Embed Size (px)
Citation preview
Half-year financial report at June 30, 2015
FOR TRANSLATION PURPOSES ONLY Page 1 of 45
A French Limited Company with a share capital of €15,550,620 Registered office: Technopole Bordeaux Montesquieu, Allée François Magendie, 33650
Martillac, France Bordeaux B 493 845 341
HALF-YEAR FINANCIAL REPORT
AT JUNE 30, 2015
Half-year financial report at June 30, 2015
FOR TRANSLATION PURPOSES ONLY Page 2 of 45
CONTENTS
1. Statement of the person responsible for the half-year financial report ................................................... 3
1.1 Person responsible for the half-year financial report ............................................................................... 3
1.2 Statement of the person responsible ........................................................................................................ 3
2. Management report at June 30, 2015 ..................................................................................................... 4
2.1. Significant events in the first half of 2015 ............................................................................................ 4
2.2. Activities and results ............................................................................................................................ 4
2.3. Progress and outlook ........................................................................................................................... 5
2.4. Post-balance sheet events .................................................................................................................... 6
2.5. Risk factors and related party transactions ......................................................................................... 6
3. Summary interim consolidated financial statements prepared in accordance with IFRS standards for the six-month period ended June 30, 2015 ....................................................................................................... 7
3.1. Statement of financial position ............................................................................................................ 8
3.2. Income statement ................................................................................................................................ 9
3.3. Statement of consolidated comprehensive income ........................................................................... 10
3.4. Changes in shareholders' equity ........................................................................................................ 11
3.5. Cash-flow statement .......................................................................................................................... 12
3.6. Detailed analysis of the changes in the working capital requirement (WCR) .................................... 13
3.7. Notes to the summary interim financial statements .......................................................................... 14
4. Limited auditors' report on the summary interim consolidated financial statements prepared in accordance with IFRS as adopted by the EU ................................................................................................... 44
Half-year financial report at June 30, 2015
FOR TRANSLATION PURPOSES ONLY Page 3 of 45
1. DECLARATION BY THE PERSON RESPONSIBLE FOR THE HALF-YEAR
FINANCIAL REPORT
1.1 Person responsible for the half-year financial report
Ludovic Lastennet, IMPLANET Chief Executive Officer.
1.2 Statement of the person responsible
(Art. 222-3 - 4° of the AMF General Regulations) "I certify that, to the best of my knowledge, the summary financial statements for the half-year have been prepared in accordance with applicable accounting standards and give a true and fair view of the assets, liabilities, financial position and results of the Company and all companies included in the scope of consolidation. The half-year management report provides an accurate account of the significant events during the first six months of the year and their impact on the interim financial statements, major transactions with related parties and a description of the main risks and uncertainties affecting the Company in the remaining six months of the year." Martillac, September 15, 2015
Ludovic Lastennet, IMPLANET Chief Executive Officer.
Half-year financial report at June 30, 2015
FOR TRANSLATION PURPOSES ONLY Page 4 of 45
2. BUSINESS REPORT AT JUNE 30, 2015
2.1. Significant events in the first half of 2015
May 2015:
CE mark granted and Food and Drug Administration (FDA) clearance in the United States for all new JAZZ diameters.
April 2015:
Definitive clinical results for a comparative study demonstrating the effectiveness of the JAZZ Band for the treatment of idiopathic scoliosis.
March 2015:
The Company carried out a second capital increase with preferential subscription rights raising €11,177,000, including the issue premium. 4,967,558 new shares were issued.
February 2015:
IMPLANET gained definitive intellectual protection for its JAZZ technology in Europe until 2031 (patent EP 2521500).
2.2. Activities and results
2.2.1 Revenue The first half of 2015 was notable for a robust trend in JAZZ sales, led by the United States. In the first half of 2015 IMPLANET recorded revenue of €3,306 thousand (+2.2% from the €3,236 thousand earned in the first half of 2014, excluding the hip business). International revenue was €1,823 thousand, 55.1% of total revenue for the period (up from 40.1% in the first half of 2014), driven by further gains in the United States, which now contributes 16.5% of sales compared to 7.2% in the first half of 2014, and the rising share of spine surgery JAZZ bands in the global product mix. Revenue from the Spine business (JAZZ), the Company's core business and priority avenue of development, increased by 65.5% to €1,455 thousand with JAZZ sales growing in all markets, particularly the United States where revenue rose 88% to €546 thousand. Over the period, France, the United States and the Rest of the World contributed, respectively, 37%, 37% and 26% of Spine revenue. JAZZ sales now account for 44% of sales in the product mix compared to 22% in the first half of 2014. In the first half year, IMPLANET sold 1,335 JAZZ units in France, 432 in the United States and 1,409 in the Rest of the World, a total of 3,176 units, up by 52% in volume terms from the 2,095 sold in the first half of 2014, and around 75% of total annual JAZZ sales in 2014. Despite a sharp recovery in sales since May, half-year revenue for the Knee business was down by 21.5% to €1,851 thousand (versus €2,357 thousand) in a hotly contested environment. The halt of Hip business sales had a material impact on the Company's global performance during the period but will no longer have an impact starting in the third quarter.
Half-year financial report at June 30, 2015
FOR TRANSLATION PURPOSES ONLY Page 5 of 45
2.2.2 Operating costs Operating costs rose by €755 thousand compared to the first half of 2014, mainly due to the following factors:
A €588 thousand rise in marketing and sales costs. This was largely due to the expansion in the United States. The sales force was expanded by five, adding €403 thousand to costs compared to the first half of 2014. Consulting fees on the strategy for roll-out in the United States, which were €173 thousand higher than in the same period 2014.
A €285 thousand rise in general and administrative expenses, consisting primarily of the fees related to the March 2015 capital increase in the amount of €177 thousand.
A reduction in operating costs by €114 thousand as a result of a €122 thousand reversal from provisions, mainly on inventories of goods for resale.
The slight fall in research and development costs net of research tax credit (-€88 thousand). This decrease was attributable to lower IP costs compared to the first half of 2014 and an accompanying reduction in the research tax credit.
The €84 thousand increase in regulatory costs linked to consulting fees for the extension of Food and Drug Administration (FDA) licensing in the United States.
2.2.3 Net financial income
Net financial income rose by €271 thousand over the prior half-year period due to:
A favorable euro/dollar exchange rate, adding €208 thousand over the period;
A €59 thousand reduction in expenses for servicing the KREOS loan following rescheduling of the bond in the first half of 2015.
2.3. Progress and outlook
In the second half of the year, the Company will:
Pursue its commercial development strategy for JAZZ abroad, particularly in the United States.
• Complete the formation of its sales team in the United States by recruiting a Sales and Business Development Director and signing contracts with regional distributors;
• Finalize the registration of JAZZ in various Latin American countries, most notably Brazil;
• Make an active contribution at global conferences held by internationally renowned scientific organizations.
Continue its R&D effort in the knee and spine fields (JAZZ).
Launch sales of the extensions to the JAZZ and Madison lines.
Half-year financial report at June 30, 2015
FOR TRANSLATION PURPOSES ONLY Page 6 of 45
See the first results from the clinical trials of JAZZ begun at the end of 2014 in pilot hospitals in the United States.
2.4. Post-balance sheet events
No significant events have occurred since June 30, 2015.
2.5. Risk factors and related party transactions
2.5.1 Risk factors
The risk factors facing the Company are similar to those set out in Chapter 4 "Risk factors" of the 2014 registration document. There was no significant change in the first half of 2015. Nor does the Company expect any change in these risks during the second half of 2015. 2.5.2 Related party transactions
Related party transactions are similar to those set out in Chapter 19 "Transactions with related parties" of the 2014 registration document. No new material agreements were made with any managers or Members of the Board of Directors in the first half of 2015 other than those mentioned in the 2014 registration document.
Half-year financial report at June 30, 2015
FOR TRANSLATION PURPOSES ONLY Page 7 of45
3. SUMMARY INTERIM CONSOLIDATED FINANCIAL STATEMENTS PREPARED
IN ACCORDANCE WITH IFRS FOR THE SIX-MONTH PERIOD ENDED JUNE
30, 2015
Half-year financial report at June 30, 2015
FOR TRANSLATION PURPOSES ONLY Page 8 of45
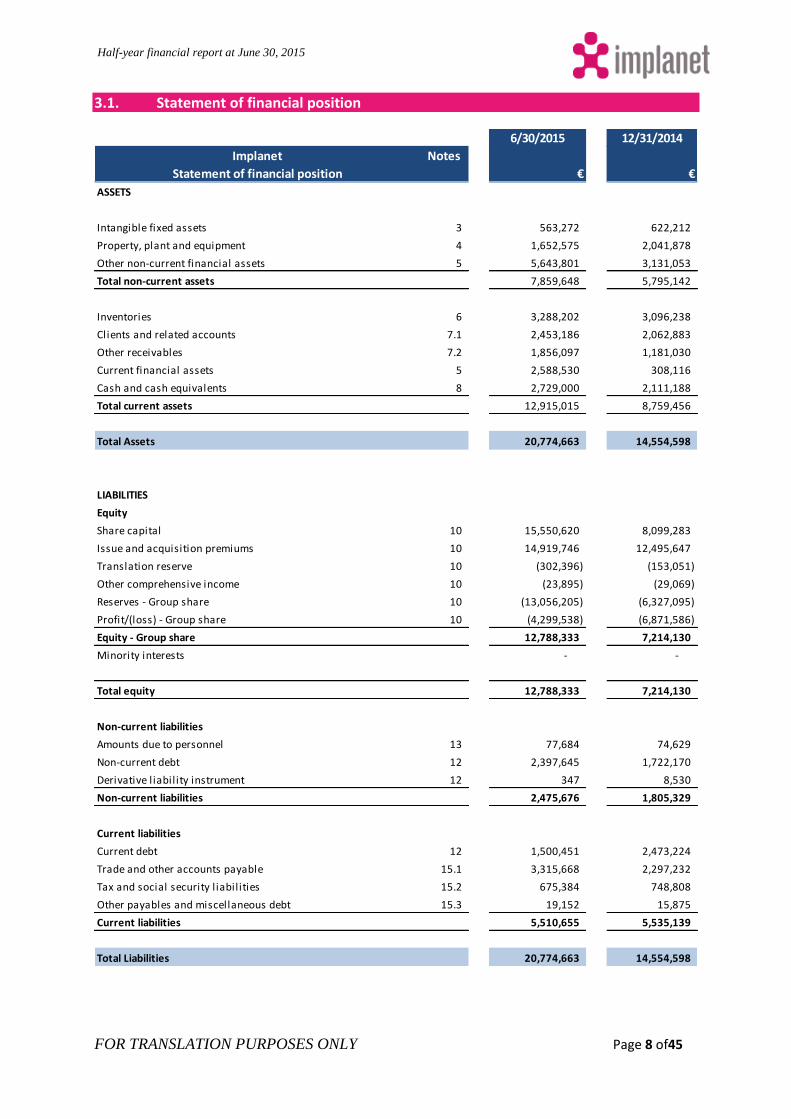
3.1. Statement of financial position
6/30/2015 12/31/2014
Implanet Notes
Statement of financial position € €
ASSETS
Intangible fixed assets 3 563,272 622,212
Property, plant and equipment 4 1,652,575 2,041,878
Other non-current financial assets 5 5,643,801 3,131,053
Total non-current assets 7,859,648 5,795,142
Inventories 6 3,288,202 3,096,238
Clients and related accounts 7.1 2,453,186 2,062,883
Other receivables 7.2 1,856,097 1,181,030
Current financial assets 5 2,588,530 308,116
Cash and cash equivalents 8 2,729,000 2,111,188
Total current assets 12,915,015 8,759,456
Total Assets 20,774,663 14,554,598
LIABILITIES
Equity
Share capital 10 15,550,620 8,099,283
Issue and acquisition premiums 10 14,919,746 12,495,647
Translation reserve 10 (302,396) (153,051)
Other comprehensive income 10 (23,895) (29,069)
Reserves - Group share 10 (13,056,205) (6,327,095)
Profit/(loss) - Group share 10 (4,299,538) (6,871,586)
Equity - Group share 12,788,333 7,214,130
Minority interests - -
Total equity 12,788,333 7,214,130
Non-current liabilities
Amounts due to personnel 13 77,684 74,629
Non-current debt 12 2,397,645 1,722,170
Derivative l iability instrument 12 347 8,530
Non-current liabilities 2,475,676 1,805,329
Current liabilities
Current debt 12 1,500,451 2,473,224
Trade and other accounts payable 15.1 3,315,668 2,297,232
Tax and social security l iabilities 15.2 675,384 748,808
Other payables and miscellaneous debt 15.3 19,152 15,875
Current liabilities 5,510,655 5,535,139
Total Liabilities 20,774,663 14,554,598
Half-year financial report at June 30, 2015
FOR TRANSLATION PURPOSES ONLY Page 9 of45
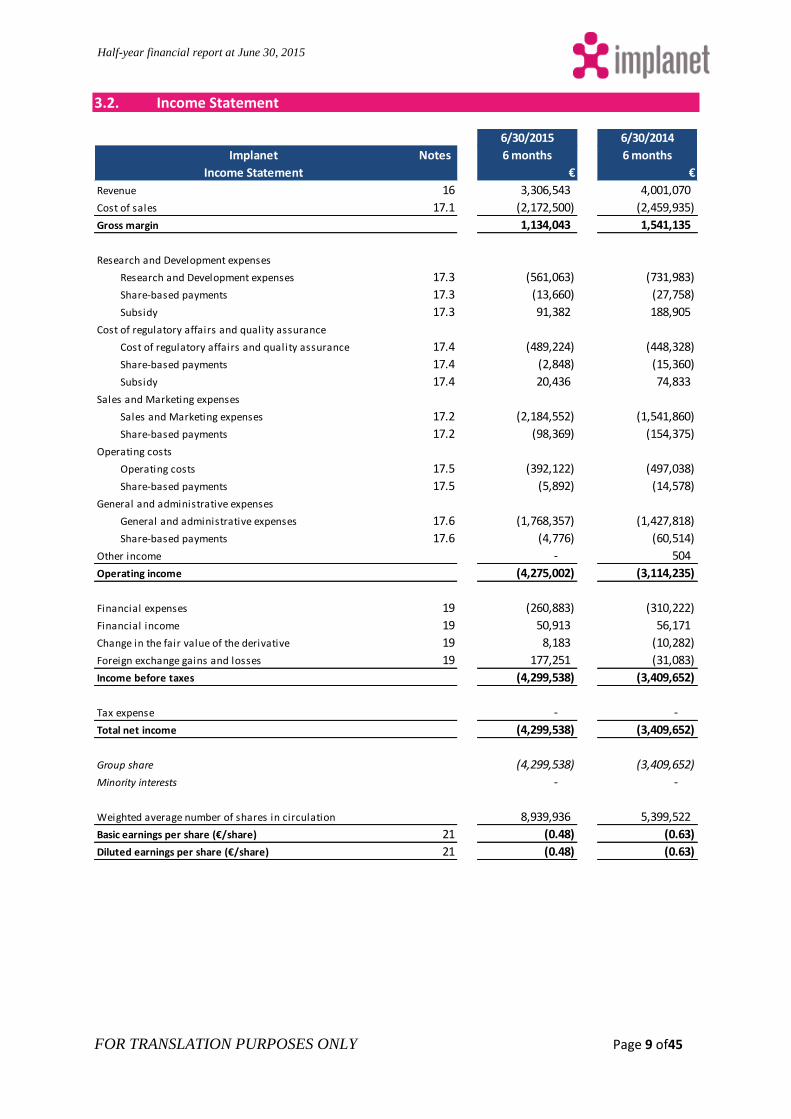
3.2. Income Statement
6/30/2015 6/30/2014
Implanet Notes 6 months 6 months
Income Statement € €
Revenue 16 3,306,543 4,001,070
Cost of sales 17.1 (2,172,500) (2,459,935)
Gross margin 1,134,043 1,541,135
Research and Development expenses
Research and Development expenses 17.3 (561,063) (731,983)
Share-based payments 17.3 (13,660) (27,758)
Subsidy 17.3 91,382 188,905
Cost of regulatory affairs and quality assurance
Cost of regulatory affairs and quality assurance 17.4 (489,224) (448,328)
Share-based payments 17.4 (2,848) (15,360)
Subsidy 17.4 20,436 74,833
Sales and Marketing expenses
Sales and Marketing expenses 17.2 (2,184,552) (1,541,860)
Share-based payments 17.2 (98,369) (154,375)
Operating costs
Operating costs 17.5 (392,122) (497,038)
Share-based payments 17.5 (5,892) (14,578)
General and administrative expenses
General and administrative expenses 17.6 (1,768,357) (1,427,818)
Share-based payments 17.6 (4,776) (60,514)
Other income - 504
Operating income (4,275,002) (3,114,235)
Financial expenses 19 (260,883) (310,222)
Financial income 19 50,913 56,171
Change in the fair value of the derivative 19 8,183 (10,282)
Foreign exchange gains and losses 19 177,251 (31,083)
Income before taxes (4,299,538) (3,409,652)
Tax expense - -
Total net income (4,299,538) (3,409,652)
Group share (4,299,538) (3,409,652)
Minority interests - -
Weighted average number of shares in circulation 8,939,936 5,399,522
Basic earnings per share (€/share) 21 (0.48) (0.63)
Diluted earnings per share (€/share) 21 (0.48) (0.63)
Half-year financial report at June 30, 2015
FOR TRANSLATION PURPOSES ONLY Page 10 of45
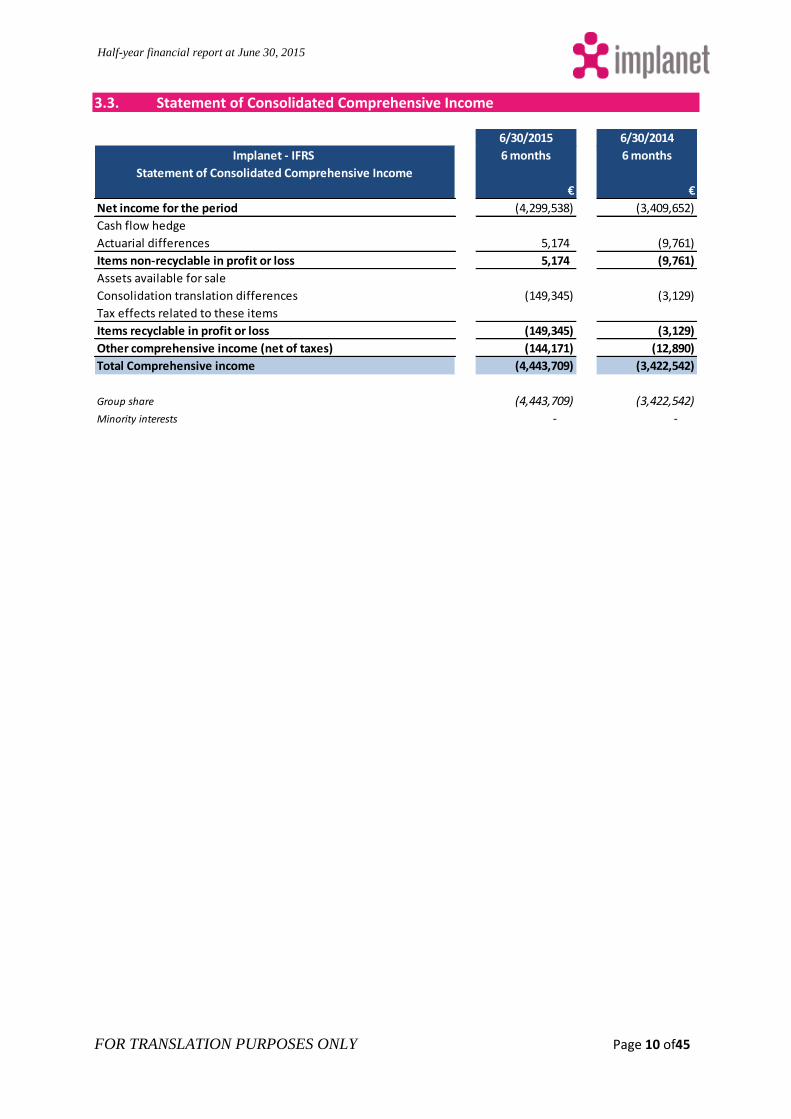
3.3. Statement of Consolidated Comprehensive Income
6/30/2015 6/30/2014
Implanet - IFRS 6 months 6 months
Statement of Consolidated Comprehensive Income
€ €
Net income for the period (4,299,538) (3,409,652)
Cash flow hedge
Actuarial differences 5,174 (9,761)
Items non-recyclable in profit or loss 5,174 (9,761)
Assets available for sale
Consolidation translation differences (149,345) (3,129)
Tax effects related to these items
Items recyclable in profit or loss (149,345) (3,129)
Other comprehensive income (net of taxes) (144,171) (12,890)
Total Comprehensive income (4,443,709) (3,422,542)
Group share (4,443,709) (3,422,542)
Minority interests - -
Half-year financial report at June 30, 2015
FOR TRANSLATION PURPOSES ONLY Page 11 of45
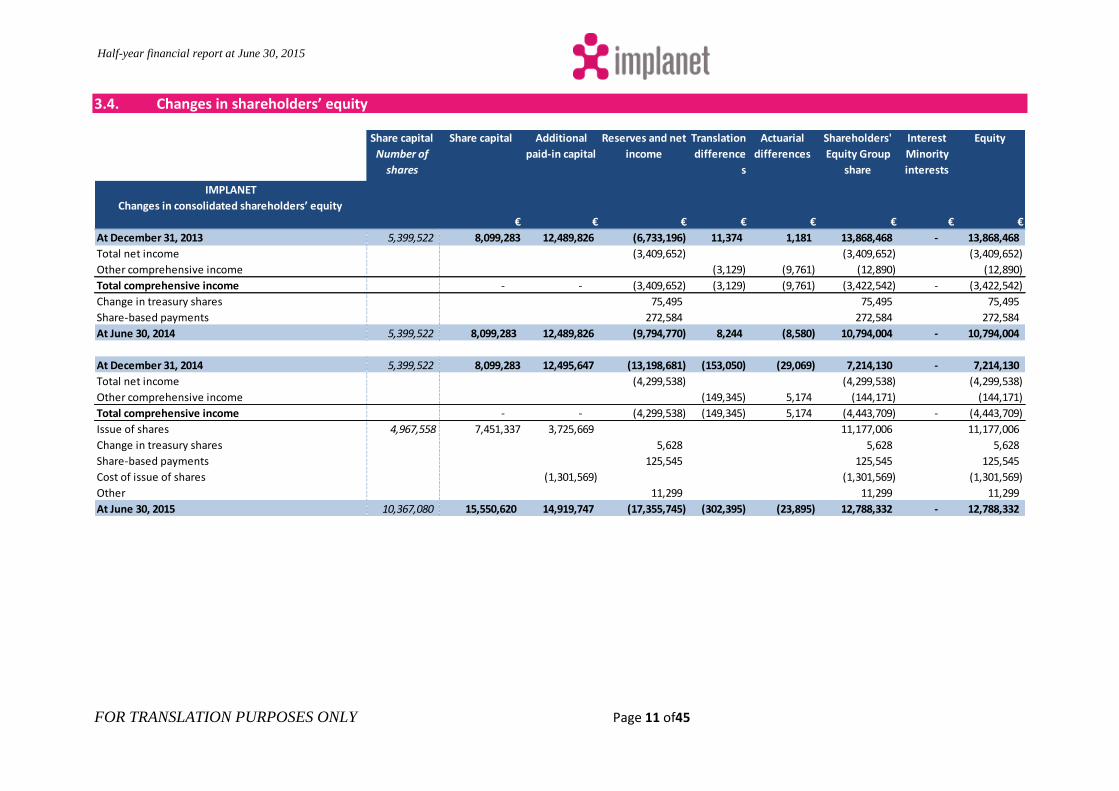
3.4. Changes in shareholders’ equity
Share capital
Number of
shares
Share capital Additional
paid-in capital
Reserves and net
income
Translation
difference
s
Actuarial
differences
IMPLANET
Changes in consolidated shareholders’ equity
€ € € € € € € €
At December 31, 2013 5,399,522 8,099,283 12,489,826 (6,733,196) 11,374 1,181 13,868,468 - 13,868,468
Total net income (3,409,652) (3,409,652) (3,409,652)
Other comprehensive income (3,129) (9,761) (12,890) (12,890)
Total comprehensive income - - (3,409,652) (3,129) (9,761) (3,422,542) - (3,422,542)
Change in treasury shares 75,495 75,495 75,495
Share-based payments 272,584 272,584 272,584
At June 30, 2014 5,399,522 8,099,283 12,489,826 (9,794,770) 8,244 (8,580) 10,794,004 - 10,794,004
At December 31, 2014 5,399,522 8,099,283 12,495,647 (13,198,681) (153,050) (29,069) 7,214,130 - 7,214,130
Total net income (4,299,538) (4,299,538) (4,299,538)
Other comprehensive income (149,345) 5,174 (144,171) (144,171)
Total comprehensive income - - (4,299,538) (149,345) 5,174 (4,443,709) - (4,443,709)
Issue of shares 4,967,558 7,451,337 3,725,669 11,177,006 11,177,006
Change in treasury shares 5,628 5,628 5,628
Share-based payments 125,545 125,545 125,545
Cost of issue of shares (1,301,569) (1,301,569) (1,301,569)
Other 11,299 11,299 11,299
At June 30, 2015 10,367,080 15,550,620 14,919,747 (17,355,745) (302,395) (23,895) 12,788,332 - 12,788,332
Shareholders'
Equity Group
share
Interest
Minority
interests
Equity

Half-year financial report at June 30, 2015
FOR TRANSLATION PURPOSES ONLY Page 12 of45
3.5. Cash flow statement
6/30/2015 6/30/2014
Inplanet - IFRS Notes 6 months 6 months
Consolidated cash flow statement € €
Cash flow generated from operations
Net income from continuing operations (4,299,538) (3,409,652)
Net income from discontinued operations
Total net income (4,299,538) (3,409,652)
(-) Elimination of depreciation on intangible fixed assets 3 (146,014) (117,034)
(-) Elimination of depreciation on property, plant and equipment 4 (472,609) (490,052)
(-) Allocations to provisions 13 (8,229) (9,576)
(-) Reversals of provisions 14 - 109,131
(-) Expense related to share-based payments 11 (125,545) (272,584)
(-) Gross financial interest paid (241,491) (225,029)
(-) Financial interest received 14,724 -
(-) Change in the fair value of the derivative 8,183 (10,282)
(-) Capital gains or losses on disposals of fixed assets (2,529) (12,936)
Other (77,094) (82,045)
Free cash flow before cost of net financial indebtedness and taxes (3,248,934) (2,299,246)
(-) Change in the working capital requirement (net of impairment of trade receivables and
inventories) 612,468 645,273
Cash flow generated from operations (3,861,402) (2,944,519)
Cash flow generated from capital investment
Acquisition of intangible fixed assets 3 (10,703) (41,959)
Capitalization of development expenses 3 (50,945) -
Acquisition of property, plant and equipment 4 (110,292) (476,041)
Demobilization of term accounts classified as other current and non-current financial assets 1,182,564 3,303,013
Subscription of term accounts classified as other non-current financial assets (5,007,398) -
Subscription of term accounts classified as other current financial assets (962,751) -
Disposals of fixed assets 64,339 -
Financial interest received 14,724 -
Cash flow related to investment operations (4,880,461) 2,785,014
Cash flow related to financing operations
Capital increase 10 11,177,006 -
Costs of capital increase (998,093) -
Repayment of the Kreos bonds 12 (694,760) (927,964)
Gross financial interest paid (241,490) (225,028)
Issue of bank loans 12 500,000 -
Repayment of loans and conditional advances 12 (35,000) (265,000)
Repayment of finance leases 12 (200,795) (218,947)
Other financing flows (factoring) 12 3,122 (85,663)
Other financing flows (changes in the liquidity contract) - 48,065
Cash flow related to financing operations 9,509,989 (1,674,537)
Impact of variations in exchange rates (150,314) (3,129)
Increase (Reduction) in cash 617,812 (1,837,170)
Cash and cash equivalents at the start of the year (including overdraft facil ities) 2,111,188 2,965,534
Cash and cash equivalents at the year end (including bank credit facil ities) 2,729,000 1,128,364
Increase (Reduction) in cash 617,812 (1,837,170)
06/30/2015
6 months
06/30/2014
6 months
Cash and cash equivalents 8 2,729,000 1,150,053
Current bank borrowings 12 - (21,689)
Cash and cash equivalents at the year end (including bank credit facilities) 2,729,000 1,128,364
Half-year financial report at June 30, 2015
FOR TRANSLATION PURPOSES ONLY Page 13 of45
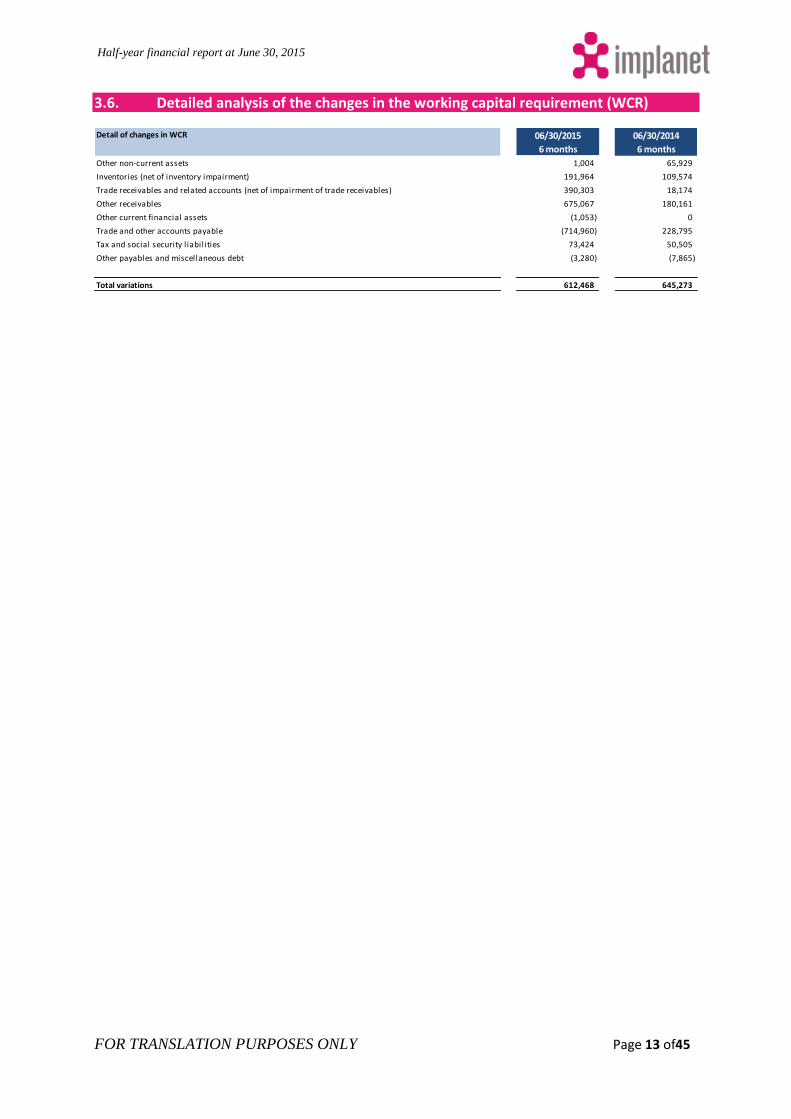
3.6. Detailed analysis of the changes in the working capital requirement (WCR)
Detail of changes in WCR 06/30/2015
6 months
06/30/2014
6 months
Other non-current assets 1,004 65,929
Inventories (net of inventory impairment) 191,964 109,574
Trade receivables and related accounts (net of impairment of trade receivables) 390,303 18,174
Other receivables 675,067 180,161
Other current financial assets (1,053) 0
Trade and other accounts payable (714,960) 228,795
Tax and social security l iabilities 73,424 50,505
Other payables and miscellaneous debt (3,280) (7,865)
Total variations 612,468 645,273
Half-year financial report at June 30, 2015
FOR TRANSLATION PURPOSES ONLY Page 14 of45
3.7. Notes to the summary interim financial statements
(Unless indicated otherwise, the amounts shown in these notes are in euros.)
Note 1: Information relating to the Company and its business
The information below constitutes the Notes to the summary interim consolidated IFRS financial statements at June 30, 2015. The summary interim consolidated financial statements of IMPLANET were approved by the Board of Directors on September 15, 2015 and authorized for publication.
1.1 Information relating to the Company and its business
Created in December 2006, IMPLANET’s business is the technical, clinical, marketing and commercial development of high-quality (“Gold Standard”) implants and surgical instruments by introducing innovative technological solutions. IMPLANET’s range covers arthroscopy, knee and spinal products. The Company has decided to outsource the majority of the operations necessary for the manufacture of its products and works with a network of about 20 subcontractors, on the basis of very precise technical specifications. IMPLANET has been listed on the NYSE Euronext market in Paris since November 25, 2013. Registered office: Technopole Bordeaux Montesquieu – Allées François Magendie – 33650 Martillac Trade and Company Registry number: RCS 493 845 341 – Bordeaux, France The IMPLANET company and its subsidiary are hereafter referred to as the “Company” or the “Group”. 1.2 Significant events in the first half of 2015
May 2015:
CE mark granted and Food and Drug Administration (FDA) clearance in the United States for all new JAZZ diameters.
April 2015:
Definitive clinical results for a comparative study demonstrating the effectiveness of the JAZZ Band for the treatment of idiopathic scoliosis.
March 2015:
The Company carried out a second capital increase with preferential subscription rights raising €11,177,000, including the issue premium. 4,967,558 new shares were issued.
Half-year financial report at June 30, 2015
FOR TRANSLATION PURPOSES ONLY Page 15 of45
February 2015:
IMPLANET gained definitive intellectual protection for its JAZZ technology in Europe until 2031 (patent EP 2521500).
1.3 Subsequent events
No events likely to have a material impact on the interim financial statements have occurred since June 30, 2015.
Half-year financial report at June 30, 2015
FOR TRANSLATION PURPOSES ONLY Page 16 of45
Note 2: Accounting principles, rules and methods
The financial statements are presented in euros unless indicated otherwise. 2.1 Principle for preparation of the financial statements
Declaration of compliance IMPLANET has prepared its consolidated financial statements in accordance with the standards and interpretations published by the International Accounting Standards Board (IASB) and adopted by the European Union as at the date of preparation of the financial statements, and this for all the periods presented. This referential, available on the website of the European Commission
(http://ec.europa.eu/internal_market/accounting/ias_fr.htm), incorporates the international accounting standards (IAS and IFRS), and the interpretations issued by the Standing Interpretations Committee (SIC) and the International Financial Interpretations Committee (IFRIC). In accordance with the provisions of European Regulation No. 1606/2002 dated July 19, 2002, the summary interim consolidated financial statements of IMPLANET at June 30, 2015 have been prepared in compliance with IAS 34 “Interim Financial Reporting”, as adopted by the European Union. Since they are summary financial statements, they do not include all the information required by the IFRS guidelines for the preparation of consolidated financial statements. These notes must therefore be supplemented by reading the consolidated financial statements of IMPLANET published in respect of the fiscal year ended December 31, 2014. Principle for the preparation of the financial statements The consolidated financial statements of the Company have been prepared in accordance with the historical cost principle, with the exception of certain categories of assets and liabilities in accordance with the provisions set out in the IFRS. Accounting methods The accounting principles used are identical to those used for the preparation of the annual IFRS consolidated financial statements for the fiscal year ended December 31, 2014, with the exception of the application of the following new standards, amendments to standards and interpretations adopted by the European Union, for which application is mandatory for the Company with effect from January 1, 2015: Standards, amendments to standards and interpretations applicable with effect from the fiscal year commencing on January 1, 2015 The Company has applied the following new standards, amendments to standards and interpretations with effect from the start of the 2015 fiscal year:
IFRIC 21 - Levies
Improvements to IFRS (2011-2013 Cycle)
Half-year financial report at June 30, 2015
FOR TRANSLATION PURPOSES ONLY Page 17 of45
These new texts published by the IASB and adopted by the EU have not had any significant impact on the Company’s financial statements. Standards and interpretations adopted by the EU but not mandatory for 2015 interim financial statements
Amendments to IAS 19: Defined benefit plans: employee contributions
Improvements to IFRS (2010-2012 cycle)
The Company is currently in the process of the assessing the impacts resulting from the first application of these new texts. It does not anticipate any significant impact on its financial statements. 2.2 Change of accounting method
With the exception of the new texts identified above, IMPLANET has not made any changes to its accounting methods during the first half of 2015. 2.3 Use of judgments and estimates
During the course of the preparation of these interim consolidated financial statements, the main judgments made by management as well as the principal assumptions used are the same as those applied during the preparation of the financial statements for the year ended December 31, 2014, namely:
Award of share subscription or founders’ warrants to the employees, executives and external service providers (see note 11),
Determination of the fair value of the derivative liability (see note 12),
Recognition of development expenses in assets (see note 3),
Impairment of inventories (see note 6),
Impairment of trade receivables (see note 7.1),
Recognition of revenues,
provision for liabilities and expenses (see note 14). These estimates are based on the going concern principle and were prepared based on the information available at the time of their preparation. They are continuously evaluated on the basis of past experience and other factors considered reasonable, which constitute the basis of the assessments of the carrying amount of the assets and liabilities. The estimates may be revised if the circumstances on which they were based change, or as a result of new information. The actual results may differ significantly from these estimates, depending on different assumptions or conditions. 2.4 Consolidation scope and methods
On the date of publication of the interim consolidated financial statements, the Company only had one wholly-owned subsidiary, IMPLANET AMERICA INC., which it created at the end of February 2013.
Half-year financial report at June 30, 2015
FOR TRANSLATION PURPOSES ONLY Page 18 of45
The assets and liabilities of foreign subsidiaries are translated at the exchange rates applicable at the balance sheet date. Income statement items are translated at the average exchange rate over the period. The resulting translation difference is recognized directly in equity under Translation reserve. The exchange rates used for the fiscal year presented are as follows:
USD - US dollar 6/30/2015 12/31/2014 6/30/2014
Closing rate 1.1189 1.2141 1.3691
Average rate 1.1204 1.3049 1.3709
Half-year financial report at June 30, 2015
FOR TRANSLATION PURPOSES ONLY Page 19 of45
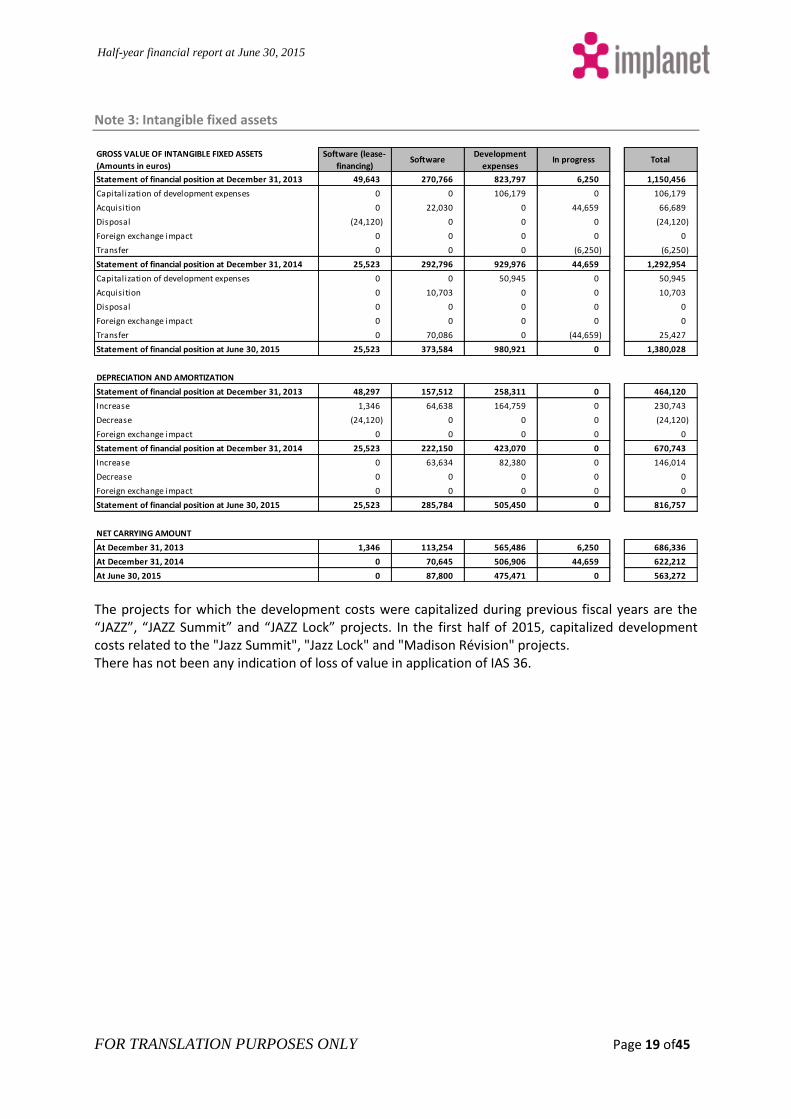
Note 3: Intangible fixed assets
The projects for which the development costs were capitalized during previous fiscal years are the “JAZZ”, “JAZZ Summit” and “JAZZ Lock” projects. In the first half of 2015, capitalized development costs related to the "Jazz Summit", "Jazz Lock" and "Madison Révision" projects. There has not been any indication of loss of value in application of IAS 36.
GROSS VALUE OF INTANGIBLE FIXED ASSETS
(Amounts in euros)
Software (lease-
financing)Software
Development
expensesIn progress Total
Statement of financial position at December 31, 2013 49,643 270,766 823,797 6,250 1,150,456
Capitalization of development expenses 0 0 106,179 0 106,179
Acquisition 0 22,030 0 44,659 66,689
Disposal (24,120) 0 0 0 (24,120)
Foreign exchange impact 0 0 0 0 0
Transfer 0 0 0 (6,250) (6,250)
Statement of financial position at December 31, 2014 25,523 292,796 929,976 44,659 1,292,954
Capitalization of development expenses 0 0 50,945 0 50,945
Acquisition 0 10,703 0 0 10,703
Disposal 0 0 0 0 0
Foreign exchange impact 0 0 0 0 0
Transfer 0 70,086 0 (44,659) 25,427
Statement of financial position at June 30, 2015 25,523 373,584 980,921 0 1,380,028
DEPRECIATION AND AMORTIZATION
Statement of financial position at December 31, 2013 48,297 157,512 258,311 0 464,120
Increase 1,346 64,638 164,759 0 230,743
Decrease (24,120) 0 0 0 (24,120)
Foreign exchange impact 0 0 0 0 0
Statement of financial position at December 31, 2014 25,523 222,150 423,070 0 670,743
Increase 0 63,634 82,380 0 146,014
Decrease 0 0 0 0 0
Foreign exchange impact 0 0 0 0 0
Statement of financial position at June 30, 2015 25,523 285,784 505,450 0 816,757
NET CARRYING AMOUNT
At December 31, 2013 1,346 113,254 565,486 6,250 686,336
At December 31, 2014 0 70,645 506,906 44,659 622,212
At June 30, 2015 0 87,800 475,471 0 563,272
Half-year financial report at June 30, 2015
FOR TRANSLATION PURPOSES ONLY Page 20 of45
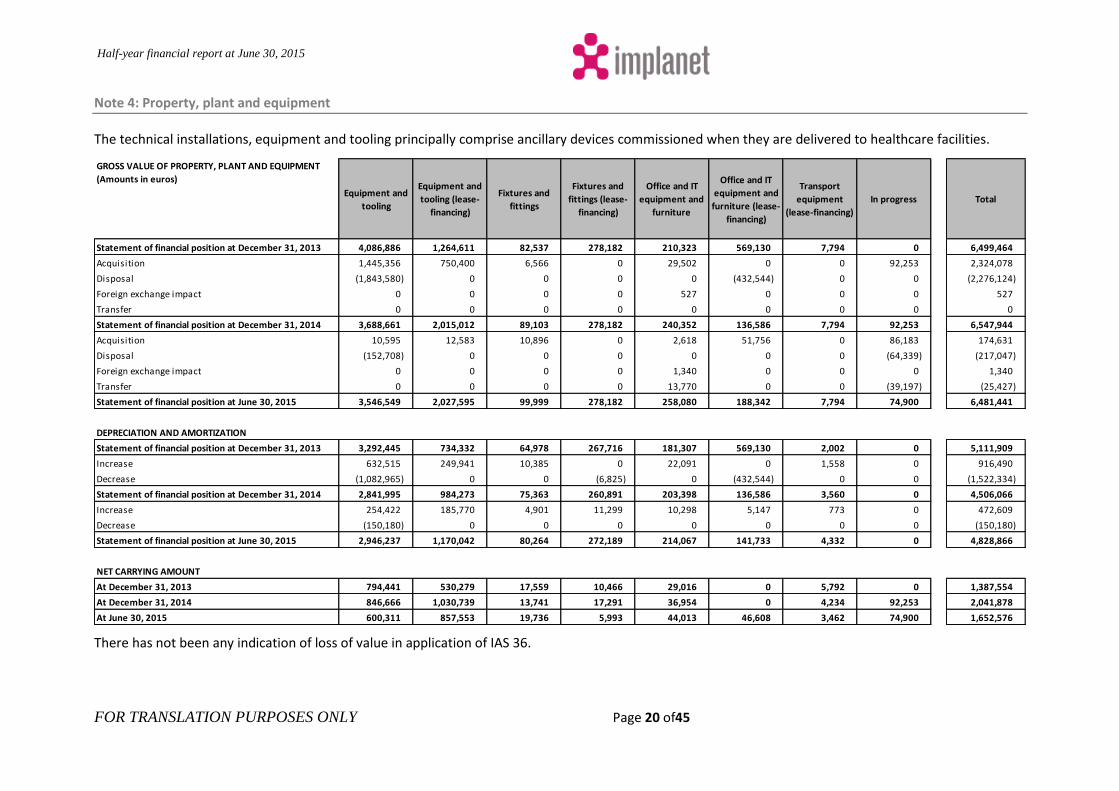
Note 4: Property, plant and equipment
The technical installations, equipment and tooling principally comprise ancillary devices commissioned when they are delivered to healthcare facilities.
There has not been any indication of loss of value in application of IAS 36.
GROSS VALUE OF PROPERTY, PLANT AND EQUIPMENT
(Amounts in euros)
Equipment and
tooling
Equipment and
tooling (lease-
financing)
Fixtures and
fittings
Fixtures and
fittings (lease-
financing)
Office and IT
equipment and
furniture
Office and IT
equipment and
furniture (lease-
financing)
Transport
equipment
(lease-financing)
In progress Total
Statement of financial position at December 31, 2013 4,086,886 1,264,611 82,537 278,182 210,323 569,130 7,794 0 6,499,464
Acquisition 1,445,356 750,400 6,566 0 29,502 0 0 92,253 2,324,078
Disposal (1,843,580) 0 0 0 0 (432,544) 0 0 (2,276,124)
Foreign exchange impact 0 0 0 0 527 0 0 0 527
Transfer 0 0 0 0 0 0 0 0 0
Statement of financial position at December 31, 2014 3,688,661 2,015,012 89,103 278,182 240,352 136,586 7,794 92,253 6,547,944
Acquisition 10,595 12,583 10,896 0 2,618 51,756 0 86,183 174,631
Disposal (152,708) 0 0 0 0 0 0 (64,339) (217,047)
Foreign exchange impact 0 0 0 0 1,340 0 0 0 1,340
Transfer 0 0 0 0 13,770 0 0 (39,197) (25,427)
Statement of financial position at June 30, 2015 3,546,549 2,027,595 99,999 278,182 258,080 188,342 7,794 74,900 6,481,441
DEPRECIATION AND AMORTIZATION
Statement of financial position at December 31, 2013 3,292,445 734,332 64,978 267,716 181,307 569,130 2,002 0 5,111,909
Increase 632,515 249,941 10,385 0 22,091 0 1,558 0 916,490
Decrease (1,082,965) 0 0 (6,825) 0 (432,544) 0 0 (1,522,334)
Statement of financial position at December 31, 2014 2,841,995 984,273 75,363 260,891 203,398 136,586 3,560 0 4,506,066
Increase 254,422 185,770 4,901 11,299 10,298 5,147 773 0 472,609
Decrease (150,180) 0 0 0 0 0 0 0 (150,180)
Statement of financial position at June 30, 2015 2,946,237 1,170,042 80,264 272,189 214,067 141,733 4,332 0 4,828,866
NET CARRYING AMOUNT
At December 31, 2013 794,441 530,279 17,559 10,466 29,016 0 5,792 0 1,387,554
At December 31, 2014 846,666 1,030,739 13,741 17,291 36,954 0 4,234 92,253 2,041,878
At June 30, 2015 600,311 857,553 19,736 5,993 44,013 46,608 3,462 74,900 1,652,576
Half-year financial report at June 30, 2015
FOR TRANSLATION PURPOSES ONLY Page 21 of45
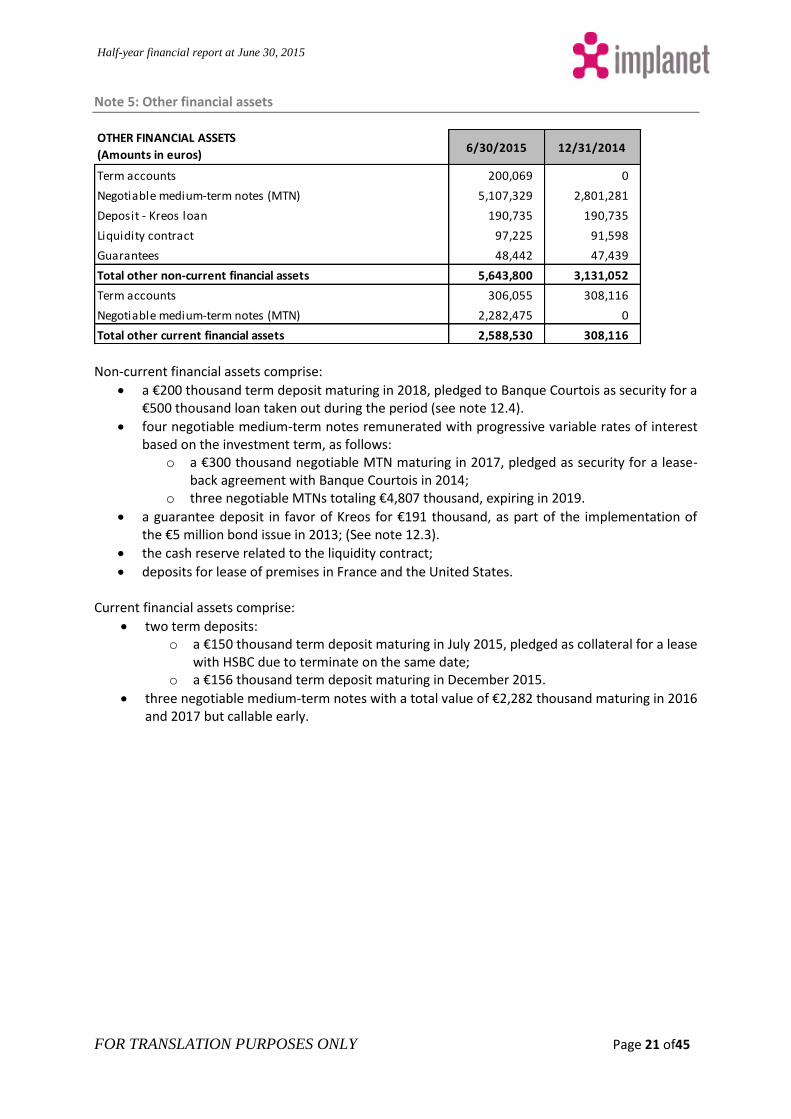
Note 5: Other financial assets
Non-current financial assets comprise:
a €200 thousand term deposit maturing in 2018, pledged to Banque Courtois as security for a €500 thousand loan taken out during the period (see note 12.4).
four negotiable medium-term notes remunerated with progressive variable rates of interest based on the investment term, as follows:
o a €300 thousand negotiable MTN maturing in 2017, pledged as security for a lease-back agreement with Banque Courtois in 2014;
o three negotiable MTNs totaling €4,807 thousand, expiring in 2019.
a guarantee deposit in favor of Kreos for €191 thousand, as part of the implementation of the €5 million bond issue in 2013; (See note 12.3).
the cash reserve related to the liquidity contract;
deposits for lease of premises in France and the United States. Current financial assets comprise:
two term deposits: o a €150 thousand term deposit maturing in July 2015, pledged as collateral for a lease
with HSBC due to terminate on the same date; o a €156 thousand term deposit maturing in December 2015.
three negotiable medium-term notes with a total value of €2,282 thousand maturing in 2016 and 2017 but callable early.
OTHER FINANCIAL ASSETS
(Amounts in euros)6/30/2015 12/31/2014
Term accounts 200,069 0
Negotiable medium-term notes (MTN) 5,107,329 2,801,281
Deposit - Kreos loan 190,735 190,735
Liquidity contract 97,225 91,598
Guarantees 48,442 47,439
Total other non-current financial assets 5,643,800 3,131,052
Term accounts 306,055 308,116
Negotiable medium-term notes (MTN) 2,282,475 0
Total other current financial assets 2,588,530 308,116
Half-year financial report at June 30, 2015
FOR TRANSLATION PURPOSES ONLY Page 22 of45
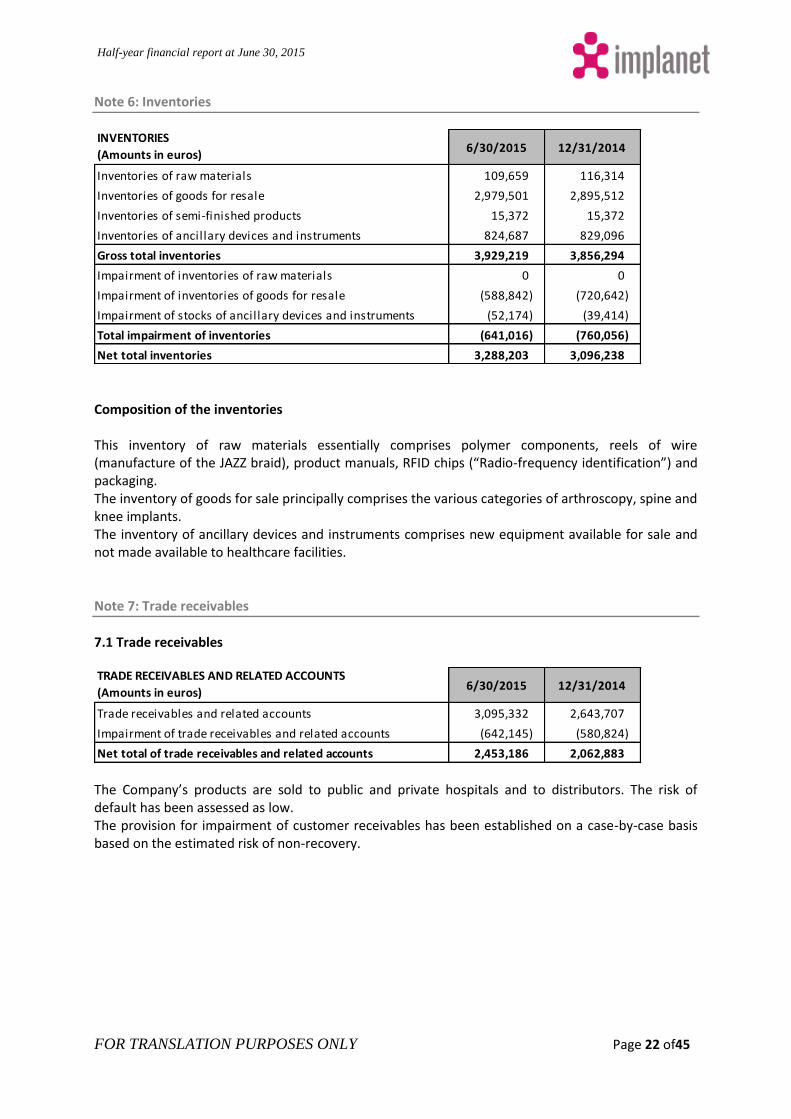
Note 6: Inventories
Composition of the inventories This inventory of raw materials essentially comprises polymer components, reels of wire (manufacture of the JAZZ braid), product manuals, RFID chips (“Radio-frequency identification”) and packaging. The inventory of goods for sale principally comprises the various categories of arthroscopy, spine and knee implants. The inventory of ancillary devices and instruments comprises new equipment available for sale and not made available to healthcare facilities. Note 7: Trade receivables
7.1 Trade receivables
The Company’s products are sold to public and private hospitals and to distributors. The risk of default has been assessed as low. The provision for impairment of customer receivables has been established on a case-by-case basis based on the estimated risk of non-recovery.
INVENTORIES
(Amounts in euros)6/30/2015 12/31/2014
Inventories of raw materials 109,659 116,314
Inventories of goods for resale 2,979,501 2,895,512
Inventories of semi-finished products 15,372 15,372
Inventories of ancillary devices and instruments 824,687 829,096
Gross total inventories 3,929,219 3,856,294
Impairment of inventories of raw materials 0 0
Impairment of inventories of goods for resale (588,842) (720,642)
Impairment of stocks of ancillary devices and instruments (52,174) (39,414)
Total impairment of inventories (641,016) (760,056)
Net total inventories 3,288,203 3,096,238
TRADE RECEIVABLES AND RELATED ACCOUNTS
(Amounts in euros)6/30/2015 12/31/2014
Trade receivables and related accounts 3,095,332 2,643,707
Impairment of trade receivables and related accounts (642,145) (580,824)
Net total of trade receivables and related accounts 2,453,186 2,062,883
Half-year financial report at June 30, 2015
FOR TRANSLATION PURPOSES ONLY Page 23 of45
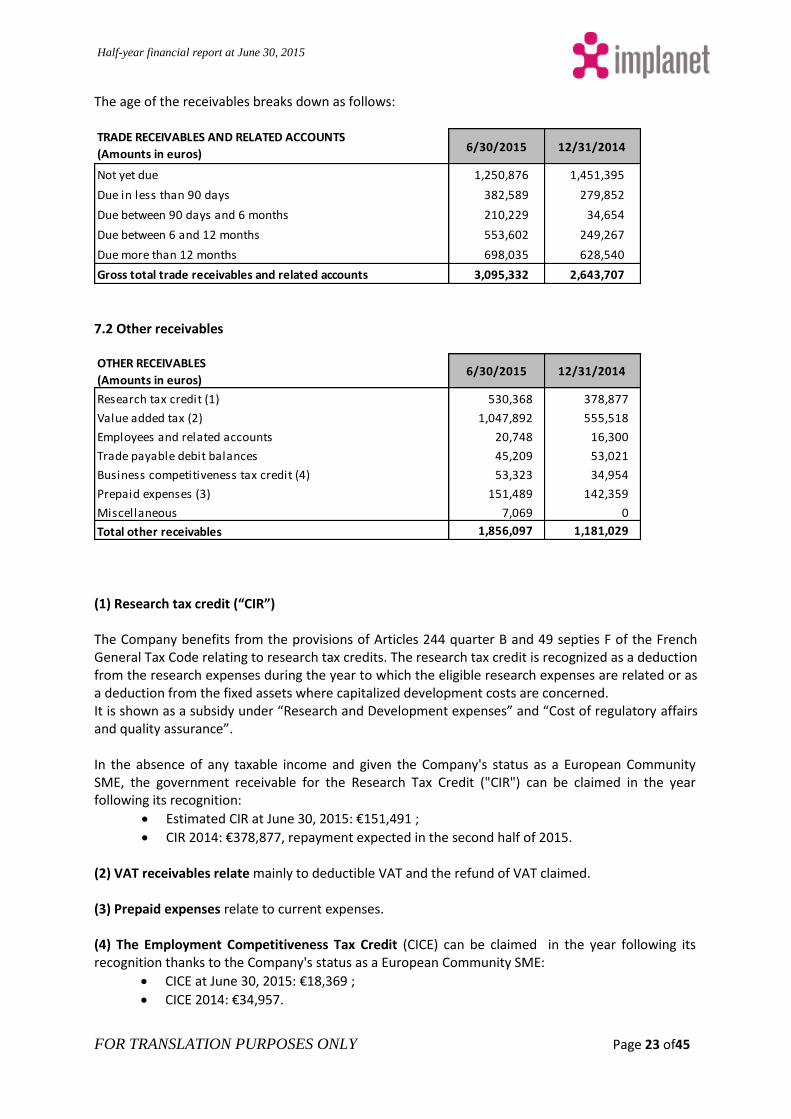
The age of the receivables breaks down as follows:
7.2 Other receivables
(1) Research tax credit (“CIR”) The Company benefits from the provisions of Articles 244 quarter B and 49 septies F of the French General Tax Code relating to research tax credits. The research tax credit is recognized as a deduction from the research expenses during the year to which the eligible research expenses are related or as a deduction from the fixed assets where capitalized development costs are concerned. It is shown as a subsidy under “Research and Development expenses” and “Cost of regulatory affairs and quality assurance”. In the absence of any taxable income and given the Company's status as a European Community SME, the government receivable for the Research Tax Credit ("CIR") can be claimed in the year following its recognition:
Estimated CIR at June 30, 2015: €151,491 ;
CIR 2014: €378,877, repayment expected in the second half of 2015. (2) VAT receivables relate mainly to deductible VAT and the refund of VAT claimed. (3) Prepaid expenses relate to current expenses. (4) The Employment Competitiveness Tax Credit (CICE) can be claimed in the year following its recognition thanks to the Company's status as a European Community SME:
CICE at June 30, 2015: €18,369 ;
CICE 2014: €34,957.
TRADE RECEIVABLES AND RELATED ACCOUNTS
(Amounts in euros)6/30/2015 12/31/2014
Not yet due 1,250,876 1,451,395
Due in less than 90 days 382,589 279,852
Due between 90 days and 6 months 210,229 34,654
Due between 6 and 12 months 553,602 249,267
Due more than 12 months 698,035 628,540
Gross total trade receivables and related accounts 3,095,332 2,643,707
OTHER RECEIVABLES
(Amounts in euros)6/30/2015 12/31/2014
Research tax credit (1) 530,368 378,877
Value added tax (2) 1,047,892 555,518
Employees and related accounts 20,748 16,300
Trade payable debit balances 45,209 53,021
Business competitiveness tax credit (4) 53,323 34,954
Prepaid expenses (3) 151,489 142,359
Miscellaneous 7,069 0
Total other receivables 1,856,097 1,181,029
Half-year financial report at June 30, 2015
FOR TRANSLATION PURPOSES ONLY Page 24 of45
Note 8: Marketable securities and cash
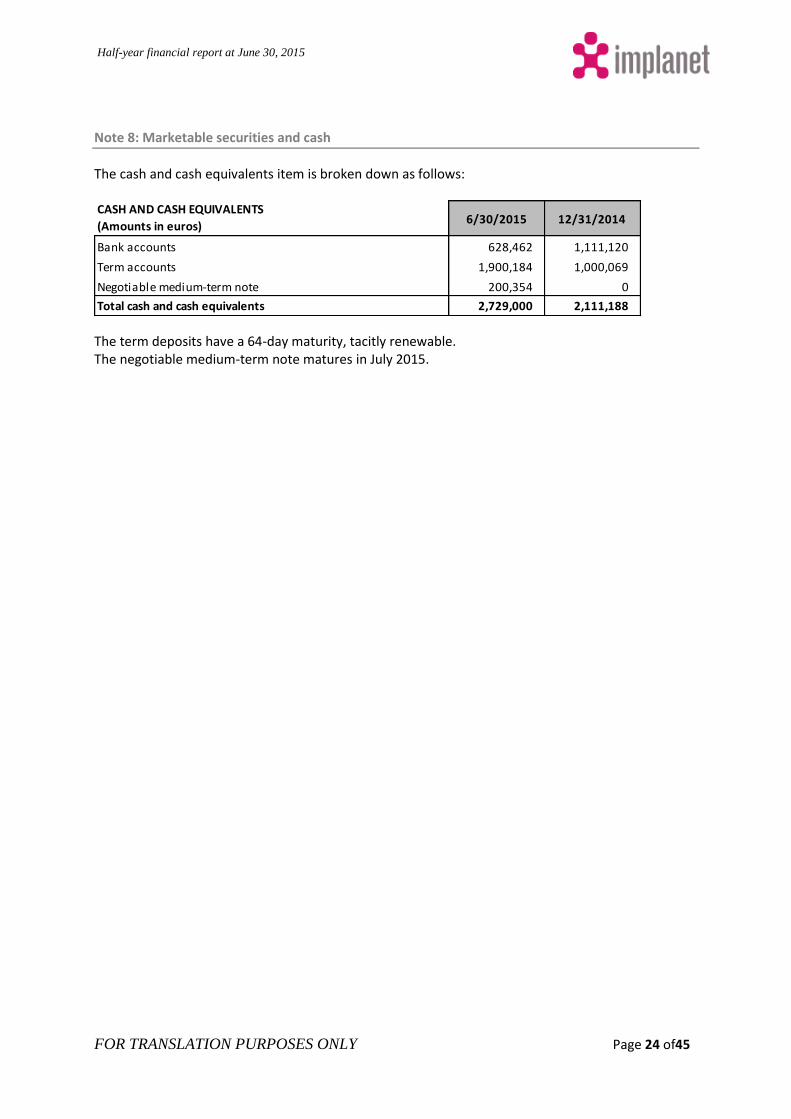
The cash and cash equivalents item is broken down as follows:
The term deposits have a 64-day maturity, tacitly renewable. The negotiable medium-term note matures in July 2015.
CASH AND CASH EQUIVALENTS
(Amounts in euros)6/30/2015 12/31/2014
Bank accounts 628,462 1,111,120
Term accounts 1,900,184 1,000,069
Negotiable medium-term note 200,354 0
Total cash and cash equivalents 2,729,000 2,111,188
Half-year financial report at June 30, 2015
FOR TRANSLATION PURPOSES ONLY Page 25 of45
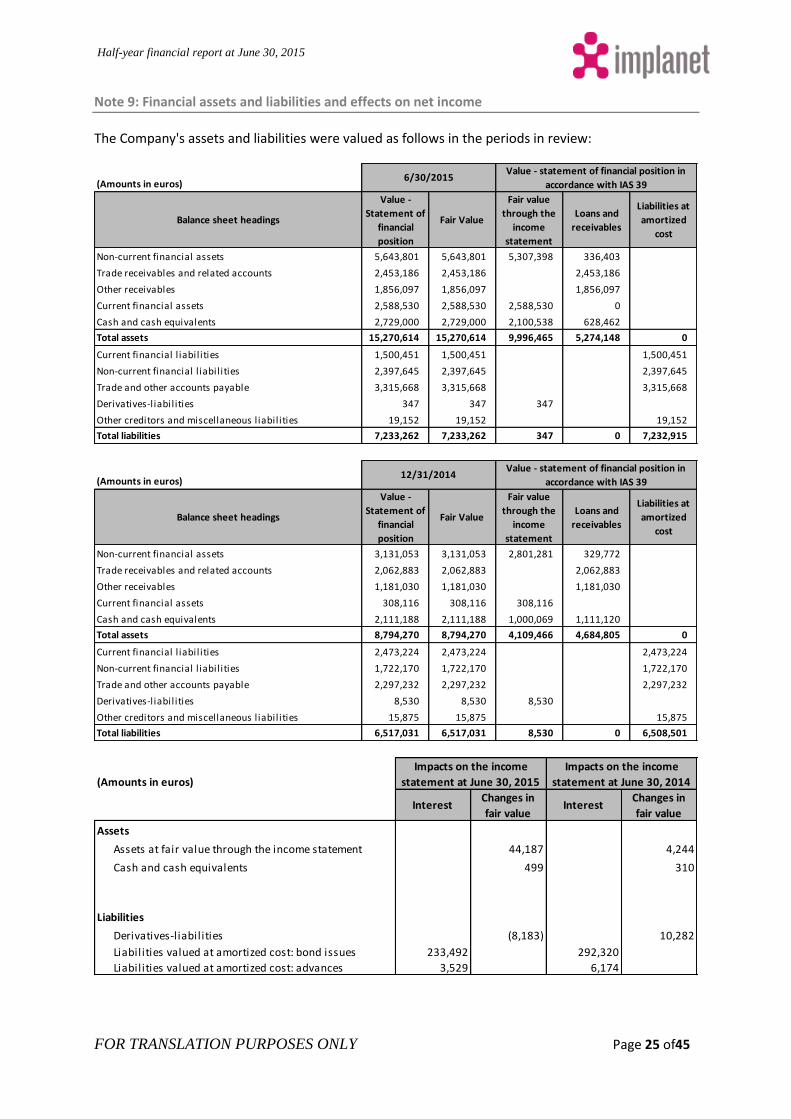
Note 9: Financial assets and liabilities and effects on net income
The Company's assets and liabilities were valued as follows in the periods in review:
(Amounts in euros)
Balance sheet headings
Value -
Statement of
financial
position
Fair Value
Fair value
through the
income
statement
Loans and
receivables
Liabilities at
amortized
cost
Non-current financial assets 5,643,801 5,643,801 5,307,398 336,403
Trade receivables and related accounts 2,453,186 2,453,186 2,453,186
Other receivables 1,856,097 1,856,097 1,856,097
Current financial assets 2,588,530 2,588,530 2,588,530 0
Cash and cash equivalents 2,729,000 2,729,000 2,100,538 628,462
Total assets 15,270,614 15,270,614 9,996,465 5,274,148 0
Current financial l iabilities 1,500,451 1,500,451 1,500,451
Non-current financial l iabilities 2,397,645 2,397,645 2,397,645
Trade and other accounts payable 3,315,668 3,315,668 3,315,668
Derivatives-liabilities 347 347 347
Other creditors and miscellaneous liabilities 19,152 19,152 19,152
Total liabilities 7,233,262 7,233,262 347 0 7,232,915
6/30/2015Value - statement of financial position in
accordance with IAS 39
(Amounts in euros)
Balance sheet headings
Value -
Statement of
financial
position
Fair Value
Fair value
through the
income
statement
Loans and
receivables
Liabilities at
amortized
cost
Non-current financial assets 3,131,053 3,131,053 2,801,281 329,772
Trade receivables and related accounts 2,062,883 2,062,883 2,062,883
Other receivables 1,181,030 1,181,030 1,181,030
Current financial assets 308,116 308,116 308,116
Cash and cash equivalents 2,111,188 2,111,188 1,000,069 1,111,120
Total assets 8,794,270 8,794,270 4,109,466 4,684,805 0
Current financial l iabilities 2,473,224 2,473,224 2,473,224
Non-current financial l iabilities 1,722,170 1,722,170 1,722,170
Trade and other accounts payable 2,297,232 2,297,232 2,297,232
Derivatives-liabilities 8,530 8,530 8,530
Other creditors and miscellaneous liabilities 15,875 15,875 15,875
Total liabilities 6,517,031 6,517,031 8,530 0 6,508,501
12/31/2014Value - statement of financial position in
accordance with IAS 39
(Amounts in euros)
InterestChanges in
fair valueInterest
Changes in
fair value
Assets
Assets at fair value through the income statement 44,187 4,244
Cash and cash equivalents 499 310
Liabilities
Derivatives-liabilities (8,183) 10,282
Liabilities valued at amortized cost: bond issues 233,492 292,320
Liabilities valued at amortized cost: advances 3,529 6,174
Impacts on the income
statement at June 30, 2015
Impacts on the income
statement at June 30, 2014
Half-year financial report at June 30, 2015
FOR TRANSLATION PURPOSES ONLY Page 26 of45
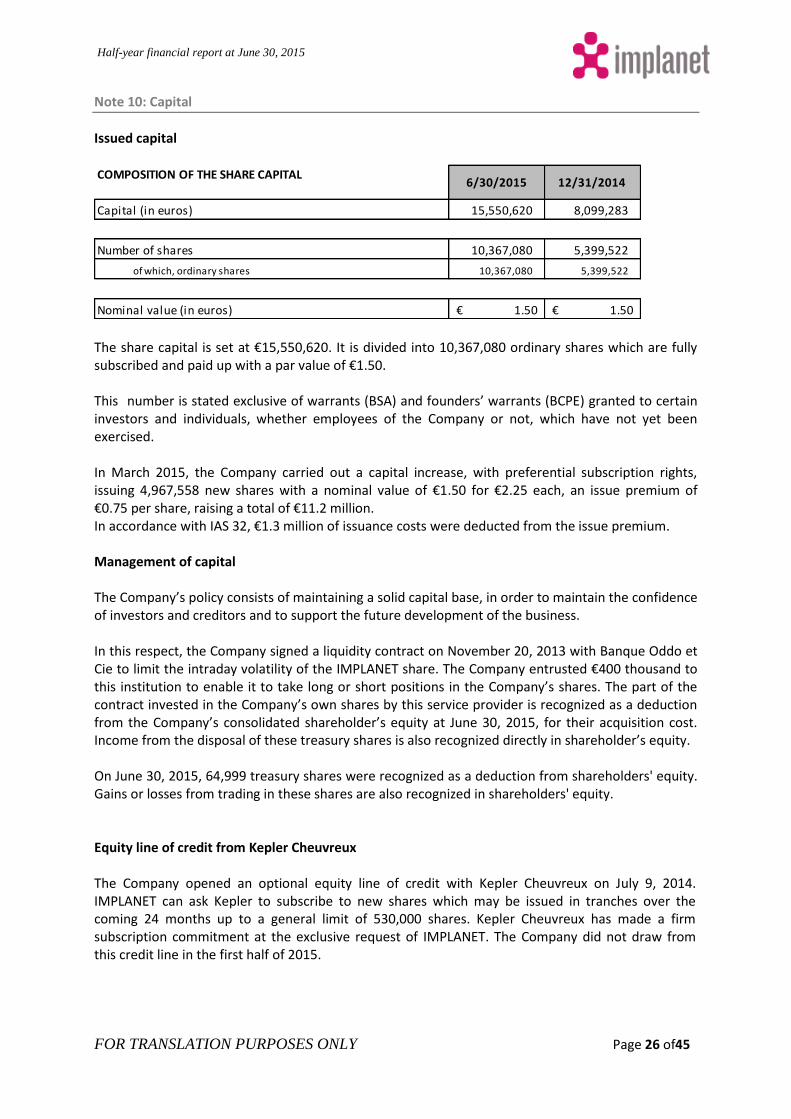
Note 10: Capital
Issued capital
The share capital is set at €15,550,620. It is divided into 10,367,080 ordinary shares which are fully subscribed and paid up with a par value of €1.50. This number is stated exclusive of warrants (BSA) and founders’ warrants (BCPE) granted to certain investors and individuals, whether employees of the Company or not, which have not yet been exercised. In March 2015, the Company carried out a capital increase, with preferential subscription rights, issuing 4,967,558 new shares with a nominal value of €1.50 for €2.25 each, an issue premium of €0.75 per share, raising a total of €11.2 million. In accordance with IAS 32, €1.3 million of issuance costs were deducted from the issue premium. Management of capital The Company’s policy consists of maintaining a solid capital base, in order to maintain the confidence of investors and creditors and to support the future development of the business. In this respect, the Company signed a liquidity contract on November 20, 2013 with Banque Oddo et Cie to limit the intraday volatility of the IMPLANET share. The Company entrusted €400 thousand to this institution to enable it to take long or short positions in the Company’s shares. The part of the contract invested in the Company’s own shares by this service provider is recognized as a deduction from the Company’s consolidated shareholder’s equity at June 30, 2015, for their acquisition cost. Income from the disposal of these treasury shares is also recognized directly in shareholder’s equity. On June 30, 2015, 64,999 treasury shares were recognized as a deduction from shareholders' equity. Gains or losses from trading in these shares are also recognized in shareholders' equity. Equity line of credit from Kepler Cheuvreux The Company opened an optional equity line of credit with Kepler Cheuvreux on July 9, 2014. IMPLANET can ask Kepler to subscribe to new shares which may be issued in tranches over the coming 24 months up to a general limit of 530,000 shares. Kepler Cheuvreux has made a firm subscription commitment at the exclusive request of IMPLANET. The Company did not draw from this credit line in the first half of 2015.
COMPOSITION OF THE SHARE CAPITAL6/30/2015 12/31/2014
Capital (in euros) 15,550,620 8,099,283
Number of shares 10,367,080 5,399,522
of which, ordinary shares 10,367,080 5,399,522
Nominal value (in euros) 1.50€ 1.50€
Half-year financial report at June 30, 2015
FOR TRANSLATION PURPOSES ONLY Page 27 of45
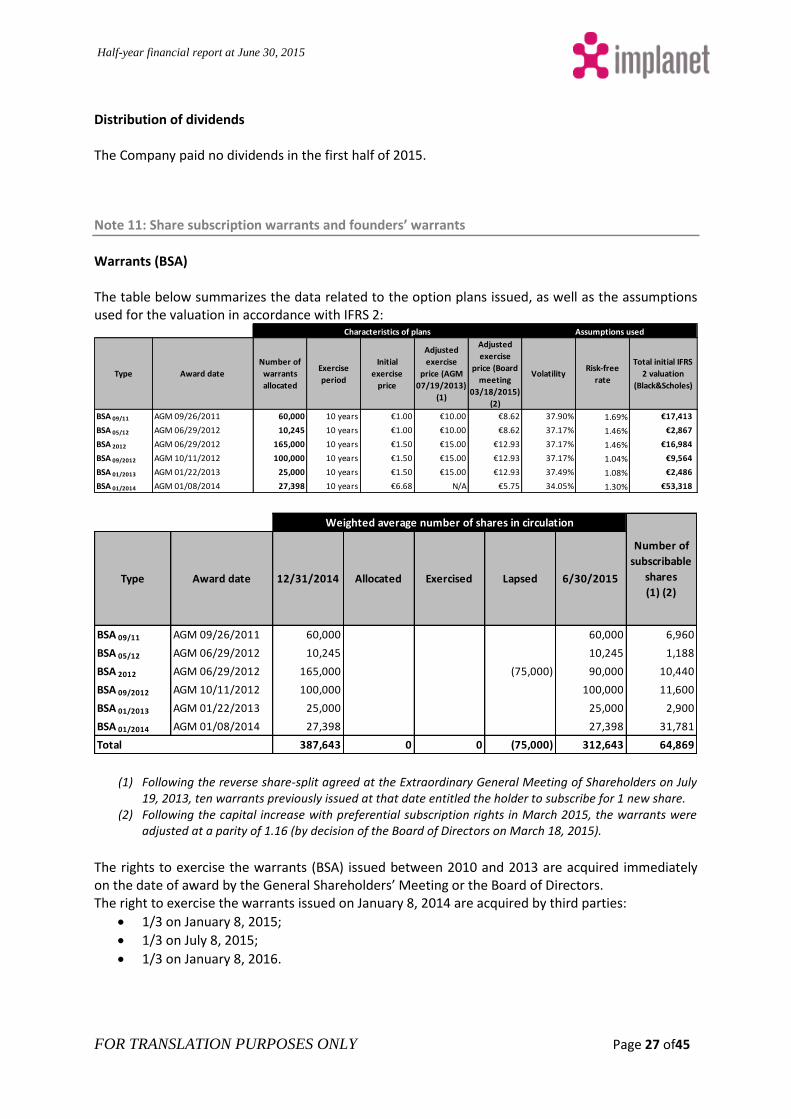
Distribution of dividends The Company paid no dividends in the first half of 2015.
Note 11: Share subscription warrants and founders’ warrants
Warrants (BSA) The table below summarizes the data related to the option plans issued, as well as the assumptions used for the valuation in accordance with IFRS 2:
(1) Following the reverse share-split agreed at the Extraordinary General Meeting of Shareholders on July 19, 2013, ten warrants previously issued at that date entitled the holder to subscribe for 1 new share.
(2) Following the capital increase with preferential subscription rights in March 2015, the warrants were adjusted at a parity of 1.16 (by decision of the Board of Directors on March 18, 2015).
The rights to exercise the warrants (BSA) issued between 2010 and 2013 are acquired immediately on the date of award by the General Shareholders’ Meeting or the Board of Directors. The right to exercise the warrants issued on January 8, 2014 are acquired by third parties:
1/3 on January 8, 2015;
1/3 on July 8, 2015;
1/3 on January 8, 2016.
Type Award date
Number of
warrants
allocated
Exercise
period
Initial
exercise
price
Adjusted
exercise
price (AGM
07/19/2013)
(1)
Adjusted
exercise
price (Board
meeting
03/18/2015)
(2)
VolatilityRisk-free
rate
Total initial IFRS
2 valuation
(Black&Scholes)
BSA 09/11 AGM 09/26/2011 60,000 10 years €1.00 €10.00 €8.62 37.90% 1.69% €17,413
BSA 05/12 AGM 06/29/2012 10,245 10 years €1.00 €10.00 €8.62 37.17% 1.46% €2,867
BSA 2012 AGM 06/29/2012 165,000 10 years €1.50 €15.00 €12.93 37.17% 1.46% €16,984
BSA 09/2012 AGM 10/11/2012 100,000 10 years €1.50 €15.00 €12.93 37.17% 1.04% €9,564
BSA 01/2013 AGM 01/22/2013 25,000 10 years €1.50 €15.00 €12.93 37.49% 1.08% €2,486
BSA 01/2014 AGM 01/08/2014 27,398 10 years €6.68 N/A €5.75 34.05% 1.30% €53,318
Characteristics of plans Assumptions used
Type Award date 12/31/2014 Allocated Exercised Lapsed 6/30/2015
BSA 09/11 AGM 09/26/2011 60,000 60,000 6,960
BSA 05/12 AGM 06/29/2012 10,245 10,245 1,188
BSA 2012 AGM 06/29/2012 165,000 (75,000) 90,000 10,440
BSA 09/2012 AGM 10/11/2012 100,000 100,000 11,600
BSA 01/2013 AGM 01/22/2013 25,000 25,000 2,900
BSA 01/2014 AGM 01/08/2014 27,398 27,398 31,781
387,643 0 0 (75,000) 312,643 64,869 Total
Weighted average number of shares in circulation
Number of
subscribable
shares
(1) (2)
Half-year financial report at June 30, 2015
FOR TRANSLATION PURPOSES ONLY Page 28 of45
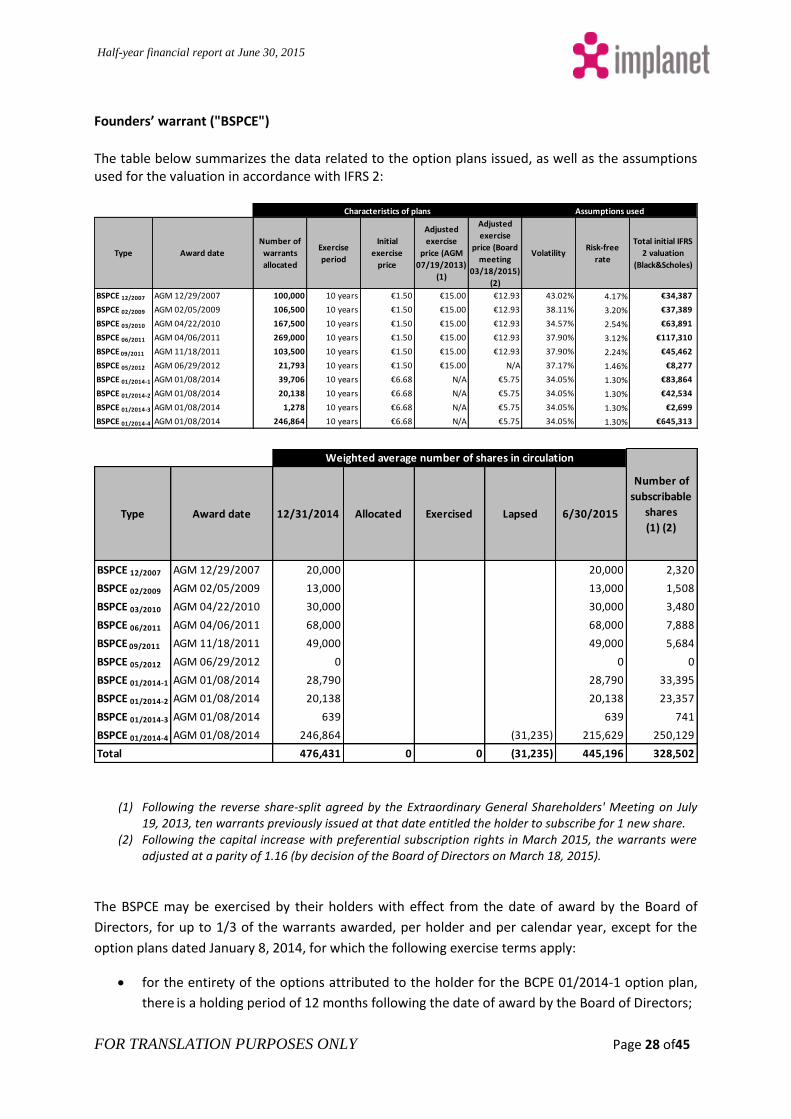
Founders’ warrant ("BSPCE")
The table below summarizes the data related to the option plans issued, as well as the assumptions used for the valuation in accordance with IFRS 2:
(1) Following the reverse share-split agreed by the Extraordinary General Shareholders' Meeting on July
19, 2013, ten warrants previously issued at that date entitled the holder to subscribe for 1 new share. (2) Following the capital increase with preferential subscription rights in March 2015, the warrants were
adjusted at a parity of 1.16 (by decision of the Board of Directors on March 18, 2015).
The BSPCE may be exercised by their holders with effect from the date of award by the Board of
Directors, for up to 1/3 of the warrants awarded, per holder and per calendar year, except for the
option plans dated January 8, 2014, for which the following exercise terms apply:
for the entirety of the options attributed to the holder for the BCPE 01/2014-1 option plan,
there is a holding period of 12 months following the date of award by the Board of Directors;
Type Award date
Number of
warrants
allocated
Exercise
period
Initial
exercise
price
Adjusted
exercise
price (AGM
07/19/2013)
(1)
Adjusted
exercise
price (Board
meeting
03/18/2015)
(2)
VolatilityRisk-free
rate
Total initial IFRS
2 valuation
(Black&Scholes)
BSPCE 12/2007 AGM 12/29/2007 100,000 10 years €1.50 €15.00 €12.93 43.02% 4.17% €34,387
BSPCE 02/2009 AGM 02/05/2009 106,500 10 years €1.50 €15.00 €12.93 38.11% 3.20% €37,389
BSPCE 03/2010 AGM 04/22/2010 167,500 10 years €1.50 €15.00 €12.93 34.57% 2.54% €63,891
BSPCE 06/2011 AGM 04/06/2011 269,000 10 years €1.50 €15.00 €12.93 37.90% 3.12% €117,310
BSPCE 09/2011 AGM 11/18/2011 103,500 10 years €1.50 €15.00 €12.93 37.90% 2.24% €45,462
BSPCE 05/2012 AGM 06/29/2012 21,793 10 years €1.50 €15.00 N/A 37.17% 1.46% €8,277
BSPCE 01/2014-1 AGM 01/08/2014 39,706 10 years €6.68 N/A €5.75 34.05% 1.30% €83,864
BSPCE 01/2014-2 AGM 01/08/2014 20,138 10 years €6.68 N/A €5.75 34.05% 1.30% €42,534
BSPCE 01/2014-3 AGM 01/08/2014 1,278 10 years €6.68 N/A €5.75 34.05% 1.30% €2,699
BSPCE 01/2014-4 AGM 01/08/2014 246,864 10 years €6.68 N/A €5.75 34.05% 1.30% €645,313
Characteristics of plans Assumptions used
Type Award date 12/31/2014 Allocated Exercised Lapsed 6/30/2015
BSPCE 12/2007 AGM 12/29/2007 20,000 20,000 2,320
BSPCE 02/2009 AGM 02/05/2009 13,000 13,000 1,508
BSPCE 03/2010 AGM 04/22/2010 30,000 30,000 3,480
BSPCE 06/2011 AGM 04/06/2011 68,000 68,000 7,888
BSPCE 09/2011 AGM 11/18/2011 49,000 49,000 5,684
BSPCE 05/2012 AGM 06/29/2012 0 0 0
BSPCE 01/2014-1 AGM 01/08/2014 28,790 28,790 33,395
BSPCE 01/2014-2 AGM 01/08/2014 20,138 20,138 23,357
BSPCE 01/2014-3 AGM 01/08/2014 639 639 741
BSPCE 01/2014-4 AGM 01/08/2014 246,864 (31,235) 215,629 250,129
476,431 0 0 (31,235) 445,196 328,502 Total
Weighted average number of shares in circulation
Number of
subscribable
shares
(1) (2)
Half-year financial report at June 30, 2015
FOR TRANSLATION PURPOSES ONLY Page 29 of45
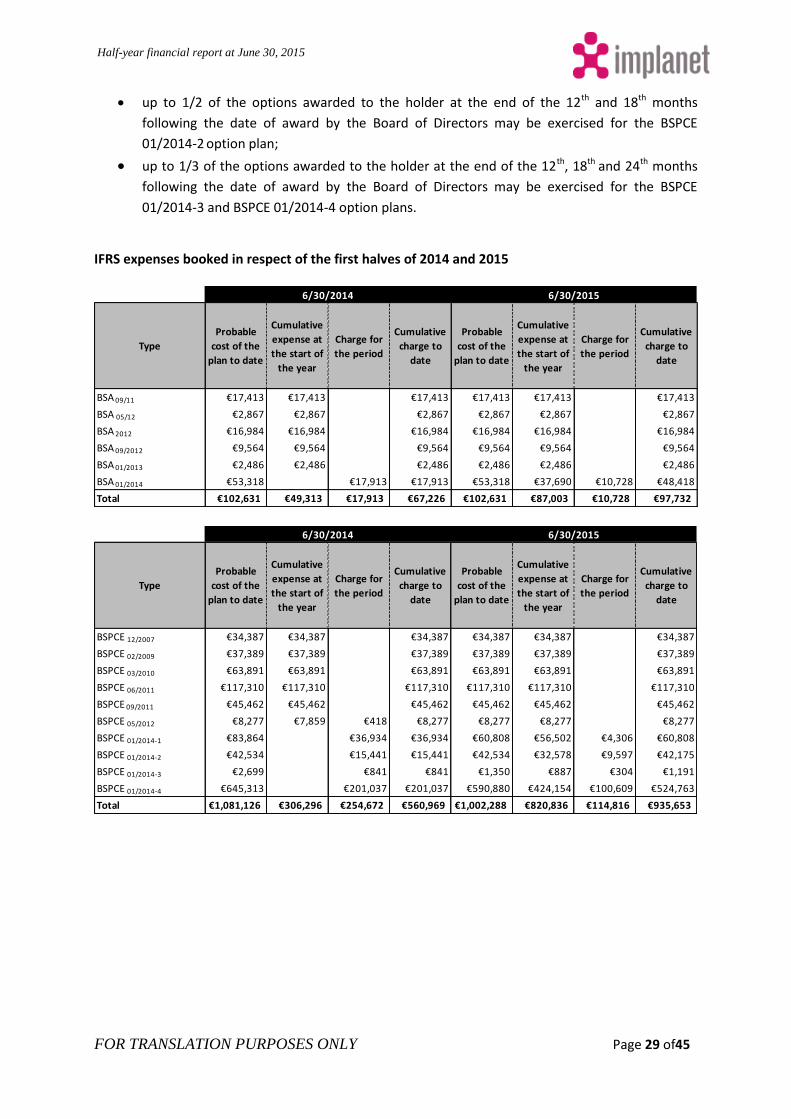
up to 1/2 of the options awarded to the holder at the end of the 12th and 18th months
following the date of award by the Board of Directors may be exercised for the BSPCE
01/2014-2 option plan;
up to 1/3 of the options awarded to the holder at the end of the 12th, 18th and 24th months
following the date of award by the Board of Directors may be exercised for the BSPCE
01/2014-3 and BSPCE 01/2014-4 option plans.
IFRS expenses booked in respect of the first halves of 2014 and 2015
Type
Probable
cost of the
plan to date
Cumulative
expense at
the start of
the year
Charge for
the period
Cumulative
charge to
date
Probable
cost of the
plan to date
Cumulative
expense at
the start of
the year
Charge for
the period
Cumulative
charge to
date
BSA 09/11 €17,413 €17,413 €17,413 €17,413 €17,413 €17,413
BSA 05/12 €2,867 €2,867 €2,867 €2,867 €2,867 €2,867
BSA 2012 €16,984 €16,984 €16,984 €16,984 €16,984 €16,984
BSA 09/2012 €9,564 €9,564 €9,564 €9,564 €9,564 €9,564
BSA 01/2013 €2,486 €2,486 €2,486 €2,486 €2,486 €2,486
BSA 01/2014 €53,318 €17,913 €17,913 €53,318 €37,690 €10,728 €48,418
Total €102,631 €49,313 €17,913 €67,226 €102,631 €87,003 €10,728 €97,732
6/30/2014 6/30/2015
Type
Probable
cost of the
plan to date
Cumulative
expense at
the start of
the year
Charge for
the period
Cumulative
charge to
date
Probable
cost of the
plan to date
Cumulative
expense at
the start of
the year
Charge for
the period
Cumulative
charge to
date
BSPCE 12/2007 €34,387 €34,387 €34,387 €34,387 €34,387 €34,387
BSPCE 02/2009 €37,389 €37,389 €37,389 €37,389 €37,389 €37,389
BSPCE 03/2010 €63,891 €63,891 €63,891 €63,891 €63,891 €63,891
BSPCE 06/2011 €117,310 €117,310 €117,310 €117,310 €117,310 €117,310
BSPCE 09/2011 €45,462 €45,462 €45,462 €45,462 €45,462 €45,462
BSPCE 05/2012 €8,277 €7,859 €418 €8,277 €8,277 €8,277 €8,277
BSPCE 01/2014-1 €83,864 €36,934 €36,934 €60,808 €56,502 €4,306 €60,808
BSPCE 01/2014-2 €42,534 €15,441 €15,441 €42,534 €32,578 €9,597 €42,175
BSPCE 01/2014-3 €2,699 €841 €841 €1,350 €887 €304 €1,191
BSPCE 01/2014-4 €645,313 €201,037 €201,037 €590,880 €424,154 €100,609 €524,763
Total €1,081,126 €306,296 €254,672 €560,969 €1,002,288 €820,836 €114,816 €935,653
6/30/20156/30/2014
Half-year financial report at June 30, 2015
FOR TRANSLATION PURPOSES ONLY Page 30 of45
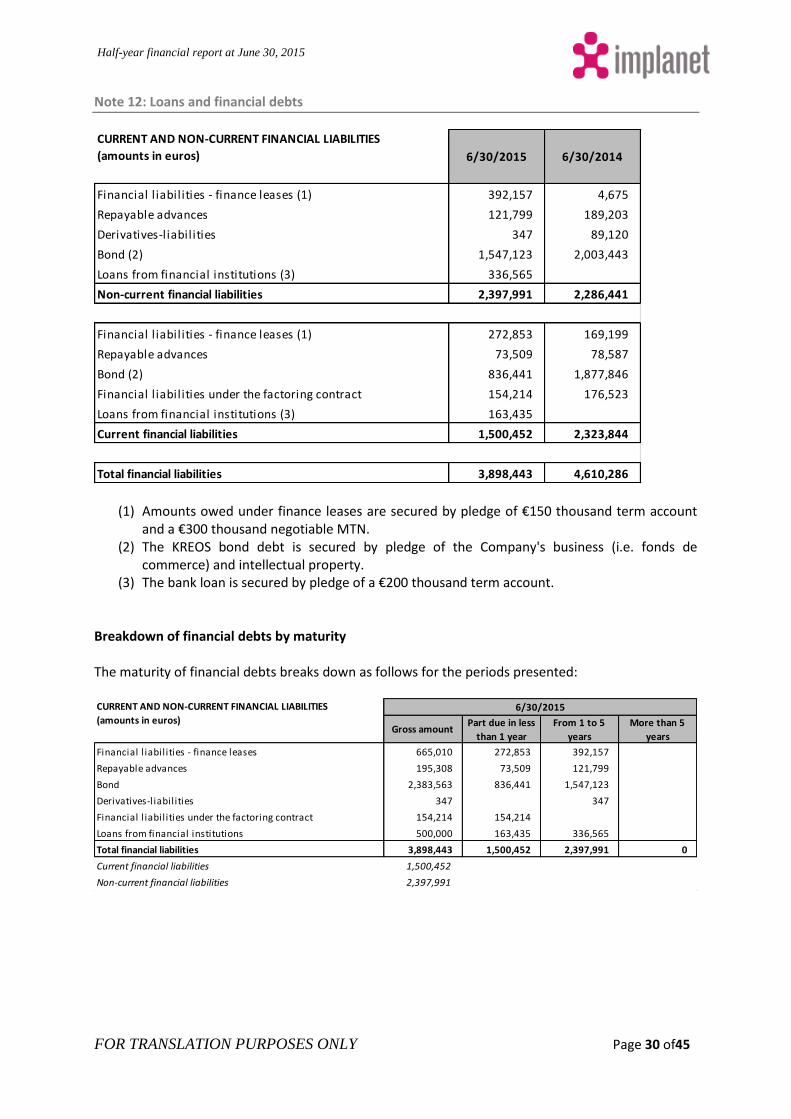
Note 12: Loans and financial debts
(1) Amounts owed under finance leases are secured by pledge of €150 thousand term account and a €300 thousand negotiable MTN.
(2) The KREOS bond debt is secured by pledge of the Company's business (i.e. fonds de commerce) and intellectual property.
(3) The bank loan is secured by pledge of a €200 thousand term account. Breakdown of financial debts by maturity The maturity of financial debts breaks down as follows for the periods presented:
CURRENT AND NON-CURRENT FINANCIAL LIABILITIES
(amounts in euros) 6/30/2015 6/30/2014
Financial l iabilities - finance leases (1) 392,157 4,675
Repayable advances 121,799 189,203
Derivatives-liabilities 347 89,120
Bond (2) 1,547,123 2,003,443
Loans from financial institutions (3) 336,565
Non-current financial liabilities 2,397,991 2,286,441
Financial l iabilities - finance leases (1) 272,853 169,199
Repayable advances 73,509 78,587
Bond (2) 836,441 1,877,846
Financial l iabilities under the factoring contract 154,214 176,523
Loans from financial institutions (3) 163,435
Current financial liabilities 1,500,452 2,323,844
Total financial liabilities 3,898,443 4,610,286
Gross amountPart due in less
than 1 year
From 1 to 5
years
More than 5
years
Financial l iabilities - finance leases 665,010 272,853 392,157
Repayable advances 195,308 73,509 121,799
Bond 2,383,563 836,441 1,547,123
Derivatives-liabilities 347 347
Financial l iabilities under the factoring contract 154,214 154,214
Loans from financial institutions 500,000 163,435 336,565
Total financial liabilities 3,898,443 1,500,452 2,397,991 0
Current financial liabilities 1,500,452
Non-current financial liabilities 2,397,991
CURRENT AND NON-CURRENT FINANCIAL LIABILITIES
(amounts in euros)6/30/2015
Half-year financial report at June 30, 2015
FOR TRANSLATION PURPOSES ONLY Page 31 of45
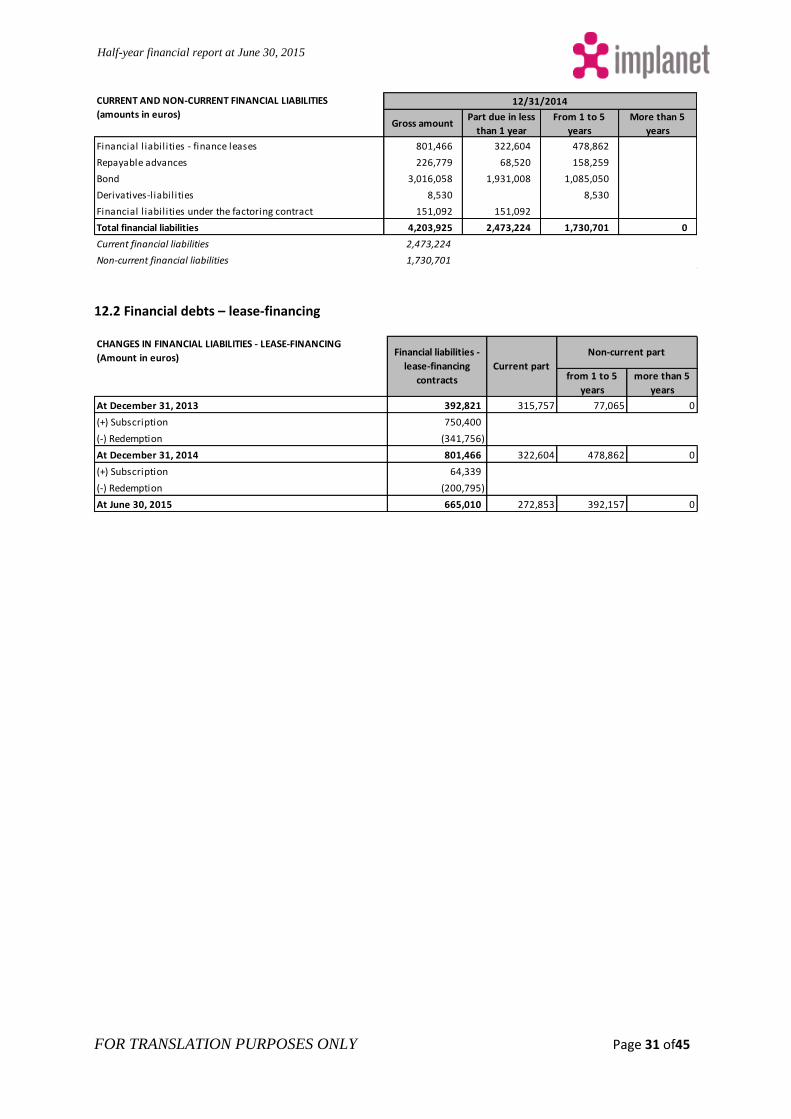
12.2 Financial debts – lease-financing
Gross amountPart due in less
than 1 year
From 1 to 5
years
More than 5
years
Financial l iabilities - finance leases 801,466 322,604 478,862
Repayable advances 226,779 68,520 158,259
Bond 3,016,058 1,931,008 1,085,050
Derivatives-liabilities 8,530 8,530
Financial l iabilities under the factoring contract 151,092 151,092
Total financial liabilities 4,203,925 2,473,224 1,730,701 0
Current financial liabilities 2,473,224
Non-current financial liabilities 1,730,701
CURRENT AND NON-CURRENT FINANCIAL LIABILITIES
(amounts in euros)12/31/2014
from 1 to 5
years
more than 5
years
At December 31, 2013 392,821 315,757 77,065 0
(+) Subscription 750,400
(-) Redemption (341,756)
At December 31, 2014 801,466 322,604 478,862 0
(+) Subscription 64,339
(-) Redemption (200,795)
At June 30, 2015 665,010 272,853 392,157 0
CHANGES IN FINANCIAL LIABILITIES - LEASE-FINANCING
(Amount in euros)Financial liabilities -
lease-financing
contracts
Current part
Non-current part
Half-year financial report at June 30, 2015
FOR TRANSLATION PURPOSES ONLY Page 32 of45
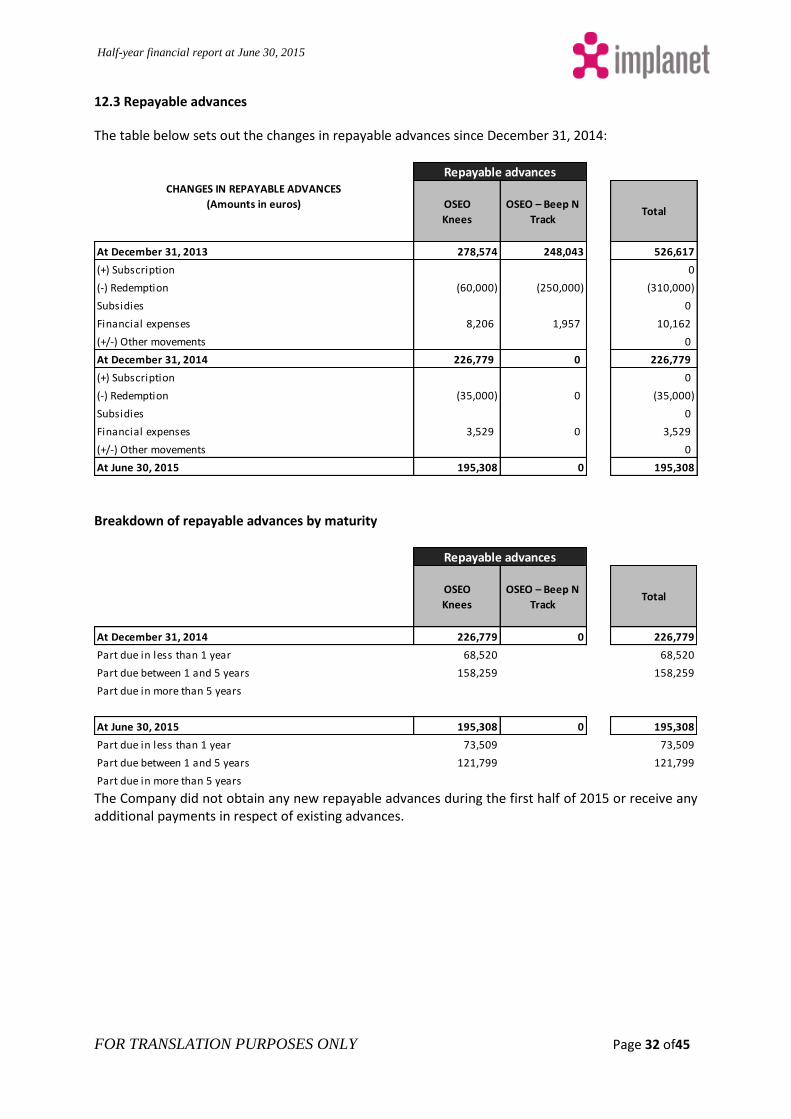
12.3 Repayable advances
The table below sets out the changes in repayable advances since December 31, 2014:
Breakdown of repayable advances by maturity
The Company did not obtain any new repayable advances during the first half of 2015 or receive any additional payments in respect of existing advances.
OSEO
Knees
OSEO – Beep N
TrackTotal
At December 31, 2013 278,574 248,043 526,617
(+) Subscription 0
(-) Redemption (60,000) (250,000) (310,000)
Subsidies 0
Financial expenses 8,206 1,957 10,162
(+/-) Other movements 0
At December 31, 2014 226,779 0 226,779
(+) Subscription 0
(-) Redemption (35,000) 0 (35,000)
Subsidies 0
Financial expenses 3,529 0 3,529
(+/-) Other movements 0
At June 30, 2015 195,308 0 195,308
CHANGES IN REPAYABLE ADVANCES
(Amounts in euros)
Repayable advances
OSEO
Knees
OSEO – Beep N
TrackTotal
At December 31, 2014 226,779 0 226,779
Part due in less than 1 year 68,520 68,520
Part due between 1 and 5 years 158,259 158,259
Part due in more than 5 years
At June 30, 2015 195,308 0 195,308
Part due in less than 1 year 73,509 73,509
Part due between 1 and 5 years 121,799 121,799
Part due in more than 5 years
Repayable advances
Half-year financial report at June 30, 2015
FOR TRANSLATION PURPOSES ONLY Page 33 of45
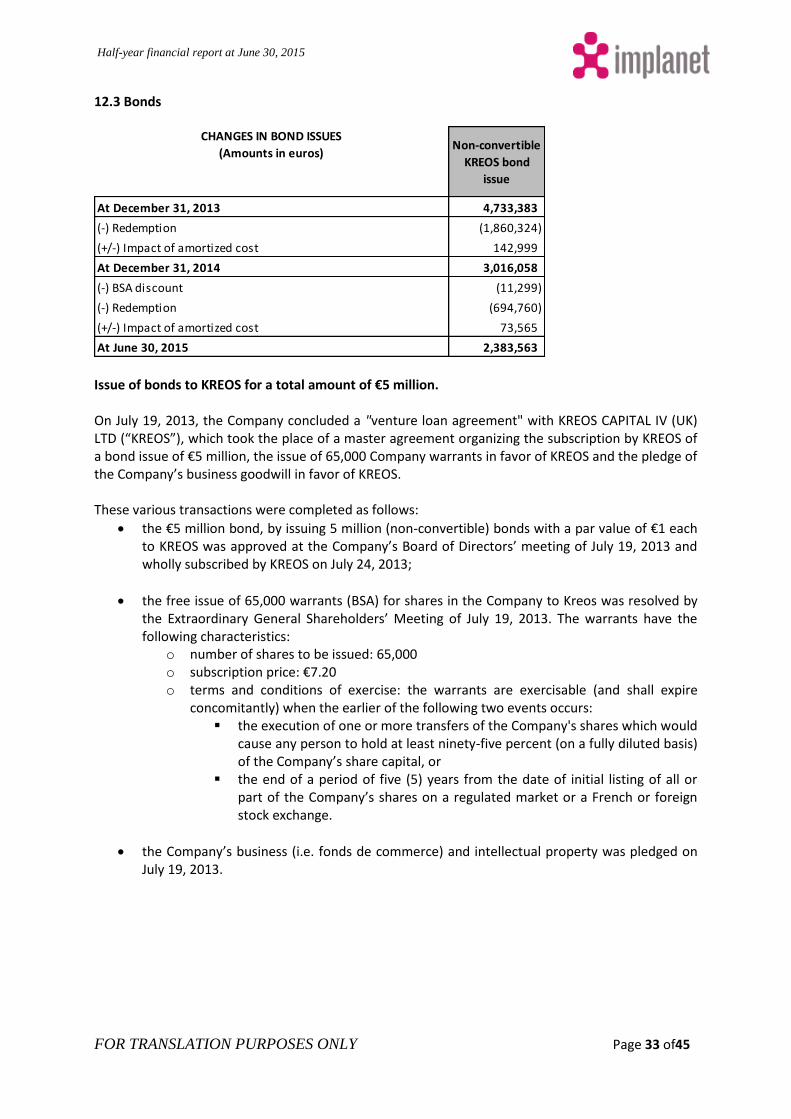
12.3 Bonds
Issue of bonds to KREOS for a total amount of €5 million. On July 19, 2013, the Company concluded a "venture loan agreement" with KREOS CAPITAL IV (UK) LTD (“KREOS”), which took the place of a master agreement organizing the subscription by KREOS of a bond issue of €5 million, the issue of 65,000 Company warrants in favor of KREOS and the pledge of the Company’s business goodwill in favor of KREOS. These various transactions were completed as follows:
the €5 million bond, by issuing 5 million (non-convertible) bonds with a par value of €1 each to KREOS was approved at the Company’s Board of Directors’ meeting of July 19, 2013 and wholly subscribed by KREOS on July 24, 2013;
the free issue of 65,000 warrants (BSA) for shares in the Company to Kreos was resolved by the Extraordinary General Shareholders’ Meeting of July 19, 2013. The warrants have the following characteristics:
o number of shares to be issued: 65,000 o subscription price: €7.20 o terms and conditions of exercise: the warrants are exercisable (and shall expire
concomitantly) when the earlier of the following two events occurs: the execution of one or more transfers of the Company's shares which would
cause any person to hold at least ninety-five percent (on a fully diluted basis) of the Company’s share capital, or
the end of a period of five (5) years from the date of initial listing of all or part of the Company’s shares on a regulated market or a French or foreign stock exchange.
the Company’s business (i.e. fonds de commerce) and intellectual property was pledged on July 19, 2013.
Non-convertible
KREOS bond
issue
At December 31, 2013 4,733,383
(-) Redemption (1,860,324)
(+/-) Impact of amortized cost 142,999
At December 31, 2014 3,016,058
(-) BSA discount (11,299)
(-) Redemption (694,760)
(+/-) Impact of amortized cost 73,565
At June 30, 2015 2,383,563
CHANGES IN BOND ISSUES
(Amounts in euros)
Half-year financial report at June 30, 2015
FOR TRANSLATION PURPOSES ONLY Page 34 of45
On April 16, 2015, the Company and KREOS CAPITAL IV (UK) Ltd agreed an additional clause to their venture loan agreement made on July 19, 2013, by which the parties agreed to reschedule the terms and conditions for repayment of the bond as follows:
the term of the agreement was extended from 36 to 54 months;
the flat monthly payment (capital and interest) was cut from €190,735.43 to €94,160.22;
the annual interest remained unchanged at 11.5%. On April 24, 2015, the Company also agreed to issue 18,473 share subscription warrants to KREOS, approved by the General Meeting of Shareholders on June 24, 2015. The warrants have the following characteristics:
o number of shares to be issued: 18,473 o subscription price: €2.91 o terms and conditions of exercise identical to the 2013 KREOS warrants
The Company incurred €112,500 in lawyers’ and consultants’ fees in the course of arranging the bond and €5,130 for its additional clause. A further €72,500 in costs will be payable on maturity of the bond. The fees were taken into account in determining the amortization of the loan, in accordance with the amortized cost method. After factoring in the costs of issue and of the additional clause as well as the discount on the 2013 and 2015 warrants, the effective interest rate on the bond is 14.87%. The 2013 Share subscription warrants (BSA) are recognized in derivative liabilities and measured at fair value, with variations in this fair value recognized in profit or loss. The fair value was determined using the Black & Scholes valuation model. The main assumptions applied at June 30, 2015 are as follows:
Anticipated term: 2.5 years
Volatility: 30.58%
Risk-free rate: -0.19% The derivative liability at June 30, 2015 amounted to €0.3 thousand. The change in fair value over the fiscal year is -€8 thousand. The 2015 Share subscription warrants are recognized as equity instruments and measured at fair value. The fair value was determined using the Black & Scholes valuation model. The fair value of the 2015 Share subscription warrants on issue is €12 thousand, based on the following assumptions:
Anticipated term: 2.5 years
Volatility: 30.58%
Risk-free rate: -0.16%
Half-year financial report at June 30, 2015
FOR TRANSLATION PURPOSES ONLY Page 35 of45
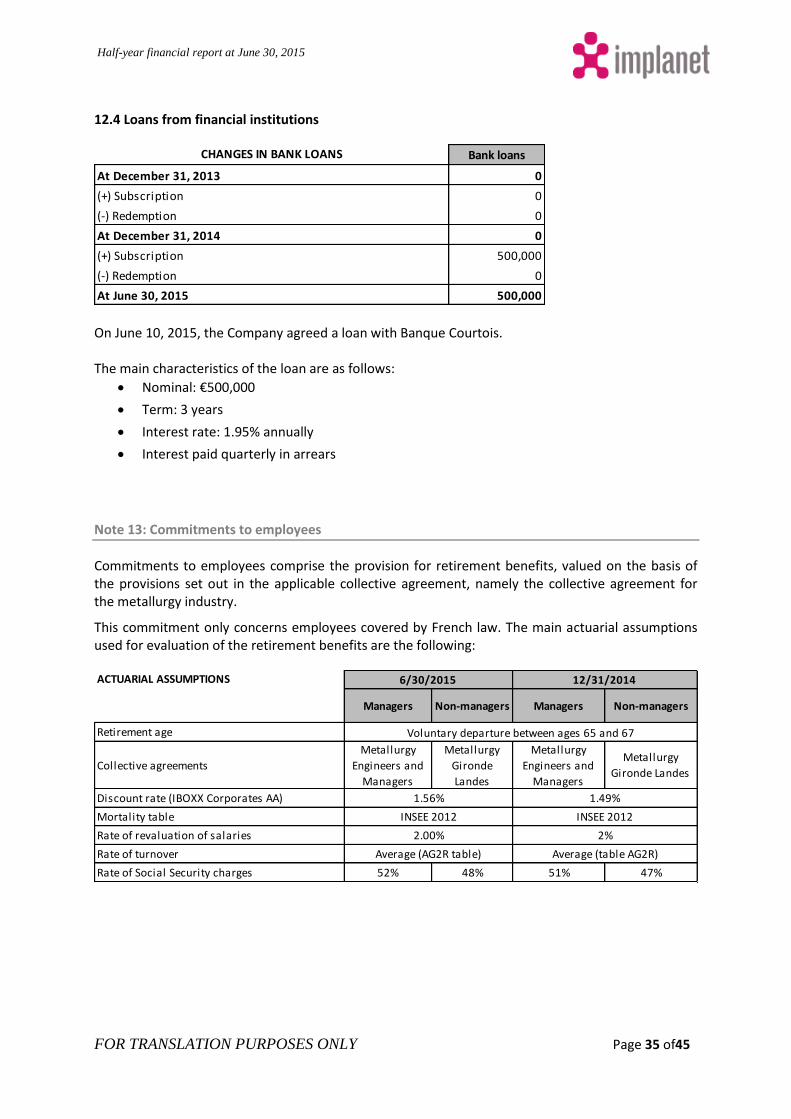
12.4 Loans from financial institutions
On June 10, 2015, the Company agreed a loan with Banque Courtois. The main characteristics of the loan are as follows:
Nominal: €500,000
Term: 3 years
Interest rate: 1.95% annually
Interest paid quarterly in arrears
Note 13: Commitments to employees
Commitments to employees comprise the provision for retirement benefits, valued on the basis of the provisions set out in the applicable collective agreement, namely the collective agreement for the metallurgy industry.
This commitment only concerns employees covered by French law. The main actuarial assumptions used for evaluation of the retirement benefits are the following:
Bank loans
At December 31, 2013 0
(+) Subscription 0
(-) Redemption 0
At December 31, 2014 0
(+) Subscription 500,000
(-) Redemption 0
At June 30, 2015 500,000
CHANGES IN BANK LOANS
(Amounts in euros)
Managers Non-managers Managers Non-managers
Retirement age
Collective agreements
Metallurgy
Engineers and
Managers
Metallurgy
Gironde
Landes
Metallurgy
Engineers and
Managers
Metallurgy
Gironde Landes
Discount rate (IBOXX Corporates AA)
Mortality table
Rate of revaluation of salaries
Rate of turnover
Rate of Social Security charges 52% 48% 51% 47%
ACTUARIAL ASSUMPTIONS 12/31/20146/30/2015
INSEE 2012
2.00%
Average (AG2R table)
1.56%
Voluntary departure between ages 65 and 67
1.49%
2%
INSEE 2012
Average (table AG2R)
Half-year financial report at June 30, 2015
FOR TRANSLATION PURPOSES ONLY Page 36 of45
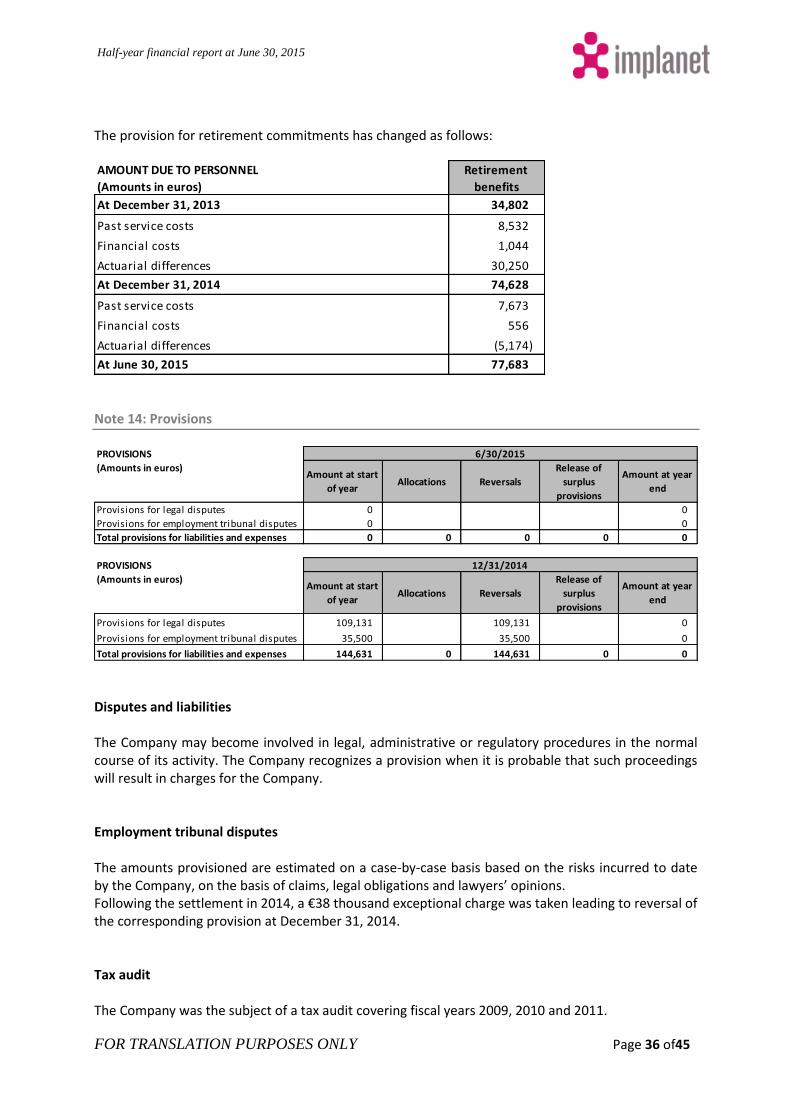
The provision for retirement commitments has changed as follows:
Note 14: Provisions
Disputes and liabilities The Company may become involved in legal, administrative or regulatory procedures in the normal course of its activity. The Company recognizes a provision when it is probable that such proceedings will result in charges for the Company. Employment tribunal disputes The amounts provisioned are estimated on a case-by-case basis based on the risks incurred to date by the Company, on the basis of claims, legal obligations and lawyers’ opinions. Following the settlement in 2014, a €38 thousand exceptional charge was taken leading to reversal of the corresponding provision at December 31, 2014. Tax audit The Company was the subject of a tax audit covering fiscal years 2009, 2010 and 2011.
AMOUNT DUE TO PERSONNEL
(Amounts in euros)
Retirement
benefits
At December 31, 2013 34,802
Past service costs 8,532
Financial costs 1,044
Actuarial differences 30,250
At December 31, 2014 74,628
Past service costs 7,673
Financial costs 556
Actuarial differences (5,174)
At June 30, 2015 77,683
Amount at start
of yearAllocations Reversals
Release of
surplus
provisions
Amount at year
end
Provisions for legal disputes 0 0
Provisions for employment tribunal disputes 0 0
Total provisions for liabilities and expenses 0 0 0 0 0
Amount at start
of yearAllocations Reversals
Release of
surplus
provisions
Amount at year
end
Provisions for legal disputes 109,131 109,131 0
Provisions for employment tribunal disputes 35,500 35,500 0
Total provisions for liabilities and expenses 144,631 0 144,631 0 0
PROVISIONS
(Amounts in euros)
6/30/2015
PROVISIONS
(Amounts in euros)
12/31/2014
Half-year financial report at June 30, 2015
FOR TRANSLATION PURPOSES ONLY Page 37 of45
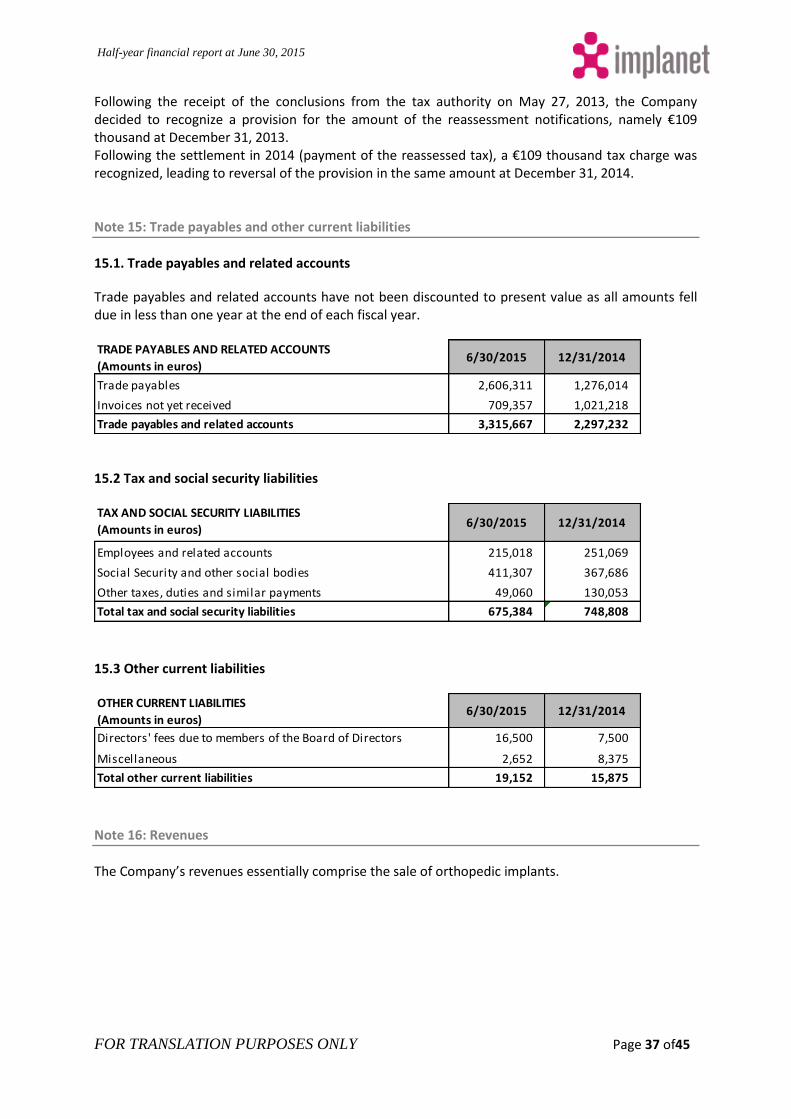
Following the receipt of the conclusions from the tax authority on May 27, 2013, the Company decided to recognize a provision for the amount of the reassessment notifications, namely €109 thousand at December 31, 2013. Following the settlement in 2014 (payment of the reassessed tax), a €109 thousand tax charge was recognized, leading to reversal of the provision in the same amount at December 31, 2014. Note 15: Trade payables and other current liabilities
15.1. Trade payables and related accounts
Trade payables and related accounts have not been discounted to present value as all amounts fell due in less than one year at the end of each fiscal year.
15.2 Tax and social security liabilities
15.3 Other current liabilities
Note 16: Revenues
The Company’s revenues essentially comprise the sale of orthopedic implants.
TRADE PAYABLES AND RELATED ACCOUNTS
(Amounts in euros)6/30/2015 12/31/2014
Trade payables 2,606,311 1,276,014
Invoices not yet received 709,357 1,021,218
Trade payables and related accounts 3,315,667 2,297,232
TAX AND SOCIAL SECURITY LIABILITIES
(Amounts in euros)6/30/2015 12/31/2014
Employees and related accounts 215,018 251,069
Social Security and other social bodies 411,307 367,686
Other taxes, duties and similar payments 49,060 130,053
Total tax and social security liabilities 675,384 748,808
OTHER CURRENT LIABILITIES
(Amounts in euros)6/30/2015 12/31/2014
Directors' fees due to members of the Board of Directors 16,500 7,500
Miscellaneous 2,652 8,375
Total other current liabilities 19,152 15,875
Half-year financial report at June 30, 2015
FOR TRANSLATION PURPOSES ONLY Page 38 of45
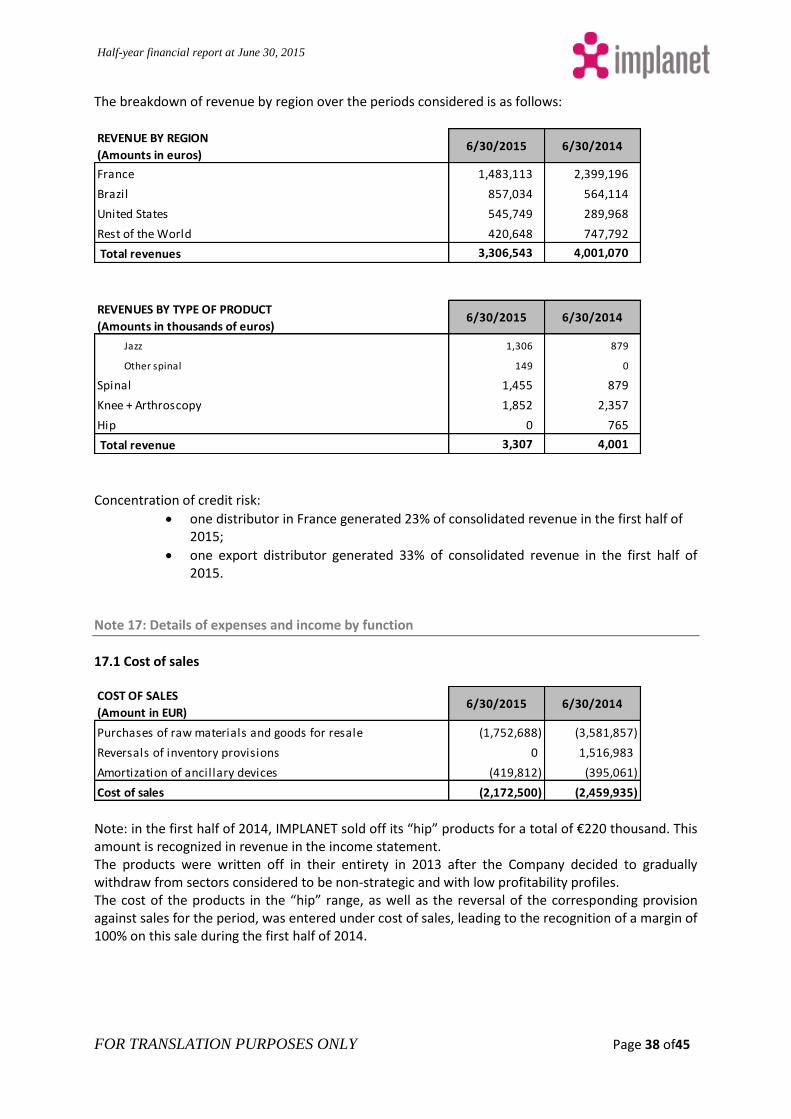
The breakdown of revenue by region over the periods considered is as follows:
Concentration of credit risk:
one distributor in France generated 23% of consolidated revenue in the first half of 2015;
one export distributor generated 33% of consolidated revenue in the first half of 2015.
Note 17: Details of expenses and income by function
17.1 Cost of sales
Note: in the first half of 2014, IMPLANET sold off its “hip” products for a total of €220 thousand. This amount is recognized in revenue in the income statement. The products were written off in their entirety in 2013 after the Company decided to gradually withdraw from sectors considered to be non-strategic and with low profitability profiles. The cost of the products in the “hip” range, as well as the reversal of the corresponding provision against sales for the period, was entered under cost of sales, leading to the recognition of a margin of 100% on this sale during the first half of 2014.
REVENUE BY REGION
(Amounts in euros)6/30/2015 6/30/2014
France 1,483,113 2,399,196
Brazil 857,034 564,114
United States 545,749 289,968
Rest of the World 420,648 747,792
Total revenues 3,306,543 4,001,070
REVENUES BY TYPE OF PRODUCT
(Amounts in thousands of euros)6/30/2015 6/30/2014
Jazz 1,306 879
Other spinal 149 0
Spinal 1,455 879
Knee + Arthroscopy 1,852 2,357
Hip 0 765
Total revenue 3,307 4,001
COST OF SALES
(Amount in EUR)6/30/2015 6/30/2014
Purchases of raw materials and goods for resale (1,752,688) (3,581,857)
Reversals of inventory provisions 0 1,516,983
Amortization of ancillary devices (419,812) (395,061)
Cost of sales (2,172,500) (2,459,935)
Half-year financial report at June 30, 2015
FOR TRANSLATION PURPOSES ONLY Page 39 of45
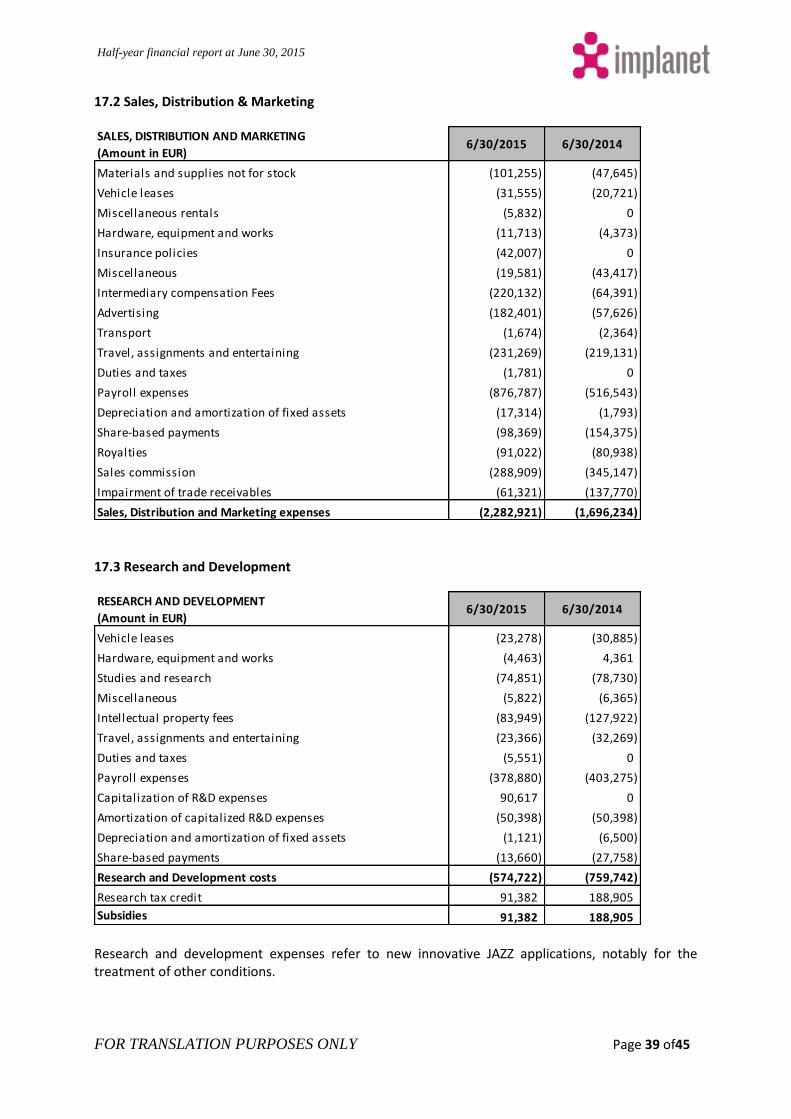
17.2 Sales, Distribution & Marketing
17.3 Research and Development
Research and development expenses refer to new innovative JAZZ applications, notably for the treatment of other conditions.
SALES, DISTRIBUTION AND MARKETING
(Amount in EUR)6/30/2015 6/30/2014
Materials and supplies not for stock (101,255) (47,645)
Vehicle leases (31,555) (20,721)
Miscellaneous rentals (5,832) 0
Hardware, equipment and works (11,713) (4,373)
Insurance policies (42,007) 0
Miscellaneous (19,581) (43,417)
Intermediary compensation Fees (220,132) (64,391)
Advertising (182,401) (57,626)
Transport (1,674) (2,364)
Travel, assignments and entertaining (231,269) (219,131)
Duties and taxes (1,781) 0
Payroll expenses (876,787) (516,543)
Depreciation and amortization of fixed assets (17,314) (1,793)
Share-based payments (98,369) (154,375)
Royalties (91,022) (80,938)
Sales commission (288,909) (345,147)
Impairment of trade receivables (61,321) (137,770)
Sales, Distribution and Marketing expenses (2,282,921) (1,696,234)
RESEARCH AND DEVELOPMENT
(Amount in EUR)6/30/2015 6/30/2014
Vehicle leases (23,278) (30,885)
Hardware, equipment and works (4,463) 4,361
Studies and research (74,851) (78,730)
Miscellaneous (5,822) (6,365)
Intellectual property fees (83,949) (127,922)
Travel, assignments and entertaining (23,366) (32,269)
Duties and taxes (5,551) 0
Payroll expenses (378,880) (403,275)
Capitalization of R&D expenses 90,617 0
Amortization of capitalized R&D expenses (50,398) (50,398)
Depreciation and amortization of fixed assets (1,121) (6,500)
Share-based payments (13,660) (27,758)
Research and Development costs (574,722) (759,742)
Research tax credit 91,382 188,905
Subsidies 91,382 188,905
Half-year financial report at June 30, 2015
FOR TRANSLATION PURPOSES ONLY Page 40 of45
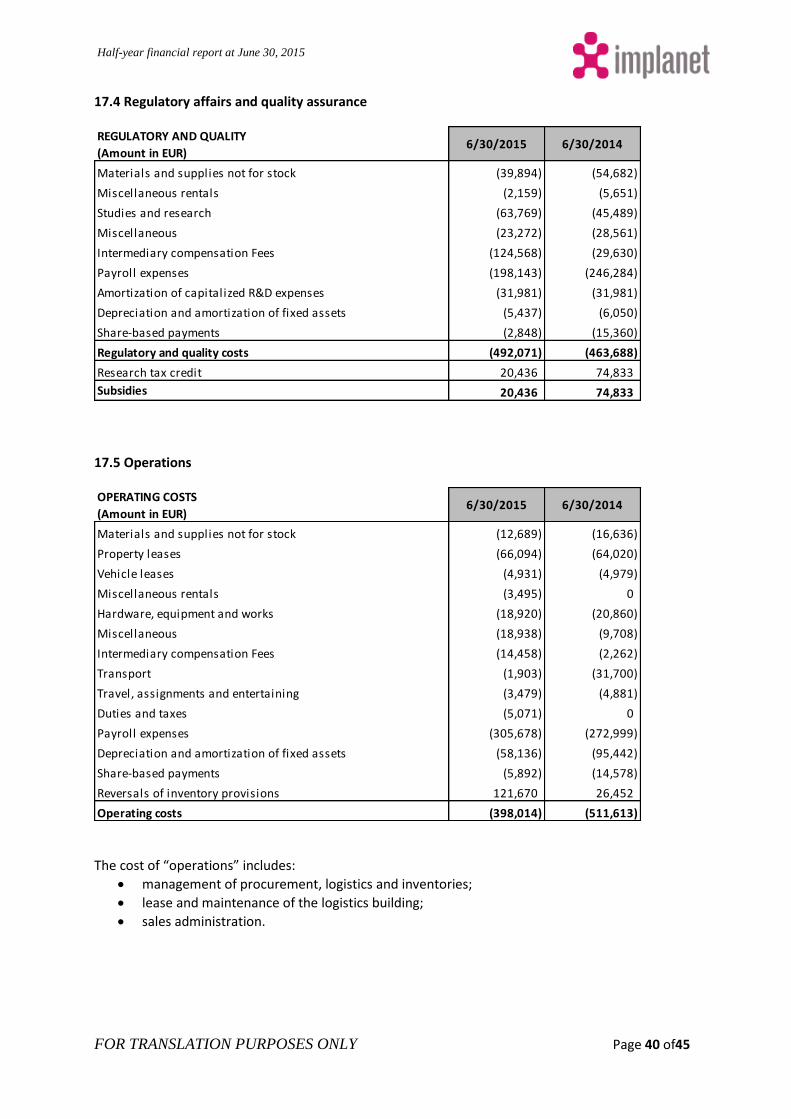
17.4 Regulatory affairs and quality assurance
17.5 Operations
The cost of “operations” includes:
management of procurement, logistics and inventories;
lease and maintenance of the logistics building;
sales administration.
REGULATORY AND QUALITY
(Amount in EUR)6/30/2015 6/30/2014
Materials and supplies not for stock (39,894) (54,682)
Miscellaneous rentals (2,159) (5,651)
Studies and research (63,769) (45,489)
Miscellaneous (23,272) (28,561)
Intermediary compensation Fees (124,568) (29,630)
Payroll expenses (198,143) (246,284)
Amortization of capitalized R&D expenses (31,981) (31,981)
Depreciation and amortization of fixed assets (5,437) (6,050)
Share-based payments (2,848) (15,360)
Regulatory and quality costs (492,071) (463,688)
Research tax credit 20,436 74,833
Subsidies 20,436 74,833
OPERATING COSTS
(Amount in EUR)6/30/2015 6/30/2014
Materials and supplies not for stock (12,689) (16,636)
Property leases (66,094) (64,020)
Vehicle leases (4,931) (4,979)
Miscellaneous rentals (3,495) 0
Hardware, equipment and works (18,920) (20,860)
Miscellaneous (18,938) (9,708)
Intermediary compensation Fees (14,458) (2,262)
Transport (1,903) (31,700)
Travel, assignments and entertaining (3,479) (4,881)
Duties and taxes (5,071) 0
Payroll expenses (305,678) (272,999)
Depreciation and amortization of fixed assets (58,136) (95,442)
Share-based payments (5,892) (14,578)
Reversals of inventory provisions 121,670 26,452
Operating costs (398,014) (511,613)
Half-year financial report at June 30, 2015
FOR TRANSLATION PURPOSES ONLY Page 41 of45
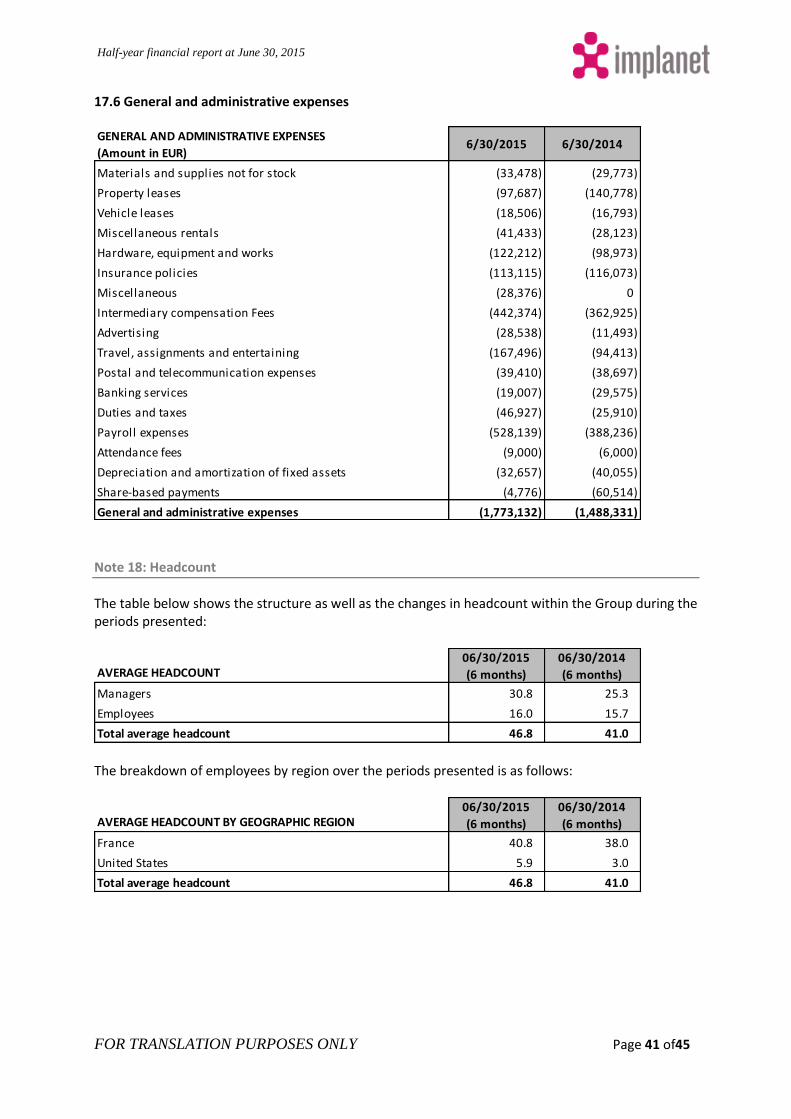
17.6 General and administrative expenses
Note 18: Headcount
The table below shows the structure as well as the changes in headcount within the Group during the periods presented:
The breakdown of employees by region over the periods presented is as follows:
GENERAL AND ADMINISTRATIVE EXPENSES
(Amount in EUR)6/30/2015 6/30/2014
Materials and supplies not for stock (33,478) (29,773)
Property leases (97,687) (140,778)
Vehicle leases (18,506) (16,793)
Miscellaneous rentals (41,433) (28,123)
Hardware, equipment and works (122,212) (98,973)
Insurance policies (113,115) (116,073)
Miscellaneous (28,376) 0
Intermediary compensation Fees (442,374) (362,925)
Advertising (28,538) (11,493)
Travel, assignments and entertaining (167,496) (94,413)
Postal and telecommunication expenses (39,410) (38,697)
Banking services (19,007) (29,575)
Duties and taxes (46,927) (25,910)
Payroll expenses (528,139) (388,236)
Attendance fees (9,000) (6,000)
Depreciation and amortization of fixed assets (32,657) (40,055)
Share-based payments (4,776) (60,514)
General and administrative expenses (1,773,132) (1,488,331)
AVERAGE HEADCOUNT06/30/2015
(6 months)
06/30/2014
(6 months)
Managers 30.8 25.3
Employees 16.0 15.7
Total average headcount 46.8 41.0
AVERAGE HEADCOUNT BY GEOGRAPHIC REGION06/30/2015
(6 months)
06/30/2014
(6 months)
France 40.8 38.0
United States 5.9 3.0
Total average headcount 46.8 41.0
Half-year financial report at June 30, 2015
FOR TRANSLATION PURPOSES ONLY Page 42 of45
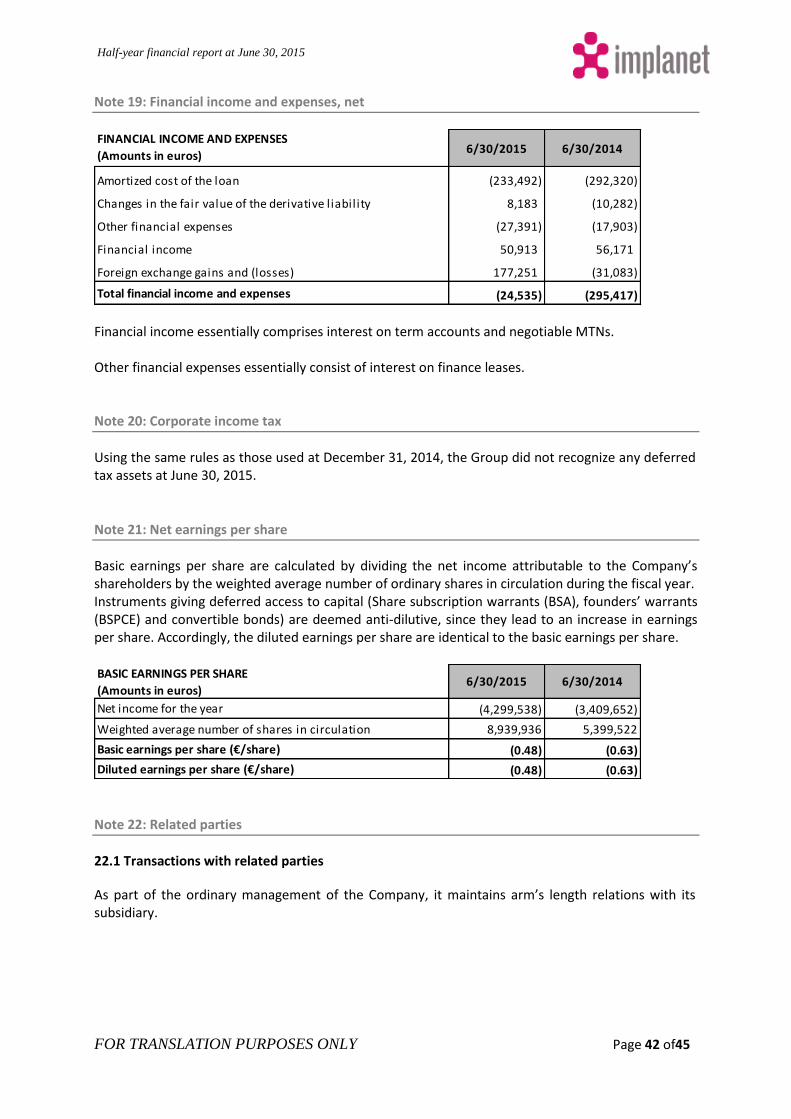
Note 19: Financial income and expenses, net
Financial income essentially comprises interest on term accounts and negotiable MTNs. Other financial expenses essentially consist of interest on finance leases. Note 20: Corporate income tax
Using the same rules as those used at December 31, 2014, the Group did not recognize any deferred tax assets at June 30, 2015.
Note 21: Net earnings per share
Basic earnings per share are calculated by dividing the net income attributable to the Company’s shareholders by the weighted average number of ordinary shares in circulation during the fiscal year. Instruments giving deferred access to capital (Share subscription warrants (BSA), founders’ warrants (BSPCE) and convertible bonds) are deemed anti-dilutive, since they lead to an increase in earnings per share. Accordingly, the diluted earnings per share are identical to the basic earnings per share.
Note 22: Related parties
22.1 Transactions with related parties
As part of the ordinary management of the Company, it maintains arm’s length relations with its subsidiary.
FINANCIAL INCOME AND EXPENSES
(Amounts in euros)6/30/2015 6/30/2014
Amortized cost of the loan (233,492) (292,320)
Changes in the fair value of the derivative liability 8,183 (10,282)
Other financial expenses (27,391) (17,903)
Financial income 50,913 56,171
Foreign exchange gains and (losses) 177,251 (31,083)
Total financial income and expenses (24,535) (295,417)
BASIC EARNINGS PER SHARE
(Amounts in euros)6/30/2015 6/30/2014
Net income for the year (4,299,538) (3,409,652)
Weighted average number of shares in circulation 8,939,936 5,399,522
Basic earnings per share (€/share) (0.48) (0.63)
Diluted earnings per share (€/share) (0.48) (0.63)
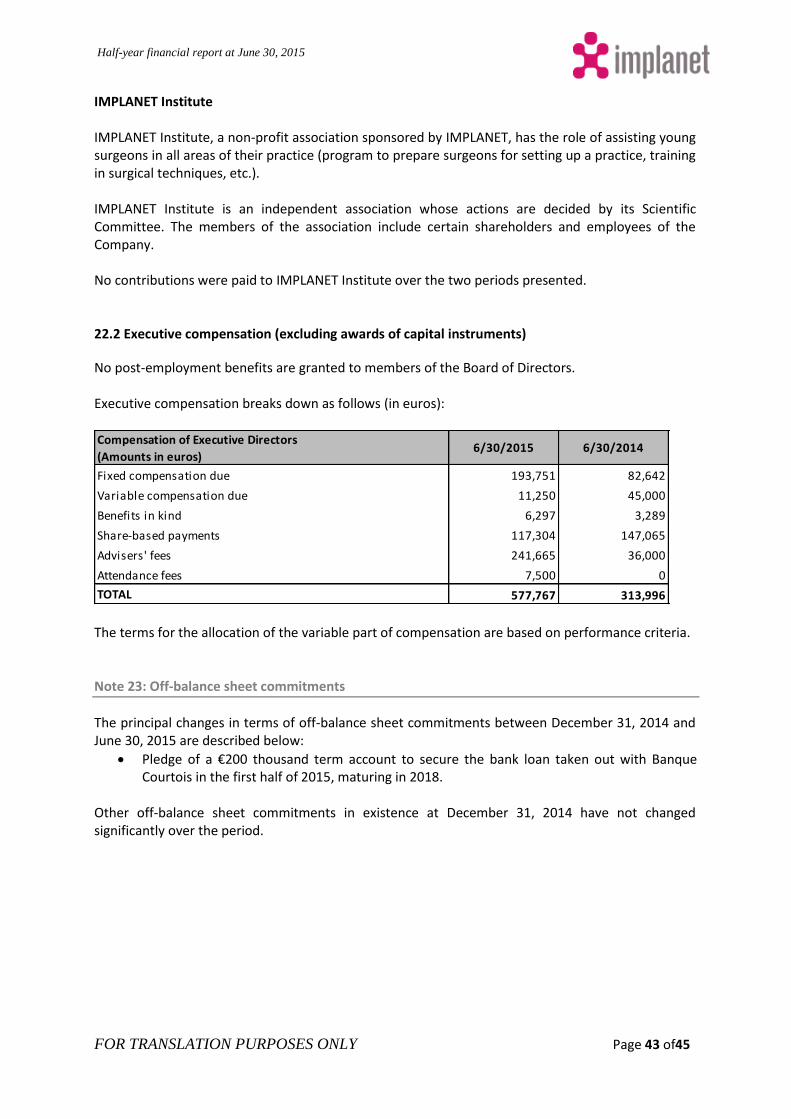
Half-year financial report at June 30, 2015
FOR TRANSLATION PURPOSES ONLY Page 43 of45
IMPLANET Institute IMPLANET Institute, a non-profit association sponsored by IMPLANET, has the role of assisting young surgeons in all areas of their practice (program to prepare surgeons for setting up a practice, training in surgical techniques, etc.). IMPLANET Institute is an independent association whose actions are decided by its Scientific Committee. The members of the association include certain shareholders and employees of the Company. No contributions were paid to IMPLANET Institute over the two periods presented. 22.2 Executive compensation (excluding awards of capital instruments)
No post-employment benefits are granted to members of the Board of Directors. Executive compensation breaks down as follows (in euros):
The terms for the allocation of the variable part of compensation are based on performance criteria. Note 23: Off-balance sheet commitments
The principal changes in terms of off-balance sheet commitments between December 31, 2014 and June 30, 2015 are described below:
Pledge of a €200 thousand term account to secure the bank loan taken out with Banque Courtois in the first half of 2015, maturing in 2018.
Other off-balance sheet commitments in existence at December 31, 2014 have not changed significantly over the period.
Compensation of Executive Directors
(Amounts in euros)6/30/2015 6/30/2014
Fixed compensation due 193,751 82,642
Variable compensation due 11,250 45,000
Benefits in kind 6,297 3,289
Share-based payments 117,304 147,065
Advisers' fees 241,665 36,000
Attendance fees 7,500 0
TOTAL 577,767 313,996
Half-year financial report at June 30, 2015
FOR TRANSLATION PURPOSES ONLY Page 44 of45
4. LIMITED AUDITORS' REPORT ON THE SUMMARY INTERIM
CONSOLIDATED FINANCIAL STATEMENTS PREPARED IN ACCORDANCE
WITH IFRS AS ADOPTED BY THE EU
“
INKIPIO AUDIT 19, rue des Tuiliers
69003 Lyon Simplified joint-stock company (SAS) with a
capital of €300,000
Statutory Auditors Member of the Lyon
regional company of auditors
ERNST & YOUNG Audit 1/2, place des Saisons
92400 Courbevoie - Paris-La Défense 1 Simplified joint-stock company (SAS) with variable
capital
Statutory Auditors Member of the Versailles
regional company of auditors
IMPLANET Period from January 1 to June 30, 2015
Statutory auditors' report on the interim financial information
To the shareholders,
In compliance with the assignment entrusted to us by your General Meetings of Shareholders and in application of Article L. 451-1-2 III of the French Monetary and Financial Code, we have carried out:
the limited examination of the summary interim consolidated financial statements of IMPLANET relating to the period from January 1 to June 30, 2015, as attached to the present report;
the verification of the information provided in the interim activity report.
These summary interim consolidated financial statements have been prepared under the responsibility of the Board of Directors. It is our responsibility, on the basis of our limited examination, to express our conclusion on these financial statements.
Half-year financial report at June 30, 2015
FOR TRANSLATION PURPOSES ONLY Page 45 of45
1. Conclusion on the financial statements
We conducted our limited examination in accordance with the professional standards applicable in France. A limited examination essentially consists of holding discussions with the members of the management responsible for the accounting and financial aspects and carrying out analytical procedures. This work is less extensive than that required for an audit carried out in accordance with the professional standards applicable in France. Consequently, the assurance that the financial statements, taken as a whole, do not include any significant anomalies obtained as part of a limited examination is a limited assurance, lower than that obtained as a result of an audit.
On the basis of our limited examination, we did not detect any significant anomalies which would be such as to call into question the compliance of the summary interim consolidated financial statements with IAS 34 – the IFRS referential relating to interim financial information as adopted in the European Union.
2. Specific verification
We also carried out the verification of the information provided in the interim activity report commenting on the summary interim consolidated financial statements covered by our limited examination.
We do not have any observations to make concerning their accuracy and their consistency with the summary interim consolidated financial statements.
Lyon and Paris-La Défense, September 15, 2015
The Statutory Auditors
INKIPIO AUDIT ERNST & YOUNG Audit
Clément Albrieux Franck Sebag Jean-Pierre Caton ”