Embed Size (px)
Citation preview

-~HAJlTEa3RESEAJ~CH fACILITIES
1
3 RESEARCH FACILITIES
31 GENERAL TECHNICAL INFORMATION
The characterisation of scientific and performance testing of the
processes concerned in a modern steam power plant in this case the
influence of coal quality on the optimum combustion air can be
divided into five levels
- Chemical and physical analysis
- Advanced analytical techniques
- Laboratory scale testing
- Pilot scale tests
- Full scale tests
Level 1 - Chemical and physical analysis
This category includes mass based proximate ultimate and CV analysis
of the coal on a gravimetric (mass) basis Ash fusion temperatures and
elemental (constituent) analysis are also included in level 1
Level 2 - Advanced analytical techniques
These analyses are mostly on a petrographical basis Petrography is
the study of the microscopic organic and inorganic constituents in
coal and the degree of metamorphosis to which they have been subjected
subsequent to their time of burial(l) The Lethabo coal analysis
according to this is approximately
3 - 1
Vitrinite - 175
Exinite - 25
Inertinite - 80
(Reactive macerals - 27)
It involves fields such as mineralogy and char microscopy Mineralogy
is the analysis of the crystal structure of the mineral components
(pyrite siderite SiO A1203 etc) Techniques such as FTIR and NMR
(see nomenclature) are also included here
Level 3 - Laboratory scale testing
This level includes combustion testing using the so-called hot stage
microscope heated grid and flat flame techniques thermogravimetric
analysis (TGA) where the mass loss is determined vs T or t which can
be performed in N2 to devolatalise or 02 to combust DSC RC DTF
methods (See nomenclature)
Moving from level 3 to 4 is the transition of microscopic to
macroscopic approach To obtain directly usable results to fulfil an
operational need the macroscopic approach (more specifically plant
performance techniques in the form of Process and Thermal Efficiency
Optimisation) is primarily required for this project This should also
serve as a link between the macroscopic and microscopic approaches
3 - 2
Level 4 - Pilot scale tests
These are mostly performed on dimensionally similar burners but are
unfortunately relatively expensive
LevelS - Full scale tests
These tests are performed on the actual plant and the tests of this
project fall into this category in the true sense of the macroscopic
approach
The geographical data for this test facility (Lethabo Power Station)
are the following
Longitude 270 58 34S (South)
Latitude 260 44 23S (East)
Altitude 14597 masl
Gravity 978665 ms- 2
For practical financial and strategic reasons unit 1 was selected
for this test The selection was dictated by factors such as the state
of plant and the availability of the units the Lethabo maintenance
outage program the ability to run at various loads with agreement
from National Control and measuring facilities that differ on the
various units The test results achieved with unit 1 were expected to
be the most representative since this unit is the oldest at Lethabo
with the most running hours most modifications implemented most
seasoned ball charges in the mills etc
3 - 3
----------------------------------------------------------------------
Table 31 UNIT ATTRIBUTES FOR TESTING PURPOSES
ASPECT UNIT 1 2 3 4 5 6
--------------------~-------------------------------------------------
Calibrated feed flow orifice plate installed x x
Machined ports to accommodate CO monitors x x x
Opacity monitor ports per casing x x
AHTR gas outlet sampling ports per casing x x x x
Coal feeder sampling ports x x x x
NOxS02 stack monitoring facility x x x
Burner pipe sampling ports x x
Balanced furnace characteristics x x x
Lean coal test performed x
Furnace characterisation test performed x
EID excess air tests performed x
Boiler guarantee efficiency test performed x
Air flow Optimisation tests performed x
Precipitator efficiency test performed x x x
Opacity Monitor correlation test performed x x x x x x
Plant constraints (such as the generator vibration problem that
plagued unit 1 and limited the load to 400 MW but which were cured
during March 1993) was the main reason why the previous air flow
optimisation tests had to be performed on unit 2 in September 1992
(Storm(2raquo) The unit preferred for testing then and now remains unit
3 - 4
1 It has the most measuring and testing equipment installed since
all other previous test work (Lean coal test(3) Guarantee efficiency
test(4) etc) was performed on it (see table 31) An interim
refurbishment (IR) was performed on unit 1 from the 18th February to
20th March 1994 During April 1994 optimisation activities on this
unit took place in preparation for the tests which were conducted from
the 2nd to 20th May 1994 These preparation activities will be
discussed in more detail in chapter 4
32 UNIT AND CYCLE DESCRIPTION
The Rankine cycle for the steam plant at Lethabo Power Station is
shown plotted on a T-s diagram in Figure 31 It is a sub-critical
laquo221 MFa Figure 31 no 3 - 4) super-heat (Figure 31 no 4 - 5)
reheat cycle (Figure 31 no 7 - 6) with extended regenerative feed
heating (Figure 31 no 10 11 amp 12) The HP (Figure 31 no 10) and
LP (Figure 31 no 12) feed heaters are surface heat exchangers
whilst contact feed heating is simultaneously done in a deaerator
(Figure 31 no 11) Sub-critical implies the presence of a steam
drum
Steam expansion occurs in one HP (Figure 31 no 5 - 7) one IP
(Figure 31 no 6 - 8) and two dual flow LP turbine cylinders (Figure
31 no 8 - 9)
3 - 5
Figure 3 1 RANKINE CYCLE ON T-s DIAGRAM
I I
I
3 - 6
The latter exhaust directly into two condensers in tandem (Figure 31
no 9 1) which operate at different temperatures due to the CW
supply (11 m3 s) flowing through them in a series arrangement
Feed pumping (plusmn 500 kgs) is in two stages (Figure 31 no 1 amp 2)
The first stage (condensate extraction pumps) takes suction from the
condenser hot well at an absolute pressure of plusmn 5 kPa and raises the
pressure to 800 kPa and a gravitational head of 33m The second
stage (20 MW steam turbine driven 100 main pump or two 50
electrically driven pumps) raises the pressure to overcome 64m of
gravitational head and associated pipe friction to produce a drum
pressure of 181 MFa
The upper temperature of the working fluid in both live and reheat
steam is controlled at 535degC at all loads whilst the average MCR
design temperature in the condensers is 35degC This renders the
Carnot efficiency for this plant as
TH - TL
nCarnot = TH
(535 + 273) - (35 + 273)
=
(535 + 273)
= 6188
3 - 7
This means that in the ideal case considering the working fluid only
at least 3812 of the heat must be rejected to the heat sink via the
condensers and cooling towers The design value of the turbine cycle
heat rate (heat sink losses included) is a minimum of 8125 kJkWh at
618 MW generated (100 MCR) (See Figure 32) This corresponds to a
maximum efficiency of 4431 for the energy conversion process in the
turbine cylinders The additional loss on the turbine plant due to
auxiliary power for example is another 274 which reduces the
useful total to 4157 The total boiler efficiency is approximately
89 which further reduces the overall value to 37 This is the
maximum possible cycle efficiency at optimum load
The heat rate calculated from the inverse of this efficiency (9730
kJkWh) is called the optimum sent out heat rate This is the minimum
possible heat rate that the units at Lethabo can achieve at 100 MCR
with specification coal to the boiler freshly soot-blown no ageing
or deposits on turbine blades etc In practice where the load factor
over a month would average 80 the coal quality is below
specification and other parameters are below ideal design optimum a
typical Lethabo unit would achieve an overall efficiency of 35
A typical Sankey diagram for Lethabo (Figure 33) shows the losses as
a percentage of primary energy input including the heat that is
3 - 8
Figure 32 TURBINE HEAT RATE
a Opound~ I tml ~poundAr itA rt ~ bullbullbullbull nvitIliO CtlRJI(crro HIiJT 1M
o o It CD
1 I I
o o
CD
o o n CD
~ shy
~ o o (I CD
~
shyshy
shy
I~ ~ r--shy
~ 0
-~ yen
0 0 0 co
shy _-fshy __
-i -J
II -x
0 0 al I
0 0 CD r-
JSO 400
sao ~so bull600 630
3 - 9
Figure 33 SANKEY DIAGRAM
Pow~r 351
Auxiliaries 11
1
Loss 651
E~hoU51 steam
541
rmiddot
middot1 Boiler loss ~--~~--~=---~
Turbine 1181
Boiler 1487
Fi~d woler 411 I
Air heoler T Energy
input ( fuel) 1001
3 - 10
recovered through regeneration (air and feed water heaters) the heat
wasted to the heat sink and the final useful electrical energy sent
out (to the national grid)
Concerning the overall efficiency of a unit (weighted average of
simultaneous boiler and turbine operation) the maximum is assumed to
be at 100 MCR This will be evaluated in this test under the
criterion of varying air flow and not varying design criteria
The point of maximum efficiency for the boiler would be most affected
by varying air flow and its influence on the load at which this
maximum efficiency occurs
33 TURBINE PLANT DESCRIPTION
The intention here is not to discuss the turbine plant in detail but
only those aspects that could influence the boiler and the unit as a
whole with changing air flow to the combustion process The fact that
some of these aspects did present themselves during the unit 2 tests
in 1992 (Storm(2raquo makes an overview of this section of plant
necessary Excess air reduction caused the reheat steam temperature
to decrease with a resulting decrease in final feed water temperature
at lower loads The influence of the turbine auxiliaries also proved
to have a significant impact on the optimum efficiency point relative
to combustion excess air quantity
3 - 11
The physical aspects of the layout and components of the turbine plant
were mentioned in section 32 Quantification thereof can be seen in
Figures 34 35 amp 36 These flow diagrams display the sequential
order of the working fluid through this part of the Rankine cycle
- turbine cylinders
- condensers
- LP feed heaters
- HP feed heaters
- deaerator
- feed pumping stages
The magnitude of the physical properties of pressure (bar)
temperature (oe) mass flow (kgs) and specific enthalpy (kJkg) are
also given between each process As mentioned the turbine cycle
achieves its maximum efficiency at 100 MeR as per design There are
some interesting aspects worthwhile mentioning since they can be
influenced by certain variables of these tests (varying combustion
air flow) and they can in turn impact on the boiler and overall
efficiency Emanating from experience in analysis and interpretation
of STEP as well as plant design factors note the following
The cycle is more efficient with the SFP and BFPT in service than
with the EFPs (see nomenclature) Depending on the load factor this
increase in efficiency can be up to 03 for the entire cycle
3 - 12
Figure 34 TURBINE CYCLE FLOW DIAGRAM - 100 LOAD
21202
tSl
10744 49220 bull If 3S82 30lt47
middot----2~J 3738S1CSSG ~ I ~-~-
11402 21ez 492~ 41 ~42
r--2103 3541 ~ L
1100 12so I -shy1114 I
492206
-------------~
lIAR QIO c
UIO 105
il
180 ~o
(I~
334 492~
CD I
1637
860 11137 ~7
1861
Ij 162 122
~rpZ
I ( bull Y ) ~~62473-+352~327 12
1~3
73
J[iF-~ ~II L~40
s Li-- r
3340I----J shy3103 7 b 401841 0
C
2831 3L4
313 1074
O4U 77
2814 1687
27430 20867
25111 2430lt4
-II
351
ItOI
34
114 86345
114c5 345H11
D 12114 ()2t7
IIAlI QIO C
IUlGlOis
3 - 13
Figure 35 TURBINE CYCLE fl()W DIAGRAM - 80 LOAD
Alt 3tSt raquolaquo ~--- A 2367 27121 10
C1[1 mri-I
So4 3342 _ a Hm
2363 21 2011 131
IlAlt 1110 (lItO C 10 S
3 - 14
Figure 36 TURBINE CYCLE FLOW DIAGRAM - 60 LOAD
1 2330 3044 bull --- 221amp 11181 14110 1~4
113$0 huo
Itle 33423 20114 CD4oea lOe2
2 12M ()~ I iIlf15
14~
1156 144t H860f
AO 6156 154t 2118601
1~31435 29860
OP446 1~ 3M I2Qt
1193 33lt123 -III
431 1
41t1 lOe21 Z11P 21
t79r un t20Zp 9372
bull 1)8314 214 1387 1131 r
1271 7 lOP 21425amp
(Y 2114 1244 291 2142~
lJko GIIoe lOS -
3 - 15
Of all the losses excluding overall governing factors such as
load factor there is not one that has such a significant impact on
cycle efficiency as condenser performance The cycle efficiency is
very sensitive to condenser vacuum (back pressure)
- Numerically smaller than the condenser loss but in the same order
of magnitude is the final feed water temperature This is a measure
of how effective the regenerative feed water system is and its effect
on cycle efficiency Important to note from Figures 34 35 and 36
is that while the target final feed water temperature decreases with
decreasing load the bled steam percentages of total steam flow
remains the same regardless of the load
The three above-mentioned aspects are important parameters where the
turbine can impact on thermal efficiency and boiler combustion For
example the boiler has to work harder for the same generator load if
the EFPs are in service instead of the SFP The test program had to
avoid random changes of auxiliary plant in service between different
tests since consistency should prevail Also from previous test
experience it is important to note the amount of CW pumps in service
as well as their configuration in terms of electrical power supply
This can impact greatly on efficiency via condenser vacuum and
auxiliary power consumption since only certain cw pumps are supplied
with power from unit 1 electrical boards
3 - 16
34 BOILER PLANT DESCRIPIION
341 BOILER AND STEAM GENERATION
As mentioned the Lethabo boiler is a sub-critical water-tube
evaporator accommodating a steam drum (Figures 37 amp 38) On exiting
the main feed pump at 22 MPa 141degC HP feed heaters raise the
temperature to 247degC and the working fluid is further pre-heated in
an economiser to 305degC before entering the steam drum at 181 MPa
357degC Natural circulation occurs due to density difference in the
latent evaporation process via down-comers and side-wall manifolds
headers risers and vestibule tubes
There is no central dividing wall in the combustion chamber Liquid
and vapour separation takes place in the steam drum whereafter the
working fluid passes on to the super-heating elements
The flow path of super-heating commences with the primary supershy
heaters to 475degC in the rear gas pass (Figure 311) The steam then
reaches 500 degC through the platen super-heater panels situated
directly above the furnace where it is exposed to the highest flue
gas temperatures Figure 39 shows the maze of pipe work of
super-heating Two aspects are worthwhile noticing here
Steam super-heating takes place in four banks from left to right
namely A B C and D when the boiler is viewed from the front
3 - 17
Figure 37 WATER FLOW TIiROtXiH BOILER
SECONOARY S TEAW __---7-----SATURATEO STEAW TO SUPERHEATERSCRUBBER
PRI RY STEAII SCRUIIBER
REAR SUPPORT WALL OUTLET HEAllE
ECONol SER OUTlE T HEAOER
JII FEEO PIPES
FROIIT ALL I OUTLET HEACER VESTIBULE OuTLET
REAR SUPPORT SCREENd All
VES T I BULE CAGE ENCLOSURE FURIIACE
INTEREO lATE OOWNCOgRS HEAOER
ECONQIIISER TOP aNK
ECONQIIISER BOTTO _ BANK
HEACER
FEEO CHECK VAL VESlOE WALL INLE T HEACER
FROIIT WALL INLET HElOERS RUR WALL IIILET gtlEAOERS
3 - 18
Figure 38 SECTIONAL VI~ OF STEAM DRUM
3 - 19
Figure 39 BOILER STEAM SIDE SUPER HEAT FLOW DIAGRAM
eol~ER RICIIT 110 I~ER unMAte) SIDpound
MAIC) SIOpound
Ir STACpound IIfTt1l1[RA roRS
TO STtAW SAYLINO COOlERS
3 - 20
The pipe work between these banks perform cross-over traversing
between primary final or secondary and platen super-heaters in order
to eliminate any unbalance in the furnace and flue gas temperatures
The first stage attemperating or spray water is added before entrance
to the platen super-heaters Four attemperation stations capable of 15
kgs each are controlled by the platen super-heaters outlet
temperature The steam then enters the secondary or final
super-heaters also with four attemperation stations of 4 kgs
capacity each and controlled by the final boiler live steam outlet
temperature of 540degC There is a 5 degC temperature loss to the
turbine where the required design inlet conditions are 161 MPa 535
degC After the HP turbine the steam returns to the boiler (41 MPa
332degC) as cold reheat for reheating The primary reheater raises the
temperature to 460degC and is situated in the rear gas pass The final
reheater is situated just behind the final super-heater in the front
gas pass A cross-over arrangement of pipe work between the four
banks similar to the superheater also exists between reheater pipe
work (Figure 310) The reheater has four attemperation stations
capable of 11 kgs each controlling the final reheater steam
temperature to 540degC The required hot reheat steam design conditions
of 535 degC and 38 ~Wa then result at the IP turbine inlet
3 - 21
Figure 310 BOILER STEAM SIDE REHEAT FLOW DIAGRAM
c ~ laquoaj g ~t lI laquo
s e ~1 ~
iii n l u
laquo
-1 ~Sold la g ~II1
~ I
fV ~- ~
81~i - shyoj 2_ S i ic ~ w
~w ~ ~ m 15 e ~
i~ ~ i ii Ii i ~ I Ii f f
i
~j
3 - 22
342 FURNACE AND COMBUSTION
The furnace is constructed such that the combustion process provides
heat to the evaporation process primarily in the radiant mode (Figure
311) Combustion temperatures are between 1200 degC and 1400 degC The
platen super-heaters also receive some radiant heat but thereafter
the heat transfer occurs mostly via convection with conduction once
the heat reaches the metal of the tubes The front and rear gas passes
are constructed in such a way that the heat transfer between flue gas
and steam occurs in the counter flow arrangement
After passing over the furnace platen final super-heater and final
reheater tubes the gas (plusmn 700 kgs) has cooled down to plusmn 600degC It
then passes through the rear gas pass in a downward direction through
the primary super-heater primary reheater and economiser to exit at
a temperature of plusmn 320degC The maximum gas velocity of plusmn 10 ms
occurs at the top of the front gas pass before entering the rear gas
pass Depending on the load an air molecule or pf particle takes 7
to 12 seconds to travel between burner and economiser exit
Downstream of the economiser the gas duct splits into two
The gas in each of these ducts then passes through a primary and
a secondary air heater in parallel to cool down to plusmn 130degC
Thereafter each duct splits into two to enter the four electrostatic
precipitator casings After passing through the precipitator where
more than 999 of the fly ash is removed the four ducts join into
3 - 23
Figure 3 11 DIAGRAMMATIC FURNACE ARRANQE1fENT
TO TOP SUSPENSION STEEL WORK r-----------------~~----------------~
fiNAl SIHR PLATEN SUPEAHtA TER OUTLET AN I fClOS
735 In
713 M
SECONOAfIY AEHtA TER
~E ESTIBULE I OOWNCOIl1ER --
I FRONT VESTU8LE
PRIMARY REHEATER
PLATEN SIHR L--+O--- ~C~~~~cig~~~~
A==iEiitiQ==IiiI~3 PRIARY AHTAFINAL SHTA ~=~~~~-1 INLET MANlfOLO~
i middot1 __ 1---- ECONOMISEA~ FUANACE FRONT WAlL I JI TOP BANItIlT_ L~lill BOTTOM BANK
WlN080X
ExIT SCAEEN -
FUANACE CACE ENCLOSURE HOPPEA GAS OUTLET fLUE
ENVELOPE
Ih-bull~---FURNCE REAR WALL
100 m ~--aUANER THROAT
fURNACE HOPPER ~ --+ 5-~ ~ ~ FRONT HOPPER OEAO SPACE ~ C~-HOPPER SUPPORT FRAII1E-plusmn )middot~URNACE LL INLET HEAOERS
ASH HOPPE~~ = 00 In BASEMENT OA Tuw iLllmiddot
3 - 24
two separate ducts where two ID fans (plusmn 35 MW each) take suction to
propel the gas to atmosphere via one flue that passes up the
multi-flue chimney stack (275 m high)
Two FD fans situated at ground level take suction inside the boiler
house at 73m level to utilise the radiant heat loss from the boiler
and furnace (Figure 312) where the ambient temperature ranges from
25degC (winter) to 40 degC (summer) The capital outlay of this
arrangement extra ducting for example is overridden by the gain in
efficiency and air heater protection It can be detrimental to metal
surfaces if the cold air side temperature of the air heater is not
kept above dew point since sulphuric and other acids in the flue gas
originating from the combustion process are extremely corrosive The
aerofoils measuring total air (sample calculation 2) are situated in
the FD fan intake ducts at 41m level
The air then passes through the secondary air heaters where its
temperature is raised to approximately 260degC before entering the
furnace via the burner The secondary air flow control to the furnace
is through thirty six SA aerofoils and dampers (one per burner) The
total arrangement of SA flow can be seen in Figure 312
Two smaller primary air fans take suction in parallel with and from
the same duct as the FD fans and supplies the mills via the primary
air heaters with air at a temperature of 260degC (Figure 313)
3 - 25
Figure 312 SECONDARY AIR FLOW DIAGRAM
r-----------shy I I I I
~~
~
f 0 I1~ 0 11
i 0 i-tID G
15 shy t
i -~ 0 CI
~
0
5 l l~O1
) (
f I
i
I~ t--+--+-- ~----____~~~------__-J
I ~_
-~
~
~ ~
~ ~
~
bull =
A
~
~ 1
------ ------1
I
I
~~
i 1 ~
II I i ~A
I bull
OJ
o w
J
~
o
3 - 26
Figure 313 PRIMARY AIR FLOW DIAGRAM
)(--_ _--__- rmiddotL I ~bullbull__J
Gd~
) (
t -
u j I
bull ~ J
~
0
u 0
middot0
0
0
a
J
0
a
a
0
0
-owbull ItJlWIII
M)IIrU~middot Itbull Vt
wo ctIIOU shy
000
o 0 0
u u
000
0
0
0
0
0
0
000
o 0 0
i
3 - 27
To prevent a fire from developing in the mills due to excessively hot
primary air an attemperating facility is provided to cool the air
entering the mill wi th air bypassing the PAlITR To prevent the
leakage of pf from the pressurised mill a seal air system powered by
seal air fans discharging at a pressure greater than that of the PA
fans seals off the trunnions and volumetric feeders The latter and
the entire interrelated PA system can be seen in Figure 313
Each boiler has six mills Full load can be maintained with five while
the remaining is on stand-by or available for maintenance The mi lIs
are situated on ground level and supply the furnace with PA and pf via
burner pipes in an arrangement as in Figure 314 and 315 Each mill
has two bunkers each fitted with a volumetric coal feeder The coal
and PA to each mill is thus supplied in dual flow mode and the
resulting PApf mixture also leaves the mill in dual flow via two
classifiers The classifier (Figure 316) is a constant efficiency
device that segregates the percentage of oversize coarse material from
the mixture and recirculates it back to the mill The temperature of
the PApf mixture leaving the classifier reduces to 80degC due to the
sensible heat absorbed by the coal and latent heat needed to evaporate
the inherent and surface moisture during the grinding process
The mills are of the tubular type each driven by a 1600 kW electric
motor Each mill contains 98 tons of grinding media which consists of
50 mm diameter steel balls having 12 Cr This type of mill absorbs
3 - 28
Figure 314 MILL AND BURNER PIPE ARRANGEMENT
3 - 29
Figure 315 MILLI~ PLANT ARRANGEMENT
~f------foll
1----4--411
i I
3 - 30
i
Figure 316 MILL CLASSIFIER
PFOUT
------- t
10
~lNVERTED CONTROL CO
-__-v-__-1
PF IN
3 - 31
virtually constant motor power once the charge has been established
irrespective of load and throughput (plusmn80 tonshour coal flow mill)
The mill is a very important component in combustion testing If the
trunnion division plates (dividing the incoming PA and coal from the
outgoing PApf) are damaged or are not in the required symmetrical
position the combustion conditions within the furnace can become
unbalanced Similarly if the mill controls are not functioning
correctly this can render it impossible for the boiler to stabilise
and to produce the required test conditions The procedure to
calibrate the mill so that its physical properties such as the mass of
the ball charge and the required amount of coal fed into the mill at a
particular time correspond to the required power and feeder control
set points is called a stripping and filling peak procedure
This procedure must be performed at regular intervals since the ball
charge wears away and the make-up must be determined This procedure
will be discussed in chapter 4
Each end of the mill supplies three burner pipes via the classifiers
and each enters the furnace through a burner (Figure 317) Thus
each mill supplies a row of six burners while each boiler has thirty
six burners 18 in each of the opposing front and rear furnace walls
The oil lance for starting a mill is in the centre of the burner
while the PApf tube and SA are located concentrically around it
3 - 32
Figure 3 17 PF BURNER
3 - 33
The burner is one of the most important components in this test
project since a heat-distorted or otherwise damaged burner can produce
an abnormal amount of CO due to incomplete combustion Incorrectly
and inconsistently set burner swirl generators can cause the same
Unbalanced combustion conditions makes testing conditions more
difficult
The tubular primary and regenerative secondary air heaters are also
very important components of plant They impact significantly on
efficiency and also have a great effect on the rate of ignition since
the increase in ignition temperature has an exponential growth with
distance from the burner If the temperature is too low ignition and
combustion can be prolonged to such an extent that an increase in
temperature of the super-heater metal elements occur
The secondary air heaters are of the rotating type Lungstr8m design
utilising rotating element packs and weigh 140 tons apiece (Figure
318) The relative movement due to rotation makes the use of axial
tangential and radial seals necessary (Figure 319) Axial seals
prevent air to gas leakage and are automatically controlled by
actuator motors sensing and correcting the gap distance Tangential
seals prevent gas to gas and air to air leakage They have a fixed
cold setting and have no sensors and actuators Radial seals also
limit air to gas leakage and are controlled by gap sensors These
are the most important seals since most leakage occurs via them
3 - 34
Figure 3 18 SECONDARY AIR HEATER
3 - 35
Figure 319 SECONDARY AIR HEATER SEALS
3 - 36
The primary air heaters are of the tubular type operating in counter
flow heat exchange mode There are two passes of gas flow and four
passes of air cross flow (Figure 320) Leakage can also occur from
air to gas in the PAHTR if tubes carrying the gas come adrift from
the tube end plates In the event of these air heaters being
deficient eg blocked with ash or excessive leakage reduced thermal
efficiency and delayed ignition and combustion will result In
addition a false impression of favourable dry flue gas loss is
created The latter is very important to this type of testing since it
played a significant role in the EID tests(S) mentioned previously
It is to eliminate this defect and to correct the leakage dilution on
the dry flue gas temperature (see sample calculation 3) that the
measuring of oxygen before as well as after the air heater was
introduced in this project
The boiler soot blowers merit mentioning since they influence boiler
efficiency A dirty furnace and associated heat transfer elements
will have a negative effect on the rate of heat transfer resulting in
an increase in dry flue gas loss Heat input into different sections
of the boiler will also be affected
A Lethabo boiler has a total of 128 soot blowers (see Figure 321)
They consist of four secondary air heater blowers thirty two furnace
wall blowers of the short stroke fixed rotating type whereas all
other blowers are of the retracting long lance type twenty four for
3 - 37
Figure 320 PRIMARY AIR HEATER
FlJIINACE EXHAUST CAS IIlET
o PIG RODS
FUIlNACE EXHAUST
ARY AIR O CAS OUTUTTO IUS
EXPANSION JOINT
_ SEC TlON
Ie-LEVEL ________lt4
t AIR FAIOY PA FtHS
3 - 38
Figure 321 SCOT BLOWER LOCATION DIAGRAM
69HO m 32 1331
6598 m ___ 65787 1ft
6283A m
5912 1ft 59078 1ft
S800a m
55S22 1ft
53000 1ft - shy 28 1291 bull30 0 I 1 51150 m
II 809 1ft
5lAO mshy__
17 to 21
BOILER FRONT -
0 22 231
0 2 1251
0 21gt 271
lZ
_1890 m 12 to IIgt
a 91 bullbullbull 930 1ft
3905 m
I to 5 0
o (71 0
8 (9) 10 0 I 1
NOTE BRACKE TEO NUIoElERS ARE OUTED ON L SlOE Of BOIIER
3 - 39
the platen super heater eight final super-heater and eight reheater
blowers in the front gas pass The remaining fifty two blowers are
situated in the rear gas pass and serve the primary super-heater
primary reheater and economiser
At Lethabo many arguments evolved around the influence of soot blowing
on boiler efficiency super-heater metal temperature excursions and
plant deficiencies and several enhancement programs were conducted
Secondary air heater blockages for example were shown to be caused by
the malfunctioning of the air heater soot blowers depositing moisture
into the packs and clogging the ash(6) rather than large ash particles
termed popcorn ash A furnace wall blower test was also carried out
to prove the importance of adequate soot blowing of the furnace and
its effect on efficiency(7) and a revised operating procedure was
implemented
35 CONfROL SYSTEM
The control system that governs the operation and reaction of the
boiler and turbine is complicated and a detailed explanation thereof
would contribute to confusion and overshadow the important issues
Only the more applicable aspects that interface with the philosophy
of this project will therefore be explained The unit and turbine
controls will not be treated in detail but only some of the boiler
controls particularly those related to combustion
3 - 40
The boiler and turbine unit is normally operated in the Automatic
Generation Control (AGe) mode This enables National Control to
regulate the output of the unit (turbine and boiler simultaneously)
according to load and frequency demands termed frequency bias control
This is done by a computerised loading device referred to as ENCOR
(see nomenclature) The unit process control provides capability for
Boiler follow and Turbine follow modes The first is where the boiler
reacts to turbine load and the latter is where the turbine only
generates what the boiler is capable of at that point in time
Variance in generator output is carried out by means of a turbine Load
Controller and the corresponding boiler reaction is obtained with the
Pressure Controller The latter operates via a control circuit
referred to as the Initial Pressure Set point Formation (Figure 322)
According to input signals such as the Unit Load Set point the
resulting calculated signals are sent to the Boiler Master controller
(Figure 323) which controls the boiler The specific control setup
for testing will be explained in more detail in Chapter 5
A suitable manner to explain the functioning of the control system is
to describe the reaction of the applicable components when a load
change occurs As a point of departure assume the unit is running at
steady load There are no variables on the set points of load
pressures number of mills in service or fuel oil burner support etc
Assuming that an increase in load (ie power demand) occurs the
response of the control system in cascading mode will be as follows
3 - 41
1-1
IURB
lt9 __J1 IGf~ SIIPRJlOfD
ltgt
C 8 z
IARGpoundl PRESS r---
iB--o-JmiddotI h
L__-+-_ I
iHAOlCood I I I
w RAoor~Ol Il __ _-_ fiRE IN SHAM flOW UiIlRY run NAH
n --- IIHOIU101 ~U06 _liP BYASS
~ 1I0r 1l0~EON ~ ttRAOQPOOI lUAl PR[SSURE
t 8=---- FIRF ~U06III SfU IlM01UIOIt _ - __ L FUIIU f
I _ rARtiEr P~ESS SETBgt0lllf soro_ _ _ __ I I ~EI(II[J
KAooOno I I I ~E lWOR~ fOR OHUUPlIHG Of 1Ht I ut $TEAIi PatSSURpound (OIHROlltRI
fROIi TNf me foliwAqoI CDI1MJNO UIIOR COISIDpoundR41IOHt Of n( OYUAMIC RfACTlONS DORIHG LOAD (lIAIIGES511 SlN IUIP
SClP fOAHAIlON NW~O(OOI
_------- l1 shy~ CDlip 15 bar
W
N N
Z f
Ii1I301Q1J-~ Apl0 bor PllfSSURC SElP ~ J enro HPSYPASS
(01 TROl R41O(099 ~
~ ~ ~
I 2l rtJ
I ~ bull I I liP BYPASS bull ClOSEn ~ I
rURS FOLlOW
~~ fXI-ItgtI~~flAOO( IO- ~ 6------ f- SOIlFR__~=-___-JI-______ 10 ~~l~~~O
L-_____ L------~-----------------~JL~r~~r dI MOlC~1
__
I
CAPA81L1TY LIMITATION
I
--______ ftJ ft--_HP ampYPAi~r shy 00019 1J---~ NOT CL05EJl I __IURDa fOllOWt--l r
- amp I - I
I I( III 0
I I B-1 I C I RP01UOO1 IlPOlUmI LCV o~~IIR~~ IIP HEAfT~~RVICE I I __ ~ OUT 0 x
I I ~_ on I I Lo ---T__ mJtshy -t ON 1141i1lAl ___ IIIJII _+_J
-- -l_____ I
T
I I Bijffl I
I I II
~--1-----H-___JI
CIIlF09980lUR H4SfER
~ (APAS LIMIT 1 NAOOClOO
(V CONT~Ol TO P4 flOW CONTROL
NM 10COOl
NII20(OlS
NII30COIS
I ~N40COIS
Nil 5O(01S
21 ~t~~~~O~ONTROL [FUEl OElWIOmiddot 1 FUEll Hlll0(OOI
FUEL OEl-IANO NII10COOl
rJ ~ I-j (1)
W
tv W
~
~
~ ~ ~ o
~
W
jl W
poundQll
NlllOCOOl
IlAOOCIOO UNIT ~ETPOINT fROM UIlIT (OORDIN
~ CD MAOleoo fRO PRESS SUP FORMAT
--+----T -Ic
I
[iT- __
~ CD
G)
reg
fAST
I
IFOLLOW
J
I
IIII JygtJ IL L _______ _I I I -- shy-- ----shy
[ ~AOlCOOll
The turbine and generator controls will cause the steam governor
valves to open further via the speed governor and frequency bias set
point This is to admit more steam to the turbine to provide the
increased power required while the terminal voltage is kept constant
by means of the AVR As a result of this there will be a drop in
steam pressure in the main steam pipes supplying the high pressure
(HP) turbine
The boiler is normally controlled on the Constant Pressure principle
(The other controlling principle is the Sliding Pressure principle
which implies that the governor valves are further open and the
quantity of steam flow is controlled more by the feed pumps via the
boi ler )
On the Lethabo boilers the Pressure Controller will detect any change
or pressure drop and the Boiler Master Controller will instruct the
feed pumps to increase the feed water flow to the boiler via the
Master Feed signal This is to enable more steam supply to the
turbine The drum level detect ion will trim or fine tune this
signal Simultaneously the Boiler Master Controller will instruct the
Master Firing control to increase the boilers firing rate (to enable
the additional feed water to be turned into steam and to overcome the
pressure drop that existed in the first place) The major signal
through which the Boiler Master achieves an increase in firing rate is
an increase in PA flow to the mills
3 - 44
Figure 323 shows the Boiler Master Controller input signals Point
(Pt) 1 is the pressure set point input This pressure of 161 MFa is
the target that the controller strives to maintain Pt 2 is the unit
load co-ordinator set point Pt 3 is the fuel oil (if any) to be
subtracted from the coal supply Pt 4 is the deviation between the
actual pressure and set pressure This is the signal that activates
the multipliers at the CV correction (Pt 5) to send the fuel demand
signal to the PA flow signal Pt 6 Note that the settings at the CV
correction (Pt 5) are fixed set points This means that the value is
set for the power stations average or expected CV and is not a
variable that can change with varying CV or be changed by the operator
at will
The increasing PA flow through the mill will sweep more pf to the
burners thus supplying the additional fuel demand to the furnace The
decreasing level of coal charge in the mill will result in a
measurably increasing power requirement to turn the tube mill This
will be sensed by the Power Sonic mill controller and the coal feeder
will be instructed to increase the coal flow into the mill
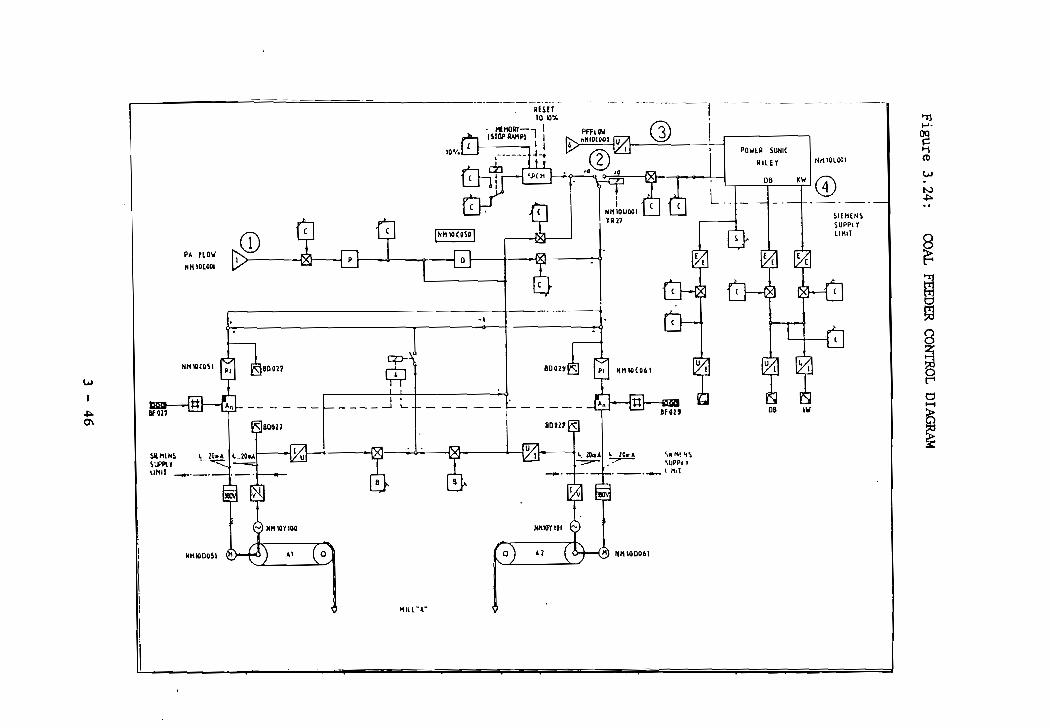
In Figure 324 it can be seen that the PA flow initially activates
the feeder (Pt 1) After the 27th step in the sub group control a
release will be given for the switch at Pt 2 to change the signal
to that coming from the Power Sonic controller at Pt 4 The input
signals for the power sonic control is primarily the power for the
3 - 45
-----1--- shy
(] Ij ~
10 POlf~ SONIC I-i RILEY I il0LOOI (l)
W ~8 K~I
N ~
5IfifN~ SUPPl Y lIlIl
PA flOIi ~ HIIIO[OIlI
- ~ 8
cp-
W 8DOl~ ~ W t
t)I I bull ____ -J L 1-011 w
~ efOI1 0 ~
~ 4 M~ ~~5IllhS ltUPPI Y
WIlT __ bull __bull trt- 11111 S~l
NHIOOOSI o o
lLL-
mill motor and the sonic verifying signal The pf signal at Pt 3 is
only a feed forward signal when a load change occurs It can be seen
as an input for the kW and decibel (db) set point Thereafter it is
again the power (kW) and decibel signals from the mill that activate
the controlling The transducers and electronic control cards of the
Power Sonic control are tuned to behave according to a prescribed Mill
Load line Figure 325
To render the mill more versatile a mill PA flow bypass damper is
built into the inletoutlet throat of the mill trunnion If the PApf
burner pipes are designed with large enough diameter so as not to
throttle the maximum required flow the diameter will be too large for
minimum required flow and pf settling will occur in these pipes To
overcome this problem a bypass damper is built in to ensure minimum
velocity at all times preventing these pipes being clogged with pf
This can be seen in Figure 326 (Pt 1) What is of importance here is
that the total amount of air approaching the mill (as measured by the
PA aerofoil and controlled by the rating damper shown in Figure 327
Pt 1) is referred to as PA The accompanying signal in the control
system is also referred to as the PA signal After the bypass air is
subtracted the remaining air passing through the mill is referred to
as a pf signal This is because this balance of air is proportional to
the flow of pf due to it being swept up by this air
3 - 47
Figure 325 MILL LOAD LINE
PAFlOW
Iltgsec
3010 20
COAL FEEDER uUTPUT Y
3 - 48
Figure 326 MIll BYPASS FIJ)W CONTROL DIAGRAM
x~
--IF I r I
I I
z I I I~ ~ l- I
I~ I I
I r
1 I
I~ I
~ I I
I
3
IS II I
~I~ Ii I~ I
la I I
rI~ I
C I IIE I
I I I ~ I
I I
~ I - I I I II I IL ___Iii I
I~ I __J ~ I
I IA Si I z x I
I~ I
~ I I r
IDea
3 - 49
Tj PA (ONTROl ON AUlIl
~ 1 tDd Ill I 1IH10
I HHIQ(OOIllf fUN ~
I N A D ~AQ1ltGQ1 --lI it
W
i 1 - ruCOWTiI
I A TO FOil MANIAl
3 c 0 [ F A 10 I I I I
b I
~ I HIll
_____~llOAgc ~ w ~
~ ~----- NAOOC100 lJl o o I
iW-~ HIU BONL---- lQAG ~II rRn
t 1 ---shyI ____J
J - -shy
I Imiddot
J (II Sa--- mVRl6-- bull ~I itiitLDIII I gt111~(11)~ I I Q OOIrtlgt1b DOWN ---------middot-I~F=_lJ YO
L~--==1I II Id Ta ur nw bull
HK lOCOSO~lOf114s
~IW ~reg regK20(OSO
HAOZCOQI
From Figure 327 some very important conclusions can be made The
control diagram shows the input requirement from the boiler master
(Pt 5) The PA flow signal measured at the PA aerofoil and regulated
by the rating damper at Pt 1 undergoes a temperature compensation at
Pt 2 and a square root extraction at Pt 3 (to produce a flow from a
differential pressure)
The bypass air is subtracted at Pt 4 to produce the pf signal as
previously explained at Pt 6 (PA minus bypass air) This signal
which is proportional to the fuel flow (Pt 6) goes to the coal
feeders at Pt 8 and the bypass damper controller at Pt 10 The
feedback pf flow signal at Pt 11 and the forced draught (FD) fan
controller which is total SA (Pt 9) receives its signal from Pt
7 which is the full PA flow without the bypass air subtracted (Note
PA + SA = total air) The result can be seen in Figure 328 In
short the PA flow in Figure 328 is the PA with the bypass air
subtracted ie actually the pf signal in order to vary the secondary
air (SA) which is plusmn 75 of the total air with the amount of fuel
for more constant airfuel (AF) ratio
All the above explanations indicate how the controls react when the
load increases The result was the PA and the SA increasing
proportionally with the pf signal ie the total air increasing (see
Figure 329) If the cvof the coal were to decrease the result
3 - 51
Figure 328 PA SA FLOW RELATIONSHIP
20B~ H~~
20
SECONDARY AIR FLOW Kgsec
3 - 52
--
RA 110 fUElltOHIUIR
INCAEHINll Clf EX(SS AlA Xl------------u WITH UlAD REOlllHG r-----------------A5 (X(SS AlA ----------- H SECONDARY ~
----------- A) AIR flOW CD-r--L r--------- A 2
~
I I --------11 W I I
I I tv 6sectY 10 bull LOAO 10
1110(001 ~ IPA FLO
~ A1 ~ ElUS
AlA ~ C
W IlIS20COU lOon
THE AIM SWIT(HINII IS CONNECTEDNS~C6U
BFDU IN PARAllEl THE flFOAE SWITLHIH6IJJ Inl-lilSfin W I11514(041 DNl Of THE AIM IoWIf(HES THE OTHER ~
lOOP SWITCHES SIIIUlTAIIEOU$II NS50( 041 11
I IMS6C [011
Rio TlNIL rl IlAIIPpoundR DII~ HANUIIL
11-1 ~-1-L-t--I At
~ I 11
9gt---------- ~SECOIIOARI NH10COOl SEC AIR A4 AIR flDll
~TOBURKf 3 rshy~~ ~~ ~A lOgO Q Q _ ~ ~ r - -shyz~z zz z bull U --------------- ----~
bullbullnOCDY bull IiSIII [0108
would again be increased total air This is because more coal would
be necessary for the same heat due to its lower CV increased PA flow
would be necessary to sweep it up and convey it to the burners and
the resulting SA and then total air would also increase
36 INSTRUMENTATION AND MONITORING EQUIPMENT
The main equipment monitoring the unit and from which the majority of
data will be accumulated is the plant computer the SICOMP 70 This
computer provides information for the process control system which
also controls the unit automatically It has a facility whereby a
group log can be compiled to have readings of the selected parameters
measured logged and printed at a preset frequency Hourly every
couple of minutes or even seconds can be chosen as frequency while a
snap shot or instantaneous facility is also available
There are however certain parameters that cannot be measured by the
SICOMP since no measuring points exist or certain parameters which
have to be measured more accurately The SICOMP relies on transducers
and frequent recalibration is therefore necessary Its accuracy is
also influenced by factors such as cold junctions and lead
compensation Plant performance testing also requires a degree of
accuracy such that standard instrumentation is not necessarily
adequate or the readings achieved may not be representative due to
the geometry of the installation
3 - 54
The SICOMP 70 is however very useful for trending and for providing
backup readings Due to the reasons mentioned above the following
are the important additional monitoring equipment which will provide
more accurate measurement of parameters than would be possible by
relying on the plant computer data alone or which cannot be measured
by the SICOMP 70 at all
The ESKOM TRI mobile caravan This facility which is equipped
specifically for the purpose of back-end exhaust gas analysis was
used to measure the following parameters very accurately
- 02 (percentage)
- NOx (ppm)
- S02 (ppm)
C02 (percentage)
- CO (ppm)
Codel CO monitors Concerning gas analysis there is one aspect
besides the accuracy of 02 that is considered so important regarding
safety that a backup instrument is necessary This is the CO content
of the gas at the 10 fan outlet Two CO monitors one per outlet
duct were employed in addition to the mobile caravan facility Where
the caravans CO monitoring operates on the extraction sample
principle whereby the sample is passed over a reactivity cell these
monitors are of the infra red cross-duct scanner type They have
3 - 55
proved to be very reliable sensitive and accurate in the past
Pitot - static tube This basic flow measurement device is very
accurate if used correctly It is normally used in conjunction with
an accurate manometer to measure a differential pressure to obtain a
velocity from the dynamic pressure Pdyn = Pstag Pstat) and
finally a flow Pi tot - static tubes were used to determine the main
gas velocity stream in order to obtain representative measuring points
on the four air heater outlet ducts (Appendix B) It was also used to
determine air in-leakage into the furnace via the mill seal air fan
suction ducts during testing (chapter 5)
The Economiser outlet sampling Matrix Two very important
parameters that need to be sampled very accurately and especially
very representatively is the oxygen and fly ash content of the flue
gas at the economiser outlet before the air heaters The percentage
oxygen here is also a legal requirement as stated in the Pf code of
practice(8) The standard oxygen measuring equipment supplied with
the boiler consists of a single 20mm diameter extraction pipe on the
upper side of each of the two rectangular ducts measuring 5 x 11m
This was considered inadequate and inaccurate Consequently a 16
probe sampling matrix was designed and installed at Lethabo Power
station (Figure 330) whereby the sampling of fly ash and oxygen
content was carried out isokenetically much more representatively
and continuously
3 - 56
Figure 330 FLUE GAS AND FLY ASH SAMPLING MATRIX
o III
===~~--==-- I
o III
-I
3 - 57
The OTOX 91 Portable Oxygen Analyser This is a small compact
portable instrument which has proved to be very reliable and accurate
It is also easily calibrated with test gas (3 oxygen) in its
operating range of 0 35 oxygen by volume It was used to obtain
correction factors for the economiser outlet oxygen on a daily basis
as well as to measure the air heater outlet oxygen content on a
continuous basis during testing
Digital read-out Thermocouples These pre-calibrated portable
instruments were used to measure the flue gas temperature at
predetermined representative points of the air heater outlet ducts
Digital display Vane Anemometer These pre-calibrated
instruments with correction figure graphs were used to measure the
air in-leakage into the furnace via the burner core air tubes during
testing
WetbulbDrybulb Thermometers These instruments were used to
measure the air intake temperatures into the furnace and to calculate
the relative humidity of the combustion air
Dual Limb Incline Manometers The total air flow was
calculated from basic principles and differential pressure
measurements taken with this manometer installation connected
to the total air measuring aerofoils (Figure 331) Compensation for
3 - 58
Figure 331 CROSS-SECTION OF MEASURING AEROFOIL
~ ~ ~
ltreg lt ~ J(Xh 150 r I nlaquo ~ oGtSSET
0 o
ltI
(I ) 8 cn Q
~
Q
pogt
-L I
g-OOx00lt8
q
5 iHK EJlO LAn Igt
Q 0
Q
SECTlCNAL ELEVATION V-V ~ CUT-Our IN ENO ATE
3 - 59
temperature relative humidity and Cd factor was done as explained in
sample calculation 2 Appendix A
Isokinetic Pulverised Fuel Sampler Isokinetic sampling is
achieved when the sampling velocity within the nozzle is equal to the
velocity in the immediate vicinity of the nozzle This is of
utmost importance for accurate evaluation of mill performance This
sampler and procedure (Appendix J) was used to sample the pf of a
representative mill on each test for particle size distribution
(Chapter 5) The mill optimisation and enhancement that preceded
these tests was also evaluated by this means (Chapter 4) since
particle size is of utmost importance in this project This equipment
included the drying oven and shaker with its sieves for the grading
process
Feed Water Flow High Pressure Orifice Plate The accuracy of the
mass flow of the working fluid is very important Since the STEP
calculations are very sensitive to feed water flow to the boiler a
special laboratory calibrated orifice plate was installed in a Sempell
block specifically designed to accommodate the plate (Figure 332)
Special high pressure transducers were employed with appropriate
conversion and correlation factors to produce accurate flow values
See sample calculation 4 (Appendix A)
3 - 60
Figure 332 FEED FLJ)W HIGH PRESSURE ORIFICE PLATE
w gt VI VI
e ~
oJ 10utl e 1c 0
3 - 61
Volumetric Coal feeders On the combustion side the coal flow is
very important The coal volume flow was measured by means of the
feeder integrators The feeder bars were set according to the
required dimensions and a correction factor was used to determine mass
flow from the volume flow obtained from the feeder integrators See
sample calculation 5 (Appendix A)
More perspective of the above preparations and measurements will be
discussed in chapter 4
3 7 COMPUfER SOFTWARE AND EFFICIENCY PROORAMS
There are three programs utilised by ESKOM for calculating thermal
efficiency or heat rates These programs will be discussed
functionally only highlighting their advantages and disadvantages
No programming or software details will be discussed
Firstly there is the PEPSE program (Performance Evaluation of Power
Station Efficiencies) This is a comprehensive heat rate calculating
program that can handle the smallest detail and process of plant Its
operating principle is that a process model can be built up to serve
as a reference Simulations can be run for certain variances of the
model eg what would the turbine cycle heat rate be if a HP feed
heater is bypassed or if the condenser cooling water temperature
changes by a certain amount The disadvantage of this program is that
3 - 62
it is very complex In order to obtain full benefit from this program
a person would have to be appointed on a full-time basis to utilise
the system and analyse results At first the PEPSE program was only
equipped for the turbine plant but it was recently expanded to include
the boiler At the time of writing it is being tested in the
evaluation of the unit in its entirety and not only in handling the
turbine and boiler as separate entities The PEPSE program is a very
good design tool to establish for example turbine plant design
specifications
The second program is based on BS2885 1974(9) This British Standard
is commonly used internationally and was used by ESKOM TRI at the time
of the Lethabo excess air reduction tests (Potgieter(Sraquo It was also
used to evaluate Guarantee Acceptance Testing of new units built by
contractors for ESKOM It is based on the losses or indirect method
It only addresses the boiler and not the turbine or the entire unit
The losses that can be measured are
- Combustibles in ash
- Radiation loss
- Sensible heat of water vapour
- Dry flue gas
- Wet flue gas
Moisture in combustion air
- Combustible (unburnt) gas
3 - 63
Although BS2885 deals with the last three losses to a greater extent
than does STEP which includes them in the unaccountable losses it
does not take into account certain other losses that STEP does This
program is the best for Guarantee testing where a specific efficiency
value is to be achieved using the indirect method by evaluating
specific losses stipulated in a specification
The third program is STEP (see nomenclature) It is used on every
thermal power station in ESKOM by plant performance personnel to
monitor and evaluate the hourly daily weekly or monthly thermal
performance of individual units as well as that of the station It
can also simulate performance in real time mode by entering for
example a series of hourly readings averaged as a snapshot It
operates on both the direct and indirect method simultaneously where
the unaccountable losses make up the difference between accounted
losses and 100 This is the best cross-controlling method to minimise
calculation and monitoring errors
STEP also calculates a sliding target for each loss and compares the
actual loss to the target to form a percentage STEP loss It
furthermore evaluates the boi ler turbine and entire unit
simultaneously The twelve most important losses measured are
3 - 64
Overall station
- Demineralised water make-up
- Auxiliary power
Turbine
- Condenser vacuum
- Final feed water temperature
- Main steam temperature
- Reheat steam temperature
Turbine deterioration (isentropic expansion efficiency)
Boiler
- Boiler radiation
- Mill rejects
- Hydrogen and fuel moisture
- Unburnt carbon
- Dry Flue gas
STEP has never before been used outside its original purpose of a
trending tool for evaluating plant history However it holds the
potential as being the best optimising tool presently available The
intention was to utilise STEP in these tests since it had already
proved itself in this mode during the Air Flow Optimisation tests
(Storm(2raquo
3 - 65
The main efficiency calculations of this project were performed by the
STEP system personal computer (PC) facility A model can be
constructed tuned and customised for a specific situation whereafter
simulation runs can be performed For the purposes of these tests
some modifications were made to the STEP formulae and targets The
compensation to dry flue gas loss due to dilution caused by air
in-leakage (sample calculation 3) and the compensation to unburnt
carbon energy due to varying ash quantity in coal were two such
formulae modifications The sliding targets of auxiliary power
consumption and dry flue gas loss proved to be erroneous and were also
corrected for the calculations of these tests
38 COAL AND TIlE BLENDING STOCKYARD
Due to its unique composition the Lethabo coal is just as important a
research topic as the plant itself The coal quality used for testing
in this project was extremely poor by international standards for
pulverised fuel technology The main reason for this is the higher
volatile matter of those coals compared to the Lethabo coal The low
volatile content of the Lethabo coal is one of the crucial matters
around which this project evolves The high ash percentage of this
coal also presents greater erosion problems in the boiler as well as
severe stack emission problems Fortunately however the ash
properties present relatively favourable clinkering characteristics
due to the high fusion temperatures The properties of the Lethabo
coal relative to other South African and European coals can be seen in
3 - 66
Table 32
Table 32 COMPARATIVE AIR DRIED COAL PROPERTIES
COAL IN SITU COAL RESERVES CONTRACTUAL COAL QUALITIES LETlIAlIO MATIMBA ORAl BROWII COAL PROPERTIES inillull ~aximum average minim aliul Base value (GUAR TEST) (RSA) (UK) (GERMANY)
--------------------------------------------------------__-------------_---__-------------------------------------------shyII II II II II II II II II II II II
CV (MJkg) II II 111 235 172 II
II 150 170 160 II II 152 201 264 200
II II
II II (total) II
II
Inherent loisture ~ II II 16 g6 59 II
II 70 150 125 II II 45 22 43 300
II II II II II II
Ash ~ II II 211 478 337 II
II 210 410 375 II II 37B 345 181 50
II II II II II II
Volat ile lIlat ter I II II 105 268 208 II
II 160 230 195 II II 211 272 I
I 289 440 II II II I II II II I
Filed carbon I II II
II II
II II 3667 3610 48 70 3600
II II I II 11 II I
Total carbon ~ II II
II II
II II 4375 4819 6439 6800
II II II II II II
Hydrogen ~ II II
II II
II II 283 359 416 500
II II II II II II
Ni trogen ~ II II
II II
II II 99 116 38 100
II 11 II II II II
Sulphur ~ II II 15 297 75 II
II II 59 109 126 50 II II II II II II
Carbonates ~ II 11
II II
II II 112 50
II II II II II II
OIygen I II II
II II
II II 960 815 591 2500
II II II II II II
Abrasiveness IgFekg 50 1095 237 II II 130 800 450 II
II II II II I II II II I
Ash fusion (lOT) nc II II 1210 1400 1390 II
II 1200 1400 1300 II II
I I 1400
II II II I II II II I
HIV ~ II II
II II
II II 2087 4094 3952 4096
II II II II II II
----------- -------------- -------------------------------------- ----------- _---------------- _---------_ __
From the values of CV ash and especially volatile matter (Table
32) it can be seen that the characteristics of the in situ coal
reserves of Lethabo Power Station span a very wide range from minimum
to maximum In general it is not feasible and in many aspects
3 - 67
impossible to design a power plant that can accommodate feed stock
with such a large variance It is therefore essential that coal
blending takes place before it enters the power station The coal
has to be blended for CVas main criterion with other prerequisites
for minimum or maximum values of ash volatile matter and moisture
etc These values form the contractual limits in Table 32 (see coal
contract(lOraquo)
The layout of the coal blending stockyard can be seen in Figure 333
The intention here is not for a detailed study of the stockyard but
rather to gain an overview and to take note of certain functions
thereof The entire coal supply side of Lethabo Power Station ie
New Vaal Mine consists of three functional areas The first is
referred to as the Pit which is an opencast mine and where the coal
under discussion originates in three relatively shallow seams The
raw coal is taken from these seams in approximate portions averaging
304 from the top seam 435 from the middle seam and 261 from the
bottom seam as per contract(lO) The coal enters the second area
which is referred to as the Plant by conveyor belt (North Eastern
side of Figure 333) About 40 of the coal undergoes beneficiation
(destoning) in a DMS (dense media separation) plant Mass meters
used for payment an assized bin for mass meter calibration and a
sampler for checking coal quality are also incorporated
3 - 68
I
Figure 333 COAL BLENDING STOCKYARD IN PLAN
i
I
3 - 69
The third area is the blending stockyard It consists of a Northern
and Southern compacted strategic stockpile In between these
stockpiles lie the live stockpiles where the coal is blended This is
basically achieved by means of three rail mounted mechanical
stacker-reclaimers The in-coming coal is stacked by either the
windrow or the chevron methods Both methods utilise the principle of
stacking the in-coming coal with different qualities in a horizontal
manner in layers and reclaiming it in a vertical manner thus taking a
certain ratio of coal at different qualities This quality is
pre-calculated to provide a quality within the range as per contract
On the outgoing side of the stockyard mass meters and a sampling plant
is also installed
There is also a facility for bypassing the blending yard in the
event of emergency coal demand from the power station This project
may also review minimum standards of coal quality during bypassing
actions
Figure 334 shows a functional flow diagram of the plant and blending
on the live stockpiles each of which can store almost one million
tons This project may also highlight the need for an on line coal
quality monitoring scanner or moisture analyser to predict certain
coal properties prior to entering the power station The original
facility was removed due to the unreliability of readings It should
be noted that at Lethabo the ratio between volatiles and CV of the
3 - 70
Figure 334 STOCKYARD COAL FLOW DIAGRAM
-----
~J---+---t-f IId
~-4--d IhJ
3 - 71
coal is not constant The results of present research and
development is anxiously being awaited There are no coal storage
staithes at Lethabo Each boiler is provided with a coal silo
holding 5550 tons which in turn serves six bunkers each of 800 tons
capacity one each per mill
The calculation and ordering of the coal for the tests will be
discussed in chapter 4 The low grade coal for these tests (low CV
low volatile type) is in abundance in the pit The intermediate coal
was blended in the normal supply mode However a problem arose with
the acquisition of high grade coal for this test Although the
required quality of high grade coal was available in the pit it did
not occur in large enough homogenous volumes to extract directly for
testing It was therefore decided to utilise the old Vaal coal
stockpile where almost a million tons of coal was available Vaal was
an old ESKOM power station which was recently decommissioned
Calculations (see chapter 4) established that the quality of this coal
was very close to the high grade required for the test It was also
more economical and practical to use this coal directly in unblended
form rather than the high grade coal from the pit Although the
coal was sold by ESKOM the negotiations were timeous enough to
recover an adequate quantity for testing
3 - 72
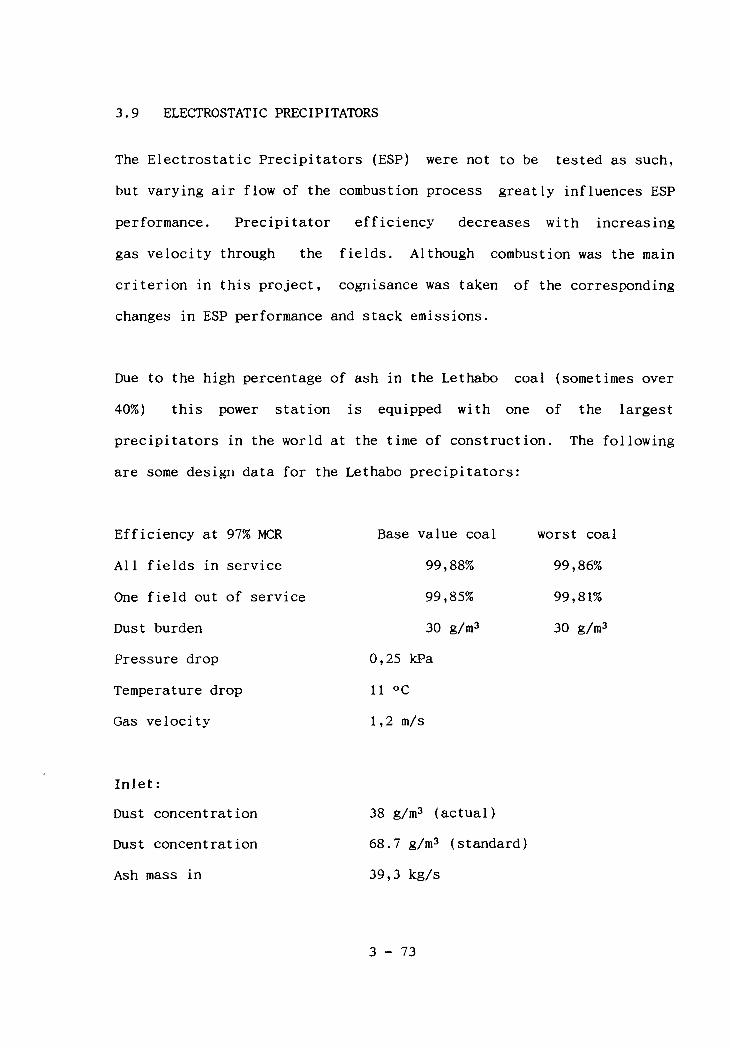
39 ELECTROSTATIC PRECIPITATORS
The Electrostatic Precipitators (ESP) were not to be tested as such
but varying air flow of the combustion process greatly influences ESP
performance Precipi tator efficiency decreases with increasing
gas velocity through the fields Although combustion was the main
criterion in this project cognisance was taken of the corresponding
changes in ESP performance and stack emissions
Due to the high percentage of ash in the Lethabo coal (sometimes over
40) this power station is equipped with one of the largest
precipitators in the world at the time of construction The following
are some design data for the Lethabo precipitators
Efficiency at 97 MCR Base value coal worst coal
All fields in service 9988 9986
One field out of service 9985 9981
Dust burden 30 gm3 30 gm3
Pressure drop 025 kPa
Temperature drop 11 degC
Gas velocity 12 mls
Inlet
Dust concentration 38 gm3 (actual)
Dust concentration 687 gm3 (standard)
Ash mass in 393 kgls
3 - 73
OUtlet
Dust concentration
Dust concentration
Ash mass out
construction (see Figures 335
Parallel casings
Series fields per pass
Plate height
Plate length
Aspect ratio
Plate area
Flow area
Specific collecting area
Transformerrectifiers
Sets
Output voltage
Output current
Output power
82 mgm3 (actual)
147 mgm3 (standard)
84 gs
336 and 337)
Four
Seven
148m
5m
24
190624 m2
817 m2
1916 sm
Per field Per boiler
28
35 kV 50 kV
476 A 1 A
5656 kW 1824 kW
3 - 74
Figure 335 GENERAL PRECIPITATOR CONSTRUcrION
3 - 75
Figure 336 SIDE VIEW OF PRECIPITATOR CASINGS
3 - 76
Figure 337 ARRANGEMENT OF PRECIPITATOR ELECTRODES AND RAPPERS
3 - 77
Typical ash analysis
Silicon (as Si02) 518
Aluminium (as A1203) 343
Iron (as Fe203) 35
Ti tanium (as TiOl) 17
Phosphorous (as P20S) 04
Calcium (as CaD) 46
Magnesium (as MgO) 12
Sodium (as Na20) 01
Potassium (as K20) 04
Sulphur (as S03) 01
Manganese (as MnO) 003
Unburnt carbon 03
An enhancement program was undertaken on the Lethabo precipitators
during 198990 This involved the retrofitting of microprocessor
controllers to all fields This resulted in reducing emission levels
especially under adverse conditions such as poor coal quality and
field outages These controllers also reduced the precipitator power
consumption from 42 MW to the 18 MW as stated above The
optimisation of rapper settings also served to reduce emission levels
3 - 78
Figure 338 PRECIPITATOR CORRELATION CURVE - UNIT 1
450
400
e 350 u
U1 en e
z 0
300
11U1 U1 I E 250 w I
jl I
~ U1 l a 200
150
100 I
I50
a ----
GART REltD [NG (Xl 0 10 20 30 40 50 60 70 80 I I I I I I
CURRENT (lIAl bull 0 2 4 S 8 10 12 14 16 I I I I I I I
OPT eM DENS tn (-] (] 2 4 6 8 12 14 I I I I I I I
STAOlt EXIT OPACIn tIl a 193 34S 474 57S 657 723 n7
3 - 79
The present environmental legislation in South Africa is based on two
requirements
- The total station mass emission per 31 days should not exceed 1200
tons of particulate emissions (ash) ie 200 tons per boiler
An opacity of 60 (250 mgm3 STP) may not be exceeded for more
than 8 hours Thereafter the specific unit should be deloaded to
bring the opacity below the limit
The above legislation is based on a correlation curve(ll) which shows
the relationship between percentage opacity and mass emission (Figure
338) A separate correlation curve is available for each individual
unit at Lethabo Power Station
The importance of the precipitators and the mass emission legislation
is the limitation that it can place on combustion air flow The
overall unit efficiency will be the main criterion but the above
emission limits can place an overruling restriction on any specific
air flow recommendation This will be of particular significance at
higher loads
3 - 80

3 RESEARCH FACILITIES
31 GENERAL TECHNICAL INFORMATION
The characterisation of scientific and performance testing of the
processes concerned in a modern steam power plant in this case the
influence of coal quality on the optimum combustion air can be
divided into five levels
- Chemical and physical analysis
- Advanced analytical techniques
- Laboratory scale testing
- Pilot scale tests
- Full scale tests
Level 1 - Chemical and physical analysis
This category includes mass based proximate ultimate and CV analysis
of the coal on a gravimetric (mass) basis Ash fusion temperatures and
elemental (constituent) analysis are also included in level 1
Level 2 - Advanced analytical techniques
These analyses are mostly on a petrographical basis Petrography is
the study of the microscopic organic and inorganic constituents in
coal and the degree of metamorphosis to which they have been subjected
subsequent to their time of burial(l) The Lethabo coal analysis
according to this is approximately
3 - 1
Vitrinite - 175
Exinite - 25
Inertinite - 80
(Reactive macerals - 27)
It involves fields such as mineralogy and char microscopy Mineralogy
is the analysis of the crystal structure of the mineral components
(pyrite siderite SiO A1203 etc) Techniques such as FTIR and NMR
(see nomenclature) are also included here
Level 3 - Laboratory scale testing
This level includes combustion testing using the so-called hot stage
microscope heated grid and flat flame techniques thermogravimetric
analysis (TGA) where the mass loss is determined vs T or t which can
be performed in N2 to devolatalise or 02 to combust DSC RC DTF
methods (See nomenclature)
Moving from level 3 to 4 is the transition of microscopic to
macroscopic approach To obtain directly usable results to fulfil an
operational need the macroscopic approach (more specifically plant
performance techniques in the form of Process and Thermal Efficiency
Optimisation) is primarily required for this project This should also
serve as a link between the macroscopic and microscopic approaches
3 - 2
Level 4 - Pilot scale tests
These are mostly performed on dimensionally similar burners but are
unfortunately relatively expensive
LevelS - Full scale tests
These tests are performed on the actual plant and the tests of this
project fall into this category in the true sense of the macroscopic
approach
The geographical data for this test facility (Lethabo Power Station)
are the following
Longitude 270 58 34S (South)
Latitude 260 44 23S (East)
Altitude 14597 masl
Gravity 978665 ms- 2
For practical financial and strategic reasons unit 1 was selected
for this test The selection was dictated by factors such as the state
of plant and the availability of the units the Lethabo maintenance
outage program the ability to run at various loads with agreement
from National Control and measuring facilities that differ on the
various units The test results achieved with unit 1 were expected to
be the most representative since this unit is the oldest at Lethabo
with the most running hours most modifications implemented most
seasoned ball charges in the mills etc
3 - 3
----------------------------------------------------------------------
Table 31 UNIT ATTRIBUTES FOR TESTING PURPOSES
ASPECT UNIT 1 2 3 4 5 6
--------------------~-------------------------------------------------
Calibrated feed flow orifice plate installed x x
Machined ports to accommodate CO monitors x x x
Opacity monitor ports per casing x x
AHTR gas outlet sampling ports per casing x x x x
Coal feeder sampling ports x x x x
NOxS02 stack monitoring facility x x x
Burner pipe sampling ports x x
Balanced furnace characteristics x x x
Lean coal test performed x
Furnace characterisation test performed x
EID excess air tests performed x
Boiler guarantee efficiency test performed x
Air flow Optimisation tests performed x
Precipitator efficiency test performed x x x
Opacity Monitor correlation test performed x x x x x x
Plant constraints (such as the generator vibration problem that
plagued unit 1 and limited the load to 400 MW but which were cured
during March 1993) was the main reason why the previous air flow
optimisation tests had to be performed on unit 2 in September 1992
(Storm(2raquo) The unit preferred for testing then and now remains unit
3 - 4
1 It has the most measuring and testing equipment installed since
all other previous test work (Lean coal test(3) Guarantee efficiency
test(4) etc) was performed on it (see table 31) An interim
refurbishment (IR) was performed on unit 1 from the 18th February to
20th March 1994 During April 1994 optimisation activities on this
unit took place in preparation for the tests which were conducted from
the 2nd to 20th May 1994 These preparation activities will be
discussed in more detail in chapter 4
32 UNIT AND CYCLE DESCRIPTION
The Rankine cycle for the steam plant at Lethabo Power Station is
shown plotted on a T-s diagram in Figure 31 It is a sub-critical
laquo221 MFa Figure 31 no 3 - 4) super-heat (Figure 31 no 4 - 5)
reheat cycle (Figure 31 no 7 - 6) with extended regenerative feed
heating (Figure 31 no 10 11 amp 12) The HP (Figure 31 no 10) and
LP (Figure 31 no 12) feed heaters are surface heat exchangers
whilst contact feed heating is simultaneously done in a deaerator
(Figure 31 no 11) Sub-critical implies the presence of a steam
drum
Steam expansion occurs in one HP (Figure 31 no 5 - 7) one IP
(Figure 31 no 6 - 8) and two dual flow LP turbine cylinders (Figure
31 no 8 - 9)
3 - 5
Figure 3 1 RANKINE CYCLE ON T-s DIAGRAM
I I
I
3 - 6
The latter exhaust directly into two condensers in tandem (Figure 31
no 9 1) which operate at different temperatures due to the CW
supply (11 m3 s) flowing through them in a series arrangement
Feed pumping (plusmn 500 kgs) is in two stages (Figure 31 no 1 amp 2)
The first stage (condensate extraction pumps) takes suction from the
condenser hot well at an absolute pressure of plusmn 5 kPa and raises the
pressure to 800 kPa and a gravitational head of 33m The second
stage (20 MW steam turbine driven 100 main pump or two 50
electrically driven pumps) raises the pressure to overcome 64m of
gravitational head and associated pipe friction to produce a drum
pressure of 181 MFa
The upper temperature of the working fluid in both live and reheat
steam is controlled at 535degC at all loads whilst the average MCR
design temperature in the condensers is 35degC This renders the
Carnot efficiency for this plant as
TH - TL
nCarnot = TH
(535 + 273) - (35 + 273)
=
(535 + 273)
= 6188
3 - 7
This means that in the ideal case considering the working fluid only
at least 3812 of the heat must be rejected to the heat sink via the
condensers and cooling towers The design value of the turbine cycle
heat rate (heat sink losses included) is a minimum of 8125 kJkWh at
618 MW generated (100 MCR) (See Figure 32) This corresponds to a
maximum efficiency of 4431 for the energy conversion process in the
turbine cylinders The additional loss on the turbine plant due to
auxiliary power for example is another 274 which reduces the
useful total to 4157 The total boiler efficiency is approximately
89 which further reduces the overall value to 37 This is the
maximum possible cycle efficiency at optimum load
The heat rate calculated from the inverse of this efficiency (9730
kJkWh) is called the optimum sent out heat rate This is the minimum
possible heat rate that the units at Lethabo can achieve at 100 MCR
with specification coal to the boiler freshly soot-blown no ageing
or deposits on turbine blades etc In practice where the load factor
over a month would average 80 the coal quality is below
specification and other parameters are below ideal design optimum a
typical Lethabo unit would achieve an overall efficiency of 35
A typical Sankey diagram for Lethabo (Figure 33) shows the losses as
a percentage of primary energy input including the heat that is
3 - 8
Figure 32 TURBINE HEAT RATE
a Opound~ I tml ~poundAr itA rt ~ bullbullbullbull nvitIliO CtlRJI(crro HIiJT 1M
o o It CD
1 I I
o o
CD
o o n CD
~ shy
~ o o (I CD
~
shyshy
shy
I~ ~ r--shy
~ 0
-~ yen
0 0 0 co
shy _-fshy __
-i -J
II -x
0 0 al I
0 0 CD r-
JSO 400
sao ~so bull600 630
3 - 9
Figure 33 SANKEY DIAGRAM
Pow~r 351
Auxiliaries 11
1
Loss 651
E~hoU51 steam
541
rmiddot
middot1 Boiler loss ~--~~--~=---~
Turbine 1181
Boiler 1487
Fi~d woler 411 I
Air heoler T Energy
input ( fuel) 1001
3 - 10
recovered through regeneration (air and feed water heaters) the heat
wasted to the heat sink and the final useful electrical energy sent
out (to the national grid)
Concerning the overall efficiency of a unit (weighted average of
simultaneous boiler and turbine operation) the maximum is assumed to
be at 100 MCR This will be evaluated in this test under the
criterion of varying air flow and not varying design criteria
The point of maximum efficiency for the boiler would be most affected
by varying air flow and its influence on the load at which this
maximum efficiency occurs
33 TURBINE PLANT DESCRIPTION
The intention here is not to discuss the turbine plant in detail but
only those aspects that could influence the boiler and the unit as a
whole with changing air flow to the combustion process The fact that
some of these aspects did present themselves during the unit 2 tests
in 1992 (Storm(2raquo makes an overview of this section of plant
necessary Excess air reduction caused the reheat steam temperature
to decrease with a resulting decrease in final feed water temperature
at lower loads The influence of the turbine auxiliaries also proved
to have a significant impact on the optimum efficiency point relative
to combustion excess air quantity
3 - 11
The physical aspects of the layout and components of the turbine plant
were mentioned in section 32 Quantification thereof can be seen in
Figures 34 35 amp 36 These flow diagrams display the sequential
order of the working fluid through this part of the Rankine cycle
- turbine cylinders
- condensers
- LP feed heaters
- HP feed heaters
- deaerator
- feed pumping stages
The magnitude of the physical properties of pressure (bar)
temperature (oe) mass flow (kgs) and specific enthalpy (kJkg) are
also given between each process As mentioned the turbine cycle
achieves its maximum efficiency at 100 MeR as per design There are
some interesting aspects worthwhile mentioning since they can be
influenced by certain variables of these tests (varying combustion
air flow) and they can in turn impact on the boiler and overall
efficiency Emanating from experience in analysis and interpretation
of STEP as well as plant design factors note the following
The cycle is more efficient with the SFP and BFPT in service than
with the EFPs (see nomenclature) Depending on the load factor this
increase in efficiency can be up to 03 for the entire cycle
3 - 12
Figure 34 TURBINE CYCLE FLOW DIAGRAM - 100 LOAD
21202
tSl
10744 49220 bull If 3S82 30lt47
middot----2~J 3738S1CSSG ~ I ~-~-
11402 21ez 492~ 41 ~42
r--2103 3541 ~ L
1100 12so I -shy1114 I
492206
-------------~
lIAR QIO c
UIO 105
il
180 ~o
(I~
334 492~
CD I
1637
860 11137 ~7
1861
Ij 162 122
~rpZ
I ( bull Y ) ~~62473-+352~327 12
1~3
73
J[iF-~ ~II L~40
s Li-- r
3340I----J shy3103 7 b 401841 0
C
2831 3L4
313 1074
O4U 77
2814 1687
27430 20867
25111 2430lt4
-II
351
ItOI
34
114 86345
114c5 345H11
D 12114 ()2t7
IIAlI QIO C
IUlGlOis
3 - 13
Figure 35 TURBINE CYCLE fl()W DIAGRAM - 80 LOAD
Alt 3tSt raquolaquo ~--- A 2367 27121 10
C1[1 mri-I
So4 3342 _ a Hm
2363 21 2011 131
IlAlt 1110 (lItO C 10 S
3 - 14
Figure 36 TURBINE CYCLE FLOW DIAGRAM - 60 LOAD
1 2330 3044 bull --- 221amp 11181 14110 1~4
113$0 huo
Itle 33423 20114 CD4oea lOe2
2 12M ()~ I iIlf15
14~
1156 144t H860f
AO 6156 154t 2118601
1~31435 29860
OP446 1~ 3M I2Qt
1193 33lt123 -III
431 1
41t1 lOe21 Z11P 21
t79r un t20Zp 9372
bull 1)8314 214 1387 1131 r
1271 7 lOP 21425amp
(Y 2114 1244 291 2142~
lJko GIIoe lOS -
3 - 15
Of all the losses excluding overall governing factors such as
load factor there is not one that has such a significant impact on
cycle efficiency as condenser performance The cycle efficiency is
very sensitive to condenser vacuum (back pressure)
- Numerically smaller than the condenser loss but in the same order
of magnitude is the final feed water temperature This is a measure
of how effective the regenerative feed water system is and its effect
on cycle efficiency Important to note from Figures 34 35 and 36
is that while the target final feed water temperature decreases with
decreasing load the bled steam percentages of total steam flow
remains the same regardless of the load
The three above-mentioned aspects are important parameters where the
turbine can impact on thermal efficiency and boiler combustion For
example the boiler has to work harder for the same generator load if
the EFPs are in service instead of the SFP The test program had to
avoid random changes of auxiliary plant in service between different
tests since consistency should prevail Also from previous test
experience it is important to note the amount of CW pumps in service
as well as their configuration in terms of electrical power supply
This can impact greatly on efficiency via condenser vacuum and
auxiliary power consumption since only certain cw pumps are supplied
with power from unit 1 electrical boards
3 - 16
34 BOILER PLANT DESCRIPIION
341 BOILER AND STEAM GENERATION
As mentioned the Lethabo boiler is a sub-critical water-tube
evaporator accommodating a steam drum (Figures 37 amp 38) On exiting
the main feed pump at 22 MPa 141degC HP feed heaters raise the
temperature to 247degC and the working fluid is further pre-heated in
an economiser to 305degC before entering the steam drum at 181 MPa
357degC Natural circulation occurs due to density difference in the
latent evaporation process via down-comers and side-wall manifolds
headers risers and vestibule tubes
There is no central dividing wall in the combustion chamber Liquid
and vapour separation takes place in the steam drum whereafter the
working fluid passes on to the super-heating elements
The flow path of super-heating commences with the primary supershy
heaters to 475degC in the rear gas pass (Figure 311) The steam then
reaches 500 degC through the platen super-heater panels situated
directly above the furnace where it is exposed to the highest flue
gas temperatures Figure 39 shows the maze of pipe work of
super-heating Two aspects are worthwhile noticing here
Steam super-heating takes place in four banks from left to right
namely A B C and D when the boiler is viewed from the front
3 - 17
Figure 37 WATER FLOW TIiROtXiH BOILER
SECONOARY S TEAW __---7-----SATURATEO STEAW TO SUPERHEATERSCRUBBER
PRI RY STEAII SCRUIIBER
REAR SUPPORT WALL OUTLET HEAllE
ECONol SER OUTlE T HEAOER
JII FEEO PIPES
FROIIT ALL I OUTLET HEACER VESTIBULE OuTLET
REAR SUPPORT SCREENd All
VES T I BULE CAGE ENCLOSURE FURIIACE
INTEREO lATE OOWNCOgRS HEAOER
ECONQIIISER TOP aNK
ECONQIIISER BOTTO _ BANK
HEACER
FEEO CHECK VAL VESlOE WALL INLE T HEACER
FROIIT WALL INLET HElOERS RUR WALL IIILET gtlEAOERS
3 - 18
Figure 38 SECTIONAL VI~ OF STEAM DRUM
3 - 19
Figure 39 BOILER STEAM SIDE SUPER HEAT FLOW DIAGRAM
eol~ER RICIIT 110 I~ER unMAte) SIDpound
MAIC) SIOpound
Ir STACpound IIfTt1l1[RA roRS
TO STtAW SAYLINO COOlERS
3 - 20
The pipe work between these banks perform cross-over traversing
between primary final or secondary and platen super-heaters in order
to eliminate any unbalance in the furnace and flue gas temperatures
The first stage attemperating or spray water is added before entrance
to the platen super-heaters Four attemperation stations capable of 15
kgs each are controlled by the platen super-heaters outlet
temperature The steam then enters the secondary or final
super-heaters also with four attemperation stations of 4 kgs
capacity each and controlled by the final boiler live steam outlet
temperature of 540degC There is a 5 degC temperature loss to the
turbine where the required design inlet conditions are 161 MPa 535
degC After the HP turbine the steam returns to the boiler (41 MPa
332degC) as cold reheat for reheating The primary reheater raises the
temperature to 460degC and is situated in the rear gas pass The final
reheater is situated just behind the final super-heater in the front
gas pass A cross-over arrangement of pipe work between the four
banks similar to the superheater also exists between reheater pipe
work (Figure 310) The reheater has four attemperation stations
capable of 11 kgs each controlling the final reheater steam
temperature to 540degC The required hot reheat steam design conditions
of 535 degC and 38 ~Wa then result at the IP turbine inlet
3 - 21
Figure 310 BOILER STEAM SIDE REHEAT FLOW DIAGRAM
c ~ laquoaj g ~t lI laquo
s e ~1 ~
iii n l u
laquo
-1 ~Sold la g ~II1
~ I
fV ~- ~
81~i - shyoj 2_ S i ic ~ w
~w ~ ~ m 15 e ~
i~ ~ i ii Ii i ~ I Ii f f
i
~j
3 - 22
342 FURNACE AND COMBUSTION
The furnace is constructed such that the combustion process provides
heat to the evaporation process primarily in the radiant mode (Figure
311) Combustion temperatures are between 1200 degC and 1400 degC The
platen super-heaters also receive some radiant heat but thereafter
the heat transfer occurs mostly via convection with conduction once
the heat reaches the metal of the tubes The front and rear gas passes
are constructed in such a way that the heat transfer between flue gas
and steam occurs in the counter flow arrangement
After passing over the furnace platen final super-heater and final
reheater tubes the gas (plusmn 700 kgs) has cooled down to plusmn 600degC It
then passes through the rear gas pass in a downward direction through
the primary super-heater primary reheater and economiser to exit at
a temperature of plusmn 320degC The maximum gas velocity of plusmn 10 ms
occurs at the top of the front gas pass before entering the rear gas
pass Depending on the load an air molecule or pf particle takes 7
to 12 seconds to travel between burner and economiser exit
Downstream of the economiser the gas duct splits into two
The gas in each of these ducts then passes through a primary and
a secondary air heater in parallel to cool down to plusmn 130degC
Thereafter each duct splits into two to enter the four electrostatic
precipitator casings After passing through the precipitator where
more than 999 of the fly ash is removed the four ducts join into
3 - 23
Figure 3 11 DIAGRAMMATIC FURNACE ARRANQE1fENT
TO TOP SUSPENSION STEEL WORK r-----------------~~----------------~
fiNAl SIHR PLATEN SUPEAHtA TER OUTLET AN I fClOS
735 In
713 M
SECONOAfIY AEHtA TER
~E ESTIBULE I OOWNCOIl1ER --
I FRONT VESTU8LE
PRIMARY REHEATER
PLATEN SIHR L--+O--- ~C~~~~cig~~~~
A==iEiitiQ==IiiI~3 PRIARY AHTAFINAL SHTA ~=~~~~-1 INLET MANlfOLO~
i middot1 __ 1---- ECONOMISEA~ FUANACE FRONT WAlL I JI TOP BANItIlT_ L~lill BOTTOM BANK
WlN080X
ExIT SCAEEN -
FUANACE CACE ENCLOSURE HOPPEA GAS OUTLET fLUE
ENVELOPE
Ih-bull~---FURNCE REAR WALL
100 m ~--aUANER THROAT
fURNACE HOPPER ~ --+ 5-~ ~ ~ FRONT HOPPER OEAO SPACE ~ C~-HOPPER SUPPORT FRAII1E-plusmn )middot~URNACE LL INLET HEAOERS
ASH HOPPE~~ = 00 In BASEMENT OA Tuw iLllmiddot
3 - 24
two separate ducts where two ID fans (plusmn 35 MW each) take suction to
propel the gas to atmosphere via one flue that passes up the
multi-flue chimney stack (275 m high)
Two FD fans situated at ground level take suction inside the boiler
house at 73m level to utilise the radiant heat loss from the boiler
and furnace (Figure 312) where the ambient temperature ranges from
25degC (winter) to 40 degC (summer) The capital outlay of this
arrangement extra ducting for example is overridden by the gain in
efficiency and air heater protection It can be detrimental to metal
surfaces if the cold air side temperature of the air heater is not
kept above dew point since sulphuric and other acids in the flue gas
originating from the combustion process are extremely corrosive The
aerofoils measuring total air (sample calculation 2) are situated in
the FD fan intake ducts at 41m level
The air then passes through the secondary air heaters where its
temperature is raised to approximately 260degC before entering the
furnace via the burner The secondary air flow control to the furnace
is through thirty six SA aerofoils and dampers (one per burner) The
total arrangement of SA flow can be seen in Figure 312
Two smaller primary air fans take suction in parallel with and from
the same duct as the FD fans and supplies the mills via the primary
air heaters with air at a temperature of 260degC (Figure 313)
3 - 25
Figure 312 SECONDARY AIR FLOW DIAGRAM
r-----------shy I I I I
~~
~
f 0 I1~ 0 11
i 0 i-tID G
15 shy t
i -~ 0 CI
~
0
5 l l~O1
) (
f I
i
I~ t--+--+-- ~----____~~~------__-J
I ~_
-~
~
~ ~
~ ~
~
bull =
A
~
~ 1
------ ------1
I
I
~~
i 1 ~
II I i ~A
I bull
OJ
o w
J
~
o
3 - 26
Figure 313 PRIMARY AIR FLOW DIAGRAM
)(--_ _--__- rmiddotL I ~bullbull__J
Gd~
) (
t -
u j I
bull ~ J
~
0
u 0
middot0
0
0
a
J
0
a
a
0
0
-owbull ItJlWIII
M)IIrU~middot Itbull Vt
wo ctIIOU shy
000
o 0 0
u u
000
0
0
0
0
0
0
000
o 0 0
i
3 - 27
To prevent a fire from developing in the mills due to excessively hot
primary air an attemperating facility is provided to cool the air
entering the mill wi th air bypassing the PAlITR To prevent the
leakage of pf from the pressurised mill a seal air system powered by
seal air fans discharging at a pressure greater than that of the PA
fans seals off the trunnions and volumetric feeders The latter and
the entire interrelated PA system can be seen in Figure 313
Each boiler has six mills Full load can be maintained with five while
the remaining is on stand-by or available for maintenance The mi lIs
are situated on ground level and supply the furnace with PA and pf via
burner pipes in an arrangement as in Figure 314 and 315 Each mill
has two bunkers each fitted with a volumetric coal feeder The coal
and PA to each mill is thus supplied in dual flow mode and the
resulting PApf mixture also leaves the mill in dual flow via two
classifiers The classifier (Figure 316) is a constant efficiency
device that segregates the percentage of oversize coarse material from
the mixture and recirculates it back to the mill The temperature of
the PApf mixture leaving the classifier reduces to 80degC due to the
sensible heat absorbed by the coal and latent heat needed to evaporate
the inherent and surface moisture during the grinding process
The mills are of the tubular type each driven by a 1600 kW electric
motor Each mill contains 98 tons of grinding media which consists of
50 mm diameter steel balls having 12 Cr This type of mill absorbs
3 - 28
Figure 314 MILL AND BURNER PIPE ARRANGEMENT
3 - 29
Figure 315 MILLI~ PLANT ARRANGEMENT
~f------foll
1----4--411
i I
3 - 30
i
Figure 316 MILL CLASSIFIER
PFOUT
------- t
10
~lNVERTED CONTROL CO
-__-v-__-1
PF IN
3 - 31
virtually constant motor power once the charge has been established
irrespective of load and throughput (plusmn80 tonshour coal flow mill)
The mill is a very important component in combustion testing If the
trunnion division plates (dividing the incoming PA and coal from the
outgoing PApf) are damaged or are not in the required symmetrical
position the combustion conditions within the furnace can become
unbalanced Similarly if the mill controls are not functioning
correctly this can render it impossible for the boiler to stabilise
and to produce the required test conditions The procedure to
calibrate the mill so that its physical properties such as the mass of
the ball charge and the required amount of coal fed into the mill at a
particular time correspond to the required power and feeder control
set points is called a stripping and filling peak procedure
This procedure must be performed at regular intervals since the ball
charge wears away and the make-up must be determined This procedure
will be discussed in chapter 4
Each end of the mill supplies three burner pipes via the classifiers
and each enters the furnace through a burner (Figure 317) Thus
each mill supplies a row of six burners while each boiler has thirty
six burners 18 in each of the opposing front and rear furnace walls
The oil lance for starting a mill is in the centre of the burner
while the PApf tube and SA are located concentrically around it
3 - 32
Figure 3 17 PF BURNER
3 - 33
The burner is one of the most important components in this test
project since a heat-distorted or otherwise damaged burner can produce
an abnormal amount of CO due to incomplete combustion Incorrectly
and inconsistently set burner swirl generators can cause the same
Unbalanced combustion conditions makes testing conditions more
difficult
The tubular primary and regenerative secondary air heaters are also
very important components of plant They impact significantly on
efficiency and also have a great effect on the rate of ignition since
the increase in ignition temperature has an exponential growth with
distance from the burner If the temperature is too low ignition and
combustion can be prolonged to such an extent that an increase in
temperature of the super-heater metal elements occur
The secondary air heaters are of the rotating type Lungstr8m design
utilising rotating element packs and weigh 140 tons apiece (Figure
318) The relative movement due to rotation makes the use of axial
tangential and radial seals necessary (Figure 319) Axial seals
prevent air to gas leakage and are automatically controlled by
actuator motors sensing and correcting the gap distance Tangential
seals prevent gas to gas and air to air leakage They have a fixed
cold setting and have no sensors and actuators Radial seals also
limit air to gas leakage and are controlled by gap sensors These
are the most important seals since most leakage occurs via them
3 - 34
Figure 3 18 SECONDARY AIR HEATER
3 - 35
Figure 319 SECONDARY AIR HEATER SEALS
3 - 36
The primary air heaters are of the tubular type operating in counter
flow heat exchange mode There are two passes of gas flow and four
passes of air cross flow (Figure 320) Leakage can also occur from
air to gas in the PAHTR if tubes carrying the gas come adrift from
the tube end plates In the event of these air heaters being
deficient eg blocked with ash or excessive leakage reduced thermal
efficiency and delayed ignition and combustion will result In
addition a false impression of favourable dry flue gas loss is
created The latter is very important to this type of testing since it
played a significant role in the EID tests(S) mentioned previously
It is to eliminate this defect and to correct the leakage dilution on
the dry flue gas temperature (see sample calculation 3) that the
measuring of oxygen before as well as after the air heater was
introduced in this project
The boiler soot blowers merit mentioning since they influence boiler
efficiency A dirty furnace and associated heat transfer elements
will have a negative effect on the rate of heat transfer resulting in
an increase in dry flue gas loss Heat input into different sections
of the boiler will also be affected
A Lethabo boiler has a total of 128 soot blowers (see Figure 321)
They consist of four secondary air heater blowers thirty two furnace
wall blowers of the short stroke fixed rotating type whereas all
other blowers are of the retracting long lance type twenty four for
3 - 37
Figure 320 PRIMARY AIR HEATER
FlJIINACE EXHAUST CAS IIlET
o PIG RODS
FUIlNACE EXHAUST
ARY AIR O CAS OUTUTTO IUS
EXPANSION JOINT
_ SEC TlON
Ie-LEVEL ________lt4
t AIR FAIOY PA FtHS
3 - 38
Figure 321 SCOT BLOWER LOCATION DIAGRAM
69HO m 32 1331
6598 m ___ 65787 1ft
6283A m
5912 1ft 59078 1ft
S800a m
55S22 1ft
53000 1ft - shy 28 1291 bull30 0 I 1 51150 m
II 809 1ft
5lAO mshy__
17 to 21
BOILER FRONT -
0 22 231
0 2 1251
0 21gt 271
lZ
_1890 m 12 to IIgt
a 91 bullbullbull 930 1ft
3905 m
I to 5 0
o (71 0
8 (9) 10 0 I 1
NOTE BRACKE TEO NUIoElERS ARE OUTED ON L SlOE Of BOIIER
3 - 39
the platen super heater eight final super-heater and eight reheater
blowers in the front gas pass The remaining fifty two blowers are
situated in the rear gas pass and serve the primary super-heater
primary reheater and economiser
At Lethabo many arguments evolved around the influence of soot blowing
on boiler efficiency super-heater metal temperature excursions and
plant deficiencies and several enhancement programs were conducted
Secondary air heater blockages for example were shown to be caused by
the malfunctioning of the air heater soot blowers depositing moisture
into the packs and clogging the ash(6) rather than large ash particles
termed popcorn ash A furnace wall blower test was also carried out
to prove the importance of adequate soot blowing of the furnace and
its effect on efficiency(7) and a revised operating procedure was
implemented
35 CONfROL SYSTEM
The control system that governs the operation and reaction of the
boiler and turbine is complicated and a detailed explanation thereof
would contribute to confusion and overshadow the important issues
Only the more applicable aspects that interface with the philosophy
of this project will therefore be explained The unit and turbine
controls will not be treated in detail but only some of the boiler
controls particularly those related to combustion
3 - 40
The boiler and turbine unit is normally operated in the Automatic
Generation Control (AGe) mode This enables National Control to
regulate the output of the unit (turbine and boiler simultaneously)
according to load and frequency demands termed frequency bias control
This is done by a computerised loading device referred to as ENCOR
(see nomenclature) The unit process control provides capability for
Boiler follow and Turbine follow modes The first is where the boiler
reacts to turbine load and the latter is where the turbine only
generates what the boiler is capable of at that point in time
Variance in generator output is carried out by means of a turbine Load
Controller and the corresponding boiler reaction is obtained with the
Pressure Controller The latter operates via a control circuit
referred to as the Initial Pressure Set point Formation (Figure 322)
According to input signals such as the Unit Load Set point the
resulting calculated signals are sent to the Boiler Master controller
(Figure 323) which controls the boiler The specific control setup
for testing will be explained in more detail in Chapter 5
A suitable manner to explain the functioning of the control system is
to describe the reaction of the applicable components when a load
change occurs As a point of departure assume the unit is running at
steady load There are no variables on the set points of load
pressures number of mills in service or fuel oil burner support etc
Assuming that an increase in load (ie power demand) occurs the
response of the control system in cascading mode will be as follows
3 - 41
1-1
IURB
lt9 __J1 IGf~ SIIPRJlOfD
ltgt
C 8 z
IARGpoundl PRESS r---
iB--o-JmiddotI h
L__-+-_ I
iHAOlCood I I I
w RAoor~Ol Il __ _-_ fiRE IN SHAM flOW UiIlRY run NAH
n --- IIHOIU101 ~U06 _liP BYASS
~ 1I0r 1l0~EON ~ ttRAOQPOOI lUAl PR[SSURE
t 8=---- FIRF ~U06III SfU IlM01UIOIt _ - __ L FUIIU f
I _ rARtiEr P~ESS SETBgt0lllf soro_ _ _ __ I I ~EI(II[J
KAooOno I I I ~E lWOR~ fOR OHUUPlIHG Of 1Ht I ut $TEAIi PatSSURpound (OIHROlltRI
fROIi TNf me foliwAqoI CDI1MJNO UIIOR COISIDpoundR41IOHt Of n( OYUAMIC RfACTlONS DORIHG LOAD (lIAIIGES511 SlN IUIP
SClP fOAHAIlON NW~O(OOI
_------- l1 shy~ CDlip 15 bar
W
N N
Z f
Ii1I301Q1J-~ Apl0 bor PllfSSURC SElP ~ J enro HPSYPASS
(01 TROl R41O(099 ~
~ ~ ~
I 2l rtJ
I ~ bull I I liP BYPASS bull ClOSEn ~ I
rURS FOLlOW
~~ fXI-ItgtI~~flAOO( IO- ~ 6------ f- SOIlFR__~=-___-JI-______ 10 ~~l~~~O
L-_____ L------~-----------------~JL~r~~r dI MOlC~1
__
I
CAPA81L1TY LIMITATION
I
--______ ftJ ft--_HP ampYPAi~r shy 00019 1J---~ NOT CL05EJl I __IURDa fOllOWt--l r
- amp I - I
I I( III 0
I I B-1 I C I RP01UOO1 IlPOlUmI LCV o~~IIR~~ IIP HEAfT~~RVICE I I __ ~ OUT 0 x
I I ~_ on I I Lo ---T__ mJtshy -t ON 1141i1lAl ___ IIIJII _+_J
-- -l_____ I
T
I I Bijffl I
I I II
~--1-----H-___JI
CIIlF09980lUR H4SfER
~ (APAS LIMIT 1 NAOOClOO
(V CONT~Ol TO P4 flOW CONTROL
NM 10COOl
NII20(OlS
NII30COIS
I ~N40COIS
Nil 5O(01S
21 ~t~~~~O~ONTROL [FUEl OElWIOmiddot 1 FUEll Hlll0(OOI
FUEL OEl-IANO NII10COOl
rJ ~ I-j (1)
W
tv W
~
~
~ ~ ~ o
~
W
jl W
poundQll
NlllOCOOl
IlAOOCIOO UNIT ~ETPOINT fROM UIlIT (OORDIN
~ CD MAOleoo fRO PRESS SUP FORMAT
--+----T -Ic
I
[iT- __
~ CD
G)
reg
fAST
I
IFOLLOW
J
I
IIII JygtJ IL L _______ _I I I -- shy-- ----shy
[ ~AOlCOOll
The turbine and generator controls will cause the steam governor
valves to open further via the speed governor and frequency bias set
point This is to admit more steam to the turbine to provide the
increased power required while the terminal voltage is kept constant
by means of the AVR As a result of this there will be a drop in
steam pressure in the main steam pipes supplying the high pressure
(HP) turbine
The boiler is normally controlled on the Constant Pressure principle
(The other controlling principle is the Sliding Pressure principle
which implies that the governor valves are further open and the
quantity of steam flow is controlled more by the feed pumps via the
boi ler )
On the Lethabo boilers the Pressure Controller will detect any change
or pressure drop and the Boiler Master Controller will instruct the
feed pumps to increase the feed water flow to the boiler via the
Master Feed signal This is to enable more steam supply to the
turbine The drum level detect ion will trim or fine tune this
signal Simultaneously the Boiler Master Controller will instruct the
Master Firing control to increase the boilers firing rate (to enable
the additional feed water to be turned into steam and to overcome the
pressure drop that existed in the first place) The major signal
through which the Boiler Master achieves an increase in firing rate is
an increase in PA flow to the mills
3 - 44
Figure 323 shows the Boiler Master Controller input signals Point
(Pt) 1 is the pressure set point input This pressure of 161 MFa is
the target that the controller strives to maintain Pt 2 is the unit
load co-ordinator set point Pt 3 is the fuel oil (if any) to be
subtracted from the coal supply Pt 4 is the deviation between the
actual pressure and set pressure This is the signal that activates
the multipliers at the CV correction (Pt 5) to send the fuel demand
signal to the PA flow signal Pt 6 Note that the settings at the CV
correction (Pt 5) are fixed set points This means that the value is
set for the power stations average or expected CV and is not a
variable that can change with varying CV or be changed by the operator
at will
The increasing PA flow through the mill will sweep more pf to the
burners thus supplying the additional fuel demand to the furnace The
decreasing level of coal charge in the mill will result in a
measurably increasing power requirement to turn the tube mill This
will be sensed by the Power Sonic mill controller and the coal feeder
will be instructed to increase the coal flow into the mill
In Figure 324 it can be seen that the PA flow initially activates
the feeder (Pt 1) After the 27th step in the sub group control a
release will be given for the switch at Pt 2 to change the signal
to that coming from the Power Sonic controller at Pt 4 The input
signals for the power sonic control is primarily the power for the
3 - 45
-----1--- shy
(] Ij ~
10 POlf~ SONIC I-i RILEY I il0LOOI (l)
W ~8 K~I
N ~
5IfifN~ SUPPl Y lIlIl
PA flOIi ~ HIIIO[OIlI
- ~ 8
cp-
W 8DOl~ ~ W t
t)I I bull ____ -J L 1-011 w
~ efOI1 0 ~
~ 4 M~ ~~5IllhS ltUPPI Y
WIlT __ bull __bull trt- 11111 S~l
NHIOOOSI o o
lLL-
mill motor and the sonic verifying signal The pf signal at Pt 3 is
only a feed forward signal when a load change occurs It can be seen
as an input for the kW and decibel (db) set point Thereafter it is
again the power (kW) and decibel signals from the mill that activate
the controlling The transducers and electronic control cards of the
Power Sonic control are tuned to behave according to a prescribed Mill
Load line Figure 325
To render the mill more versatile a mill PA flow bypass damper is
built into the inletoutlet throat of the mill trunnion If the PApf
burner pipes are designed with large enough diameter so as not to
throttle the maximum required flow the diameter will be too large for
minimum required flow and pf settling will occur in these pipes To
overcome this problem a bypass damper is built in to ensure minimum
velocity at all times preventing these pipes being clogged with pf
This can be seen in Figure 326 (Pt 1) What is of importance here is
that the total amount of air approaching the mill (as measured by the
PA aerofoil and controlled by the rating damper shown in Figure 327
Pt 1) is referred to as PA The accompanying signal in the control
system is also referred to as the PA signal After the bypass air is
subtracted the remaining air passing through the mill is referred to
as a pf signal This is because this balance of air is proportional to
the flow of pf due to it being swept up by this air
3 - 47
Figure 325 MILL LOAD LINE
PAFlOW
Iltgsec
3010 20
COAL FEEDER uUTPUT Y
3 - 48
Figure 326 MIll BYPASS FIJ)W CONTROL DIAGRAM
x~
--IF I r I
I I
z I I I~ ~ l- I
I~ I I
I r
1 I
I~ I
~ I I
I
3
IS II I
~I~ Ii I~ I
la I I
rI~ I
C I IIE I
I I I ~ I
I I
~ I - I I I II I IL ___Iii I
I~ I __J ~ I
I IA Si I z x I
I~ I
~ I I r
IDea
3 - 49
Tj PA (ONTROl ON AUlIl
~ 1 tDd Ill I 1IH10
I HHIQ(OOIllf fUN ~
I N A D ~AQ1ltGQ1 --lI it
W
i 1 - ruCOWTiI
I A TO FOil MANIAl
3 c 0 [ F A 10 I I I I
b I
~ I HIll
_____~llOAgc ~ w ~
~ ~----- NAOOC100 lJl o o I
iW-~ HIU BONL---- lQAG ~II rRn
t 1 ---shyI ____J
J - -shy
I Imiddot
J (II Sa--- mVRl6-- bull ~I itiitLDIII I gt111~(11)~ I I Q OOIrtlgt1b DOWN ---------middot-I~F=_lJ YO
L~--==1I II Id Ta ur nw bull
HK lOCOSO~lOf114s
~IW ~reg regK20(OSO
HAOZCOQI
From Figure 327 some very important conclusions can be made The
control diagram shows the input requirement from the boiler master
(Pt 5) The PA flow signal measured at the PA aerofoil and regulated
by the rating damper at Pt 1 undergoes a temperature compensation at
Pt 2 and a square root extraction at Pt 3 (to produce a flow from a
differential pressure)
The bypass air is subtracted at Pt 4 to produce the pf signal as
previously explained at Pt 6 (PA minus bypass air) This signal
which is proportional to the fuel flow (Pt 6) goes to the coal
feeders at Pt 8 and the bypass damper controller at Pt 10 The
feedback pf flow signal at Pt 11 and the forced draught (FD) fan
controller which is total SA (Pt 9) receives its signal from Pt
7 which is the full PA flow without the bypass air subtracted (Note
PA + SA = total air) The result can be seen in Figure 328 In
short the PA flow in Figure 328 is the PA with the bypass air
subtracted ie actually the pf signal in order to vary the secondary
air (SA) which is plusmn 75 of the total air with the amount of fuel
for more constant airfuel (AF) ratio
All the above explanations indicate how the controls react when the
load increases The result was the PA and the SA increasing
proportionally with the pf signal ie the total air increasing (see
Figure 329) If the cvof the coal were to decrease the result
3 - 51
Figure 328 PA SA FLOW RELATIONSHIP
20B~ H~~
20
SECONDARY AIR FLOW Kgsec
3 - 52
--
RA 110 fUElltOHIUIR
INCAEHINll Clf EX(SS AlA Xl------------u WITH UlAD REOlllHG r-----------------A5 (X(SS AlA ----------- H SECONDARY ~
----------- A) AIR flOW CD-r--L r--------- A 2
~
I I --------11 W I I
I I tv 6sectY 10 bull LOAO 10
1110(001 ~ IPA FLO
~ A1 ~ ElUS
AlA ~ C
W IlIS20COU lOon
THE AIM SWIT(HINII IS CONNECTEDNS~C6U
BFDU IN PARAllEl THE flFOAE SWITLHIH6IJJ Inl-lilSfin W I11514(041 DNl Of THE AIM IoWIf(HES THE OTHER ~
lOOP SWITCHES SIIIUlTAIIEOU$II NS50( 041 11
I IMS6C [011
Rio TlNIL rl IlAIIPpoundR DII~ HANUIIL
11-1 ~-1-L-t--I At
~ I 11
9gt---------- ~SECOIIOARI NH10COOl SEC AIR A4 AIR flDll
~TOBURKf 3 rshy~~ ~~ ~A lOgO Q Q _ ~ ~ r - -shyz~z zz z bull U --------------- ----~
bullbullnOCDY bull IiSIII [0108
would again be increased total air This is because more coal would
be necessary for the same heat due to its lower CV increased PA flow
would be necessary to sweep it up and convey it to the burners and
the resulting SA and then total air would also increase
36 INSTRUMENTATION AND MONITORING EQUIPMENT
The main equipment monitoring the unit and from which the majority of
data will be accumulated is the plant computer the SICOMP 70 This
computer provides information for the process control system which
also controls the unit automatically It has a facility whereby a
group log can be compiled to have readings of the selected parameters
measured logged and printed at a preset frequency Hourly every
couple of minutes or even seconds can be chosen as frequency while a
snap shot or instantaneous facility is also available
There are however certain parameters that cannot be measured by the
SICOMP since no measuring points exist or certain parameters which
have to be measured more accurately The SICOMP relies on transducers
and frequent recalibration is therefore necessary Its accuracy is
also influenced by factors such as cold junctions and lead
compensation Plant performance testing also requires a degree of
accuracy such that standard instrumentation is not necessarily
adequate or the readings achieved may not be representative due to
the geometry of the installation
3 - 54
The SICOMP 70 is however very useful for trending and for providing
backup readings Due to the reasons mentioned above the following
are the important additional monitoring equipment which will provide
more accurate measurement of parameters than would be possible by
relying on the plant computer data alone or which cannot be measured
by the SICOMP 70 at all
The ESKOM TRI mobile caravan This facility which is equipped
specifically for the purpose of back-end exhaust gas analysis was
used to measure the following parameters very accurately
- 02 (percentage)
- NOx (ppm)
- S02 (ppm)
C02 (percentage)
- CO (ppm)
Codel CO monitors Concerning gas analysis there is one aspect
besides the accuracy of 02 that is considered so important regarding
safety that a backup instrument is necessary This is the CO content
of the gas at the 10 fan outlet Two CO monitors one per outlet
duct were employed in addition to the mobile caravan facility Where
the caravans CO monitoring operates on the extraction sample
principle whereby the sample is passed over a reactivity cell these
monitors are of the infra red cross-duct scanner type They have
3 - 55
proved to be very reliable sensitive and accurate in the past
Pitot - static tube This basic flow measurement device is very
accurate if used correctly It is normally used in conjunction with
an accurate manometer to measure a differential pressure to obtain a
velocity from the dynamic pressure Pdyn = Pstag Pstat) and
finally a flow Pi tot - static tubes were used to determine the main
gas velocity stream in order to obtain representative measuring points
on the four air heater outlet ducts (Appendix B) It was also used to
determine air in-leakage into the furnace via the mill seal air fan
suction ducts during testing (chapter 5)
The Economiser outlet sampling Matrix Two very important
parameters that need to be sampled very accurately and especially
very representatively is the oxygen and fly ash content of the flue
gas at the economiser outlet before the air heaters The percentage
oxygen here is also a legal requirement as stated in the Pf code of
practice(8) The standard oxygen measuring equipment supplied with
the boiler consists of a single 20mm diameter extraction pipe on the
upper side of each of the two rectangular ducts measuring 5 x 11m
This was considered inadequate and inaccurate Consequently a 16
probe sampling matrix was designed and installed at Lethabo Power
station (Figure 330) whereby the sampling of fly ash and oxygen
content was carried out isokenetically much more representatively
and continuously
3 - 56
Figure 330 FLUE GAS AND FLY ASH SAMPLING MATRIX
o III
===~~--==-- I
o III
-I
3 - 57
The OTOX 91 Portable Oxygen Analyser This is a small compact
portable instrument which has proved to be very reliable and accurate
It is also easily calibrated with test gas (3 oxygen) in its
operating range of 0 35 oxygen by volume It was used to obtain
correction factors for the economiser outlet oxygen on a daily basis
as well as to measure the air heater outlet oxygen content on a
continuous basis during testing
Digital read-out Thermocouples These pre-calibrated portable
instruments were used to measure the flue gas temperature at
predetermined representative points of the air heater outlet ducts
Digital display Vane Anemometer These pre-calibrated
instruments with correction figure graphs were used to measure the
air in-leakage into the furnace via the burner core air tubes during
testing
WetbulbDrybulb Thermometers These instruments were used to
measure the air intake temperatures into the furnace and to calculate
the relative humidity of the combustion air
Dual Limb Incline Manometers The total air flow was
calculated from basic principles and differential pressure
measurements taken with this manometer installation connected
to the total air measuring aerofoils (Figure 331) Compensation for
3 - 58
Figure 331 CROSS-SECTION OF MEASURING AEROFOIL
~ ~ ~
ltreg lt ~ J(Xh 150 r I nlaquo ~ oGtSSET
0 o
ltI
(I ) 8 cn Q
~
Q
pogt
-L I
g-OOx00lt8
q
5 iHK EJlO LAn Igt
Q 0
Q
SECTlCNAL ELEVATION V-V ~ CUT-Our IN ENO ATE
3 - 59
temperature relative humidity and Cd factor was done as explained in
sample calculation 2 Appendix A
Isokinetic Pulverised Fuel Sampler Isokinetic sampling is
achieved when the sampling velocity within the nozzle is equal to the
velocity in the immediate vicinity of the nozzle This is of
utmost importance for accurate evaluation of mill performance This
sampler and procedure (Appendix J) was used to sample the pf of a
representative mill on each test for particle size distribution
(Chapter 5) The mill optimisation and enhancement that preceded
these tests was also evaluated by this means (Chapter 4) since
particle size is of utmost importance in this project This equipment
included the drying oven and shaker with its sieves for the grading
process
Feed Water Flow High Pressure Orifice Plate The accuracy of the
mass flow of the working fluid is very important Since the STEP
calculations are very sensitive to feed water flow to the boiler a
special laboratory calibrated orifice plate was installed in a Sempell
block specifically designed to accommodate the plate (Figure 332)
Special high pressure transducers were employed with appropriate
conversion and correlation factors to produce accurate flow values
See sample calculation 4 (Appendix A)
3 - 60
Figure 332 FEED FLJ)W HIGH PRESSURE ORIFICE PLATE
w gt VI VI
e ~
oJ 10utl e 1c 0
3 - 61
Volumetric Coal feeders On the combustion side the coal flow is
very important The coal volume flow was measured by means of the
feeder integrators The feeder bars were set according to the
required dimensions and a correction factor was used to determine mass
flow from the volume flow obtained from the feeder integrators See
sample calculation 5 (Appendix A)
More perspective of the above preparations and measurements will be
discussed in chapter 4
3 7 COMPUfER SOFTWARE AND EFFICIENCY PROORAMS
There are three programs utilised by ESKOM for calculating thermal
efficiency or heat rates These programs will be discussed
functionally only highlighting their advantages and disadvantages
No programming or software details will be discussed
Firstly there is the PEPSE program (Performance Evaluation of Power
Station Efficiencies) This is a comprehensive heat rate calculating
program that can handle the smallest detail and process of plant Its
operating principle is that a process model can be built up to serve
as a reference Simulations can be run for certain variances of the
model eg what would the turbine cycle heat rate be if a HP feed
heater is bypassed or if the condenser cooling water temperature
changes by a certain amount The disadvantage of this program is that
3 - 62
it is very complex In order to obtain full benefit from this program
a person would have to be appointed on a full-time basis to utilise
the system and analyse results At first the PEPSE program was only
equipped for the turbine plant but it was recently expanded to include
the boiler At the time of writing it is being tested in the
evaluation of the unit in its entirety and not only in handling the
turbine and boiler as separate entities The PEPSE program is a very
good design tool to establish for example turbine plant design
specifications
The second program is based on BS2885 1974(9) This British Standard
is commonly used internationally and was used by ESKOM TRI at the time
of the Lethabo excess air reduction tests (Potgieter(Sraquo It was also
used to evaluate Guarantee Acceptance Testing of new units built by
contractors for ESKOM It is based on the losses or indirect method
It only addresses the boiler and not the turbine or the entire unit
The losses that can be measured are
- Combustibles in ash
- Radiation loss
- Sensible heat of water vapour
- Dry flue gas
- Wet flue gas
Moisture in combustion air
- Combustible (unburnt) gas
3 - 63
Although BS2885 deals with the last three losses to a greater extent
than does STEP which includes them in the unaccountable losses it
does not take into account certain other losses that STEP does This
program is the best for Guarantee testing where a specific efficiency
value is to be achieved using the indirect method by evaluating
specific losses stipulated in a specification
The third program is STEP (see nomenclature) It is used on every
thermal power station in ESKOM by plant performance personnel to
monitor and evaluate the hourly daily weekly or monthly thermal
performance of individual units as well as that of the station It
can also simulate performance in real time mode by entering for
example a series of hourly readings averaged as a snapshot It
operates on both the direct and indirect method simultaneously where
the unaccountable losses make up the difference between accounted
losses and 100 This is the best cross-controlling method to minimise
calculation and monitoring errors
STEP also calculates a sliding target for each loss and compares the
actual loss to the target to form a percentage STEP loss It
furthermore evaluates the boi ler turbine and entire unit
simultaneously The twelve most important losses measured are
3 - 64
Overall station
- Demineralised water make-up
- Auxiliary power
Turbine
- Condenser vacuum
- Final feed water temperature
- Main steam temperature
- Reheat steam temperature
Turbine deterioration (isentropic expansion efficiency)
Boiler
- Boiler radiation
- Mill rejects
- Hydrogen and fuel moisture
- Unburnt carbon
- Dry Flue gas
STEP has never before been used outside its original purpose of a
trending tool for evaluating plant history However it holds the
potential as being the best optimising tool presently available The
intention was to utilise STEP in these tests since it had already
proved itself in this mode during the Air Flow Optimisation tests
(Storm(2raquo
3 - 65
The main efficiency calculations of this project were performed by the
STEP system personal computer (PC) facility A model can be
constructed tuned and customised for a specific situation whereafter
simulation runs can be performed For the purposes of these tests
some modifications were made to the STEP formulae and targets The
compensation to dry flue gas loss due to dilution caused by air
in-leakage (sample calculation 3) and the compensation to unburnt
carbon energy due to varying ash quantity in coal were two such
formulae modifications The sliding targets of auxiliary power
consumption and dry flue gas loss proved to be erroneous and were also
corrected for the calculations of these tests
38 COAL AND TIlE BLENDING STOCKYARD
Due to its unique composition the Lethabo coal is just as important a
research topic as the plant itself The coal quality used for testing
in this project was extremely poor by international standards for
pulverised fuel technology The main reason for this is the higher
volatile matter of those coals compared to the Lethabo coal The low
volatile content of the Lethabo coal is one of the crucial matters
around which this project evolves The high ash percentage of this
coal also presents greater erosion problems in the boiler as well as
severe stack emission problems Fortunately however the ash
properties present relatively favourable clinkering characteristics
due to the high fusion temperatures The properties of the Lethabo
coal relative to other South African and European coals can be seen in
3 - 66
Table 32
Table 32 COMPARATIVE AIR DRIED COAL PROPERTIES
COAL IN SITU COAL RESERVES CONTRACTUAL COAL QUALITIES LETlIAlIO MATIMBA ORAl BROWII COAL PROPERTIES inillull ~aximum average minim aliul Base value (GUAR TEST) (RSA) (UK) (GERMANY)
--------------------------------------------------------__-------------_---__-------------------------------------------shyII II II II II II II II II II II II
CV (MJkg) II II 111 235 172 II
II 150 170 160 II II 152 201 264 200
II II
II II (total) II
II
Inherent loisture ~ II II 16 g6 59 II
II 70 150 125 II II 45 22 43 300
II II II II II II
Ash ~ II II 211 478 337 II
II 210 410 375 II II 37B 345 181 50
II II II II II II
Volat ile lIlat ter I II II 105 268 208 II
II 160 230 195 II II 211 272 I
I 289 440 II II II I II II II I
Filed carbon I II II
II II
II II 3667 3610 48 70 3600
II II I II 11 II I
Total carbon ~ II II
II II
II II 4375 4819 6439 6800
II II II II II II
Hydrogen ~ II II
II II
II II 283 359 416 500
II II II II II II
Ni trogen ~ II II
II II
II II 99 116 38 100
II 11 II II II II
Sulphur ~ II II 15 297 75 II
II II 59 109 126 50 II II II II II II
Carbonates ~ II 11
II II
II II 112 50
II II II II II II
OIygen I II II
II II
II II 960 815 591 2500
II II II II II II
Abrasiveness IgFekg 50 1095 237 II II 130 800 450 II
II II II II I II II II I
Ash fusion (lOT) nc II II 1210 1400 1390 II
II 1200 1400 1300 II II
I I 1400
II II II I II II II I
HIV ~ II II
II II
II II 2087 4094 3952 4096
II II II II II II
----------- -------------- -------------------------------------- ----------- _---------------- _---------_ __
From the values of CV ash and especially volatile matter (Table
32) it can be seen that the characteristics of the in situ coal
reserves of Lethabo Power Station span a very wide range from minimum
to maximum In general it is not feasible and in many aspects
3 - 67
impossible to design a power plant that can accommodate feed stock
with such a large variance It is therefore essential that coal
blending takes place before it enters the power station The coal
has to be blended for CVas main criterion with other prerequisites
for minimum or maximum values of ash volatile matter and moisture
etc These values form the contractual limits in Table 32 (see coal
contract(lOraquo)
The layout of the coal blending stockyard can be seen in Figure 333
The intention here is not for a detailed study of the stockyard but
rather to gain an overview and to take note of certain functions
thereof The entire coal supply side of Lethabo Power Station ie
New Vaal Mine consists of three functional areas The first is
referred to as the Pit which is an opencast mine and where the coal
under discussion originates in three relatively shallow seams The
raw coal is taken from these seams in approximate portions averaging
304 from the top seam 435 from the middle seam and 261 from the
bottom seam as per contract(lO) The coal enters the second area
which is referred to as the Plant by conveyor belt (North Eastern
side of Figure 333) About 40 of the coal undergoes beneficiation
(destoning) in a DMS (dense media separation) plant Mass meters
used for payment an assized bin for mass meter calibration and a
sampler for checking coal quality are also incorporated
3 - 68
I
Figure 333 COAL BLENDING STOCKYARD IN PLAN
i
I
3 - 69
The third area is the blending stockyard It consists of a Northern
and Southern compacted strategic stockpile In between these
stockpiles lie the live stockpiles where the coal is blended This is
basically achieved by means of three rail mounted mechanical
stacker-reclaimers The in-coming coal is stacked by either the
windrow or the chevron methods Both methods utilise the principle of
stacking the in-coming coal with different qualities in a horizontal
manner in layers and reclaiming it in a vertical manner thus taking a
certain ratio of coal at different qualities This quality is
pre-calculated to provide a quality within the range as per contract
On the outgoing side of the stockyard mass meters and a sampling plant
is also installed
There is also a facility for bypassing the blending yard in the
event of emergency coal demand from the power station This project
may also review minimum standards of coal quality during bypassing
actions
Figure 334 shows a functional flow diagram of the plant and blending
on the live stockpiles each of which can store almost one million
tons This project may also highlight the need for an on line coal
quality monitoring scanner or moisture analyser to predict certain
coal properties prior to entering the power station The original
facility was removed due to the unreliability of readings It should
be noted that at Lethabo the ratio between volatiles and CV of the
3 - 70
Figure 334 STOCKYARD COAL FLOW DIAGRAM
-----
~J---+---t-f IId
~-4--d IhJ
3 - 71
coal is not constant The results of present research and
development is anxiously being awaited There are no coal storage
staithes at Lethabo Each boiler is provided with a coal silo
holding 5550 tons which in turn serves six bunkers each of 800 tons
capacity one each per mill
The calculation and ordering of the coal for the tests will be
discussed in chapter 4 The low grade coal for these tests (low CV
low volatile type) is in abundance in the pit The intermediate coal
was blended in the normal supply mode However a problem arose with
the acquisition of high grade coal for this test Although the
required quality of high grade coal was available in the pit it did
not occur in large enough homogenous volumes to extract directly for
testing It was therefore decided to utilise the old Vaal coal
stockpile where almost a million tons of coal was available Vaal was
an old ESKOM power station which was recently decommissioned
Calculations (see chapter 4) established that the quality of this coal
was very close to the high grade required for the test It was also
more economical and practical to use this coal directly in unblended
form rather than the high grade coal from the pit Although the
coal was sold by ESKOM the negotiations were timeous enough to
recover an adequate quantity for testing
3 - 72
39 ELECTROSTATIC PRECIPITATORS
The Electrostatic Precipitators (ESP) were not to be tested as such
but varying air flow of the combustion process greatly influences ESP
performance Precipi tator efficiency decreases with increasing
gas velocity through the fields Although combustion was the main
criterion in this project cognisance was taken of the corresponding
changes in ESP performance and stack emissions
Due to the high percentage of ash in the Lethabo coal (sometimes over
40) this power station is equipped with one of the largest
precipitators in the world at the time of construction The following
are some design data for the Lethabo precipitators
Efficiency at 97 MCR Base value coal worst coal
All fields in service 9988 9986
One field out of service 9985 9981
Dust burden 30 gm3 30 gm3
Pressure drop 025 kPa
Temperature drop 11 degC
Gas velocity 12 mls
Inlet
Dust concentration 38 gm3 (actual)
Dust concentration 687 gm3 (standard)
Ash mass in 393 kgls
3 - 73
OUtlet
Dust concentration
Dust concentration
Ash mass out
construction (see Figures 335
Parallel casings
Series fields per pass
Plate height
Plate length
Aspect ratio
Plate area
Flow area
Specific collecting area
Transformerrectifiers
Sets
Output voltage
Output current
Output power
82 mgm3 (actual)
147 mgm3 (standard)
84 gs
336 and 337)
Four
Seven
148m
5m
24
190624 m2
817 m2
1916 sm
Per field Per boiler
28
35 kV 50 kV
476 A 1 A
5656 kW 1824 kW
3 - 74
Figure 335 GENERAL PRECIPITATOR CONSTRUcrION
3 - 75
Figure 336 SIDE VIEW OF PRECIPITATOR CASINGS
3 - 76
Figure 337 ARRANGEMENT OF PRECIPITATOR ELECTRODES AND RAPPERS
3 - 77
Typical ash analysis
Silicon (as Si02) 518
Aluminium (as A1203) 343
Iron (as Fe203) 35
Ti tanium (as TiOl) 17
Phosphorous (as P20S) 04
Calcium (as CaD) 46
Magnesium (as MgO) 12
Sodium (as Na20) 01
Potassium (as K20) 04
Sulphur (as S03) 01
Manganese (as MnO) 003
Unburnt carbon 03
An enhancement program was undertaken on the Lethabo precipitators
during 198990 This involved the retrofitting of microprocessor
controllers to all fields This resulted in reducing emission levels
especially under adverse conditions such as poor coal quality and
field outages These controllers also reduced the precipitator power
consumption from 42 MW to the 18 MW as stated above The
optimisation of rapper settings also served to reduce emission levels
3 - 78
Figure 338 PRECIPITATOR CORRELATION CURVE - UNIT 1
450
400
e 350 u
U1 en e
z 0
300
11U1 U1 I E 250 w I
jl I
~ U1 l a 200
150
100 I
I50
a ----
GART REltD [NG (Xl 0 10 20 30 40 50 60 70 80 I I I I I I
CURRENT (lIAl bull 0 2 4 S 8 10 12 14 16 I I I I I I I
OPT eM DENS tn (-] (] 2 4 6 8 12 14 I I I I I I I
STAOlt EXIT OPACIn tIl a 193 34S 474 57S 657 723 n7
3 - 79
The present environmental legislation in South Africa is based on two
requirements
- The total station mass emission per 31 days should not exceed 1200
tons of particulate emissions (ash) ie 200 tons per boiler
An opacity of 60 (250 mgm3 STP) may not be exceeded for more
than 8 hours Thereafter the specific unit should be deloaded to
bring the opacity below the limit
The above legislation is based on a correlation curve(ll) which shows
the relationship between percentage opacity and mass emission (Figure
338) A separate correlation curve is available for each individual
unit at Lethabo Power Station
The importance of the precipitators and the mass emission legislation
is the limitation that it can place on combustion air flow The
overall unit efficiency will be the main criterion but the above
emission limits can place an overruling restriction on any specific
air flow recommendation This will be of particular significance at
higher loads
3 - 80
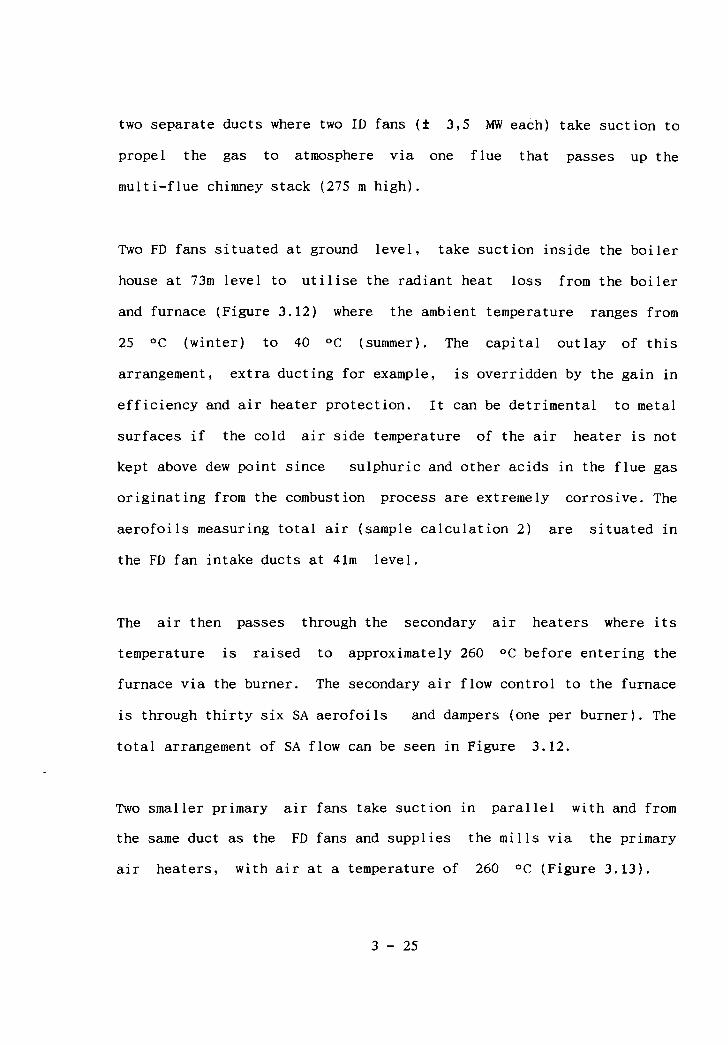