Embed Size (px)
Citation preview
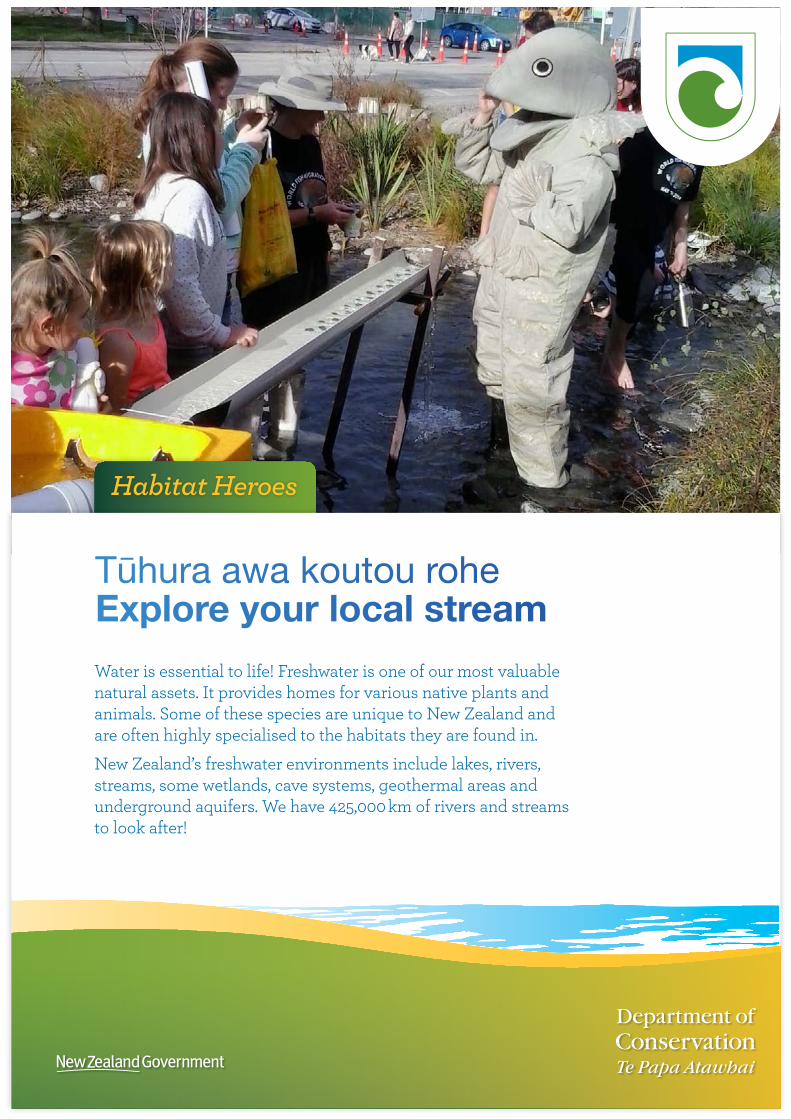
Habitat Heroes
Tūhura awa koutou rohe Explore your local streamWater is essential to life! Freshwater is one of our most valuable natural assets. It provides homes for various native plants and animals. Some of these species are unique to New Zealand and are often highly specialised to the habitats they are found in.
New Zealand’s freshwater environments include lakes, rivers, streams, some wetlands, cave systems, geothermal areas and underground aquifers. We have 425,000 km of rivers and streams to look after!

Introduction . . . . . . . . . . . . . . . . . . . . . . . . . . . . . . . . . . . . . . . . . . . . . . . . . . . . . . . . . . . . . . . . . . . . . . . . . . . . . . . . . . . . . . . . . . . . . . 1Detecting the health of a stream . . . . . . . . . . . . . . . . . . . . . . . . . . . . . . . . . . . . . . . . . . . . . . . . . . . . . . . . . . . . . 2
How to use this resource . . . . . . . . . . . . . . . . . . . . . . . . . . . . . . . . . . . . . . . . . . . . . . . . . . . . . . . . . . . . . . . . . . . . . . . . 3
Dive in: Introduction activity ideas . . . . . . . . . . . . . . . . . . . . . . . . . . . . . . . . . . . . . . . . . . . . . . . . . . . . . . 5Class discussion . . . . . . . . . . . . . . . . . . . . . . . . . . . . . . . . . . . . . . . . . . . . . . . . . . . . . . . . . . . . . . . . . . . . . . . . . . . . . . . . . . . . . . . . 5Determining the health of our local stream . . . . . . . . . . . . . . . . . . . . . . . . . . . . . . . . . . . . . . . . . 6Preparing for your stream investigation . . . . . . . . . . . . . . . . . . . . . . . . . . . . . . . . . . . . . . . . . . . . . . 7
Time to explore: Investigation activity ideas . . . . . . . . . . . . . . . . . . . . . . . . . . . . . . . . . . . . . 8Ensuring safe and fun exploration . . . . . . . . . . . . . . . . . . . . . . . . . . . . . . . . . . . . . . . . . . . . . . . . . . . . . . . . 8SMART tests . . . . . . . . . . . . . . . . . . . . . . . . . . . . . . . . . . . . . . . . . . . . . . . . . . . . . . . . . . . . . . . . . . . . . . . . . . . . . . . . . . . . . . . . . . . . . 9Who’s home? (Stream habitat observations) . . . . . . . . . . . . . . . . . . . . . . . . . . . . . . . . . . . . . .13Human impacts observation . . . . . . . . . . . . . . . . . . . . . . . . . . . . . . . . . . . . . . . . . . . . . . . . . . . . . . . . . . . . . . . .14
Sharing and presenting findings . . . . . . . . . . . . . . . . . . . . . . . . . . . . . . . . . . . . . . . . . . . . . . . . . . . . . . . 15
Planning for action: How can we improve the health of our local stream? . . . . . . . . . . . . . . . . . . . . . . . . . . . . . . . . . . . . . . . . . . . . . . . . . . . . . . . . . . . . . . . . . . . . . . . . . . . . . . . . . . . . . . . . . . . . . . . . . . . . .16Action ideas . . . . . . . . . . . . . . . . . . . . . . . . . . . . . . . . . . . . . . . . . . . . . . . . . . . . . . . . . . . . . . . . . . . . . . . . . . . . . . . . . . . . . . . . . . . . . . 17Going further . . . . . . . . . . . . . . . . . . . . . . . . . . . . . . . . . . . . . . . . . . . . . . . . . . . . . . . . . . . . . . . . . . . . . . . . . . . . . . . . . . . . . . . . . . 17
Activity sheets
Where in the World is our Water? . . . . . . . . . . . . . . . . . . . . . . . . . . . . . . . . . . . . . . . . . . . . . . . . . . . . . .18
The role of plants and algae in the catchment activity sheet . . . . . .19
Stream data collection sheet . . . . . . . . . . . . . . . . . . . . . . . . . . . . . . . . . . . . . . . . . . . . . . . . . . . . . . . . . . . . . . . .20Who’s home? (stream habitat observations) . . . . . . . . . . . . . . . . . . . . . . . . . . . . . . . . . . . . . .20Human impact observation . . . . . . . . . . . . . . . . . . . . . . . . . . . . . . . . . . . . . . . . . . . . . . . . . . . . . . . . . . . . . . . . . .20SMART tests . . . . . . . . . . . . . . . . . . . . . . . . . . . . . . . . . . . . . . . . . . . . . . . . . . . . . . . . . . . . . . . . . . . . . . . . . . . . . . . . . . . . . . . . . . . . 21
Critter identification card . . . . . . . . . . . . . . . . . . . . . . . . . . . . . . . . . . . . . . . . . . . . . . . . . . . . . . . . . . . . . . . . . . . . .23
Contents
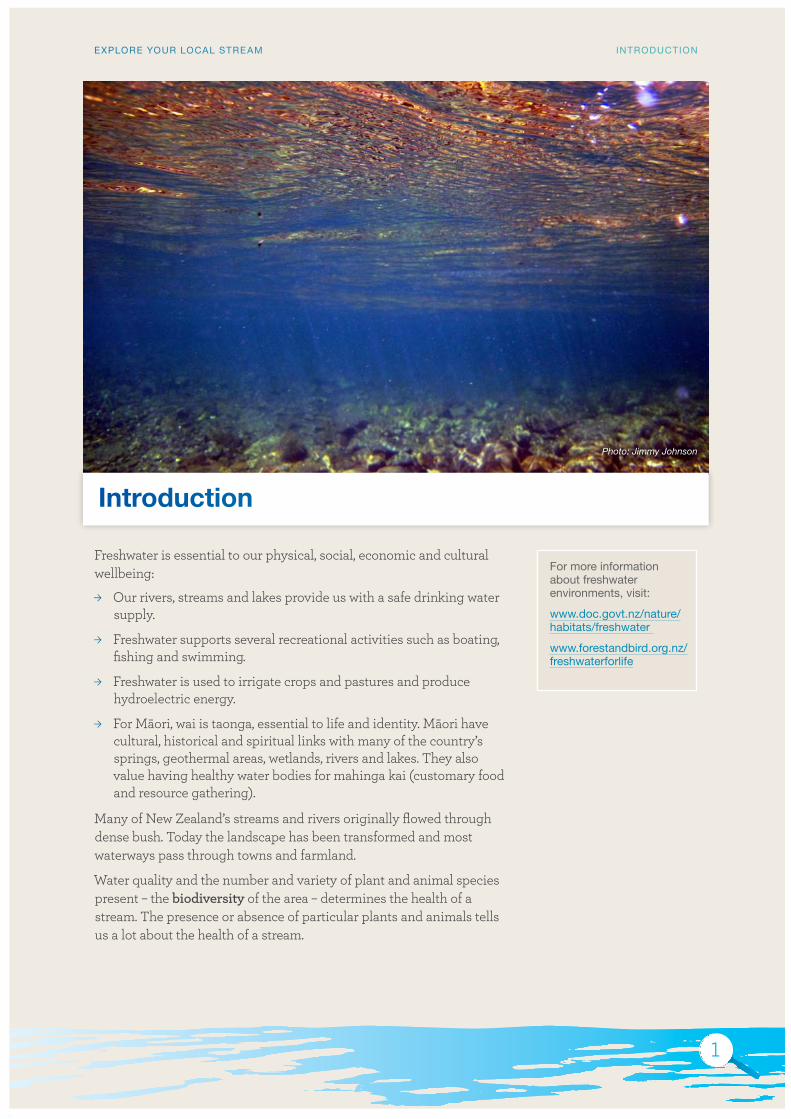
Photo: Jimmy Johnson
Freshwater is essential to our physical, social, economic and cultural wellbeing:
´ Our rivers, streams and lakes provide us with a safe drinking water supply.
´ Freshwater supports several recreational activities such as boating, fishing and swimming.
´ Freshwater is used to irrigate crops and pastures and produce hydroelectric energy.
´ For Māori, wai is taonga, essential to life and identity. Māori have cultural, historical and spiritual links with many of the country’s springs, geothermal areas, wetlands, rivers and lakes. They also value having healthy water bodies for mahinga kai (customary food and resource gathering).
Many of New Zealand’s streams and rivers originally flowed through dense bush. Today the landscape has been transformed and most waterways pass through towns and farmland.
Water quality and the number and variety of plant and animal species present – the biodiversity of the area – determines the health of a stream. The presence or absence of particular plants and animals tells us a lot about the health of a stream.
For more information about freshwater environments, visit:
www.doc.govt.nz/nature/habitats/freshwater
www.forestandbird.org.nz/freshwaterforlife
Introduction
1
EXPLORE YOUR LOCAL STRE AM INTRODUCTION
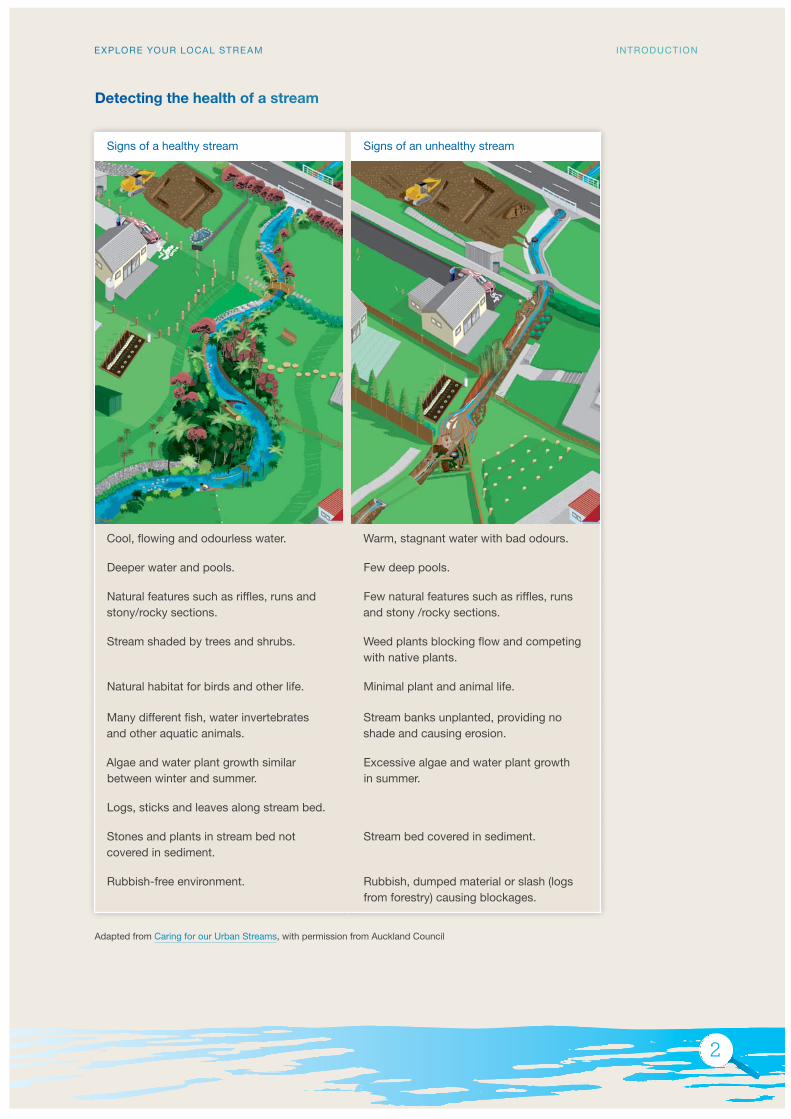
Signs of a healthy stream Signs of an unhealthy stream
Cool, flowing and odourless water. Warm, stagnant water with bad odours.
Deeper water and pools. Few deep pools.
Natural features such as riffles, runs and stony/rocky sections.
Few natural features such as riffles, runs and stony /rocky sections.
Stream shaded by trees and shrubs. Weed plants blocking flow and competing with native plants.
Natural habitat for birds and other life. Minimal plant and animal life.
Many different fish, water invertebrates and other aquatic animals.
Stream banks unplanted, providing no shade and causing erosion.
Algae and water plant growth similar between winter and summer.
Excessive algae and water plant growth in summer.
Logs, sticks and leaves along stream bed.
Stones and plants in stream bed not covered in sediment.
Stream bed covered in sediment.
Rubbish-free environment. Rubbish, dumped material or slash (logs from forestry) causing blockages.
Detecting the health of a stream
Adapted from Caring for our Urban Streams, with permission from Auckland Council
2
EXPLORE YOUR LOCAL STRE AM INTRODUCTION
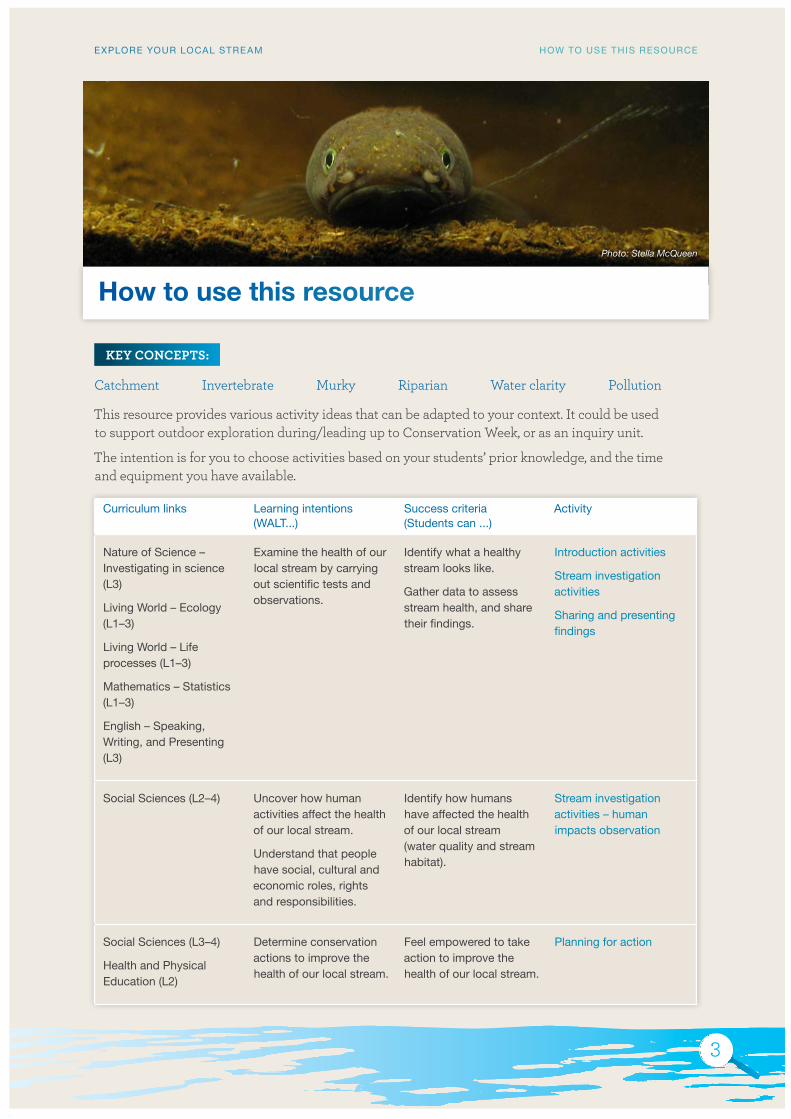
Photo: Stella McQueen
This resource provides various activity ideas that can be adapted to your context. It could be used to support outdoor exploration during/leading up to Conservation Week, or as an inquiry unit.
The intention is for you to choose activities based on your students’ prior knowledge, and the time and equipment you have available.
How to use this resource
Curriculum links Learning intentions (WALT...)
Success criteria (Students can ...)
Activity
Nature of Science – Investigating in science (L3)
Living World – Ecology (L1–3)
Living World – Life processes (L1–3)
Mathematics – Statistics (L1–3)
English – Speaking, Writing, and Presenting (L3)
Examine the health of our local stream by carrying out scientific tests and observations.
Identify what a healthy stream looks like.
Gather data to assess stream health, and share their findings.
Introduction activities
Stream investigation activities
Sharing and presenting findings
Social Sciences (L2–4) Uncover how human activities affect the health of our local stream.
Understand that people have social, cultural and economic roles, rights and responsibilities.
Identify how humans have affected the health of our local stream (water quality and stream habitat).
Stream investigation activities – human impacts observation
Social Sciences (L3–4)
Health and Physical Education (L2)
Determine conservation actions to improve the health of our local stream.
Feel empowered to take action to improve the health of our local stream.
Planning for action
Catchment Invertebrate Murky Riparian Water clarity Pollution
KEY CONCEPTS:
3
EXPLORE YOUR LOCAL STRE AM HOW TO USE THIS RESOURCE
Science Nature of Science – Investigating in science ´ Ask questions, find evidence, explore simple models and carry out
appropriate investigations to develop simple explanations. (L3)
Living World – Ecology ´ Recognise that living things are suited to their particular habitat. (L1–2)
´ Explain how living things are suited to their particular habitat and how they respond to environmental changes, both natural and human-induced. (L3)
Living World – Life processes ´ Recognise that all living things have certain requirements so they can
stay alive. (L1–2)
´ Recognise that there are life processes common to all living things and that these occur in different ways. (L3)
Mathematics Statistics ´ Conduct investigations using the statistical enquiry cycle. (L1–3)
English Speaking, Writing, and Presenting ´ Integrate sources of information, processes and strategies with
developing confidence to identify, form and express ideas. (L3)
Social Sciences ´ Understand how people view and use places differently. (L3)
´ Understand that events have causes and effects. (L4)
Health and Physical Education
Healthy Communities and Environments – Societal attitudes and values ´ Explore how people’s attitudes, values and actions contribute to healthy
physical and social environments. (L2)
Photo: Sjaan Bowie
4
EXPLORE YOUR LOCAL STRE AM HOW TO USE THIS RESOURCE
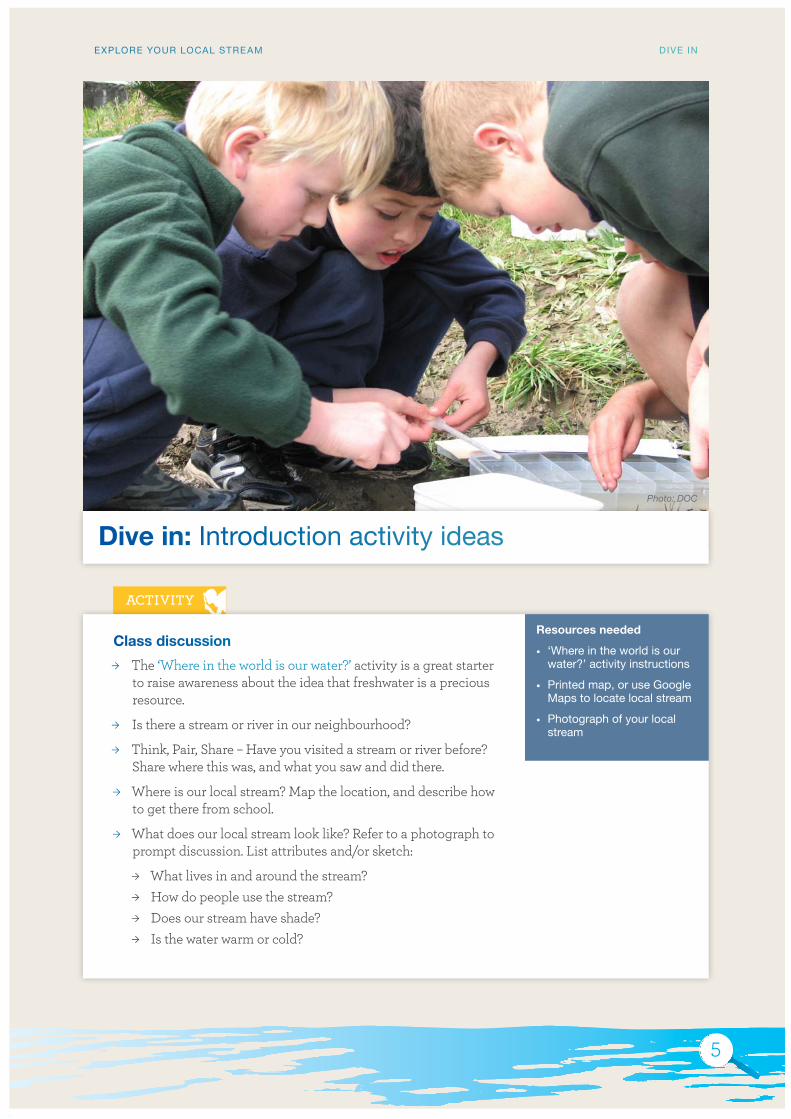
Class discussion
´ The ‘Where in the world is our water?’ activity is a great starter to raise awareness about the idea that freshwater is a precious resource.
´ Is there a stream or river in our neighbourhood?
´ Think, Pair, Share – Have you visited a stream or river before? Share where this was, and what you saw and did there.
´ Where is our local stream? Map the location, and describe how to get there from school.
´ What does our local stream look like? Refer to a photograph to prompt discussion. List attributes and/or sketch:
´ What lives in and around the stream? ´ How do people use the stream? ´ Does our stream have shade? ´ Is the water warm or cold?
Resources needed
• ‘Where in the world is our water?’ activity instructions
• Printed map, or use Google Maps to locate local stream
• Photograph of your local stream
Dive in: Introduction activity ideas
Photo: DOC
5
EXPLORE YOUR LOCAL STRE AM DIVE IN
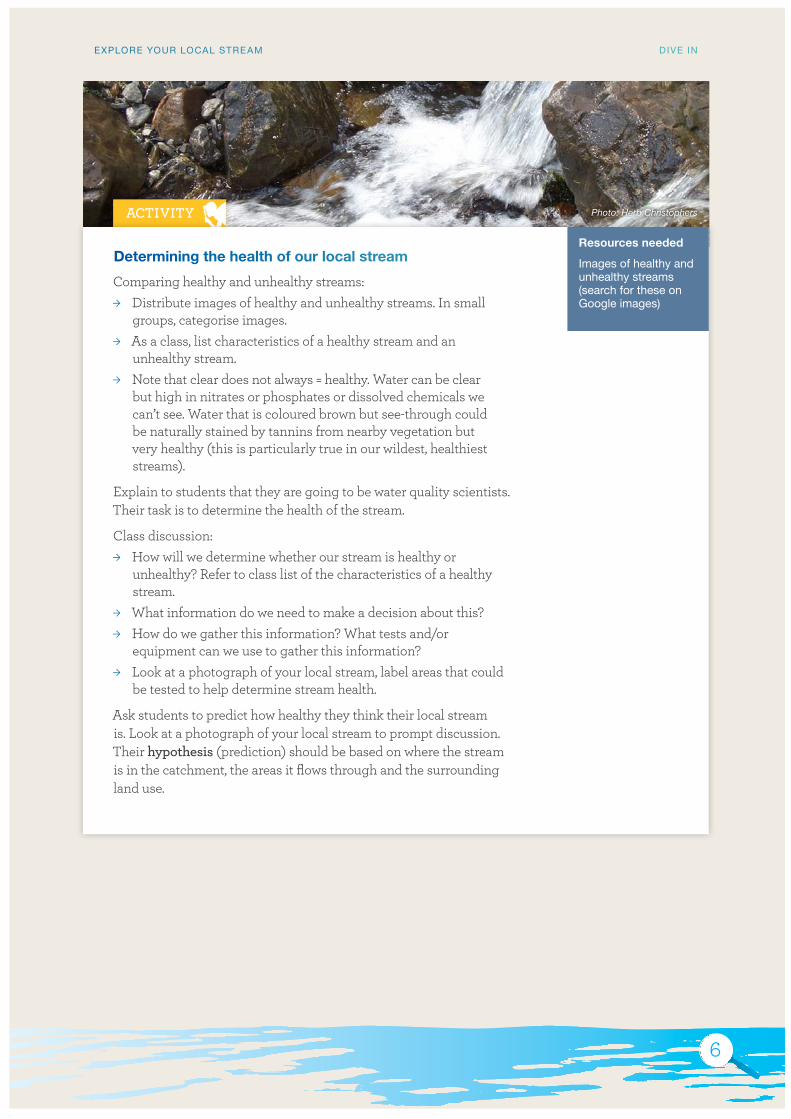
Photo: Herb Christophers
Determining the health of our local stream
Comparing healthy and unhealthy streams: ´ Distribute images of healthy and unhealthy streams. In small
groups, categorise images. ´ As a class, list characteristics of a healthy stream and an
unhealthy stream. ´ Note that clear does not always = healthy. Water can be clear
but high in nitrates or phosphates or dissolved chemicals we can’t see. Water that is coloured brown but see-through could be naturally stained by tannins from nearby vegetation but very healthy (this is particularly true in our wildest, healthiest streams).
Explain to students that they are going to be water quality scientists. Their task is to determine the health of the stream.
Class discussion: ´ How will we determine whether our stream is healthy or
unhealthy? Refer to class list of the characteristics of a healthy stream.
´ What information do we need to make a decision about this? ´ How do we gather this information? What tests and/or
equipment can we use to gather this information? ´ Look at a photograph of your local stream, label areas that could
be tested to help determine stream health.
Ask students to predict how healthy they think their local stream is. Look at a photograph of your local stream to prompt discussion. Their hypothesis (prediction) should be based on where the stream is in the catchment, the areas it flows through and the surrounding land use.
Resources needed
Images of healthy and unhealthy streams (search for these on Google images)
6
EXPLORE YOUR LOCAL STRE AM DIVE IN
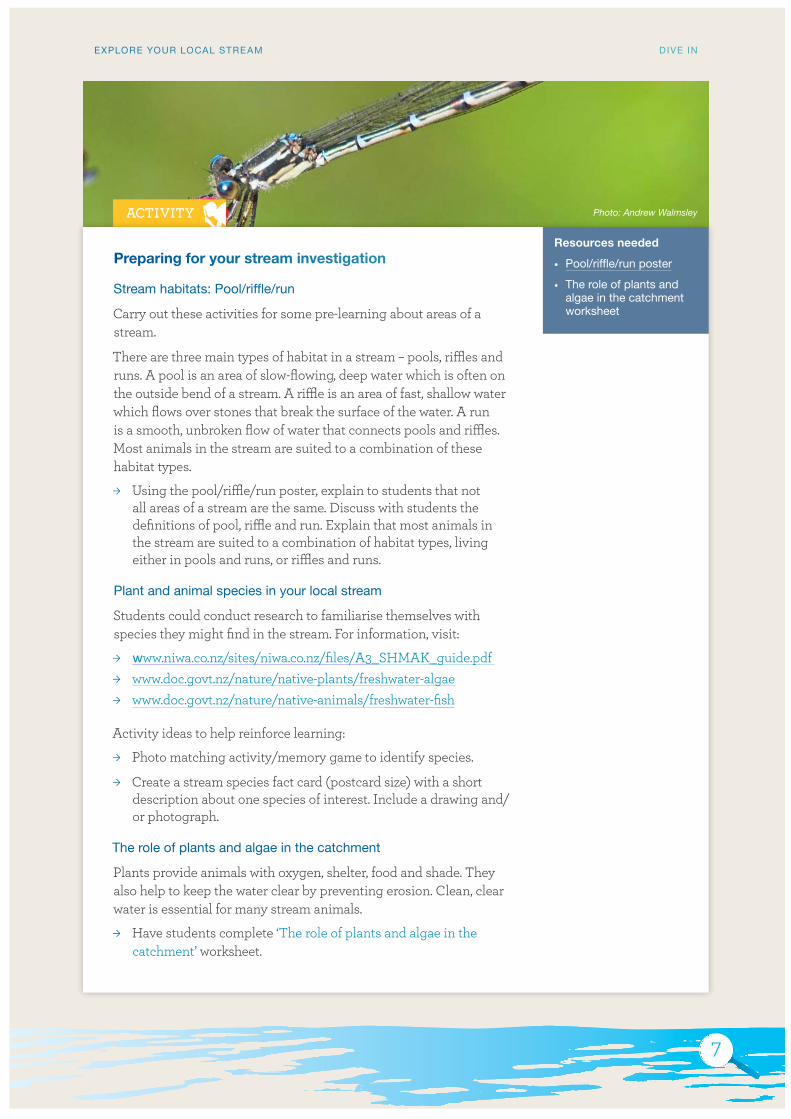
Photo: Andrew Walmsley
Preparing for your stream investigation
Stream habitats: Pool/riffle/run
Carry out these activities for some pre-learning about areas of a stream.
There are three main types of habitat in a stream – pools, riffles and runs. A pool is an area of slow-flowing, deep water which is often on the outside bend of a stream. A riffle is an area of fast, shallow water which flows over stones that break the surface of the water. A run is a smooth, unbroken flow of water that connects pools and riffles. Most animals in the stream are suited to a combination of these habitat types.
´ Using the pool/riffle/run poster, explain to students that not all areas of a stream are the same. Discuss with students the definitions of pool, riffle and run. Explain that most animals in the stream are suited to a combination of habitat types, living either in pools and runs, or riffles and runs.
Plant and animal species in your local stream
Students could conduct research to familiarise themselves with species they might find in the stream. For information, visit:
´ www.niwa.co.nz/sites/niwa.co.nz/files/A3_SHMAK_guide.pdf ´ www.doc.govt.nz/nature/native-plants/freshwater-algae ´ www.doc.govt.nz/nature/native-animals/freshwater-fish
Activity ideas to help reinforce learning:
´ Photo matching activity/memory game to identify species.
´ Create a stream species fact card (postcard size) with a short description about one species of interest. Include a drawing and/or photograph.
The role of plants and algae in the catchment
Plants provide animals with oxygen, shelter, food and shade. They also help to keep the water clear by preventing erosion. Clean, clear water is essential for many stream animals.
´ Have students complete ‘The role of plants and algae in the catchment’ worksheet.
Resources needed
• Pool/riffle/run poster
• The role of plants and algae in the catchment worksheet
7
EXPLORE YOUR LOCAL STRE AM DIVE IN
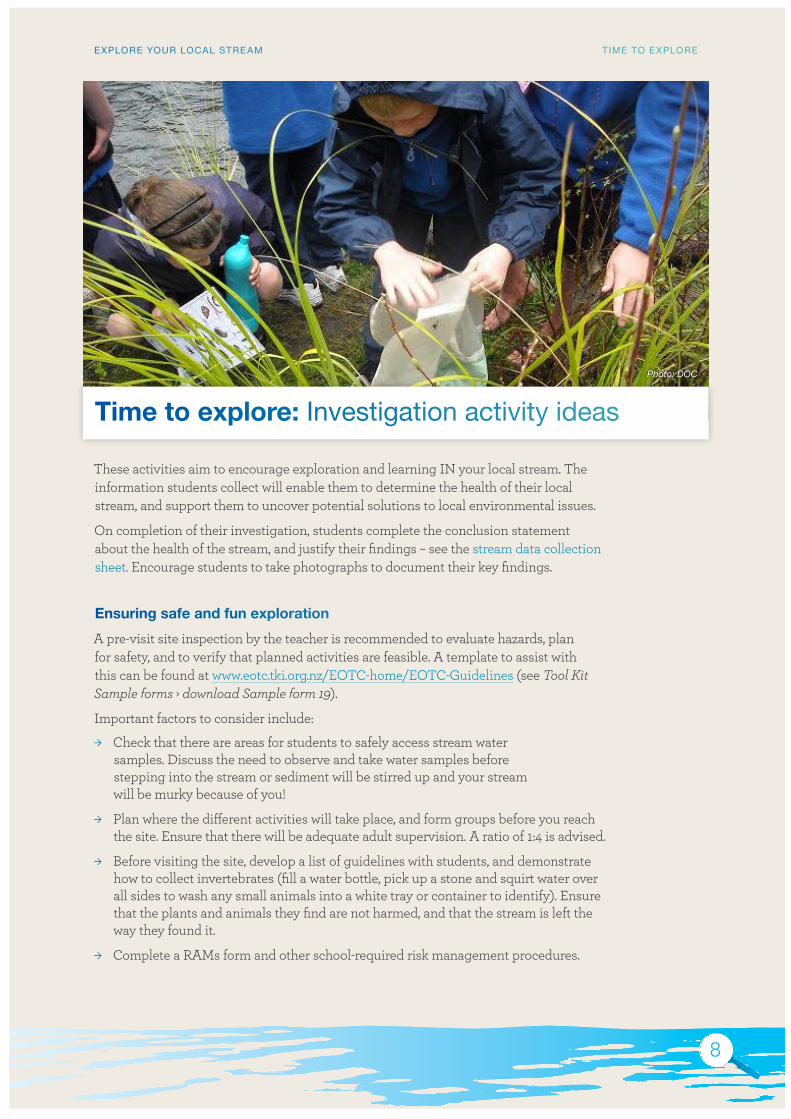
Photo: DOC
These activities aim to encourage exploration and learning IN your local stream. The information students collect will enable them to determine the health of their local stream, and support them to uncover potential solutions to local environmental issues.
On completion of their investigation, students complete the conclusion statement about the health of the stream, and justify their findings – see the stream data collection sheet. Encourage students to take photographs to document their key findings.
Ensuring safe and fun exploration
A pre-visit site inspection by the teacher is recommended to evaluate hazards, plan for safety, and to verify that planned activities are feasible. A template to assist with this can be found at www.eotc.tki.org.nz/EOTC-home/EOTC-Guidelines (see Tool Kit Sample forms › download Sample form 19).
Important factors to consider include:
´ Check that there are areas for students to safely access stream water samples. Discuss the need to observe and take water samples before stepping into the stream or sediment will be stirred up and your stream will be murky because of you!
´ Plan where the different activities will take place, and form groups before you reach the site. Ensure that there will be adequate adult supervision. A ratio of 1:4 is advised.
´ Before visiting the site, develop a list of guidelines with students, and demonstrate how to collect invertebrates (fill a water bottle, pick up a stone and squirt water over all sides to wash any small animals into a white tray or container to identify). Ensure that the plants and animals they find are not harmed, and that the stream is left the way they found it.
´ Complete a RAMs form and other school-required risk management procedures.
Time to explore: Investigation activity ideas
8
EXPLORE YOUR LOCAL STRE AM TIME TO EXPLORE
9
EXPLORE YOUR LOCAL STRE AM TIME TO EXPLORE
SMART tests
Use SMART to remember the areas of the stream to test to collect useful information about stream health:
S tream bed M argin (stream bank) A ppearance (water clarity) R ate T emperature
Stream bed (5 minutes)
The stream bed observation is a visual assessment. The stream bed has a major influence on what can live in the stream. Many aquatic animals rely on stony stream beds, where they live on and in between the stones. If there are significant changes in the catchment (e.g. earthworks or deforestation) the stream bed can become covered in sediment. Sediment reduces water clarity, which can make the stream bed an unsuitable habitat for aquatic animals.
´ Is the stream bed made up of large stones, smaller bits of gravel, or mud and sand?
The algae observation is a visual assessment of the algae growing on the stones in the stream bed. Algae are very important to many invertebrates. They graze on short algae as their main food source, but can’t eat it when it gets too thick. Too much nutrients in the water (e.g. agriculture runoff) and too much sunlight (lack of stream shading) can cause algae to grow. Algae smothering the stream bed reduces habitat for mayflies, caddisflies and banded kōkopu. Also, decaying algae in the stream uses up the oxygen that mayflies and caddisflies depend on.
´ Observe whether algae are growing on the stones in the stream bed.
Margin (stream bank) (5 minutes)
The stream shading observation is a visual assessment of plants and trees shading the stream. Vegetation shading the stream reduces water temperature extremes, and falling leaves from native species are a year-round food source for aquatic invertebrates. Shading by native trees is very important to the health of the stream. Exotic, deciduous trees are not palatable for aquatic invertebrates, and they lose all their leaves at once, which then decompose, reducing oxygen levels in the water.
´ Take note of the types of plant species planted along the stream bank – are they native or exotic? (Use Andrew Crowe’s flipcharts or books to help identify these.)
The bank stability observation is a visual assessment of how effectively plants are holding the stream banks together. Bank stability is provided naturally by trees and plants. Root systems hold the banks together, and limit the amount of sediment and other polluting materials entering the stream.
1. Look for signs of erosion and rubbish along the stream bank.
2. Collect rubbish along the stream after all tests are complete.
3. Reflect – How did the rubbish get there? What could be done to prevent this happening again?
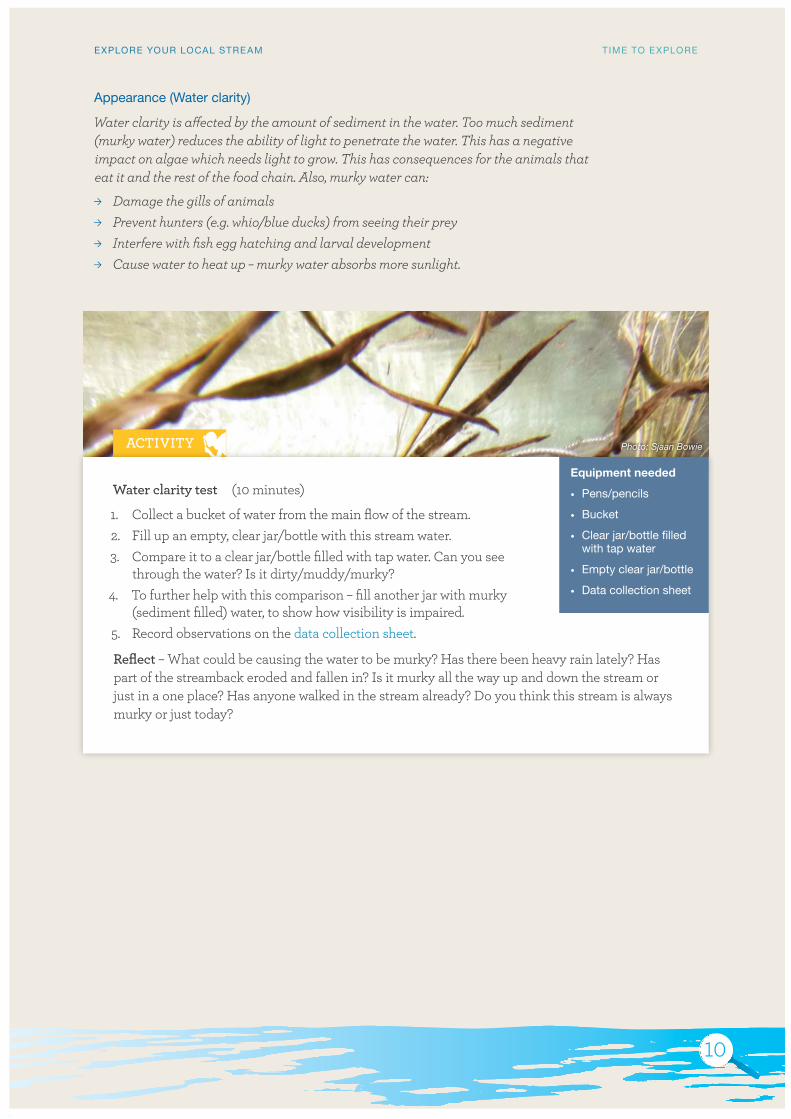
Photo: Sjaan Bowie
10
EXPLORE YOUR LOCAL STRE AM TIME TO EXPLORE
Appearance (Water clarity)
Water clarity is affected by the amount of sediment in the water. Too much sediment (murky water) reduces the ability of light to penetrate the water. This has a negative impact on algae which needs light to grow. This has consequences for the animals that eat it and the rest of the food chain. Also, murky water can:
´ Damage the gills of animals ´ Prevent hunters (e.g. whio/blue ducks) from seeing their prey ´ Interfere with fish egg hatching and larval development ´ Cause water to heat up – murky water absorbs more sunlight.
Water clarity test (10 minutes)
1. Collect a bucket of water from the main flow of the stream.2. Fill up an empty, clear jar/bottle with this stream water. 3. Compare it to a clear jar/bottle filled with tap water. Can you see
through the water? Is it dirty/muddy/murky? 4. To further help with this comparison – fill another jar with murky
(sediment filled) water, to show how visibility is impaired.5. Record observations on the data collection sheet.
Reflect – What could be causing the water to be murky? Has there been heavy rain lately? Has part of the streamback eroded and fallen in? Is it murky all the way up and down the stream or just in a one place? Has anyone walked in the stream already? Do you think this stream is always murky or just today?
Equipment needed
• Pens/pencils
• Bucket
• Clear jar/bottle filled with tap water
• Empty clear jar/bottle
• Data collection sheet
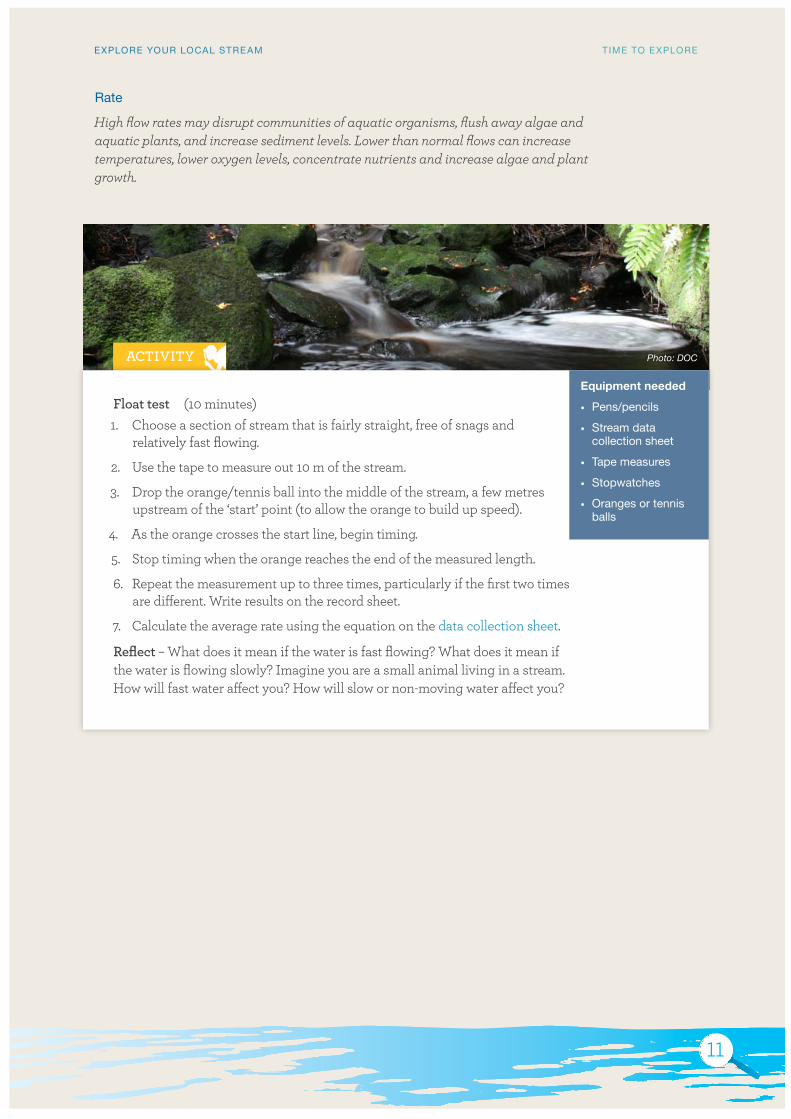
Rate
High flow rates may disrupt communities of aquatic organisms, flush away algae and aquatic plants, and increase sediment levels. Lower than normal flows can increase temperatures, lower oxygen levels, concentrate nutrients and increase algae and plant growth.
Photo: DOC
11
EXPLORE YOUR LOCAL STRE AM TIME TO EXPLORE
Float test (10 minutes)1. Choose a section of stream that is fairly straight, free of snags and
relatively fast flowing.
2. Use the tape to measure out 10 m of the stream.
3. Drop the orange/tennis ball into the middle of the stream, a few metres upstream of the ‘start’ point (to allow the orange to build up speed).
4. As the orange crosses the start line, begin timing.
5. Stop timing when the orange reaches the end of the measured length.
6. Repeat the measurement up to three times, particularly if the first two times are different. Write results on the record sheet.
7. Calculate the average rate using the equation on the data collection sheet.
Reflect – What does it mean if the water is fast flowing? What does it mean if the water is flowing slowly? Imagine you are a small animal living in a stream. How will fast water affect you? How will slow or non-moving water affect you?
Equipment needed
• Pens/pencils
• Stream data collection sheet
• Tape measures
• Stopwatches
• Oranges or tennis balls
12
EXPLORE YOUR LOCAL STRE AM TIME TO EXPLORE
Photo: DOC
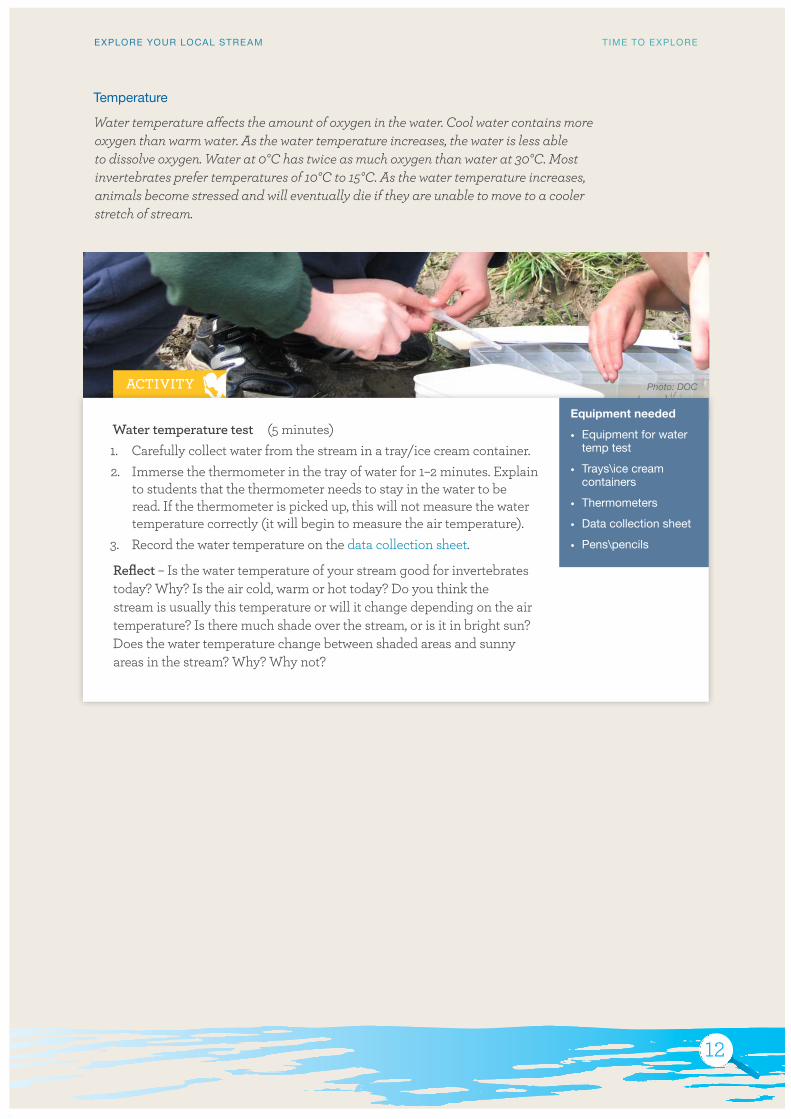
Water temperature test (5 minutes)1. Carefully collect water from the stream in a tray/ice cream container.2. Immerse the thermometer in the tray of water for 1–2 minutes. Explain
to students that the thermometer needs to stay in the water to be read. If the thermometer is picked up, this will not measure the water temperature correctly (it will begin to measure the air temperature).
3. Record the water temperature on the data collection sheet.
Reflect – Is the water temperature of your stream good for invertebrates today? Why? Is the air cold, warm or hot today? Do you think the stream is usually this temperature or will it change depending on the air temperature? Is there much shade over the stream, or is it in bright sun? Does the water temperature change between shaded areas and sunny areas in the stream? Why? Why not?
Equipment needed
• Equipment for water temp test
• Trays\ice cream containers
• Thermometers
• Data collection sheet
• Pens\pencils
Temperature
Water temperature affects the amount of oxygen in the water. Cool water contains more oxygen than warm water. As the water temperature increases, the water is less able to dissolve oxygen. Water at 0°C has twice as much oxygen than water at 30°C. Most invertebrates prefer temperatures of 10°C to 15°C. As the water temperature increases, animals become stressed and will eventually die if they are unable to move to a cooler stretch of stream.
13
EXPLORE YOUR LOCAL STRE AM TIME TO EXPLORE
Photo: Shellie Evans
Equipment needed
• Pens/pencils
• Stream data collection sheet
• Trays or ice cream containers
• Water bottles
• Printed copies of the Critter Identification Card
• Magnifying glasses (optional)
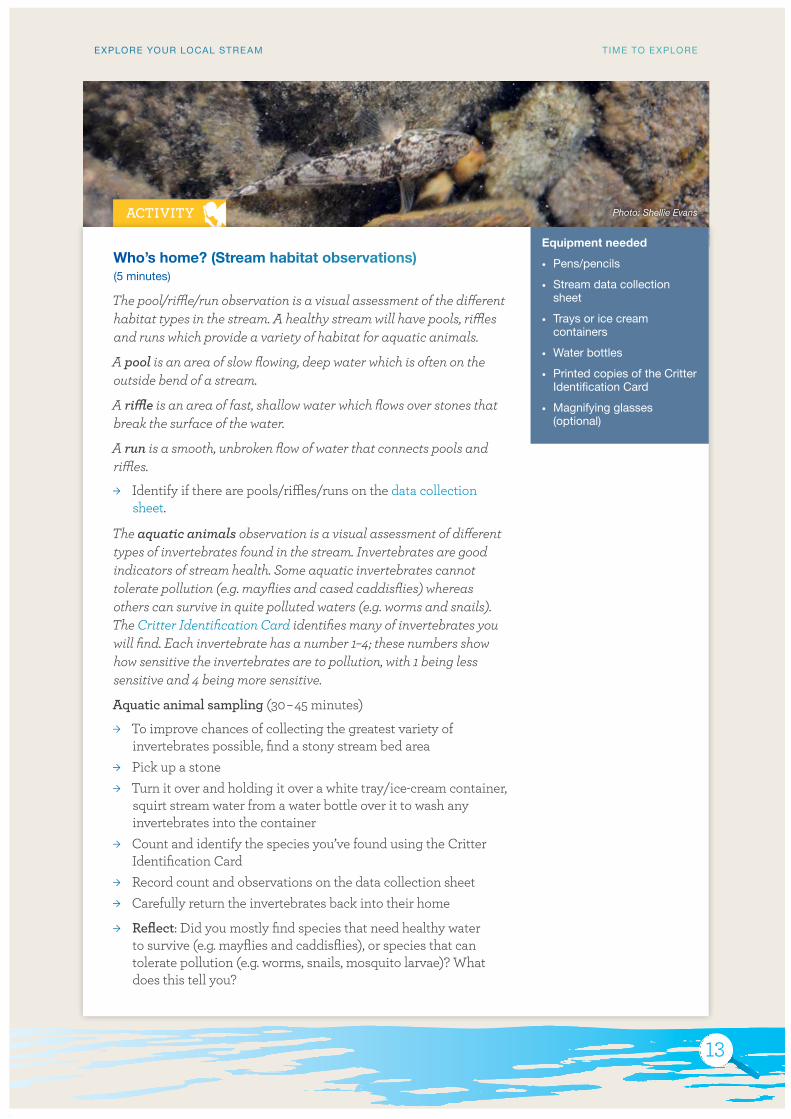
Who’s home? (Stream habitat observations) (5 minutes)
The pool/riffle/run observation is a visual assessment of the different habitat types in the stream. A healthy stream will have pools, riffles and runs which provide a variety of habitat for aquatic animals.
A pool is an area of slow flowing, deep water which is often on the outside bend of a stream.
A riffle is an area of fast, shallow water which flows over stones that break the surface of the water.
A run is a smooth, unbroken flow of water that connects pools and riffles.
´ Identify if there are pools/riffles/runs on the data collection sheet.
The aquatic animals observation is a visual assessment of different types of invertebrates found in the stream. Invertebrates are good indicators of stream health. Some aquatic invertebrates cannot tolerate pollution (e.g. mayflies and cased caddisflies) whereas others can survive in quite polluted waters (e.g. worms and snails). The Critter Identification Card identifies many of invertebrates you will find. Each invertebrate has a number 1–4; these numbers show how sensitive the invertebrates are to pollution, with 1 being less sensitive and 4 being more sensitive.
Aquatic animal sampling (30 – 45 minutes)
´ To improve chances of collecting the greatest variety of invertebrates possible, find a stony stream bed area
´ Pick up a stone ´ Turn it over and holding it over a white tray/ice-cream container,
squirt stream water from a water bottle over it to wash any invertebrates into the container
´ Count and identify the species you’ve found using the Critter Identification Card
´ Record count and observations on the data collection sheet ´ Carefully return the invertebrates back into their home
´ Reflect: Did you mostly find species that need healthy water to survive (e.g. mayflies and caddisflies), or species that can tolerate pollution (e.g. worms, snails, mosquito larvae)? What does this tell you?
EXPLORE YOUR LOCAL STRE AM
14
Photo: DOC
Sources:
Auckland Council WaiCare (2003), Field Manual
Greater Wellington Regional Council (2012), Take Action for Water resources
Greater Wellington Regional Council (2015), Guide for monitoring stream health.
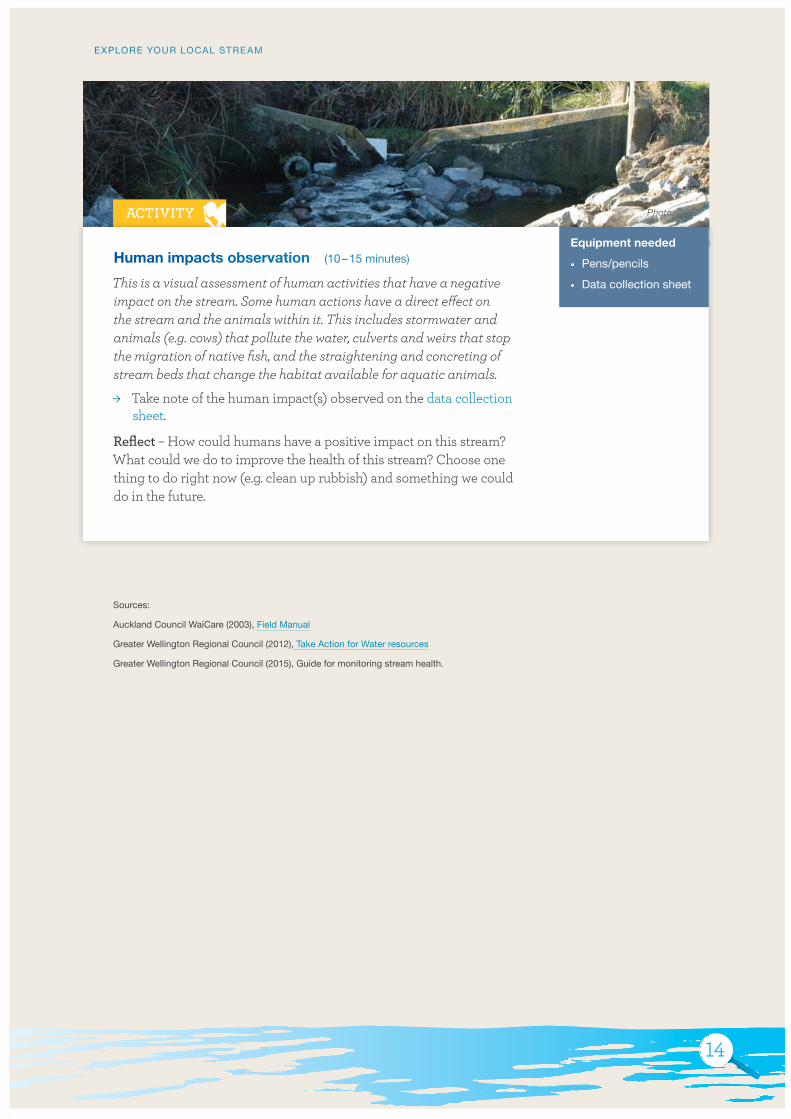
Human impacts observation (10 – 15 minutes)
This is a visual assessment of human activities that have a negative impact on the stream. Some human actions have a direct effect on the stream and the animals within it. This includes stormwater and animals (e.g. cows) that pollute the water, culverts and weirs that stop the migration of native fish, and the straightening and concreting of stream beds that change the habitat available for aquatic animals.
´ Take note of the human impact(s) observed on the data collection sheet.
Reflect – How could humans have a positive impact on this stream? What could we do to improve the health of this stream? Choose one thing to do right now (e.g. clean up rubbish) and something we could do in the future.
Equipment needed
• Pens/pencils
• Data collection sheet
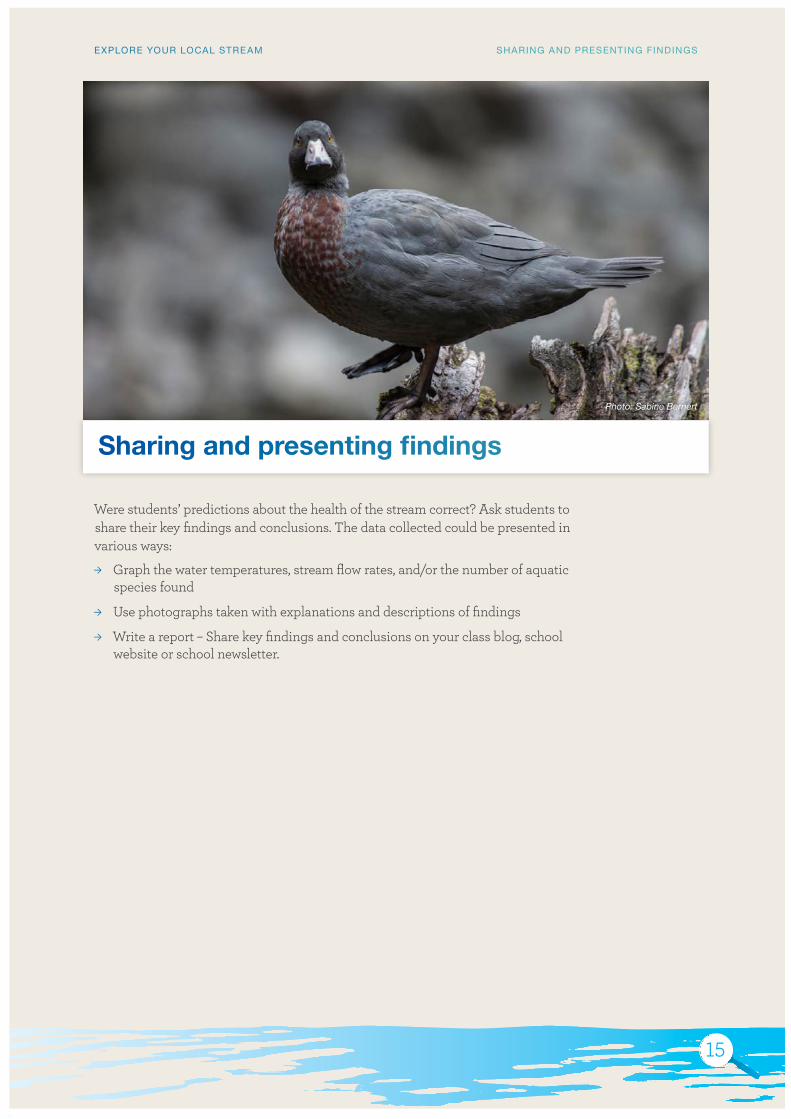
Photo: Sabine Bernert
15
EXPLORE YOUR LOCAL STRE AM SHARING AND PRESENTING FINDINGS
Were students’ predictions about the health of the stream correct? Ask students to share their key findings and conclusions. The data collected could be presented in various ways:
´ Graph the water temperatures, stream flow rates, and/or the number of aquatic species found
´ Use photographs taken with explanations and descriptions of findings
´ Write a report – Share key findings and conclusions on your class blog, school website or school newsletter.
Sharing and presenting findings
16
EXPLORE YOUR LOCAL STRE AM PL ANNING FOR ACTION
Photo: DOC
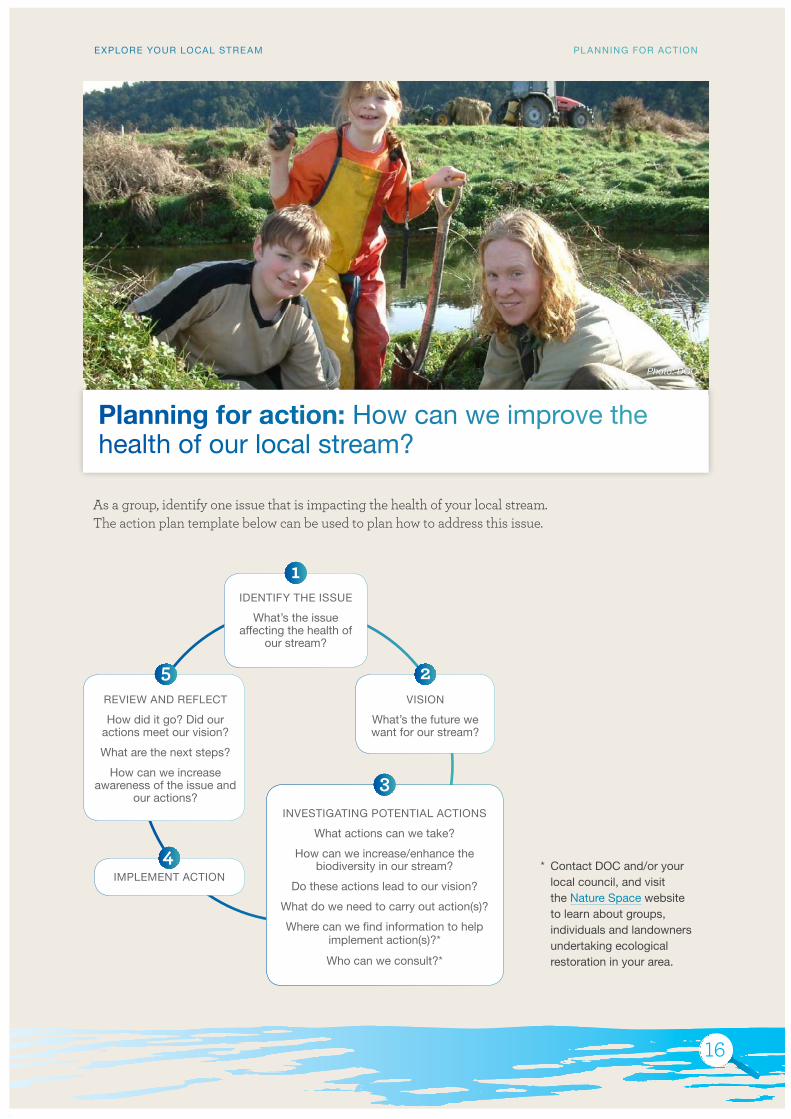
As a group, identify one issue that is impacting the health of your local stream. The action plan template below can be used to plan how to address this issue.
Planning for action: How can we improve the health of our local stream?
* Contact DOC and/or your local council, and visit the Nature Space website to learn about groups, individuals and landowners undertaking ecological restoration in your area.
IDENTIFY THE ISSUE
What’s the issue affecting the health of
our stream?
INVESTIGATING POTENTIAL ACTIONS
What actions can we take?
How can we increase/enhance the biodiversity in our stream?
Do these actions lead to our vision?
What do we need to carry out action(s)?
Where can we find information to help implement action(s)?*
Who can we consult?*
VISION
What’s the future we want for our stream?
REVIEW AND REFLECT
How did it go? Did our actions meet our vision?
What are the next steps?
How can we increase awareness of the issue and
our actions?
IMPLEMENT ACTION
17
EXPLORE YOUR LOCAL STRE AM PL ANNING FOR ACTION
Action ideas
´ Riparian planting – planting native plants along a stream bank stabilises the bank from erosion, creates a cool, shaded environment for wildlife to thrive, and filters toxins entering the stream. Go to www.loveyourwater.org.
´ A fun way to raise awareness about stormwater drains is to do some drain art. Drain art is where a picture or a sign is placed near a drain to remind people that what goes down the drain goes into streams and then into the ocean. Check with your local council first.
Going further
Education resources and programmes to support further learning about, and exploration in your local freshwater environments include:
´ Freshwater board and card games – Learn about New Zealand’s wonderful freshwater ecosystems with these great board and card games brought to you by Hastings Central School.
´ Alpha Series, Royal Society of New Zealand (2012), Issue 117: New Zealand Streams and Rivers includes information about the top four human activities affecting the health of our waterways, and case studies about successful stream restoration projects.
´ Whitebait Connection (WBC) programme – WBC is a non-profit action-based community conservation programme that facilitates exploration in local waterways, and supports schools to take action to improve the health of local waterways.
´ Cultural Health Index (Appendix 4 pg 42) offers a way for iwi to evaluate the health of streams and rivers within their rohe that expresses and accommodates their values and beliefs while at the same time enabling effective use of scientific methods such as macroinvertebrate sampling.
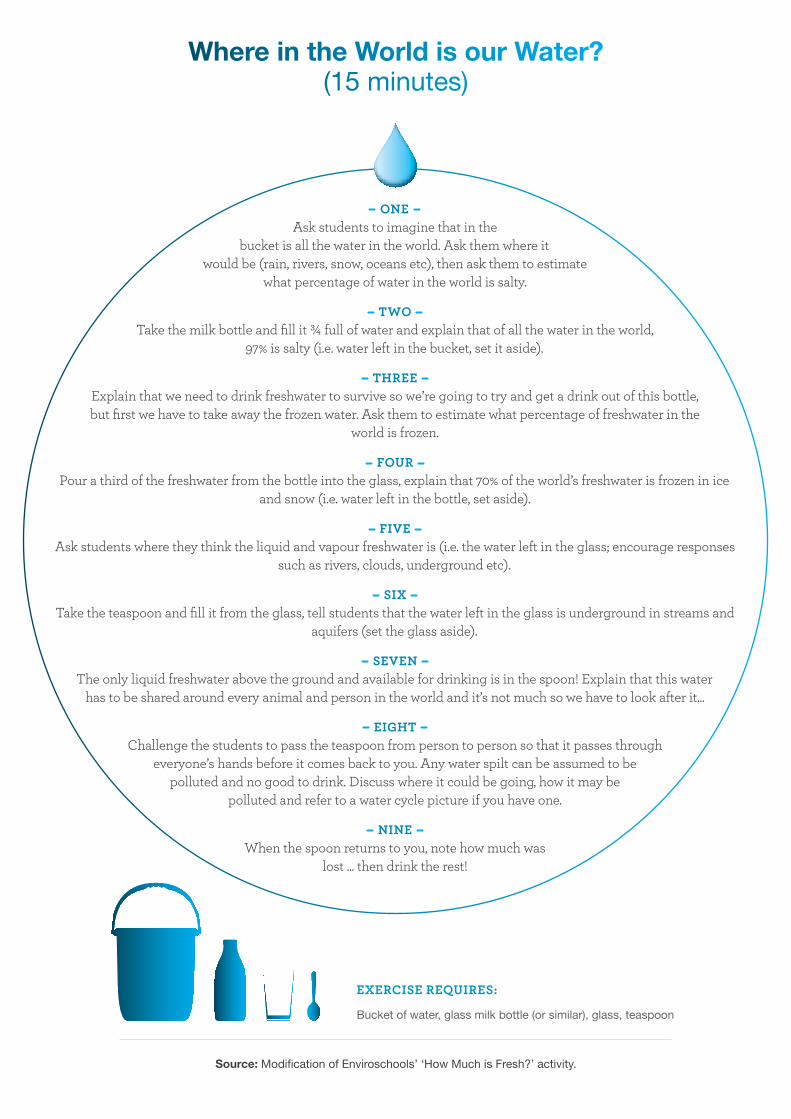
ONE Ask students to imagine that in the
bucket is all the water in the world. Ask them where it would be (rain, rivers, snow, oceans etc), then ask them to estimate
what percentage of water in the world is salty.
TWO Take the milk bottle and fill it ¾ full of water and explain that of all the water in the world,
97% is salty (i.e. water left in the bucket, set it aside).
THREE Explain that we need to drink freshwater to survive so we’re going to try and get a drink out of this bottle, but first we have to take away the frozen water. Ask them to estimate what percentage of freshwater in the
world is frozen.
FOUR Pour a third of the freshwater from the bottle into the glass, explain that 70% of the world’s freshwater is frozen in ice
and snow (i.e. water left in the bottle, set aside).
FIVE Ask students where they think the liquid and vapour freshwater is (i.e. the water left in the glass; encourage responses
such as rivers, clouds, underground etc).
SIX Take the teaspoon and fill it from the glass, tell students that the water left in the glass is underground in streams and
aquifers (set the glass aside).
SEVEN The only liquid freshwater above the ground and available for drinking is in the spoon! Explain that this water
has to be shared around every animal and person in the world and it’s not much so we have to look after it...
EIGHT Challenge the students to pass the teaspoon from person to person so that it passes through
everyone’s hands before it comes back to you. Any water spilt can be assumed to be polluted and no good to drink. Discuss where it could be going, how it may be
polluted and refer to a water cycle picture if you have one.
NINE When the spoon returns to you, note how much was
lost ... then drink the rest!
Source: Modification of Enviroschools’ ‘How Much is Fresh?’ activity.
Where in the World is our Water? (15 minutes)
EXERCISE REQUIRES:
Bucket of water, glass milk bottle (or similar), glass, teaspoon
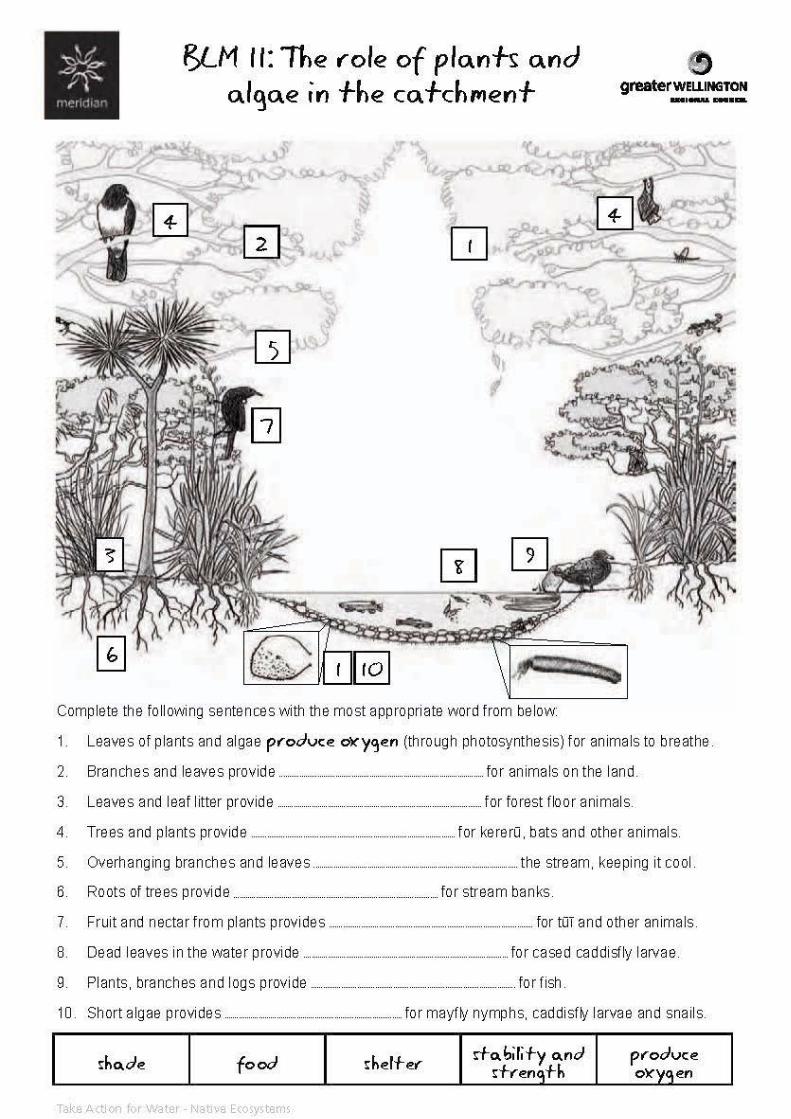
The role of plants and algae in the catchment activity sheet
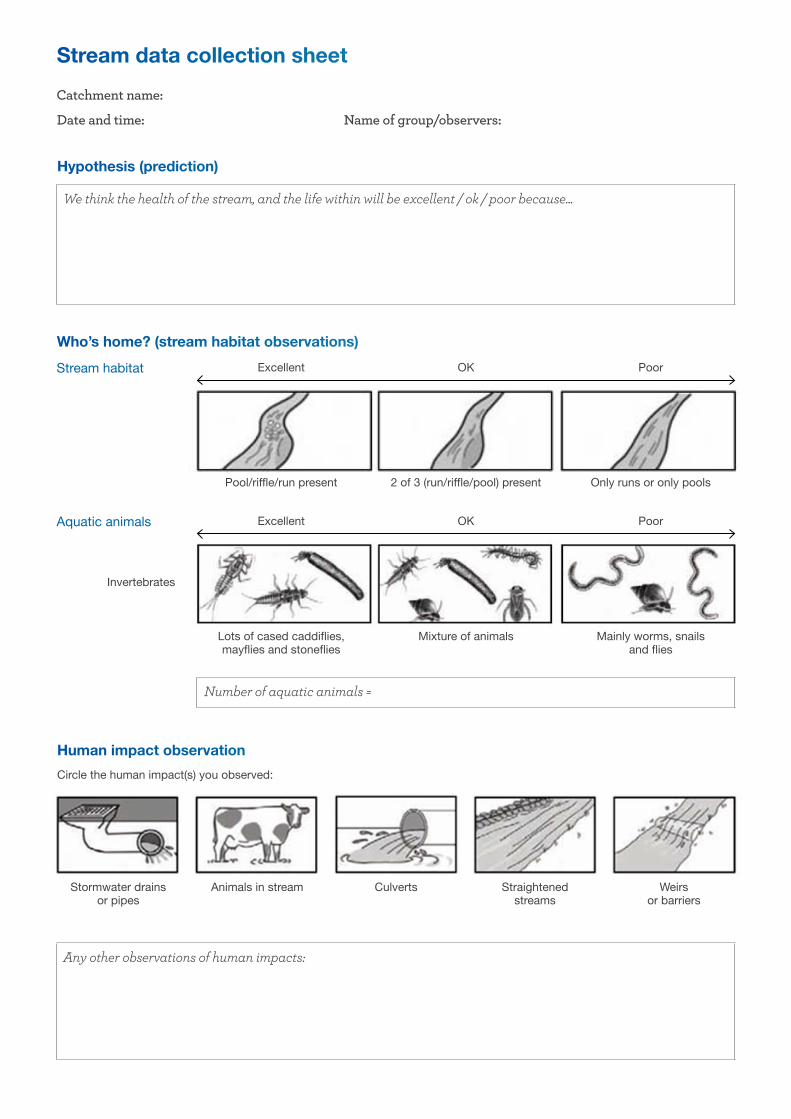
Stream data collection sheet
Catchment name:
Date and time: Name of group/observers:
Hypothesis (prediction)
We think the health of the stream, and the life within will be excellent / ok / poor because...
Who’s home? (stream habitat observations)
Stream habitat
Aquatic animals
Excellent OK Poor
Excellent OK Poor
Invertebrates
Lots of cased caddiflies, mayflies and stoneflies
Mixture of animals Mainly worms, snails and flies
Pool/riffle/run present 2 of 3 (run/riffle/pool) present Only runs or only pools
Human impact observation
Circle the human impact(s) you observed:
Any other observations of human impacts:
Stormwater drains or pipes
Animals in stream Culverts Straightened streams
Weirs or barriers
Number of aquatic animals =
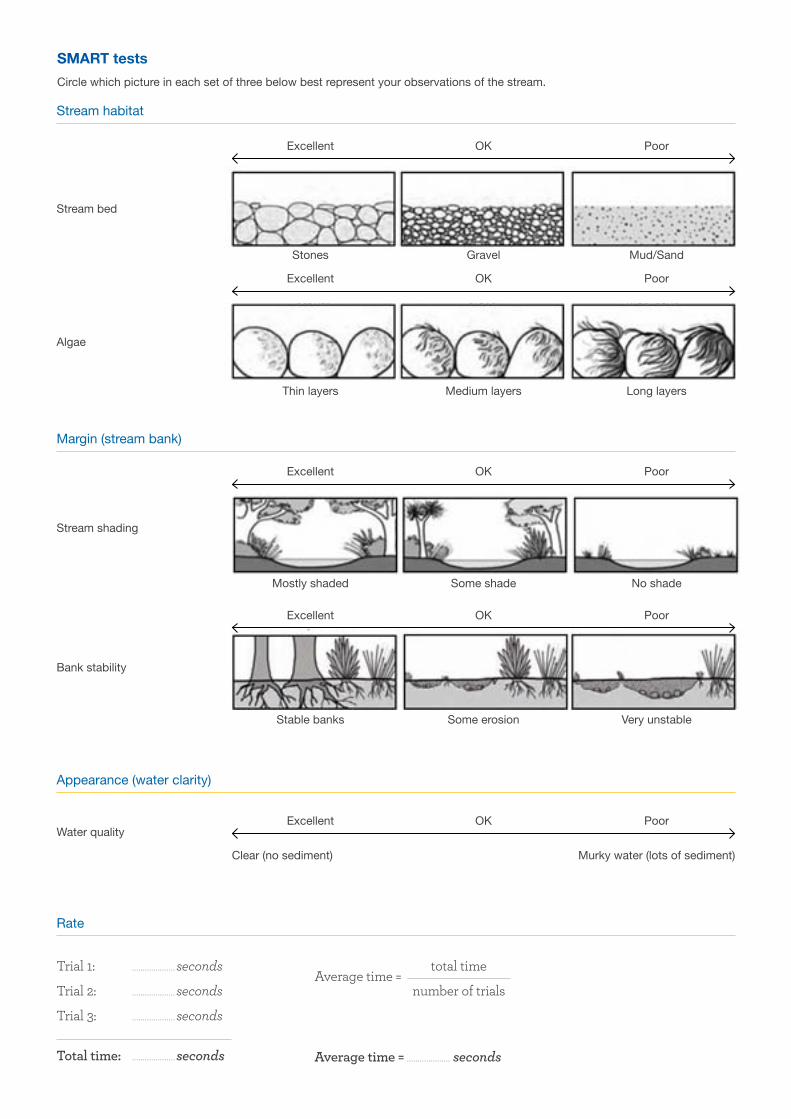
SMART tests
Circle which picture in each set of three below best represent your observations of the stream.
Stream habitat
Margin (stream bank)
Appearance (water clarity)
Rate
Excellent OK Poor
Excellent OK Poor
Excellent OK Poor
Excellent OK Poor
Excellent OK Poor
Stones Gravel Mud/Sand
Mostly shaded Some shade No shade
Clear (no sediment) Murky water (lots of sediment)
Stable banks Some erosion Very unstable
Thin layers Medium layers Long layers
Stream bed
Algae
Stream shading
Bank stability
Water quality
Trial 1: .................... seconds
Trial 2: .................... seconds
Trial 3: .................... seconds
Total time: .................... seconds
Average time =
Average time = .................... seconds
total time
number of trials
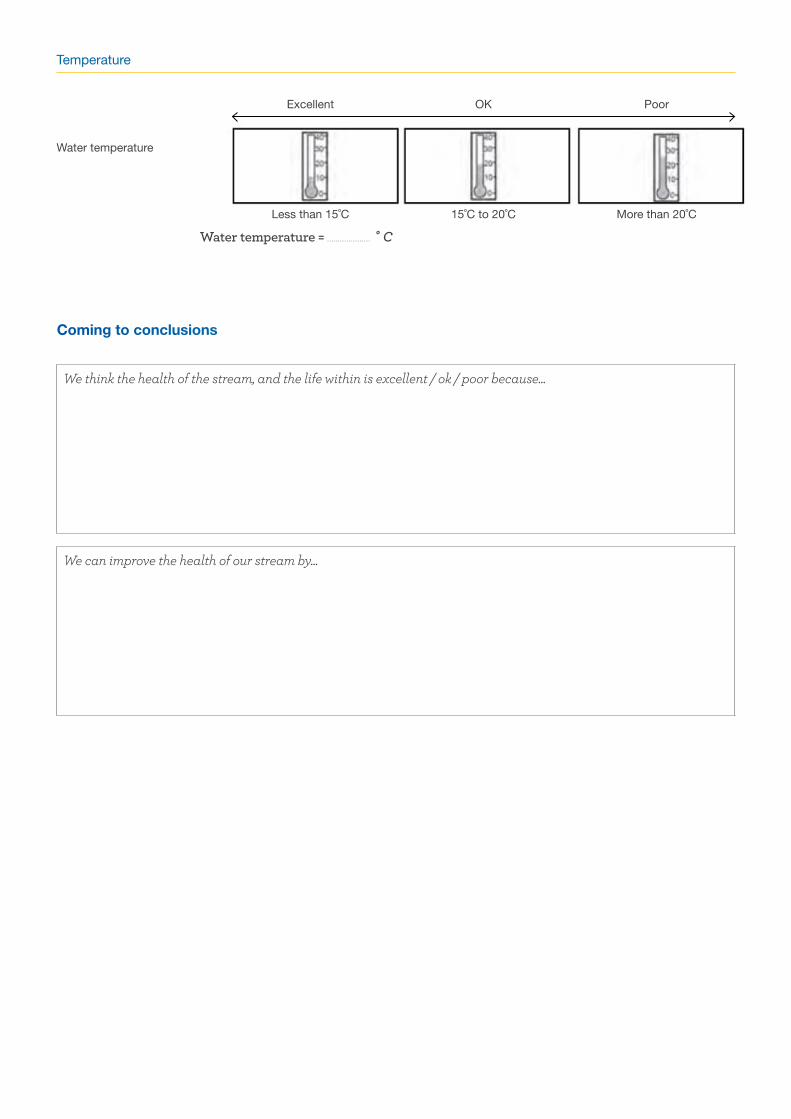
We think the health of the stream, and the life within is excellent / ok / poor because...
We can improve the health of our stream by...
Temperature
Excellent OK Poor
Less than 15˚C 15˚C to 20˚C More than 20˚C
Water temperature
Water temperature = .................... ˚ C
Coming to conclusions
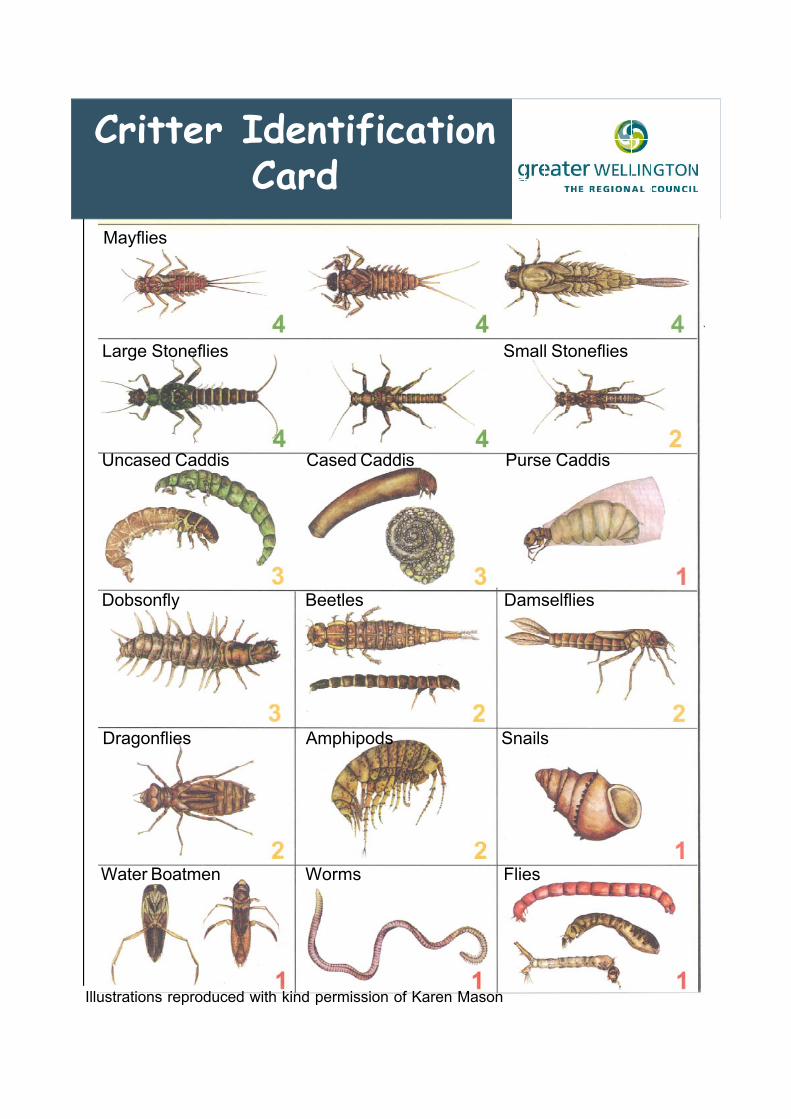
Critter identification cardCritter Identification
Card
Illustrations reproduced with kind permission of Karen Mason
Mayflies
Large Stoneflies Small Stoneflies
Uncased Caddis Cased Caddis Purse Caddis
Dobsonfly Beetles Damselflies
Dragonflies Amphipods Snails
Water Boatmen Worms Flies
Critter Master Maori-English.PM6 7/05/2003, 10:37 a.m.1