Embed Size (px)
Citation preview


©Hafiz ur Rahman2017
iii

DedicationTo my parents and family, may Allah protect them and give them good health
and happiness.
iv

ACKNOWLEDGMENTS
First and foremost, praise and thanks to Allah almighty for giving me strength
and health to complete this thesis work.
Secondly, I would like to express my sincere gratitude to my thesis adviser
Dr. Farag Azzedin, for his consistent support and guidance throughout my
MS degree. His valuable suggestions and encouragement can never be forgotten.
I would also like to thank my thesis committee members Dr. Mahmood
Khan Niazi and Dr. Salahadin Mohammed for their guidance and help. I
would like also to express my special thanks to my friend Mr. Saleh Alyahya
for his contribution in my experimentation. I would also like to extend my thanks
to the Chairman of Information and Computer Science Department, Dr.
Khalid Al Jasser, for providing me all the required facilities for my work.
A very special gratitude goes to King Fahd University of Petroleum and
Minerals for supporting my study and providing the computing facilities. I also
grateful to Mr. Yusuf, Mr. Muneed Iqbal, Mr. Khurram Shahzad, Mr.
Faisal Munir and Mr. Mohsin Ali for their technical support.
Last but not least, I would like to thank my family for providing me their
continuous support and patience throughout my studies.
v

TABLE OF CONTENTS
ACKNOWLEDGEMENT v
LIST OF TABLES ix
LIST OF FIGURES x
LIST OF ABBREVIATIONS xii
ABSTRACT (ENGLISH) xiii
ABSTRACT (ARABIC) xiv
CHAPTER 1 INTRODUCTION 1
1.1 Problem Statement . . . . . . . . . . . . . . . . . . . . . . . . . . 3
1.2 Motivation . . . . . . . . . . . . . . . . . . . . . . . . . . . . . . . 4
1.3 Objectives . . . . . . . . . . . . . . . . . . . . . . . . . . . . . . . 5
1.4 Contributions . . . . . . . . . . . . . . . . . . . . . . . . . . . . . 6
1.5 Thesis Organization . . . . . . . . . . . . . . . . . . . . . . . . . . 7
CHAPTER 2 BACKGROUND 8
2.1 Cloud Service Models . . . . . . . . . . . . . . . . . . . . . . . . . 11
2.1.1 Infrastructure-as-a-Service . . . . . . . . . . . . . . . . . . 11
2.1.2 Platform-as-a-Service . . . . . . . . . . . . . . . . . . . . . 12
2.1.3 Software-as-a-Service . . . . . . . . . . . . . . . . . . . . . 13
2.2 Cloud Deployment Models . . . . . . . . . . . . . . . . . . . . . . 13
vi

2.2.1 Private Cloud . . . . . . . . . . . . . . . . . . . . . . . . . 13
2.2.2 Public Cloud . . . . . . . . . . . . . . . . . . . . . . . . . 14
2.2.3 Hybrid Cloud . . . . . . . . . . . . . . . . . . . . . . . . . 15
2.2.4 Community Cloud . . . . . . . . . . . . . . . . . . . . . . 15
2.3 Virtualization Solutions . . . . . . . . . . . . . . . . . . . . . . . 16
2.3.1 Hypervisor . . . . . . . . . . . . . . . . . . . . . . . . . . . 17
2.3.2 Types of Hypervisors . . . . . . . . . . . . . . . . . . . . . 18
2.4 Virtualization Approaches and Challenges . . . . . . . . . . . . . 21
2.4.1 Virtualization Techniques . . . . . . . . . . . . . . . . . . 22
CHAPTER 3 RELATED WORK 26
3.1 Hypervisor Evaluation . . . . . . . . . . . . . . . . . . . . . . . . 26
3.2 vCPU-pCPU Mapping and vCPU-VM Configuration . . . . . . . 29
CHAPTER 4 RESEARCH METHODOLOGY AND EXPERI-
MENTAL DESIGN 33
4.1 Research Questions . . . . . . . . . . . . . . . . . . . . . . . . . . 33
4.2 Proposed Methodology . . . . . . . . . . . . . . . . . . . . . . . . 34
4.3 Methodology Architecture . . . . . . . . . . . . . . . . . . . . . . 36
4.4 Experimental Design . . . . . . . . . . . . . . . . . . . . . . . . . 36
4.4.1 N-Queens Benchmark . . . . . . . . . . . . . . . . . . . . . 38
4.4.2 Test Configurations . . . . . . . . . . . . . . . . . . . . . . 40
4.4.3 Test Cases . . . . . . . . . . . . . . . . . . . . . . . . . . . 41
CHAPTER 5 RESULTS AND DISCUSSION 44
5.1 The Effect of Virtualization Technology . . . . . . . . . . . . . . . 44
5.2 The Effect of Virtual Machines on Performance . . . . . . . . . . 47
5.2.1 Under Allocation . . . . . . . . . . . . . . . . . . . . . . . 48
5.2.2 Balance Allocation . . . . . . . . . . . . . . . . . . . . . . 49
5.2.3 Over Allocation . . . . . . . . . . . . . . . . . . . . . . . . 52
5.3 The Effect of Virtual CPUs on Performance . . . . . . . . . . . . 53
vii

5.3.1 Concluding Remarks . . . . . . . . . . . . . . . . . . . . . 57
5.4 The Significance of Over Allocation . . . . . . . . . . . . . . . . . 58
5.5 The Effect of Pinning Strategies on Performance . . . . . . . . . . 64
CHAPTER 6 CONCLUSIONS AND FUTURE WORK 69
6.1 Conclusions . . . . . . . . . . . . . . . . . . . . . . . . . . . . . . 69
6.2 Future Work . . . . . . . . . . . . . . . . . . . . . . . . . . . . . . 70
REFERENCES 72
VITAE 80
viii

LIST OF TABLES
3.1 Summary of related work . . . . . . . . . . . . . . . . . . . . . . . 32
4.1 Specification of the Servers . . . . . . . . . . . . . . . . . . . . . 38
4.2 N-Queens problem with elapsed time (seconds) . . . . . . . . . . 39
5.1 Elapsed time (sec) to solve N-Queens problem using Citrix
xenServer . . . . . . . . . . . . . . . . . . . . . . . . . . . . . . . 66
5.2 Elapsed time (sec) to solve N-Queens problem using KVM . . . . 67
5.3 Elapsed time (sec) to solve N-Queens problem using Citrix
xenServer and KVM for balance allocation . . . . . . . . . . . . . 68
ix

LIST OF FIGURES
1.1 Regular system and Virtualized environment . . . . . . . . . . . . 2
2.1 Cloud Computing [1] . . . . . . . . . . . . . . . . . . . . . . . . . 9
2.2 Cloud Service Models . . . . . . . . . . . . . . . . . . . . . . . . . 12
2.3 Cloud Deployment Models [2] . . . . . . . . . . . . . . . . . . . . 14
2.4 Server Virtualization [3] . . . . . . . . . . . . . . . . . . . . . . . 16
2.5 A Virtualization Solution . . . . . . . . . . . . . . . . . . . . . . . 18
2.6 Type I and Type II Hypervisors . . . . . . . . . . . . . . . . . . . 19
2.7 Commonly used Approaches for Virtualization Layer [4] . . . . . . 24
4.1 Proposed Methodology . . . . . . . . . . . . . . . . . . . . . . . . 35
4.2 Proposed Methodology Architecture . . . . . . . . . . . . . . . . . 35
4.3 Experimental Design . . . . . . . . . . . . . . . . . . . . . . . . . 37
4.4 One Solution of N-Queens Problem (8 x 8 board) [5] . . . . . . . 37
5.1 The effect of Virtualization Layer using N-Queens benchmark . . 45
5.2 The effect of Virtualization Layer using John-the-Ripper bench-
mark . . . . . . . . . . . . . . . . . . . . . . . . . . . . . . . . . 46
5.3 The effect of Virtual Machines on Performance - Under allocation 48
5.4 The effect of Virtual Machines on Performance - Balance allocation 50
5.5 The effect of Virtual Machines on Performance - Over allocation . 52
5.6 The effect of Virtual Machines on Performance . . . . . . . . . . 53
5.7 The effect of Virtual CPUs on Performance - Citrix xenServer . . 54
5.8 The effect of Virtual CPUs on Performance - KVM . . . . . . . . 54
x

5.9 Total CPU Utilization at Hypervisor Level - Citrix xenServer . . . 55
5.10 Total CPU Utilization at Hypervisor Level - KVM . . . . . . . . . 55
5.11 Mean Elapsed time of Hypervisor, VMs, and vCPUs . . . . . . . . 57
5.12 The effect of Virtual CPUs on Performance - Uniform vCPUs per
VMs . . . . . . . . . . . . . . . . . . . . . . . . . . . . . . . . . . 60
5.13 CPU Utilization for Uniform vCPUs . . . . . . . . . . . . . . . . 60
5.14 The effect of Virtual CPUs on Performance - Non-uniform vCPUs
per VMs . . . . . . . . . . . . . . . . . . . . . . . . . . . . . . . 62
5.15 CPU Utilization for Non-uniform vCPUs . . . . . . . . . . . . . 62
5.16 Normal distribution of Elapsed time (sec), Uniformed vCPU allo-
cation . . . . . . . . . . . . . . . . . . . . . . . . . . . . . . . . . 64
5.17 Normal distribution of Elapsed time (sec), Non-uniformed vCPU
allocation . . . . . . . . . . . . . . . . . . . . . . . . . . . . . . . 65
xi

xii
LIST OF ABBREVIATIONS
CMP Chip Multiprocessor
CPU Central Processing Unit
FV Full Virtualization
KVM Kernel-based Virtual Machine
HAV Hardware Assisted Virtualization
IaaS Infrastructure-as-a-Service
NUMA Non-Uniform Memory Access
OS Operating System
PaaS Platform-as-a-Service
PV Paravirtualization
pCPU Physical CPU
PTS Phronix Testing Suite
RHEV Red Hat Enterprise Virtualization
SaaS Software-as-a-Service
SMP Symmetric Multiprocessing
vCPU − VM Virtual CPU to Virtual Machine
vCPU − pCPU Virtual CPU to Physical CPU
VM Virtual Machine
VMM Virtual Machine Monitor

xiii
ABSTRACT
Full Name : Hafiz ur Rahman
Thesis Title : Evaluating CPU Utilization in a Cloud Environment
Major Field : Computer Science
Date of Degree : May 2017
Virtualization is used to ease computing resource management, resource utilization and
running multiple heterogeneous or homogeneous operating systems on a single physical
machine. Virtualization offers many advantages such as reducing fiscal costs, easing
system migration, running legacy applications, easing backups and disaster recovery, and
utilizing the shared resources over traditional data centers. In virtualized environments, the
higher the percentage of the CPU utilization results in the maximum performance.
However, virtualization systems have shortcomings including virtual machines allocation,
virtual CPU configuration, and virtual CPU to physical CPU mapping. Such shortcomings
may lead to system performance degradation. In this thesis, we focus on the role that
hypervisors, virtual CPU to virtual machine allocation, and the virtual CPU to physical
CPU mapping play on CPU utilization. PTS benchmarking tool is used as a traffic
generator and analyzer, which provides a detailed evaluation of CPU utilization. The
results of this study will help cloud service providers and researchers select and decide
which virtualization technology, virtual CPU to virtual machine configuration, and
mapping strategies to used for better performance and best CPU resources allocation.

xiv
ملخص الرسالة
.حفيظ الرحمن :الاسم الكامل
تقييم الاستخدام الأمثل لوحدة المعالجة المركزية في البيئة السحابية. :عنوان الرسالة
علوم الحاسب الآلي والمعلومات. :التخصص
.2017 مايو :تاريخ الدرجة العلمية
لك الموارد ولتشغيل عدة أنظمة تشغيل لتالأمثل الاستخدامالافتراضية مستخدمة لتسهيل إدارة موارد الحوسبة ولتسهيل
متجانسة أو متفاوتة على ماكينة مادية وحيدة. الافتراضية تقدم العديد من المزايا مثل تقليص التكاليف المالية وتسهيل
الأمثل للموارد المشتركة من مراكز البيانات التقليدية. في البيئات والاستخدام كارثةمن ال تعافيالنسخ الاحتياطية وال
ومع ( فأنها تسفر عن الأداء عالي لها. CPUالافتراضية، كلما زادت نسبة الاستفادة من وحدة المعالجة المركزية )
لافتراضية، تكوين وتهيئة وحدة المعالجة ذلك، الأنظمة الافتراضية لديها قصور مشتملة على تخصيص الآلات ا
قود إلى تراجع في يما لافتراضية بالمادية. هكذا قصور ربالمركزية الافتراضية، ووصل وحدة المعالجة المركزية ا
بالإضافة إلى وصل وحدة المعالجة المركزية Hypervisorـ في هذه الرسالة، سنركزعلى الدور للأداء النظام.
أداة وحدة المعالجة المركزية.لالأمثل الاستخدامحدة المعالجة المركزية المادية في أن تلعب دورا في بو -الافتراضية
( مستخدمة كمولد ومحلل لحركة المرور، والتي تزود بتقييم مفصل لتكشف التباين في الاستخدام الأمثل PTSالاختبار )
نتائج هذه الدراسة ستساعد مزودي الخدمة السحابية والباحثين ليختاروا ويقرروا التقنية لوحدة المعالجة المركزية.
الافتراضية الأفضل، التهيئة والتكوين لوحدة المعالجة المركزية الافتراضية في الآلات الافتراضية، وربط
الاستراتيجيات لاحتياجاتهم الخاصة.
CHAPTER 1
INTRODUCTION
Virtualization is the fundamental element of cloud computing [6, 7, 13] by which
we can deliver resources or data as a service. In the last decade, virtualization has
attracted many different research groups working on server consolidation, security,
and computing [8, 9]. For example, distributed data centers are now being utilized
by using virtualization technology which was not possible in the past.
Usually, servers are underutilized, which results in making the data centers
unproductive [10]. Traditional data centers have several shortcomings including
maintenance cost and resources utilization. Furthermore, traditional data centers
suffer from server proliferation, low resource utilization, physical infrastructure
cost, and migration challenges [3, 8, 11, 13]. Thus, virtualization plays a vital role
in mitigating such challenges [8]. Virtualization makes use of server resources in a
well-organized manner by setting up different servers within different cloud types
[13]. Moreover, virtualization consolidates workloads so that one physical machine
can be used for different users. This improves the efficiency and utilization of
1

Figure 1.1: Regular system and Virtualized environment
data centers by allowing more work to be done on a smaller set of physical nodes
[14, 15]. Through virtualization, organizations can achieve better management
and improve resource efficiency [15]. As a result, organizations can access and
manage their data more efficiently. Therefore, many organizations are adopting
virtualization technology to reduce the cost while maximizing the productivity,
flexibility, responsiveness, and efficiency.
Virtualization can be done to various resources such as CPU, memory, or I/O
devices. Virtualization vendors use different technologies to provide virtualization
environment. These environments can be built to enhance the utilization of tradi-
tional IT infrastructures as well as resource management capabilities. Hypervisors
are used in virtualized environments as agents facilitating virtual machines and
hardware [4, 15, 16, 17].
2

1.1 Problem Statement
Virtualization technology inserts an additional abstraction layer between the hard-
ware and the operating system [4, 8, 18] as shown in Figure 1.1. In a regular sys-
tem, the hardware resources are shared by single OS. While in virtualization envi-
ronments, hypervisors are responsible to manage hardware resources and virtual
machines. Moreover, every guest operating system is in charge of virtual resources
and concurrently share and access the hardware resources [9]. Therefore, virtual-
ization systems face challenges such as virtual machines (VMs) allocation, virtual
CPU allocation, and virtual CPU to physical CPU (vCPU-pCPU) mapping. Such
challenges may lead to system performance degradation [19, 20, 21].
Nevertheless, CPU is one of the most significant and critical resource among
all the available resources in a system [8, 22, 23]. Improving CPU utilization is
one goal of any virtualization technology. In addition, CPU utilization is used as
a metric to measure system performance. The cloud provider assigns resources to
each user request aiming to minimize resource allocation and fulfill user require-
ments [24]. The following [25] are the main factors that have implications on CPU
utilization namely: resource sharing between physical cores, resource sharing be-
tween logical cores (hyper threading), the choice of guest OS, the BIOS setting
for power management (machine level), the hypervisor/OS setting for power man-
agement, and VM setting (over-commitment between vCPU and physical CPU
(pCPU)).
CPU utilization can be improved at different levels by tuning up different
3

components. At VM level [19, 20, 21, 26], the following parameters can be tuned to
improve the CPU utilization: (a) vCPU-pCPU commitment, (b) the OS setting for
power management, and (c) the OS scheduling algorithm. Moreover, at hypervisor
level, the following parameters can be tuned to improve the CPU utilization: (a)
the hypervisor scheduler and (b) vCPU-pCPU mapping [19, 21]. Furthermore,
configuring BIOS setting for power management [25] and choosing the state-of-the-
art hardware, such as Intel and AMD virtualization aware processors [4, 8, 18] that
provides the necessary support for virtualization, contribute towards improving
CPU utilization.
In this thesis, we evaluate the effects of hyppervisor, virtual machine allo-
cation, vCPU-VM configuration, and vCPU-pCPU mapping on performance in
terms of CPU utilization in a cloud environment. Various experiments for CPU
utilization are performed using Citrix xenServer (commercial) and KVM (open
source) hypervisors. Phronix Testing Suite (PTS) [27] benchmarking tool is used
as a traffic generator and analyzer. We chose PTS, since it tracks CPU perfor-
mance and generates data points for performance investigation. The aim of these
experiments is to investigate how to allocate CPU resources (in terms of cores and
logical CPUs) to achieve better performance.
1.2 Motivation
In this thesis, we were motivated by the fact that virtualization suffers from draw-
backs. In addition, researchers evaluate and analyze hypervisors without inves-
4

tigating the best vCPU-VM configuration through which better CPU utilization
and performance for each hypervisor can be expected. They assigned vCPU to
VM based on non-suitable vCPU-VM configuration [15, 28, 29, 30]. Furthermore,
there are a variety of vendors for the virtualization environment and all of them
claim that their virtualization hypervisor is the best, however they depend on the
used application [17]. Moreover, when applying virtualization technology to an
infrastructure environment, which hypervisor among others is better and faster
in terms of CPU utilization? When a system administrator or a researcher de-
ploy virtual machine in a cloud environment, which vCPU-VM configuration and
mapping strategies for virtual machine is the best to improve CPU utilization?
What is the effect of VM and vCPU on performance? Is there any other setting
or configuration by which CPU utilization be improved?
1.3 Objectives
In this research study, our aim is to investigate the best CPU resources allocation
and better performance using the latest version of the state-of-the-art hypervi-
sors. In addition, we investigate the effect of hyperviosr, VM, vCPU, and pinning
strategies on performance. We also present the best vCPU configuration and pin-
ning strategy for VM in a cloud environment through which better performance
and maximum CPU utilization can be expected.
Our finding will be a road map to assist cloud service providers to choose
the best hypervisor, vCPU-VM configuration, and mapping strategies for their
5

specific needs.
In a nutshell, the thesis objectives are:
1. Build a private cloud using the latest version of commercial and open source
hypervisors (Citrix xenServer and KVM).
2. Prior to evaluate the hypervisors, investigate the best vCPU - VM config-
uration and vCPU pCPU mapping strategies, through which better CPU
utilization can be expected for each hypervisor.
3. Evaluate the effects of Hypervisor, Virtual Machine, vCPU VM assignment,
and vCPU pCPU mapping on performance in terms of CPU utilization.
1.4 Contributions
Based on the objectives defined previously, we outline the main contributions of
this thesis as follows:
Building a private cloud using the latest version of commercial and open source
hypervisors (Citrix xenServer version 7.0.1 and KVM version 4.4.0). In this
research work, we focus on the effect virtualization technology, VM allocation,
vCPU-VM configuration, and vCPU-pCPU mapping to find out the variation in
CPU utilization prior to evaluate the hypervisors.
As another contribution, we provide recommendations for vCPU-VM configu-
ration and vCPU-pCPU mapping through which better CPU utilization on each
hypervisor can be achieved. As a result, cloud service providers will get the ben-
6

efits, when they deploy VMs in a cloud environment or evaluate open source and
commercial hypervisors (KVM, Citrix xenServer, VMware, and Hyper-V).
1.5 Thesis Organization
This thesis is organized into six chapters. Chapter 2 presents a background on
virtualization technology and outlines the definition of virtualization terminology.
Chapter 3 provides an extensive literature review of the impact of hypervisor,
vCPUs-VMs configuration, and vCPU-pCPU mapping on performance. Chapter
4 describes our research methodology and experimental setup. We analyze the
evaluation results in chapter 5 and draw conclusions in chapter 6. Furthermore,
we summarize our major contributions, discuss perspectives, and envisions future
work directions in chapter 6 as well.
7

CHAPTER 2
BACKGROUND
This chapter introduces the concept of cloud computing and virtualization. For
completeness and clarity purposes, we provide a list of definitions that will be
used throughout this thesis. We also outline the main concept of virtualization
and cloud computing. Finally, we highlight the virtualization approaches and
challenges.
1. Cloud Computing: Cloud computing is a pay-per-use model on demand
delivery of computing resources over the internet [31]. Figure 2.1, shows the
cloud computing environment.
2. Virtualization: Virtualization refers to a variety of different computing
concepts. It is used for ease computing resource management, resource
utilization, and running multiple heterogeneous or homogeneous OSs on a
single physical machine [7, 9].
3. Hypervisor: An abstraction layer of software which is also known as Vir-
8

Figure 2.1: Cloud Computing [1]
tual Machine Monitor (VMM) that makes virtualization possible. A widely
accepted definition has been provided by [8] for VMM: “As a piece of soft-
ware a VMM has three essential characteristics. First, the VMM provides an
environment for programs which is identical to the original machine; second,
programs running in this environment show at worst only minor decreases
in speed; lastly, VMM is a complete control of system resources”.
4. Virtual Machine: A Virtual Machine (VM) is an efficient isolated dupli-
cate of the real physical machine that can has its own OS [22, 32].
9

5. Host Machine: A host machine is a server component or physical machine
on which a hypervisor is running. Host machines provide the computing
resources such as processing power, memory, network, I/O, etc., to support
virtual machines [8].
6. Guest OS: A guest OS is an independent instance of an OS that is installed
and run in a virtual machine.
7. Physical CPU: A physical CPU (pCPU) is the central processing unit
responsible of all processing operations. A server can have more than one
processor.
8. Core: Inside physical CPU, there are more than one operations unit (like
a processor), called core [33].
9. Logical CPU: It is a processing unit that is capable of executing its own
thread in parallel with other logical cores. Number of logical processors
means number of threads. Normally, a core can handle one thread at the
same time (processor time slot). But when Hyper-Threading is activated
and supported, the core can handle two threads at the same time [8, 22].
10. Virtual CPU: A virtual CPU (vCPU) is also known as a virtual processor.
A vCPU is a physical central processing unit that is assigned to a virtual
machine. A vCPU represents a portion or share of a physical CPU that is
assigned to a virtual machine [8, 22].
11. CPU Utilization: CPU utilization refers to a computer’s usage of pro-
10

cessing resources, or the amount of work handled by a CPU in a given time.
Actual CPU utilization varies depending on the amount and type of man-
aged computing tasks [34]. It is the metric that represents how busy is a
processor. It shows whether the CPU on the host is completely occupied.
Moreover, It can be used to track CPU performance regressions or improve-
ments.
2.1 Cloud Service Models
The cloud computing resources can be accessed through a set of service mod-
els. The cloud service models describe how cloud services are made available
to clients [35]. Infrastructure-as-a-Service (IaaS), Platform-as-a-Service (PaaS),
and Software-as-a-Service (SaaS) are examples of cloud computing service models
[3, 8]. These service models can be selected and customized for an organization’s
requirements [31, 36]. Cloud service models are shown in Figure 2.2 and details
are given below for each service model.
2.1.1 Infrastructure-as-a-Service
IaaS is the most straightforward model for delivering cloud services. This model
provides the power to control and manage the fundamental computing resources
such as virtual machines, physical servers, operating system, storage, network,
firewalls, and so on. By using IaaS service, users are able to develop their own
application environments. Furthermore, IaaS allows an organization to rent com-
11

Figure 2.2: Cloud Service Models
puting resources on demand instead of spending much money on management
and building their own data centers [3, 8, 28, 35]. Amazon EC2, Nimbus, and
Eucalyptus are popular IaaS providers [28].
2.1.2 Platform-as-a-Service
PaaS hides the low-level details from the user and provides a pre-built applica-
tion development platform for the client to develop, deploy, and manage cloud
applications while not worrying about the technology. PaaS allows a user to de-
ploy applications but hides from the user the backend infrastructure such as OS
12

[3, 8, 35]. Google AppEngine, Heroku, and Microsoft Azure are the most popular
PaaS providers [31].
2.1.3 Software-as-a-Service
SaaS is the top level of service models which providing software solutions to users.
A user can access the SaaS applications using any thin interface such as mobile
device or browsers. Google documents, google apps, online mail, project manage-
ments systems, and social media platforms are some examples of SaaA [3, 8, 35].
The main difference between SaaS and PaaS is that SaaS delivers already
complete and developed applications while PaaS represents a platform where the
user has a complete control over the applications [3, 8].
2.2 Cloud Deployment Models
The cloud service model can be deployed on one or more deployment models.
There are four different approaches to deploying cloud service models, namely
private cloud, public cloud, hybrid cloud, and community cloud [3, 8] as shown in
Figure 2.3. Each of these deployment models is explained in the next subsections.
2.2.1 Private Cloud
A private cloud refers to cloud infrastructures in which the services are maintained
on a private network and not available for public use. A private cloud is hosted
in the data center of a company and provides its services only to users inside
13

Figure 2.3: Cloud Deployment Models [2]
that company or its partners. The cloud infrastructure is accessed only by the
members of the organization and/or by granted third parties. A private cloud
has the potential to give the organization greater control over the infrastructure
and computational resources [37, 38]. Private clouds can be managed by the
organization itself or by a third party cloud [31, 36].
2.2.2 Public Cloud
Public clouds refer to infrastructures operated and owned by a cloud service
provider such as Microsoft Azure, IBM’s Blue Cloud, and Google AppEngine
are the examples of public clouds [31, 36]. Public clouds provide services that are
open to users over the Internet, for a pay-per-usage fee. In public clouds, users
can scale their use on demand and do not need to purchase hardware to use the
service [37, 38].
14

2.2.3 Hybrid Cloud
Hybrid clouds are more complex than the other deployment models, since they
involve a composition of two or more clouds (private, community, or public). A
hybrid cloud is a composition of at least one private cloud and at least one public
cloud. A hybrid cloud is typically offered in one of two ways: a vendor has a
private cloud and forms a partnership with a public cloud provider, or a public
cloud provider forms a partnership with a vendor that provides private cloud
platforms [38]. This deployment model gives greater flexibility, scalability, and
security i.e., by allowing workloads to move between private and public clouds
[31, 36].
2.2.4 Community Cloud
A community cloud is shared by multiple organizations to support a specific com-
munity with shared concerns i.e., security, compliance, jurisdiction, etc. [31, 36].
A community cloud falls between public and private clouds with respect to the
target set of consumers. It is somewhat similar to a private cloud, but the infras-
tructure and computational resources are exclusive to two or more organizations
that have common privacy, security, and regulatory considerations, rather than a
single organization [38].
15

Figure 2.4: Server Virtualization [3]
2.3 Virtualization Solutions
Virtualization is the fundamental element of cloud computing [9, 7] by which we
can deliver resources or data as a service. It refers to the creation of virtual
resources on a physical one such as server, OS, network, and storage. Differ-
ent resources can be virtualized including a server, file, storage, and a network
virtualization. All of these cases share the same idea, that is physical resources
abstraction.
Server virtualization is the most common resource abstraction technique in
cloud computing. Server virtualization is a technique in which a physical server
can be split into a number of virtual nodes and run multiple concurrent operat-
ing systems on the same server to better consume, utilize, and achieve maximum
performance [9, 10, 39]. Figure 2.4 represents server virtualization. This kind of
16

virtualization allows multiple isolated virtual servers to run on a single physical
server and can be implemented in different ways. There are three main implemen-
tation approaches for server virtualization called full virtualization (FV), para-
virtualization (PV), and hardware assistance virtualization (HAV) [3, 4, 8, 35] as
shown in Figure 2.7
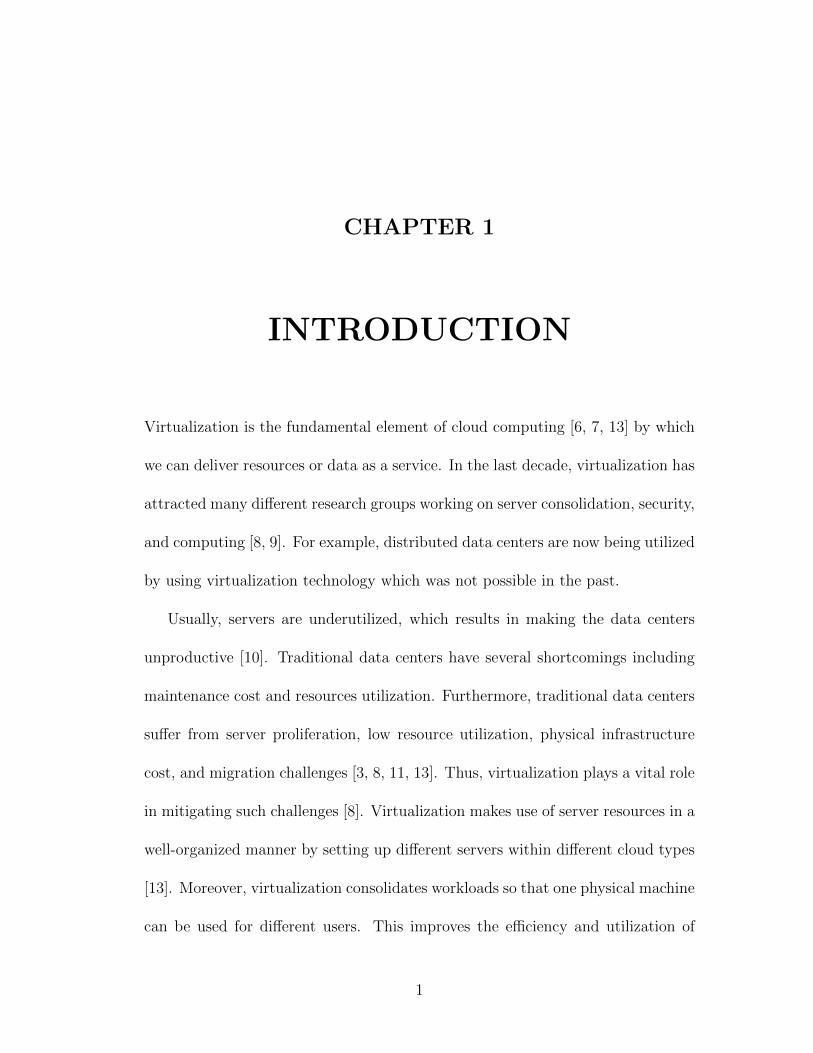
2.3.1 Hypervisor
A hypervisor, as shown in Figure 2.5 is the core component of a virtualization so-
lution [8, 30]. The hypervisor is responsible for running multiple virtual machines
on a host machine to consolidate the workloads so that one physical machine can
be multiplexed for many different users. This improves the efficiency of the overall
system. The resources such as memory, OS, CPU, network, and data are shared
among different virtual machines and completely managed by the hypervisor [40].
This highlights three basic properties or essential requirements for VMM [30].
The first property of the VMM is equivalence by which a program running under
VMM should have the same behavior and effect as that of the program running on
the original physical host machine. The second property is efficiency meaning
that the virtual CPU instruction is executing directly on host hardware without
any intervention by the hypervisor. Resource Control, being the last property
of VMM. This property enables the VMM to control the allocated resources in
such a way that an arbitrary program: (a) can not affect system resources and
(b) it does not have access to any resources not explicitly allocated to it. Figure
17
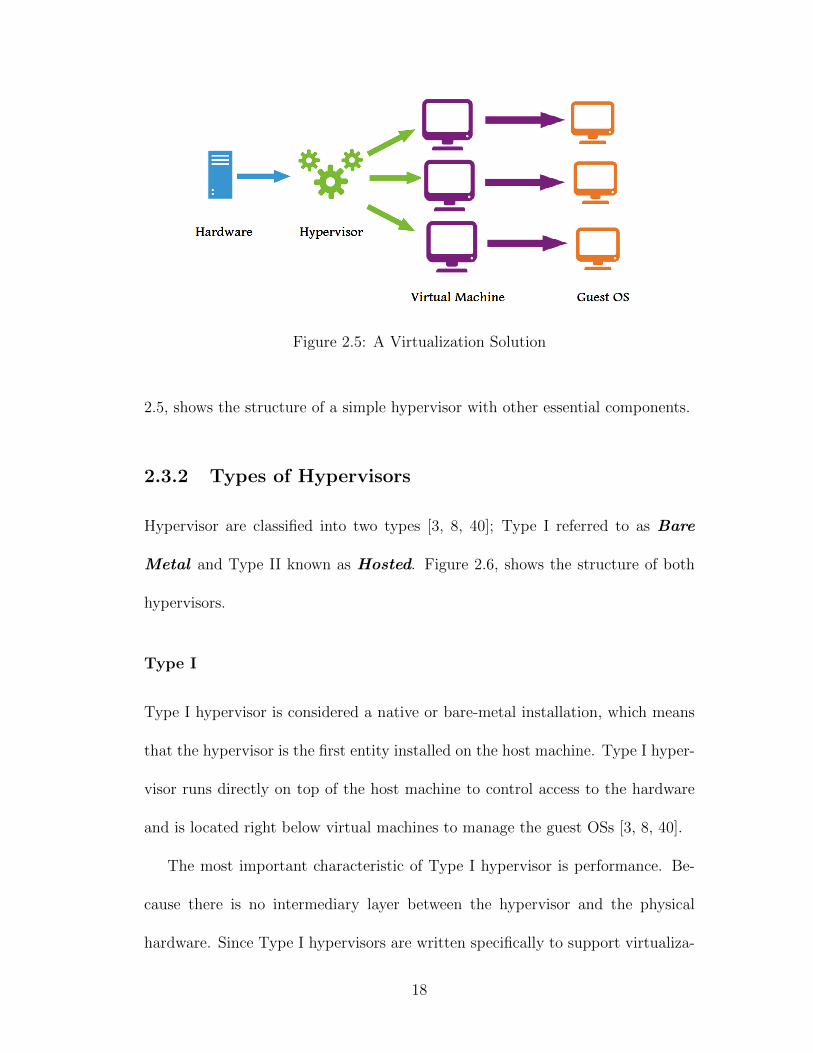
Figure 2.5: A Virtualization Solution
2.5, shows the structure of a simple hypervisor with other essential components.
2.3.2 Types of Hypervisors
Hypervisor are classified into two types [3, 8, 40]; Type I referred to as Bare
Metal and Type II known as Hosted. Figure 2.6, shows the structure of both
hypervisors.
Type I
Type I hypervisor is considered a native or bare-metal installation, which means
that the hypervisor is the first entity installed on the host machine. Type I hyper-
visor runs directly on top of the host machine to control access to the hardware
and is located right below virtual machines to manage the guest OSs [3, 8, 40].
The most important characteristic of Type I hypervisor is performance. Be-
cause there is no intermediary layer between the hypervisor and the physical
hardware. Since Type I hypervisors are written specifically to support virtualiza-
18

Figure 2.6: Type I and Type II Hypervisors
tion, they usually have a very small footprint compared to general purpose OSs.
At the same time, designed specifically to support only virtualization. Type I
hypervisors enable us to provide most of the physical hardware resources of the
host machine to the guest virtual machines. In general, Type I hypervisors such
as VMware ESXi are less compatible with hardware equipment due to their small
footprint.
Taking into consideration the performance and capabilities built into Type I
hypervisors, they are good candidates to run in data centers [3, 8, 40]. These
hypervisors are high performance with special capabilities (e.g high availability,
dynamic resource management) designed to support guest OSs that require high
availability features. This makes Type I hypervisors a more efficient solution with
19

better performance compared to Type II hypervisors. VMware vSphere ESXi,
Microsoft Hyper-V, Citrix xenServer, Red Hat Enterprise Virtualization (RHEV),
and KVM are some examples of Type I hypervisors.
Type II
Type II hypervisors, also known as hosted hypervisors. They are not deployed
in bare-metal fashion [3, 8, 40]. They are installed as an application on top of a
traditional OS. This type was the first x86 hypervisor to leverage the pre-existing
OS installed on the hardware for managing hardware resources. So, it was the
fastest way to introduce virtualization into the market.
Type II hypervisors are installed in the form of an application on commodity
OSs such as Microsoft Windows and Linux. Furthermore, they are more com-
patible with physical hardware devices compared to Type I hypervisors. This is
because this kind of hypervisors utilize the hardware. Moreover, a Type II hyper-
visor runs as an application on top of the OS, there is an extra layer between the
hypervisor and the hardware.
The difference with the Type I hypervisor is that since a Type II hypervisor
does not have direct access to hardware [30], it has to go through one additional
cycle and provide the request to the OS. So, every transaction in a Type II hy-
pervisor requires two additional steps, which require more time and processing
overhead compared to a Type I hypervisor. Since Type II hypervisors run atop
the OS, any issues such as malware, OS failure,and bad device driver will be
noticed by all virtual machines running on top of the OS.
20

Due to the performance and limitations of Type II hypervisors [3, 8, 40], they
are not used in data centers. At the same time, Type II hypervisors can be used by
application developers, who need to access a number of different OSs on their local
machines for research or software testing in different environments [8]. VMware
Workstation, Microsoft Virtual PC, Parallels Workstation, and Oracle Virtual-
Box are some example of Type II hypervisors provided by leading virtualization
vendors [3, 40].
2.4 Virtualization Approaches and Challenges
The x86 platform is the dominant and most commonly used architecture in data
centers [3, 8]. They offer different levels of privilege levels (i.e., 0, 1, 2, and 3)
known as rings [4, 8, 18], numbered 0 (most privileged) to 3 (least privileged), and
main resources such as to execute CPU instruction, memory, and I/O ports are
being protected. The ring 0 have the highest privilege with complete control over
the system where the OSs kernel is running and control the system. Moreover, they
consider themselves the owner of the system resources. Ring 3 is the outermost
ring with the most limited level privilege is where the user applications execute
and called Userspace or Userland. While the other two rings are rarely used
where device drivers reside. This architecture ensures ring 3 application can not
make privilege system calls [18]. If they access privilege resources they create an
exception and corresponding catch, as a result of the unprivileged state change to
privilege mode and the OS execute the instruction.
21

In virtualization environment Type I hypervisors run in Ring 0 and control
the overall system resources like OS. The VM behaviors is exactly the same as
the user application program [4, 8, 18]. In virtualized environments, thy system
resources including CPU, main memory, and I/O are virtualized to the guest OS.
However, the x86 platform was not designed with virtualization support. It was
designed to execute a single instance of OS. By running a hypervisor in the most
privilege level without modifying the guest OS is a big challenge in virtualization.
Because the hypervisor moves up the OS to a ring above and de-privilege the OS.
Moreover, the hypervisor can not allow the guest OS to run at the level from
which it originally designs because doing so might corrupt the hypervisor code
and data [4, 29].
In order to handle the challenges of x86 platform virtualization, there are
three main alternative approaches: Paravirtualization (PV) or OS assisted virtu-
alization, Full Virtualization (FV), and Hardware Assisted Virtualization (HAV)
[4, 8, 18, 29]. Each of the solutions is shown in Figure 2.7. We discuss these three
alternative virtualization approaches in the following subsections.
2.4.1 Virtualization Techniques
In order to handle the challenges of x86 platform virtualization, we are present-
ing the three commonly used approaches namely FT, PV, and HAV. Figure 2.7,
depicts the different approaches used to provide the virtualization layer [4].
22

Full Virtualization
The hypervisor runs in Ring 0 with binary translation of privileged instructions
with the guest OS is running in Ring 1 in unmodified form or in isolation in full
virtualization [4, 8, 18] as shown in Figure 2.7. In addition, the guest OS is un-
aware that it is running in a virtualized environment. Moreover, it did not require
OS or hardware assistant to virtualize the underlying hardware or to run the confi-
dential instructions. Because full virtualization used binary translation method in
which it dynamically translate the nonvirtualizable instructions to codes, then the
translated codes are executed in Ring 0 with the same sequence of the instructions
having the same effect on the underlining virtualized hardware.
Due to a full control of the hardware resources and no modification on the part
of guest OS, full virtualization enables the hypervisor to support a wide range of
OSs and provides the best security and seemless migration and portability of the
guest OS. Furthermore, a high performance can be archive by using the binary
translation with of the direct execution of OS instruction [4, 8, 18].
Paravirtualization
In paravirtualization (PV) as shown in Figure 2.7, the hypervisor runs directly on
the top of hardware as an abstraction layer called virtualization layer, while the
guest OS runs within its expected ring 0 for which it originally designed [4, 8, 18].
Furthermore, PV provides hypercall interface for nonvirtualizable instructions to
handle and replace kernel operation. But in PV, the guest OS kernel code is
23

Figure 2.7: Commonly used Approaches for Virtualization Layer [4]
modified and it directly communicates with the hypervisor with hypercalls for
better performance and efficiency. In PV, the guest OS is aware of virtualization.
Through kernel code modification, virtualization overhead can be minimized
and we can obtain better performance as compared to full virtualization binary
translation. However, it is possible to modify open source OS kernel code such
as Linux, but it is hard and impossible to modify OS kernel code of other OSs
such as Microsoft. Eventually, paravirtualization does not support a wide range
of OSs. In addition, PV can not modify older version of open sources OS kernel
codes that are already in use.
Hardware Assisted Virtualization
Hardware Assisted Virtualization (HAV) is the latest virtulization technology. In
HAV, the guest OS runs in isolation without modifying its kernel code. Latest
processors provide the necessary support for virtualization in HAV [4, 8, 18]. Since
2006, hardware vendors (Intel and AMD) produce virtualization aware processors
24

and provided a new CPU exaction mode know as root mode [41]. In root mode
they hypervisors run directly on the top of hardware to take control of both
hardware and guest OS in a new layer below ring 0 as depicted in Figure 2.7.
Furthermore, OS sensitive and privileged requests are automatically trapped by
the hypervisor and binary translation, hypercall are no longer required [4, 8, 18].
Intel and AMD produce virtualization aware processors that simplify virtual-
ization. Both manufacturers provide a new CPU execution mode known as root
mode that enabled the hypervisor to run in a layer below ring 0 to take control of
the guest OS. Using HAV, sensitive and privileged instructions are automatically
trapped by the hypervisor removing the need for binary translation or paravirtu-
alization [18]. In addition, HAV provide excellent compatibility to support a wide
range of OSs regardless of kernel modification. HAV, can not be used on old x86
platform and requires second generation hardware (virtualization assisted hard-
ware). Citrix xenServer, Hyper-V, KVM, and VMware EXSi hypervisors support
hardware assisted virtualization.
25

CHAPTER 3
RELATED WORK
In the next two subsections, we discuss recently published papers in order to in-
vestigate the impact of vCPU-pCPU matching, vCPU-VM assignment, and the
impact of hypervisors on CPU utilization. Furthermore, we study the implemen-
tation environments used to conduct the performance evaluation. Other factors
such as the nature of virtualization type (i.e., full virtualization, para virtualiza-
tion, or hardware assistance virtualization) are also investigated and summarized.
3.1 Hypervisor Evaluation
Charles David [28] analyzed two types of virtualization namely paravirtualization
and hardware assisted virtualization using open sources virtualization platforms
KVM (RHEL 5.3 64bit) and Xen 3.1.2 hypervisors on CMP system. The au-
thor measured the throughput and overall performance of the hypervisors using
PTS benchmarking tool under various levels of workload and compared different
system attributes including CPU usage, memory access rate, and I/O operations.
26

Unfortunately, the author randomly assigned vCPUs to VMs which caused perfor-
mance degradation. The author did not analyze the root cause of the performance
degradation.
Babu et al. [29] evaluated the system performance of three hypervisors. The
authors had opted Xen-PV, OpenVZ, and XenServer for para virtualization, con-
tainer virtualization, and full virtualization, respectively. They compared the
performance of these techniques based on Unixbench benchmarking tool. They
observed that the hypervisor which supports full virtualization has a compara-
tively higher system performance in terms of file copy, pipe based context switch-
ing, process creation, shell scripts, and floating point operation than the other
two virtualization types. However, the authors did not investigated the effects of
vCPU-VM and vCPU-pCPU. Moreover, the authors only used one virtual ma-
chine for their evaluation.
C. Mancas [30], used Passmask benchmarking tool and evaluated VMware
and KVM hypervisors for CPU, memory, and I/O performance. They observed
that overall VMware behaves better than KVM. However, there are cases, such as
memory and HDD in which KVM overtakes VMware. Like [29], the author used
a simple test case in which he used XP as a guest OS.
S. Varette et al. [15] evaluated energy-efficiency of VMware ESXi 5, KVM
0.12 and Xen 4.0, using NUMA architecture using HPC implementation. The
authors used HPL benchmarking tool and the Grid 5000 platform to investigate
the performance of different hypervisors in a well-regulated and similar to HPC
27

environment. The authors concluded that there is a sustainable performance
impact introduced by the virtualization layer across all types of hypervisors.
Hwang et al. [4] investigated open source and commercial hypervisors (Hyper-
V 2008R2, vSphere 5.0, KVM 2.6.32-279, and Xen 4.1.2). The authors stated
that there is no impact by increasing the number of virtual CPUs on performance
from one vCPU up to four vCPUs on all hypervisor. In our work, we will show
that there is a high impact of vCPU on performance.
Graniszewski et al. [17] evaluated open source and commercial hypervisors
(Hyper-V, ESXi, OVM, Virtual Box, and Xen) like Hwang et al. [4] investigated,
but in [17] the authors used the latest version of each hypervisor in CMP archi-
tecture. Moreover, they included type II hypervisor in their experiments to show
the difference as well. More important, they criticized the work of M. Kedziora
[42] by stating that ”Since 2012 the VMware is the market leader, followed by
Microsoft”. Graniszewski et al. [17] recommended that Xen is the best choice for
the small size organization while VMware and Microsoft Hyper-V are good for
enterprise but they are more expensive than Xen. However, the authors did not
investigate the effect of vCPU-VM and vCPU-pCPU for hyper threading enabled
NUMA architecture for each hypervisor.
Sogand et al. [43] compared the performance of three hypervisors: VMware
EXSi 5.0, Xen 3.0.13 and KVM using two quad core CPUs with hyperthreading
enabled (i.e., total 16 logical CPU) and 4x146 GB Hard Drive. As a guest OS,
the authors installed RedHat Enterprise Linux 6.2 on each hypervisor. According
28

to their measurements, no single hypervisor has the best performance for CPU
utilization, disk utilization, response time, and downtime: VMware and KVM
performed better in terms of application response time and CPU utilization as
compare with Xen, but Xen performed well during live migration and showed less
downtime than KVM and VMware. However, the authors did not show the actual
work perform by each hypervisor during CPU utilization. Furthermore, they only
conducted their experiments on two VMs running on each host machine with three
different vCPU-VM configurations (6 vCPU, 12 vCPU, and 16 vCPU) such that
they did not consider over allocation of vCPU-VM configuration. It should be
noted that the latest state-of-the-art hypervisors supported to assign more than
16 vCPUs to VM [44]).
3.2 vCPU-pCPU Mapping and vCPU-VM Con-
figuration
Zong et al. [19] analyzed the impact of the non-uniform virtual CPU and vCPU-
pCPU mapping on CMP system using Xen 3.4.0 hypervisor. The authors investi-
gated the impact of non-uniform vCPU-pCPU mapping by running multithreaded
applications (Apahe and TPC-H). The authors concluded that both dynamic and
static non-uniform vCPU-pCPU mapping have the same performance implication
i.e., negative impacts. Furthermore, the authors found out that the application
performance instability such as throughput has a linear relationship with the de-
29

gree of non-uniformity. For instant, the performance will be more stable if each
pCPU have the same number of vCPU. However, The authors did not test and an-
alyze the impact of vCPU-pCPU mapping on NUMA system and hyper threading
enabled architecture.
Yuxia and Wnzhi [45] investigated the impact of VMs scheduling on multicore
systems. They applied different VM-mapping combinations using KVM hypervi-
sor and NAS benchmark. They concluded that if the number of threads increases
(i.e., number of threads more than pCPUs), then the scheduler used in KVM
hypervisor can not work effectively in multicore NUMA architecture due to the
NUMA unaware property of CFS algorithm used in KVM. In addition, the au-
thors in [45] found out that due to the dynamic behavior of co-running VMs,
the overall performance and VMs scheduling strategy will be affected. It should
be noted that the latest hypervisors are NUMA aware [46, 47]. Therefore, the
findings of [45] might not apply to the state-of-the-art hypervisors.
Sogand and Lars. [45] studied the performance implication of over allocation of
vCPUs to VMs at NUMA architecture, using VMware ESXi 5.5 hypervisor. They
observed that the performance could decrease up to 20% when there is a massive
over-allocation of physical CPU resources. Moreover, the best performance was
gained when there were only a few VMs with no over-allocation. Such work is
different from our work. Authors tested different hypervisor than us. We tested
Citrex xenServer and KVM hypervisors. Also, the authors did not investigate
vCPU-pCPU mapping.
30

The summary of related work is shown in Table 3.1. As a summary of our
related work, we leave the reader with Table 3.1 to compare the work done by
each paper. As we see in Table 3.1, most of the authors analyzed and compared
various hypervisors without investigating the effect of vCPU-VM configuration
and vCPU-pCPU mapping. However, some of them analyzed either vCPU-VM
configuration or vCPU-pCPU mapping by using a certain hypervisor.
In this thesis, prior to evaluate the hypervisors (Citrix xenServer and KVM),
the best vCPU-VM configuration as well as vCPU-pCPU mapping strategies is
analyzed for each hypervisor using NUMA architecture. In addition, the effects
of hypervisor, virtual machine allocation, vCPU-VM configuration, and vCPU-
pCPU mappping on performance in terms of CPU utilization are investigated.
31

Tab
le3.
1:Sum
mar
yof
rela
ted
wor
k
Wor
kH
yp
ervis
orA
rchit
ectu
reV
irtu
aliz
atio
nB
ench
mar
kin
gH
yp
ervis
orvC
PU
-VM
vC
PU
-pC
PU
Use
dT
yp
eT
ool
Com
par
ison
Con
fiura
tion
Map
pin
g
Char
les
Dav
id[2
8]K
VM
,X
enC
MP
HA
V,
PV
PT
SY
esR
andom
lyR
andom
ly
Bab
uet
al[2
9]O
pen
VZ
,X
en,
xen
Ser
ver
CM
PC
onta
iner
,P
V,
FV
Unix
ben
chY
esR
andom
lyR
andom
ly
Man
cas
[30]
Vm
war
e,K
VM
CM
PN
otM
en-
tion
edP
assm
ask
Yes
Ran
dom
lyR
andom
ly
S.
Var
ette
etal
,[1
5]H
yp
er-
V,
KV
M,
VM
war
e,V
irtu
alB
ox
NU
MA
FV
,H
AV
HP
LY
esR
andom
lyR
andom
ly
Hw
ang
etal
.[4
]V
Mw
are,
Xen
SM
PH
AV
Ram
spee
d,
Net
per
fY
esR
andom
lyR
andom
ly
Hyp
er-V
,K
VM
Zon
get
al.
[19]
Xen
3.4.
0C
MP
PV
Apac
he,
TP
C-H
No
Ran
dom
lyN
otR
andom
ly
Yuxia
and
Wnzh
i[4
5]K
VM
NU
MA
PV
NA
SN
oR
andom
lyN
otR
andom
ly
Sog
and
and
Lar
s[2
1]V
Mw
are
EX
Si
5.5
NU
MA
Not
Men
-ti
oned
Vce
nte
r,P
erfo
rmac
e,SSH
+Sar
No
Not
Ran
dom
lyR
andom
ly
32

CHAPTER 4
RESEARCH METHODOLOGY
AND EXPERIMENTAL
DESIGN
In this chapter, we introduce our proposed methodology as well as our experimen-
tal design. Subsection 4.1 starts with some research questions that will influence
our research methodology and our experimental setup. In subsection 4.2 and 4.3,
we discuss our proposed methodology and methodology architecture. We discuss
experimental design in subsection 4.4.
4.1 Research Questions
To properly design and conduct an evaluation environment, an answer to some
research questions must be found. These questions are listed as follows:
33

1. What is the effect of hypervisors such as Citrix xenServer and KVM on CPU
utilization?
2. What is the effect of virtualization technology on performance?
(a) What is the effect of VM on performance?
(b) What is the effect of vCPU on performance?
(c) What is the effect of vCPU-pCPU pinning strategies on performance?
4.2 Proposed Methodology
In our evaluation process, we want to follow a systematic problem-solving ap-
proach [48, 49]allowing us to scientifically deliver our contributions explained in
section 1.4. In this study, empirical method [48, 49] is used which is based on
evidence, observations, and experiments.
As shown in Figure 4.1, the proposed methodology consists of six steps. In
the first step, we presented our research objectives. In the second step, we con-
ducted a literature review for our research objectives, to investigate the effect of
the virtualization layer, vCPUs-VMs allocation, and vCPUs-pCPUs matching on
performance. In step three, we built an experimental design and selected an ap-
propriate approach to achieved our research objectives. Performance evaluation
is presented in step four. In step five, we calculated statistics from experiments.
Finally, in step six, we analyzed and drew meaningful conclusions from our work.
34

Figure 4.1: Proposed Methodology
Figure 4.2: Proposed Methodology Architecture
35

4.3 Methodology Architecture
Our architecture, as shown in Figure 4.2, starts with two identical physical servers.
The specification of these two servers is shown in Table 4.1. We installed two
hypervisors (Citrix xenServer and KVM) on the physical servers. The two physical
machine have similar architecture and specifications in order to achieve a fair
assessment. Next, we created virtual machines running Ubuntu 16.04 as a guest
OS. We built virtual machines on each hypervisor in order to provide the test
environment. Finally, the PTS benchmarking tool is installed on each virtual
machine as a traffic generator and analyzer
4.4 Experimental Design
Various experiments were conducted for CPU utilization using two sate-of-the-art
hypervisors. Before starting our main experiments, we investigated the effect of
virtualization layer on elapsed time. It should be mentioned that we tested only
CPU bound operations. In order to investigate and choose the best vCPUs-VMs
allocation and mapping strategy for better CPU utilization and maximum perfor-
mance. We focused our test measurement for under allocation (i.e., the number
of vCPUs less than available logical CPUs), balance allocation of vCPUs to VMs
(i.e., equally divided available logical CPUs among VMs), and over-allocation (the
number of vCPUs more than available logical CPUs) and vCPU-pCPU mapping
strategies.
PTS benchmarking tool is used to generate the workload and analyze the re-
36

Figure 4.3: Experimental Design
Figure 4.4: One Solution of N-Queens Problem (8 x 8 board) [5]
37

sults and a detailed evaluation is conducted to measure elapsed time and CPU
utilization. PTS contains a variety of test profiles. For CPU bound operations,
we chose two important test profiles called N-Queens and John-the-Ripper bench-
marks. Workloads were generated using N-Queens benchmark, which report the
elapsed time in seconds. We also measured the CPU utilization at hypervisor level
for both hypervisors using Linux Top command.
4.4.1 N-Queens Benchmark
N-Queens is an open-source OpenMP benchmarking tool [27] that solves the N-
Queens problem. N-Queens problem is a classical combinatorial problem, widely
used as a benchmarking tool by researchers for CPU-intensive calculation that
have different workloads and simple structure [50, 51]. The problem involves
placing N queens on an N x N chessboard such that no queen can attack any
other. Thus, a solution requires that no two queens share the same row, column,
or diagonal. It is also used to test how the various hypervisors perform under
calculation intensive operations [50, 51]. The N-Queens problem sizes are shown
Table 4.1: Specification of the Servers
Specifications Server 1 Server 2
Hardware Model Intel Xeon Intel XeonProcessor Speed 2 GHz 2 GHzCPU Processor 12 Cores 12 CoresLogical Processors 24 cores 24 coresMain Memory (RAM) 64 GB 64 GBStorage Capacity 1024 GB 1024 GB
38

Table 4.2: N-Queens problem with elapsed time (seconds)
Board Size(N x Nchessboard)
Number of Solutionsto N Queens Problem
Without Virtu-alization
UsingxenServer
UsingKVM
1 1 <0 <0 <02 0 <0 <0 <02 0 <0 <0 <04 2 <0 <0 <05 10 <0 <0 <06 4 <0 <0 <07 40 <0 <0 <08 92 <0 <0 <09 352 <0 <0 <010 724 <0 <0 <011 2680 <0 <0 <012 14200 <0 <0 <013 73712 <0 <0 <014 365596 <0 <0 <015 2279184 <0 <0 <016 14772512 <0 <0 <017 95815104 3.38 3.46 3.5618 666090624 23.28 23.56 23.7519 4968057848 191.5 193.72 201.18
39

in Table 4.2. As the problem size increases, the corresponding possible solutions
and the elapsed time to solve the problem also increasing. For a regular-sized
board (8 x 8), there are 92 distinct solutions, one of them is shown in Figure 4.4.
In this thesis, we tested each hypervisor for different queens size ranges from 4 to
19.
4.4.2 Test Configurations
This evaluation is composed of two main experiments; Citrix xenServer-based
setup and KVM-based setup as shown in Figure 4.3. We have four main factors
in our experimental design namely: type of hypervisor, VMs, vCPUs, and work-
load. The objectives of these test configurations are to investigate the effects of
hyperviosr, VM, vCPU, and pinning strategies on performance. Fore every ex-
periment setup, six test cases and nine vCPU-VM configurations are presented.
Figure 4.3 illustrates the experimental design and the details of each test configu-
ration. In Figure 4.3, there are two different hypervisors, each hypervisor has six
different test cases. Each test case has nine different deployments i.e., allocation
of vCPUs to VMs. In every deployment, we run N-Queens benchmark for sixteen
different workloads (i.e., total 2 x 6 x 9 x 16 = 1728 experiments).
Each experiment is conducted on an identical separate server. Therefore, all
the hardware resources of the server are fully dedicated for each hypervisor and
the results obtained are fairly and reliably analyzed.
40

4.4.3 Test Cases
In these test cases, we gradually increase the number of active VMs on the top of
each hypervisor and vary the number of vCPUs inside VM as well as the workload.
The aim is to examine how the number of deployed load on a system and different
vCPUs-VMs configuration will effect the overall performance in terms of CPU
utilization and elapsed time.
One Virtual Machine
To evaluate the effect of hyperviosr, VMs, and vCPUs on performance, only one
VM is running by having different vCPUs configuration. We focused on our
test measurement for under allocation, balance, and over-allocation of vCPU-VM
configuration to investigate the effect of each factor on performance.
We started our test configuration with the simple case; one VM has two vCPUs
using N-Queens benchmark for different workload i.e., problem size range from 4
to 19. We measured average CPU utilization in percentage at VM level the elapsed
time for each N-Queens problem size. Then, we gradually increased the number
of vCPUs in the same VM (i.e., 4, 8, 12, 16, 20, 24, 28, and 32 vCPUs) until we
investigated the best vCPU-VM configuration for which maximum performance
was obtained in terms of CPU utilization and elapsed time. In addition to this,
to investigate the effect of virtulization layer for CPU bound operations, we run
one VM on the top of both hyperviosrs and allocate all physical CPU resource to
one VMs (e.g., one VM having 24 vCPUs).
41

Two Virtual Machines
To further analyze the effect of VMs and vCPUs on performance, we doubled the
number of active VMs and performed nine different experiments (vCPUs-VMs
deployment) like we did in ‘One Virtual Machine’ test case.
Four Virtual Machines
In this case the number of active VMs are doubled than case two (total active
VMs are four). The vCPUs-VM configurations are the same as for case one.
Six Virtual Machines
In this case, the number of active VMs are six, the rest of the configurations are
the same as for case one.
Eight Virtual Machines
In this case, the number of active VMs are doubled (i.e., three times of case two
and two time of case four), the other configurations are the same to as case one.
Moreover, to investigate the effect of pinning strategies and the importance of over
allocation of computing resources, we performed four different experiments using
eight concurrent VMs. The aim was to observed the significance of over allocation
of vCPUs and select the best vCPU-pCPU mapping strategies for better CPU
utilization.
42

Twelve Virtual Machines
In this case, the number of active VMs are twelve. The rest of configurations
remains the same as for case one.
43

CHAPTER 5
RESULTS AND DISCUSSION
In this chapter, the results have been discussed that were obtained using the PTS
benchmarking tool. The objectives of these experiments are to investigate the
effects of hyperviosr, VM, vCPU, and pinning strategies on performance. The
experimental results are shown in Figures 5.1 - 5.11 and Tables 5.1 - 5.3.
5.1 The Effect of Virtualization Technology
This test is designed to investigate the effect of virtualization technology layer
(hypervisor) on performance in terms of CPU bound operations. For this test,
only one VM allocated 24 vCPUs, having Ubuntu 16.04 as a guest OS, running at
the top of both hypervisors, as well as a host OS on a bare-metal (non virtualized)
machine. This test is performed using two powerful servers, server specifications
are shown in Table 4.1. In this experiment, the N-Queens benchmark is used as
a stress test to judge the virtualization overhead for CPU bound operations. The
performance (elapsed time) of non virtualized machine against commercial and
44

Figure 5.1: The effect of Virtualization Layer using N-Queens benchmark
open source hypervisor are given in Figures 5.1 and 5.2. Figure 5.1 illustrates
the effect of virtualization on performance using three different workloads (17,
18 and 19; which is low, medium, and high workload) of N-Queens benchmark.
The results illustrate that for low and medium workload there is no significant
performance overheard but for heavy workload a low performance overhead is
observed i.e., performance is decrease by 0.6% and 5% using Citrix xenServer
and KVM respectively. One of the reason of performance reduction for heavy
workload is that when we used heavy workload there are more context switching
due to high elapsed time (i.e., CPU cycle are wasted instead of being utilized by
vCPUs) and NUMA processor affinity between vCPUs as compared to low and
medium workload.
To ensure that the CPU utilization (i.e., elapsed time) seen with N-Queens
benchmark was not an anomaly, John-the-Ripper benchmark (CPU bound oper-
45

Figure 5.2: The effect of Virtualization Layer using John-the-Ripper benchmark
ation) is used as a benchmark with the same settings. Figure 5.2 shows the result
of Jon-the-ripper. Both benchmarks were run six times, and the results were av-
eraged. Both results illustrated that for CPU bound operations using only one
VM and consuming all CPUs, the virtualization overhead is almost minimal.
E = t(α/2) ∗ s/√n (5.1)
Both benchmarking results are statistically verified using equation 5.1. Where
E is the maximum error with one degree of confidence, (alpha) using two tail dis-
tribution, s is the standard deviation, and n is the number of samples. Confidence
Interval (CI) with 95% significance level and p value is calculated. CI levels over-
lap with each other and p value is less than 0.05. So, the results are significant
and there are no significant differences among the results.
46

5.2 The Effect of Virtual Machines on Perfor-
mance
To investigate the effect of VMs on performance. In these experiments, we vary
the number of VMs running on the top Citrix xenServer and KVM hypervisor.
We also vary the number of vCPUs allocation to VMs as well as the workloads,
as already discussed in chapter 4. For both hypervisors total 1728 (2 x 16 x
6 x 9) observations were obtained where (2) is the number of hypervisors used
in our experiments, (16) represents workloads, (6) shows different test cases of
VMs running on top of each hypervisor, and (9) represents different vCPU-VM
configurations. Out of 1728 obtained observations, the significant observations
(324 = 3 x 2 x 6 x 9) were found significant for CPU utilization as shown in
Tables 5.1 and 5.3. Based on the possible solutions and elapsed time, we chose
problem size 17 (low), 18 (medium) and 19 (heavy) workload.
Furthermore, for each experiment, the average CPU utilization in percentage
at hypervisor level is measured. But, only CPU utilization in percentage is in-
sufficient to investigate the effect of VMs on performance, especially when the
CPU utilization level is 100% . Then, we can not judge the effect of VMs on
performance. Therefore, the elapsed time to solve the N-Queens problem was cal-
culated to trace how much actual work is performed by CPU. In the remaining of
the thesis, we focused on elapsed time instead of CPU utilization in percentage.
To systematically investigate the effect of VMs on performance, we performed
three main experiments: under allocation, balance allocation, and over alloca-
47

Figure 5.3: The effect of Virtual Machines on Performance - Under allocation
tion of computing resources. We discussed the details of each experiment in the
following subsections.
5.2.1 Under Allocation
Under allocation is the case in which the total number of vCPUs assigned to
VMs are less than the total logical CPUs. Based on user configuration for under
allocation, the physical CPU cores are not fully utilized as shown in Figures 5.9
and 5.10. As a result, poor performance in terms elapsed time in seconds can be
expected.
Figure 5.3 shows the effect of VMs on performance for under allocation of
computing resource on two different hypervisors. In this experiment, the number
of vCPUs are kept fixed (i.e., total 16 out of 24 vCPUs are allocated to VMs),
while the number of VMs and workload are increased from one VM to eight VMs
and low workload to high workload, respectively. As the number of concurrent
48

VMs increases, the elapsed time in seconds also increases i.e., nearly double for
each workload. In a cloud environment, under allocation is not recommended due
to the poor performance in terms of CPU utilization. Moreover, we can not run
many VMs per our need, because the performance of the system decreases with
increases in number of VMs. In order to achieved better performance (i.e., low
elapsed time to solved N-Queens problem) and maximum CPU utilization, we
need to consume all CPUs. Therefor, we carried out experiments and discussed
in subsection 5.2.2 for balance allocation, where all the CPU cores were allocated
to active VMs.
5.2.2 Balance Allocation
The maximum performance (i.e., low elapsed time) can be achieved if 100% CPU
is utilized (24 out of 24 CPU logical CPUs are utilized), which is one of the main
objectives of cloud computing. In balance allocation, physical CPU is utilized
100% as shown in Figures 5.9, 5.10. Figure 5.4 depicts the effect of VMs on
performance using Citrix xenServer and KVM hypervisors for balance allocation.
In balance allocation, the number of vCPUs were kept fixed, while the number of
workload and active VMs varied. In this experiment, 24 out of 24 logical CPUs
were equally divided among VMs, such as: 24 CPUs cores were assigned to one
VM; 12 vCPUs, 6 vCPUs, 4 vCPUs, 3 vCPUs and 2 vCPUs were allocated to
other five test cases.
Figure 5.4 illustrates the effect of VMs on performance using balance alloca-
49

Figure 5.4: The effect of Virtual Machines on Performance - Balance allocation
tion. By comparing the results of balance allocation with under allocation, in
every test case and workloads, the improved performance (better elapsed time)
was achieved as shown in Figure 5.6.
If we compare the average elapsed time of each test case, inside balance allo-
cation test configuration (1 VM with 2 VMs; 2 VMs with 4 VM; 4 VMs with 8
VMs) using any workload, the average elapsed time is almost double, although
the CPU utilization level is 100%. In one VMs test case, total available physical
CPU resources (24 out of 24 logical CPUs) are allocated to one VMs. Therefore
the total elapsed time is minimum. For two VMs test case, the VMs time share
the CPU resources such as 50% CPU is be used by VM1 and 50% is used by VM2,
therefore the elapsed time is almost double (98% increase) by comparing with one
VM test case and so on.
We used linear regression model [52] for balance allocation to predict the future
elapsed time (i.e., if more or less than 12 VMs are running) using the following
formulas:
50

Y = β0 + β1 ∗ VM (5.2)
β0 =(∑Y ) ∗ (
∑VM2)− (
∑VM) ∗ (
∑VM ∗ Y )
n ∗ (∑VM2)− (
∑VM)2
(5.3)
β1 =n ∗ (
∑VM ∗ Y )− (
∑VM) ∗ (
∑Y )
n ∗ (∑VM2)− (
∑VM)2
(5.4)
Where Y is the dependent variable (elapsed time) and plotted it on Y-axis.
VM is the independent variable and plotted at on the X-axis which is the number
of active VMs running on the top of hypervisor. Beta 1 is the slope of the line and
Beta 0 is the Y-intercept [53]. Using equation 2, elapsed time can be predicted
from active VMs by the following equations:
ElapsedT ime(Sec)Citrix = −4.8 + 195.45 ∗ activeV Ms+− ε, R2 = 0.99 (5.5)
ElapsedT ime(Sec)KVM = −10.3 + 195.45 ∗ activeV Ms+− ε, R2 = 0.99 (5.6)
Both prediction models shown in equation 5.5 and 5.6 give a strong prediction
for new observations due to the R square values which are very close to 1. We
also calculated the CI considering the significant level as 95% for each workload
51

Figure 5.5: The effect of Virtual Machines on Performance - Over allocation
and for 6 test cases, namely: 1 VMs, 2 VMs, 4 VMs, 6 VMs, 8 VMs and 12 VMs.
It is clear that all CIs levels and means do not overlap with each other. This is
an indication of decrease in performance by increasing the number of concurrent
VMs from one to N, where N is the number concurrent VMs.
Figure 5.4 also illustrates the comparison between Citrix xenServer and KVM
hyperviosr for three different workload. It’s clearly shown that for each workloads
no significant difference was identified in either of the hypervisors.
5.2.3 Over Allocation
Figure 5.5 illustrates the effect of VMs on performance using over allocation (i.e.,
total 32 vCPUs are allocated to VMs). However, Figure 5.6 depicts a compari-
son among all test cases (under, balance, and over allocation). In case of under
allocation, 16 vCPUs were assigned to each VM. In addition, in case of balance
allocation, 24 vCPUs were allocated to each VM, 32 vCPUs were configured per
52

Figure 5.6: The effect of Virtual Machines on Performance
VM in case of over allocation. The performance (elapsed time) of over allocation
and balance allocation were found analogous for two different workload. However,
anomalous behavior of lowest performance (elapsed time) was shown by under
allocation results for medium and heavy workloads. Therefore, it is needed to
allocate a suitable vCPUs for each VM for better performance. The significance
of vCPU-VM allocation will be discussed in details in subsection 5.3.
5.3 The Effect of Virtual CPUs on Performance
The cloud service providers are interested to know how much resources (vCPUs-
VMs) should be allocated for maximum performance. Since large number of VMs
are running in cloud environment and sharing physical computer resources, a risk
of poor performance arises due to over allocation of physical CPU resources. These
performance bottlenecks should be investigated, quantified, and avoided.
Here, we are testing the impact of vCPU assigned to VM. Previous studies
[21, 43] showed that the system performance could be affected by using different
ways of the pCPUs. Each virtual machine is configured with a number of vCPUs.
53

Figure 5.7: The effect of Virtual CPUs on Performance - Citrix xenServer
Figure 5.8: The effect of Virtual CPUs on Performance - KVM
54

Figure 5.9: Total CPU Utilization at Hypervisor Level - Citrix xenServer
Figure 5.10: Total CPU Utilization at Hypervisor Level - KVM
55

The performance of a VMs having eight vCPUs will be doubled as compared to
four vCPU-VM configuration (e.g., balance and under allocation). One can decide
to use available pCPUs in two opposite ways such as by using few VMs having
large number of vCPUs, or large number of VMs having small number of vCPU.
Figures 5.7 and 5.8 show the elapsed time in second for different vCPUs con-
figurations (vi.e, CPU-VM configuration are 2, 4, 8, 12, 16, 20, 24, 28, and 32
vCPUs) using heavy workload (problem size 19). In both figures, the number of
active VMs increases from 1 to 12 with nine different vCPUs-VM configuration.
From both figures, it is clearly seen that, the performance is improved by allocat-
ing more vCPUs to VMs. However, there is a performance threshold for vCPUs
i.e, 24 out of 24 logical CPUs are consume. After the threshold, no significance
improvement was observed. The similar trend was observed in the data presented
in Tables 5.1 and Table 5.2, where the performance was decreased after crossing
the threshold. In One VM test case, the effect of over allocation of vCPUs to
VMs was low, but it was significantly high for other test cases. The time sharing
of CPU resources by VMs, in case of over allocation, could be the possible reason.
That why, there was no or very small time sharing in balance allocation. Time
sharing increases the number of context switches among VMs. The overhead, due
to excessive context switching between VMs and NUMA processor affinity, will
result performance reduction, and CPU cycle will be wasted instead of being uti-
lized by the VMs. After further analysis, higher performance implication of over
allocation was observed in 6, 8, and 12 VMs tests cases as compare to the other
56

Figure 5.11: Mean Elapsed time of Hypervisor, VMs, and vCPUs
test case (1,2, and 4). In addition to this, the CPU utilization for Citrix xenServer
and KVM are given in Figures 5.9 and 5.10. Both figures show CPU utilization
in percentage at hypervisor level i.e., how much the VMs are using the physical
CPU resources.
5.3.1 Concluding Remarks
In this section, we summarized the effect of hyperviosrs, VMs, and vCPUs on
elapsed time. Figure 5.11 illustrates the mean of elapsed time in seconds for two
hypervisors, active VMs, and vCPUs assigned to VMs using heavy workload. The
57

results reveal that mean elapsed time of both hypervisors are similar for active
VMs as well as for vCPUs per hypervisor. So, for CPU bound operations, there is
no significance difference to use commercial or open source hypervisor. The results
also depict that by increasing the number of active VMs from one to twelve VMs,
the performance will be decreases by 1106% i.e,. elapsed time to solve the N-
Queens problem increased. In addition, it is clearly seen that, the performance
is improved by allocating more vCPUs to VMs. However, there is a performance
threshold for vCPUs (i.e., balance allocation of vCPUs). After the threshold, no
significance improvement was observed.
5.4 The Significance of Over Allocation
The over allocations of vCPUs to VMs is also important in a cloud environment.
If a cloud service provider did not use over allocation of vCPUs, they may not be
able to use all the physical cores after live migration or idle VMs. For instance,
there is one host with 24 CPU cores, and there are two VMs running on the host
and each VM has 12 vCPUs. If one VM is migrated to another host, crashed, or
become idle then twelve physical CPU cores will not be used, although one VM
is overloaded. However, if each VM configure more than 24 vCPUs then there
would be enough vCPUs to utilize by overloaded VM after live migration or idle
VM.
To highlight the significance of over allocation of vCPUs on performance,
we performed two more experiments namely: uniform vCPUs and non-uniform
58
vCPU-VMs configuration. In addition, we compared two pinning strategies based
on the same experiments. The details are given in the following subsections.
Uniform vCPUs-VMs Allocation
In uniform vCPU configuration, each active VM has the same number of vCPUs
but no over allocation. In this experiment, we vary the pinning strategies and
fixed the number of VMs (eight VMs), vCPUs (i.e., each VM allocated three
VCPU, total vCPUs = 8 x 3 = 24), and also fixed the number of workloads (low,
medium, and high). Two out of eight VMs will run a low workload, two of them
with medium workload while the reaming four VMs will run the heavy workload.
Figure 5.12 illustrates the uniform vCPU-VM configuration for two vCPU
pinning strategies; pinning and no pining strategy. In no pinning strategy, the
hypervisor is free to schedule domain’s vCPUs on any pCPUs. While in pinning
strategy the hypervisor is free to schedule the Dom0 (hypervisor) vCPUs on any
pCPUs and other active VMs’ vCPUs are statically pinned to user define logical
CPUs. We discussed the pros and cons of pinning and no pinning in section 5.5.
To investigate the effect of vCPUs on uniform vCPUs, we have run two differ-
ent experiments with eight VMs each. The purpose of assigning different work-
loads to VMs, while keeping the same vCPUs configuration, was to investigate
the effect of over allocation and pinning strategies. Figure 5.12 shows that after
26 and 28 seconds (depending on pinning strategies), the VMs having low work-
load become idle, due to low workload they finished their task early as compare to
medium and high workload VMs. The other six VMs were still busy. However, the
59

Figure 5.12: The effect of Virtual CPUs on Performance - Uniform vCPUs perVMs
Figure 5.13: CPU Utilization for Uniform vCPUs
60

CPU utilization level dropped from 100% to 77% as shown in Figure 5.13. After
180 and 182 seconds (depending on pinning strategies), the VMs having medium
workload become idle. Now four VMs out of eight VMs are idle while other four
are still busy due to heavy workload. Thus, the average CPU utilization level
drops to 52%. So, there was no significant difference among pinning strategies
(pinning strategies have no effect on under allocation and balance allocation of
vCPUs-VMs). For better CPU utilization, the optimum vCPU-VMs configura-
tion is needed. In the next subsection, we will discussed the non-uniform vCPUs
test configuration by which CPU utilization and performance (in terms of elapsed
time) can be improved.
Non-uniform vCPUs-VMs Allocation
In non-uniform vCPU configuration, each active VM has the same vCPUs like
uniform configuration, but we used over allocation. In this experiment, we vary
the pinning strategies and fixed the number of vCPUs (6 vCPUs per VM), the
number of VMs (8 active VMs), and the number of workloads (low, medium, and
high). Two out of eight VMs will run a low workload, two of them with medium
workload while the reaming four VMs will run the heavy workload. The aim of
over allocation of vCPUs, in this experiment was to utilize all the physical cores
after idleness of VMs. Because four VMs were busy due to high workload and
other four VMs which having low and medium workload will be became idle due
to low and medium workload.
Figure 5.14 shows the significance of over allocation of vCPUs and the result
61

Figure 5.14: The effect of Virtual CPUs on Performance - Non-uniform vCPUsper VMs
Figure 5.15: CPU Utilization for Non-uniform vCPUs
62

of two pinning stratagies. It is shown, that after 28 and 26 seconds (depending
on pinning strategies), the VMs having low workload became idle. The other
six VMs having medium and high workload were still busy. But, this time the
CPU utilization level for no pinning strategy did not drop from 100% as shown in
Figure 5.15. Based on pinning strategies, the hypervisor may or may not assign
the idle vCPUs of two idle VMs (having low workload) to VMs having the medium
and high workload while no pinning strategy assign the idle vCPUs to medium
and heavy workload VMs. After 180 and 178 seconds (depending on pinning
strategies), the VMs having medium workload also became idle. Now, four out of
eight VMs are idle while four are still busy due to the heavy workload. The no
pinning strategy takes the advantage of over allocation of vCPUs, by using the
free vCPUs. In addition, the CPU utilization level for no pinning strategy did not
drop from 100% as shown in Figure 5.15. As a result, the performance (elapsed
time) is improved and the elapsed time to solved the N-Queens problem for the
heavy workload is minimized (i.e., almost half as compare with other two pinning
strategies). While the pinning strategies can not utilize the free vCPUs, because
it is restricted to run on particular vCPUs. In conclusion, pinning strategies have
effect on over allocation (vCPUs-VMs) and better performance (elapsed time) and
higher CPU utilization can be achieved using over allocation of vCPUs-VMs with
no pinning strategy.
63

Figure 5.16: Normal distribution of Elapsed time (sec), Uniformed vCPU alloca-tion
5.5 The Effect of Pinning Strategies on Perfor-
mance
We already discussed the effects of pinning and no pinning on performance in
subsection 5.4. Here, we briefly discuss the pros and cons of both strategies.
The effect of pinning strategies depends on workload types and vCPUs-pCPU
allocation (under, balance, and over allocation). Figures 5.16 and 5.17 show nor-
mal distribution of elapsed time (sec) for two pinning strategies. For uniform
vCPU allocation, it seems that both pinning strategies have similar normal dis-
tribution curve. But pinning strategy gives more stable performance for heavy
workload i.e., mean and standard deviation of pinning strategy is 3%, 71% respec-
tively lower than no pinning strategy as shown in Figure 5.16.
64

Figure 5.17: Normal distribution of Elapsed time (sec), Non-uniformed vCPUallocation
Nevertheless, the no pinning strategy having Non-uniformed vCPUs alloca-
tion performed better than pinning strategy as shown in 5.17. The elapsed time
decrease by 74.78% for no pinning strategy.
65

Table 5.1: Elapsed time (sec) to solve N-Queens problem using Citrix xenServer
P. Size Number of Active Active Active Active Active ActivevCPUs VMs: 1 VMs: 2 VMs: 4 VMs: 6 VMs: 8 VMs: 12
17
2 26.53 29.54 29.14 30.42 40.00 36.24
4 13.59 15.06 15.36 10.78 21.90 37.67
8 6.92 7.19 8.35 10.86 22.08 40.24
12 4.86 5.09 8.44 10.97 22.89 40.66
16 4.26 5.62 8.99 11.23 23.22 41.28
20 3.81 5.81 9.15 11.87 23.78 42.22
24 3.46 5.88 9.44 12.33 24.03 42.50
28 3.49 5.99 9.23 13.23 25.76 43.20
32 3.46 5.80 10.33 14.85 26.06 44.33
18
2 183.14 195.50 197.10 199.71 232.15 279.33
4 109.57 97.49 120.51 145.66 173.88 282.73
8 47.94 56.48 91.05 147.33 174.33 284.19
12 33.28 44.90 91.67 147.98 176.56 288.30
16 29.23 44.99 92.34 149.50 177.87 292.76
20 26.04 45.15 92.99 152.87 178.33 294.73
24 23.56 45.36 93.23 153.20 178.99 295.22
28 23.60 46.33 94.08 154.89 179.82 296.61
32 23.66 47.07 94.45 155.01 180.23 297.84
19
2 1509.53 1555.39 1591.24 1723.40 1876.00 2337.68
4 800.55 803.41 959.75 1188.84 1565.33 2347.59
8 402.55 476.67 768.80 1188.33 1579.87 2355.33
12 273.76 383.88 768.99 1190.65 1582.51 2364.10
16 244.91 383.97 771.22 1192.51 1584.76 2376.72
20 218.16 385.19 773.74 1196.19 1587.09 2383.11
24 193.72 385.33 775.11 1196.23 1591.72 2388.22
28 194.06 386.48 777.61 1197.56 1593.02 2391.71
32 195.7 387.58 779.15 1199.09 1595.01 2398.22
66

Table 5.2: Elapsed time (sec) to solve N-Queens problem using KVM
P. Size Number of Active Active Active Active Active ActivevCPUs VMs: 1 VMs: 2 VMs: 4 VMs: 6 VMs: 8 VMs: 12
17
2 27.04 20.43 28.54 31.04 29.52 36.89
4 13.81 14.12 16.49 16.93 22.33 38.29
8 7.28 7.64 11.22 16.99 23.82 40.72
12 6.58 6.45 11.54 17.23 23.97 40.83
16 4.64 6.72 11.89 17.55 24.09 41.22
20 3.91 6.78 12.23 18.23 24.98 42.12
24 3.56 6.85 12.87 18.66 25.20 42.72
28 3.68 7.09 12.54 19.20 25.33 43.80
32 3.70 7.42 13.08 18.48 26.30 44.03
18
2 188.05 141.16 195.20 205.29 206.97 278.36
4 94.27 96.03 118.00 139.81 164.43 283.06
8 48.67 54.71 89.55 141.22 132.67 285.63
12 46.18 47.39 90.56 141.49 149.56 289.98
16 31.98 47.90 90.34 143.31 172.55 290.60
20 26.33 48.64 91.23 145.98 156.80 291.66
24 23.75 48.80 91.44 147.94 149.36 292.25
28 24.58 49.25 92.78 149.66 131.84 294.30
32 24.79 49.55 93.65 151.83 188.23 295.00
19
2 1584.86 1617.69 1616.63 1700.89 1705.34 2329.92
4 778.25 792.54 964.91 1181.50 1554.88 2329.30
8 410.80 456.05 770.89 1183.45 1562.76 2350.07
12 349.86 371.08 772.98 1184.82 1568.32 2364.33
16 260.38 373.60 774.23 1186.23 1572.22 2371.22
20 216.20 374.75 777.87 1188.90 1574.22 2376.00
24 201.18 374.04 778.02 1190.32 1579.85 2382.33
28 203.99 375.03 779.33 1194.67 1584.34 2386.29
32 207.39 377.05 780.55 1197.33 1589.69 2390.76
67

Table 5.3: Elapsed time (sec) to solve N-Queens problem using Citrix xenServerand KVM for balance allocation
Hypervisor Workload Active VMs vCPU per VMs Elapsed Time (Sec)
Citrix xenServer
17
1 24 3.462 12 5.094 6 10.776 4 10.788 3 21.7712 2 36.24
18
1 24 23.562 12 44.904 6 90.936 4 140.318 3 172.7412 2 278.53
19
1 24 193.722 12 383.884 6 767.306 4 1188.848 3 1561.9212 2 2337.68
KVM
17
1 24 3.562 12 6.454 6 11.076 4 16.938 3 22.2412 2 36.89
18
1 24 23.752 12 47.394 6 89.496 4 139.818 3 183.6212 2 278.36
19
1 24 201.182 12 370.084 6 770.326 4 1181.508 3 1547.0512 2 2329.92
68

CHAPTER 6
CONCLUSIONS AND FUTURE
WORK
6.1 Conclusions
In this thesis, we tested the most recent hypervisors (open source and commer-
cial) in terms of CPU utilization. This test was conducted in a cloud environ-
ment. Specifically, we analyzed the implication of virtualization technology layer,
vCPU-VM assignment, and vCPU-pCPU mapping on performance in terms of
CPU utilization. In addition, we proposed a suitable vCPUs configuration and
pinning strategies for VMs in cloud environments. This configuration provides
adequate performance in terms of elapsed time and CPU utilization. It should be
mentioned that we tested only CPU bound operations. Cloud service providers
and researchers will get the benefits when they deploy VMs in a cloud environment
or evaluate open source and commercial hypervisors.
69

Using CPU bound operations, the results obtained from this evaluation showed
that commercial (Citrix xenServer) and open source (KVM) hypervisors have
similar performance in terms of elapsed and CPU utilization.
As per our observation, the performance of a system would degrade by running
many VMs, improper allocation of vCPUs to VMs, or using unsuitable vCPUs-
pCPUs pinning strategies. Moreover, we have found that elapsed time increases
when there is a massive over allocation of vCPUs.
The experimental results revealed that the best performance (elapsed time)
was gained when there was only a few active VMs with balance allocation and
over allocation (i.e., over allocation using no pinning strategies). In addition,
virtual CPUs to physical CPUs pinning strategies have no effect on performance
for under allocation and balance allocation of vCPUs-VMs. However, better CPU
utilization and low elapsed time were obtained using over allocation of vCPUs to
VM with no pinning strategy.
We suggested that the cloud service providers and researchers should consider
the effects of massive over allocation of vCPUs, VMs, and vCPUs-pCPUs mapping
when they choose deployment strategies for better performance and best CPU
resources allocation.
6.2 Future Work
Migration refers to moving a server environment from one place to another. With
most virtualization solutions it is possible to move a virtual machine from one
70

physical machine to another. Migration is typically used to improve reliability
and availability: in the case of hardware failure, the guest system can be moved
to a healthy server with limited downtime, if any. It is also useful if a virtual
machine needs to scale beyond the physical capabilities of the current host and
must be relocated to physical hardware with better performance. CPU utilization
during live migration of virtual machine from one host to another is one of the
future directions for this work.
There are a variety of vendors for the virtualization environment and all of
them claim that their virtualization hypervisor is the best, however they depend
on the used application. The obtained results from our evaluation experiments can
be validated using other commercial hypervisors (VMware, Hyper-V, and RHV).
This will aid the cloud service providers in choosing which hypervisor to use for
their specific needs.
In addition, CPU utilization for I/O bound operations has not been investi-
gated. We used CPU bound operations and evaluated the effects of hypervisor,
vCPU-VM configuration, and vCPU-pCPU mapping on performance. However,
I/O bound operations or the combination of both could be used to get improved
performance in terms of CPU utilization.
71

REFERENCES
[1] B. Hub, “Cloud computing main diagram,” [On-
line]. http://www.brighthub.com/environment/green-
computing/articles/127086.aspx/ [Accessed 28 December 2016], 2017.
[2] TCPI, “Total cloud computing information,” [Online]. Available:
http://cloudcomputingtypes.com/cloud-computing-models/ , [Accessed
24 May 2017], 2017.
[3] C. D. Graziano, “A performance analysis of xen and kvm hypervisors for
hosting the xen worlds project,” 2011.
[4] J. Hwang, S. Zeng, F. y Wu, and T. Wood, “A component-based perfor-
mance comparison of four hypervisors,” in 2013 IFIP/IEEE International
Symposium on Integrated Network Management (IM 2013). IEEE, 2013,
pp. 269–276.
[5] “N-queens, author=Code Pumpkin, year=2017, journal= [Online].
http://codepumpkin.com/n-queen-problem/ [Accessed 28 December 2016].”
72

[6] F. Fernandes, D. Beserra, E. D. Moreno, B. Schulze, and R. C. G. Pinto, “A
virtual machine scheduler based on cpu and i/o-bound features for energy-
aware in high performance computing clouds,” Computers & Electrical En-
gineering, vol. 56, pp. 854–870, 2016.
[7] I. Voras, M. Orlic, and B. Mihaljevic, “An early comparison of commercial
and open-source cloud platforms for scientific environments,” in KES Inter-
national Symposium on Agent and Multi-Agent Systems: Technologies and
Applications. Springer, 2012, pp. 164–173.
[8] P. Aghaalitari, “Development of a virtualization systems architecture course
for the information sciences and technologies department at the rochester
institute of technology (rit),” 2014.
[9] J. Sahoo, S. Mohapatra, and R. Lath, “Virtualization: A survey on concepts,
taxonomy and associated security issues,” pp. 222–226, 2010.
[10] X. Wei, “Application of server virtualization technology in enterprise infor-
mation,” in Internet Computing & Information Services (ICICIS), 2011 In-
ternational Conference on. IEEE, 2011, pp. 25–28.
[11] R. Chi, Z. Qian, and S. Lu, “Be a good neighbour: Characterizing per-
formance interference of virtual machines under xen virtualization environ-
ments,” in Parallel and Distributed Systems (ICPADS), 2014 20th IEEE In-
ternational Conference on. IEEE, 2014, pp. 257–264.
73

[12] Y. Xu, H. Yu, and W. Zheng, “A consistent backup mechanism for disaster
recovery that using container based virtualization,” in ChinaGrid Annual
Conference (ChinaGrid), 2012 Seventh. IEEE, 2012, pp. 95–100.
[13] u. R. Hafiz, Farag, A. Shawahna, F. Sajjad, and A. S. Abdulrahman, “Perfor-
mance evaluation of vdi environment,” in Innovative Computing Technology
(INTECH), 2016 Sixth International Conference on. IEEE, 2016, pp. 104–
109.
[14] S. Esfandiarpoor, A. Pahlavan, and M. Goudarzi, “Structure-aware online
virtual machine consolidation for datacenter energy improvement in cloud
computing,” Computers & Electrical Engineering, vol. 42, pp. 74–89, 2015.
[15] S. Varrette, M. Guzek, V. Plugaru, X. Besseron, and P. Bouvry, “Hpc perfor-
mance and energy-efficiency of xen, kvm and vmware hypervisors,” in 2013
25th International Symposium on Computer Architecture and High Perfor-
mance Computing. IEEE, 2013, pp. 89–96.
[16] A. Elsayed and N. Abdelbaki, “Performance evaluation and comparison of the
top market virtualization hypervisors,” in Computer Engineering & Systems
(ICCES), 2013 8th International Conference on. IEEE, 2013, pp. 45–50.
[17] W. Graniszewski and A. Arciszewski, “Performance analysis of selected hy-
pervisors (virtual machine monitors-vmms),” International Journal of Elec-
tronics and Telecommunications, vol. 62, no. 3, pp. 231–236, 2016.
74

[18] C. Horne, “Understanding full virtualization, paravirtualization, and hard-
ware assist,” White paper, VMware Inc, 2007.
[19] A. Zhong, H. Jin, S. Wu, X. Shi, and W. Gao, “Performance implications
of non-uniform vcpu-pcpu mapping in virtualization environment,” Cluster
Computing, vol. 16, no. 3, pp. 347–358, 2013.
[20] K. Kourai and R. Nakata, “Analysis of the impact of cpu virtualization
on parallel applications in xen,” in Trustcom/BigDataSE/ISPA, 2015 IEEE,
vol. 3. IEEE, 2015, pp. 132–139.
[21] S. Shirinbab and L. Lundberg, “Performance implications of over-allocation
of virtual cpus,” in Networks, Computers and Communications (ISNCC),
2015 International Symposium on. IEEE, 2015, pp. 1–6.
[22] G. J. Popek and R. P. Goldberg, “Formal requirements for virtualizable third
generation architectures,” Communications of the ACM, vol. 17, no. 7, pp.
412–421, 1974.
[23] V. Thakur and S. Kumar, “Load balancing approaches: Recent computing
trends,” International Journal of Computer Applications (0975-8887), vol.
131, no. 14, pp. 43–47, 2015.
[24] A. Beloglazov, J. Abawajy, and R. Buyya, “Energy-aware resource allocation
heuristics for efficient management of data centers for cloud computing,”
Future generation computer systems, vol. 28, no. 5, pp. 755–768, 2012.
75

[25] VMware, “Best practices for performance tuning of latency-sensitive work-
loads in vsphere vms,” Technical White Paper: VMware Inc. 3401 Hillview
Avenue Palo Alto CA 94304 USA, Item: EN-001169-02, 2013.
[26] A. Tikotekar, H. Ong, S. Alam, G. Vallee, T. Naughton, C. Engelmann, and
S. L. Scott, “Performance comparison of two virtual machine scenarios using
an hpc application: a case study using molecular dynamics simulations,”
in Proceedings of the 3rd ACM Workshop on System-level Virtualization for
High Performance Computing. ACM, 2009, pp. 33–40.
[27] PTS, “Phoronix test suite,” [Online]. Available: http://www.phoronix-test-
suite.com , [Accessed 21 April 2017], 2017.
[28] C. D. Graziano, “A performance analysis of xen and kvm hypervisors for
hosting the xen worlds project,” 2011.
[29] A. Babu, M. Hareesh, J. P. Martin, S. Cherian, and Y. Sastri, “System per-
formance evaluation of para virtualization, container virtualization, and full
virtualization using xen, openvz, and xenserver,” in Advances in Computing
and Communications (ICACC), 2014 Fourth International Conference on.
IEEE, 2014, pp. 247–250.
[30] C. Mancas, “Performance improvement through virtualization,” in 2015 14th
RoEduNet International Conference-Networking in Education and Research
(RoEduNet NER). IEEE, 2015, pp. 253–256.
[31] P. Mell, T. Grance et al., “The nist definition of cloud computing,” 2011.
76

[32] G. Heiser, “Virtualizing embedded linux-the system virtual machine can be
used to make linux-based applications faster and more responsive and secure.
here’s a primer to get you started.” Embedded Systems Design, vol. 21, no. 2,
p. 18, 2008.
[33] D. Processor, “Power and thermal management in the intel® core tm,” In-
tel® Centrino® Duo Mobile Technology, vol. 10, no. 2, p. 109, 2006.
[34] C. Janssen, “Techopedia,” Techopedia,[Online]. Available:
http://www.techopedia.com/definition/2851/central-processing-unit-
cpu,[Accessed 02 December 2016].
[35] L. Wang, G. Von Laszewski, A. Younge, X. He, M. Kunze, J. Tao, and
C. Fu, “Cloud computing: a perspective study,” New Generation Computing,
vol. 28, no. 2, pp. 137–146, 2010.
[36] T. Dillon, C. Wu, and E. Chang, “Cloud computing: issues and challenges,”
in Advanced Information Networking and Applications (AINA), 2010 24th
IEEE International Conference on. Ieee, 2010, pp. 27–33.
[37] W. Jansen and T. Grance, “Sp 800-144. guidelines on security and privacy
in public cloud computing,” 2011.
[38] S. Goyal, “Public vs private vs hybrid vs community-cloud computing: A
critical review,” International Journal of Computer Network and Information
Security, vol. 6, no. 3, p. 20, 2014.
77

[39] V. Venkatesh, “Optimization of cpu scheduling in virtual machine environ-
ments,” Ph.D. dissertation, Universite d’Ottawa/University of Ottawa, 2015.
[40] N. Alam, “Survey on hypervisors,” Indiana University, Bloomington, School
of Informatics and Computing, 2009.
[41] A. J. Younge, R. Henschel, J. T. Brown, G. Von Laszewski, J. Qiu, and G. C.
Fox, “Analysis of virtualization technologies for high performance comput-
ing environments,” in Cloud Computing (CLOUD), 2011 IEEE International
Conference on. IEEE, 2011, pp. 9–16.
[42] M. K. edziora, “gartner magic quadrant,” [Online]. Available:
https://blogs.technet.microsoft.com/mkedziora/2014/07/16/co-to-jest-
magiczny-kwadrat-gartnera-gartner-magic-quadrant/ [Accessed 05 December
2016], 2016.
[43] S. Shirinbab, L. Lundberg, and D. Ilie, “Performance comparison of kvm,
vmware and xenserver using a large telecommunication application,” in Cloud
Computing. IARIA XPS Press, 2014.
[44] J. Frappier, VMware vSphere Resource Management Essentials. Packt Pub-
lishing Ltd, 2014.
[45] Y. Cheng and W. Chen, “Evaluation of virtual machine performance on numa
multicore systems,” in P2P, Parallel, Grid, Cloud and Internet Computing
(3PGCIC), 2013 Eighth International Conference on. IEEE, 2013, pp. 136–
143.
78

[46] L. Cherkasova, D. Gupta, and A. Vahdat, “Comparison of the three cpu
schedulers in xen,” SIGMETRICS Performance Evaluation Review, vol. 35,
no. 2, pp. 42–51, 2007.
[47] M. Takuya, “How numa balancing moves kvm guests,” 2014.
[48] A. Strauss, J. Corbin et al., Basics of qualitative research. Newbury Park,
CA: Sage, 1990, vol. 15.
[49] Y. K. Singh and R. Bajpai, Research methodology: Techniques and trends.
APH Pub., 2007.
[50] A. Fonseca, N. Lourenco, and B. Cabral, “Evolving cut-off mechanisms and
other work-stealing parameters for parallel programs,” in European Confer-
ence on the Applications of Evolutionary Computation. Springer, 2017, pp.
757–772.
[51] K.-L. Du and M. Swamy, “Tabu search and scatter search,” in Search and
Optimization by Metaheuristics. Springer, 2016, pp. 327–336.
[52] R. L. Lorza, F. S. Gomez, and E. P. V. Gonzalez, “Cyclone performance pre-
diction using linear regression techniques,” in International Joint Conference
SOCO16-CISIS16-ICEUTE16. Springer, 2017, p. 53.
[53] S. Asumadu-Sarkodie and P. A. Owusu, “Recent evidence of the relationship
between carbon dioxide emissions, energy use, gdp, and population in ghana:
A linear regression approach,” Energy Sources, Part B: Economics, Planning,
and Policy, pp. 1–9, 2017.
79

Vitae
� Name: Hafiz ur Rahman
� Nationality: Pakistan
� Date of Birth: January 18, 1988
� Research Interest: Cloud Computing, Networking, Big Data, and
Databases
� Earned a Master of Science degree in Computer Science (MSCS)
from King Fahd University of Petroleum and Minerals (KFUPM),
Dhahran, Saudia Arabia, in May 2017.
� Earned a Bachelors of Science degree in Computer Science (BSCS)
from University of Peshawar, KPK, Pakistan, in December 2011.
� Mobile: 00966599499345; 00923459139719
� Email: hafiz [email protected]
� Web: https://www.researchgate.net/profile/Hafizur_Rahman12
� Permenant Address: Koherai Malakand P/O Malakand Tehseel
Balambat, Lower Dir, KPK, Pakistan
80

![[XLS]Untitled Spreadsheet · Web viewata ur rahman shamsher rahman Fizza jamshed Jamshed shah safi navira sultan sultan uddin Noorullah Nizamuddin Wali Ur Rahman Naqib Ullah Amjad](https://img.pdfslide.us/doc/110x75/5b3a12a37f8b9a4a728edb58/xlsuntitled-web-viewata-ur-rahman-shamsher-rahman-fizza-jamshed-jamshed-shah.jpg)