Embed Size (px)
Citation preview
General rights Copyright and moral rights for the publications made accessible in the public portal are retained by the authors and/or other copyright owners and it is a condition of accessing publications that users recognise and abide by the legal requirements associated with these rights.
Users may download and print one copy of any publication from the public portal for the purpose of private study or research.
You may not further distribute the material or use it for any profit-making activity or commercial gain
You may freely distribute the URL identifying the publication in the public portal If you believe that this document breaches copyright please contact us providing details, and we will remove access to the work immediately and investigate your claim.
Downloaded from orbit.dtu.dk on: May 14, 2020
H2 assisted NH3-SCR over Ag/Al2O3 for automotive applications
Fogel, Sebastian
Publication date:2013
Document VersionPublisher's PDF, also known as Version of record
Link back to DTU Orbit
Citation (APA):Fogel, S. (2013). H
2 assisted NH
3-SCR over Ag/Al
2O
3 for automotive applications. Department of Physics,
Technical University of Denmark.
Ph.D. Thesis
H2 assisted NH3-SCR over Ag/Al2O3 for automotive applications
Sebastian Fogel
May 2013
Technical University of Denmark
Department of Physics
Haldor Topsøe A/S
2013-05-14
i
Preface The work in this Ph.D. thesis was performed at the R&D Division at Haldor Topsøe A/S, Denmark
and at the Technical University of Denmark, Department of Physics. The work was supported by
the Danish Council for Strategic Research through grant 09-067233. Project partners were
Chalmers University of Technology, Sweden, Amminex A/S, Denmark, Technical University of
Denmark and Haldor Topsøe A/S, Denmark.
A lot of people have helped me during my Ph.D. with varying things, from sample analysis to
proof reading, from welding to theoretical discussions and everything in between. Without this
help I doubt this work would have been possible. First I would like to thank all colleagues in the
environmental departments at Topsøe for making my stay there a time to remember. At Topsøe
I also want to thank Tais – sometimes I felt you believed in me more than I did, everyone in
Miljølab (especially Drago) for help with the test set-up there, everyone in building 10 for help
with monolith preparation, Cecile and Jesper for all the work with the set-up, Chi-Mahn for help
with SEM, Anders for help with algorithms for engine testing, Magnus, Bjarne, Holger, Kristoffer,
Eilif and Karsten for help with the engine testing, Axel and Mark for help with the control both in
engine tests and at the test set-up and Susanne for proof reading of articles. At Chalmers I want
to thank Stefanie, Louise and Magnus for nice meetings and interesting discussions. My car-
buddies, Henrik, Olle and Christian thanks for making the time in the car to and from work
enjoyable.
Thanks to my supervisors: Marie for helping me to understand what this was all about in the
beginning, Jacob for help with monolith preparation and the theory behind it, Søren for always
having time (even when you left DTU) and Dmitry for teaching me the practical aspects of what
it means and how to do research. The set-up of supervisors has changed during the years but
one thing has been constant Pär. Thank you for being patient and explaining things even when I
was slow or reluctant. Your point was (most often) the right, sometimes I just had to find that
out for myself.
Finally thanks to my beloved Sara for supporting me throughout these years.
Ravnholm
May 2013
Sebastian Fogel
2013-05-14
ii
Abstract The up-coming strict emission legislation demands new and improved catalysts for diesel
vehicle deNOx. The demand for low-temperature activity is especially challenging. H2-assisted
NH3-SCR over Ag/Al2O3 has shown a very promising low-temperature activity and a combination
of Ag/Al2O3 and Fe-BEA can give a high NOx conversion in a broad temperature window without
the need to dose H2 at higher temperatures. The aim of this study has been to investigate the
combined Ag/Al2O3 and Fe-BEA catalyst system both at laboratory-scale and in full-scale engine-
bench testing. The catalysts were combined both in a sequential dual-bed layout and a dual-layer
layout where the catalysts were coated on top of each other. The Ag/Al2O3 catalyst was also
investigated with the aim of improving the sulphur tolerance and low-temperature activity by
testing different alumina-supports. A large focus of this study has been the preparation of
monolithic catalyst bricks for the catalyst testing.
A high SBET and higher Ag loading gave a high sulphur tolerance and activity. It was believed that
the high SBET is needed to give a higher NH3 adsorption capacity, necessary for the SCR reaction.
A higher Ag loading gives more Ag sites and probably a favourable Ag dispersion. Testing with
sulphur gave an increased activity of the catalysts. Testing of monolithic catalysts showed a
similar activity enhancement after a few standard test cycles. A change in the dispersion or state
of Ag can be possible reasons for the activation seen and the activation was believed to be
related to Ag and not the alumina.
Small-scale laboratory testing showed that it was preferred to have Ag/Al2O3 either upstream or
as the outer layer of Fe-BEA. This was attributed to complete NH3 oxidation over Fe-BEA giving a
deficit of NH3 over the Ag/Al2O3 if it was placed downstream or as the inner layer. Full-scale
engine testing, on the other hand, showed the opposite for a dual-brick layout. High NO2
concentrations are believed to give fast-SCR over the Fe-BEA when it was placed upstream of the
Ag/Al2O3. The activity of the combined catalyst layouts were higher than the activity for
individual catalysts when less or no H2 was co-fed in the small-scale case showing that there
were synergistic effects by combining them. The dual-layer layout showed the best performance
which is believed to be attributed the short diffusion distance between the layers allowing
diffusion of reaction intermediates between them.
Ag/Al2O3 only and the combined Ag/Al2O3 – Fe-BEA systems were active during the transient
NEDC. The NOx conversions were not very high which is related to the very low temperature of
the NEDC and the lower than expected activity of the Ag/Al2O3 catalyst seen in stationary
testing. The most interesting result was that the catalyst systems showed NOx conversion
already from the start of the cycle, before any NH3 or H2 was dosed. NOx storage over the
Ag/Al2O3 was believed to be the most likely explanation for this. The NOx conversion could be
enhanced by dosing of NH3 and H2 at temperatures lower than 150°C that was used as standard
starting temperature of dosing. However, dosing too early inhibited the NOx conversion.
2013-05-14
iii
Dansk resumé De fremtidige restriktioner i miljølovgivningen for dieselbiler kræver nye og forbedrede
katalysatorer, især i lav-temperaturområdet. H2-assisteret NH3-SCR over Ag/Al2O3 har vist stort
potentiale, og en kombination af Ag/Al2O3 og Fe-BEA kan give en høj NOx omsætning i et stort
temperaturområde uden der er behov for at dosere H2 ved højere temperaturer. Målet med
denne afhandling har været at undersøge det kombinerede Ag/Al2O3 og Fe-BEA system både i
laboratorieskala og i fuldskala motortest. Ag/Al2O3 blev også undersøgt med det formål at
forbedre svovletolerancen og lav-temperatur aktiviteten. Der blev fokuseret på præparation af
monolitter til testning.
En høj SBET og en højere Ag-koncentration gav en høj svovltolerance og aktivitet. Den høje SBET
gav en høj NH3-adsorptionskapacitet, og høj Ag-koncentration gav flere sites og muligvis en
mere optimal Ag-dispersion. Frisk Ag/Al2O3 aktivitet blev højere efter testning både med svovl
og NO2. Aktiveringen formodes at være koblet til Ag og ikke alumina. En ændring i Ag-
dispersionen kan være en sandsynlig forklaring.
Monolitforsøgene viste synergieffekter ved at kombinere Ag/Al2O3 og Fe-BEA sammenlignet
med de individuelle katalysatorer. Det var en fordel at have Ag/Al2O3 i en opstrøms eller ydre
position i forhold til Fe-BEA i laboratorietest i lille skala. Test i fuldskala gav de modsatte
resultater. Forskellen var at Fe-BEA gav en fuldstændig NH3 omsætning i de første test, og at NO2
i feeden gav såkaldt ”fast-SCR” over Fe-BEA i fuldskala testene. En dual-layer layout gav den
bedste aktivitet da H2 niveauet blev sænket. Det forklares med den korte diffusionsafstand, der
giver mulighed for diffusion af reaktionsmellemprodukter. Transiente motortest viste aktivitet
helt fra starten af cyklussen, længe inden nogen NH3 eller H2 var doseret. Den bedste forklaring
på det er NOx lagring over Ag/Al2O3.
2013-05-14
iv
Papers I. S. Fogel, D.E. Doronkin, P. Gabrielsson, S. Dahl, 2012, “Optimisation of Ag loading and
alumina characteristics to give sulphur-tolerant Ag/Al2O3 catalyst for H2-assisted NH3-
SCR of NOx”, Appl. Catal. B, 125, 457-464.
II. S. Fogel, D.E. Doronkin, J.W. Høj, P. Gabrielsson, S. Dahl, 2013, “Combination of Ag/Al2O3
and Fe-BEA for high-activity catalyst system for H2-assisted NH3-SCR of NOx for light-
duty diesel car applications”, Top Catal., 56, 14-18.
III. S. Fogel, P. Gabrielsson, 2013, “H2-assisted NH3-SCR over Ag/Al2O3: An engine-bench
study”, in manuscript.
IV. D.E. Doronkin, T.S. Khan, T. Bligaard, S. Fogel, P. Gabrielsson, S. Dahl, 2012, “Sulfur
poisoning and regeneration of the Ag/γ-Al2O3 catalyst for H2-assisted SCR of NOx by
ammonia”, Appl. Catal. B, 117-118, 49-58.
V. S. Tamm, S. Fogel, P. Gabrielsson, M. Skoglundh, L. Olsson, 2013, “The effect of the gas
composition on hydrogen-assisted NH3-SCR over Ag/Al2O3”, Appl. Catal. B, 136-137, 168-
176
VI. D.E. Doronkin, S. Fogel, S. Tamm, L. Olsson, T.S. Khan, T. Bligaard, P. Gabrielsson, S. Dahl,
2012, “Study of the “Fast SCR”-like mechanism of H2-assisted SCR of NOx with ammonia
over Ag/Al2O3”, Appl. Catal. B, 113-114, 228-236.
Contribution report
I. I performed most of the experimental work and evaluated the results with my co-
authors, especially D. Doronkin. I also wrote the manuscript.
II. I prepared the catalyst and evaluated the results with my co-authors. I also wrote the
manuscript.
III. I performed all experimental work, interpreted the results and wrote the article.
IV. I participated in the in the planning of experiment strategy and the interpretation of the
results, discussion and evaluation of the results. I also performed calculation of required
tolerance to sulphur.
V. I prepared the catalysts and prepared that section of the manuscript and participated in
the discussion of the results.
VI. I participated in the discussion and evaluation of the results.
Papers not included in the thesis
D.E. Doronkin, S. Fogel, P. Gabrielsson, S. Dahl, 2013, “Ti and Si doping as a way to increase low
temperature activity of sulfated Ag/Al2O3 in H2 -assisted NOx SCR by NH3”, in manuscript.
2013-05-14
Table of Contents Preface ..................................................................................................................................................................................... i
Abstract .................................................................................................................................................................................. ii
Dansk resumé .................................................................................................................................................................... iii
Papers ....................................................................................................................................................................................iv
Contribution report .....................................................................................................................................................iv
1 Introduction ................................................................................................................................................................ 1
1.1 Background ....................................................................................................................................................... 1
1.2 Ag/Al2O3 ............................................................................................................................................................. 3
1.3 Motivation .......................................................................................................................................................... 6
2 Catalyst development ............................................................................................................................................. 7
2.1 Materials and method ................................................................................................................................... 7
2.2 Results and discussion.................................................................................................................................. 7
2.3 Conclusions .................................................................................................................................................... 12
2.4 Summary ......................................................................................................................................................... 13
3 Monolith preparation: effect of slurry properties ................................................................................... 14
3.1 Theoretical background ............................................................................................................................ 14
3.2 Materials and method ................................................................................................................................ 16
3.3 Results and discussion............................................................................................................................... 17
3.3.1 Topsøe alumina ................................................................................................................................... 17
3.3.2 Siralox alumina ................................................................................................................................... 22
3.4 Conclusions .................................................................................................................................................... 24
4 Monolith testing ..................................................................................................................................................... 25
4.1 Materials and method ................................................................................................................................ 25
4.1.1 Small-scale laboratory testing: Ag/Al2O3 and Fe-BEA combinations ........................... 25
4.1.2 Medium-scale laboratory testing ................................................................................................. 25
4.1.3 Engine-bench testing ........................................................................................................................ 26
4.2 Results and discussion............................................................................................................................... 27
4.2.1 Small-scale laboratory testing: Ag/Al2O3 and Fe-BEA combinations ........................... 27
4.2.2 Stationary engine-bench testing .................................................................................................. 30
4.2.3 Transient engine-bench testing ................................................................................................... 36
4.3 Conclusions .................................................................................................................................................... 39
5 Overall conclusions and future outlook ....................................................................................................... 40
5.1 Conclusions .................................................................................................................................................... 40
5.2 Future ............................................................................................................................................................... 40
6 References ................................................................................................................................................................ 42
Appendix ................................................................................................................................................................................ a
A. List of abbreviations ........................................................................................................................................... a
B. Monolith preparation......................................................................................................................................... b
2013-05-14
1
1 Introduction
1.1 Background
Diesel engines are completely dominating for heavy-duty vehicles such as trucks and busses. In
Western Europe gasoline has had the main market share for light-duty vehicles with an
increased share for diesel since the 1990’s. The increase in diesel share of new registration was
dramatic from the end of the 1990’s to the middle of 2000’s where it levelled out at around 50%
of the market share [1]. One of the reasons for the increased popularity is the lower fuel
consumption compared to gasoline vehicles. Diesel is also less costly than gasoline in most
European countries. Together, this gives substantially lower operational costs for the owner
even though the diesel technology is more costly than the gasoline technology. Many countries
e.g. Germany and the UK also have tax incentives to increase sell of low CO2 emitting cars which
include many smaller diesel vehicles [2]. EU legislation that limits the fleet average emitted CO2
for new vehicles to 130 g/km will be gradually implemented from 2012 to 2015 with a long-
term target of 95 g/km in 2020 [3]. This could further increase the incentive for small diesel
engines.
Emissions are harmful, both for the environment and for humans. NOx and especially NO2 are
toxic. Exposure to NO2 can give respiratory and cardiovascular diseases. NOx are powerful
greenhouse compounds, NOx is 7-10 times [4] and N2O is 270 times more powerful than CO2. NOx
also contributes to acid rain, photochemical smog and ground-level ozone [5]. PM can give
asthma and other respiratory effects [6]. CO is highly toxic by blocking the O2 uptake in the
lungs.
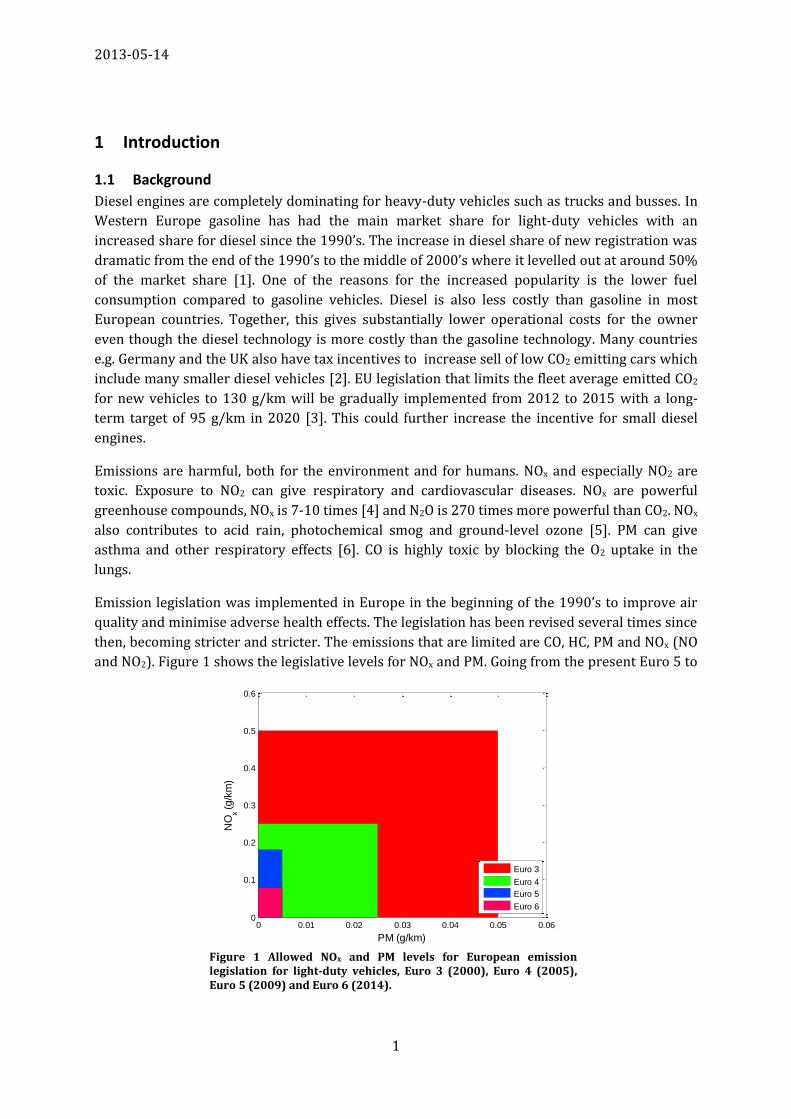
Emission legislation was implemented in Europe in the beginning of the 1990’s to improve air
quality and minimise adverse health effects. The legislation has been revised several times since
then, becoming stricter and stricter. The emissions that are limited are CO, HC, PM and NOx (NO
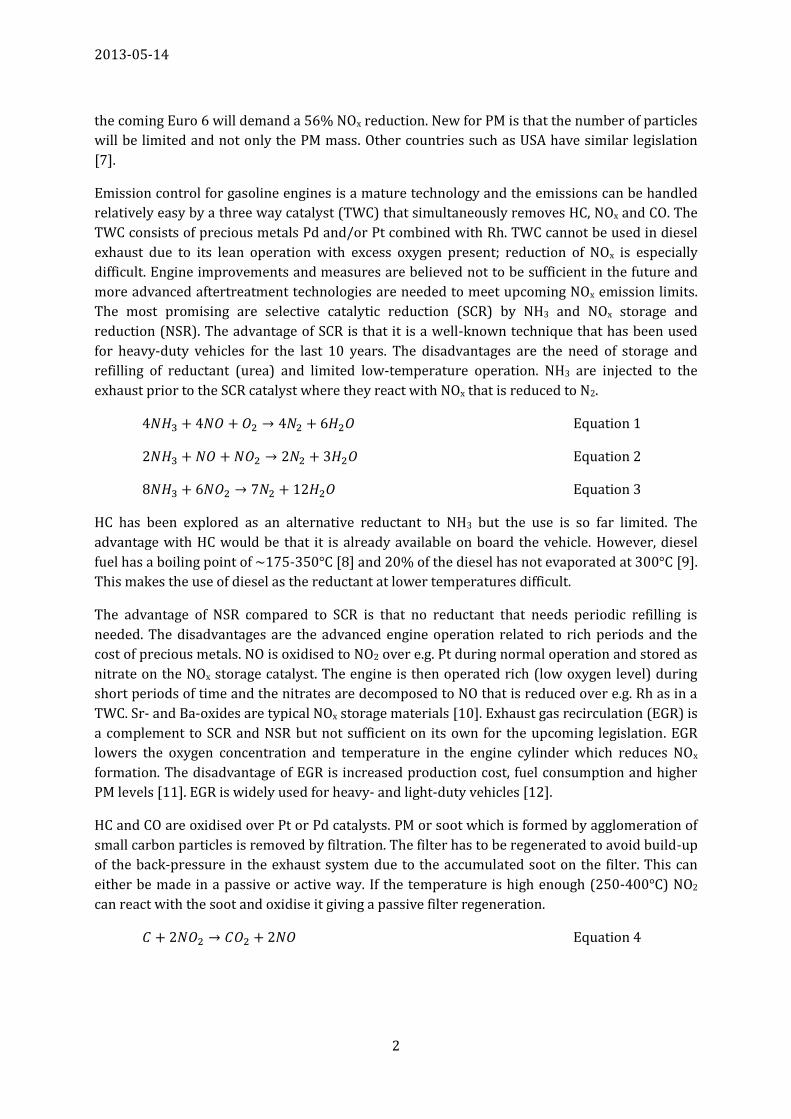
and NO2). Figure 1 shows the legislative levels for NOx and PM. Going from the present Euro 5 to
Figure 1 Allowed NOx and PM levels for European emission legislation for light-duty vehicles, Euro 3 (2000), Euro 4 (2005), Euro 5 (2009) and Euro 6 (2014).
0 0.01 0.02 0.03 0.04 0.05 0.060
0.1
0.2
0.3
0.4
0.5
0.6
PM (g/km)
NO
x (g
/km
)
Euro 3
Euro 4
Euro 5
Euro 6
2013-05-14
2
the coming Euro 6 will demand a 56% NOx reduction. New for PM is that the number of particles
will be limited and not only the PM mass. Other countries such as USA have similar legislation
[7].
Emission control for gasoline engines is a mature technology and the emissions can be handled
relatively easy by a three way catalyst (TWC) that simultaneously removes HC, NOx and CO. The
TWC consists of precious metals Pd and/or Pt combined with Rh. TWC cannot be used in diesel
exhaust due to its lean operation with excess oxygen present; reduction of NOx is especially
difficult. Engine improvements and measures are believed not to be sufficient in the future and
more advanced aftertreatment technologies are needed to meet upcoming NOx emission limits.
The most promising are selective catalytic reduction (SCR) by NH3 and NOx storage and
reduction (NSR). The advantage of SCR is that it is a well-known technique that has been used
for heavy-duty vehicles for the last 10 years. The disadvantages are the need of storage and
refilling of reductant (urea) and limited low-temperature operation. NH3 are injected to the
exhaust prior to the SCR catalyst where they react with NOx that is reduced to N2.
Equation 1
Equation 2
Equation 3
HC has been explored as an alternative reductant to NH3 but the use is so far limited. The
advantage with HC would be that it is already available on board the vehicle. However, diesel
fuel has a boiling point of ~175-350°C [8] and 20% of the diesel has not evaporated at 300°C [9].
This makes the use of diesel as the reductant at lower temperatures difficult.
The advantage of NSR compared to SCR is that no reductant that needs periodic refilling is
needed. The disadvantages are the advanced engine operation related to rich periods and the
cost of precious metals. NO is oxidised to NO2 over e.g. Pt during normal operation and stored as
nitrate on the NOx storage catalyst. The engine is then operated rich (low oxygen level) during
short periods of time and the nitrates are decomposed to NO that is reduced over e.g. Rh as in a
TWC. Sr- and Ba-oxides are typical NOx storage materials [10]. Exhaust gas recirculation (EGR) is
a complement to SCR and NSR but not sufficient on its own for the upcoming legislation. EGR
lowers the oxygen concentration and temperature in the engine cylinder which reduces NOx
formation. The disadvantage of EGR is increased production cost, fuel consumption and higher
PM levels [11]. EGR is widely used for heavy- and light-duty vehicles [12].
HC and CO are oxidised over Pt or Pd catalysts. PM or soot which is formed by agglomeration of
small carbon particles is removed by filtration. The filter has to be regenerated to avoid build-up
of the back-pressure in the exhaust system due to the accumulated soot on the filter. This can
either be made in a passive or active way. If the temperature is high enough (250-400°C) NO2
can react with the soot and oxidise it giving a passive filter regeneration.
Equation 4
2013-05-14
3
The NO2 can come from up-stream NO to NO2 oxidation over precious metals, e.g. in a DOC. In
active regeneration extra diesel fuel is periodically injected and oxidised over an oxidation
catalyst to raise the temperature to 450-600°C which is sufficient to burn off the soot at the filter
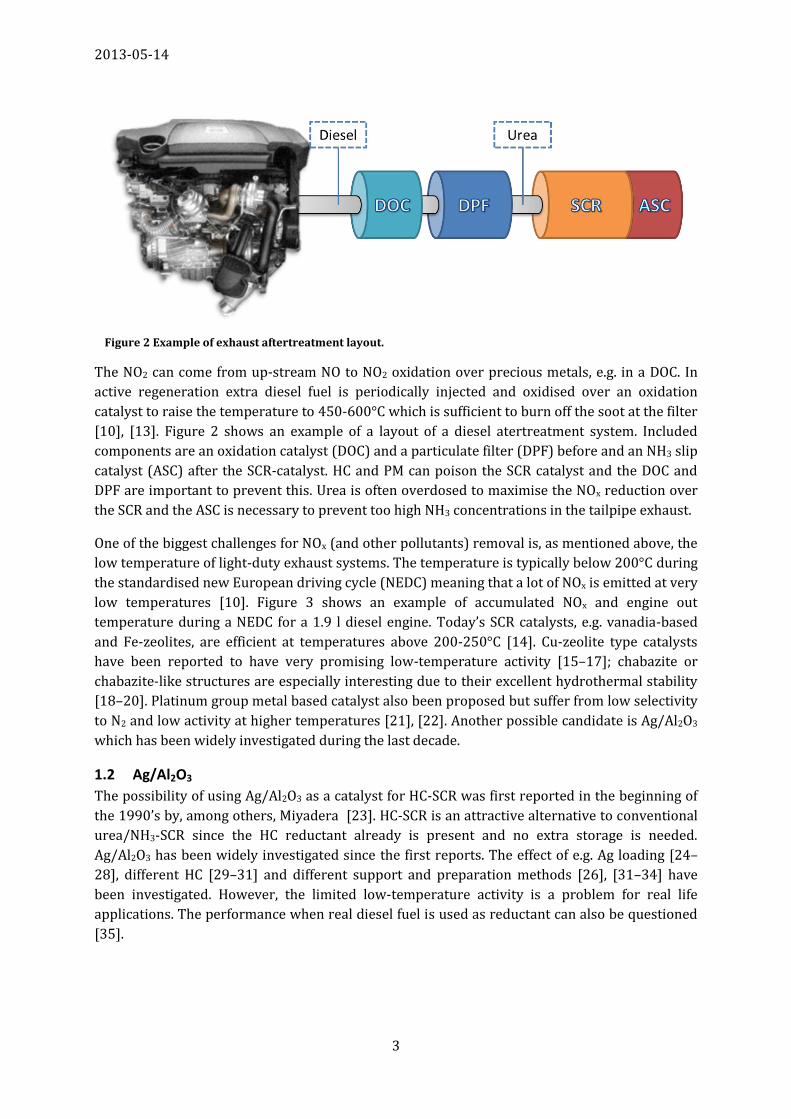
[10], [13]. Figure 2 shows an example of a layout of a diesel atertreatment system. Included
components are an oxidation catalyst (DOC) and a particulate filter (DPF) before and an NH3 slip
catalyst (ASC) after the SCR-catalyst. HC and PM can poison the SCR catalyst and the DOC and
DPF are important to prevent this. Urea is often overdosed to maximise the NOx reduction over
the SCR and the ASC is necessary to prevent too high NH3 concentrations in the tailpipe exhaust.
One of the biggest challenges for NOx (and other pollutants) removal is, as mentioned above, the
low temperature of light-duty exhaust systems. The temperature is typically below 200°C during
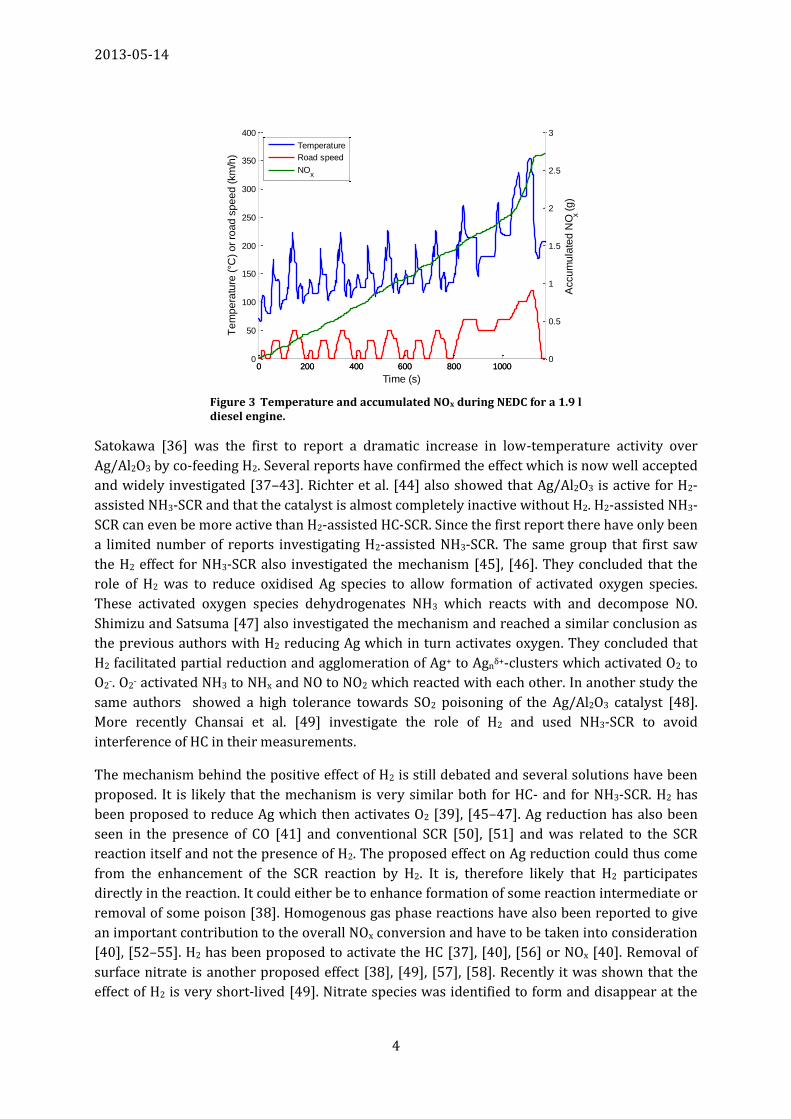
the standardised new European driving cycle (NEDC) meaning that a lot of NOx is emitted at very
low temperatures [10]. Figure 3 shows an example of accumulated NOx and engine out
temperature during a NEDC for a 1.9 l diesel engine. Today’s SCR catalysts, e.g. vanadia-based
and Fe-zeolites, are efficient at temperatures above 200-250°C [14]. Cu-zeolite type catalysts
have been reported to have very promising low-temperature activity [15–17]; chabazite or
chabazite-like structures are especially interesting due to their excellent hydrothermal stability
[18–20]. Platinum group metal based catalyst also been proposed but suffer from low selectivity
to N2 and low activity at higher temperatures [21], [22]. Another possible candidate is Ag/Al2O3
which has been widely investigated during the last decade.
1.2 Ag/Al2O3
The possibility of using Ag/Al2O3 as a catalyst for HC-SCR was first reported in the beginning of
the 1990’s by, among others, Miyadera [23]. HC-SCR is an attractive alternative to conventional
urea/NH3-SCR since the HC reductant already is present and no extra storage is needed.
Ag/Al2O3 has been widely investigated since the first reports. The effect of e.g. Ag loading [24–
28], different HC [29–31] and different support and preparation methods [26], [31–34] have
been investigated. However, the limited low-temperature activity is a problem for real life
applications. The performance when real diesel fuel is used as reductant can also be questioned
[35].
Figure 2 Example of exhaust aftertreatment layout.
2013-05-14
4
Satokawa [36] was the first to report a dramatic increase in low-temperature activity over
Ag/Al2O3 by co-feeding H2. Several reports have confirmed the effect which is now well accepted
and widely investigated [37–43]. Richter et al. [44] also showed that Ag/Al2O3 is active for H2-
assisted NH3-SCR and that the catalyst is almost completely inactive without H2. H2-assisted NH3-
SCR can even be more active than H2-assisted HC-SCR. Since the first report there have only been
a limited number of reports investigating H2-assisted NH3-SCR. The same group that first saw
the H2 effect for NH3-SCR also investigated the mechanism [45], [46]. They concluded that the
role of H2 was to reduce oxidised Ag species to allow formation of activated oxygen species.
These activated oxygen species dehydrogenates NH3 which reacts with and decompose NO.
Shimizu and Satsuma [47] also investigated the mechanism and reached a similar conclusion as
the previous authors with H2 reducing Ag which in turn activates oxygen. They concluded that
H2 facilitated partial reduction and agglomeration of Ag+ to Agnδ+-clusters which activated O2 to
O2-. O2- activated NH3 to NHx and NO to NO2 which reacted with each other. In another study the
same authors showed a high tolerance towards SO2 poisoning of the Ag/Al2O3 catalyst [48].
More recently Chansai et al. [49] investigate the role of H2 and used NH3-SCR to avoid
interference of HC in their measurements.
The mechanism behind the positive effect of H2 is still debated and several solutions have been
proposed. It is likely that the mechanism is very similar both for HC- and for NH3-SCR. H2 has
been proposed to reduce Ag which then activates O2 [39], [45–47]. Ag reduction has also been
seen in the presence of CO [41] and conventional SCR [50], [51] and was related to the SCR
reaction itself and not the presence of H2. The proposed effect on Ag reduction could thus come
from the enhancement of the SCR reaction by H2. It is, therefore likely that H2 participates
directly in the reaction. It could either be to enhance formation of some reaction intermediate or
removal of some poison [38]. Homogenous gas phase reactions have also been reported to give
an important contribution to the overall NOx conversion and have to be taken into consideration
[40], [52–55]. H2 has been proposed to activate the HC [37], [40], [56] or NOx [40]. Removal of
surface nitrate is another proposed effect [38], [49], [57], [58]. Recently it was shown that the
effect of H2 is very short-lived [49]. Nitrate species was identified to form and disappear at the
0 200 400 600 800 10000
50
100
150
200
250
300
350
400
Time (s)
Te
mp
era
ture
(°C
) o
r ro
ad
sp
ee
d (
km
/h)
0 200 400 600 800 10000
0.5
1
1.5
2
2.5
3
Accu
mu
late
d N
Ox (
g)
Temperature
Road speed
NOx
Figure 3 Temperature and accumulated NOx during NEDC for a 1.9 l diesel engine.
2013-05-14
5
same rate as the enhancement of the SCR reaction by short time DRIFT experiments [49]. The
nitrate species is probably adsorbed on or close to the active Ag site. It is well known in
literature that H2 enhances the NO to NO2 oxidation over Ag/Al2O3 [38], [50], [56]. Reports both
show a positive [24], [59] and a negative effect [39], [50], [56] of replacing NO with NO2 as the
NOx species. It is then rather NO oxidation to adsorbed NOx species (ad-NOx) that is the relevant
step and not NO to NO2 oxidation. NO2 can directly form these ad-NOx species [57], [59]. These
ad-NOx species could also poison the active sites on Ag and the removal of these by H2 [49], [57]
seems as a reasonable explanation for the H2-effect seen.
The sulphur tolerance of a potential automotive catalyst needs to be investigated since sulphur
is present in all fuel. SO2 is the main gas phase sulphur species present in the engine exhaust.
Part of the SO2 is oxidised to SO3 which can poison the Ag/Al2O3 catalyst by forming Ag-
sulphates, the oxidation occurs at temperatures above 230°C. Ag-sulphates become unstable and
decompose at temperatures above 400°C [60]. Ag/Al2O3 has been investigated with respect to
sulphur tolerance. The activity is severely decreased at temperatures of 200-450°C [30], [43],
[48], [60–62]. At higher temperatures no or low deactivation was seen [60], [61]. Some reports
show a severe deactivation even at higher temperatures [59], [63]. Sulphur has also been
reported to increase the activity [63], [64]. This has been attributed to formation of Ag2SO4
which is believed to be more active than highly dispersed Ag-ions [61], [63]. Higher Ag loaded
catalysts are reported to show higher sulphur tolerance [63] [43]. The effect of sulphur is also
dependent on the reductant (HC) used [30], [62], [64].
Doping of the alumina with SiO2 [65] or TiO2 [65], [66] is reported to increase the sulphur
tolerance, which was related to increased acidity of the support which gave less sulphur
adsorption. It is widely reported that the activity can be, at least partly, regained by high-
temperature treatment (500-650°C) in the presence of H2 [43], [48], [59], [60]. H2 in general is
reported to have a positive effect on the sulphur tolerance by increasing the sulphur desorption
form the catalyst surface [30], [43]. Whether or not Ag- and alumina-sulphates or only Ag-
sulphates affects the activity is not clear. Reports have concluded that the poisoning by sulphur
is believed to occur on the Ag and that alumina-sulphates does not affect the activity [43], [59],
[60]. Alumina-sulphates could even enhance the activity by inhibiting excessive HC combustion
[60]. Others have reported that the formation of alumina-sulphates has a negative influence on
the activity [63], [66]. Differences in Ag loading and presence of H2 might explain the differences
seen.
A number of studies have tested Ag/Al2O3 in real engine exhaust, both in stationary [29], [54],
[55], [67], [68] and in transient tests [55], [69]. HC was used as reductant in all reports.
Relatively high NOx conversions were reported. The activity was highly dependent on GHSV
[67–69]. Viola [69] reported that a GHSV below 10000 h-1 was needed to get a sufficiently high
NOx conversion during transient test cycles (HYWFET, US06 and cold start FTP). Sitshebo et al.
[67] reported that the HC present in the exhaust was enough to give a substantial NOx
conversion when H2 was co-fed. They also showed that the H2 can be produced on-board via fuel
reforming. Lindfors et al. [54] showed a slight deactivation of the Ag/Al2O3 catalyst during
testing in a real engine exhaust, no deactivation was reported in the other reports.
2013-05-14
6
1.3 Motivation
The ever stricter emission legislation demand new and improved catalysts for deNOx and
innovative ways of utilising them. The low exhaust temperature of modern cars is especially
demanding and makes it difficult and costly to meet the demands with today’s commercial
catalysts. NOx reduction in a broad temperature window can be obtained by combining low-
temperature active Ag/Al2O3 and high-temperature active Fe-BEA [70]. A high NOx conversion
could be obtained already at 150-175°C. The benefit of combining the two catalysts was that
less H2 was needed to reach a high NOx conversion, even at low temperatures. Another
advantage was that the tolerance against sulphur poisoning was increased compared to
Ag/Al2O3 only. The Ag/Al2O3 and Fe-BEA system has the potential to meet upcoming legislation
with a high low-temperature activity combined with a lower cost related to the use of H2. This
study has been part of a larger research project aimed at further investigated the possibilities of
the Ag/Al2O3 and Fe-BEA system. The research project included catalyst development on
powder-scale, kinetic modelling, theoretical calculations, monolith preparation and testing, full
size engine-bench testing and development of a NH3 and H2 dosing system for the engine-bench
testing.
Most catalyst screening and testing are done in small-scale powder form because of practical
reasons. The most important reason for this is that very small amounts of catalysts can be used
giving smaller and cheaper testing equipment and easier handling. An important factor when
investigating mechanistic aspect is that factors such as mass transfer limitations can be avoided
by using small particles. Powder-scale testing was also used in this study to screen different
alumina as support for the Ag/Al2O3 catalyst. However, to fully evaluate the potential of a
promising catalyst it has to be tested as close as possible to real conditions. In the case of
automotive catalysts this means as monolithic bricks. A successful transfer of the desired
properties found at powder-scale of a catalyst to monolithic-scale is therefore crucial. This can
be a key to commercial success of a catalyst and the exact formulations and methods are well
guarded secrets of the catalyst companies.
A large focus of this study has, therefore, been the preparation and testing of monolithic catalyst
bricks. Small-scale bricks were first prepared followed by scale up of the process to full size 2 l
bricks. Different preparation methods and the influence of parameters such as dry-matter and
viscosity of washcoating slurries were investigated. The catalytic bricks were both tested in
laboratory-scale and on a full size light-duty engine test-bench. The Ag/Al2O3 and Fe-BEA was
combined both in a sequential dual-bed layout and a dual-layer layout where the catalysts were
coated on top of each other. The engine-bench test gave valuable insight into the catalyst
performance during real conditions with e.g. poisoning. Laboratory-scale testing with well-
defined and controllable conditions was used for an initial test of the different catalyst layouts
and to further evaluate the results from engine testing. The Ag/Al2O3 catalyst has also been
investigated with the aim of improving the sulphur tolerance and low-temperature activity by
testing different alumina-supports.
2013-05-14
7
2 Catalyst development The results presented in this chapter are mainly from Paper I with small parts from papers IV
and VI.
2.1 Materials and method
All catalysts were prepared by incipient wetness impregnation to give the desired Ag loading (1-
6 wt%). Four different pseudoboehmite alumina precursors that were precalcined at 550, 750 or
1000°C for two hours were compared to commercial γ-Al2O3 (Puralox SCFa or TH from Sasol) as
a reference sample. The alumina precursors were one from Topsøe, Catapal and Pural from
Sasol, and Versal from UOP.
The catalytic activity was tested in a fix-bed quartz flow reactor. Standard test conditions were,
500 ppm NO, 520 ppm NH3, 1200 ppm H2, 8.3% O2, 7% H2O and balance Ar. 10 ppm SO2 was
added to the feed for sulphur testing. The total flow was 120 Nml/min giving a GHSV of ~50000
h-1 based on the whole bed volume (catalyst + SiC). The tests were performed as a ramp down of
the temperature from 475 to 130°C at a rate of 2°C/min. For the sulphur testing, the samples
were first heated to 475°C and held there for 30 min before being ramped down (2.5°C/min) to
250°C, where SO2 was introduced and the activity measurement started. The SO2 was switched
off after 1 h at 250°C and the temperature was increased to 670°C and held there for 10 min
before being ramped down to 250°C again. The cycle, 1 h at 250°C followed by 10 min at 670°C,
was repeated until no difference in activity between the sulphation cycles could be seen. All
outlet gases were monitored by FTIR. NOx conversion was calculated as,
Equation 5
where NOx was the sum of NO, NO2 and N2O.
The SBET, pore volume and pore size was measured by N2-adsorption. NH3-TPD was conducted in
the catalyst test set-up where NH3 was adsorbed at 90°C in a flow of NH3 and Ar.
2.2 Results and discussion
XRD showed that the crystallinity of the needle shaped alumina increased when it was calcined
at higher temperatures. All samples calcined at 1000°C had, at least partly, transformed from
the parent eta/gamma alumina to other, more crystalline, forms such as alpha, delta and/or
theta alumina. The test samples showed a wide variety of pore size, volume, size distribution
and surface area (SBET). Addition of more Ag did not significantly change the properties.
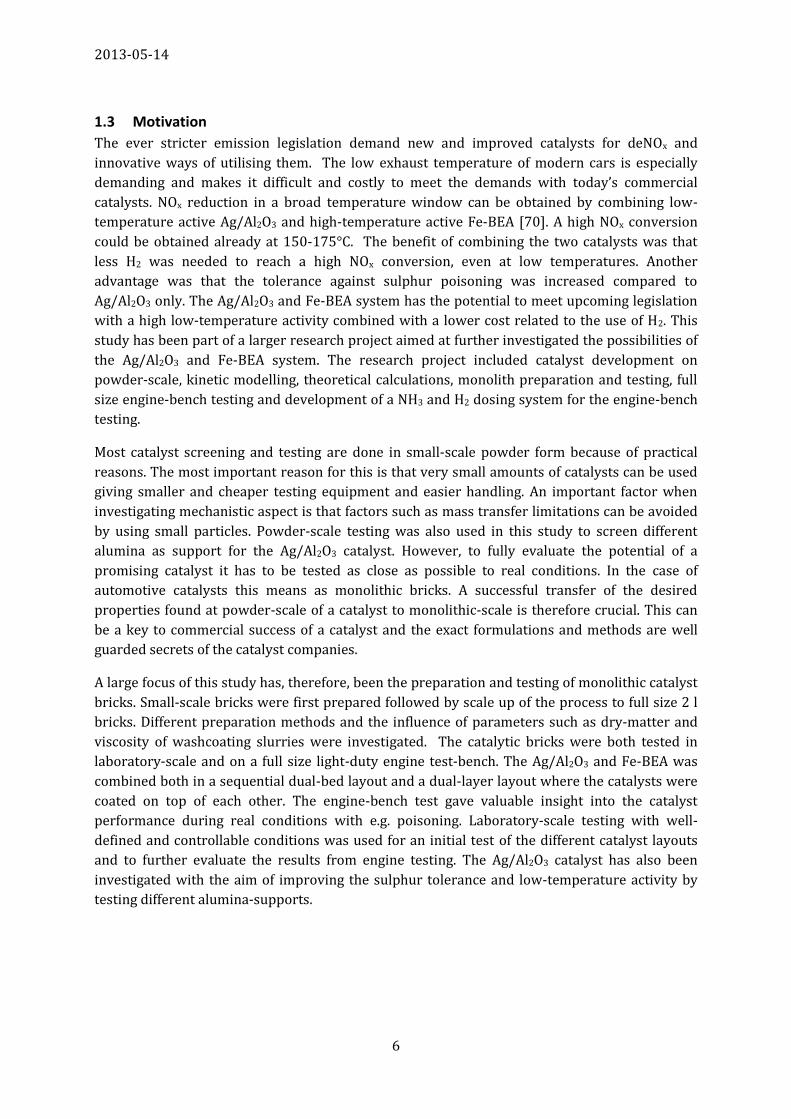
A series of 1 wt% Ag catalysts with different parent alumina were tested. Figure 4 a) shows an
example of temperature dependency of NOx and NH3 conversion for fresh 1 wt% Ag/Al2O3 from
Catapal alumina calcined at 550, 750 and 1000°C. The N2O level was at most 10 ppm and
typically below 5 ppm for all the catalysts tested. The temperature of 50% NOx conversion (T50)
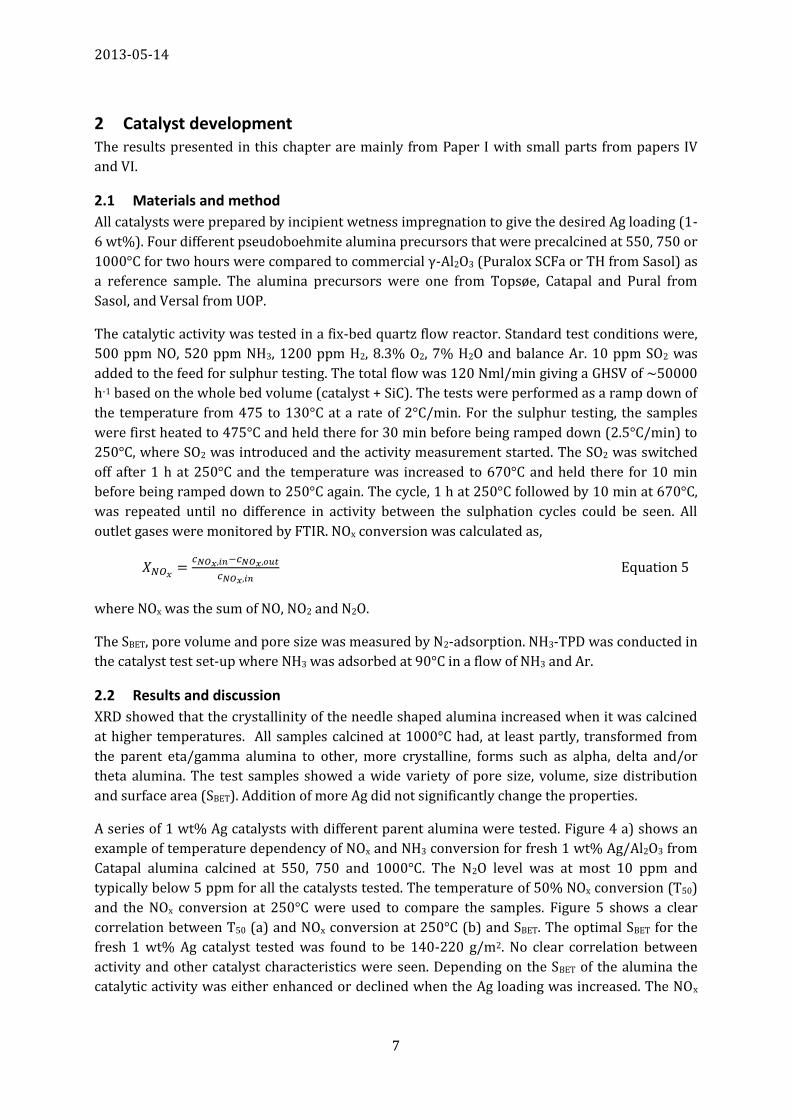
and the NOx conversion at 250°C were used to compare the samples. Figure 5 shows a clear
correlation between T50 (a) and NOx conversion at 250°C (b) and SBET. The optimal SBET for the
fresh 1 wt% Ag catalyst tested was found to be 140-220 g/m2. No clear correlation between
activity and other catalyst characteristics were seen. Depending on the SBET of the alumina the
catalytic activity was either enhanced or declined when the Ag loading was increased. The NOx
2013-05-14
8
Figure 5 a) T50 (temperature of 50% NOx conversion); b) NOx conversion at 250°C; for fresh 1 wt% Ag/Al2O3 with respect to SBET. Reaction conditions: 500 ppm NO, 520 ppm NH3, 1200 ppm H2, 8.3% O2, 7% H2O and balance Ar, GHSV ~50000 h-1 (based on bed volume).
50 100 150 200 250 300175
180
185
190
195
200
205
210
215
SBET
(m2/g)
T5
0 (
°C)
50 100 150 200 250 3000.5
0.55
0.6
0.65
0.7
0.75
0.8
0.85
0.9
0.95
1
SBET
(m2/g)
NO
x co
nve
rsio
n a
t 2
50
°C
a) b)
Figure 4 a) Example of NOx conversion as function of temperature for 1 wt% Ag/Al2O3 from Catapal precursor calcined at 550, 750 and 1000°C; b) Comparison of NOx conversion for Ag/Al2O3 with different Ag loading from reference alumina. Reaction conditions: 500 ppm NO, 520 ppm NH3, 1200 ppm H2, 8.3% O2, 7% H2O and balance Ar, GHSV ~50000 h-1 (based on bed volume).
100 150 200 250 300 350 400 450 5000
0.1
0.2
0.3
0.4
0.5
0.6
0.7
0.8
0.9
1
Temperature (°C)
NO
x co
nve
rsio
n
Catapal-550
Catapal-750
Catapal-1000
100 150 200 250 300 350 400 450 5000
0.1
0.2
0.3
0.4
0.5
0.6
0.7
0.8
0.9
1
2 wt% Ag
3 wt% Ag
4wt% Ag
a) b)
conversion at 250°C increased for samples with SBET >180 m2/g until it reached its maximum; for
lower SBET it was decreased. Figure 4 b) shows an example for the reference catalyst. The activity
was the same up to ~170°C for all the Ag loadings. The activity for the 4 wt% Ag sample
decreased rapidly at above 170°C and the activity of the 3 wt% Ag sample decreased rapidly at
above 200°C. Other catalysts also showed an shift in activity at the lowest temperatures; e.g. 4
wt% Ag/Al2O3 from Topsøe-alumina calcined at 550°C had a T50 of 170°C compared to 210°C for
the same catalyst with 1 wt% Ag. This is discussed more in detail in Chapter 2.3 Conclusions. It
was, therefore, concluded that it is the Ag loading/SBET that was the key to activity and not the
SBET in itself. Different Ag loadings will therefore correspond to different optimal SBET and vice
2013-05-14
9
Figure 7 NOx conversion for one sulphur tolerance test cycle at steady-state (no change in activity profile between cycles) for samples with different Ag loading (1-6 wt%) and SBET (64-270 m2/g). Reaction conditions: T = 250°C, 500 ppm NO, 520 ppm NH3, 1200 ppm H2, 10 ppm SO2, 8.3% O2, 7% H2O and balance Ar, GHSV ~50000 h−1 (based on bed volume).
0 10 20 30 40 50 600
0.1
0.2
0.3
0.4
0.5
0.6
0.7
0.8
0.9
1
Time (min)
NO
x co
nve
rsio
n
1 wt% Ag 180 m2/g
1 wt% Ag 260 m2/g
1 wt% Ag 64 m2/g
2 wt% Ag 64 m2/g
2 wt% Ag 140 m2/g
3 wt% Ag 140 m2/g
4 wt% Ag 140 m2/g
4 wt% Ag 270 m2/g
6 wt% Ag 270 m2/g
versa. This was also concluded by Zhang et al. [71] for HC-SCR reaction. It should be emphasised
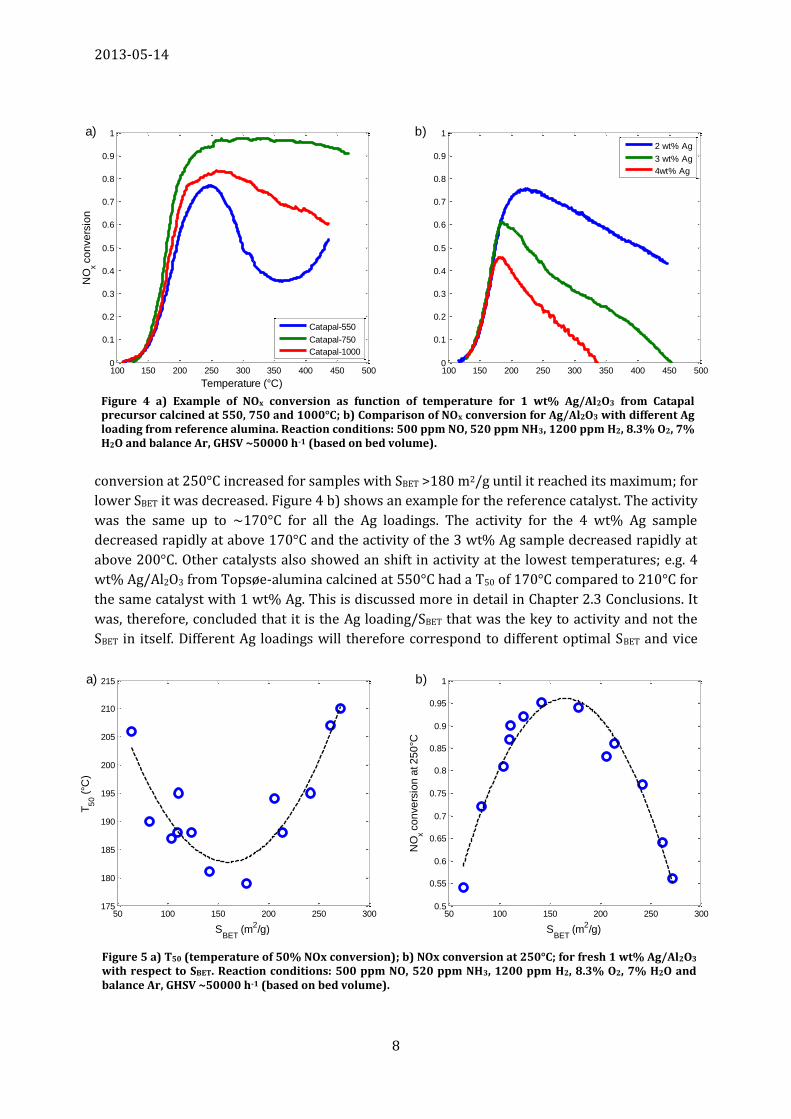
that SBET only is a way of quantifying the factors affecting activity such as acidity. Acidity affects,
among other things, the NH3 adsorption capacity of the catalyst which was found to be
important. Figure 6 shows that the NH3 adsorption capacity decreased at temperatures above
200°C as the Ag loading increased for the reference sample series. A lack of NH3 available for the
SCR reaction was believed to be the reason for the loss of activity for the higher Ag loading
samples.
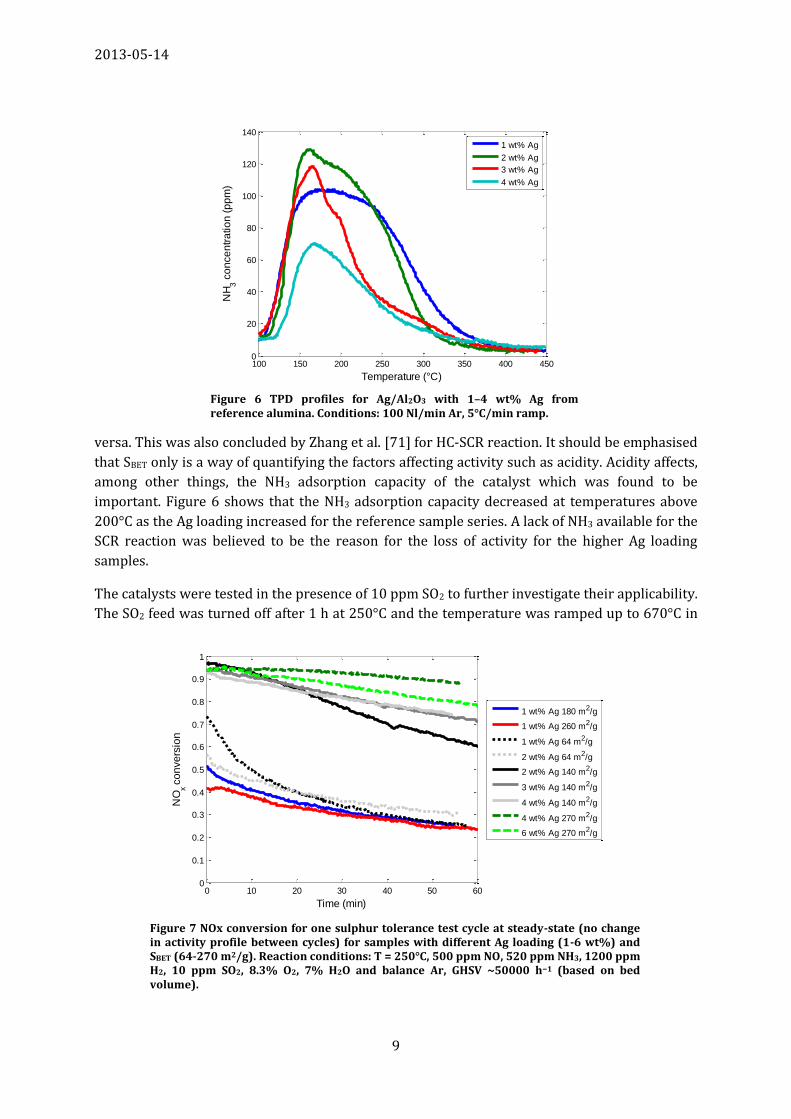
The catalysts were tested in the presence of 10 ppm SO2 to further investigate their applicability.
The SO2 feed was turned off after 1 h at 250°C and the temperature was ramped up to 670°C in
Figure 6 TPD profiles for Ag/Al2O3 with 1–4 wt% Ag from reference alumina. Conditions: 100 Nl/min Ar, 5°C/min ramp.
100 150 200 250 300 350 400 4500
20
40
60
80
100
120
140
Temperature (°C)
NH
3 c
on
ce
ntr
atio
n (
pp
m)
1 wt% Ag
2 wt% Ag
3 wt% Ag
4 wt% Ag
2013-05-14
10
100 150 200 250 300 350 400 450 5000
0.1
0.2
0.3
0.4
0.5
0.6
0.7
0.8
0.9
1
Temperature (°C)
NO
x co
nve
rsio
n
3 wt% Ag - before
3 wt% Ag - after
4 wt% Ag - before
4 wt% Ag - after
100 150 200 250 300 350 400 450 5000
0.1
0.2
0.3
0.4
0.5
0.6
0.7
0.8
0.9
1
Temperature (°C)
4 wt% Ag - before
4 wt% Ag - after
a) b)
Figure 8 Comparison of NOx conversion as function of temperature for Ag/Al2O3 with different Ag loading from a) reference alumina and b) Topsøe alumina, before and after testing with sulphur. Reaction conditions: 500 ppm NO, 520 ppm NH3, 1200 ppm H2, 8.3% O2, 7% H2O and balance Ar, GHSV ~50000 h−1 (based on bed volume)
order to regenerate the catalytic activity. The cycle was repeated until deactivation stabilised
and no difference in activity profile between the cycles was seen, steady-state. Figure 7 shows a
comparison of steady-state activity profiles for different samples. The catalysts were deactivated
by the presence of SO2 but could be regenerated and part of the activity regained. The results
differed from those of the fresh catalysts with a shift in optimum Ag loading to higher values. It
was also clear that a higher SBET was beneficial. The sample that showed the highest NOx
conversion at the end of the deactivation cycle was a high SBET alumina (270 m2/g) with 4 wt%
Ag. The low Ag loading and SBET samples showed poor overall conversion. This was attributed to
the higher NH3 adsorption capacity of the higher SBET alumina since the number of acid sites is
proportional to the SBET.
Figure 8 shows a comparison of the temperature dependency of NOx conversion for fresh
catalysts and catalysts after extended testing with sulphur followed by regeneration. A large
increase in activity was seen at temperatures above 200°C. However, the activity at lower
temperatures decreased and could not be regenerated. Part of the explanation for the increase in
activity is believed to be that sulphation of the alumina surface enhances the intensity of Lewis
acid sites [66] that increases the NH3 adsorption capacity of the catalysts; this was also shown by
TPD. Another reason was that sulphur poisoned the sites responsible for the unselective NH3
oxidation seen for fresh high Ag loading catalysts at temperatures above 250-300°C. It is also
possible that sulphur poisoning and the high-temperature regeneration affect the Ag dispersion
[61].
Dispersion and state of the Ag is believed to be important for the catalytic activity of the Ag
catalyst. Both highly dispersed ions [24], [26], [28], [32], [50], [72] and Ag-clusters [34], [73],
[74] have been proposed to be the active species for HC-SCR and H2 promoted HC-SCR. Ag-
clusters are reported to form during the SCR reaction by reduction and migration of Ag ions
[50], [51], [73]. Ag-clusters [47] and metallic Ag [45], [46] have been reported to be the active
2013-05-14
11
species for NH3-SCR.
An increased Ag-loading will affect the state of Ag. An ex-situ study of a number of Ag/Al2O3
catalysts from different alumina series with different Ag loadings was performed. When
comparing catalyst with the same parent alumina but with different Ag loadings it was seen that
the amount of Agnδ+-clusters and Ag particles increased as expected from literature. Figure 9
shows an example for 2-4 wt% Ag/Al2O3 from reference alumina. It has to be stressed that a
higher Ag loading also will give a higher total number of Ag sites. The increased activity seen for
high Ag loading samples could, therefore, be related to the increased amount of active sites
rather than different types of Ag present. From the tests it was concluded that it is not feasible to
get quantitative results from UV-vis studies, nor to compare different series of catalysts. UV-
visible spectroscopy is a method that has been widely used to investigate the state of Ag in
literature [24], [26], [28], [32], [34]. However, the signal from the alumina itself might interfere
with the results from UV-vis [24], Ag is also mobile and can easily form clusters and be re-
dispersed as smaller Ag ions on the alumina surface during SCR-conditions [28], [50]. Large Ag
particles are, on the other hand, not affected by reduction-oxidation [28]. Ex-situ measurements
are, therefore, not necessarily representative for what happens during reaction conditions and it
is difficult to identify the active Ag species. Well dispersed Ag ions have been reported to be
poisoned by sulphur species on the alumina and Ag-clusters have been reported to give a higher
sulphur tolerance [43]. Large Ag particles oxidises NH3 to a larger extent than Ag ions and
clusters [75], [76]. Ag-clusters are, therefore, believed to be preferred over Ag-ions and larger Ag
particles as the main Ag-species to get a sulphur tolerant and highly active catalyst. However, it
is not possible to fully distinguish between Ag ions and clusters as they might form and
disappear during SCR. It could be that sulphur favours the presence of a specific form of Ag and
that is what is responsible for the permanent loss in low-temperature activity. Further studies
are needed to clarify this.
1 1.5 2 2.5 3 3.5 4 4.5 5
x 104
0
0.5
1
1.5
2
2.5
3
Waveno. (cm-1
)
F(R
)
2 wt% Ag
3 wt% Ag
4 wt% Ag
Ag+
Ag0
Agn
+
Figure 9 UV–vis spectra for 2–4 wt% Ag/Al2O3 from reference alumina. The major peaks attributed to Ag0, Agnδ+ and Ag+ are indicated.
2013-05-14
12
Temperature (°C)
NO
x co
nve
rsio
n
Temperature (°C)
a) b)
Increased Ag loadingDecreased Ag loading
Figure 10 Schematic explanation of influence of Ag loading on activity for a) Ag loadings lower than the optimal Ag loading and b) Ag loadings higher than the optimal Ag loading for any given SBET.
2.3 Conclusions
The results seen for powdered catalysts with an optimum of high SBET with a high Ag loading can
be explained as follows (schematically shown in Figure 10): As Ag loading is increased for a
given surface area more active sites will form and the catalytic activity will increase (Figure 10
a). As more metal is loaded the surface will get more and more crowded by Ag-species that form
larger and larger clusters/particles. The activity at medium to high temperature (>200-250°C)
will start to decrease when the Ag loading becomes higher than the optimal loading since the
increased Ag loading will block NH3 adsorption sites leading to shortage of NH3 for the SCR
reaction (Figure 10 b). From 250-300°C unselective NH3 oxidation will further decrease the
amount of available NH3, which leads to a reduction of activity. The low-temperature activity is
kept constant since NH3 adsorption still is high and it is, thus, only dependent on the number of
available sites. This can also explain the results seen for 1 wt% Ag/Al2O3 in Figure 5. The
samples with a SBET below 140 m2/g suffer from low NH3 adsorption capacity and too crowded
Ag giving larger Ag particles. The high SBET samples have too well dispersed Ag and a low amount
of sites per SBET. The right balance between amount of Ag and SBET is thus important.
Sulphur, as ad-SOx species, will poison the catalyst. Part of the poisoning effect is reversible by
regeneration at >600-650°C in the presence of H2. Three main phenomena are seen for the
irreversible effects; first, a loss of low-temperature activity; second, an increase in activity above
200-250°C; and third, a decrease in unselective NH3 oxidation. The loss of low-temperature
activity is believed to be related to SOx bound to the alumina support blocking the sites active at
low temperature. By treatment at 950°C this activity can be regenerated but with large loss of
higher temperature activity likely related to sintering of Ag particles [28]. SOx adsorbed on Ag
will, unlike SOx bound to the alumina, be desorbed at 600-650°C [61], [77], thus, allowing these
sites to be regenerated. It is thus concluded that there are two different Ag sites present at the
catalyst. The increase in activity for the sulphur poisoned catalysts above 200-250°C is related to
increased NH3 storage capacity from more acid sites and also the decreased unselective NH3
oxidation which is believed to come from blocking of these sites on larger Ag particles. This can
2013-05-14
13
explain why a higher SBET is an advantage; a high SBET can hold more Ag, i.e. more sites, before it
becomes too crowded (to large Ag clusters/particles). It could also be that the sulphur influences
Ag dispersion towards a dispersion with higher activity at temperatures above 200-250°C and a
lower activity at lower temperatures. An addition of Si or Ti will likely affect the Ag dispersion
allowing more Ag to be loaded without the negative effects.
2.4 Summary
An optimal SBET of 140-220 m2/g was found for a series of fresh 1 wt% Ag samples. By testing
higher Ag loading samples it was concluded that it was the Ag loading/SBET that was the
important measure. By testing the catalysts in the presence of SO2 followed by regeneration it
was found that sulphur irreversibly poisoned the activity below 200°C but also gave a large
increase in the activity above 200°C; the activity could be regenerated by high-temperature
treatment in the presence of H2. It was beneficial to have a high SBET since it allowed a higher NH3
adsorption which is needed for the SCR reaction. A high SBET also allows a higher Ag loading. A
high Ag loading will give more available sites and possibly also an optimal dispersion of Ag. A too
high Ag loading is believed to give a deficit of NH3 adsorption capacity on the alumina surface for
the SCR reaction at temperatures above 200°C lowering the deNOx activity. Acidic sites related to
sulphur increases the NH3 adsorption capacity of the catalyst giving an increased activity above
200°C.
2013-05-14
14
3 Monolith preparation: effect of slurry properties
3.1 Theoretical background
The principle of the preparation process of coated catalytic monoliths, so called washcoating, is
as follows [78]:
1. The powder catalyst is mixed with water or some other solvent and binder into slurry.
2. The catalyst particle size is reduced in e.g. a ball mill.
3. The catalyst slurry is coated onto the monolith. Different techniques can be used, e.g.
a. The monolith can be partly or fully immersed into the slurry.
b. The slurry can be drawn through the monolith either by gravitational forces or
by suction.
4. Excess slurry is removed with e.g. pressurised air.
5. The monolith is dried.
6. Steps 3-5 are repeated until the desired catalyst loading is reached.
7. The monolith is calcined to fixate the coat to the monolith and remove any residue
solvent or pH adjuster. The monoliths can also be calcined after each single coat layer if
steps 3-5 are repeated.
During the coating process the pores in the support wall take up the liquid in the slurry while
the solid particles are too big to enter the support and are deposited on the wall forming a filter
cake [78], [79]. A viscous film will form outside the filter cake when the excess slurry is removed
from the channels. The thickness of the film is dependent on the properties of the slurry, such as
viscosity, and the speed at which the excess liquid is removed, i.e. dependent the external force
used [79]. The liquid uptake will be larger in subsequent coats since the previous coat layer also
will absorb liquid, in addition to the substrate material. To avoid channel blocking the solid
content or dry matter (DM) has to be lowered to get less viscous slurry. Binders are used to
increase the interparticle adhesion of the catalyst and the anchoring to the substrate wall [78],
[80]. The properties of the slurry can be adjusted with different additives such as dispersion or
wetting agents to give the desired properties [80].
The DM of the slurry will directly affect the catalyst loading on the substrate. A high DM of the
slurry is preferred since it will give a higher coat loading per impregnation [81]. The substrate
can only take up a certain amount of liquid and a higher DM of the slurry will give a higher
amount of catalyst deposited related to the liquid uptake. The amount deposited is also related
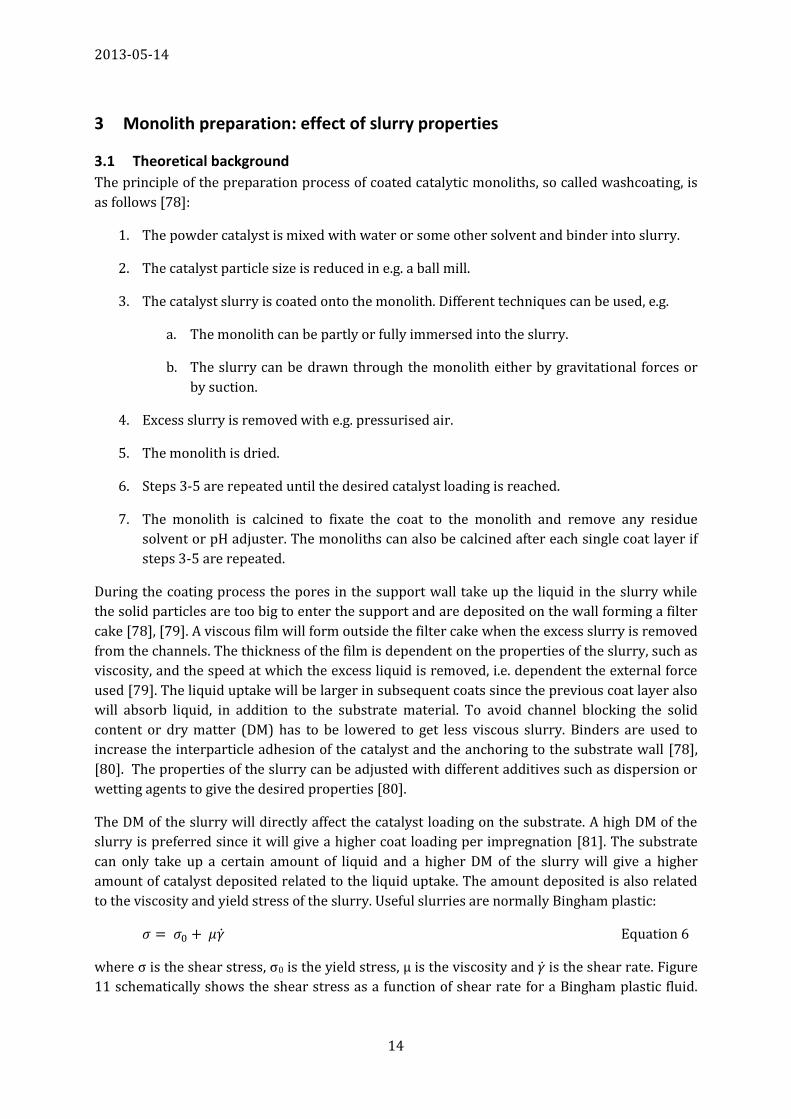
to the viscosity and yield stress of the slurry. Useful slurries are normally Bingham plastic:
Equation 6
where σ is the shear stress, σ0 is the yield stress, µ is the viscosity and is the shear rate. Figure
11 schematically shows the shear stress as a function of shear rate for a Bingham plastic fluid.
2013-05-14
15
The yield stress is marked in the figure and the viscosity is represented by the slope of the curve.
If the DM is low the yield stress will be close to zero and the slurry will be Newtonian [82]. If the
shear stress is lower than the yield stress the medium (in this case the slurry) is immobile [79].
This happens in the monolith channels; as the substrate walls take up the liquid the DM will
increase together with viscosity and yield stress, eventually making the catalyst to deposit on
the substrate wall. Thus, by increasing the yield stress it is possible to manipulate the amount of
catalyst deposited on the wall. This can be done by adding thickener agents which has a very
high yield stress in comparison to viscosity, enough to affect the yield stress of the whole slurry
[83].
Too viscous slurry will lead to channel blocking of the monolith substrate. pH and DM are the
most important factors for controlling the viscosity of the slurry [79]. The effect of pH is
connected to the surface charge of the alumina. An increased pH will give a more negatively
charged surface from the equilibrium
Equation 7
where s denotes the surface. A decreased pH gives a more positively charged surface according
to
Equation 8
If the particles have low or zero charge they will agglomerate and the slurry will become more
viscous. A larger charge, either positive or negative, will lead to repulsion between the particles
[82]. The isoelectric point of alumina is at a pH of 7-8 [81]. A lower or higher pH is, therefore,
appropriate for alumina [78], [81]. Changing pH can be enough to ensure stable slurry with an
appropriate viscosity. The viscosity can also be lowered by using a dispersion agent that hinders
particle agglomeration [81]. The effect of the dispersion agent can e.g. be electrostatic by
charging the surface (as with pH) or steric by adding a polymer that hinders the particles to
come into contact with each other [82]. The length of the monolith is also of importance. A
Shear rate ()
Sh
ea
r str
ess (
)
Yieldstress(
0)
Figure 11 Schematic figure of shear stress as function of shear rate for a Bingham plastic fluid.
2013-05-14
16
longer monolith will give a higher DM and viscosity at the end of the channel due to more and
more liquid being absorbed by the monolith, which may lead to channel blocking.
Desired properties of the coated monoliths are high mechanical strength (so that the catalyst is
not lost due to vehicle vibrations) and low diffusion resistance (so that the whole catalyst layer
is utilised). Particle size is a crucial parameter in order to get a catalyst coat with good
adherence to the monolith (high mechanical strength). The particle size should be in the same
size range as the macropores of the cordierite support (5 µm) to allow anchoring to the support
[78], [84]. Interfacial forces between the particles also play an important role [84]. Too small
particles can give a very dense coat with diffusion limitations and too large particles can give
irregular coats with poorer adherence [78], [84]. Smaller particles also leads to a higher
viscosity of the slurry which will affect the coating process [81]. Cracks can form in the coat
layer during drying. The cracks will form where the coat is thickest, typically in the corners of
the monolith channels [85].
The target of the washcoating and slurry studies was an as high as possible coat loading of the
monolith bricks to minimise the number of repeated coatings. The parameters that could be
tuned were DM and viscosity. Viscosity is linked to DM and a change in DM will affect the
viscosity. The viscosity could also be adjusted by pH and additives such as thickening and
dispersion agents. Particle size was not believed to affect the coating properties to any larger
extent. It does, however, influence the mechanical stability of the coat. The effect of slurry
properties and different additives on coating capability was investigated in an empirical way and
the success was evaluated based on if the monolith channels were blocked or not. If the coating
tests were successful the DM or viscosity was increased up to the point when coating became
unsuccessful. The effect of modifying agents is very complex and very much based on empirical
work.
3.2 Materials and method
Based on the results in Chapter 2 Catalyst development a Topsøe high surface area alumina (300
m2/g) was chosen as the catalyst carrier material. The catalysts were, except for the first
washcoating tests, prepared by incipient wetness impregnation. Wetness impregnation followed
by spray dying was investigated as an alternative method to incipient wetness impregnation for
catalyst preparation. The difference of scale between catalyst powder tests and monolith test are
significant, from a couple of grams to several kilograms of catalyst and wetness impregnation
was believed to be a more effective way of preparing larger amounts of catalyst. For the first
washcoating test a wetness impregnation method was used instead. The alumina was mixed
with excess H2O and ball-milled to a typical d50 of 2.5-3.0 µm. AgNO3 was added to the slurry
under intense stirring in sufficient amount to give the desired load of 6 wt% Ag and the slurry
was spray-dried to produce fine catalyst powder. The small alumina particles agglomerated
during spray drying giving a d50 of 17 µm. No further particle size reduction was made. The SBET
of the prepared catalyst was 270 m2/g. The catalyst also had a high pore volume (0.9 cm3/g), i.e.
high ability of the catalyst powder to take up liquid, and it was not possible to get a DM higher
than approximately 35%.
2013-05-14
17
XRD showed no traces of Ag and that the alumina was eta/gamma phase with approximately
20% alpha phase. ICP analysis showed a content of 6.1 wt% for the first batch and 6.6 wt% for
the second batch prepared.
All slurries and monoliths were prepared following the scheme described in Chapter 3.1
Theoretical background, unless stated otherwise. The Fe-BEA monoliths were prepared using a
Topsøe standard recipe. The particle size was reduced by shaking the slurry with glass beads (2-
3 mm) in a paint shaker. Depending on the size of the monolith they were either dipped in the
slurry (d=2 cm monoliths) or the slurry was poured from the top and allowed to flow through
the monolith. The support material was 400 cpsi cordierite that was cut to the desired size when
necessary. Three different sizes of cylindrical monoliths were prepared; small size, 21x20 mm
(dxh) (V=7 mL), medium size, 49x76 mm (dxh) (V=140 mL) and full size, 140x130 mm (dxh)
(V=2 L).
pH was adjusted either by using HNO3 or NH4OH. The binder used was colloidal silica (Levasil
200N) in 14-18 wt% of total DM. Particle size was measured by laser diffraction with a Malvern
Mastersizer 2000 (Malvern Instruments, UK). The viscosity was measured with a cup and bob
Bohlin Visco 88 Viscometer (Malvern Instruments, UK). The yield stress and viscosity was
calculated by varying the shear rate and measuring the shear stress. The dry matter (DM) or
solid content of the slurries was measured using a Mettler Toledo HB 43 (the sample was heated
by a halogen lamp to evaporate all liquid and the weight loss was measured). Scanning electron
microscope (SEM) image was acquired on a Philips XL30 ESEM-FEG. The sample was mounted
in epoxy and ground to reveal the cross section.
3.3 Results and discussion
3.3.1 Topsøe alumina
The activity of the catalyst prepared by wetness impregnation and spray-drying was lower
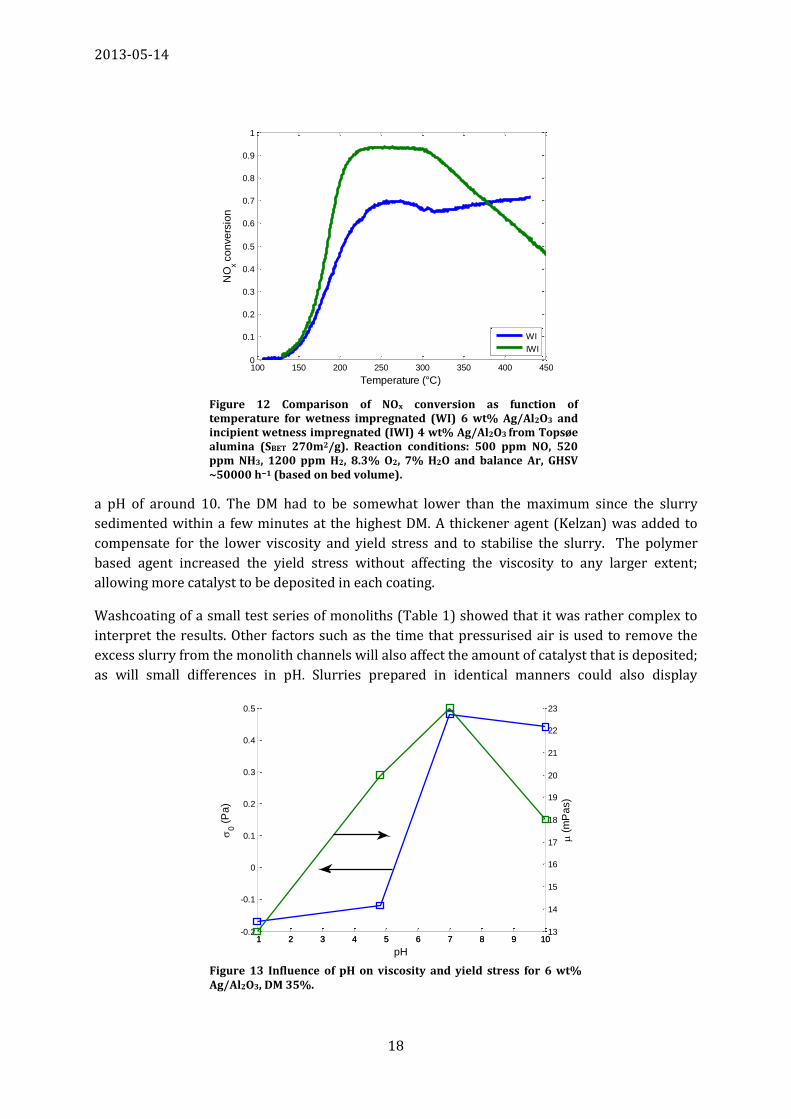
compared to a 4 wt% reference catalyst (Figure 12). Spray-drying is known to give a very good
metal distribution which is often desired. However, the catalyst development showed that the
optimal Ag/Al2O3 also needs some larger clusters of Ag to retain a high activity when the catalyst
was sulphur poisoned (Chapter 2 Catalyst development). It is believed that the spray-drying
gave too dispersed Ag on the catalyst surface giving a lower activity. More Ag was also likely
trapped in the bulk of the catalyst and not directly available for SCR compared to the incipient
wetness impregnated catalyst where more Ag is present on the catalyst surface. By increasing
the amount of Ag added and by investigating the process further it should be possible to get the
same activity on a spray-dried catalyst. This was, however, beyond the scope of this study and it
was decided to use the conventional incipient wetness impregnation method instead. It was also
shown that the gain in time and simplicity was not as large as expected for the wetness
impregnation and spray-dry method. Incipient wetness impregnation was, therefore chosen for
the further catalyst preparation.
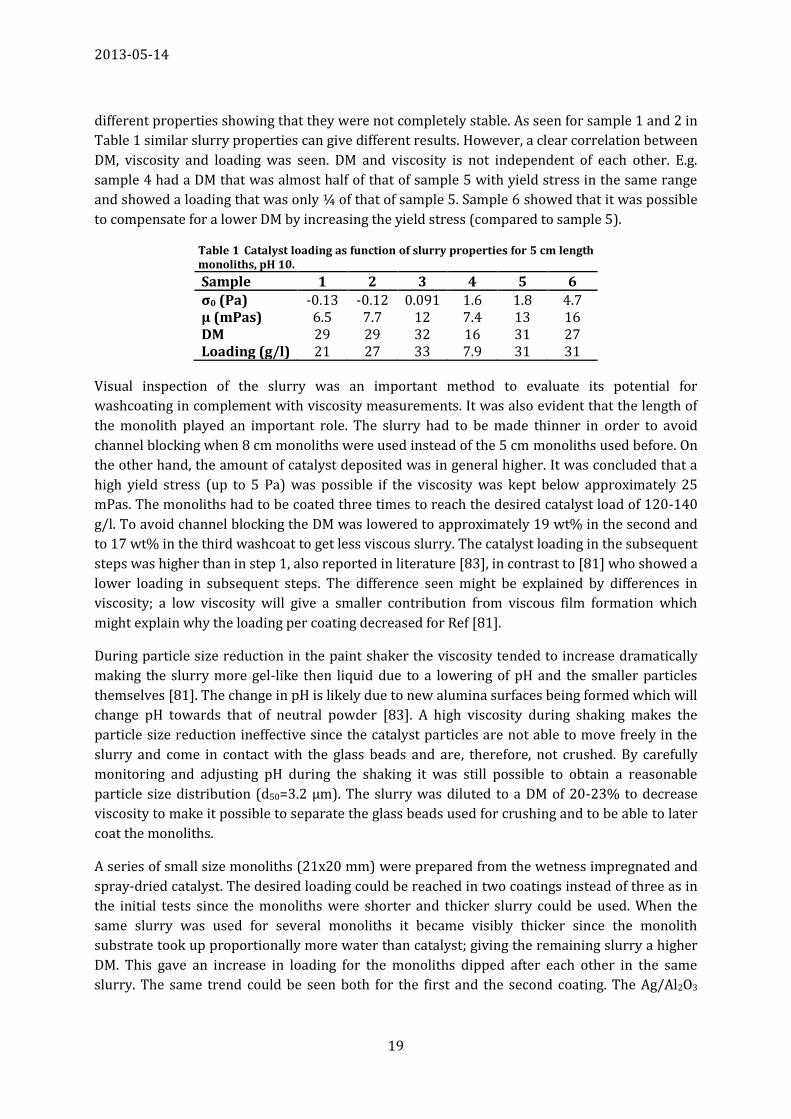
Figure 13 shows the influence of pH on viscosity, pH of the as prepared slurry was 7. The highest
viscosity was found at pH close to 7 as expected from literature. A decreased pH gave a
substantially lower yield stress while an increase in pH had no significant effect. The viscosity
was not affected to the same extent by pH. Based on the higher yield stress it was decided to use
2013-05-14
18
a pH of around 10. The DM had to be somewhat lower than the maximum since the slurry
sedimented within a few minutes at the highest DM. A thickener agent (Kelzan) was added to
compensate for the lower viscosity and yield stress and to stabilise the slurry. The polymer
based agent increased the yield stress without affecting the viscosity to any larger extent;
allowing more catalyst to be deposited in each coating.
Washcoating of a small test series of monoliths (Table 1) showed that it was rather complex to
interpret the results. Other factors such as the time that pressurised air is used to remove the
excess slurry from the monolith channels will also affect the amount of catalyst that is deposited;
as will small differences in pH. Slurries prepared in identical manners could also display
100 150 200 250 300 350 400 4500
0.1
0.2
0.3
0.4
0.5
0.6
0.7
0.8
0.9
1
Temperature (°C)
NO
x co
nve
rsio
n
WI
IWI
Figure 12 Comparison of NOx conversion as function of temperature for wetness impregnated (WI) 6 wt% Ag/Al2O3 and incipient wetness impregnated (IWI) 4 wt% Ag/Al2O3 from Topsøe alumina (SBET 270m2/g). Reaction conditions: 500 ppm NO, 520 ppm NH3, 1200 ppm H2, 8.3% O2, 7% H2O and balance Ar, GHSV ~50000 h−1 (based on bed volume).
Figure 13 Influence of pH on viscosity and yield stress for 6 wt% Ag/Al2O3, DM 35%.
1 2 3 4 5 6 7 8 9 10-0.2
-0.1
0
0.1
0.2
0.3
0.4
0.5
pH
0 (
Pa
)
1 2 3 4 5 6 7 8 9 1013
14
15
16
17
18
19
20
21
22
23
(
mP
as)
2013-05-14
19
different properties showing that they were not completely stable. As seen for sample 1 and 2 in
Table 1 similar slurry properties can give different results. However, a clear correlation between
DM, viscosity and loading was seen. DM and viscosity is not independent of each other. E.g.
sample 4 had a DM that was almost half of that of sample 5 with yield stress in the same range
and showed a loading that was only ¼ of that of sample 5. Sample 6 showed that it was possible
to compensate for a lower DM by increasing the yield stress (compared to sample 5).
Table 1 Catalyst loading as function of slurry properties for 5 cm length monoliths, pH 10.
Sample 1 2 3 4 5 6
σ0 (Pa) -0.13 -0.12 0.091 1.6 1.8 4.7 µ (mPas) 6.5 7.7 12 7.4 13 16 DM 29 29 32 16 31 27 Loading (g/l) 21 27 33 7.9 31 31
Visual inspection of the slurry was an important method to evaluate its potential for
washcoating in complement with viscosity measurements. It was also evident that the length of
the monolith played an important role. The slurry had to be made thinner in order to avoid
channel blocking when 8 cm monoliths were used instead of the 5 cm monoliths used before. On
the other hand, the amount of catalyst deposited was in general higher. It was concluded that a
high yield stress (up to 5 Pa) was possible if the viscosity was kept below approximately 25
mPas. The monoliths had to be coated three times to reach the desired catalyst load of 120-140
g/l. To avoid channel blocking the DM was lowered to approximately 19 wt% in the second and
to 17 wt% in the third washcoat to get less viscous slurry. The catalyst loading in the subsequent
steps was higher than in step 1, also reported in literature [83], in contrast to [81] who showed a
lower loading in subsequent steps. The difference seen might be explained by differences in
viscosity; a low viscosity will give a smaller contribution from viscous film formation which
might explain why the loading per coating decreased for Ref [81].
During particle size reduction in the paint shaker the viscosity tended to increase dramatically
making the slurry more gel-like then liquid due to a lowering of pH and the smaller particles
themselves [81]. The change in pH is likely due to new alumina surfaces being formed which will
change pH towards that of neutral powder [83]. A high viscosity during shaking makes the
particle size reduction ineffective since the catalyst particles are not able to move freely in the
slurry and come in contact with the glass beads and are, therefore, not crushed. By carefully
monitoring and adjusting pH during the shaking it was still possible to obtain a reasonable
particle size distribution (d50=3.2 µm). The slurry was diluted to a DM of 20-23% to decrease
viscosity to make it possible to separate the glass beads used for crushing and to be able to later
coat the monoliths.
A series of small size monoliths (21x20 mm) were prepared from the wetness impregnated and
spray-dried catalyst. The desired loading could be reached in two coatings instead of three as in
the initial tests since the monoliths were shorter and thicker slurry could be used. When the
same slurry was used for several monoliths it became visibly thicker since the monolith
substrate took up proportionally more water than catalyst; giving the remaining slurry a higher
DM. This gave an increase in loading for the monoliths dipped after each other in the same
slurry. The same trend could be seen both for the first and the second coating. The Ag/Al2O3
2013-05-14
20
catalyst can be made more active by sulphur treatment (Chapter 2 Catalyst development). The
monoliths were, therefore, impregnated with sulphur by a pore volume impregnation method.
The monoliths were submerged in an ammonium sulphite solution; the pores of both the
catalyst and the monolith substrate were, thus, filled with liquid. The amount of sulphur
impregnated was determined by the amount of liquid that was taken up by the monolith and the
sulphur concentration of the liquid. Excess water was removed with pressurized air. The
monoliths were frozen (-30°C) and the water was removed by sublimation in a vacuum
chamber. Freeze drying is believed to prevent formation of sulphur concentration gradients in
the monoliths during drying and has also been used for catalyst preparation, giving a high
dispersion of the metal on the catalyst support [31]. The amount of sulphur added could be
controlled close to the targeted amount. The monoliths were used for the development of a
kinetic model (Paper V). Dual-layer monoliths were prepared from incipient wetness
impregnated Ag/Al2O3 to investigate different possibilities of combining Ag/Al2O3 with Fe-BEA.
They were denoted as dual-layer-X/Y where X was the outer layer and Y the inner layer catalyst,
Ag means Ag/Al2O3 and Fe means Fe-BEA. The ratio between the two catalysts was 1:1 on
weight basis with the same total loading as the single catalyst bricks. Catalysts with Ag loading of
both 6 and 4 wt% were prepared. 4 wt% Ag loading was prepared since that was believed to be
a more optimal loading than 6 wt%. The 4 wt% Ag monoliths were used for activity testing in
Paper II (Chapter 4.1.1 Small-scale laboratory testing: Ag/Al2O3 and Fe-BEA combinations).
Unlike the previous test three coatings were needed to meet the targeted loading for Ag/Al2O3
monoliths (Ag-only) and two coatings of Ag/Al2O3 for the dual-layer bricks. The targeted slurry
properties were met without addition of thickener for the 4 wt% Ag samples. This again shows
that it was challenging to work with the present alumina and that the reproducibility is
questionable. More details about the slurries and monoliths can be found in Appendix B.
The adhesion of the coat layer of the first catalyst series was somewhat poor and parts of the
coat had fallen off in the catalyst container. If the coat falls off even when no extensive force is
placed on the monolith even more might fall off from the vibrations and high gas flow behind an
engine. A likely explanation for the poor coat adherence was believed to be the large particle size
(d50 = 17 µm). However, the catalyst prepared by incipient wetness impregnation followed by
particle size reduction in the paint shaker (to d50=3.2 µm) did not show any significant
improvement compared to the ones prepared by wetness impregnation and spray-drying.
A SEM study of the incipient wetness impregnated 6 wt% Ag samples was conducted to
investigate the condition of the coat and adherence of it. Figure 14 shows SEM images of dual-
layer-Fe/Ag and –Ag/Fe. The damages and mayor cracks seen in the pictures are believed to
come from the preparation process of the samples for the SEM study. The faint vertical line for
Ag/Al2O3 in Figure 14 e) might be the boundary between layers. No clear boundaries or
separation from the multiple coatings layers could, however, be seen for any other sample. The
coat thickness was larger for dual-layer-Ag/Fe compared to dual-layer-Fe/Ag as expected from
the somewhat higher catalyst loading (165 and 150 g/l). The boundary between Ag/Al2O3 and
Fe-BEA showed no tendency to separate which means that there was a good adherence between
the two. There was a clear difference in density between the Ag/Al2O3 and Fe-BEA layers; the
smaller particles of Fe-BEA allowed a much denser structure. Fe-BEA also showed a better
interaction with the cordierite support compared to Ag/Al2O3. This is likely related to the
smaller Fe-BEA particles being able to more freely enter the macro-pores of the cordierite
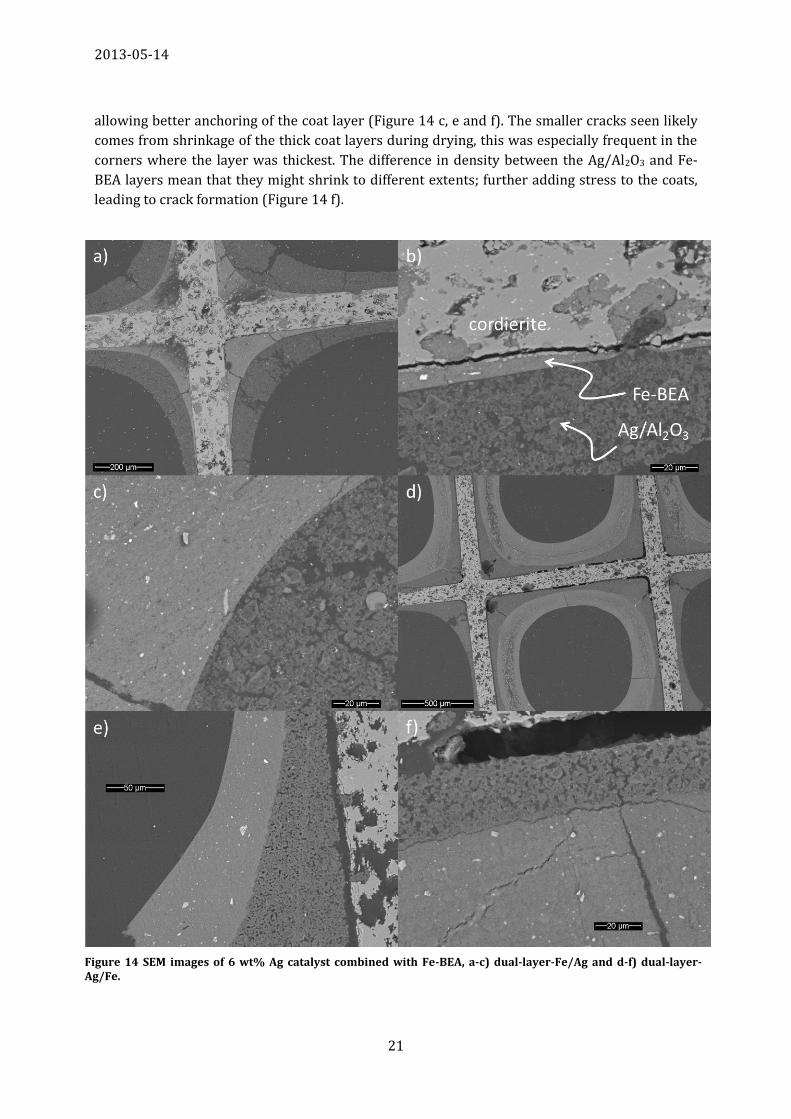
2013-05-14
21
Figure 14 SEM images of 6 wt% Ag catalyst combined with Fe-BEA, a-c) dual-layer-Fe/Ag and d-f) dual-layer-Ag/Fe.
allowing better anchoring of the coat layer (Figure 14 c, e and f). The smaller cracks seen likely
comes from shrinkage of the thick coat layers during drying, this was especially frequent in the
corners where the layer was thickest. The difference in density between the Ag/Al2O3 and Fe-
BEA layers mean that they might shrink to different extents; further adding stress to the coats,
leading to crack formation (Figure 14 f).
2013-05-14
22
The conclusion from this test was that the alumina used was not optimal for washcoating. First
the catalyst was somewhat difficult to work with since the large pore volume restricts the DM of
the slurries and the reproducibility of results was low. This will make it challenging to scale up
the procedure to full size samples. Second, the mechanical stability of the coat on the monoliths
was believed to be a bit too low for engine tests with vibrations and periodical high flows.
Different alumina was, therefore, used for later monolith preparation.
3.3.2 Siralox alumina
Catalyst development showed that the low-temperature performance of the catalyst could be
improved by impregnation of small amounts of Si or Ti (1-2 wt%) [86]. T50 was improved by
10°C and sulphur tolerance was more or less similar compared to the previous best Ag/Al2O3.
The same result was shown for commercial Si-alumina (Siralox 5/230, Sasol Germany, 3 wt%
Si). Cordierite monoliths were washcoated with Ag/Si-Al2O3 to further investigate the
performance of the doped catalyst. The monolithic catalysts were both prepared and tested at
lab-scale (140 ml) and in full-scale engine tests (2 l) (Paper III and Chapter 4 Monolith testing).
The catalyst could not form completely homogenous slurry when mixed with water due to hard
catalyst agglomerates. These agglomerates sedimented in a matter of a few minutes and stirring
in a dissolver were not enough to break them apart. A few minutes (~3) in the paint shaker were
enough to break the agglomerates and create more homogenous slurry. Table 2 shows the
particle size reduction as an effect of shaking time. There was a large decrease in particle size
after 9 min of shaking. The most dramatic decrease in particle size is believed to occur in the
very first minutes (not measured). There was also a reasonable decrease between 9 and 12 min.
More than 12 min only gave a small particle size decrease. There is a limit to how small the
particles in the slurry can become which is dependent on the size and the hardness of the glass
beads. An even longer time in the shaker will, therefore, not reduce the particle size any further.
12 min seems to be a reasonable time for further studies based on these results since it gives
small enough particles and a reasonable particle distribution. The slurry should give good
adhesive capabilities of the coat.
Table 2 Effect of time in paint shaker (2-3 mm glass beads) on particle size of the prepared washcoat slurry for Ag/Si-Al2O3.
Time (min) d0.1 (μm) d0.5 (μm) d0.9 (μm)
0 10.9 45.5 119 9 1.51 4.29 11.18
12 1.42 3.62 8.96 15 1.42 3.49 8.14 18 1.35 3.17 7.04
Different dispersion agents were tested to allow a higher DM in the slurry, thus simplifying the
washcoating process. Compared to the previously used alumina the Si-alumina had a smaller
pore volume and was easier to work with. A basic dispersion agent was preferred over an acidic
since the thickener used (Kelzan) could not be used at a too low pH.
Four basic dispersion agents were tested; BYK-E-420, Darvan 821A, Dispex A40 and AMP-90.
Darvan and Dispex gave fast sedimentation and BYK gave no visible effect on the slurry
viscosity; neither was, therefore, considered any further. AMP-90 gave visibly thinner slurry.
However, the results could not be repeated and the large effect seen in the beginning is believed
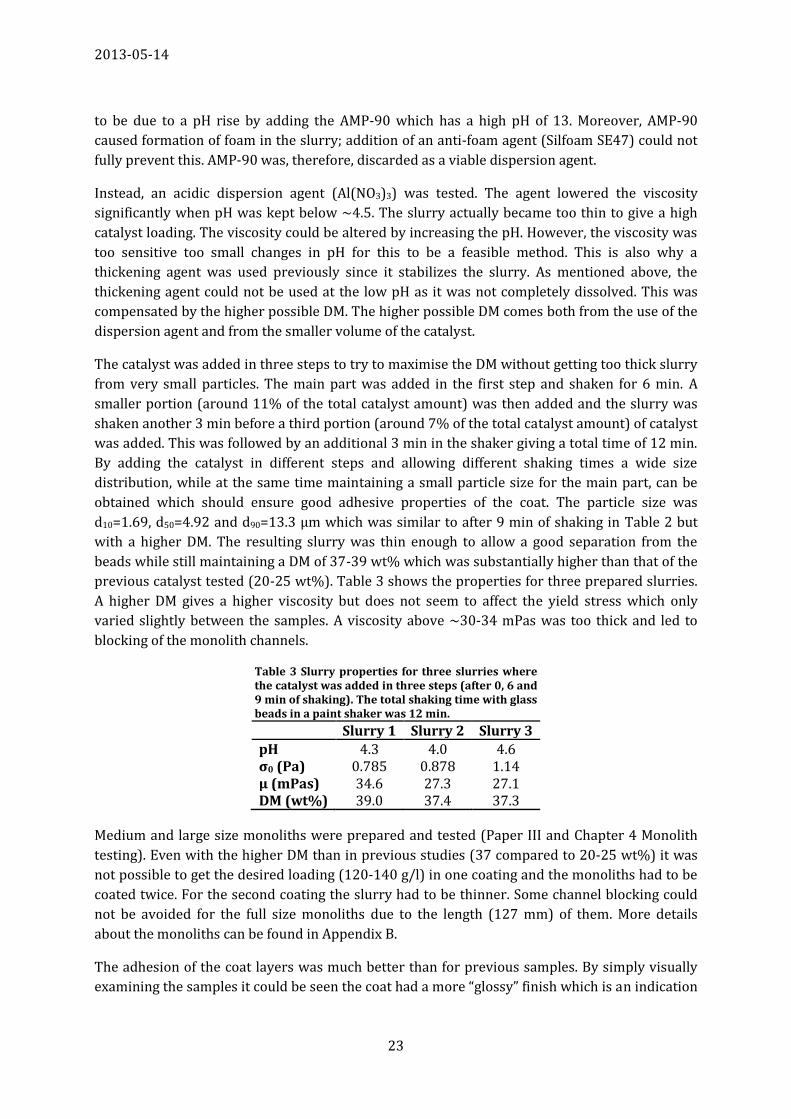
2013-05-14
23
to be due to a pH rise by adding the AMP-90 which has a high pH of 13. Moreover, AMP-90
caused formation of foam in the slurry; addition of an anti-foam agent (Silfoam SE47) could not
fully prevent this. AMP-90 was, therefore, discarded as a viable dispersion agent.
Instead, an acidic dispersion agent (Al(NO3)3) was tested. The agent lowered the viscosity
significantly when pH was kept below ~4.5. The slurry actually became too thin to give a high
catalyst loading. The viscosity could be altered by increasing the pH. However, the viscosity was
too sensitive too small changes in pH for this to be a feasible method. This is also why a
thickening agent was used previously since it stabilizes the slurry. As mentioned above, the
thickening agent could not be used at the low pH as it was not completely dissolved. This was
compensated by the higher possible DM. The higher possible DM comes both from the use of the
dispersion agent and from the smaller volume of the catalyst.
The catalyst was added in three steps to try to maximise the DM without getting too thick slurry
from very small particles. The main part was added in the first step and shaken for 6 min. A
smaller portion (around 11% of the total catalyst amount) was then added and the slurry was
shaken another 3 min before a third portion (around 7% of the total catalyst amount) of catalyst
was added. This was followed by an additional 3 min in the shaker giving a total time of 12 min.
By adding the catalyst in different steps and allowing different shaking times a wide size
distribution, while at the same time maintaining a small particle size for the main part, can be
obtained which should ensure good adhesive properties of the coat. The particle size was
d10=1.69, d50=4.92 and d90=13.3 µm which was similar to after 9 min of shaking in Table 2 but
with a higher DM. The resulting slurry was thin enough to allow a good separation from the
beads while still maintaining a DM of 37-39 wt% which was substantially higher than that of the
previous catalyst tested (20-25 wt%). Table 3 shows the properties for three prepared slurries.
A higher DM gives a higher viscosity but does not seem to affect the yield stress which only
varied slightly between the samples. A viscosity above ~30-34 mPas was too thick and led to
blocking of the monolith channels.
Table 3 Slurry properties for three slurries where the catalyst was added in three steps (after 0, 6 and 9 min of shaking). The total shaking time with glass beads in a paint shaker was 12 min.
Slurry 1 Slurry 2 Slurry 3
pH 4.3 4.0 4.6 σ0 (Pa) 0.785 0.878 1.14 µ (mPas) 34.6 27.3 27.1 DM (wt%) 39.0 37.4 37.3
Medium and large size monoliths were prepared and tested (Paper III and Chapter 4 Monolith
testing). Even with the higher DM than in previous studies (37 compared to 20-25 wt%) it was
not possible to get the desired loading (120-140 g/l) in one coating and the monoliths had to be
coated twice. For the second coating the slurry had to be thinner. Some channel blocking could
not be avoided for the full size monoliths due to the length (127 mm) of them. More details
about the monoliths can be found in Appendix B.
The adhesion of the coat layers was much better than for previous samples. By simply visually
examining the samples it could be seen the coat had a more “glossy” finish which is an indication
2013-05-14
24
of a denser and thus more adhesive coat. This is attributed to the smaller volume and the
particle size distribution of the catalyst.
3.4 Conclusions
Two different alumina were used as carriers for the Ag/Al2O3 based on the results from catalyst
development; a Topsøe high surface area alumina and a commercial Si-alumina. A wetness
impregnation method combined with spray drying was first used as an alternative to standard
incipient wetness impregnation for the Topsøe alumina. The goal was to simplify the catalyst
preparation when the process was scaled up from small-scale powder tests (a couple of grams)
to full size monolith washcoating (several kilograms). However, catalyst activity tests indicated
that some of the activity was lost compared to reference catalyst. This likely comes from a
different Ag dispersion on the catalyst. The gain in time and simplicity was also lower than
anticipated. Incipient wetness impregnation was, therefore, used for the further catalyst
preparation.
The highest possible DM of slurries prepared from the Topsøe alumina was low since the
alumina had a high pore volume. A low DM leads to low coat loadings and the washcoating
process had to be repeated two to three times to meet the desired loading (120-140 g/l). One
way to increase the loading for a given DM is to increase the yield stress of the slurry. This
should be made without increasing the viscosity which may lead to channel blocking of the
monoliths. A thickener agent was successfully used. The thickener also stabilised the slurry
which was very sensitive to small changes in pH. However, it was difficult to work with the
alumina due to the high pore volume (“fluffiness”) and it was difficult to fully reproduce the
results making it challenging to scale up the results to larger monolith bricks. The adherence of
the coat layer, both seen as parts of the coat falling off and by a SEM study, was also considered a
bit low.
The Si-alumina had a smaller pore volume and was easier to handle and a higher DM was
possible. To improve the properties of the washcoat slurries a series of dispersion agents was
tested of which Al(NO3)3 gave positive results. The thickener agent used previously could not be
completely dissolved at the low pH of the acidic dispersion agent. Without addition of a
thickener the slurry was too thin to get a high coat loading. Instead the DM was increased by
adding catalyst in three steps during particle size reduction. Even though a higher DM was
possible, two subsequent coatings were needed to meet the desired loading. It was difficult to
prepare full size monoliths since there was a tendency for channel blocking at the end of the
channels. The monoliths had a visible better adherence compared to the previous ones.
2013-05-14
25
4 Monolith testing The results presented in this chapter are from Papers II and III.
4.1 Materials and method
Catalytic monoliths in three different sizes were prepared and tested. The smallest size was
21x20 mm and they were tested in the “small-scale” laboratory test set-up with flows around 1.7
Nl/min. The monoliths became more challenging to prepare as they got bigger and the next size
was 49x76 mm monoliths that were tested in the “medium-scale” laboratory test set-up at flows
around 70 Nl/min. The last size was full-scale 2 l monoliths tested after a passenger car engine
with flows around 132 Nm3/h during stationary tests.
4.1.1 Small-scale laboratory testing: Ag/Al2O3 and Fe-BEA combinations
The tested small size (21x20 or 10 mm) cylindrical monoliths were prepared by washcoating
cordierite, according to the process described in Chapter 3.3.1 Topsøe alumina. The catalyst
activity was tested in a stainless-steel tubular flow reactor with a feed of 250 ppm NO, 275 ppm
NH3, 0, 250 or 600 ppm H2, 12% O2, 6% H2O and balance N2. The total gas flow was adjusted to
give the desired GHSV (15000, 30000 or 60000 h-1). The tests were performed as a ramp down
of the temperature from 400 to 150°C; NOx and ammonia concentrations were allowed to
stabilize at each step. All outlet gases were monitored by FTIR. NOx conversion was calculated
according to Equation 5. More details can be found in Paper II.
4.1.2 Medium-scale laboratory testing
The tested medium size (49x76 mm) cylindrical monoliths were prepared by washcoating
cordierite according to the process described in Chapter 3.3.2 Siralox alumina.
In a conventional test set-up an oven/furnace is used to heat the feed gases before entering the
reactor. The whole reactor with feed lines can alternatively be placed inside the oven/furnace.
This is a robust technique that is well proven. However, it suffers from slow heating and cooling
rates when the dimensions of the system increase, mostly due to the large mass of the piping, the
reactor and of the surrounding air that has to be heated. In a real vehicle exhaust system the
only heat comes from the hot exhaust gas itself. A “new” test set-up was, therefore, designed
with the intention of building a more compact unit with fast heating and cooling rates. The
ultimate goal was to be able to perform transient runs to more closely mimic the operation of an
engine during real-life driving.
Figure 15 shows a schematic picture of the set-up, all gases and liquid H2O were controlled with
mass flow controllers. All lines after the heater were made of steel. N2 and air were first heated
in a small gas heater before the desired feed gases was added to the hot stream. Steam was
produced by passing liquid H2O to a heated metal block were it rapidly evaporated. The distance
between the heater and the reactor was not large enough to allow a sufficient mixing to get a
homogenous gas feed and a metal mixer was added which proved satisfactory. However, the
heating and cooling rates became significantly slower due to the relatively large mass of the
mixer. During heating a large part of the energy was used to heat the mixer and once heated the
mixer heated the cool gas when the system was meant to cool down. It was, thus, not possible to
run the system transient. The mixer may be omitted if the distance between the heater and the
reactor is increased and/or the dimensions of the tubes are smaller to give an increased
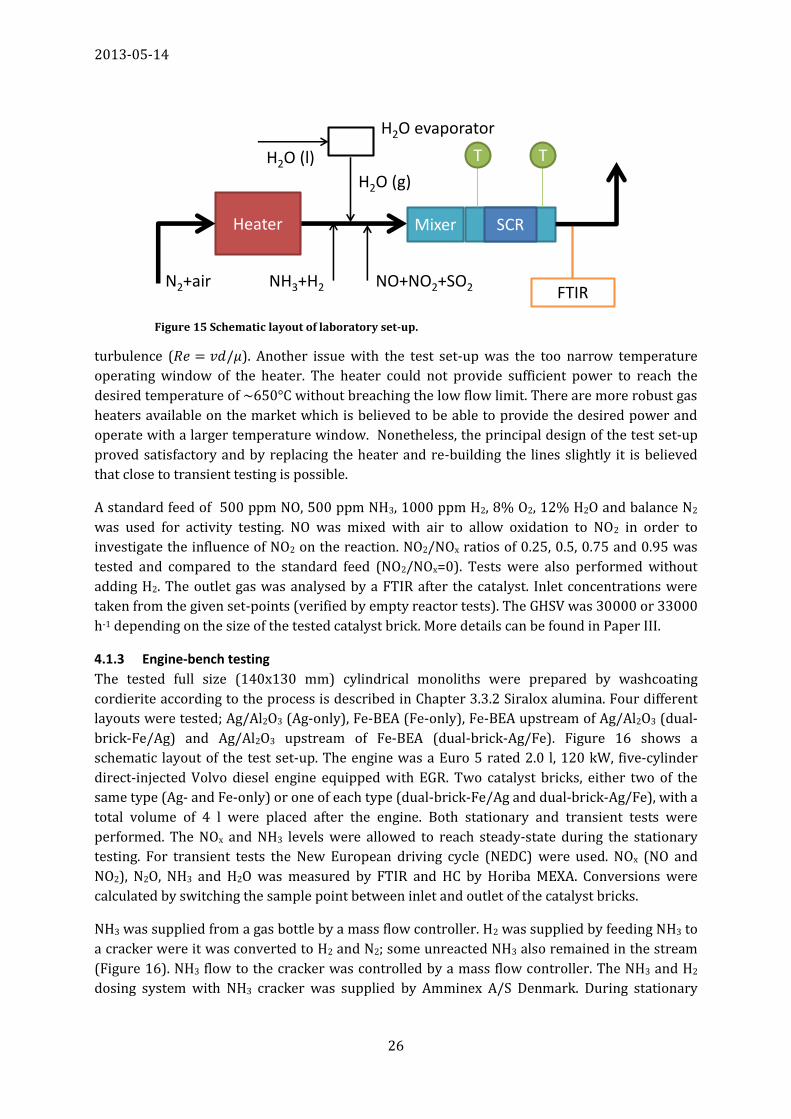
2013-05-14
26
turbulence ( ). Another issue with the test set-up was the too narrow temperature
operating window of the heater. The heater could not provide sufficient power to reach the
desired temperature of ~650°C without breaching the low flow limit. There are more robust gas
heaters available on the market which is believed to be able to provide the desired power and
operate with a larger temperature window. Nonetheless, the principal design of the test set-up
proved satisfactory and by replacing the heater and re-building the lines slightly it is believed
that close to transient testing is possible.
A standard feed of 500 ppm NO, 500 ppm NH3, 1000 ppm H2, 8% O2, 12% H2O and balance N2
was used for activity testing. NO was mixed with air to allow oxidation to NO2 in order to
investigate the influence of NO2 on the reaction. NO2/NOx ratios of 0.25, 0.5, 0.75 and 0.95 was
tested and compared to the standard feed (NO2/NOx=0). Tests were also performed without
adding H2. The outlet gas was analysed by a FTIR after the catalyst. Inlet concentrations were
taken from the given set-points (verified by empty reactor tests). The GHSV was 30000 or 33000
h-1 depending on the size of the tested catalyst brick. More details can be found in Paper III.
4.1.3 Engine-bench testing
The tested full size (140x130 mm) cylindrical monoliths were prepared by washcoating
cordierite according to the process is described in Chapter 3.3.2 Siralox alumina. Four different
layouts were tested; Ag/Al2O3 (Ag-only), Fe-BEA (Fe-only), Fe-BEA upstream of Ag/Al2O3 (dual-
brick-Fe/Ag) and Ag/Al2O3 upstream of Fe-BEA (dual-brick-Ag/Fe). Figure 16 shows a
schematic layout of the test set-up. The engine was a Euro 5 rated 2.0 l, 120 kW, five-cylinder
direct-injected Volvo diesel engine equipped with EGR. Two catalyst bricks, either two of the
same type (Ag- and Fe-only) or one of each type (dual-brick-Fe/Ag and dual-brick-Ag/Fe), with a
total volume of 4 l were placed after the engine. Both stationary and transient tests were
performed. The NOx and NH3 levels were allowed to reach steady-state during the stationary
testing. For transient tests the New European driving cycle (NEDC) were used. NOx (NO and
NO2), N2O, NH3 and H2O was measured by FTIR and HC by Horiba MEXA. Conversions were
calculated by switching the sample point between inlet and outlet of the catalyst bricks.
NH3 was supplied from a gas bottle by a mass flow controller. H2 was supplied by feeding NH3 to
a cracker were it was converted to H2 and N2; some unreacted NH3 also remained in the stream
(Figure 16). NH3 flow to the cracker was controlled by a mass flow controller. The NH3 and H2
dosing system with NH3 cracker was supplied by Amminex A/S Denmark. During stationary
FTIR
Mixer
TT
SCRHeater
H2O evaporator
H2O (l)
H2O (g)
NO+NO2+SO2NH3+H2N2+air
Figure 15 Schematic layout of laboratory set-up.
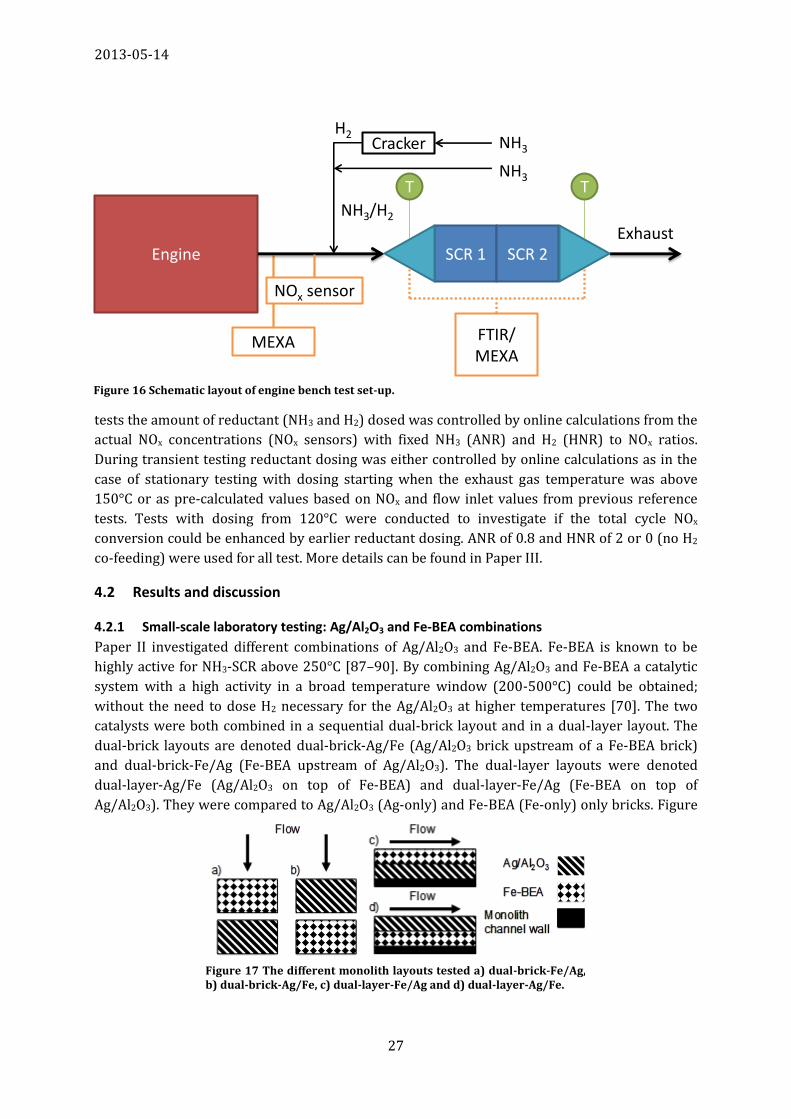
2013-05-14
27
tests the amount of reductant (NH3 and H2) dosed was controlled by online calculations from the
actual NOx concentrations (NOx sensors) with fixed NH3 (ANR) and H2 (HNR) to NOx ratios.
During transient testing reductant dosing was either controlled by online calculations as in the
case of stationary testing with dosing starting when the exhaust gas temperature was above
150°C or as pre-calculated values based on NOx and flow inlet values from previous reference
tests. Tests with dosing from 120°C were conducted to investigate if the total cycle NOx
conversion could be enhanced by earlier reductant dosing. ANR of 0.8 and HNR of 2 or 0 (no H2
co-feeding) were used for all test. More details can be found in Paper III.
4.2 Results and discussion
4.2.1 Small-scale laboratory testing: Ag/Al2O3 and Fe-BEA combinations
Paper II investigated different combinations of Ag/Al2O3 and Fe-BEA. Fe-BEA is known to be
highly active for NH3-SCR above 250°C [87–90]. By combining Ag/Al2O3 and Fe-BEA a catalytic
system with a high activity in a broad temperature window (200-500°C) could be obtained;
without the need to dose H2 necessary for the Ag/Al2O3 at higher temperatures [70]. The two
catalysts were both combined in a sequential dual-brick layout and in a dual-layer layout. The
dual-brick layouts are denoted dual-brick-Ag/Fe (Ag/Al2O3 brick upstream of a Fe-BEA brick)
and dual-brick-Fe/Ag (Fe-BEA upstream of Ag/Al2O3). The dual-layer layouts were denoted
dual-layer-Ag/Fe (Ag/Al2O3 on top of Fe-BEA) and dual-layer-Fe/Ag (Fe-BEA on top of
Ag/Al2O3). They were compared to Ag/Al2O3 (Ag-only) and Fe-BEA (Fe-only) only bricks. Figure
SCR 1 SCR 2Engine
T T
FTIR/MEXA
MEXA
NOx sensor
NH3/H2
NH3
Cracker NH3
H2
Exhaust
Figure 16 Schematic layout of engine bench test set-up.
Figure 17 The different monolith layouts tested a) dual-brick-Fe/Ag, b) dual-brick-Ag/Fe, c) dual-layer-Fe/Ag and d) dual-layer-Ag/Fe.
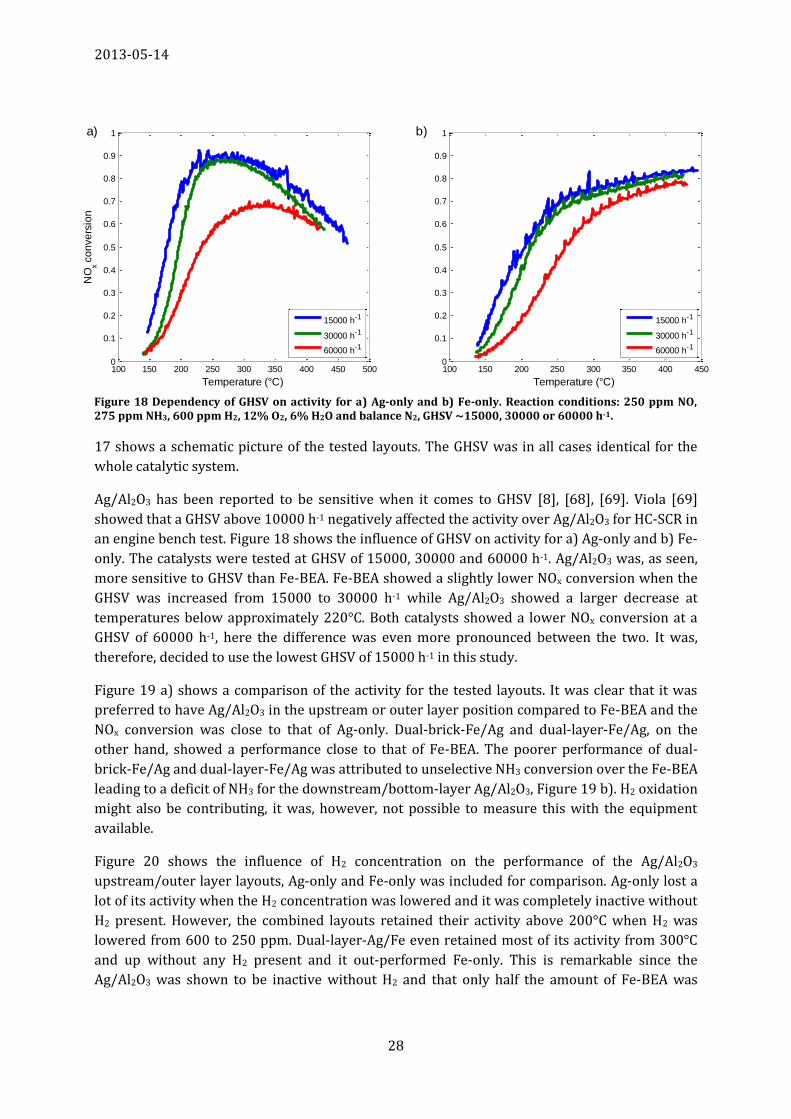
2013-05-14
28
Figure 18 Dependency of GHSV on activity for a) Ag-only and b) Fe-only. Reaction conditions: 250 ppm NO, 275 ppm NH3, 600 ppm H2, 12% O2, 6% H2O and balance N2, GHSV ∼15000, 30000 or 60000 h-1.
100 150 200 250 300 350 400 450 5000
0.1
0.2
0.3
0.4
0.5
0.6
0.7
0.8
0.9
1
Temperature (°C)
NO
x co
nve
rsio
n
15000 h-1
30000 h-1
60000 h-1
100 150 200 250 300 350 400 4500
0.1
0.2
0.3
0.4
0.5
0.6
0.7
0.8
0.9
1
Temperature (°C)
15000 h-1
30000 h-1
60000 h-1
a) b)
17 shows a schematic picture of the tested layouts. The GHSV was in all cases identical for the
whole catalytic system.
Ag/Al2O3 has been reported to be sensitive when it comes to GHSV [8], [68], [69]. Viola [69]
showed that a GHSV above 10000 h-1 negatively affected the activity over Ag/Al2O3 for HC-SCR in
an engine bench test. Figure 18 shows the influence of GHSV on activity for a) Ag-only and b) Fe-
only. The catalysts were tested at GHSV of 15000, 30000 and 60000 h-1. Ag/Al2O3 was, as seen,
more sensitive to GHSV than Fe-BEA. Fe-BEA showed a slightly lower NOx conversion when the
GHSV was increased from 15000 to 30000 h-1 while Ag/Al2O3 showed a larger decrease at
temperatures below approximately 220°C. Both catalysts showed a lower NOx conversion at a
GHSV of 60000 h-1, here the difference was even more pronounced between the two. It was,
therefore, decided to use the lowest GHSV of 15000 h-1 in this study.
Figure 19 a) shows a comparison of the activity for the tested layouts. It was clear that it was
preferred to have Ag/Al2O3 in the upstream or outer layer position compared to Fe-BEA and the
NOx conversion was close to that of Ag-only. Dual-brick-Fe/Ag and dual-layer-Fe/Ag, on the
other hand, showed a performance close to that of Fe-BEA. The poorer performance of dual-
brick-Fe/Ag and dual-layer-Fe/Ag was attributed to unselective NH3 conversion over the Fe-BEA
leading to a deficit of NH3 for the downstream/bottom-layer Ag/Al2O3, Figure 19 b). H2 oxidation
might also be contributing, it was, however, not possible to measure this with the equipment
available.
Figure 20 shows the influence of H2 concentration on the performance of the Ag/Al2O3
upstream/outer layer layouts, Ag-only and Fe-only was included for comparison. Ag-only lost a
lot of its activity when the H2 concentration was lowered and it was completely inactive without
H2 present. However, the combined layouts retained their activity above 200°C when H2 was
lowered from 600 to 250 ppm. Dual-layer-Ag/Fe even retained most of its activity from 300°C
and up without any H2 present and it out-performed Fe-only. This is remarkable since the
Ag/Al2O3 was shown to be inactive without H2 and that only half the amount of Fe-BEA was
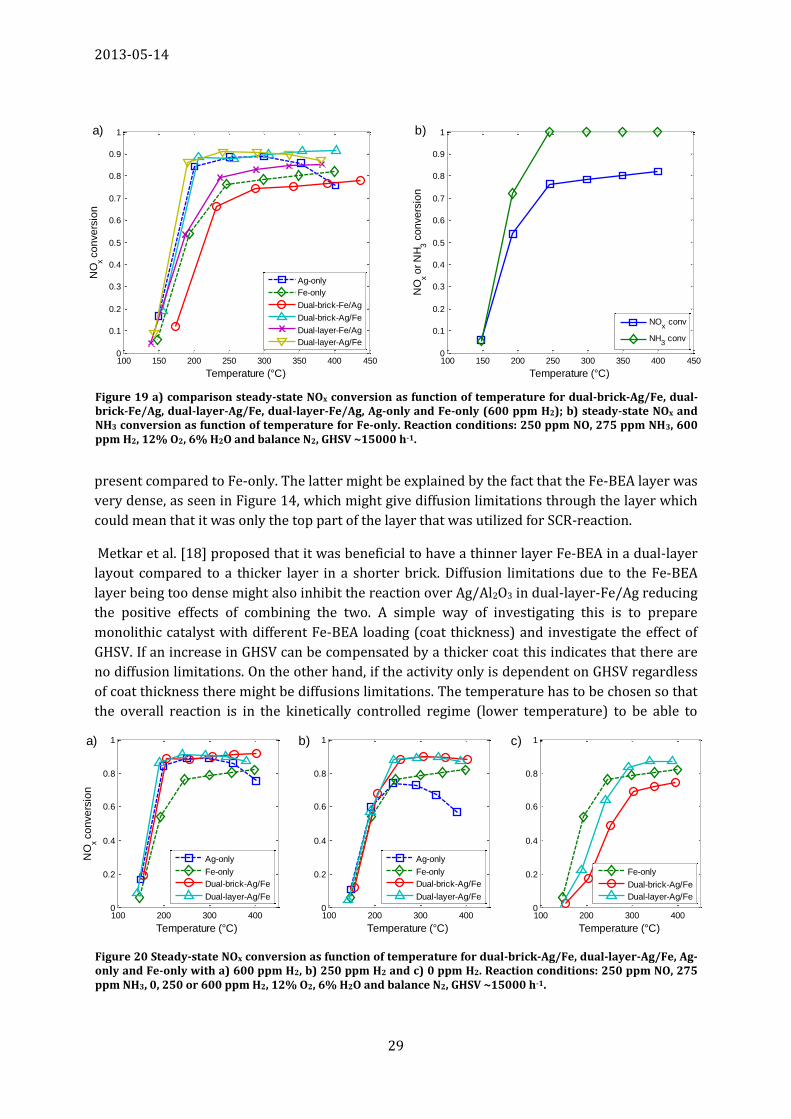
2013-05-14
29
Figure 20 Steady-state NOx conversion as function of temperature for dual-brick-Ag/Fe, dual-layer-Ag/Fe, Ag-only and Fe-only with a) 600 ppm H2, b) 250 ppm H2 and c) 0 ppm H2. Reaction conditions: 250 ppm NO, 275 ppm NH3, 0, 250 or 600 ppm H2, 12% O2, 6% H2O and balance N2, GHSV ~15000 h-1.
100 200 300 4000
0.2
0.4
0.6
0.8
1
Temperature (°C)
NO
x co
nve
rsio
n
Ag-only
Fe-only
Dual-brick-Ag/Fe
Dual-layer-Ag/Fe
100 200 300 4000
0.2
0.4
0.6
0.8
1
Temperature (°C)
Ag-only
Fe-only
Dual-brick-Ag/Fe
Dual-layer-Ag/Fe
100 200 300 4000
0.2
0.4
0.6
0.8
1
Temperature (°C)
Fe-only
Dual-brick-Ag/Fe
Dual-layer-Ag/Fe
a) b) c)
Figure 19 a) comparison steady-state NOx conversion as function of temperature for dual-brick-Ag/Fe, dual-brick-Fe/Ag, dual-layer-Ag/Fe, dual-layer-Fe/Ag, Ag-only and Fe-only (600 ppm H2); b) steady-state NOx and NH3 conversion as function of temperature for Fe-only. Reaction conditions: 250 ppm NO, 275 ppm NH3, 600 ppm H2, 12% O2, 6% H2O and balance N2, GHSV ~15000 h-1.
100 150 200 250 300 350 400 4500
0.1
0.2
0.3
0.4
0.5
0.6
0.7
0.8
0.9
1
Temperature (°C)
NO
x co
nve
rsio
n
Ag-only
Fe-only
Dual-brick-Fe/Ag
Dual-brick-Ag/Fe
Dual-layer-Fe/Ag
Dual-layer-Ag/Fe
100 150 200 250 300 350 400 4500
0.1
0.2
0.3
0.4
0.5
0.6
0.7
0.8
0.9
1
Temperature (°C)
NO
x or
NH
3 c
on
ve
rsio
n
NOx conv
NH3 conv
a) b)
present compared to Fe-only. The latter might be explained by the fact that the Fe-BEA layer was
very dense, as seen in Figure 14, which might give diffusion limitations through the layer which
could mean that it was only the top part of the layer that was utilized for SCR-reaction.
Metkar et al. [18] proposed that it was beneficial to have a thinner layer Fe-BEA in a dual-layer
layout compared to a thicker layer in a shorter brick. Diffusion limitations due to the Fe-BEA
layer being too dense might also inhibit the reaction over Ag/Al2O3 in dual-layer-Fe/Ag reducing
the positive effects of combining the two. A simple way of investigating this is to prepare
monolithic catalyst with different Fe-BEA loading (coat thickness) and investigate the effect of
GHSV. If an increase in GHSV can be compensated by a thicker coat this indicates that there are
no diffusion limitations. On the other hand, if the activity only is dependent on GHSV regardless
of coat thickness there might be diffusions limitations. The temperature has to be chosen so that
the overall reaction is in the kinetically controlled regime (lower temperature) to be able to
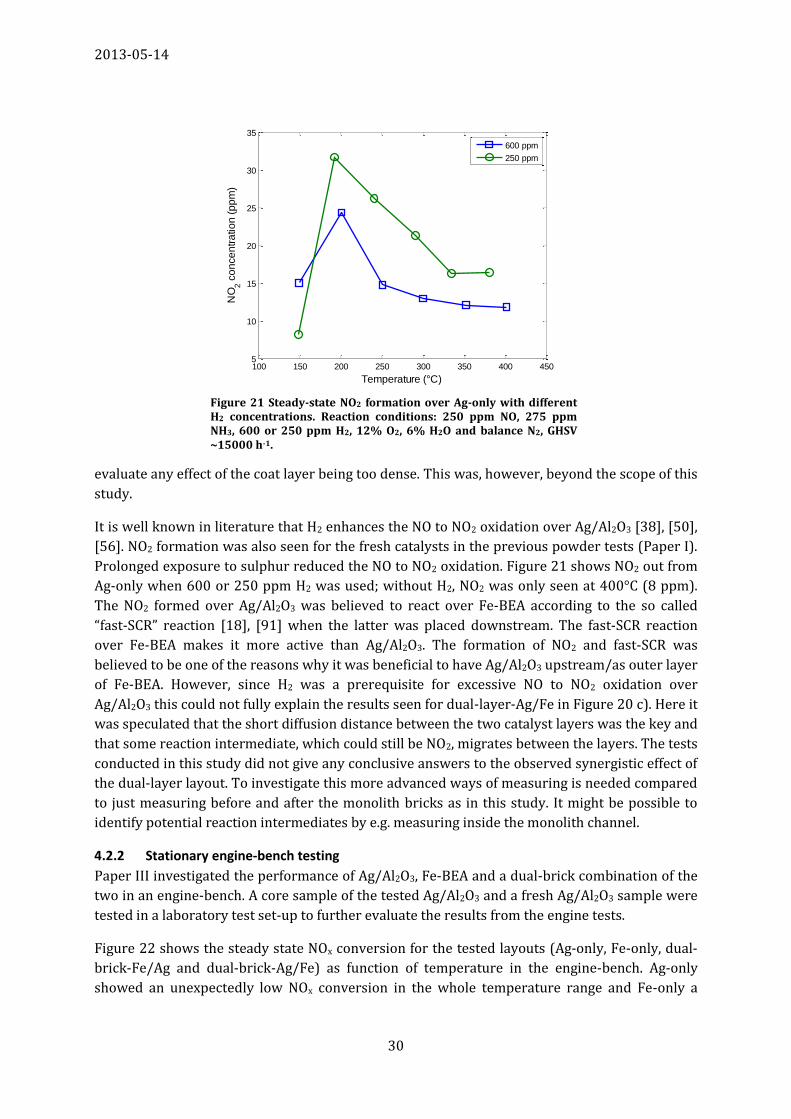
2013-05-14
30
evaluate any effect of the coat layer being too dense. This was, however, beyond the scope of this
study.
It is well known in literature that H2 enhances the NO to NO2 oxidation over Ag/Al2O3 [38], [50],
[56]. NO2 formation was also seen for the fresh catalysts in the previous powder tests (Paper I).
Prolonged exposure to sulphur reduced the NO to NO2 oxidation. Figure 21 shows NO2 out from
Ag-only when 600 or 250 ppm H2 was used; without H2, NO2 was only seen at 400°C (8 ppm).
The NO2 formed over Ag/Al2O3 was believed to react over Fe-BEA according to the so called
“fast-SCR” reaction [18], [91] when the latter was placed downstream. The fast-SCR reaction
over Fe-BEA makes it more active than Ag/Al2O3. The formation of NO2 and fast-SCR was
believed to be one of the reasons why it was beneficial to have Ag/Al2O3 upstream/as outer layer
of Fe-BEA. However, since H2 was a prerequisite for excessive NO to NO2 oxidation over
Ag/Al2O3 this could not fully explain the results seen for dual-layer-Ag/Fe in Figure 20 c). Here it
was speculated that the short diffusion distance between the two catalyst layers was the key and
that some reaction intermediate, which could still be NO2, migrates between the layers. The tests
conducted in this study did not give any conclusive answers to the observed synergistic effect of
the dual-layer layout. To investigate this more advanced ways of measuring is needed compared
to just measuring before and after the monolith bricks as in this study. It might be possible to
identify potential reaction intermediates by e.g. measuring inside the monolith channel.
4.2.2 Stationary engine-bench testing
Paper III investigated the performance of Ag/Al2O3, Fe-BEA and a dual-brick combination of the
two in an engine-bench. A core sample of the tested Ag/Al2O3 and a fresh Ag/Al2O3 sample were
tested in a laboratory test set-up to further evaluate the results from the engine tests.
Figure 22 shows the steady state NOx conversion for the tested layouts (Ag-only, Fe-only, dual-
brick-Fe/Ag and dual-brick-Ag/Fe) as function of temperature in the engine-bench. Ag-only
showed an unexpectedly low NOx conversion in the whole temperature range and Fe-only a
100 150 200 250 300 350 400 4505
10
15
20
25
30
35
NO
2 c
on
ce
ntr
atio
n (
pp
m)
Temperature (°C)
600 ppm
250 ppm
Figure 21 Steady-state NO2 formation over Ag-only with different H2 concentrations. Reaction conditions: 250 ppm NO, 275 ppm NH3, 600 or 250 ppm H2, 12% O2, 6% H2O and balance N2, GHSV ~15000 h-1.
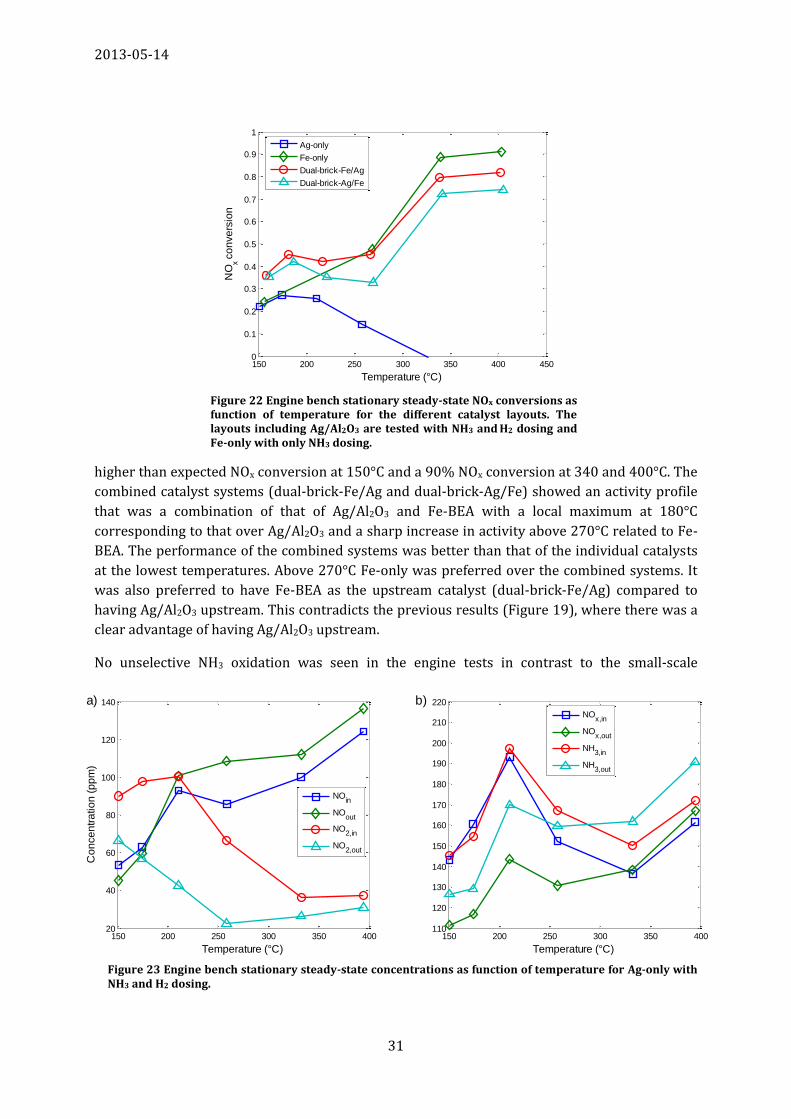
2013-05-14
31
Figure 23 Engine bench stationary steady-state concentrations as function of temperature for Ag-only with NH3 and H2 dosing.
150 200 250 300 350 40020
40
60
80
100
120
140
Temperature (°C)
Co
nce
ntr
atio
n (
pp
m)
NOin
NOout
NO2,in
NO2,out
150 200 250 300 350 400110
120
130
140
150
160
170
180
190
200
210
220
Temperature (°C)
NOx,in
NOx,out
NH3,in
NH3,out
a) b)
higher than expected NOx conversion at 150°C and a 90% NOx conversion at 340 and 400°C. The
combined catalyst systems (dual-brick-Fe/Ag and dual-brick-Ag/Fe) showed an activity profile
that was a combination of that of Ag/Al2O3 and Fe-BEA with a local maximum at 180°C
corresponding to that over Ag/Al2O3 and a sharp increase in activity above 270°C related to Fe-
BEA. The performance of the combined systems was better than that of the individual catalysts
at the lowest temperatures. Above 270°C Fe-only was preferred over the combined systems. It
was also preferred to have Fe-BEA as the upstream catalyst (dual-brick-Fe/Ag) compared to
having Ag/Al2O3 upstream. This contradicts the previous results (Figure 19), where there was a
clear advantage of having Ag/Al2O3 upstream.
No unselective NH3 oxidation was seen in the engine tests in contrast to the small-scale
150 200 250 300 350 400 4500
0.1
0.2
0.3
0.4
0.5
0.6
0.7
0.8
0.9
1
NO
x co
nve
rsio
n
Temperature (°C)
Ag-only
Fe-only
Dual-brick-Fe/Ag
Dual-brick-Ag/Fe
Figure 22 Engine bench stationary steady-state NOx conversions as function of temperature for the different catalyst layouts. The layouts including Ag/Al2O3 are tested with NH3 and H2 dosing and Fe-only with only NH3 dosing.
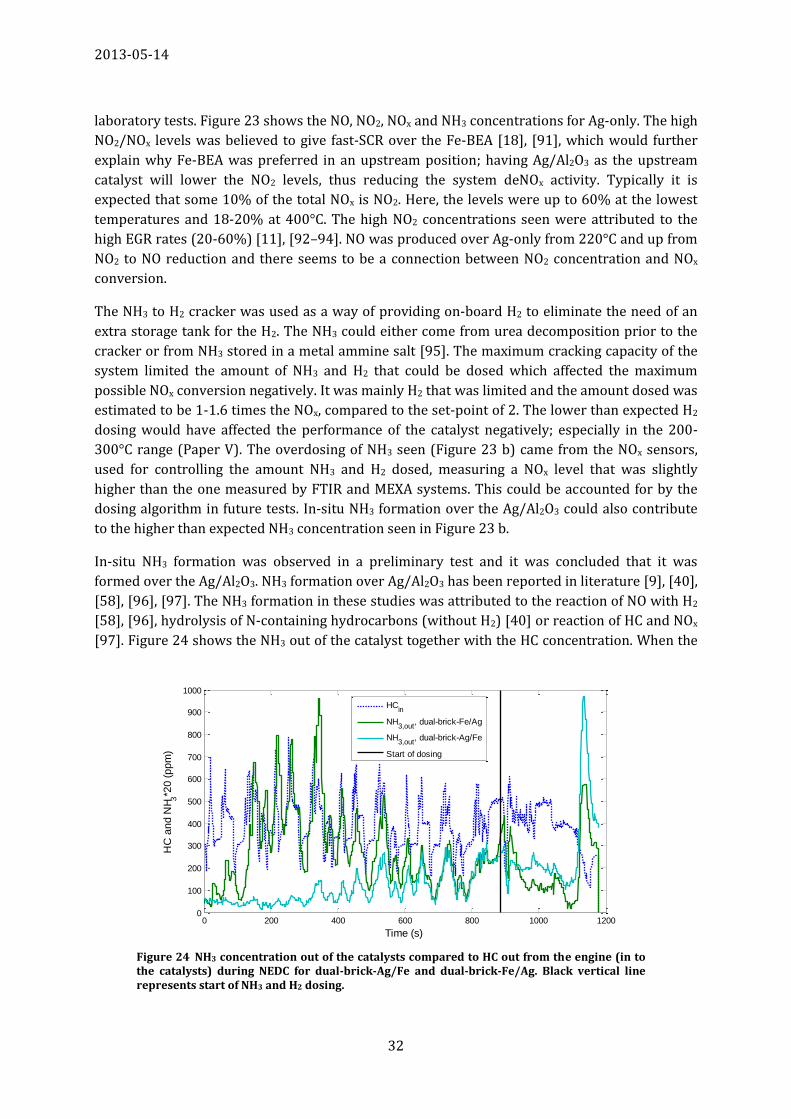
2013-05-14
32
0 200 400 600 800 1000 12000
100
200
300
400
500
600
700
800
900
1000
HC
an
d N
H3*2
0 (
pp
m)
Time (s)
HC
in
NH3,out
, dual-brick-Fe/Ag
NH3,out
, dual-brick-Ag/Fe
Start of dosing
Figure 24 NH3 concentration out of the catalysts compared to HC out from the engine (in to the catalysts) during NEDC for dual-brick-Ag/Fe and dual-brick-Fe/Ag. Black vertical line represents start of NH3 and H2 dosing.
laboratory tests. Figure 23 shows the NO, NO2, NOx and NH3 concentrations for Ag-only. The high
NO2/NOx levels was believed to give fast-SCR over the Fe-BEA [18], [91], which would further
explain why Fe-BEA was preferred in an upstream position; having Ag/Al2O3 as the upstream
catalyst will lower the NO2 levels, thus reducing the system deNOx activity. Typically it is
expected that some 10% of the total NOx is NO2. Here, the levels were up to 60% at the lowest
temperatures and 18-20% at 400°C. The high NO2 concentrations seen were attributed to the
high EGR rates (20-60%) [11], [92–94]. NO was produced over Ag-only from 220°C and up from
NO2 to NO reduction and there seems to be a connection between NO2 concentration and NOx
conversion.
The NH3 to H2 cracker was used as a way of providing on-board H2 to eliminate the need of an
extra storage tank for the H2. The NH3 could either come from urea decomposition prior to the
cracker or from NH3 stored in a metal ammine salt [95]. The maximum cracking capacity of the
system limited the amount of NH3 and H2 that could be dosed which affected the maximum
possible NOx conversion negatively. It was mainly H2 that was limited and the amount dosed was
estimated to be 1-1.6 times the NOx, compared to the set-point of 2. The lower than expected H2
dosing would have affected the performance of the catalyst negatively; especially in the 200-
300°C range (Paper V). The overdosing of NH3 seen (Figure 23 b) came from the NOx sensors,
used for controlling the amount NH3 and H2 dosed, measuring a NOx level that was slightly
higher than the one measured by FTIR and MEXA systems. This could be accounted for by the
dosing algorithm in future tests. In-situ NH3 formation over the Ag/Al2O3 could also contribute
to the higher than expected NH3 concentration seen in Figure 23 b.
In-situ NH3 formation was observed in a preliminary test and it was concluded that it was
formed over the Ag/Al2O3. NH3 formation over Ag/Al2O3 has been reported in literature [9], [40],
[58], [96], [97]. The NH3 formation in these studies was attributed to the reaction of NO with H2
[58], [96], hydrolysis of N-containing hydrocarbons (without H2) [40] or reaction of HC and NOx
[97]. Figure 24 shows the NH3 out of the catalyst together with the HC concentration. When the
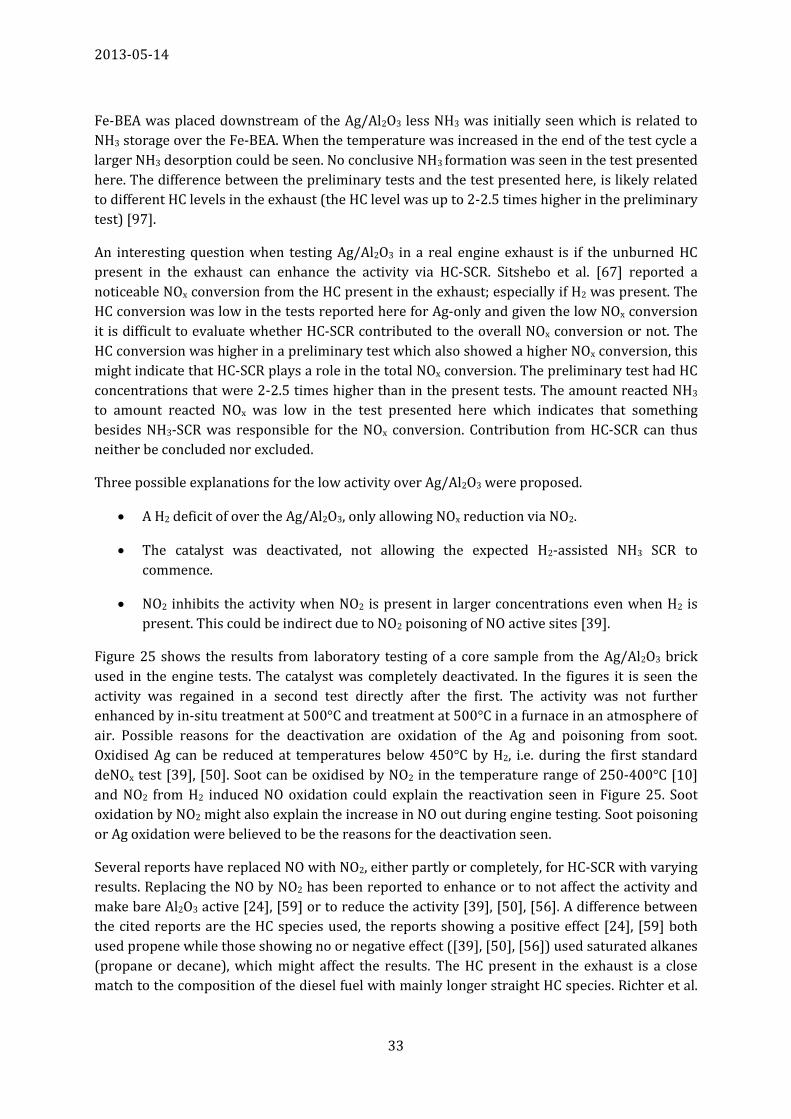
2013-05-14
33
Fe-BEA was placed downstream of the Ag/Al2O3 less NH3 was initially seen which is related to
NH3 storage over the Fe-BEA. When the temperature was increased in the end of the test cycle a
larger NH3 desorption could be seen. No conclusive NH3 formation was seen in the test presented
here. The difference between the preliminary tests and the test presented here, is likely related
to different HC levels in the exhaust (the HC level was up to 2-2.5 times higher in the preliminary
test) [97].
An interesting question when testing Ag/Al2O3 in a real engine exhaust is if the unburned HC
present in the exhaust can enhance the activity via HC-SCR. Sitshebo et al. [67] reported a
noticeable NOx conversion from the HC present in the exhaust; especially if H2 was present. The
HC conversion was low in the tests reported here for Ag-only and given the low NOx conversion
it is difficult to evaluate whether HC-SCR contributed to the overall NOx conversion or not. The
HC conversion was higher in a preliminary test which also showed a higher NOx conversion, this
might indicate that HC-SCR plays a role in the total NOx conversion. The preliminary test had HC
concentrations that were 2-2.5 times higher than in the present tests. The amount reacted NH3
to amount reacted NOx was low in the test presented here which indicates that something
besides NH3-SCR was responsible for the NOx conversion. Contribution from HC-SCR can thus
neither be concluded nor excluded.
Three possible explanations for the low activity over Ag/Al2O3 were proposed.
A H2 deficit of over the Ag/Al2O3, only allowing NOx reduction via NO2.
The catalyst was deactivated, not allowing the expected H2-assisted NH3 SCR to
commence.
NO2 inhibits the activity when NO2 is present in larger concentrations even when H2 is
present. This could be indirect due to NO2 poisoning of NO active sites [39].
Figure 25 shows the results from laboratory testing of a core sample from the Ag/Al2O3 brick
used in the engine tests. The catalyst was completely deactivated. In the figures it is seen the
activity was regained in a second test directly after the first. The activity was not further
enhanced by in-situ treatment at 500°C and treatment at 500°C in a furnace in an atmosphere of
air. Possible reasons for the deactivation are oxidation of the Ag and poisoning from soot.
Oxidised Ag can be reduced at temperatures below 450°C by H2, i.e. during the first standard
deNOx test [39], [50]. Soot can be oxidised by NO2 in the temperature range of 250-400°C [10]
and NO2 from H2 induced NO oxidation could explain the reactivation seen in Figure 25. Soot
oxidation by NO2 might also explain the increase in NO out during engine testing. Soot poisoning
or Ag oxidation were believed to be the reasons for the deactivation seen.
Several reports have replaced NO with NO2, either partly or completely, for HC-SCR with varying
results. Replacing the NO by NO2 has been reported to enhance or to not affect the activity and
make bare Al2O3 active [24], [59] or to reduce the activity [39], [50], [56]. A difference between
the cited reports are the HC species used, the reports showing a positive effect [24], [59] both
used propene while those showing no or negative effect ([39], [50], [56]) used saturated alkanes
(propane or decane), which might affect the results. The HC present in the exhaust is a close
match to the composition of the diesel fuel with mainly longer straight HC species. Richter et al.
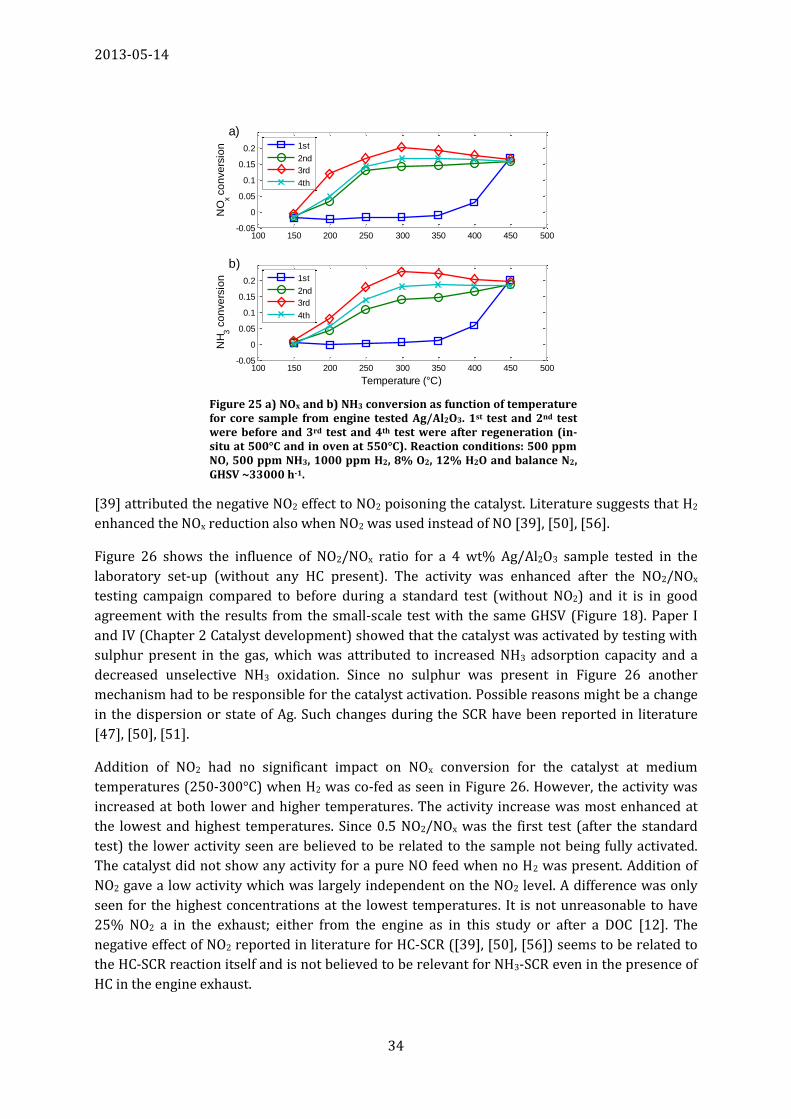
2013-05-14
34
[39] attributed the negative NO2 effect to NO2 poisoning the catalyst. Literature suggests that H2
enhanced the NOx reduction also when NO2 was used instead of NO [39], [50], [56].
Figure 26 shows the influence of NO2/NOx ratio for a 4 wt% Ag/Al2O3 sample tested in the
laboratory set-up (without any HC present). The activity was enhanced after the NO2/NOx
testing campaign compared to before during a standard test (without NO2) and it is in good
agreement with the results from the small-scale test with the same GHSV (Figure 18). Paper I
and IV (Chapter 2 Catalyst development) showed that the catalyst was activated by testing with
sulphur present in the gas, which was attributed to increased NH3 adsorption capacity and a
decreased unselective NH3 oxidation. Since no sulphur was present in Figure 26 another
mechanism had to be responsible for the catalyst activation. Possible reasons might be a change
in the dispersion or state of Ag. Such changes during the SCR have been reported in literature
[47], [50], [51].
Addition of NO2 had no significant impact on NOx conversion for the catalyst at medium
temperatures (250-300°C) when H2 was co-fed as seen in Figure 26. However, the activity was
increased at both lower and higher temperatures. The activity increase was most enhanced at
the lowest and highest temperatures. Since 0.5 NO2/NOx was the first test (after the standard
test) the lower activity seen are believed to be related to the sample not being fully activated.
The catalyst did not show any activity for a pure NO feed when no H2 was present. Addition of
NO2 gave a low activity which was largely independent on the NO2 level. A difference was only
seen for the highest concentrations at the lowest temperatures. It is not unreasonable to have
25% NO2 a in the exhaust; either from the engine as in this study or after a DOC [12]. The
negative effect of NO2 reported in literature for HC-SCR ([39], [50], [56]) seems to be related to
the HC-SCR reaction itself and is not believed to be relevant for NH3-SCR even in the presence of
HC in the engine exhaust.
100 150 200 250 300 350 400 450 500-0.05
0
0.05
0.1
0.15
0.2
NO
x co
nve
rsio
n
1st
2nd
3rd
4th
100 150 200 250 300 350 400 450 500-0.05
0
0.05
0.1
0.15
0.2
Temperature (°C)
NH
3 c
on
ve
rsio
n
1st
2nd
3rd
4th
a)
b)
Figure 25 a) NOx and b) NH3 conversion as function of temperature for core sample from engine tested Ag/Al2O3. 1st test and 2nd test were before and 3rd test and 4th test were after regeneration (in-situ at 500°C and in oven at 550°C). Reaction conditions: 500 ppm NO, 500 ppm NH3, 1000 ppm H2, 8% O2, 12% H2O and balance N2, GHSV ~33000 h-1.
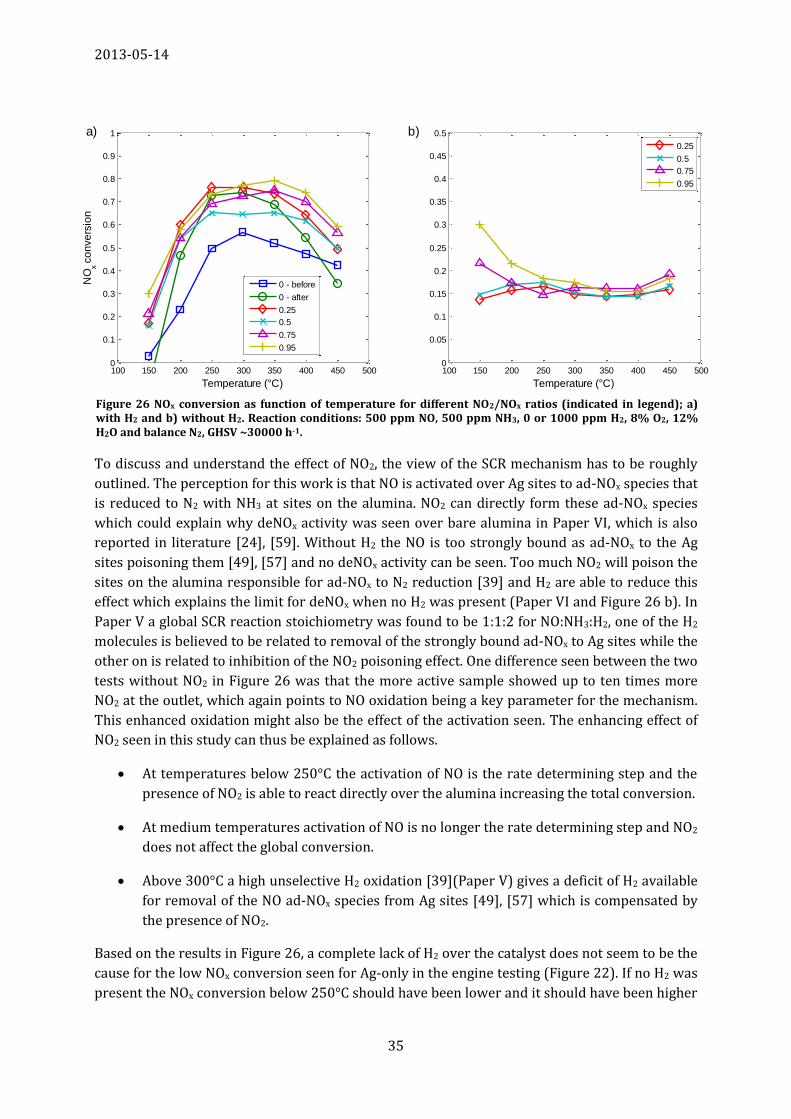
2013-05-14
35
Figure 26 NOx conversion as function of temperature for different NO2/NOx ratios (indicated in legend); a) with H2 and b) without H2. Reaction conditions: 500 ppm NO, 500 ppm NH3, 0 or 1000 ppm H2, 8% O2, 12% H2O and balance N2, GHSV ~30000 h-1.
100 150 200 250 300 350 400 450 5000
0.1
0.2
0.3
0.4
0.5
0.6
0.7
0.8
0.9
1
Temperature (°C)
NO
x co
nve
rsio
n
0 - before
0 - after
0.25
0.5
0.75
0.95
100 150 200 250 300 350 400 450 5000
0.05
0.1
0.15
0.2
0.25
0.3
0.35
0.4
0.45
0.5
Temperature (°C)
0.25
0.5
0.75
0.95
a) b)
To discuss and understand the effect of NO2, the view of the SCR mechanism has to be roughly
outlined. The perception for this work is that NO is activated over Ag sites to ad-NOx species that
is reduced to N2 with NH3 at sites on the alumina. NO2 can directly form these ad-NOx species
which could explain why deNOx activity was seen over bare alumina in Paper VI, which is also
reported in literature [24], [59]. Without H2 the NO is too strongly bound as ad-NOx to the Ag
sites poisoning them [49], [57] and no deNOx activity can be seen. Too much NO2 will poison the
sites on the alumina responsible for ad-NOx to N2 reduction [39] and H2 are able to reduce this
effect which explains the limit for deNOx when no H2 was present (Paper VI and Figure 26 b). In
Paper V a global SCR reaction stoichiometry was found to be 1:1:2 for NO:NH3:H2, one of the H2
molecules is believed to be related to removal of the strongly bound ad-NOx to Ag sites while the
other on is related to inhibition of the NO2 poisoning effect. One difference seen between the two
tests without NO2 in Figure 26 was that the more active sample showed up to ten times more
NO2 at the outlet, which again points to NO oxidation being a key parameter for the mechanism.
This enhanced oxidation might also be the effect of the activation seen. The enhancing effect of
NO2 seen in this study can thus be explained as follows.
At temperatures below 250°C the activation of NO is the rate determining step and the
presence of NO2 is able to react directly over the alumina increasing the total conversion.
At medium temperatures activation of NO is no longer the rate determining step and NO2
does not affect the global conversion.
Above 300°C a high unselective H2 oxidation [39](Paper V) gives a deficit of H2 available
for removal of the NO ad-NOx species from Ag sites [49], [57] which is compensated by
the presence of NO2.
Based on the results in Figure 26, a complete lack of H2 over the catalyst does not seem to be the
cause for the low NOx conversion seen for Ag-only in the engine testing (Figure 22). If no H2 was
present the NOx conversion below 250°C should have been lower and it should have been higher
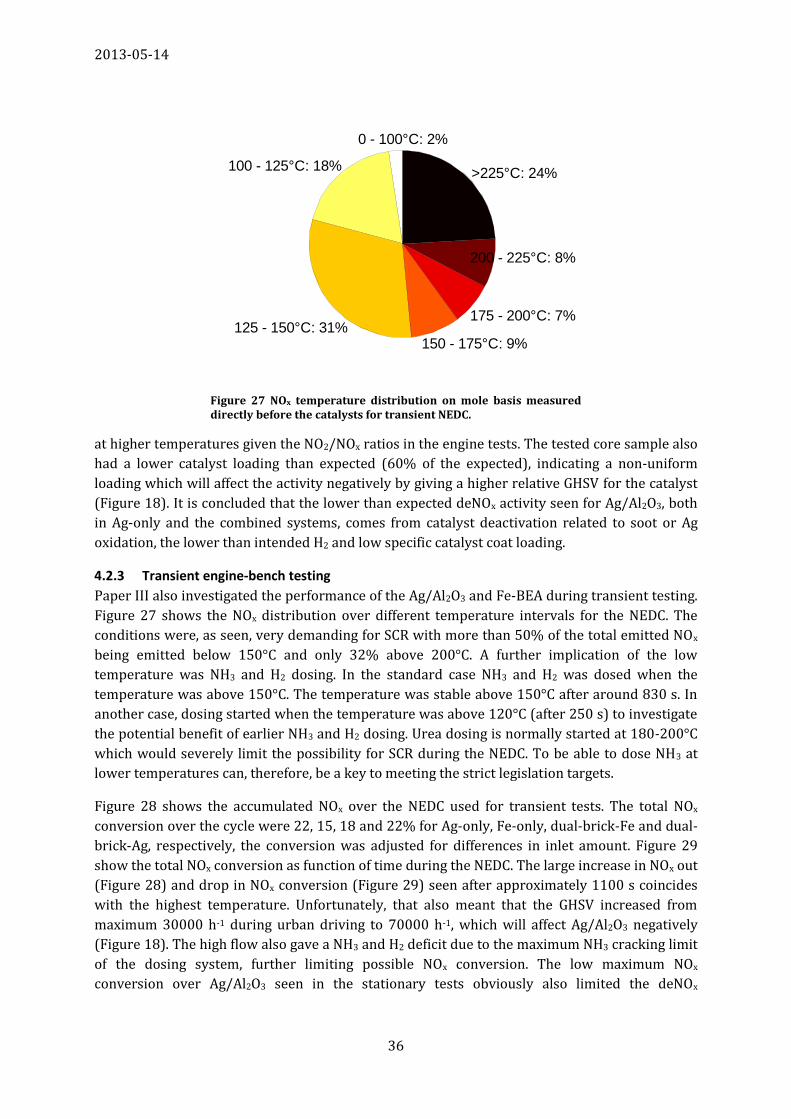
2013-05-14
36
at higher temperatures given the NO2/NOx ratios in the engine tests. The tested core sample also
had a lower catalyst loading than expected (60% of the expected), indicating a non-uniform
loading which will affect the activity negatively by giving a higher relative GHSV for the catalyst
(Figure 18). It is concluded that the lower than expected deNOx activity seen for Ag/Al2O3, both
in Ag-only and the combined systems, comes from catalyst deactivation related to soot or Ag
oxidation, the lower than intended H2 and low specific catalyst coat loading.
4.2.3 Transient engine-bench testing
Paper III also investigated the performance of the Ag/Al2O3 and Fe-BEA during transient testing.
Figure 27 shows the NOx distribution over different temperature intervals for the NEDC. The
conditions were, as seen, very demanding for SCR with more than 50% of the total emitted NOx
being emitted below 150°C and only 32% above 200°C. A further implication of the low
temperature was NH3 and H2 dosing. In the standard case NH3 and H2 was dosed when the
temperature was above 150°C. The temperature was stable above 150°C after around 830 s. In
another case, dosing started when the temperature was above 120°C (after 250 s) to investigate
the potential benefit of earlier NH3 and H2 dosing. Urea dosing is normally started at 180-200°C
which would severely limit the possibility for SCR during the NEDC. To be able to dose NH3 at
lower temperatures can, therefore, be a key to meeting the strict legislation targets.
Figure 28 shows the accumulated NOx over the NEDC used for transient tests. The total NOx
conversion over the cycle were 22, 15, 18 and 22% for Ag-only, Fe-only, dual-brick-Fe and dual-
brick-Ag, respectively, the conversion was adjusted for differences in inlet amount. Figure 29
show the total NOx conversion as function of time during the NEDC. The large increase in NOx out
(Figure 28) and drop in NOx conversion (Figure 29) seen after approximately 1100 s coincides
with the highest temperature. Unfortunately, that also meant that the GHSV increased from
maximum 30000 h-1 during urban driving to 70000 h-1, which will affect Ag/Al2O3 negatively
(Figure 18). The high flow also gave a NH3 and H2 deficit due to the maximum NH3 cracking limit
of the dosing system, further limiting possible NOx conversion. The low maximum NOx
conversion over Ag/Al2O3 seen in the stationary tests obviously also limited the deNOx
0 - 100°C: 2%
100 - 125°C: 18%
125 - 150°C: 31%150 - 175°C: 9%
175 - 200°C: 7%
200 - 225°C: 8%
>225°C: 24%
Figure 27 NOx temperature distribution on mole basis measured directly before the catalysts for transient NEDC.
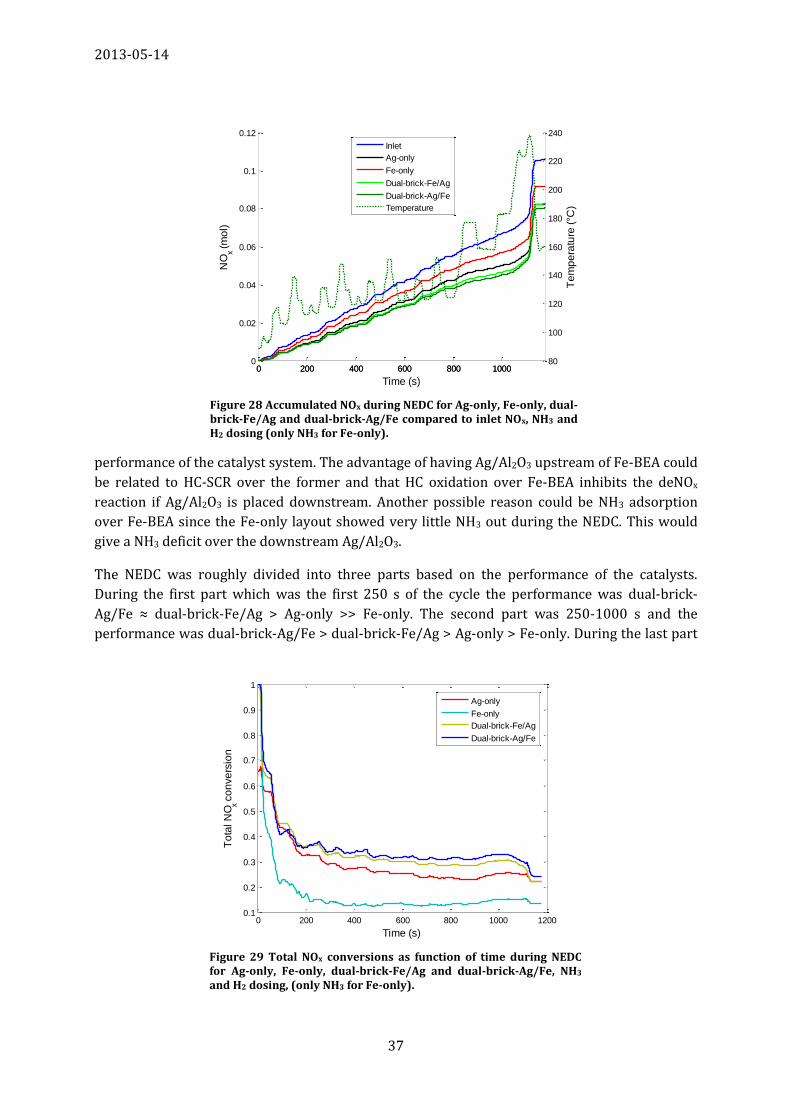
2013-05-14
37
performance of the catalyst system. The advantage of having Ag/Al2O3 upstream of Fe-BEA could
be related to HC-SCR over the former and that HC oxidation over Fe-BEA inhibits the deNOx
reaction if Ag/Al2O3 is placed downstream. Another possible reason could be NH3 adsorption
over Fe-BEA since the Fe-only layout showed very little NH3 out during the NEDC. This would
give a NH3 deficit over the downstream Ag/Al2O3.
The NEDC was roughly divided into three parts based on the performance of the catalysts.
During the first part which was the first 250 s of the cycle the performance was dual-brick-
Ag/Fe ≈ dual-brick-Fe/Ag > Ag-only >> Fe-only. The second part was 250-1000 s and the
performance was dual-brick-Ag/Fe > dual-brick-Fe/Ag > Ag-only > Fe-only. During the last part
0 200 400 600 800 10000
0.02
0.04
0.06
0.08
0.1
0.12
Time (s)
NO
x (m
ol)
0 200 400 600 800 100080
100
120
140
160
180
200
220
240
Te
mp
era
ture
(°C
)
Inlet
Ag-only
Fe-only
Dual-brick-Fe/Ag
Dual-brick-Ag/Fe
Temperature
Figure 28 Accumulated NOx during NEDC for Ag-only, Fe-only, dual-brick-Fe/Ag and dual-brick-Ag/Fe compared to inlet NOx, NH3 and H2 dosing (only NH3 for Fe-only).
0 200 400 600 800 1000 12000.1
0.2
0.3
0.4
0.5
0.6
0.7
0.8
0.9
1
To
tal N
Ox c
on
ve
rsio
n
Time (s)
Ag-only
Fe-only
Dual-brick-Fe/Ag
Dual-brick-Ag/Fe
Figure 29 Total NOx conversions as function of time during NEDC for Ag-only, Fe-only, dual-brick-Fe/Ag and dual-brick-Ag/Fe, NH3 and H2 dosing, (only NH3 for Fe-only).
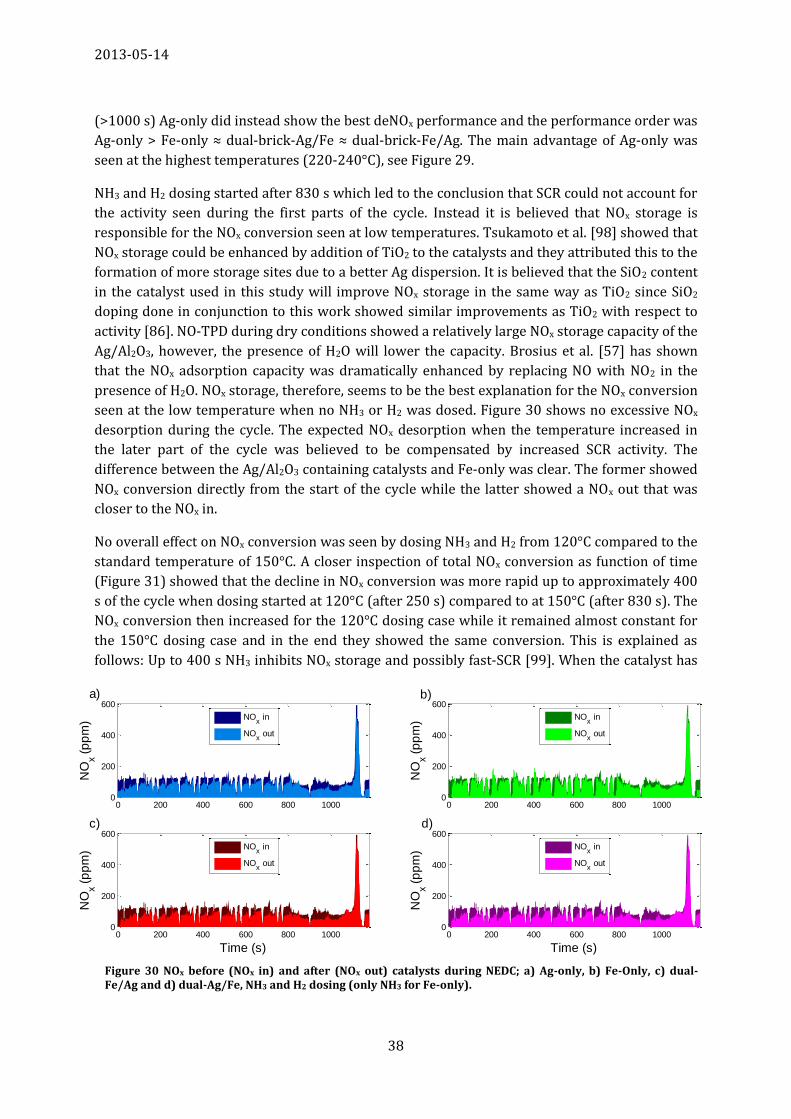
2013-05-14
38
0 200 400 600 800 10000
200
400
600
NO
x (p
pm
)
NOx in
NOx out
0 200 400 600 800 10000
200
400
600
NO
x (p
pm
)
NOx in
NOx out
0 200 400 600 800 10000
200
400
600
Time (s)
NO
x (p
pm
)
NOx in
NOx out
0 200 400 600 800 10000
200
400
600
Time (s)
NO
x (p
pm
)
NOx in
NOx out
a) b)
c) d)
Figure 30 NOx before (NOx in) and after (NOx out) catalysts during NEDC; a) Ag-only, b) Fe-Only, c) dual-Fe/Ag and d) dual-Ag/Fe, NH3 and H2 dosing (only NH3 for Fe-only).
(>1000 s) Ag-only did instead show the best deNOx performance and the performance order was
Ag-only > Fe-only ≈ dual-brick-Ag/Fe ≈ dual-brick-Fe/Ag. The main advantage of Ag-only was
seen at the highest temperatures (220-240°C), see Figure 29.
NH3 and H2 dosing started after 830 s which led to the conclusion that SCR could not account for
the activity seen during the first parts of the cycle. Instead it is believed that NOx storage is
responsible for the NOx conversion seen at low temperatures. Tsukamoto et al. [98] showed that
NOx storage could be enhanced by addition of TiO2 to the catalysts and they attributed this to the
formation of more storage sites due to a better Ag dispersion. It is believed that the SiO2 content
in the catalyst used in this study will improve NOx storage in the same way as TiO2 since SiO2
doping done in conjunction to this work showed similar improvements as TiO2 with respect to
activity [86]. NO-TPD during dry conditions showed a relatively large NOx storage capacity of the
Ag/Al2O3, however, the presence of H2O will lower the capacity. Brosius et al. [57] has shown
that the NOx adsorption capacity was dramatically enhanced by replacing NO with NO2 in the
presence of H2O. NOx storage, therefore, seems to be the best explanation for the NOx conversion
seen at the low temperature when no NH3 or H2 was dosed. Figure 30 shows no excessive NOx
desorption during the cycle. The expected NOx desorption when the temperature increased in
the later part of the cycle was believed to be compensated by increased SCR activity. The
difference between the Ag/Al2O3 containing catalysts and Fe-only was clear. The former showed
NOx conversion directly from the start of the cycle while the latter showed a NOx out that was
closer to the NOx in.
No overall effect on NOx conversion was seen by dosing NH3 and H2 from 120°C compared to the
standard temperature of 150°C. A closer inspection of total NOx conversion as function of time
(Figure 31) showed that the decline in NOx conversion was more rapid up to approximately 400
s of the cycle when dosing started at 120°C (after 250 s) compared to at 150°C (after 830 s). The
NOx conversion then increased for the 120°C dosing case while it remained almost constant for
the 150°C dosing case and in the end they showed the same conversion. This is explained as
follows: Up to 400 s NH3 inhibits NOx storage and possibly fast-SCR [99]. When the catalyst has
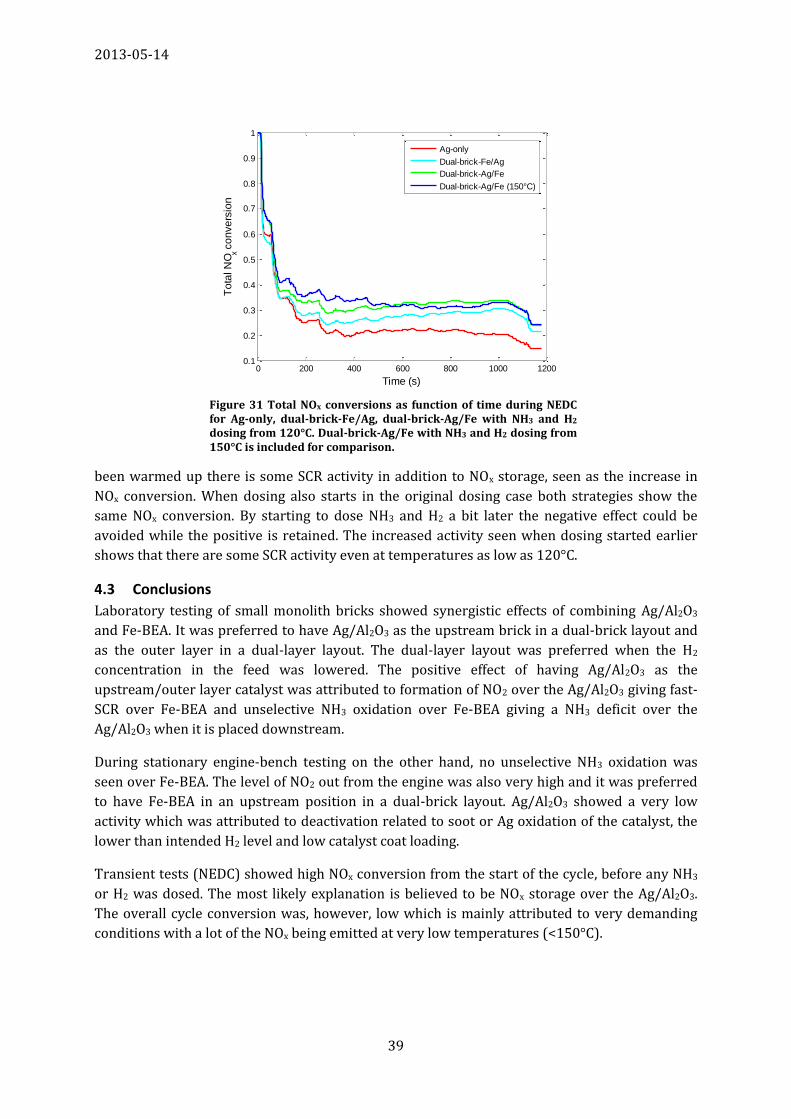
2013-05-14
39
been warmed up there is some SCR activity in addition to NOx storage, seen as the increase in
NOx conversion. When dosing also starts in the original dosing case both strategies show the
same NOx conversion. By starting to dose NH3 and H2 a bit later the negative effect could be
avoided while the positive is retained. The increased activity seen when dosing started earlier
shows that there are some SCR activity even at temperatures as low as 120°C.
4.3 Conclusions
Laboratory testing of small monolith bricks showed synergistic effects of combining Ag/Al2O3
and Fe-BEA. It was preferred to have Ag/Al2O3 as the upstream brick in a dual-brick layout and
as the outer layer in a dual-layer layout. The dual-layer layout was preferred when the H2
concentration in the feed was lowered. The positive effect of having Ag/Al2O3 as the
upstream/outer layer catalyst was attributed to formation of NO2 over the Ag/Al2O3 giving fast-
SCR over Fe-BEA and unselective NH3 oxidation over Fe-BEA giving a NH3 deficit over the
Ag/Al2O3 when it is placed downstream.
During stationary engine-bench testing on the other hand, no unselective NH3 oxidation was
seen over Fe-BEA. The level of NO2 out from the engine was also very high and it was preferred
to have Fe-BEA in an upstream position in a dual-brick layout. Ag/Al2O3 showed a very low
activity which was attributed to deactivation related to soot or Ag oxidation of the catalyst, the
lower than intended H2 level and low catalyst coat loading.
Transient tests (NEDC) showed high NOx conversion from the start of the cycle, before any NH3
or H2 was dosed. The most likely explanation is believed to be NOx storage over the Ag/Al2O3.
The overall cycle conversion was, however, low which is mainly attributed to very demanding
conditions with a lot of the NOx being emitted at very low temperatures (<150°C).
0 200 400 600 800 1000 12000.1
0.2
0.3
0.4
0.5
0.6
0.7
0.8
0.9
1
To
tal N
Ox c
on
ve
rsio
n
Time (s)
Ag-only
Dual-brick-Fe/Ag
Dual-brick-Ag/Fe
Dual-brick-Ag/Fe (150°C)
Figure 31 Total NOx conversions as function of time during NEDC for Ag-only, dual-brick-Fe/Ag, dual-brick-Ag/Fe with NH3 and H2 dosing from 120°C. Dual-brick-Ag/Fe with NH3 and H2 dosing from 150°C is included for comparison.
2013-05-14
40
5 Overall conclusions and future outlook
5.1 Conclusions
From the catalyst development it was concluded that a high SBET and higher Ag loading gives a
high sulphur tolerance and a high deNOx activity. A high Ag loading gives more active sites and
probably a more favourable Ag dispersion. A too high Ag loading reduces the NH3 adsorption
capacity while sulphur increases it due to formation of acid sites. The high SBET is believed to
allow more Ag and give a higher NH3 adsorption capacity, necessary for the SCR reaction. The
high Ag loading and high SBET catalyst showed a high tolerance towards sulphur poisoning.
A similar activity enhancement (de-greening) was seen from laboratory-scale testing of
monolithic catalysts as was seen for powder catalysts during testing with sulphur. NO2 was
present in the feed for the monolithic tests which might affect the results. It might also be that
the observed activity enhancement for the powder catalyst is more related to the testing itself
than the presence of sulphur. It is believed that the activation is related to Ag and not the
alumina as an increased NO to NO2 oxidation was seen for the monolithic catalyst after it was
activated. Possible reasons for this activation might be a change in the dispersion or state of Ag.
Ag/Al2O3 was combined with Fe-BEA to give a catalyst with a high activity in a broad
temperature range without the need to continuously having to dose H2 to get activity over the
Ag/Al2O3. Small-scale monolith tests showed that it was preferred to have Ag/Al2O3 either as the
upstream brick in a dual-brick layout or as the outer layer in a dual-layer layout. The opposite
could give complete NH3 oxidation over Fe-BEA leading to a NH3 deficit over Ag/Al2O3. Full-scale
engine testing contradicted these results and showed that Fe-BEA was preferred as the
upstream brick in a dual-brick layout. The presence of NO2 in the feed giving fast-SCR over Fe-
BEA and no unselective NH3 oxidation in the engine tests are believed to explain the observed
difference between the two tests. The activity of the combined catalyst layouts were higher than
the activity for individual catalysts when less or no H2 was co-fed showing that there were
synergistic effects by combining them. The dual-layer layout showed the best performance
which is believed to be attributed the short diffusion distance between the layers allowing
dispersion of reaction intermediates between them.
Transient engine bench testing showed that Ag/Al2O3 and a combined Ag/Al2O3 – Fe-BEA system
was active during the NEDC. The NOx conversion was not very high which is related to both the
very low temperature of the NEDC and the low activity of the Ag/Al2O3 catalyst seen from
stationary testing. The most interesting result was that the catalyst systems showed NOx
conversion already from the start of the cycle before any NH3 or H2 was dosed. NOx storage over
the Ag/Al2O3 was believed to be the most likely explanation for this. The NOx conversion could
be enhanced by dosing of NH3 and H2 at temperatures lower than 150°C that was used as the
standard dosing temperature. Dosing at too low temperature, however, inhibited the NOx
conversion.
5.2 Future
The mechanism behind the synergistic effects of combining Ag/Al2O3 and Fe-BEA is not fully
investigated. Especially the effect of the dual-layer layout is not completely understood and
further studies are needed. The de-greening seen for the high Ag loading and high SBET catalysts
2013-05-14
41
was first attributed to the effect of sulphur poisoning. A similar effect was seen for the later tests
when no SO2 was present and the possible mechanism should be further investigated. The
sulphur tolerance was only tested for powder catalyst and the possible impact of sulphur on
monolithic catalysts needs to be evaluated. It would also be interesting to further investigate
which state of Ag and which Ag dispersion that is the most optimal over Ag/Al2O3 and if it is
affected by sulphur.
The preliminary engine tests showed NH3 formation over the Ag/Al2O3. This could potentially
enhance the low-temperature activity for combined catalyst system with a downstream catalyst
that can store the formed NH3. The main explanation for the NOx conversion seen at the start of
the NEDC (before any NH3 or H2 was dosed) was believed to be NOx storage over Ag/Al2O3. NO-
TPD during dry conditions also showed a substantially storage capacity. More NOx
storage/adsorption tests with H2O present are needed to fully evaluate the potential of Ag/Al2O3
for NOx storage. It was believed that the Ag/Al2O3 catalyst was poisoned by soot during the
engine testing. Future test should, therefore include DPF prior to the SCR catalysts. More
catalyst, either by increasing the catalyst loading or adding more/larger bricks, is also needed to
reduce the GHSV. It is also believed that the results can be improved by tailor-made dosing
algorithms that take the possible NOx storage and other mechanism into consideration.
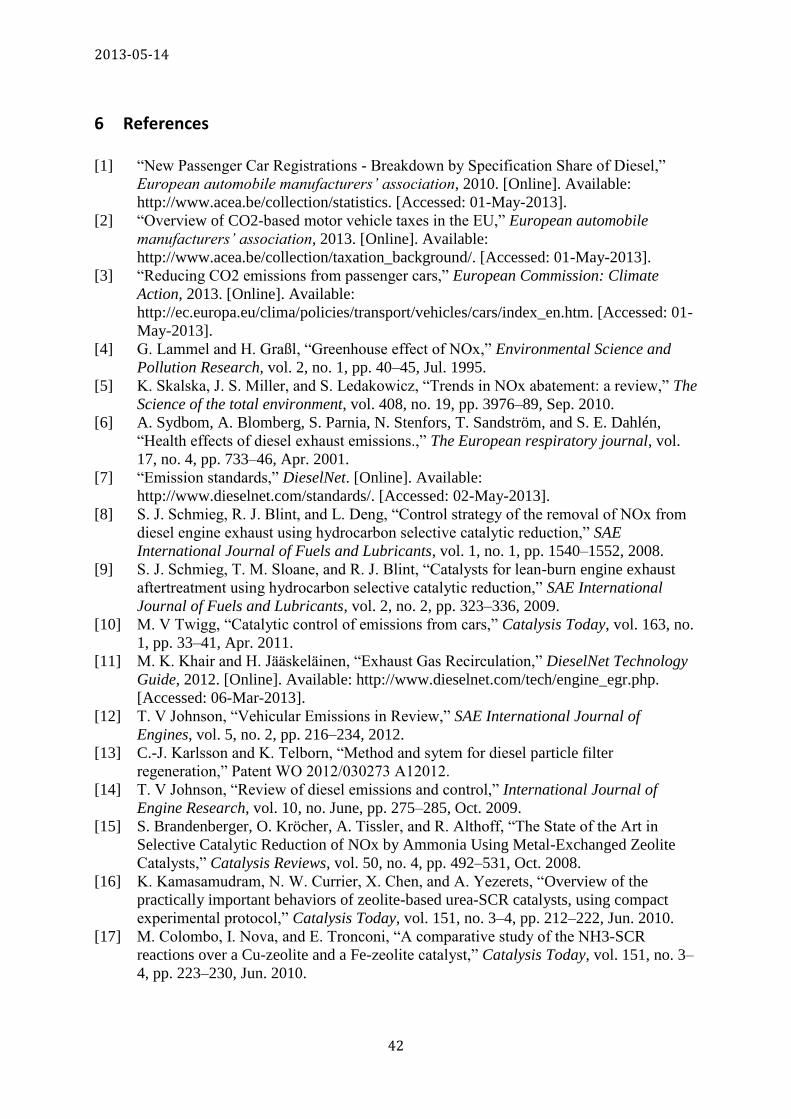
2013-05-14
42
6 References
[1] “New Passenger Car Registrations - Breakdown by Specification Share of Diesel,”
European automobile manufacturers’ association, 2010. [Online]. Available:
http://www.acea.be/collection/statistics. [Accessed: 01-May-2013].
[2] “Overview of CO2-based motor vehicle taxes in the EU,” European automobile
manufacturers’ association, 2013. [Online]. Available:
http://www.acea.be/collection/taxation_background/. [Accessed: 01-May-2013].
[3] “Reducing CO2 emissions from passenger cars,” European Commission: Climate
Action, 2013. [Online]. Available:
http://ec.europa.eu/clima/policies/transport/vehicles/cars/index_en.htm. [Accessed: 01-
May-2013].
[4] G. Lammel and H. Graßl, “Greenhouse effect of NOx,” Environmental Science and
Pollution Research, vol. 2, no. 1, pp. 40–45, Jul. 1995.
[5] K. Skalska, J. S. Miller, and S. Ledakowicz, “Trends in NOx abatement: a review,” The
Science of the total environment, vol. 408, no. 19, pp. 3976–89, Sep. 2010.
[6] A. Sydbom, A. Blomberg, S. Parnia, N. Stenfors, T. Sandström, and S. E. Dahlén,
“Health effects of diesel exhaust emissions.,” The European respiratory journal, vol.
17, no. 4, pp. 733–46, Apr. 2001.
[7] “Emission standards,” DieselNet. [Online]. Available:
http://www.dieselnet.com/standards/. [Accessed: 02-May-2013].
[8] S. J. Schmieg, R. J. Blint, and L. Deng, “Control strategy of the removal of NOx from
diesel engine exhaust using hydrocarbon selective catalytic reduction,” SAE
International Journal of Fuels and Lubricants, vol. 1, no. 1, pp. 1540–1552, 2008.
[9] S. J. Schmieg, T. M. Sloane, and R. J. Blint, “Catalysts for lean-burn engine exhaust
aftertreatment using hydrocarbon selective catalytic reduction,” SAE International
Journal of Fuels and Lubricants, vol. 2, no. 2, pp. 323–336, 2009.
[10] M. V Twigg, “Catalytic control of emissions from cars,” Catalysis Today, vol. 163, no.
1, pp. 33–41, Apr. 2011.
[11] M. K. Khair and H. Jääskeläinen, “Exhaust Gas Recirculation,” DieselNet Technology
Guide, 2012. [Online]. Available: http://www.dieselnet.com/tech/engine_egr.php.
[Accessed: 06-Mar-2013].
[12] T. V Johnson, “Vehicular Emissions in Review,” SAE International Journal of
Engines, vol. 5, no. 2, pp. 216–234, 2012.
[13] C.-J. Karlsson and K. Telborn, “Method and sytem for diesel particle filter
regeneration,” Patent WO 2012/030273 A12012.
[14] T. V Johnson, “Review of diesel emissions and control,” International Journal of
Engine Research, vol. 10, no. June, pp. 275–285, Oct. 2009.
[15] S. Brandenberger, O. Kröcher, A. Tissler, and R. Althoff, “The State of the Art in
Selective Catalytic Reduction of NOx by Ammonia Using Metal-Exchanged Zeolite
Catalysts,” Catalysis Reviews, vol. 50, no. 4, pp. 492–531, Oct. 2008.
[16] K. Kamasamudram, N. W. Currier, X. Chen, and A. Yezerets, “Overview of the
practically important behaviors of zeolite-based urea-SCR catalysts, using compact
experimental protocol,” Catalysis Today, vol. 151, no. 3–4, pp. 212–222, Jun. 2010.
[17] M. Colombo, I. Nova, and E. Tronconi, “A comparative study of the NH3-SCR
reactions over a Cu-zeolite and a Fe-zeolite catalyst,” Catalysis Today, vol. 151, no. 3–
4, pp. 223–230, Jun. 2010.
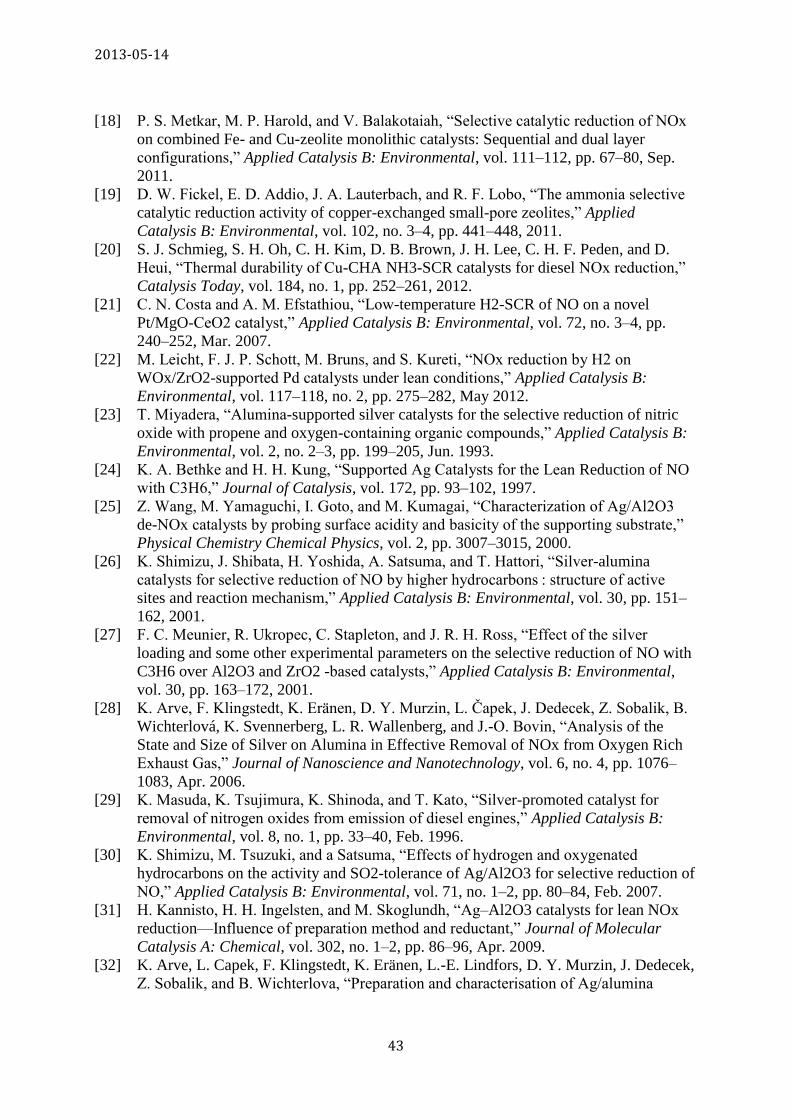
2013-05-14
43
[18] P. S. Metkar, M. P. Harold, and V. Balakotaiah, “Selective catalytic reduction of NOx
on combined Fe- and Cu-zeolite monolithic catalysts: Sequential and dual layer
configurations,” Applied Catalysis B: Environmental, vol. 111–112, pp. 67–80, Sep.
2011.
[19] D. W. Fickel, E. D. Addio, J. A. Lauterbach, and R. F. Lobo, “The ammonia selective
catalytic reduction activity of copper-exchanged small-pore zeolites,” Applied
Catalysis B: Environmental, vol. 102, no. 3–4, pp. 441–448, 2011.
[20] S. J. Schmieg, S. H. Oh, C. H. Kim, D. B. Brown, J. H. Lee, C. H. F. Peden, and D.
Heui, “Thermal durability of Cu-CHA NH3-SCR catalysts for diesel NOx reduction,”
Catalysis Today, vol. 184, no. 1, pp. 252–261, 2012.
[21] C. N. Costa and A. M. Efstathiou, “Low-temperature H2-SCR of NO on a novel
Pt/MgO-CeO2 catalyst,” Applied Catalysis B: Environmental, vol. 72, no. 3–4, pp.
240–252, Mar. 2007.
[22] M. Leicht, F. J. P. Schott, M. Bruns, and S. Kureti, “NOx reduction by H2 on
WOx/ZrO2-supported Pd catalysts under lean conditions,” Applied Catalysis B:
Environmental, vol. 117–118, no. 2, pp. 275–282, May 2012.
[23] T. Miyadera, “Alumina-supported silver catalysts for the selective reduction of nitric
oxide with propene and oxygen-containing organic compounds,” Applied Catalysis B:
Environmental, vol. 2, no. 2–3, pp. 199–205, Jun. 1993.
[24] K. A. Bethke and H. H. Kung, “Supported Ag Catalysts for the Lean Reduction of NO
with C3H6,” Journal of Catalysis, vol. 172, pp. 93–102, 1997.
[25] Z. Wang, M. Yamaguchi, I. Goto, and M. Kumagai, “Characterization of Ag/Al2O3
de-NOx catalysts by probing surface acidity and basicity of the supporting substrate,”
Physical Chemistry Chemical Physics, vol. 2, pp. 3007–3015, 2000.
[26] K. Shimizu, J. Shibata, H. Yoshida, A. Satsuma, and T. Hattori, “Silver-alumina
catalysts for selective reduction of NO by higher hydrocarbons : structure of active
sites and reaction mechanism,” Applied Catalysis B: Environmental, vol. 30, pp. 151–
162, 2001.
[27] F. C. Meunier, R. Ukropec, C. Stapleton, and J. R. H. Ross, “Effect of the silver
loading and some other experimental parameters on the selective reduction of NO with
C3H6 over Al2O3 and ZrO2 -based catalysts,” Applied Catalysis B: Environmental,
vol. 30, pp. 163–172, 2001.
[28] K. Arve, F. Klingstedt, K. Eränen, D. Y. Murzin, L. Čapek, J. Dedecek, Z. Sobalik, B.
Wichterlová, K. Svennerberg, L. R. Wallenberg, and J.-O. Bovin, “Analysis of the
State and Size of Silver on Alumina in Effective Removal of NOx from Oxygen Rich
Exhaust Gas,” Journal of Nanoscience and Nanotechnology, vol. 6, no. 4, pp. 1076–
1083, Apr. 2006.
[29] K. Masuda, K. Tsujimura, K. Shinoda, and T. Kato, “Silver-promoted catalyst for
removal of nitrogen oxides from emission of diesel engines,” Applied Catalysis B:
Environmental, vol. 8, no. 1, pp. 33–40, Feb. 1996.
[30] K. Shimizu, M. Tsuzuki, and a Satsuma, “Effects of hydrogen and oxygenated
hydrocarbons on the activity and SO2-tolerance of Ag/Al2O3 for selective reduction of
NO,” Applied Catalysis B: Environmental, vol. 71, no. 1–2, pp. 80–84, Feb. 2007.
[31] H. Kannisto, H. H. Ingelsten, and M. Skoglundh, “Ag–Al2O3 catalysts for lean NOx
reduction—Influence of preparation method and reductant,” Journal of Molecular
Catalysis A: Chemical, vol. 302, no. 1–2, pp. 86–96, Apr. 2009.
[32] K. Arve, L. Capek, F. Klingstedt, K. Eränen, L.-E. Lindfors, D. Y. Murzin, J. Dedecek,
Z. Sobalik, and B. Wichterlova, “Preparation and characterisation of Ag/alumina
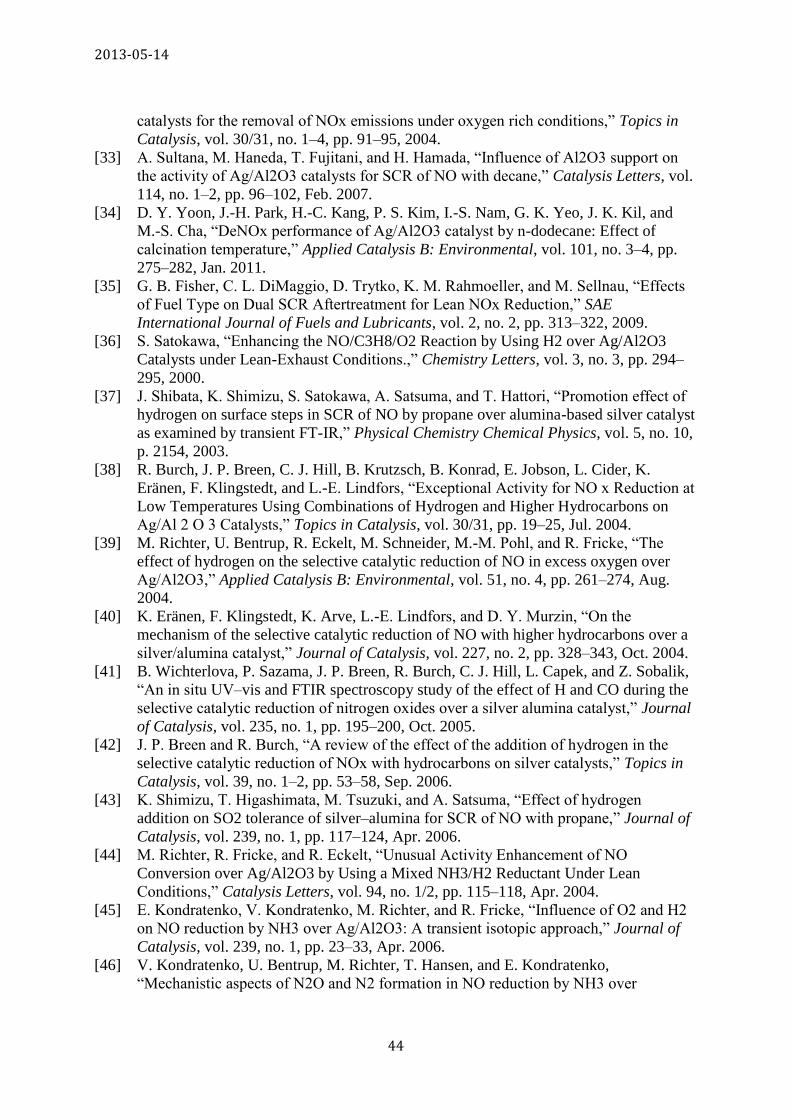
2013-05-14
44
catalysts for the removal of NOx emissions under oxygen rich conditions,” Topics in
Catalysis, vol. 30/31, no. 1–4, pp. 91–95, 2004.
[33] A. Sultana, M. Haneda, T. Fujitani, and H. Hamada, “Influence of Al2O3 support on
the activity of Ag/Al2O3 catalysts for SCR of NO with decane,” Catalysis Letters, vol.
114, no. 1–2, pp. 96–102, Feb. 2007.
[34] D. Y. Yoon, J.-H. Park, H.-C. Kang, P. S. Kim, I.-S. Nam, G. K. Yeo, J. K. Kil, and
M.-S. Cha, “DeNOx performance of Ag/Al2O3 catalyst by n-dodecane: Effect of
calcination temperature,” Applied Catalysis B: Environmental, vol. 101, no. 3–4, pp.
275–282, Jan. 2011.
[35] G. B. Fisher, C. L. DiMaggio, D. Trytko, K. M. Rahmoeller, and M. Sellnau, “Effects
of Fuel Type on Dual SCR Aftertreatment for Lean NOx Reduction,” SAE
International Journal of Fuels and Lubricants, vol. 2, no. 2, pp. 313–322, 2009.
[36] S. Satokawa, “Enhancing the NO/C3H8/O2 Reaction by Using H2 over Ag/Al2O3
Catalysts under Lean-Exhaust Conditions.,” Chemistry Letters, vol. 3, no. 3, pp. 294–
295, 2000.
[37] J. Shibata, K. Shimizu, S. Satokawa, A. Satsuma, and T. Hattori, “Promotion effect of
hydrogen on surface steps in SCR of NO by propane over alumina-based silver catalyst
as examined by transient FT-IR,” Physical Chemistry Chemical Physics, vol. 5, no. 10,
p. 2154, 2003.
[38] R. Burch, J. P. Breen, C. J. Hill, B. Krutzsch, B. Konrad, E. Jobson, L. Cider, K.
Eränen, F. Klingstedt, and L.-E. Lindfors, “Exceptional Activity for NO x Reduction at
Low Temperatures Using Combinations of Hydrogen and Higher Hydrocarbons on
Ag/Al 2 O 3 Catalysts,” Topics in Catalysis, vol. 30/31, pp. 19–25, Jul. 2004.
[39] M. Richter, U. Bentrup, R. Eckelt, M. Schneider, M.-M. Pohl, and R. Fricke, “The
effect of hydrogen on the selective catalytic reduction of NO in excess oxygen over
Ag/Al2O3,” Applied Catalysis B: Environmental, vol. 51, no. 4, pp. 261–274, Aug.
2004.
[40] K. Eränen, F. Klingstedt, K. Arve, L.-E. Lindfors, and D. Y. Murzin, “On the
mechanism of the selective catalytic reduction of NO with higher hydrocarbons over a
silver/alumina catalyst,” Journal of Catalysis, vol. 227, no. 2, pp. 328–343, Oct. 2004.
[41] B. Wichterlova, P. Sazama, J. P. Breen, R. Burch, C. J. Hill, L. Capek, and Z. Sobalik,
“An in situ UV–vis and FTIR spectroscopy study of the effect of H and CO during the
selective catalytic reduction of nitrogen oxides over a silver alumina catalyst,” Journal
of Catalysis, vol. 235, no. 1, pp. 195–200, Oct. 2005.
[42] J. P. Breen and R. Burch, “A review of the effect of the addition of hydrogen in the
selective catalytic reduction of NOx with hydrocarbons on silver catalysts,” Topics in
Catalysis, vol. 39, no. 1–2, pp. 53–58, Sep. 2006.
[43] K. Shimizu, T. Higashimata, M. Tsuzuki, and A. Satsuma, “Effect of hydrogen
addition on SO2 tolerance of silver–alumina for SCR of NO with propane,” Journal of
Catalysis, vol. 239, no. 1, pp. 117–124, Apr. 2006.
[44] M. Richter, R. Fricke, and R. Eckelt, “Unusual Activity Enhancement of NO
Conversion over Ag/Al2O3 by Using a Mixed NH3/H2 Reductant Under Lean
Conditions,” Catalysis Letters, vol. 94, no. 1/2, pp. 115–118, Apr. 2004.
[45] E. Kondratenko, V. Kondratenko, M. Richter, and R. Fricke, “Influence of O2 and H2
on NO reduction by NH3 over Ag/Al2O3: A transient isotopic approach,” Journal of
Catalysis, vol. 239, no. 1, pp. 23–33, Apr. 2006.
[46] V. Kondratenko, U. Bentrup, M. Richter, T. Hansen, and E. Kondratenko,
“Mechanistic aspects of N2O and N2 formation in NO reduction by NH3 over
2013-05-14
45
Ag/Al2O3: The effect of O2 and H2,” Applied Catalysis B: Environmental, vol. 84, no.
3–4, pp. 497–504, Dec. 2008.
[47] K. Shimizu and A. Satsuma, “Reaction Mechanism of H 2 -Promoted Selective
Catalytic Reduction of NO with NH 3 over Ag/Al2O3,” Journal of Physical Chemistry
C, vol. 111, pp. 2259–2264, 2007.
[48] K. Shimizu and A. Satsuma, “Hydrogen assisted urea-SCR and NH3-SCR with silver–
alumina as highly active and SO2-tolerant de-NOx catalysis,” Applied Catalysis B:
Environmental, vol. 77, no. 1–2, pp. 202–205, Nov. 2007.
[49] S. Chansai, R. Burch, and C. Hardacre, “The use of Short Time on Stream (STOS)
transient kinetics to investigate the role of hydrogen in enhancing NOx reduction over
silver catalysts,” Journal of Catalysis, vol. 295, pp. 223–231, Nov. 2012.
[50] P. Sazama, L. Capek, H. Drobna, Z. Sobalik, J. Dedecek, K. Arve, and B. Wichterlova,
“Enhancement of decane-SCR-NO over Ag/alumina by hydrogen. Reaction kinetics
and in situ FTIR and UV–vis study,” Journal of Catalysis, vol. 232, no. 2, pp. 302–
317, Jun. 2005.
[51] J. P. Breen, R. Burch, C. Hardacre, and C. J. Hill, “Structural investigation of the
promotional effect of hydrogen during the selective catalytic reduction of NOx with
hydrocarbons over Ag/Al2O3 catalysts.,” The journal of physical chemistry. B, vol.
109, no. 11, pp. 4805–7, Mar. 2005.
[52] K. Eränen, L.-E. Lindfors, F. Klingstedt, and D. Y. Murzin, “Continuous reduction of
NO with octane over a silver/alumina catalyst in oxygen-rich exhaust gases: combined
heterogeneous and surface-mediated homogeneous reactions,” Journal of Catalysis,
vol. 219, no. 1, pp. 25–40, Oct. 2003.
[53] K. Arve, E. Popov, M. Rönnholm, F. Klingstedt, J. Eloranta, K. Eränen, and D.
Murzin, “From a fixed bed Ag-alumina catalyst to a modified reactor design: how to
enhance the crucial heterogeneous-homogeneous reactions in HC-SCR,” Chemical
Engineering Science, vol. 59, no. 22–23, pp. 5277–5282, Dec. 2004.
[54] L.-E. Lindfors, K. Eränen, F. Klingstedt, and D. Y. Murzin, “Silver/alumina catalyst
for selective catalytic reduction of NOx to N2 by hydrocarbons in diesel powered
vehicles,” Topics in Catalysis, vol. 28, no. 1–4, pp. 185–189, 2004.
[55] F. Klingstedt, K. Eränen, L.-E. Lindfors, S. Andersson, L. Cider, C. Landberg, E.
Jobson, L. Eriksson, T. Ilkenhans, and D. Webster, “A Highly Active Ag/Alumina
Catalytic Converter for Continuous HC-SCR During Lean-Burn Conditions: From
Laboratory to Full-Scale Vehicle Tests,” Topics in Catalysis, vol. 30/31, no. 1–4, pp.
27–30, Jul. 2004.
[56] S. Satokawa, J. Shibata, K. Shimizu, A. Satsuma, and T. Hattori, “Promotion effect of
H2 on the low temperature activity of the selective reduction of NO by light
hydrocarbons over Ag/Al2O3,” Applied Catalysis B: Environmental, vol. 42, no. 2, pp.
179–186, May 2003.
[57] R. Brosius, K. Arve, M. Groothaert, and J. Martens, “Adsorption chemistry of NOx on
Ag/Al2O3 catalyst for selective catalytic reduction of NOx using hydrocarbons,”
Journal of Catalysis, vol. 231, no. 2, pp. 344–353, Apr. 2005.
[58] K. Shimizu, J. Shibata, and A. Satsuma, “Kinetic and in situ infrared studies on SCR of
NO with propane by silver–alumina catalyst: Role of H2 on O2 activation and
retardation of nitrate poisoning,” Journal of Catalysis, vol. 239, no. 2, pp. 402–409,
Apr. 2006.
2013-05-14
46
[59] F. C. Meunier and J. R. H. Ross, “Effect of ex situ treatments with SO2 on the activity
of a low loading silver–alumina catalyst for the selective reduction of NO and NO2 by
propene,” Applied Catalysis B: Environmental, vol. 24, no. 1, pp. 23–32, Jan. 2000.
[60] J. P. Breen, R. Burch, C. Hardacre, C. J. Hill, B. Krutzsch, B. Bandl-Konrad, E.
Jobson, L. Cider, P. G. Blakeman, L. J. Peace, M. V Twigg, M. Preis, and M.
Gottschling, “An investigation of the thermal stability and sulphur tolerance of Ag/γ-
Al2O3 catalysts for the SCR of NOx with hydrocarbons and hydrogen,” Applied
Catalysis B: Environmental, vol. 70, no. 1–4, pp. 36–44, Jan. 2007.
[61] A. Abe, N. Aoyama, S. Sumiya, N. Kakuta, and K. Yoshida, “Effect of SO2 on NOx
reduction by ethanol over Ag/Al2O3 catalyst,” Catalysis Letters, vol. 51, pp. 5–9,
1998.
[62] Q. Wu, Q. Feng, and H. He, “Disparate effects of SO2 on the selective catalytic
reduction of NO by C2H5OH and IPA over Ag/Al2O3,” Catalysis Communications,
vol. 7, no. 9, pp. 657–661, Sep. 2006.
[63] P. W. Park and C. L. Boyer, “Effect of SO 2 on the activity of Ag / g-Al 2 O 3 catalysts
for NO x reduction in lean conditions,” Applied Catalysis B: Environmental, vol. 59,
pp. 27–34, 2005.
[64] T. N. Angelidis, S. Christoforou, A. Bongiovanni, and N. Kruse, “On the promotion by
SO2 of the SCR process over Ag/Al2O3 : influence of SO2 concentration with C3H6
versus C3H8 as reductant,” Applied Catalysis B: Environmental, vol. 39, pp. 197–204,
2002.
[65] N. Jagtap, S. B. Umbarkar, P. Miquel, P. Granger, and M. K. Dongare, “Support
modification to improve the sulphur tolerance of Ag/Al2O3 for SCR of NOx with
propene under lean-burn conditions,” Applied Catalysis B: Environmental, vol. 90, no.
3–4, pp. 416–425, Aug. 2009.
[66] J. Li, Y. Zhu, R. Ke, and J. Hao, “Improvement of catalytic activity and sulfur-
resistance of Ag/TiO2–Al2O3 for NO reduction with propene under lean burn
conditions,” Applied Catalysis B: Environmental, vol. 80, pp. 202–213, 2008.
[67] S. Sitshebo, A. Tsolakis, and K. Theinnoi, “Promoting hydrocarbon-SCR of NOx in
diesel engine exhaust by hydrogen and fuel reforming,” International Journal of
Hydrogen Energy, vol. 34, no. 18, pp. 7842–7850, Sep. 2009.
[68] K. Kim, K. M. Chun, S. Song, H. S. Han, and H. Gu, “Hydrogen Effect on the DeNOx
Efficiency Enhancement of Fresh and Aged Ag/Al2O3 HC-SCR in a Diesel Engine
Exhaust,” SAE International, no. 2011–01–1278, 2011.
[69] M. B. Viola, “HC-SCR Catalyst Performance in Reducing NOx Emissions from a
Diesel Engine Running Transient Test Cycles,” SAE Technical paper series, no. 2008–
01–2487, 2008.
[70] A. Stakhev, S. Dahl, I. Gekas, and P. L. T. Gabrielsson, “Process and catalyst system
for SCR of NOx,” Patent EP 2 301 650 A12011.
[71] R. Zhang and S. Kaliaguine, “Lean reduction of NO by C3H6 over Ag/alumina derived
from Al2O3, AlOOH and Al(OH)3,” Applied Catalysis B: Environmental, vol. 78, no.
3–4, pp. 275–287, Feb. 2008.
[72] X. She and M. Flytzani-Stephanopoulos, “The role of AgOAl species in silver–alumina
catalysts for the selective catalytic reduction of NOx with methane,” Journal of
Catalysis, vol. 237, no. 1, pp. 79–93, Jan. 2006.
[73] A. Satsuma, J. Shibata, A. Wada, Y. Shinozaki, and T. Hattori, “In-situ UV-Visible
Spectroscopic Study for Dynamic Analysis of Silver Catalyst,” Science And
Technology in Catalysis, vol. 145, pp. 235–238, 2003.
2013-05-14
47
[74] S. T. Korhonen, A. M. Beale, M. A. Newton, and B. M. Weckhuysen, “New Insights
into the Active Surface Species of Silver Alumina Catalysts in the Selective Catalytic
Reduction of NO,” Journal of Physical Chemistry C, vol. 115, pp. 885–896, 2011.
[75] V. Demidyuk, C. Hardacre, R. Burch, A. Mhadeshwar, D. Norton, and D. Hancu,
“Aromatic hydrocarbons and sulfur based catalyst deactivation for selective catalytic
reduction of NOx,” Catalysis Today, vol. 164, no. 1, pp. 515–519, Apr. 2011.
[76] L. Zhang, C. Zhang, and H. He, “The role of silver species on Ag / Al 2 O 3 catalysts
for the selective catalytic oxidation of ammonia to nitrogen,” Journal of Catalysis, vol.
261, no. 1, pp. 101–109, 2009.
[77] Q. Wu, H. Gao, and H. He, “Conformational Analysis of Sulfate Species on Ag/Al2O3
by Means of Theoretical and Experimental Vibration Spectra,” Journal of Physical
Chemistry B, vol. 110, pp. 8320–8324, 2006.
[78] T. Nijhuis, A. Beers, T. Vergunst, I. Hoek, F. Kapteijn, and J. Moulijn, “Preparation of
monolithic catalysts,” Catalysis Reviews, vol. 43, no. 4, pp. 345–380, Mar. 2001.
[79] W. B. Kolb, A. A. Papadimitriou, R. L. Cerro, D. D. Leavitt, and J. C. Summers, “The
ins and outs of coating monolithic structures,” Chemical engineering progress, vol. 89,
no. 2, pp. 61–67, 1993.
[80] W. P. Addiego, I. M. Lachman, J. L. Williams, M. R. Williams, and K. E. Zaun, “High
surface area washcoated substrate and method for producig same,” Patent
US005212130A1993.
[81] C. Agrafiotis and A. Tsetsekou, “The effect of processing parameters on the properties
of γ-alumina washcoats deposited on ceramic honeycombs,” Journal of Materials
Science, vol. 35, pp. 951 – 960, 2000.
[82] R. J. Pugh and L. Bergström, Eds., Surface and colloid chemistry in advanced ceramics
processing. New York: Marcel Dekker Inc, 1994.
[83] A. K. Mogalicherla and D. Kunzru, “Effect of method of preparation on activity of
Pd/Al2O3 monolith catalysts,” The Canadian Journal of Chemical Engineering, vol.
9999, pp. 367–375, 2010.
[84] C. Agrafiotis and A. Tsetsekou, “The effect of powder characteristics on washcoat
quality . Part I : Alumina washcoats,” Journal of the European Ceramic Society, vol.
20, no. 7, pp. 815–824, Jun. 2000.
[85] L. Villegas, F. Masset, and N. Guilhaume, “Wet impregnation of alumina-washcoated
monoliths: Effect of the drying procedure on Ni distribution and on autothermal
reforming activity,” Applied Catalysis A: General, vol. 320, pp. 43–55, Mar. 2007.
[86] D. E. Doronkin, S. Fogel, P. Gabrielsson, and S. Dahl, “Ti and Si doping as a way to
increase low temperature activity of sulfated Ag/Al2O3 in H2 -assisted NOx SCR by
NH3,” In manuscript, 2013.
[87] P. Balle, B. Geiger, D. Klukowski, M. Pignatelli, S. Wohnrau, M. Menzel, I. Zirkwa,
G. Brunklaus, and S. Kureti, “Study of the selective catalytic reduction of NOx on an
efficient Fe/HBEA zeolite catalyst for heavy duty diesel engines,” Applied Catalysis B:
Environmental, vol. 91, no. 3–4, pp. 587–595, Sep. 2009.
[88] P. Balle, B. Geiger, and S. Kureti, “Selective catalytic reduction of NOx by NH3 on
Fe/HBEA zeolite catalysts in oxygen-rich exhaust,” Applied Catalysis B:
Environmental, vol. 85, no. 3–4, pp. 109–119, Jan. 2009.
[89] C. He, Y. Wang, Y. Cheng, C. K. Lambert, and R. T. Yang, “Activity, stability and
hydrocarbon deactivation of Fe/Beta catalyst for SCR of NO with ammonia,” Applied
Catalysis A: General, vol. 368, no. 1–2, pp. 121–126, Oct. 2009.
2013-05-14
48
[90] R. G. Silver, M. O. Stefanick, and B. I. Todd, “A study of chemical aging effects on
HDD Fe–zeolite SCR catalyst,” Catalysis Today, vol. 136, no. 1–2, pp. 28–33, Jul.
2008.
[91] A. Grossale, I. Nova, and E. Tronconi, “Study of a Fe–zeolite-based system as NH3-
SCR catalyst for diesel exhaust aftertreatment,” Catalysis Today, vol. 136, no. 1–2, pp.
18–27, Jul. 2008.
[92] M. J. Pipho, D. B. Kittelson, and D. D. Zarling, “NO2 Formation in a Diesel Engine,”
SAE Technical paper series, no. 910231, 1991.
[93] H. Yamada, K. Misawa, D. Suzuki, K. Tanaka, J. Matsumoto, M. Fujii, and K. Tanaka,
“Detailed analysis of diesel vehicle exhaust emissions: Nitrogen oxides, hydrocarbons
and particulate size distributions,” Proceedings of the Combustion Institute, vol. 33, no.
2, pp. 2895–2902, Jan. 2011.
[94] J. J. Chong, A. Tsolakis, S. S. Gill, K. Theinnoi, and S. E. Golunski, “Enhancing the
NO2/NOx ratio in compression ignition engines by hydrogen and reformate
combustion, for improved aftertreatment performance,” International Journal of
Hydrogen Energy, vol. 35, no. 16, pp. 8723–8732, Aug. 2010.
[95] T. Johannessen, H. Schmidt, A. M. Frey, and C. H. Christensen, “Improved
Automotive NOx Aftertreatment System: Metal Ammine Complexes as NH3 Source
for SCR Using Fe-Containing Zeolite Catalysts,” Catalysis Letters, vol. 128, no. 1–2,
pp. 94–100, Jan. 2009.
[96] J. P. Breen, R. Burch, C. Hardacre, C. J. Hill, and C. Rioche, “A fast transient kinetic
study of the effect of H2 on the selective catalytic reduction of NOx with octane using
isotopically labelled 15NO,” Journal of Catalysis, vol. 246, no. 1, pp. 1–9, Feb. 2007.
[97] C. L. DiMaggio, G. B. Fisher, K. M. Rahmoeller, and M. Sellnau, “Dual SCR
Aftertreatment for Lean NOx Reduction,” SAE International Journal of Fuels and
Lubricants, vol. 2, no. 1, pp. 66–77, 2009.
[98] Y. Tsukamoto, H. Nishioka, D. Imai, Y. Sobue, N. Takagi, T. Tanaka, and T.
Hamaguchi, “Development of New Concept Catalyst for Low CO 2 Emission Diesel
Engine Using NOx Adsorption at Low Temperatures,” SAE International, vol. 2012–
01–03, 2012.
[99] A. Grossale, I. Nova, and E. Tronconi, “Ammonia blocking of the ‘Fast SCR’
reactivity over a commercial Fe-zeolite catalyst for Diesel exhaust aftertreatment,”
Journal of Catalysis, vol. 265, no. 2, pp. 141–147, Jul. 2009.
2013-05-14
a
Appendix
A. List of abbreviations
γ Shear rate
μ Viscosity
σ0 Yield stress
σ Shear stress
ad-NOx Adsorbed Nox species
ASC Ammonia slip catalyst
d Diameter
DM Dry matter - solid content
DOC Diesel oxidation catalyst
DPF Diesel particulate filter
dx Particle size distribution, x denotes the percentage of particles that is of a size less than the
stated value
FTIR Fourier transform infrared spectroscopy
GHSV Gas hourly space velocity
HC Hydrocarbons
NSR Nox storage and reduction
PM Particulate matter
Re Reynolds number
SBET Surface area calculated using the Brunauer, Emmet and Teller method
SCR Selective catalytic reduction
SEM Scanning electron microscope
T50 Temperature for 50% Nox conversion
TPD Temperature programmed desorption
TWC Three way catalyst
v Velocity
XRD X-ray diffraction
Ag-only Catalyst brick with only Ag/Al2O3
Dual-brick-Ag/Fe Dual brick layout with Ag/Al2O3 upstream of Fe-BEA
Dual-brick-Fe/Ag Dual brick layout with Fe-BEA upstream of Ag/Al2O3
Dual-layer-Ag/Fe Dual layer layout with Ag/Al2O3 as the outer layer of Fe-BEA
Dual-layer-Fe/Ag Dual layer layout with Fe-BEA as the outer layer of Ag/Al2O3
Fe-only Catalyst brick with only Fe-BEA
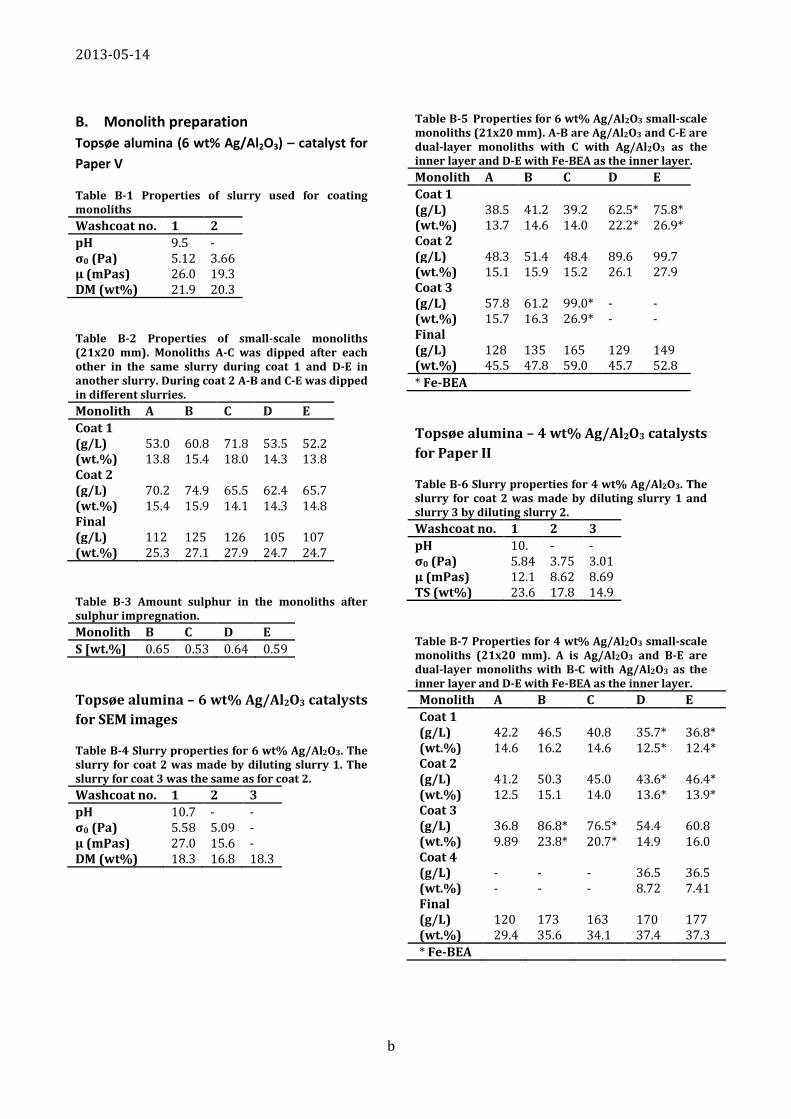
2013-05-14
b
B. Monolith preparation
Topsøe alumina (6 wt% Ag/Al2O3) – catalyst for
Paper V
Table B-1 Properties of slurry used for coating monoliths
Washcoat no. 1 2
pH 9.5 - σ0 (Pa) 5.12 3.66 µ (mPas) 26.0 19.3 DM (wt%) 21.9 20.3
Table B-2 Properties of small-scale monoliths (21x20 mm). Monoliths A-C was dipped after each other in the same slurry during coat 1 and D-E in another slurry. During coat 2 A-B and C-E was dipped in different slurries.
Monolith A B C D E
Coat 1 (g/L) 53.0 60.8 71.8 53.5 52.2 (wt.%) 13.8 15.4 18.0 14.3 13.8 Coat 2 (g/L) 70.2 74.9 65.5 62.4 65.7 (wt.%) 15.4 15.9 14.1 14.3 14.8 Final (g/L) 112 125 126 105 107 (wt.%) 25.3 27.1 27.9 24.7 24.7
Table B-3 Amount sulphur in the monoliths after sulphur impregnation.
Monolith B C D E
S [wt.%] 0.65 0.53 0.64 0.59
Topsøe alumina – 6 wt% Ag/Al2O3 catalysts
for SEM images
Table B-4 Slurry properties for 6 wt% Ag/Al2O3. The slurry for coat 2 was made by diluting slurry 1. The slurry for coat 3 was the same as for coat 2.
Washcoat no. 1 2 3
pH 10.7 - - σ0 (Pa) 5.58 5.09 - µ (mPas) 27.0 15.6 - DM (wt%) 18.3 16.8 18.3
Table B-5 Properties for 6 wt% Ag/Al2O3 small-scale monoliths (21x20 mm). A-B are Ag/Al2O3 and C-E are dual-layer monoliths with C with Ag/Al2O3 as the inner layer and D-E with Fe-BEA as the inner layer.
Monolith A B C D E
Coat 1 (g/L) 38.5 41.2 39.2 62.5* 75.8* (wt.%) 13.7 14.6 14.0 22.2* 26.9* Coat 2 (g/L) 48.3 51.4 48.4 89.6 99.7 (wt.%) 15.1 15.9 15.2 26.1 27.9 Coat 3 (g/L) 57.8 61.2 99.0* - - (wt.%) 15.7 16.3 26.9* - - Final (g/L) 128 135 165 129 149 (wt.%) 45.5 47.8 59.0 45.7 52.8
* Fe-BEA
Topsøe alumina – 4 wt% Ag/Al2O3 catalysts
for Paper II
Table B-6 Slurry properties for 4 wt% Ag/Al2O3. The slurry for coat 2 was made by diluting slurry 1 and slurry 3 by diluting slurry 2.
Washcoat no. 1 2 3
pH 10. - - σ0 (Pa) 5.84 3.75 3.01 µ (mPas) 12.1 8.62 8.69 TS (wt%) 23.6 17.8 14.9
Table B-7 Properties for 4 wt% Ag/Al2O3 small-scale monoliths (21x20 mm). A is Ag/Al2O3 and B-E are dual-layer monoliths with B-C with Ag/Al2O3 as the inner layer and D-E with Fe-BEA as the inner layer.
Monolith A B C D E
Coat 1 (g/L) 42.2 46.5 40.8 35.7* 36.8* (wt.%) 14.6 16.2 14.6 12.5* 12.4* Coat 2 (g/L) 41.2 50.3 45.0 43.6* 46.4* (wt.%) 12.5 15.1 14.0 13.6* 13.9* Coat 3 (g/L) 36.8 86.8* 76.5* 54.4 60.8 (wt.%) 9.89 23.8* 20.7* 14.9 16.0 Coat 4 (g/L) - - - 36.5 36.5 (wt.%) - - - 8.72 7.41 Final (g/L) 120 173 163 170 177 (wt.%) 29.4 35.6 34.1 37.4 37.3
* Fe-BEA
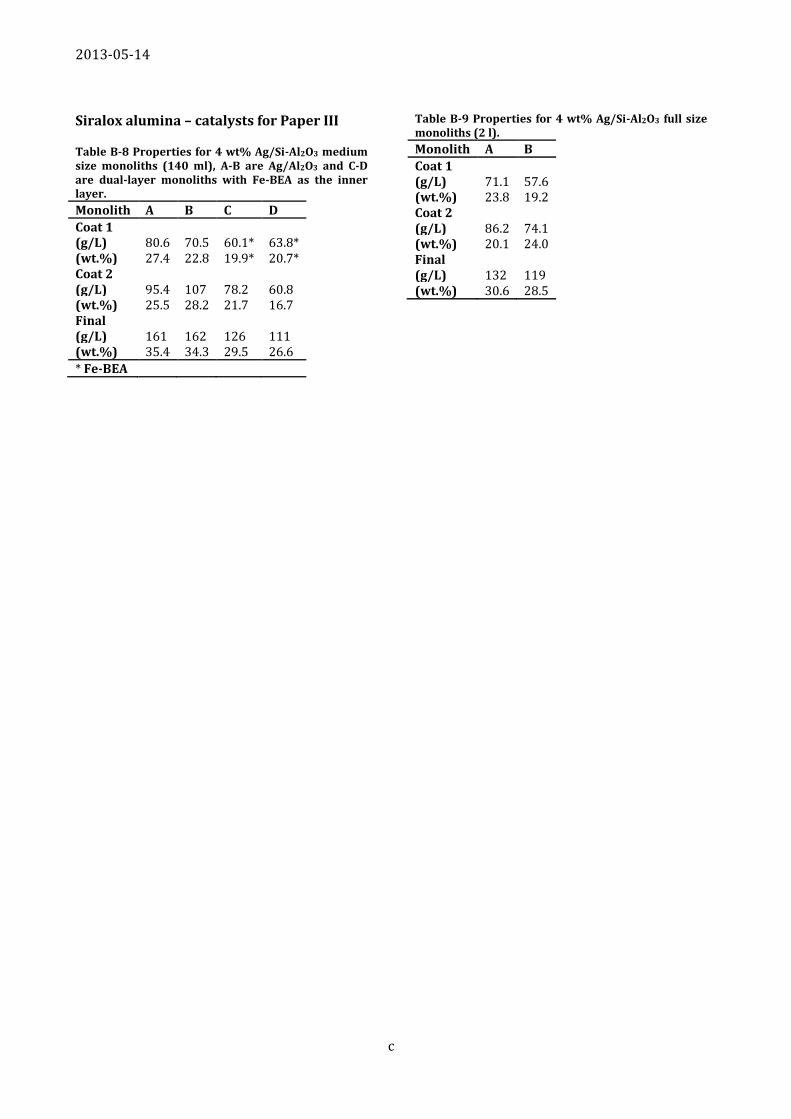
2013-05-14
c
Siralox alumina – catalysts for Paper III
Table B-8 Properties for 4 wt% Ag/Si-Al2O3 medium size monoliths (140 ml), A-B are Ag/Al2O3 and C-D are dual-layer monoliths with Fe-BEA as the inner layer.
Monolith A B C D
Coat 1 (g/L) 80.6 70.5 60.1* 63.8* (wt.%) 27.4 22.8 19.9* 20.7* Coat 2 (g/L) 95.4 107 78.2 60.8 (wt.%) 25.5 28.2 21.7 16.7 Final (g/L) 161 162 126 111 (wt.%) 35.4 34.3 29.5 26.6
* Fe-BEA
Table B-9 Properties for 4 wt% Ag/Si-Al2O3 full size monoliths (2 l).
Monolith A B
Coat 1 (g/L) 71.1 57.6 (wt.%) 23.8 19.2 Coat 2 (g/L) 86.2 74.1 (wt.%) 20.1 24.0 Final (g/L) 132 119 (wt.%) 30.6 28.5

Paper I
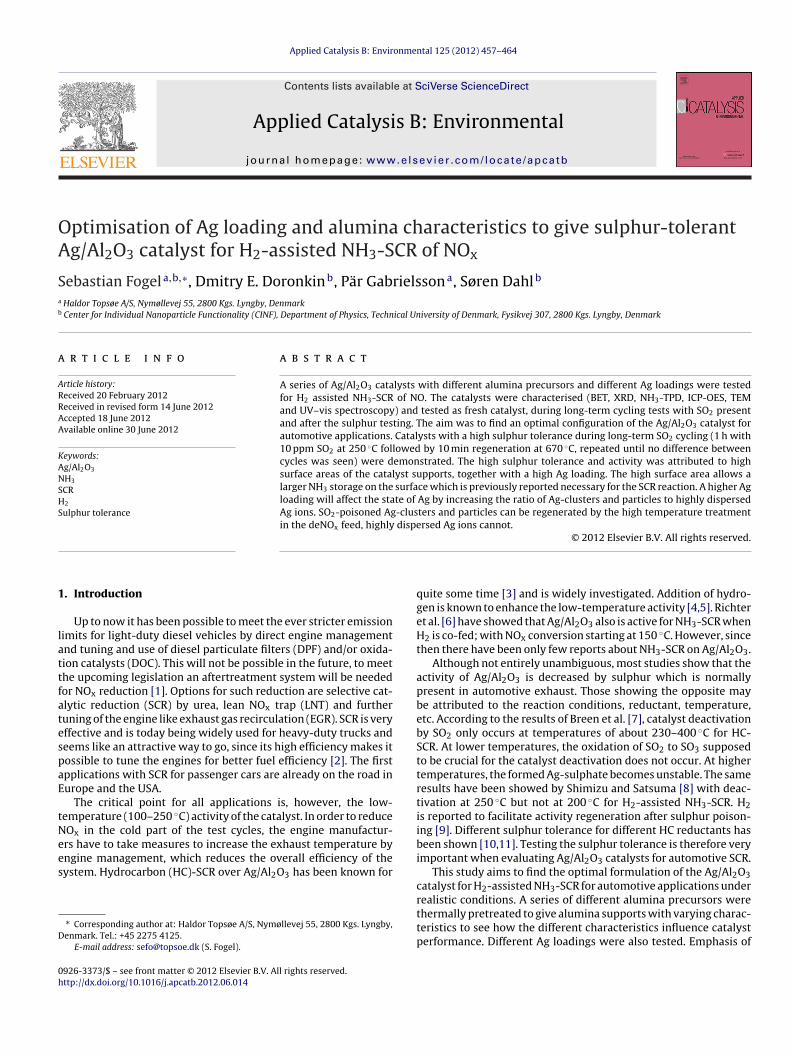
OA
Sa
b
a
ARRAA
KANSHS
1
lattfatespaE
tNees
D
0h
Applied Catalysis B: Environmental 125 (2012) 457– 464
Contents lists available at SciVerse ScienceDirect
Applied Catalysis B: Environmental
jo ur n al homepage: www.elsev ier .com/ locate /apcatb
ptimisation of Ag loading and alumina characteristics to give sulphur-tolerantg/Al2O3 catalyst for H2-assisted NH3-SCR of NOx
ebastian Fogela,b,∗, Dmitry E. Doronkinb, Pär Gabrielssona, Søren Dahlb
Haldor Topsøe A/S, Nymøllevej 55, 2800 Kgs. Lyngby, DenmarkCenter for Individual Nanoparticle Functionality (CINF), Department of Physics, Technical University of Denmark, Fysikvej 307, 2800 Kgs. Lyngby, Denmark
r t i c l e i n f o
rticle history:eceived 20 February 2012eceived in revised form 14 June 2012ccepted 18 June 2012vailable online 30 June 2012
eywords:
a b s t r a c t
A series of Ag/Al2O3 catalysts with different alumina precursors and different Ag loadings were testedfor H2 assisted NH3-SCR of NO. The catalysts were characterised (BET, XRD, NH3-TPD, ICP-OES, TEMand UV–vis spectroscopy) and tested as fresh catalyst, during long-term cycling tests with SO2 presentand after the sulphur testing. The aim was to find an optimal configuration of the Ag/Al2O3 catalyst forautomotive applications. Catalysts with a high sulphur tolerance during long-term SO2 cycling (1 h with10 ppm SO2 at 250 ◦C followed by 10 min regeneration at 670 ◦C, repeated until no difference between
g/Al2O3
H3
CR2
ulphur tolerance
cycles was seen) were demonstrated. The high sulphur tolerance and activity was attributed to highsurface areas of the catalyst supports, together with a high Ag loading. The high surface area allows alarger NH3 storage on the surface which is previously reported necessary for the SCR reaction. A higher Agloading will affect the state of Ag by increasing the ratio of Ag-clusters and particles to highly dispersedAg ions. SO2-poisoned Ag-clusters and particles can be regenerated by the high temperature treatmentin the deNOx feed, highly dispersed Ag ions cannot.
. Introduction
Up to now it has been possible to meet the ever stricter emissionimits for light-duty diesel vehicles by direct engine managementnd tuning and use of diesel particulate filters (DPF) and/or oxida-ion catalysts (DOC). This will not be possible in the future, to meethe upcoming legislation an aftertreatment system will be neededor NOx reduction [1]. Options for such reduction are selective cat-lytic reduction (SCR) by urea, lean NOx trap (LNT) and furtheruning of the engine like exhaust gas recirculation (EGR). SCR is veryffective and is today being widely used for heavy-duty trucks andeems like an attractive way to go, since its high efficiency makes itossible to tune the engines for better fuel efficiency [2]. The firstpplications with SCR for passenger cars are already on the road inurope and the USA.
The critical point for all applications is, however, the low-emperature (100–250 ◦C) activity of the catalyst. In order to reduceOx in the cold part of the test cycles, the engine manufactur-
rs have to take measures to increase the exhaust temperature byngine management, which reduces the overall efficiency of theystem. Hydrocarbon (HC)-SCR over Ag/Al2O3 has been known for∗ Corresponding author at: Haldor Topsøe A/S, Nymøllevej 55, 2800 Kgs. Lyngby,enmark. Tel.: +45 2275 4125.
E-mail address: [email protected] (S. Fogel).
926-3373/$ – see front matter © 2012 Elsevier B.V. All rights reserved.ttp://dx.doi.org/10.1016/j.apcatb.2012.06.014
© 2012 Elsevier B.V. All rights reserved.
quite some time [3] and is widely investigated. Addition of hydro-gen is known to enhance the low-temperature activity [4,5]. Richteret al. [6] have showed that Ag/Al2O3 also is active for NH3-SCR whenH2 is co-fed; with NOx conversion starting at 150 ◦C. However, sincethen there have been only few reports about NH3-SCR on Ag/Al2O3.
Although not entirely unambiguous, most studies show that theactivity of Ag/Al2O3 is decreased by sulphur which is normallypresent in automotive exhaust. Those showing the opposite maybe attributed to the reaction conditions, reductant, temperature,etc. According to the results of Breen et al. [7], catalyst deactivationby SO2 only occurs at temperatures of about 230–400 ◦C for HC-SCR. At lower temperatures, the oxidation of SO2 to SO3 supposedto be crucial for the catalyst deactivation does not occur. At highertemperatures, the formed Ag-sulphate becomes unstable. The sameresults have been showed by Shimizu and Satsuma [8] with deac-tivation at 250 ◦C but not at 200 ◦C for H2-assisted NH3-SCR. H2is reported to facilitate activity regeneration after sulphur poison-ing [9]. Different sulphur tolerance for different HC reductants hasbeen shown [10,11]. Testing the sulphur tolerance is therefore veryimportant when evaluating Ag/Al2O3 catalysts for automotive SCR.
This study aims to find the optimal formulation of the Ag/Al2O3catalyst for H2-assisted NH3-SCR for automotive applications under
realistic conditions. A series of different alumina precursors werethermally pretreated to give alumina supports with varying charac-teristics to see how the different characteristics influence catalystperformance. Different Ag loadings were also tested. Emphasis of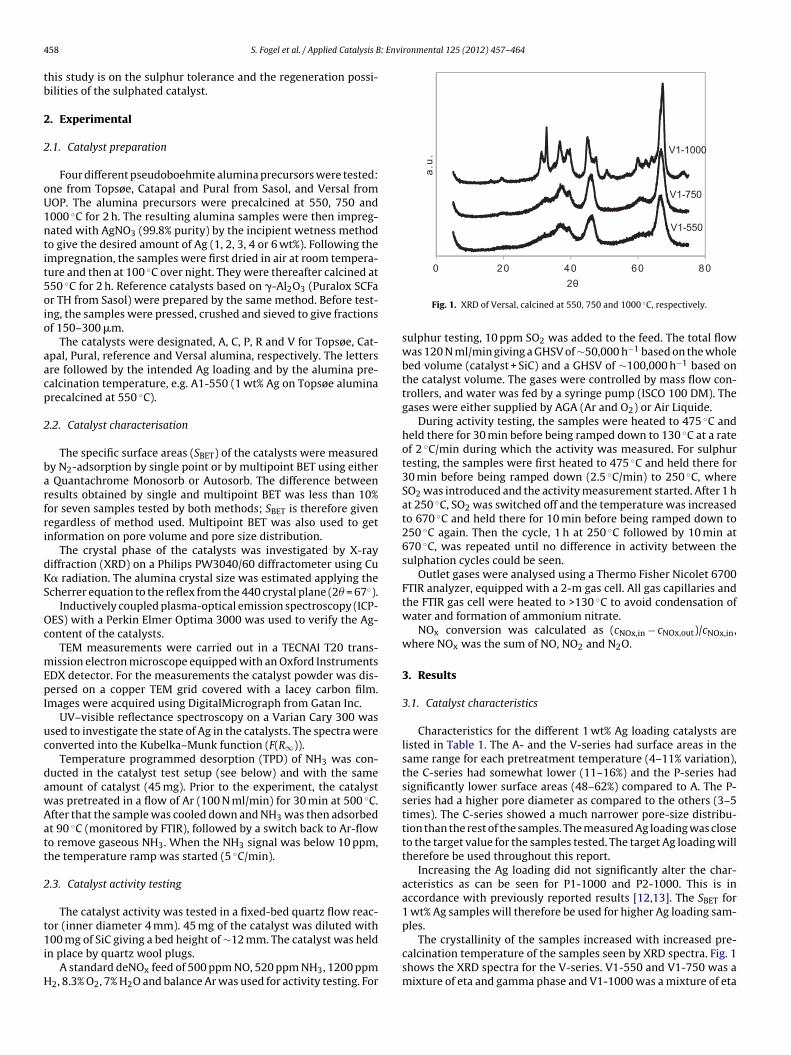
4 : Environmental 125 (2012) 457– 464
tb
2
2
oU1ntit5oio
aacp
2
barfri
dKS
Oc
mEpI
uc
dawAatt
2
t1i
H
58 S. Fogel et al. / Applied Catalysis B
his study is on the sulphur tolerance and the regeneration possi-ilities of the sulphated catalyst.
. Experimental
.1. Catalyst preparation
Four different pseudoboehmite alumina precursors were tested:ne from Topsøe, Catapal and Pural from Sasol, and Versal fromOP. The alumina precursors were precalcined at 550, 750 and000 ◦C for 2 h. The resulting alumina samples were then impreg-ated with AgNO3 (99.8% purity) by the incipient wetness methodo give the desired amount of Ag (1, 2, 3, 4 or 6 wt%). Following thempregnation, the samples were first dried in air at room tempera-ure and then at 100 ◦C over night. They were thereafter calcined at50 ◦C for 2 h. Reference catalysts based on �-Al2O3 (Puralox SCFar TH from Sasol) were prepared by the same method. Before test-ng, the samples were pressed, crushed and sieved to give fractionsf 150–300 �m.
The catalysts were designated, A, C, P, R and V for Topsøe, Cat-pal, Pural, reference and Versal alumina, respectively. The lettersre followed by the intended Ag loading and by the alumina pre-alcination temperature, e.g. A1-550 (1 wt% Ag on Topsøe aluminarecalcined at 550 ◦C).
.2. Catalyst characterisation
The specific surface areas (SBET) of the catalysts were measuredy N2-adsorption by single point or by multipoint BET using either
Quantachrome Monosorb or Autosorb. The difference betweenesults obtained by single and multipoint BET was less than 10%or seven samples tested by both methods; SBET is therefore givenegardless of method used. Multipoint BET was also used to getnformation on pore volume and pore size distribution.
The crystal phase of the catalysts was investigated by X-rayiffraction (XRD) on a Philips PW3040/60 diffractometer using Cu� radiation. The alumina crystal size was estimated applying thecherrer equation to the reflex from the 440 crystal plane (2� = 67◦).
Inductively coupled plasma-optical emission spectroscopy (ICP-ES) with a Perkin Elmer Optima 3000 was used to verify the Ag-ontent of the catalysts.
TEM measurements were carried out in a TECNAI T20 trans-ission electron microscope equipped with an Oxford Instruments
DX detector. For the measurements the catalyst powder was dis-ersed on a copper TEM grid covered with a lacey carbon film.
mages were acquired using DigitalMicrograph from Gatan Inc.UV–visible reflectance spectroscopy on a Varian Cary 300 was
sed to investigate the state of Ag in the catalysts. The spectra wereonverted into the Kubelka–Munk function (F(R∞)).
Temperature programmed desorption (TPD) of NH3 was con-ucted in the catalyst test setup (see below) and with the samemount of catalyst (45 mg). Prior to the experiment, the catalystas pretreated in a flow of Ar (100 N ml/min) for 30 min at 500 ◦C.fter that the sample was cooled down and NH3 was then adsorbedt 90 ◦C (monitored by FTIR), followed by a switch back to Ar-flowo remove gaseous NH3. When the NH3 signal was below 10 ppm,he temperature ramp was started (5 ◦C/min).
.3. Catalyst activity testing
The catalyst activity was tested in a fixed-bed quartz flow reac-or (inner diameter 4 mm). 45 mg of the catalyst was diluted with
00 mg of SiC giving a bed height of ∼12 mm. The catalyst was heldn place by quartz wool plugs.A standard deNOx feed of 500 ppm NO, 520 ppm NH3, 1200 ppm
2, 8.3% O2, 7% H2O and balance Ar was used for activity testing. For
Fig. 1. XRD of Versal, calcined at 550, 750 and 1000 ◦C, respectively.
sulphur testing, 10 ppm SO2 was added to the feed. The total flowwas 120 N ml/min giving a GHSV of ∼50,000 h−1 based on the wholebed volume (catalyst + SiC) and a GHSV of ∼100,000 h−1 based onthe catalyst volume. The gases were controlled by mass flow con-trollers, and water was fed by a syringe pump (ISCO 100 DM). Thegases were either supplied by AGA (Ar and O2) or Air Liquide.
During activity testing, the samples were heated to 475 ◦C andheld there for 30 min before being ramped down to 130 ◦C at a rateof 2 ◦C/min during which the activity was measured. For sulphurtesting, the samples were first heated to 475 ◦C and held there for30 min before being ramped down (2.5 ◦C/min) to 250 ◦C, whereSO2 was introduced and the activity measurement started. After 1 hat 250 ◦C, SO2 was switched off and the temperature was increasedto 670 ◦C and held there for 10 min before being ramped down to250 ◦C again. Then the cycle, 1 h at 250 ◦C followed by 10 min at670 ◦C, was repeated until no difference in activity between thesulphation cycles could be seen.
Outlet gases were analysed using a Thermo Fisher Nicolet 6700FTIR analyzer, equipped with a 2-m gas cell. All gas capillaries andthe FTIR gas cell were heated to >130 ◦C to avoid condensation ofwater and formation of ammonium nitrate.
NOx conversion was calculated as (cNOx,in − cNOx,out)/cNOx,in,where NOx was the sum of NO, NO2 and N2O.
3. Results
3.1. Catalyst characteristics
Characteristics for the different 1 wt% Ag loading catalysts arelisted in Table 1. The A- and the V-series had surface areas in thesame range for each pretreatment temperature (4–11% variation),the C-series had somewhat lower (11–16%) and the P-series hadsignificantly lower surface areas (48–62%) compared to A. The P-series had a higher pore diameter as compared to the others (3–5times). The C-series showed a much narrower pore-size distribu-tion than the rest of the samples. The measured Ag loading was closeto the target value for the samples tested. The target Ag loading willtherefore be used throughout this report.
Increasing the Ag loading did not significantly alter the char-acteristics as can be seen for P1-1000 and P2-1000. This is inaccordance with previously reported results [12,13]. The SBET for1 wt% Ag samples will therefore be used for higher Ag loading sam-ples.
The crystallinity of the samples increased with increased pre-calcination temperature of the samples seen by XRD spectra. Fig. 1shows the XRD spectra for the V-series. V1-550 and V1-750 was amixture of eta and gamma phase and V1-1000 was a mixture of eta
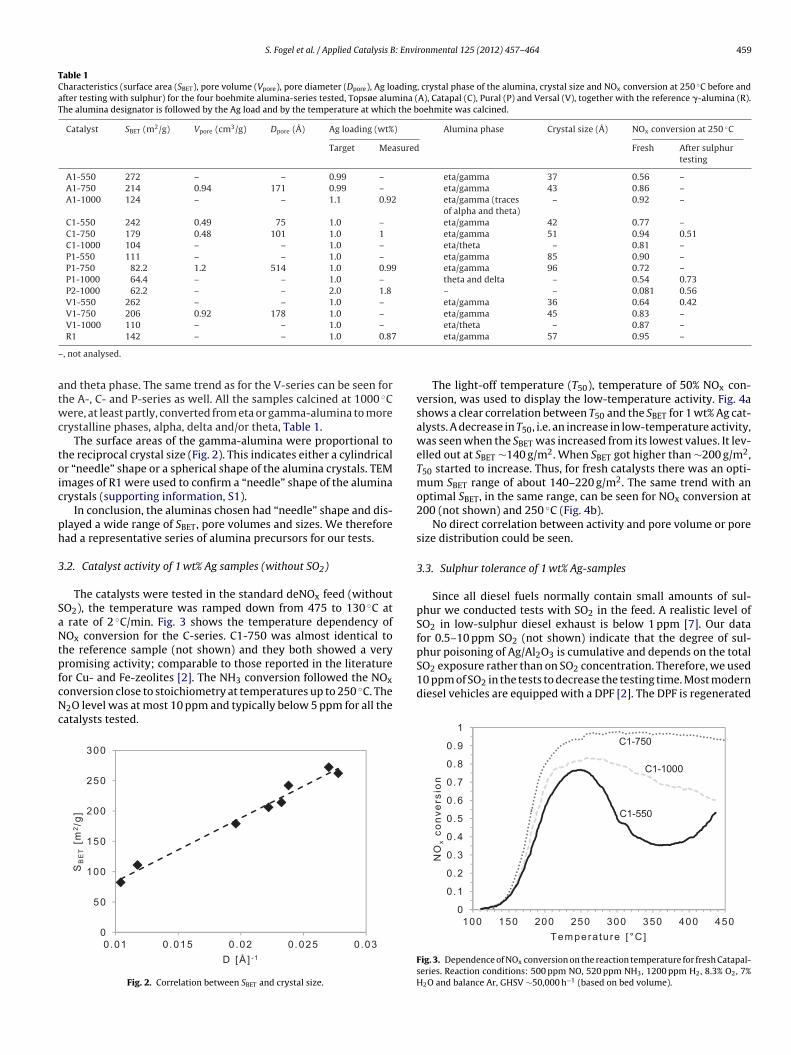
S. Fogel et al. / Applied Catalysis B: Environmental 125 (2012) 457– 464 459
Table 1Characteristics (surface area (SBET), pore volume (Vpore), pore diameter (Dpore), Ag loading, crystal phase of the alumina, crystal size and NOx conversion at 250 ◦C before andafter testing with sulphur) for the four boehmite alumina-series tested, Topsøe alumina (A), Catapal (C), Pural (P) and Versal (V), together with the reference �-alumina (R).The alumina designator is followed by the Ag load and by the temperature at which the boehmite was calcined.
Catalyst SBET (m2/g) Vpore (cm3/g) Dpore (Å) Ag loading (wt%) Alumina phase Crystal size (Å) NOx conversion at 250 ◦C
Target Measured Fresh After sulphurtesting
A1-550 272 – – 0.99 – eta/gamma 37 0.56 –A1-750 214 0.94 171 0.99 – eta/gamma 43 0.86 –A1-1000 124 – – 1.1 0.92 eta/gamma (traces
of alpha and theta)– 0.92 –
C1-550 242 0.49 75 1.0 – eta/gamma 42 0.77 –C1-750 179 0.48 101 1.0 1 eta/gamma 51 0.94 0.51C1-1000 104 – – 1.0 – eta/theta – 0.81 –P1-550 111 – – 1.0 – eta/gamma 85 0.90 –P1-750 82.2 1.2 514 1.0 0.99 eta/gamma 96 0.72 –P1-1000 64.4 – – 1.0 – theta and delta – 0.54 0.73P2-1000 62.2 – – 2.0 1.8 – – 0.081 0.56V1-550 262 – – 1.0 – eta/gamma 36 0.64 0.42V1-750 206 0.92 178 1.0 – eta/gamma 45 0.83 –V1-1000 110 – – 1.0 – eta/theta – 0.87 –
–
atwc
toic
ph
3
SaNtpfcNc
phur poisoning of Ag/Al2O3 is cumulative and depends on the totalSO2 exposure rather than on SO2 concentration. Therefore, we used
R1 142 – – 1.0 0.87
, not analysed.
nd theta phase. The same trend as for the V-series can be seen forhe A-, C- and P-series as well. All the samples calcined at 1000 ◦Cere, at least partly, converted from eta or gamma-alumina to more
rystalline phases, alpha, delta and/or theta, Table 1.The surface areas of the gamma-alumina were proportional to
he reciprocal crystal size (Fig. 2). This indicates either a cylindricalr “needle” shape or a spherical shape of the alumina crystals. TEMmages of R1 were used to confirm a “needle” shape of the aluminarystals (supporting information, S1).
In conclusion, the aluminas chosen had “needle” shape and dis-layed a wide range of SBET, pore volumes and sizes. We thereforead a representative series of alumina precursors for our tests.
.2. Catalyst activity of 1 wt% Ag samples (without SO2)
The catalysts were tested in the standard deNOx feed (withoutO2), the temperature was ramped down from 475 to 130 ◦C at
rate of 2 ◦C/min. Fig. 3 shows the temperature dependency ofOx conversion for the C-series. C1-750 was almost identical to
he reference sample (not shown) and they both showed a veryromising activity; comparable to those reported in the literature
or Cu- and Fe-zeolites [2]. The NH3 conversion followed the NOxonversion close to stoichiometry at temperatures up to 250 ◦C. The2O level was at most 10 ppm and typically below 5 ppm for all theatalysts tested.
Fig. 2. Correlation between SBET and crystal size.
eta/gamma 57 0.95 –
The light-off temperature (T50), temperature of 50% NOx con-version, was used to display the low-temperature activity. Fig. 4ashows a clear correlation between T50 and the SBET for 1 wt% Ag cat-alysts. A decrease in T50, i.e. an increase in low-temperature activity,was seen when the SBET was increased from its lowest values. It lev-elled out at SBET ∼140 g/m2. When SBET got higher than ∼200 g/m2,T50 started to increase. Thus, for fresh catalysts there was an opti-mum SBET range of about 140–220 g/m2. The same trend with anoptimal SBET, in the same range, can be seen for NOx conversion at200 (not shown) and 250 ◦C (Fig. 4b).
No direct correlation between activity and pore volume or poresize distribution could be seen.
3.3. Sulphur tolerance of 1 wt% Ag-samples
Since all diesel fuels normally contain small amounts of sul-phur we conducted tests with SO2 in the feed. A realistic level ofSO2 in low-sulphur diesel exhaust is below 1 ppm [7]. Our datafor 0.5–10 ppm SO2 (not shown) indicate that the degree of sul-
10 ppm of SO2 in the tests to decrease the testing time. Most moderndiesel vehicles are equipped with a DPF [2]. The DPF is regenerated
Fig. 3. Dependence of NOx conversion on the reaction temperature for fresh Catapal-series. Reaction conditions: 500 ppm NO, 520 ppm NH3, 1200 ppm H2, 8.3% O2, 7%H2O and balance Ar, GHSV ∼50,000 h−1 (based on bed volume).
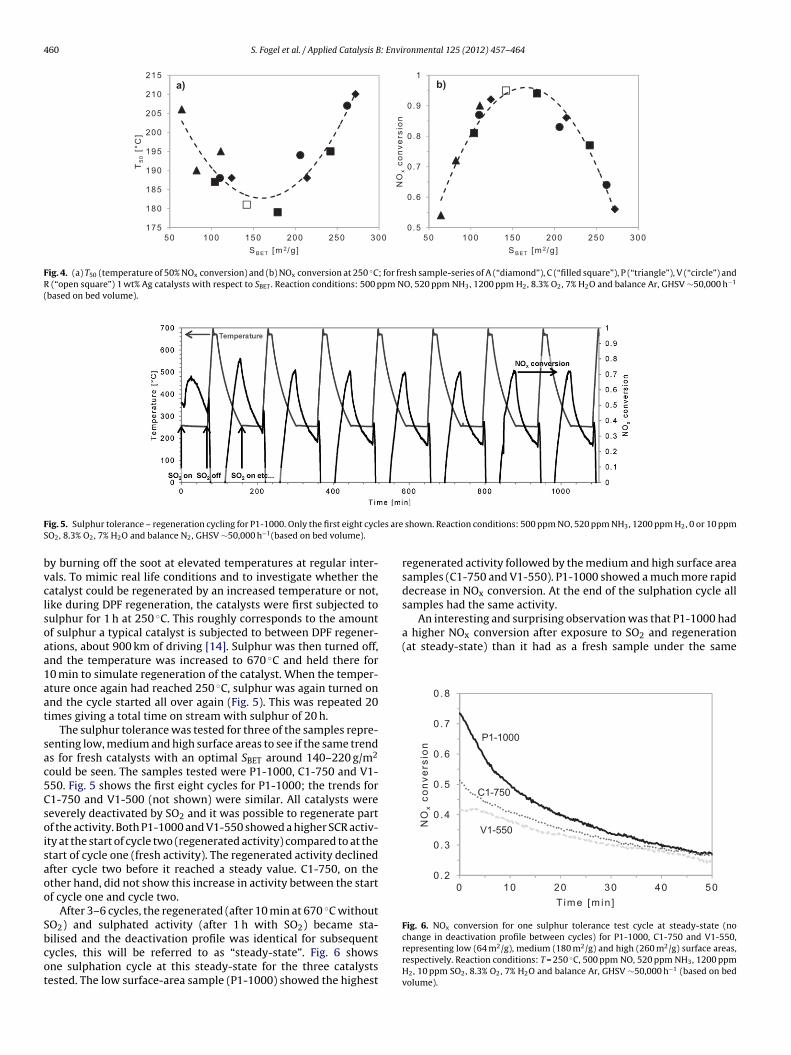
460 S. Fogel et al. / Applied Catalysis B: Environmental 125 (2012) 457– 464
Fig. 4. (a) T50 (temperature of 50% NOx conversion) and (b) NOx conversion at 250 ◦C; for fresh sample-series of A (“diamond”), C (“filled square”), P (“triangle”), V (“circle”) andR (“open square”) 1 wt% Ag catalysts with respect to SBET. Reaction conditions: 500 ppm NO, 520 ppm NH3, 1200 ppm H2, 8.3% O2, 7% H2O and balance Ar, GHSV ∼50,000 h−1
(based on bed volume).
F es areS
bvclsoaa1aat
sac5Csoisaoo
Sbcot
samples had the same activity.An interesting and surprising observation was that P1-1000 had
a higher NOx conversion after exposure to SO2 and regeneration(at steady-state) than it had as a fresh sample under the same
Fig. 6. NOx conversion for one sulphur tolerance test cycle at steady-state (no
ig. 5. Sulphur tolerance – regeneration cycling for P1-1000. Only the first eight cyclO2, 8.3% O2, 7% H2O and balance N2, GHSV ∼50,000 h−1(based on bed volume).
y burning off the soot at elevated temperatures at regular inter-als. To mimic real life conditions and to investigate whether theatalyst could be regenerated by an increased temperature or not,ike during DPF regeneration, the catalysts were first subjected toulphur for 1 h at 250 ◦C. This roughly corresponds to the amountf sulphur a typical catalyst is subjected to between DPF regener-tions, about 900 km of driving [14]. Sulphur was then turned off,nd the temperature was increased to 670 ◦C and held there for0 min to simulate regeneration of the catalyst. When the temper-ture once again had reached 250 ◦C, sulphur was again turned onnd the cycle started all over again (Fig. 5). This was repeated 20imes giving a total time on stream with sulphur of 20 h.
The sulphur tolerance was tested for three of the samples repre-enting low, medium and high surface areas to see if the same trends for fresh catalysts with an optimal SBET around 140–220 g/m2
ould be seen. The samples tested were P1-1000, C1-750 and V1-50. Fig. 5 shows the first eight cycles for P1-1000; the trends for1-750 and V1-500 (not shown) were similar. All catalysts wereeverely deactivated by SO2 and it was possible to regenerate partf the activity. Both P1-1000 and V1-550 showed a higher SCR activ-ty at the start of cycle two (regenerated activity) compared to at thetart of cycle one (fresh activity). The regenerated activity declinedfter cycle two before it reached a steady value. C1-750, on thether hand, did not show this increase in activity between the startf cycle one and cycle two.
After 3–6 cycles, the regenerated (after 10 min at 670 ◦C withoutO2) and sulphated activity (after 1 h with SO2) became sta-
ilised and the deactivation profile was identical for subsequentycles, this will be referred to as “steady-state”. Fig. 6 showsne sulphation cycle at this steady-state for the three catalystsested. The low surface-area sample (P1-1000) showed the highestshown. Reaction conditions: 500 ppm NO, 520 ppm NH3, 1200 ppm H2, 0 or 10 ppm
regenerated activity followed by the medium and high surface areasamples (C1-750 and V1-550). P1-1000 showed a much more rapiddecrease in NOx conversion. At the end of the sulphation cycle all
change in deactivation profile between cycles) for P1-1000, C1-750 and V1-550,representing low (64 m2/g), medium (180 m2/g) and high (260 m2/g) surface areas,respectively. Reaction conditions: T = 250 ◦C, 500 ppm NO, 520 ppm NH3, 1200 ppmH2, 10 ppm SO2, 8.3% O2, 7% H2O and balance Ar, GHSV ∼50,000 h−1 (based on bedvolume).
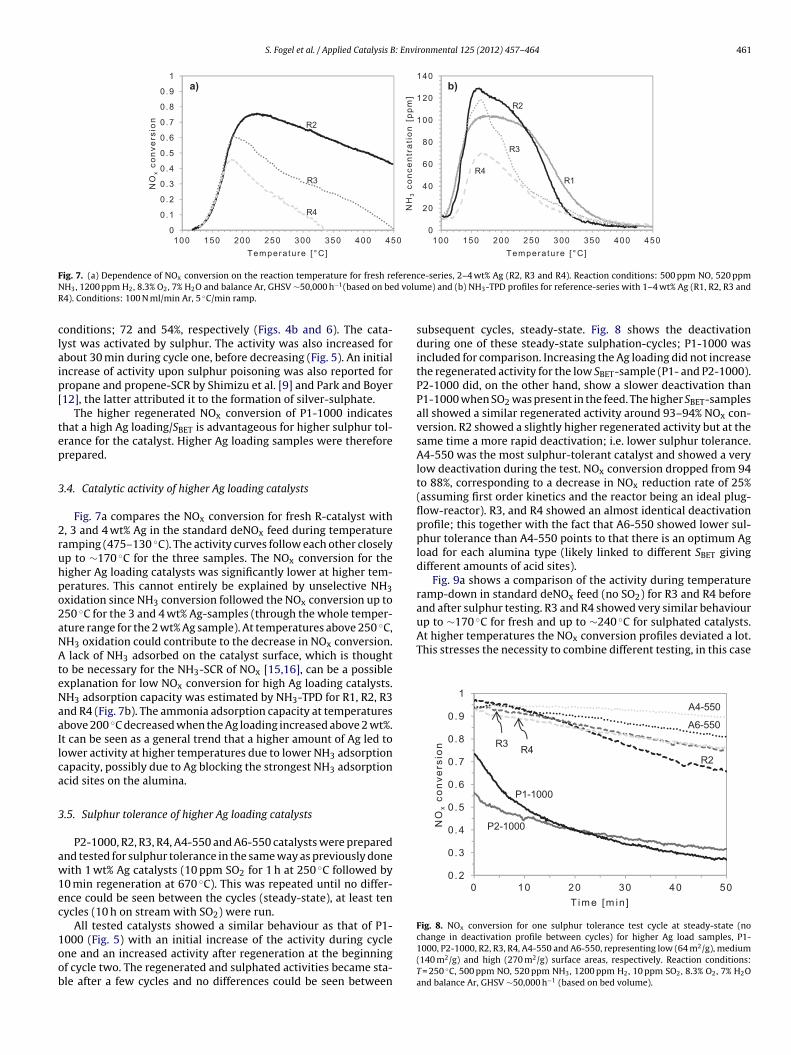
S. Fogel et al. / Applied Catalysis B: Environmental 125 (2012) 457– 464 461
F ferenN d voluR
claip[
tep
3
2ruhpo2aNAteNaaIlca
3
aw1ec
1oob
up to ∼170 ◦C for fresh and up to ∼240 ◦C for sulphated catalysts.At higher temperatures the NOx conversion profiles deviated a lot.This stresses the necessity to combine different testing, in this case
Fig. 8. NOx conversion for one sulphur tolerance test cycle at steady-state (no
ig. 7. (a) Dependence of NOx conversion on the reaction temperature for fresh reH3, 1200 ppm H2, 8.3% O2, 7% H2O and balance Ar, GHSV ∼50,000 h−1(based on be4). Conditions: 100 N ml/min Ar, 5 ◦C/min ramp.
onditions; 72 and 54%, respectively (Figs. 4b and 6). The cata-yst was activated by sulphur. The activity was also increased forbout 30 min during cycle one, before decreasing (Fig. 5). An initialncrease of activity upon sulphur poisoning was also reported forropane and propene-SCR by Shimizu et al. [9] and Park and Boyer12], the latter attributed it to the formation of silver-sulphate.
The higher regenerated NOx conversion of P1-1000 indicateshat a high Ag loading/SBET is advantageous for higher sulphur tol-rance for the catalyst. Higher Ag loading samples were thereforerepared.
.4. Catalytic activity of higher Ag loading catalysts
Fig. 7a compares the NOx conversion for fresh R-catalyst with, 3 and 4 wt% Ag in the standard deNOx feed during temperatureamping (475–130 ◦C). The activity curves follow each other closelyp to ∼170 ◦C for the three samples. The NOx conversion for theigher Ag loading catalysts was significantly lower at higher tem-eratures. This cannot entirely be explained by unselective NH3xidation since NH3 conversion followed the NOx conversion up to50 ◦C for the 3 and 4 wt% Ag-samples (through the whole temper-ture range for the 2 wt% Ag sample). At temperatures above 250 ◦C,H3 oxidation could contribute to the decrease in NOx conversion.
lack of NH3 adsorbed on the catalyst surface, which is thoughto be necessary for the NH3-SCR of NOx [15,16], can be a possiblexplanation for low NOx conversion for high Ag loading catalysts.H3 adsorption capacity was estimated by NH3-TPD for R1, R2, R3nd R4 (Fig. 7b). The ammonia adsorption capacity at temperaturesbove 200 ◦C decreased when the Ag loading increased above 2 wt%.t can be seen as a general trend that a higher amount of Ag led toower activity at higher temperatures due to lower NH3 adsorptionapacity, possibly due to Ag blocking the strongest NH3 adsorptioncid sites on the alumina.
.5. Sulphur tolerance of higher Ag loading catalysts
P2-1000, R2, R3, R4, A4-550 and A6-550 catalysts were preparednd tested for sulphur tolerance in the same way as previously doneith 1 wt% Ag catalysts (10 ppm SO2 for 1 h at 250 ◦C followed by
0 min regeneration at 670 ◦C). This was repeated until no differ-nce could be seen between the cycles (steady-state), at least tenycles (10 h on stream with SO2) were run.
All tested catalysts showed a similar behaviour as that of P1-
000 (Fig. 5) with an initial increase of the activity during cyclene and an increased activity after regeneration at the beginningf cycle two. The regenerated and sulphated activities became sta-le after a few cycles and no differences could be seen betweence-series, 2–4 wt% Ag (R2, R3 and R4). Reaction conditions: 500 ppm NO, 520 ppmme) and (b) NH3-TPD profiles for reference-series with 1–4 wt% Ag (R1, R2, R3 and
subsequent cycles, steady-state. Fig. 8 shows the deactivationduring one of these steady-state sulphation-cycles; P1-1000 wasincluded for comparison. Increasing the Ag loading did not increasethe regenerated activity for the low SBET-sample (P1- and P2-1000).P2-1000 did, on the other hand, show a slower deactivation thanP1-1000 when SO2 was present in the feed. The higher SBET-samplesall showed a similar regenerated activity around 93–94% NOx con-version. R2 showed a slightly higher regenerated activity but at thesame time a more rapid deactivation; i.e. lower sulphur tolerance.A4-550 was the most sulphur-tolerant catalyst and showed a verylow deactivation during the test. NOx conversion dropped from 94to 88%, corresponding to a decrease in NOx reduction rate of 25%(assuming first order kinetics and the reactor being an ideal plug-flow-reactor). R3, and R4 showed an almost identical deactivationprofile; this together with the fact that A6-550 showed lower sul-phur tolerance than A4-550 points to that there is an optimum Agload for each alumina type (likely linked to different SBET givingdifferent amounts of acid sites).
Fig. 9a shows a comparison of the activity during temperatureramp-down in standard deNOx feed (no SO2) for R3 and R4 beforeand after sulphur testing. R3 and R4 showed very similar behaviour
change in deactivation profile between cycles) for higher Ag load samples, P1-1000, P2-1000, R2, R3, R4, A4-550 and A6-550, representing low (64 m2/g), medium(140 m2/g) and high (270 m2/g) surface areas, respectively. Reaction conditions:T = 250 ◦C, 500 ppm NO, 520 ppm NH3, 1200 ppm H2, 10 ppm SO2, 8.3% O2, 7% H2Oand balance Ar, GHSV ∼50,000 h−1 (based on bed volume).
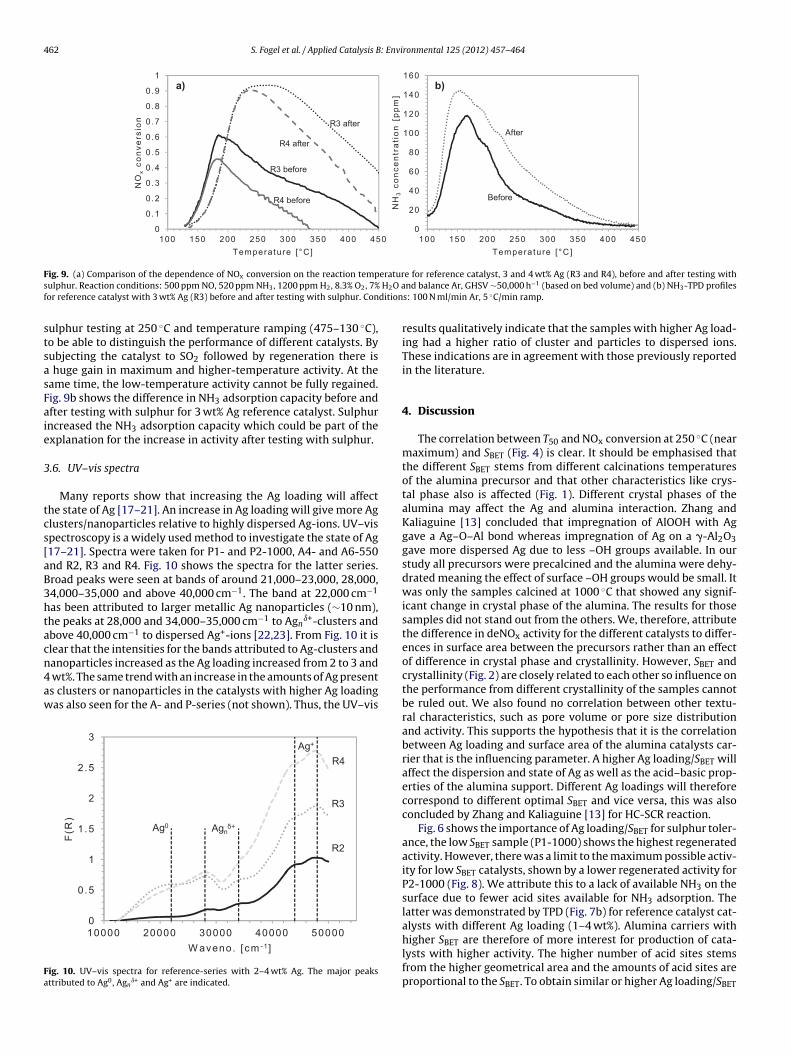
462 S. Fogel et al. / Applied Catalysis B: Environmental 125 (2012) 457– 464
F eraturs H2O af dition
stsasFaie
3
tcs[aB3htacn4aw
Fa
ig. 9. (a) Comparison of the dependence of NOx conversion on the reaction tempulphur. Reaction conditions: 500 ppm NO, 520 ppm NH3, 1200 ppm H2, 8.3% O2, 7%or reference catalyst with 3 wt% Ag (R3) before and after testing with sulphur. Con
ulphur testing at 250 ◦C and temperature ramping (475–130 ◦C),o be able to distinguish the performance of different catalysts. Byubjecting the catalyst to SO2 followed by regeneration there is
huge gain in maximum and higher-temperature activity. At theame time, the low-temperature activity cannot be fully regained.ig. 9b shows the difference in NH3 adsorption capacity before andfter testing with sulphur for 3 wt% Ag reference catalyst. Sulphurncreased the NH3 adsorption capacity which could be part of thexplanation for the increase in activity after testing with sulphur.
.6. UV–vis spectra
Many reports show that increasing the Ag loading will affecthe state of Ag [17–21]. An increase in Ag loading will give more Aglusters/nanoparticles relative to highly dispersed Ag-ions. UV–vispectroscopy is a widely used method to investigate the state of Ag17–21]. Spectra were taken for P1- and P2-1000, A4- and A6-550nd R2, R3 and R4. Fig. 10 shows the spectra for the latter series.road peaks were seen at bands of around 21,000–23,000, 28,000,4,000–35,000 and above 40,000 cm−1. The band at 22,000 cm−1
as been attributed to larger metallic Ag nanoparticles (∼10 nm),he peaks at 28,000 and 34,000–35,000 cm−1 to Agn
ı+-clusters andbove 40,000 cm−1 to dispersed Ag+-ions [22,23]. From Fig. 10 it islear that the intensities for the bands attributed to Ag-clusters and
anoparticles increased as the Ag loading increased from 2 to 3 andwt%. The same trend with an increase in the amounts of Ag presents clusters or nanoparticles in the catalysts with higher Ag loadingas also seen for the A- and P-series (not shown). Thus, the UV–vis
ig. 10. UV–vis spectra for reference-series with 2–4 wt% Ag. The major peaksttributed to Ag0, Agn
ı+ and Ag+ are indicated.
e for reference catalyst, 3 and 4 wt% Ag (R3 and R4), before and after testing withnd balance Ar, GHSV ∼50,000 h−1 (based on bed volume) and (b) NH3-TPD profiles
s: 100 N ml/min Ar, 5 ◦C/min ramp.
results qualitatively indicate that the samples with higher Ag load-ing had a higher ratio of cluster and particles to dispersed ions.These indications are in agreement with those previously reportedin the literature.
4. Discussion
The correlation between T50 and NOx conversion at 250 ◦C (nearmaximum) and SBET (Fig. 4) is clear. It should be emphasised thatthe different SBET stems from different calcinations temperaturesof the alumina precursor and that other characteristics like crys-tal phase also is affected (Fig. 1). Different crystal phases of thealumina may affect the Ag and alumina interaction. Zhang andKaliaguine [13] concluded that impregnation of AlOOH with Aggave a Ag–O–Al bond whereas impregnation of Ag on a �-Al2O3gave more dispersed Ag due to less –OH groups available. In ourstudy all precursors were precalcined and the alumina were dehy-drated meaning the effect of surface –OH groups would be small. Itwas only the samples calcined at 1000 ◦C that showed any signif-icant change in crystal phase of the alumina. The results for thosesamples did not stand out from the others. We, therefore, attributethe difference in deNOx activity for the different catalysts to differ-ences in surface area between the precursors rather than an effectof difference in crystal phase and crystallinity. However, SBET andcrystallinity (Fig. 2) are closely related to each other so influence onthe performance from different crystallinity of the samples cannotbe ruled out. We also found no correlation between other textu-ral characteristics, such as pore volume or pore size distributionand activity. This supports the hypothesis that it is the correlationbetween Ag loading and surface area of the alumina catalysts car-rier that is the influencing parameter. A higher Ag loading/SBET willaffect the dispersion and state of Ag as well as the acid–basic prop-erties of the alumina support. Different Ag loadings will thereforecorrespond to different optimal SBET and vice versa, this was alsoconcluded by Zhang and Kaliaguine [13] for HC-SCR reaction.
Fig. 6 shows the importance of Ag loading/SBET for sulphur toler-ance, the low SBET sample (P1-1000) shows the highest regeneratedactivity. However, there was a limit to the maximum possible activ-ity for low SBET catalysts, shown by a lower regenerated activity forP2-1000 (Fig. 8). We attribute this to a lack of available NH3 on thesurface due to fewer acid sites available for NH3 adsorption. Thelatter was demonstrated by TPD (Fig. 7b) for reference catalyst cat-alysts with different Ag loading (1–4 wt%). Alumina carriers with
higher SBET are therefore of more interest for production of cata-lysts with higher activity. The higher number of acid sites stemsfrom the higher geometrical area and the amounts of acid sites areproportional to the SBET. To obtain similar or higher Ag loading/SBET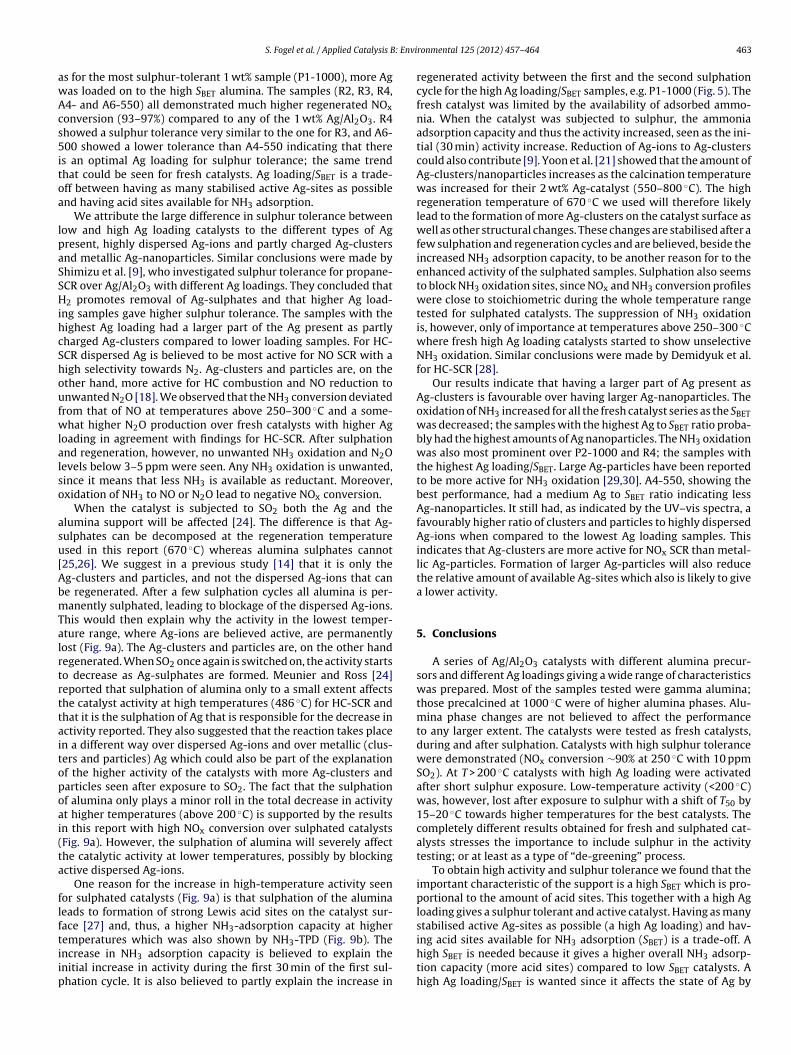
: Envi
awAcs5itoa
lpaSSHihcShoufwlalso
asu[AbmTalrtrttaitopoai(ta
flftiip
S. Fogel et al. / Applied Catalysis B
s for the most sulphur-tolerant 1 wt% sample (P1-1000), more Agas loaded on to the high SBET alumina. The samples (R2, R3, R4,4- and A6-550) all demonstrated much higher regenerated NOx
onversion (93–97%) compared to any of the 1 wt% Ag/Al2O3. R4howed a sulphur tolerance very similar to the one for R3, and A6-00 showed a lower tolerance than A4-550 indicating that there
s an optimal Ag loading for sulphur tolerance; the same trendhat could be seen for fresh catalysts. Ag loading/SBET is a trade-ff between having as many stabilised active Ag-sites as possiblend having acid sites available for NH3 adsorption.
We attribute the large difference in sulphur tolerance betweenow and high Ag loading catalysts to the different types of Agresent, highly dispersed Ag-ions and partly charged Ag-clustersnd metallic Ag-nanoparticles. Similar conclusions were made byhimizu et al. [9], who investigated sulphur tolerance for propane-CR over Ag/Al2O3 with different Ag loadings. They concluded that2 promotes removal of Ag-sulphates and that higher Ag load-
ng samples gave higher sulphur tolerance. The samples with theighest Ag loading had a larger part of the Ag present as partlyharged Ag-clusters compared to lower loading samples. For HC-CR dispersed Ag is believed to be most active for NO SCR with aigh selectivity towards N2. Ag-clusters and particles are, on thether hand, more active for HC combustion and NO reduction tonwanted N2O [18]. We observed that the NH3 conversion deviatedrom that of NO at temperatures above 250–300 ◦C and a some-hat higher N2O production over fresh catalysts with higher Ag
oading in agreement with findings for HC-SCR. After sulphationnd regeneration, however, no unwanted NH3 oxidation and N2Oevels below 3–5 ppm were seen. Any NH3 oxidation is unwanted,ince it means that less NH3 is available as reductant. Moreover,xidation of NH3 to NO or N2O lead to negative NOx conversion.
When the catalyst is subjected to SO2 both the Ag and thelumina support will be affected [24]. The difference is that Ag-ulphates can be decomposed at the regeneration temperaturesed in this report (670 ◦C) whereas alumina sulphates cannot25,26]. We suggest in a previous study [14] that it is only theg-clusters and particles, and not the dispersed Ag-ions that cane regenerated. After a few sulphation cycles all alumina is per-anently sulphated, leading to blockage of the dispersed Ag-ions.
his would then explain why the activity in the lowest temper-ture range, where Ag-ions are believed active, are permanentlyost (Fig. 9a). The Ag-clusters and particles are, on the other handegenerated. When SO2 once again is switched on, the activity startso decrease as Ag-sulphates are formed. Meunier and Ross [24]eported that sulphation of alumina only to a small extent affectshe catalyst activity at high temperatures (486 ◦C) for HC-SCR andhat it is the sulphation of Ag that is responsible for the decrease inctivity reported. They also suggested that the reaction takes placen a different way over dispersed Ag-ions and over metallic (clus-ers and particles) Ag which could also be part of the explanationf the higher activity of the catalysts with more Ag-clusters andarticles seen after exposure to SO2. The fact that the sulphationf alumina only plays a minor roll in the total decrease in activityt higher temperatures (above 200 ◦C) is supported by the resultsn this report with high NOx conversion over sulphated catalystsFig. 9a). However, the sulphation of alumina will severely affecthe catalytic activity at lower temperatures, possibly by blockingctive dispersed Ag-ions.
One reason for the increase in high-temperature activity seenor sulphated catalysts (Fig. 9a) is that sulphation of the aluminaeads to formation of strong Lewis acid sites on the catalyst sur-ace [27] and, thus, a higher NH3-adsorption capacity at higher
emperatures which was also shown by NH3-TPD (Fig. 9b). Thencrease in NH3 adsorption capacity is believed to explain thenitial increase in activity during the first 30 min of the first sul-hation cycle. It is also believed to partly explain the increase inronmental 125 (2012) 457– 464 463
regenerated activity between the first and the second sulphationcycle for the high Ag loading/SBET samples, e.g. P1-1000 (Fig. 5). Thefresh catalyst was limited by the availability of adsorbed ammo-nia. When the catalyst was subjected to sulphur, the ammoniaadsorption capacity and thus the activity increased, seen as the ini-tial (30 min) activity increase. Reduction of Ag-ions to Ag-clusterscould also contribute [9]. Yoon et al. [21] showed that the amount ofAg-clusters/nanoparticles increases as the calcination temperaturewas increased for their 2 wt% Ag-catalyst (550–800 ◦C). The highregeneration temperature of 670 ◦C we used will therefore likelylead to the formation of more Ag-clusters on the catalyst surface aswell as other structural changes. These changes are stabilised after afew sulphation and regeneration cycles and are believed, beside theincreased NH3 adsorption capacity, to be another reason for to theenhanced activity of the sulphated samples. Sulphation also seemsto block NH3 oxidation sites, since NOx and NH3 conversion profileswere close to stoichiometric during the whole temperature rangetested for sulphated catalysts. The suppression of NH3 oxidationis, however, only of importance at temperatures above 250–300 ◦Cwhere fresh high Ag loading catalysts started to show unselectiveNH3 oxidation. Similar conclusions were made by Demidyuk et al.for HC-SCR [28].
Our results indicate that having a larger part of Ag present asAg-clusters is favourable over having larger Ag-nanoparticles. Theoxidation of NH3 increased for all the fresh catalyst series as the SBETwas decreased; the samples with the highest Ag to SBET ratio proba-bly had the highest amounts of Ag nanoparticles. The NH3 oxidationwas also most prominent over P2-1000 and R4; the samples withthe highest Ag loading/SBET. Large Ag-particles have been reportedto be more active for NH3 oxidation [29,30]. A4-550, showing thebest performance, had a medium Ag to SBET ratio indicating lessAg-nanoparticles. It still had, as indicated by the UV–vis spectra, afavourably higher ratio of clusters and particles to highly dispersedAg-ions when compared to the lowest Ag loading samples. Thisindicates that Ag-clusters are more active for NOx SCR than metal-lic Ag-particles. Formation of larger Ag-particles will also reducethe relative amount of available Ag-sites which also is likely to givea lower activity.
5. Conclusions
A series of Ag/Al2O3 catalysts with different alumina precur-sors and different Ag loadings giving a wide range of characteristicswas prepared. Most of the samples tested were gamma alumina;those precalcined at 1000 ◦C were of higher alumina phases. Alu-mina phase changes are not believed to affect the performanceto any larger extent. The catalysts were tested as fresh catalysts,during and after sulphation. Catalysts with high sulphur tolerancewere demonstrated (NOx conversion ∼90% at 250 ◦C with 10 ppmSO2). At T > 200 ◦C catalysts with high Ag loading were activatedafter short sulphur exposure. Low-temperature activity (<200 ◦C)was, however, lost after exposure to sulphur with a shift of T50 by15–20 ◦C towards higher temperatures for the best catalysts. Thecompletely different results obtained for fresh and sulphated cat-alysts stresses the importance to include sulphur in the activitytesting; or at least as a type of “de-greening” process.
To obtain high activity and sulphur tolerance we found that theimportant characteristic of the support is a high SBET which is pro-portional to the amount of acid sites. This together with a high Agloading gives a sulphur tolerant and active catalyst. Having as manystabilised active Ag-sites as possible (a high Ag loading) and hav-
ing acid sites available for NH3 adsorption (SBET) is a trade-off. Ahigh SBET is needed because it gives a higher overall NH3 adsorp-tion capacity (more acid sites) compared to low SBET catalysts. Ahigh Ag loading/SBET is wanted since it affects the state of Ag by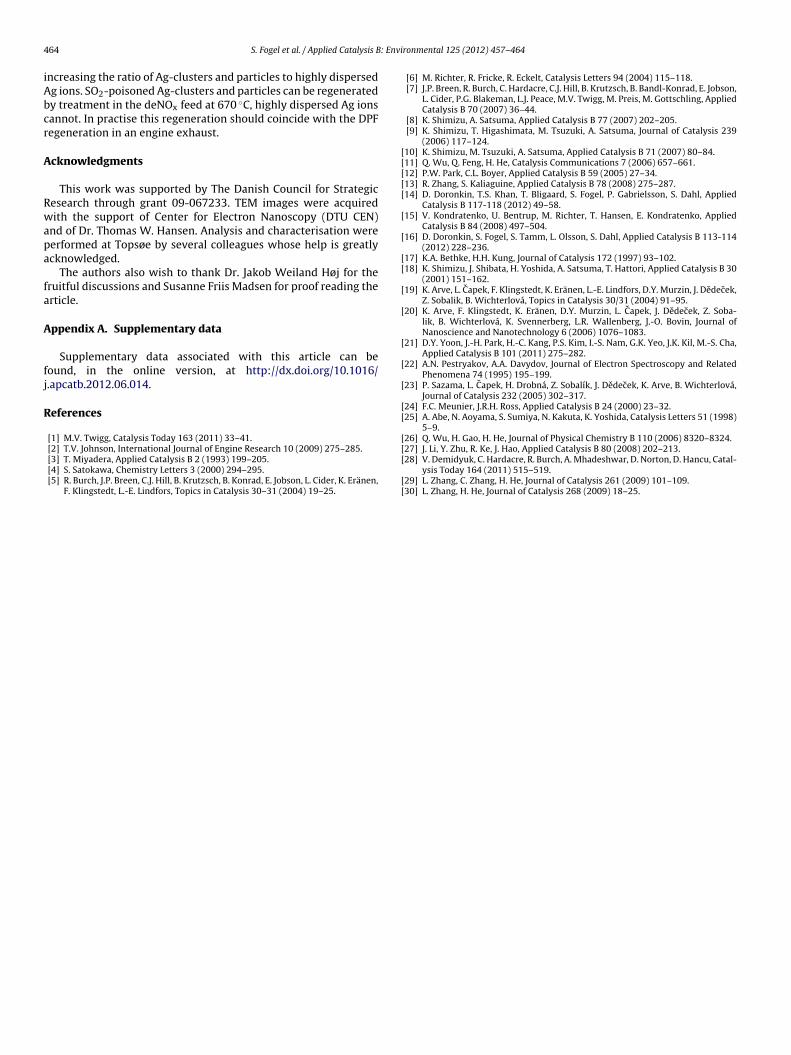
4 : Envi
iAbcr
A
Rwapa
fa
A
fj
R
[[[[[
[
[
[[
[
[
[
[
[
[[
[
64 S. Fogel et al. / Applied Catalysis B
ncreasing the ratio of Ag-clusters and particles to highly dispersedg ions. SO2-poisoned Ag-clusters and particles can be regeneratedy treatment in the deNOx feed at 670 ◦C, highly dispersed Ag ionsannot. In practise this regeneration should coincide with the DPFegeneration in an engine exhaust.
cknowledgments
This work was supported by The Danish Council for Strategicesearch through grant 09-067233. TEM images were acquiredith the support of Center for Electron Nanoscopy (DTU CEN)
nd of Dr. Thomas W. Hansen. Analysis and characterisation wereerformed at Topsøe by several colleagues whose help is greatlycknowledged.
The authors also wish to thank Dr. Jakob Weiland Høj for theruitful discussions and Susanne Friis Madsen for proof reading therticle.
ppendix A. Supplementary data
Supplementary data associated with this article can beound, in the online version, at http://dx.doi.org/10.1016/.apcatb.2012.06.014.
eferences
[1] M.V. Twigg, Catalysis Today 163 (2011) 33–41.
[2] T.V. Johnson, International Journal of Engine Research 10 (2009) 275–285.[3] T. Miyadera, Applied Catalysis B 2 (1993) 199–205.[4] S. Satokawa, Chemistry Letters 3 (2000) 294–295.[5] R. Burch, J.P. Breen, C.J. Hill, B. Krutzsch, B. Konrad, E. Jobson, L. Cider, K. Eränen,F. Klingstedt, L.-E. Lindfors, Topics in Catalysis 30–31 (2004) 19–25.
[[
[[
ronmental 125 (2012) 457– 464
[6] M. Richter, R. Fricke, R. Eckelt, Catalysis Letters 94 (2004) 115–118.[7] J.P. Breen, R. Burch, C. Hardacre, C.J. Hill, B. Krutzsch, B. Bandl-Konrad, E. Jobson,
L. Cider, P.G. Blakeman, L.J. Peace, M.V. Twigg, M. Preis, M. Gottschling, AppliedCatalysis B 70 (2007) 36–44.
[8] K. Shimizu, A. Satsuma, Applied Catalysis B 77 (2007) 202–205.[9] K. Shimizu, T. Higashimata, M. Tsuzuki, A. Satsuma, Journal of Catalysis 239
(2006) 117–124.10] K. Shimizu, M. Tsuzuki, A. Satsuma, Applied Catalysis B 71 (2007) 80–84.11] Q. Wu, Q. Feng, H. He, Catalysis Communications 7 (2006) 657–661.12] P.W. Park, C.L. Boyer, Applied Catalysis B 59 (2005) 27–34.13] R. Zhang, S. Kaliaguine, Applied Catalysis B 78 (2008) 275–287.14] D. Doronkin, T.S. Khan, T. Bligaard, S. Fogel, P. Gabrielsson, S. Dahl, Applied
Catalysis B 117-118 (2012) 49–58.15] V. Kondratenko, U. Bentrup, M. Richter, T. Hansen, E. Kondratenko, Applied
Catalysis B 84 (2008) 497–504.16] D. Doronkin, S. Fogel, S. Tamm, L. Olsson, S. Dahl, Applied Catalysis B 113-114
(2012) 228–236.17] K.A. Bethke, H.H. Kung, Journal of Catalysis 172 (1997) 93–102.18] K. Shimizu, J. Shibata, H. Yoshida, A. Satsuma, T. Hattori, Applied Catalysis B 30
(2001) 151–162.19] K. Arve, L. Capek, F. Klingstedt, K. Eränen, L.-E. Lindfors, D.Y. Murzin, J. Dedecek,
Z. Sobalik, B. Wichterlová, Topics in Catalysis 30/31 (2004) 91–95.20] K. Arve, F. Klingstedt, K. Eränen, D.Y. Murzin, L. Capek, J. Dedecek, Z. Soba-
lik, B. Wichterlová, K. Svennerberg, L.R. Wallenberg, J.-O. Bovin, Journal ofNanoscience and Nanotechnology 6 (2006) 1076–1083.
21] D.Y. Yoon, J.-H. Park, H.-C. Kang, P.S. Kim, I.-S. Nam, G.K. Yeo, J.K. Kil, M.-S. Cha,Applied Catalysis B 101 (2011) 275–282.
22] A.N. Pestryakov, A.A. Davydov, Journal of Electron Spectroscopy and RelatedPhenomena 74 (1995) 195–199.
23] P. Sazama, L. Capek, H. Drobná, Z. Sobalík, J. Dedecek, K. Arve, B. Wichterlová,Journal of Catalysis 232 (2005) 302–317.
24] F.C. Meunier, J.R.H. Ross, Applied Catalysis B 24 (2000) 23–32.25] A. Abe, N. Aoyama, S. Sumiya, N. Kakuta, K. Yoshida, Catalysis Letters 51 (1998)
5–9.26] Q. Wu, H. Gao, H. He, Journal of Physical Chemistry B 110 (2006) 8320–8324.
27] J. Li, Y. Zhu, R. Ke, J. Hao, Applied Catalysis B 80 (2008) 202–213.28] V. Demidyuk, C. Hardacre, R. Burch, A. Mhadeshwar, D. Norton, D. Hancu, Catal-ysis Today 164 (2011) 515–519.29] L. Zhang, C. Zhang, H. He, Journal of Catalysis 261 (2009) 101–109.30] L. Zhang, H. He, Journal of Catalysis 268 (2009) 18–25.

Paper II
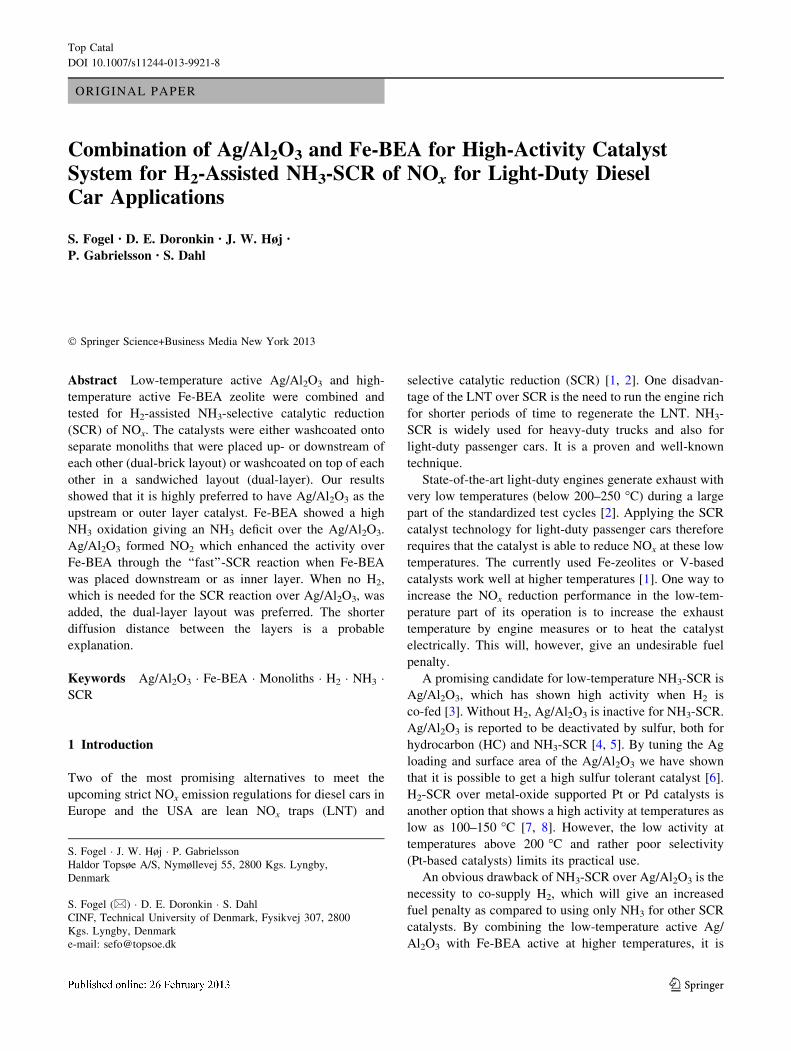
ORIGINAL PAPER
Combination of Ag/Al2O3 and Fe-BEA for High-Activity CatalystSystem for H2-Assisted NH3-SCR of NOx for Light-Duty DieselCar Applications
S. Fogel • D. E. Doronkin • J. W. Høj •
P. Gabrielsson • S. Dahl
� Springer Science+Business Media New York 2013
Abstract Low-temperature active Ag/Al2O3 and high-
temperature active Fe-BEA zeolite were combined and
tested for H2-assisted NH3-selective catalytic reduction
(SCR) of NOx. The catalysts were either washcoated onto
separate monoliths that were placed up- or downstream of
each other (dual-brick layout) or washcoated on top of each
other in a sandwiched layout (dual-layer). Our results
showed that it is highly preferred to have Ag/Al2O3 as the
upstream or outer layer catalyst. Fe-BEA showed a high
NH3 oxidation giving an NH3 deficit over the Ag/Al2O3.
Ag/Al2O3 formed NO2 which enhanced the activity over
Fe-BEA through the ‘‘fast’’-SCR reaction when Fe-BEA
was placed downstream or as inner layer. When no H2,
which is needed for the SCR reaction over Ag/Al2O3, was
added, the dual-layer layout was preferred. The shorter
diffusion distance between the layers is a probable
explanation.
Keywords Ag/Al2O3 � Fe-BEA � Monoliths � H2 � NH3 �SCR
1 Introduction
Two of the most promising alternatives to meet the
upcoming strict NOx emission regulations for diesel cars in
Europe and the USA are lean NOx traps (LNT) and
selective catalytic reduction (SCR) [1, 2]. One disadvan-
tage of the LNT over SCR is the need to run the engine rich
for shorter periods of time to regenerate the LNT. NH3-
SCR is widely used for heavy-duty trucks and also for
light-duty passenger cars. It is a proven and well-known
technique.
State-of-the-art light-duty engines generate exhaust with
very low temperatures (below 200–250 �C) during a large
part of the standardized test cycles [2]. Applying the SCR
catalyst technology for light-duty passenger cars therefore
requires that the catalyst is able to reduce NOx at these low
temperatures. The currently used Fe-zeolites or V-based
catalysts work well at higher temperatures [1]. One way to
increase the NOx reduction performance in the low-tem-
perature part of its operation is to increase the exhaust
temperature by engine measures or to heat the catalyst
electrically. This will, however, give an undesirable fuel
penalty.
A promising candidate for low-temperature NH3-SCR is
Ag/Al2O3, which has shown high activity when H2 is
co-fed [3]. Without H2, Ag/Al2O3 is inactive for NH3-SCR.
Ag/Al2O3 is reported to be deactivated by sulfur, both for
hydrocarbon (HC) and NH3-SCR [4, 5]. By tuning the Ag
loading and surface area of the Ag/Al2O3 we have shown
that it is possible to get a high sulfur tolerant catalyst [6].
H2-SCR over metal-oxide supported Pt or Pd catalysts is
another option that shows a high activity at temperatures as
low as 100–150 �C [7, 8]. However, the low activity at
temperatures above 200 �C and rather poor selectivity
(Pt-based catalysts) limits its practical use.
An obvious drawback of NH3-SCR over Ag/Al2O3 is the
necessity to co-supply H2, which will give an increased
fuel penalty as compared to using only NH3 for other SCR
catalysts. By combining the low-temperature active Ag/
Al2O3 with Fe-BEA active at higher temperatures, it is
S. Fogel � J. W. Høj � P. Gabrielsson
Haldor Topsøe A/S, Nymøllevej 55, 2800 Kgs. Lyngby,
Denmark
S. Fogel (&) � D. E. Doronkin � S. Dahl
CINF, Technical University of Denmark, Fysikvej 307, 2800
Kgs. Lyngby, Denmark
e-mail: [email protected]
123
Top Catal
DOI 10.1007/s11244-013-9921-8
possible to get a system that shows high low- and high high-
temperature activity; without having to dose H2 at the higher
temperatures. This decreases the fuel penalty of the com-
bined system compared to a Ag/Al2O3 system. Fe-BEA is a
well-known and tested catalyst that shows high hydrother-
mal stability [9–11] and sulfur tolerance [9, 12].
There are several ways of combining the low-tempera-
ture (Ag/Al2O3) and the high-temperature (Fe-BEA) cata-
lysts, e.g. as two (or more) separate bricks (monoliths),
as washcoated on each end of a single monolith brick, as
multiple layers washcoated on top of each other or as
combinations of the mentioned layouts. In a recent publi-
cation, Cu-zeolite as the low-temperature and Fe-zeolite as
the high-temperature active catalyst were combined and
tested as separate bricks and in a two-layer layout [13].
This study aims to investigate a combined NH3-SCR
system for automotive applications comprising a combi-
nation of Ag/Al2O3 active at low temperatures and Fe-BEA
active at higher temperatures. We tested a dual-brick layout
(two separate monoliths) and a dual-layer layout (a single
monolith with two sandwiched catalyst layers).
2 Materials and Methods
Ag/Al2O3 catalyst (4 wt% Ag) was prepared by incipient
wetness impregnation of AgNO3 (99.8 % purity) of pre-
calcined (500 �C) Topsøe boehmite-alumina. A commer-
cial Fe-BEA (1 wt% Fe) was used as the high-temperature
catalyst. The catalysts were washcoated onto cordierite
monoliths (400 cpsi) to give the desired total loads of
catalysts of 120–140 g/l. After washcoating, the monoliths
were dried and calcined at 500 �C for 2 h. In the case of the
two-layer washcoat layout, the Ag/Al2O3:Fe-BEA ratio
was 1:0.9–1 based on mass.
The catalyst activity was tested in a stainless-steel
tubular flow reactor (id = 22 mm). The tested monoliths
had a diameter of 2.1 cm and a height of 2 or 1 cm (dual-
brick layout) to get the same shape and total volume for all
tested layouts. The monoliths were wrapped in a thick layer
of quartz wool to avoid gas slip between the reactor wall
and the catalyst. The feed gas was pre-heated in the oven in
a 160-cm-long capillary. A deNOx feed of 250 ppm NO,
275 ppm NH3, 600, 250 or 0 ppm H2, 12 % O2, 6 % H2O
and balance N2 was used for activity testing. Technical air
was used after purification with a Parker K-MT 3 LAB
adsorption dryer. The gases were controlled by UNIT
Celerity mass flow controllers, and water was fed by a
syringe pump (ISCO 100 DM) through a heated capillary.
The total flow was 1,730 Nml/min giving a GHSV
of *15,000 h-1 based on the monolith volume. During
activity testing, the samples were heated to 400 �C and
held there for 60 min before stepwise decrease to 150 �C.
NOx and ammonia concentrations were allowed to stabilize
at each step. Outlet gases were analyzed using a Thermo
Fisher Nicolet 6700 FTIR analyzer, equipped with a 2-m
gas cell. All gas capillaries and the FTIR gas cell were
heated to [130 �C to avoid condensation of water and
formation of ammonium nitrate. NOx conversion was cal-
culated as ðcNOx;IN � cNOx;OUTÞ=cNOx;IN, where NOx is the
sum of NO, NO2 and N2O.
Scanning electron microscope (SEM) image was
acquired on a Philips XL30 ESEM-FEG. The sample was
mounted in epoxy and ground to reveal the cross section.
3 Results and Discussion
3.1 Comparison of Layouts
Figure 1 shows the four different layouts tested; dual-brick
with either Fe-BEA or Ag/Al2O3 as upstream monolith
(dual-brick-Fe and -Ag) and dual layer with either Fe-BEA
or Ag/Al2O3 as the outer layer (dual-layer-Fe and -Ag). In
addition, single monoliths with Ag/Al2O3 (Ag-only) or
Fe-BEA (Fe-only) were tested. Figure 2 shows the tem-
perature dependency of NOx conversion for the tested
monoliths. The best performance was achieved by dual-
layer-Ag, dual-brick-Ag and Ag-only; the performance was
comparable for these three up to *350 �C. Dual-layer-Fe
and dual-brick-Fe showed much lower NOx conversions,
comparable with Fe-only, dual-layer-Fe showed a small
advantage over Fe-only at temperatures above *250 �C.
One thing worth noting from Fig. 2 is the relatively low
maximum NOx conversion of Fe-only (0.8); it would be
expected to reach closer to 1 at the highest temperatures
tested in this study. Since sufficient time was allowed to
saturate the Fe-BEA at each temperature tested, NH3
storage [14] could be ruled out. Excess amount of NH3 in
the feed gas may inhibit the activity of Fe-BEA. With an
NO:NH3 ratio of 1:1.1 in the tests, this might explain the
somewhat lower than expected maximum NOx conversion
of Fe-BEA.
NH3 conversion for Ag-only followed the NOx conver-
sion closely, meaning that the unreacted NH3 and NOx
Ag/Al2O3
Fe-BEA
Monolith channel wall
FlowFlow
Flow
Ag/Al2O3
Fe-BEA
Monolith channel wall
Ag/Al2O3
Fe-BEA
Monolith channel wall
FlowFlow
(a) (b)
(d)
(c)
Flow
Fig. 1 The different monolith layouts tested a dual-brick-Fe, b dual-
brick-Ag, c dual-layer-Fe and d dual-layer-Ag
Top Catal
123
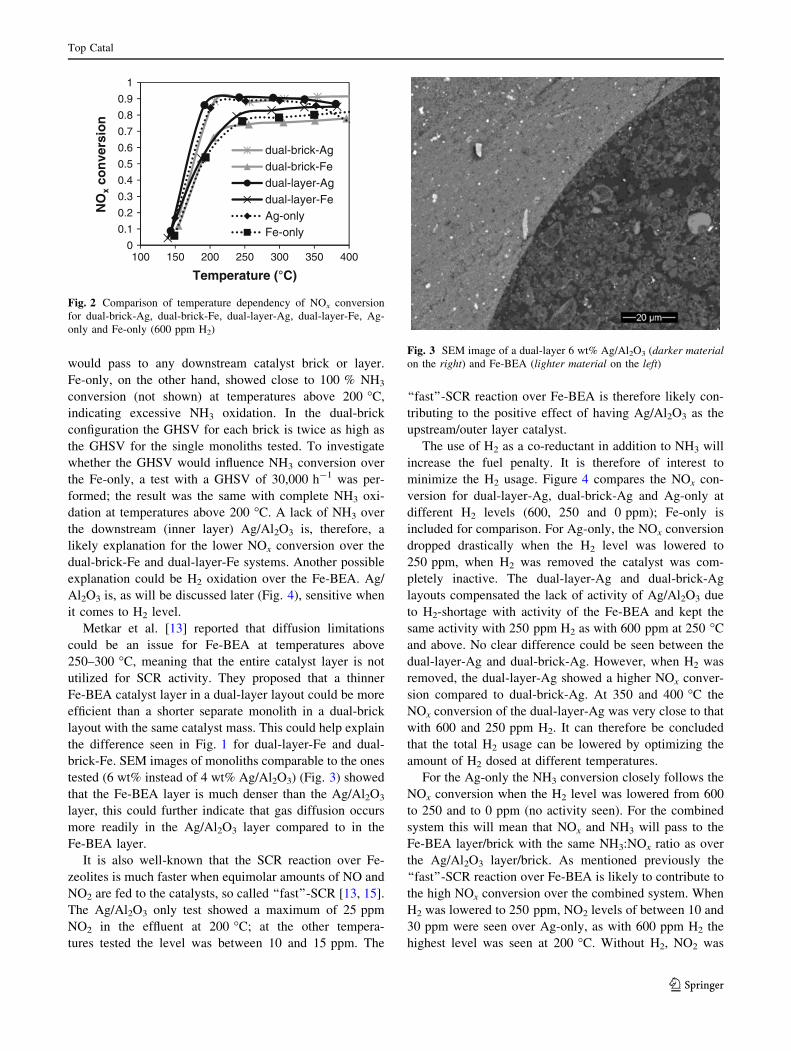
would pass to any downstream catalyst brick or layer.
Fe-only, on the other hand, showed close to 100 % NH3
conversion (not shown) at temperatures above 200 �C,
indicating excessive NH3 oxidation. In the dual-brick
configuration the GHSV for each brick is twice as high as
the GHSV for the single monoliths tested. To investigate
whether the GHSV would influence NH3 conversion over
the Fe-only, a test with a GHSV of 30,000 h-1 was per-
formed; the result was the same with complete NH3 oxi-
dation at temperatures above 200 �C. A lack of NH3 over
the downstream (inner layer) Ag/Al2O3 is, therefore, a
likely explanation for the lower NOx conversion over the
dual-brick-Fe and dual-layer-Fe systems. Another possible
explanation could be H2 oxidation over the Fe-BEA. Ag/
Al2O3 is, as will be discussed later (Fig. 4), sensitive when
it comes to H2 level.
Metkar et al. [13] reported that diffusion limitations
could be an issue for Fe-BEA at temperatures above
250–300 �C, meaning that the entire catalyst layer is not
utilized for SCR activity. They proposed that a thinner
Fe-BEA catalyst layer in a dual-layer layout could be more
efficient than a shorter separate monolith in a dual-brick
layout with the same catalyst mass. This could help explain
the difference seen in Fig. 1 for dual-layer-Fe and dual-
brick-Fe. SEM images of monoliths comparable to the ones
tested (6 wt% instead of 4 wt% Ag/Al2O3) (Fig. 3) showed
that the Fe-BEA layer is much denser than the Ag/Al2O3
layer, this could further indicate that gas diffusion occurs
more readily in the Ag/Al2O3 layer compared to in the
Fe-BEA layer.
It is also well-known that the SCR reaction over Fe-
zeolites is much faster when equimolar amounts of NO and
NO2 are fed to the catalysts, so called ‘‘fast’’-SCR [13, 15].
The Ag/Al2O3 only test showed a maximum of 25 ppm
NO2 in the effluent at 200 �C; at the other tempera-
tures tested the level was between 10 and 15 ppm. The
‘‘fast’’-SCR reaction over Fe-BEA is therefore likely con-
tributing to the positive effect of having Ag/Al2O3 as the
upstream/outer layer catalyst.
The use of H2 as a co-reductant in addition to NH3 will
increase the fuel penalty. It is therefore of interest to
minimize the H2 usage. Figure 4 compares the NOx con-
version for dual-layer-Ag, dual-brick-Ag and Ag-only at
different H2 levels (600, 250 and 0 ppm); Fe-only is
included for comparison. For Ag-only, the NOx conversion
dropped drastically when the H2 level was lowered to
250 ppm, when H2 was removed the catalyst was com-
pletely inactive. The dual-layer-Ag and dual-brick-Ag
layouts compensated the lack of activity of Ag/Al2O3 due
to H2-shortage with activity of the Fe-BEA and kept the
same activity with 250 ppm H2 as with 600 ppm at 250 �C
and above. No clear difference could be seen between the
dual-layer-Ag and dual-brick-Ag. However, when H2 was
removed, the dual-layer-Ag showed a higher NOx conver-
sion compared to dual-brick-Ag. At 350 and 400 �C the
NOx conversion of the dual-layer-Ag was very close to that
with 600 and 250 ppm H2. It can therefore be concluded
that the total H2 usage can be lowered by optimizing the
amount of H2 dosed at different temperatures.
For the Ag-only the NH3 conversion closely follows the
NOx conversion when the H2 level was lowered from 600
to 250 and to 0 ppm (no activity seen). For the combined
system this will mean that NOx and NH3 will pass to the
Fe-BEA layer/brick with the same NH3:NOx ratio as over
the Ag/Al2O3 layer/brick. As mentioned previously the
‘‘fast’’-SCR reaction over Fe-BEA is likely to contribute to
the high NOx conversion over the combined system. When
H2 was lowered to 250 ppm, NO2 levels of between 10 and
30 ppm were seen over Ag-only, as with 600 ppm H2 the
highest level was seen at 200 �C. Without H2, NO2 was
0
0.1
0.2
0.3
0.4
0.5
0.6
0.7
0.8
0.9
1
100 150 200 250 300 350 400
NO
xco
nve
rsio
n
Temperature (°C)
dual-brick-Agdual-brick-Fedual-layer-Agdual-layer-FeAg-onlyFe-only
Fig. 2 Comparison of temperature dependency of NOx conversion
for dual-brick-Ag, dual-brick-Fe, dual-layer-Ag, dual-layer-Fe, Ag-
only and Fe-only (600 ppm H2)
Fig. 3 SEM image of a dual-layer 6 wt% Ag/Al2O3 (darker materialon the right) and Fe-BEA (lighter material on the left)
Top Catal
123
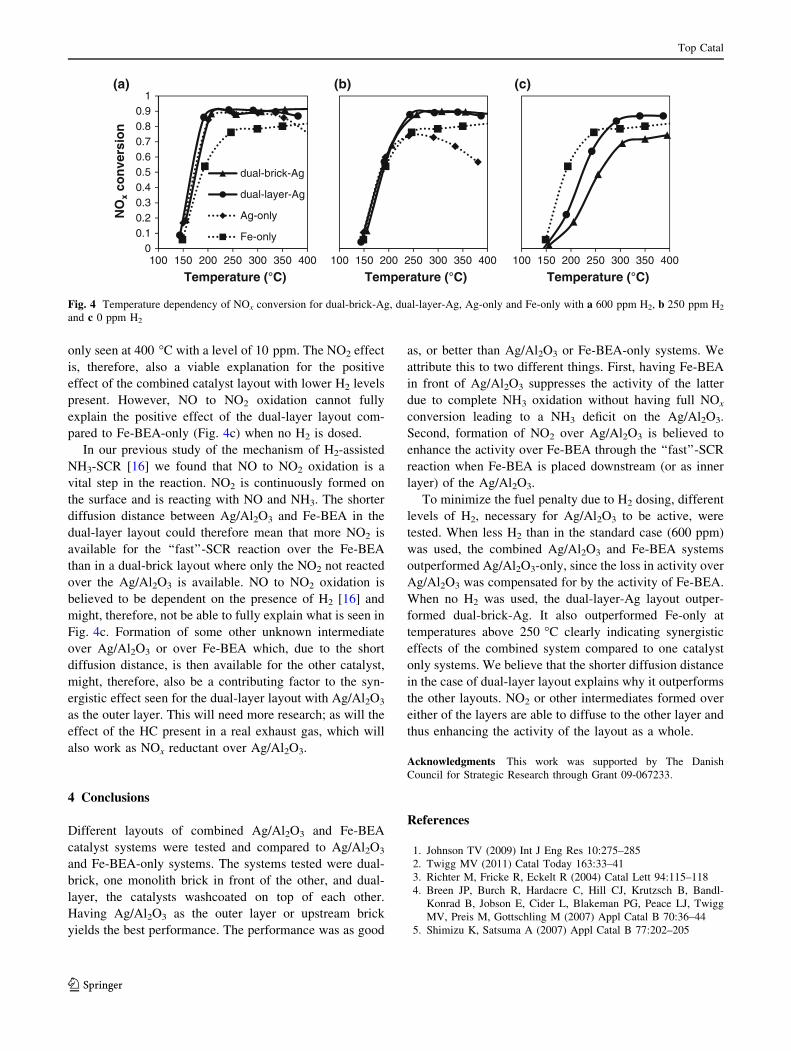
only seen at 400 �C with a level of 10 ppm. The NO2 effect
is, therefore, also a viable explanation for the positive
effect of the combined catalyst layout with lower H2 levels
present. However, NO to NO2 oxidation cannot fully
explain the positive effect of the dual-layer layout com-
pared to Fe-BEA-only (Fig. 4c) when no H2 is dosed.
In our previous study of the mechanism of H2-assisted
NH3-SCR [16] we found that NO to NO2 oxidation is a
vital step in the reaction. NO2 is continuously formed on
the surface and is reacting with NO and NH3. The shorter
diffusion distance between Ag/Al2O3 and Fe-BEA in the
dual-layer layout could therefore mean that more NO2 is
available for the ‘‘fast’’-SCR reaction over the Fe-BEA
than in a dual-brick layout where only the NO2 not reacted
over the Ag/Al2O3 is available. NO to NO2 oxidation is
believed to be dependent on the presence of H2 [16] and
might, therefore, not be able to fully explain what is seen in
Fig. 4c. Formation of some other unknown intermediate
over Ag/Al2O3 or over Fe-BEA which, due to the short
diffusion distance, is then available for the other catalyst,
might, therefore, also be a contributing factor to the syn-
ergistic effect seen for the dual-layer layout with Ag/Al2O3
as the outer layer. This will need more research; as will the
effect of the HC present in a real exhaust gas, which will
also work as NOx reductant over Ag/Al2O3.
4 Conclusions
Different layouts of combined Ag/Al2O3 and Fe-BEA
catalyst systems were tested and compared to Ag/Al2O3
and Fe-BEA-only systems. The systems tested were dual-
brick, one monolith brick in front of the other, and dual-
layer, the catalysts washcoated on top of each other.
Having Ag/Al2O3 as the outer layer or upstream brick
yields the best performance. The performance was as good
as, or better than Ag/Al2O3 or Fe-BEA-only systems. We
attribute this to two different things. First, having Fe-BEA
in front of Ag/Al2O3 suppresses the activity of the latter
due to complete NH3 oxidation without having full NOx
conversion leading to a NH3 deficit on the Ag/Al2O3.
Second, formation of NO2 over Ag/Al2O3 is believed to
enhance the activity over Fe-BEA through the ‘‘fast’’-SCR
reaction when Fe-BEA is placed downstream (or as inner
layer) of the Ag/Al2O3.
To minimize the fuel penalty due to H2 dosing, different
levels of H2, necessary for Ag/Al2O3 to be active, were
tested. When less H2 than in the standard case (600 ppm)
was used, the combined Ag/Al2O3 and Fe-BEA systems
outperformed Ag/Al2O3-only, since the loss in activity over
Ag/Al2O3 was compensated for by the activity of Fe-BEA.
When no H2 was used, the dual-layer-Ag layout outper-
formed dual-brick-Ag. It also outperformed Fe-only at
temperatures above 250 �C clearly indicating synergistic
effects of the combined system compared to one catalyst
only systems. We believe that the shorter diffusion distance
in the case of dual-layer layout explains why it outperforms
the other layouts. NO2 or other intermediates formed over
either of the layers are able to diffuse to the other layer and
thus enhancing the activity of the layout as a whole.
Acknowledgments This work was supported by The Danish
Council for Strategic Research through Grant 09-067233.
References
1. Johnson TV (2009) Int J Eng Res 10:275–285
2. Twigg MV (2011) Catal Today 163:33–41
3. Richter M, Fricke R, Eckelt R (2004) Catal Lett 94:115–118
4. Breen JP, Burch R, Hardacre C, Hill CJ, Krutzsch B, Bandl-
Konrad B, Jobson E, Cider L, Blakeman PG, Peace LJ, Twigg
MV, Preis M, Gottschling M (2007) Appl Catal B 70:36–44
5. Shimizu K, Satsuma A (2007) Appl Catal B 77:202–205
100 150 200 250 300 350 400
Temperature (°C)
(c)
100 150 200 250 300 350 400
Temperature (°C)
(b)
00.10.20.30.40.50.60.70.80.9
1
100 150 200 250 300 350 400
NO
xco
nve
rsio
n
Temperature (°C)
dual-brick-Ag
dual-layer-Ag
Ag-only
Fe-only
(a)
Fig. 4 Temperature dependency of NOx conversion for dual-brick-Ag, dual-layer-Ag, Ag-only and Fe-only with a 600 ppm H2, b 250 ppm H2
and c 0 ppm H2
Top Catal
123

6. Fogel S, Doronkin DE, Gabrielsson P, Dahl S (2012) Appl Catal
B 125:457–464
7. Costa CN, Efstathiou AM (2007) Appl Catal B 72:240–252
8. Leicht M, Schott FJP, Bruns M, Kureti S (2012) Appl Catal B
117–118:275–282
9. Balle P, Geiger B, Klukowski D, Pignatelli M, Wohnrau S,
Menzel M, Zirkwa I, Brunklaus G, Kureti S (2009) Appl Catal B
91:587–595
10. Balle P, Geiger B, Kureti S (2009) Appl Catal B 85:109–119
11. He C, Wang Y, Cheng Y, Lambert CK, Yang RT (2009) Appl
Catal A 368:121–126
12. Silver RG, Stefanick MO, Todd BI (2008) Catal Today
136:28–33
13. Metkar PS, Harold MP, Balakotaiah V (2011) Appl Catal B
111–112:67–80
14. Lindholm A, Sjovall H, Olsson L (2010) Appl Catal B
98:112–121
15. Grossale A, Nova I, Tronconi E (2008) Catal Today 136:18–27
16. Doronkin DE, Fogel S, Tamm S, Olsson L, Khan TS, Bligaard T,
Gabrielsson P, Dahl S (2011) Appl Catal B 113–114:228–236
Top Catal
123

Paper III
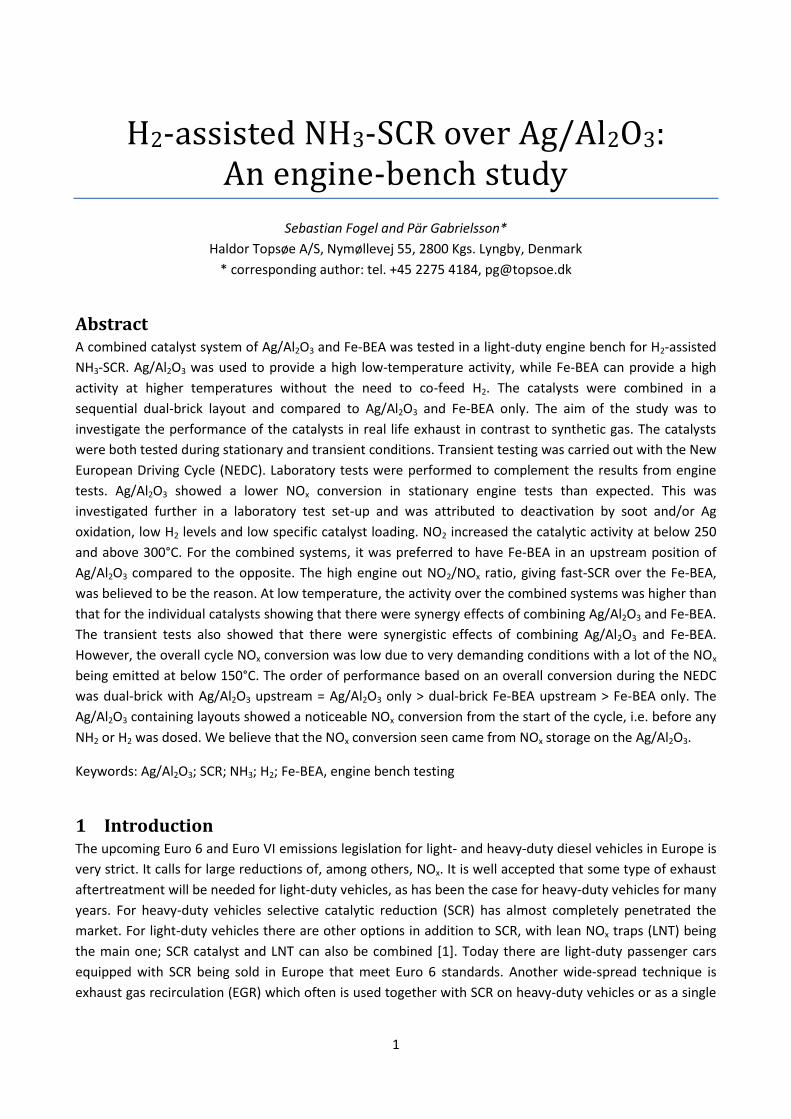
1
H2-assisted NH3-SCR over Ag/Al2O3: An engine-bench study
Sebastian Fogel and Pär Gabrielsson*
Haldor Topsøe A/S, Nymøllevej 55, 2800 Kgs. Lyngby, Denmark
* corresponding author: tel. +45 2275 4184, [email protected]
Abstract A combined catalyst system of Ag/Al2O3 and Fe-BEA was tested in a light-duty engine bench for H2-assisted
NH3-SCR. Ag/Al2O3 was used to provide a high low-temperature activity, while Fe-BEA can provide a high
activity at higher temperatures without the need to co-feed H2. The catalysts were combined in a
sequential dual-brick layout and compared to Ag/Al2O3 and Fe-BEA only. The aim of the study was to
investigate the performance of the catalysts in real life exhaust in contrast to synthetic gas. The catalysts
were both tested during stationary and transient conditions. Transient testing was carried out with the New
European Driving Cycle (NEDC). Laboratory tests were performed to complement the results from engine
tests. Ag/Al2O3 showed a lower NOx conversion in stationary engine tests than expected. This was
investigated further in a laboratory test set-up and was attributed to deactivation by soot and/or Ag
oxidation, low H2 levels and low specific catalyst loading. NO2 increased the catalytic activity at below 250
and above 300°C. For the combined systems, it was preferred to have Fe-BEA in an upstream position of
Ag/Al2O3 compared to the opposite. The high engine out NO2/NOx ratio, giving fast-SCR over the Fe-BEA,
was believed to be the reason. At low temperature, the activity over the combined systems was higher than
that for the individual catalysts showing that there were synergy effects of combining Ag/Al2O3 and Fe-BEA.
The transient tests also showed that there were synergistic effects of combining Ag/Al2O3 and Fe-BEA.
However, the overall cycle NOx conversion was low due to very demanding conditions with a lot of the NOx
being emitted at below 150°C. The order of performance based on an overall conversion during the NEDC
was dual-brick with Ag/Al2O3 upstream = Ag/Al2O3 only > dual-brick Fe-BEA upstream > Fe-BEA only. The
Ag/Al2O3 containing layouts showed a noticeable NOx conversion from the start of the cycle, i.e. before any
NH2 or H2 was dosed. We believe that the NOx conversion seen came from NOx storage on the Ag/Al2O3.
Keywords: Ag/Al2O3; SCR; NH3; H2; Fe-BEA, engine bench testing
1 Introduction The upcoming Euro 6 and Euro VI emissions legislation for light- and heavy-duty diesel vehicles in Europe is
very strict. It calls for large reductions of, among others, NOx. It is well accepted that some type of exhaust
aftertreatment will be needed for light-duty vehicles, as has been the case for heavy-duty vehicles for many
years. For heavy-duty vehicles selective catalytic reduction (SCR) has almost completely penetrated the
market. For light-duty vehicles there are other options in addition to SCR, with lean NOx traps (LNT) being
the main one; SCR catalyst and LNT can also be combined [1]. Today there are light-duty passenger cars
equipped with SCR being sold in Europe that meet Euro 6 standards. Another wide-spread technique is
exhaust gas recirculation (EGR) which often is used together with SCR on heavy-duty vehicles or as a single
2
measure to reach present NOx legislation (Euro 5) on light-duty vehicles. EGR lowers the oxygen
concentration and temperature in the engine cylinder which reduces NOx formation [2].
The main challenge for the NOx removal both for light- and heavy-duty vehicles is the low-temperature
activity (<200-250oC). Today’s SCR catalysts, e.g. vanadia-based and Fe-zeolites, are efficient at higher
temperatures [3]. Cu-zeolite type catalysts have been reported to have very promising low-temperature
activity [4–6] ; chabazite or chabazite-like structures are especially interesting due to their excellent
hydrothermal stability [7–9]. Platinum group metal-based catalyst has also been proposed but suffers from
low selectivity to N2 and has a limited temperature window of operation since they oxidize the NH3 at
temperatures above 200°C [10], [11]. Ag/Al2O3 is a promising candidate that has been reported to have
high low-temperature activity, when H2 is co-fed with either hydrocarbons (HC) [12–14] or NH3 as the
reductant [15], [16]. We have previously investigated the mechanism [17], [18] and sulfur tolerance [19],
[20] of NH3-SCR with H2 over Ag/Al2O3 and showed a promising low-temperature activity and stability of the
catalyst. A large draw-back of NH3-SCR over Ag/Al2O3 is that the catalyst is inactive without H2 in contrast to
HC-SCR which is active from 250-300°C even without H2 [12–14]. Thus, we combined Ag/Al2O3 with Fe-BEA
in a previous study and showed that the amount of H2 needed can be reduced without sacrificing the
activity over the combined catalyst system [21]. Fe-BEA shows high activity from 250-300°C [5], [6], [22].
Since diesel exhaust contains a lot more compounds than are possible to include in simulated exhaust, the
catalyst system has to be tested under real conditions to fully evaluate the potential of it. Compounds, such
as unburned hydrocarbons, particulates, residues from engine lubricant oil and even traces of metal from
engine wear [23] could potentially affect the catalyst performance. There is a number of reports that test
Ag/Al2O3 in real diesel exhaust for HC-SCR [24–29]; to our knowledge, there are none using urea/NH3 as the
reductant. The reported NOx conversions were dependent on the type of HC species used, HC/NOx ratio,
GHSV and amount of H2 used.
In this study, we aim to investigate the performance of Ag/Al2O3, Fe-BEA and a combination of the two in
the exhaust of a light-duty engine mounted on an engine dynamometer for H2-assisted NH3-SCR. We tested
the catalysts both under stationary and transient conditions. Transient testing was made with the New
European Driving Cycle (NEDC). Laboratory tests were performed to complement results from the engine
tests.
2 Materials and method
2.1 Catalyst preparation Ag/Al2O3 catalyst (4 wt% Ag) was prepared by incipient wetness impregnation of Si-Al2O3 (Siralox 5/320,
courtesy of Sasol Germany) with AgNO3 (99.8% purity). The prepared catalyst was dried at room
temperature and at 100°C and later calcined at 500°C. The Fe-BEA was a commercial 1 wt% Fe catalyst. The
catalysts were washcoated onto cordierite monolith bricks (400 cpsi) to give the desired catalyst loading
(120-160 g/l). We used 5.6x5.0” (dxh) (2 l) bricks for engine testing and 4.9x7.6 cm (dxh) (0.14 ml) bricks for
laboratory tests. The catalyst bricks were dried at room temperature in flowing air and calcined at 500°C for
2 h after the washcoating. Core samples, 4.9x7.4 cm (dxh), were taken from the Ag/Al2O3 catalyst used in
the engine tests and were tested in the laboratory test set-up.
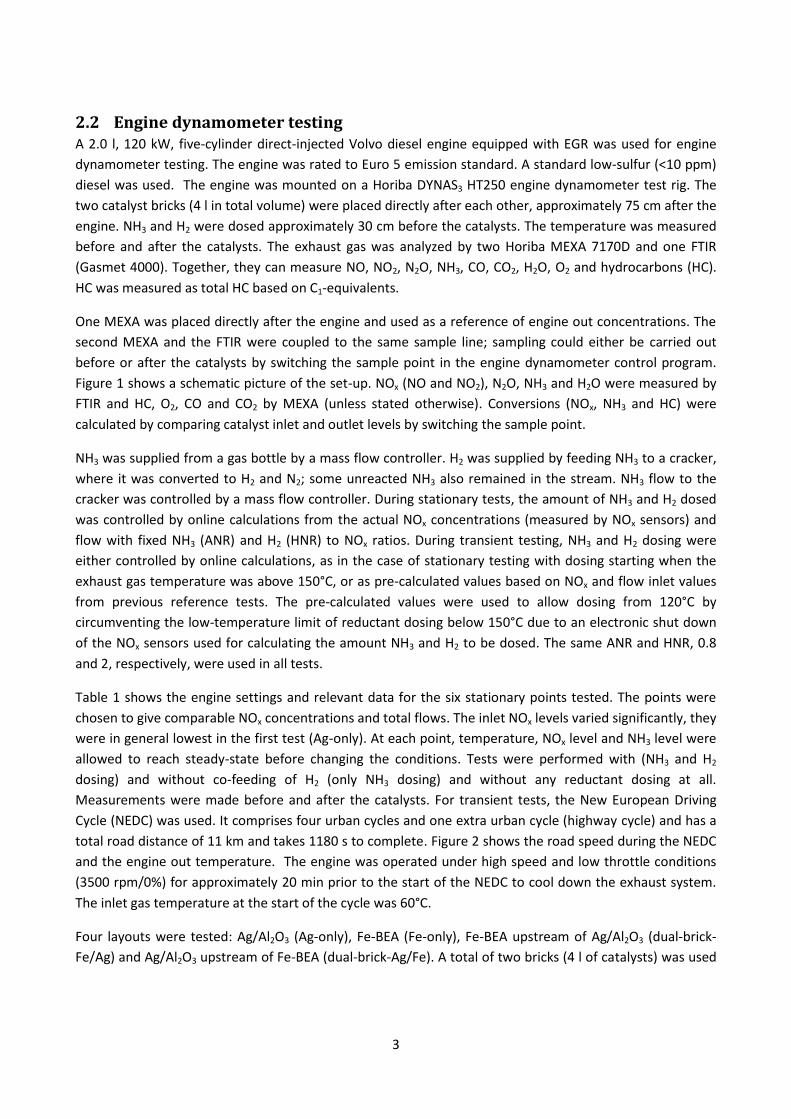
3
2.2 Engine dynamometer testing A 2.0 l, 120 kW, five-cylinder direct-injected Volvo diesel engine equipped with EGR was used for engine
dynamometer testing. The engine was rated to Euro 5 emission standard. A standard low-sulfur (<10 ppm)
diesel was used. The engine was mounted on a Horiba DYNAS3 HT250 engine dynamometer test rig. The
two catalyst bricks (4 l in total volume) were placed directly after each other, approximately 75 cm after the
engine. NH3 and H2 were dosed approximately 30 cm before the catalysts. The temperature was measured
before and after the catalysts. The exhaust gas was analyzed by two Horiba MEXA 7170D and one FTIR
(Gasmet 4000). Together, they can measure NO, NO2, N2O, NH3, CO, CO2, H2O, O2 and hydrocarbons (HC).
HC was measured as total HC based on C1-equivalents.
One MEXA was placed directly after the engine and used as a reference of engine out concentrations. The
second MEXA and the FTIR were coupled to the same sample line; sampling could either be carried out
before or after the catalysts by switching the sample point in the engine dynamometer control program.
Figure 1 shows a schematic picture of the set-up. NOx (NO and NO2), N2O, NH3 and H2O were measured by
FTIR and HC, O2, CO and CO2 by MEXA (unless stated otherwise). Conversions (NOx, NH3 and HC) were
calculated by comparing catalyst inlet and outlet levels by switching the sample point.
NH3 was supplied from a gas bottle by a mass flow controller. H2 was supplied by feeding NH3 to a cracker,
where it was converted to H2 and N2; some unreacted NH3 also remained in the stream. NH3 flow to the
cracker was controlled by a mass flow controller. During stationary tests, the amount of NH3 and H2 dosed
was controlled by online calculations from the actual NOx concentrations (measured by NOx sensors) and
flow with fixed NH3 (ANR) and H2 (HNR) to NOx ratios. During transient testing, NH3 and H2 dosing were
either controlled by online calculations, as in the case of stationary testing with dosing starting when the
exhaust gas temperature was above 150°C, or as pre-calculated values based on NOx and flow inlet values
from previous reference tests. The pre-calculated values were used to allow dosing from 120°C by
circumventing the low-temperature limit of reductant dosing below 150°C due to an electronic shut down
of the NOx sensors used for calculating the amount NH3 and H2 to be dosed. The same ANR and HNR, 0.8
and 2, respectively, were used in all tests.
Table 1 shows the engine settings and relevant data for the six stationary points tested. The points were
chosen to give comparable NOx concentrations and total flows. The inlet NOx levels varied significantly, they
were in general lowest in the first test (Ag-only). At each point, temperature, NOx level and NH3 level were
allowed to reach steady-state before changing the conditions. Tests were performed with (NH3 and H2
dosing) and without co-feeding of H2 (only NH3 dosing) and without any reductant dosing at all.
Measurements were made before and after the catalysts. For transient tests, the New European Driving
Cycle (NEDC) was used. It comprises four urban cycles and one extra urban cycle (highway cycle) and has a
total road distance of 11 km and takes 1180 s to complete. Figure 2 shows the road speed during the NEDC
and the engine out temperature. The engine was operated under high speed and low throttle conditions
(3500 rpm/0%) for approximately 20 min prior to the start of the NEDC to cool down the exhaust system.
The inlet gas temperature at the start of the cycle was 60°C.
Four layouts were tested: Ag/Al2O3 (Ag-only), Fe-BEA (Fe-only), Fe-BEA upstream of Ag/Al2O3 (dual-brick-
Fe/Ag) and Ag/Al2O3 upstream of Fe-BEA (dual-brick-Ag/Fe). A total of two bricks (4 l of catalysts) was used
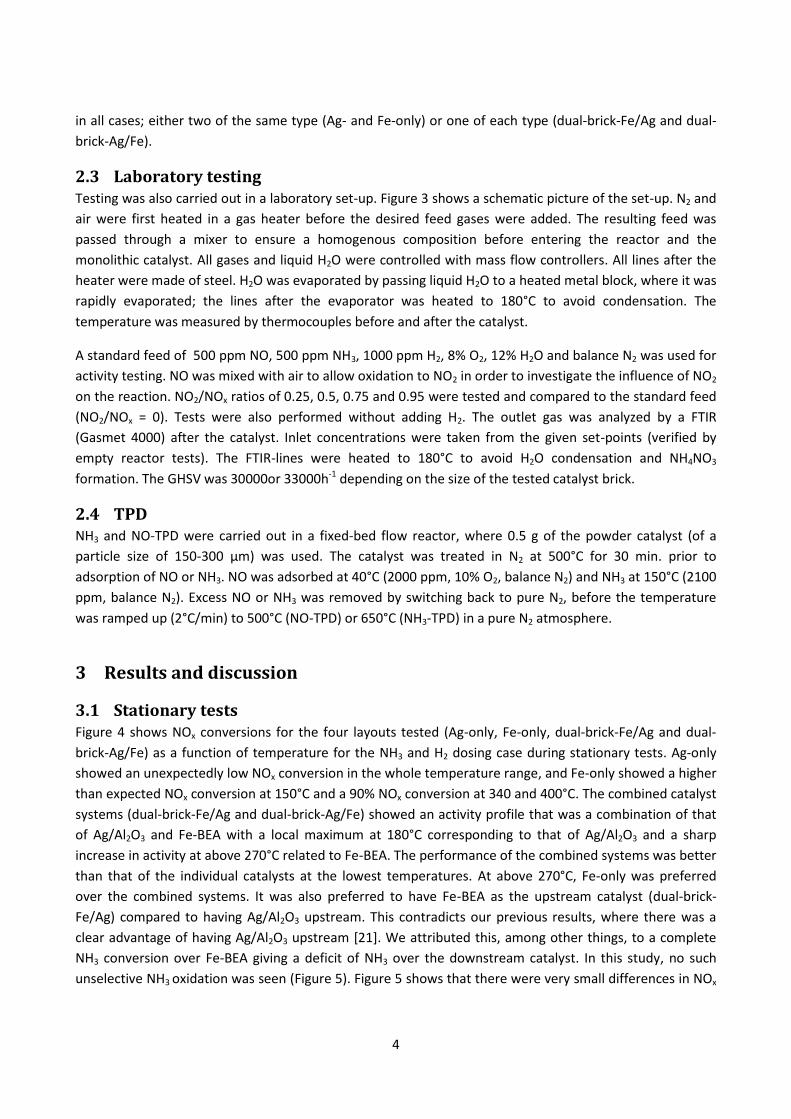
4
in all cases; either two of the same type (Ag- and Fe-only) or one of each type (dual-brick-Fe/Ag and dual-
brick-Ag/Fe).
2.3 Laboratory testing Testing was also carried out in a laboratory set-up. Figure 3 shows a schematic picture of the set-up. N2 and
air were first heated in a gas heater before the desired feed gases were added. The resulting feed was
passed through a mixer to ensure a homogenous composition before entering the reactor and the
monolithic catalyst. All gases and liquid H2O were controlled with mass flow controllers. All lines after the
heater were made of steel. H2O was evaporated by passing liquid H2O to a heated metal block, where it was
rapidly evaporated; the lines after the evaporator was heated to 180°C to avoid condensation. The
temperature was measured by thermocouples before and after the catalyst.
A standard feed of 500 ppm NO, 500 ppm NH3, 1000 ppm H2, 8% O2, 12% H2O and balance N2 was used for
activity testing. NO was mixed with air to allow oxidation to NO2 in order to investigate the influence of NO2
on the reaction. NO2/NOx ratios of 0.25, 0.5, 0.75 and 0.95 were tested and compared to the standard feed
(NO2/NOx = 0). Tests were also performed without adding H2. The outlet gas was analyzed by a FTIR
(Gasmet 4000) after the catalyst. Inlet concentrations were taken from the given set-points (verified by
empty reactor tests). The FTIR-lines were heated to 180°C to avoid H2O condensation and NH4NO3
formation. The GHSV was 30000or 33000h-1 depending on the size of the tested catalyst brick.
2.4 TPD NH3 and NO-TPD were carried out in a fixed-bed flow reactor, where 0.5 g of the powder catalyst (of a
particle size of 150-300 µm) was used. The catalyst was treated in N2 at 500°C for 30 min. prior to
adsorption of NO or NH3. NO was adsorbed at 40°C (2000 ppm, 10% O2, balance N2) and NH3 at 150°C (2100
ppm, balance N2). Excess NO or NH3 was removed by switching back to pure N2, before the temperature
was ramped up (2°C/min) to 500°C (NO-TPD) or 650°C (NH3-TPD) in a pure N2 atmosphere.
3 Results and discussion
3.1 Stationary tests Figure 4 shows NOx conversions for the four layouts tested (Ag-only, Fe-only, dual-brick-Fe/Ag and dual-
brick-Ag/Fe) as a function of temperature for the NH3 and H2 dosing case during stationary tests. Ag-only
showed an unexpectedly low NOx conversion in the whole temperature range, and Fe-only showed a higher
than expected NOx conversion at 150°C and a 90% NOx conversion at 340 and 400°C. The combined catalyst
systems (dual-brick-Fe/Ag and dual-brick-Ag/Fe) showed an activity profile that was a combination of that
of Ag/Al2O3 and Fe-BEA with a local maximum at 180°C corresponding to that of Ag/Al2O3 and a sharp
increase in activity at above 270°C related to Fe-BEA. The performance of the combined systems was better
than that of the individual catalysts at the lowest temperatures. At above 270°C, Fe-only was preferred
over the combined systems. It was also preferred to have Fe-BEA as the upstream catalyst (dual-brick-
Fe/Ag) compared to having Ag/Al2O3 upstream. This contradicts our previous results, where there was a
clear advantage of having Ag/Al2O3 upstream [21]. We attributed this, among other things, to a complete
NH3 conversion over Fe-BEA giving a deficit of NH3 over the downstream catalyst. In this study, no such
unselective NH3 oxidation was seen (Figure 5). Figure 5 shows that there were very small differences in NOx
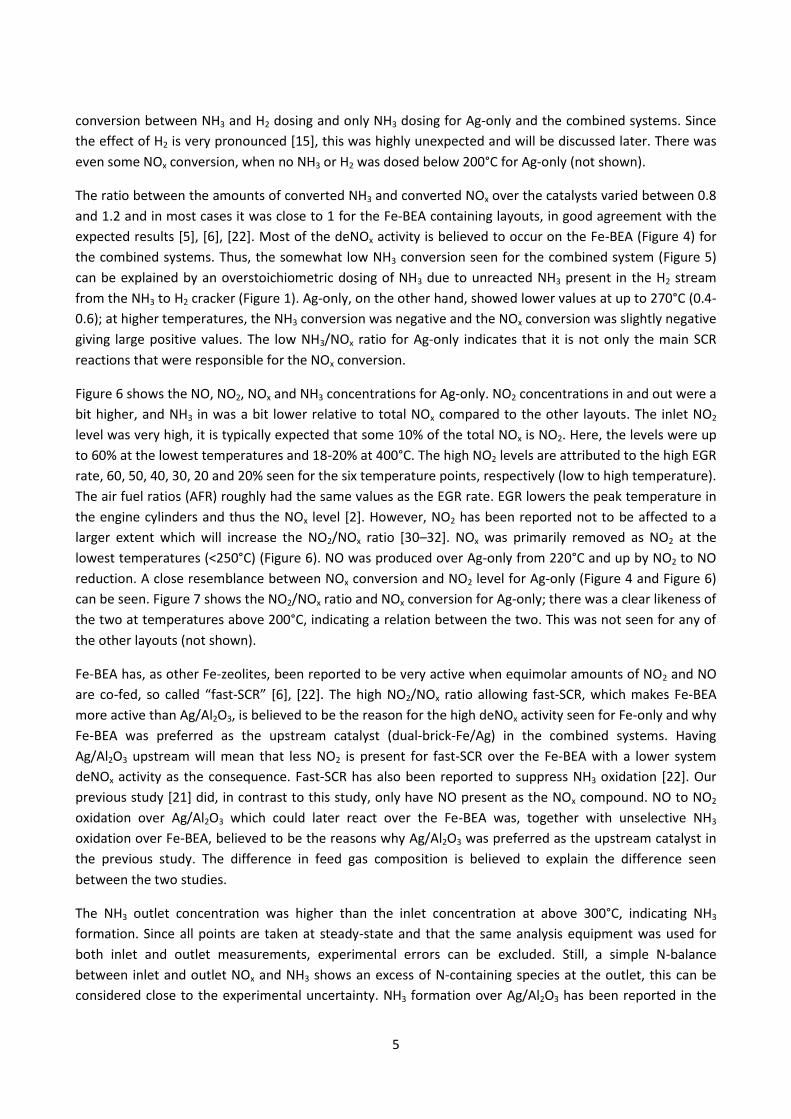
5
conversion between NH3 and H2 dosing and only NH3 dosing for Ag-only and the combined systems. Since
the effect of H2 is very pronounced [15], this was highly unexpected and will be discussed later. There was
even some NOx conversion, when no NH3 or H2 was dosed below 200°C for Ag-only (not shown).
The ratio between the amounts of converted NH3 and converted NOx over the catalysts varied between 0.8
and 1.2 and in most cases it was close to 1 for the Fe-BEA containing layouts, in good agreement with the
expected results [5], [6], [22]. Most of the deNOx activity is believed to occur on the Fe-BEA (Figure 4) for
the combined systems. Thus, the somewhat low NH3 conversion seen for the combined system (Figure 5)
can be explained by an overstoichiometric dosing of NH3 due to unreacted NH3 present in the H2 stream
from the NH3 to H2 cracker (Figure 1). Ag-only, on the other hand, showed lower values at up to 270°C (0.4-
0.6); at higher temperatures, the NH3 conversion was negative and the NOx conversion was slightly negative
giving large positive values. The low NH3/NOx ratio for Ag-only indicates that it is not only the main SCR
reactions that were responsible for the NOx conversion.
Figure 6 shows the NO, NO2, NOx and NH3 concentrations for Ag-only. NO2 concentrations in and out were a
bit higher, and NH3 in was a bit lower relative to total NOx compared to the other layouts. The inlet NO2
level was very high, it is typically expected that some 10% of the total NOx is NO2. Here, the levels were up
to 60% at the lowest temperatures and 18-20% at 400°C. The high NO2 levels are attributed to the high EGR
rate, 60, 50, 40, 30, 20 and 20% seen for the six temperature points, respectively (low to high temperature).
The air fuel ratios (AFR) roughly had the same values as the EGR rate. EGR lowers the peak temperature in
the engine cylinders and thus the NOx level [2]. However, NO2 has been reported not to be affected to a
larger extent which will increase the NO2/NOx ratio [30–32]. NOx was primarily removed as NO2 at the
lowest temperatures (<250°C) (Figure 6). NO was produced over Ag-only from 220°C and up by NO2 to NO
reduction. A close resemblance between NOx conversion and NO2 level for Ag-only (Figure 4 and Figure 6)
can be seen. Figure 7 shows the NO2/NOx ratio and NOx conversion for Ag-only; there was a clear likeness of
the two at temperatures above 200°C, indicating a relation between the two. This was not seen for any of
the other layouts (not shown).
Fe-BEA has, as other Fe-zeolites, been reported to be very active when equimolar amounts of NO2 and NO
are co-fed, so called “fast-SCR” [6], [22]. The high NO2/NOx ratio allowing fast-SCR, which makes Fe-BEA
more active than Ag/Al2O3, is believed to be the reason for the high deNOx activity seen for Fe-only and why
Fe-BEA was preferred as the upstream catalyst (dual-brick-Fe/Ag) in the combined systems. Having
Ag/Al2O3 upstream will mean that less NO2 is present for fast-SCR over the Fe-BEA with a lower system
deNOx activity as the consequence. Fast-SCR has also been reported to suppress NH3 oxidation [22]. Our
previous study [21] did, in contrast to this study, only have NO present as the NOx compound. NO to NO2
oxidation over Ag/Al2O3 which could later react over the Fe-BEA was, together with unselective NH3
oxidation over Fe-BEA, believed to be the reasons why Ag/Al2O3 was preferred as the upstream catalyst in
the previous study. The difference in feed gas composition is believed to explain the difference seen
between the two studies.
The NH3 outlet concentration was higher than the inlet concentration at above 300°C, indicating NH3
formation. Since all points are taken at steady-state and that the same analysis equipment was used for
both inlet and outlet measurements, experimental errors can be excluded. Still, a simple N-balance
between inlet and outlet NOx and NH3 shows an excess of N-containing species at the outlet, this can be
considered close to the experimental uncertainty. NH3 formation over Ag/Al2O3 has been reported in the
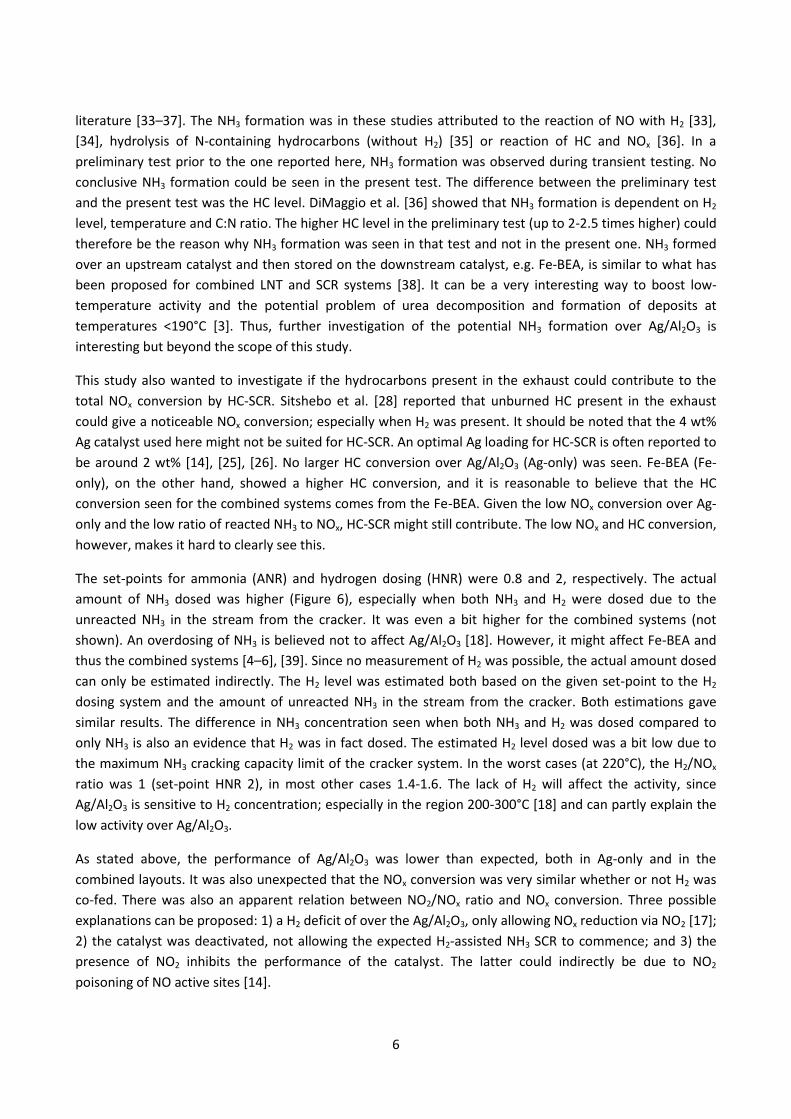
6
literature [33–37]. The NH3 formation was in these studies attributed to the reaction of NO with H2 [33],
[34], hydrolysis of N-containing hydrocarbons (without H2) [35] or reaction of HC and NOx [36]. In a
preliminary test prior to the one reported here, NH3 formation was observed during transient testing. No
conclusive NH3 formation could be seen in the present test. The difference between the preliminary test
and the present test was the HC level. DiMaggio et al. [36] showed that NH3 formation is dependent on H2
level, temperature and C:N ratio. The higher HC level in the preliminary test (up to 2-2.5 times higher) could
therefore be the reason why NH3 formation was seen in that test and not in the present one. NH3 formed
over an upstream catalyst and then stored on the downstream catalyst, e.g. Fe-BEA, is similar to what has
been proposed for combined LNT and SCR systems [38]. It can be a very interesting way to boost low-
temperature activity and the potential problem of urea decomposition and formation of deposits at
temperatures <190°C [3]. Thus, further investigation of the potential NH3 formation over Ag/Al2O3 is
interesting but beyond the scope of this study.
This study also wanted to investigate if the hydrocarbons present in the exhaust could contribute to the
total NOx conversion by HC-SCR. Sitshebo et al. [28] reported that unburned HC present in the exhaust
could give a noticeable NOx conversion; especially when H2 was present. It should be noted that the 4 wt%
Ag catalyst used here might not be suited for HC-SCR. An optimal Ag loading for HC-SCR is often reported to
be around 2 wt% [14], [25], [26]. No larger HC conversion over Ag/Al2O3 (Ag-only) was seen. Fe-BEA (Fe-
only), on the other hand, showed a higher HC conversion, and it is reasonable to believe that the HC
conversion seen for the combined systems comes from the Fe-BEA. Given the low NOx conversion over Ag-
only and the low ratio of reacted NH3 to NOx, HC-SCR might still contribute. The low NOx and HC conversion,
however, makes it hard to clearly see this.
The set-points for ammonia (ANR) and hydrogen dosing (HNR) were 0.8 and 2, respectively. The actual
amount of NH3 dosed was higher (Figure 6), especially when both NH3 and H2 were dosed due to the
unreacted NH3 in the stream from the cracker. It was even a bit higher for the combined systems (not
shown). An overdosing of NH3 is believed not to affect Ag/Al2O3 [18]. However, it might affect Fe-BEA and
thus the combined systems [4–6], [39]. Since no measurement of H2 was possible, the actual amount dosed
can only be estimated indirectly. The H2 level was estimated both based on the given set-point to the H2
dosing system and the amount of unreacted NH3 in the stream from the cracker. Both estimations gave
similar results. The difference in NH3 concentration seen when both NH3 and H2 was dosed compared to
only NH3 is also an evidence that H2 was in fact dosed. The estimated H2 level dosed was a bit low due to
the maximum NH3 cracking capacity limit of the cracker system. In the worst cases (at 220°C), the H2/NOx
ratio was 1 (set-point HNR 2), in most other cases 1.4-1.6. The lack of H2 will affect the activity, since
Ag/Al2O3 is sensitive to H2 concentration; especially in the region 200-300°C [18] and can partly explain the
low activity over Ag/Al2O3.
As stated above, the performance of Ag/Al2O3 was lower than expected, both in Ag-only and in the
combined layouts. It was also unexpected that the NOx conversion was very similar whether or not H2 was
co-fed. There was also an apparent relation between NO2/NOx ratio and NOx conversion. Three possible
explanations can be proposed: 1) a H2 deficit of over the Ag/Al2O3, only allowing NOx reduction via NO2 [17];
2) the catalyst was deactivated, not allowing the expected H2-assisted NH3 SCR to commence; and 3) the
presence of NO2 inhibits the performance of the catalyst. The latter could indirectly be due to NO2
poisoning of NO active sites [14].
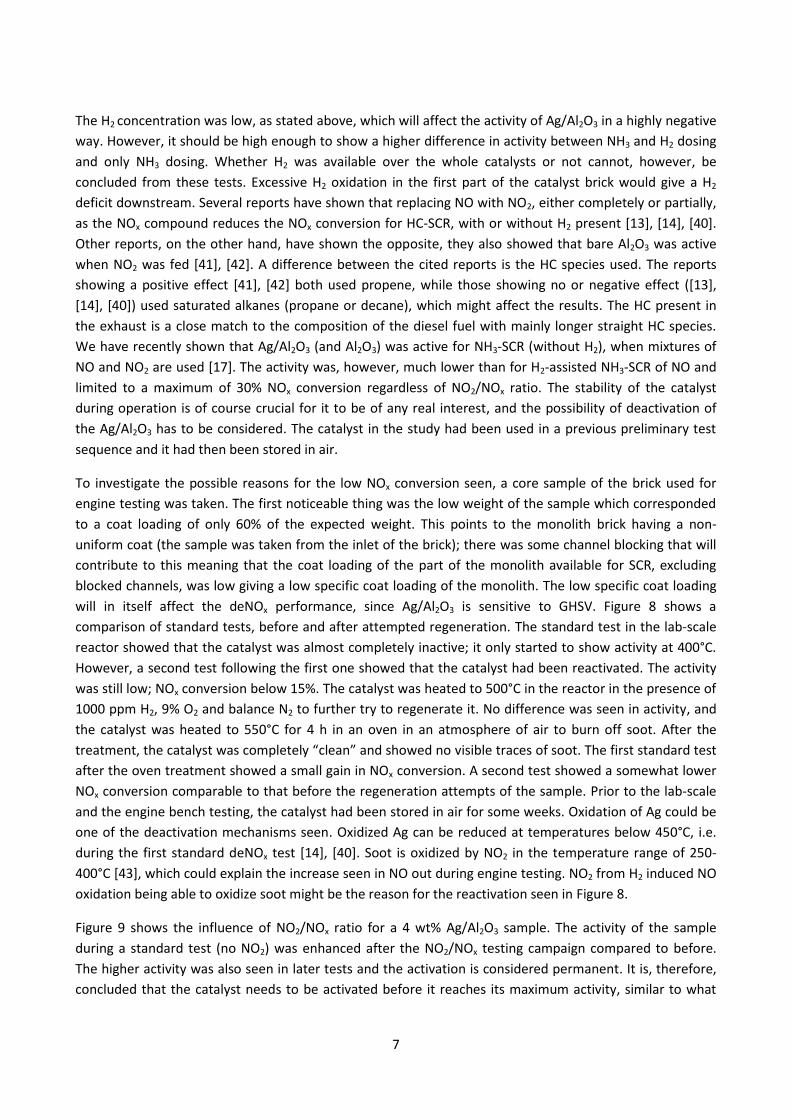
7
The H2 concentration was low, as stated above, which will affect the activity of Ag/Al2O3 in a highly negative
way. However, it should be high enough to show a higher difference in activity between NH3 and H2 dosing
and only NH3 dosing. Whether H2 was available over the whole catalysts or not cannot, however, be
concluded from these tests. Excessive H2 oxidation in the first part of the catalyst brick would give a H2
deficit downstream. Several reports have shown that replacing NO with NO2, either completely or partially,
as the NOx compound reduces the NOx conversion for HC-SCR, with or without H2 present [13], [14], [40].
Other reports, on the other hand, have shown the opposite, they also showed that bare Al2O3 was active
when NO2 was fed [41], [42]. A difference between the cited reports is the HC species used. The reports
showing a positive effect [41], [42] both used propene, while those showing no or negative effect ([13],
[14], [40]) used saturated alkanes (propane or decane), which might affect the results. The HC present in
the exhaust is a close match to the composition of the diesel fuel with mainly longer straight HC species.
We have recently shown that Ag/Al2O3 (and Al2O3) was active for NH3-SCR (without H2), when mixtures of
NO and NO2 are used [17]. The activity was, however, much lower than for H2-assisted NH3-SCR of NO and
limited to a maximum of 30% NOx conversion regardless of NO2/NOx ratio. The stability of the catalyst
during operation is of course crucial for it to be of any real interest, and the possibility of deactivation of
the Ag/Al2O3 has to be considered. The catalyst in the study had been used in a previous preliminary test
sequence and it had then been stored in air.
To investigate the possible reasons for the low NOx conversion seen, a core sample of the brick used for
engine testing was taken. The first noticeable thing was the low weight of the sample which corresponded
to a coat loading of only 60% of the expected weight. This points to the monolith brick having a non-
uniform coat (the sample was taken from the inlet of the brick); there was some channel blocking that will
contribute to this meaning that the coat loading of the part of the monolith available for SCR, excluding
blocked channels, was low giving a low specific coat loading of the monolith. The low specific coat loading
will in itself affect the deNOx performance, since Ag/Al2O3 is sensitive to GHSV. Figure 8 shows a
comparison of standard tests, before and after attempted regeneration. The standard test in the lab-scale
reactor showed that the catalyst was almost completely inactive; it only started to show activity at 400°C.
However, a second test following the first one showed that the catalyst had been reactivated. The activity
was still low; NOx conversion below 15%. The catalyst was heated to 500°C in the reactor in the presence of
1000 ppm H2, 9% O2 and balance N2 to further try to regenerate it. No difference was seen in activity, and
the catalyst was heated to 550°C for 4 h in an oven in an atmosphere of air to burn off soot. After the
treatment, the catalyst was completely “clean” and showed no visible traces of soot. The first standard test
after the oven treatment showed a small gain in NOx conversion. A second test showed a somewhat lower
NOx conversion comparable to that before the regeneration attempts of the sample. Prior to the lab-scale
and the engine bench testing, the catalyst had been stored in air for some weeks. Oxidation of Ag could be
one of the deactivation mechanisms seen. Oxidized Ag can be reduced at temperatures below 450°C, i.e.
during the first standard deNOx test [14], [40]. Soot is oxidized by NO2 in the temperature range of 250-
400°C [43], which could explain the increase seen in NO out during engine testing. NO2 from H2 induced NO
oxidation being able to oxidize soot might be the reason for the reactivation seen in Figure 8.
Figure 9 shows the influence of NO2/NOx ratio for a 4 wt% Ag/Al2O3 sample. The activity of the sample
during a standard test (no NO2) was enhanced after the NO2/NOx testing campaign compared to before.
The higher activity was also seen in later tests and the activation is considered permanent. It is, therefore,
concluded that the catalyst needs to be activated before it reaches its maximum activity, similar to what
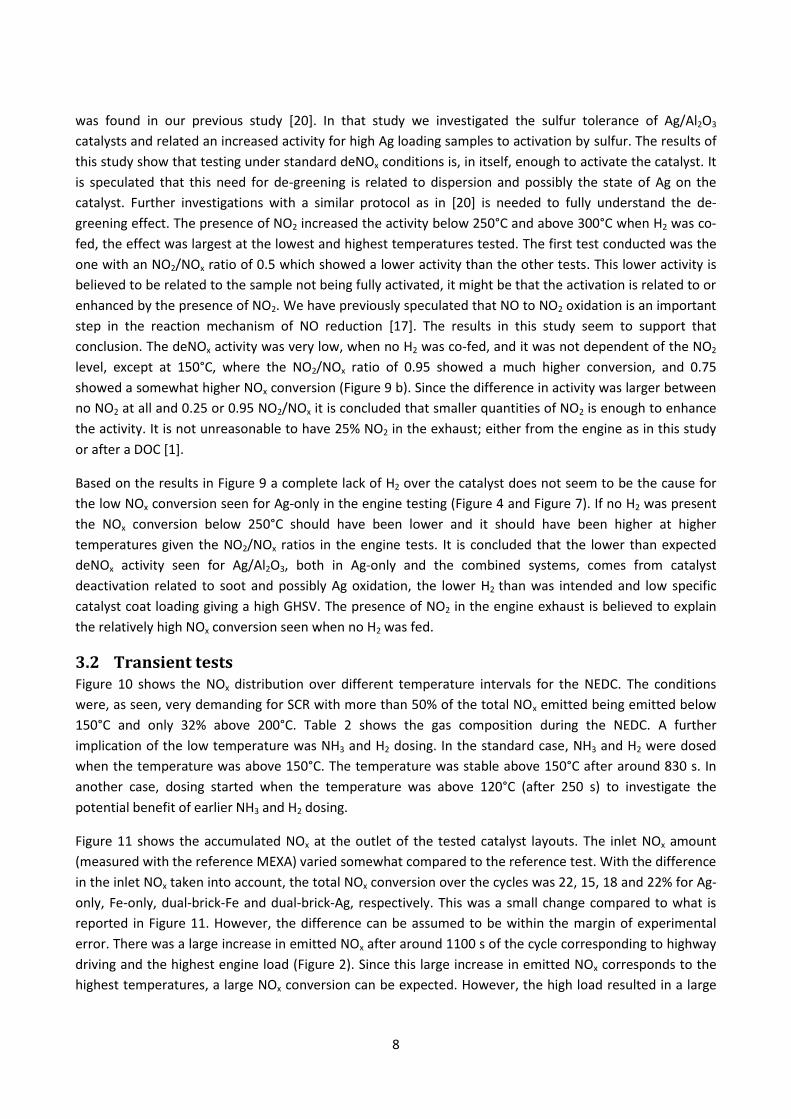
8
was found in our previous study [20]. In that study we investigated the sulfur tolerance of Ag/Al2O3
catalysts and related an increased activity for high Ag loading samples to activation by sulfur. The results of
this study show that testing under standard deNOx conditions is, in itself, enough to activate the catalyst. It
is speculated that this need for de-greening is related to dispersion and possibly the state of Ag on the
catalyst. Further investigations with a similar protocol as in [20] is needed to fully understand the de-
greening effect. The presence of NO2 increased the activity below 250°C and above 300°C when H2 was co-
fed, the effect was largest at the lowest and highest temperatures tested. The first test conducted was the
one with an NO2/NOx ratio of 0.5 which showed a lower activity than the other tests. This lower activity is
believed to be related to the sample not being fully activated, it might be that the activation is related to or
enhanced by the presence of NO2. We have previously speculated that NO to NO2 oxidation is an important
step in the reaction mechanism of NO reduction [17]. The results in this study seem to support that
conclusion. The deNOx activity was very low, when no H2 was co-fed, and it was not dependent of the NO2
level, except at 150°C, where the NO2/NOx ratio of 0.95 showed a much higher conversion, and 0.75
showed a somewhat higher NOx conversion (Figure 9 b). Since the difference in activity was larger between
no NO2 at all and 0.25 or 0.95 NO2/NOx it is concluded that smaller quantities of NO2 is enough to enhance
the activity. It is not unreasonable to have 25% NO2 in the exhaust; either from the engine as in this study
or after a DOC [1].
Based on the results in Figure 9 a complete lack of H2 over the catalyst does not seem to be the cause for
the low NOx conversion seen for Ag-only in the engine testing (Figure 4 and Figure 7). If no H2 was present
the NOx conversion below 250°C should have been lower and it should have been higher at higher
temperatures given the NO2/NOx ratios in the engine tests. It is concluded that the lower than expected
deNOx activity seen for Ag/Al2O3, both in Ag-only and the combined systems, comes from catalyst
deactivation related to soot and possibly Ag oxidation, the lower H2 than was intended and low specific
catalyst coat loading giving a high GHSV. The presence of NO2 in the engine exhaust is believed to explain
the relatively high NOx conversion seen when no H2 was fed.
3.2 Transient tests Figure 10 shows the NOx distribution over different temperature intervals for the NEDC. The conditions
were, as seen, very demanding for SCR with more than 50% of the total NOx emitted being emitted below
150°C and only 32% above 200°C. Table 2 shows the gas composition during the NEDC. A further
implication of the low temperature was NH3 and H2 dosing. In the standard case, NH3 and H2 were dosed
when the temperature was above 150°C. The temperature was stable above 150°C after around 830 s. In
another case, dosing started when the temperature was above 120°C (after 250 s) to investigate the
potential benefit of earlier NH3 and H2 dosing.
Figure 11 shows the accumulated NOx at the outlet of the tested catalyst layouts. The inlet NOx amount
(measured with the reference MEXA) varied somewhat compared to the reference test. With the difference
in the inlet NOx taken into account, the total NOx conversion over the cycles was 22, 15, 18 and 22% for Ag-
only, Fe-only, dual-brick-Fe and dual-brick-Ag, respectively. This was a small change compared to what is
reported in Figure 11. However, the difference can be assumed to be within the margin of experimental
error. There was a large increase in emitted NOx after around 1100 s of the cycle corresponding to highway
driving and the highest engine load (Figure 2). Since this large increase in emitted NOx corresponds to the
highest temperatures, a large NOx conversion can be expected. However, the high load resulted in a large
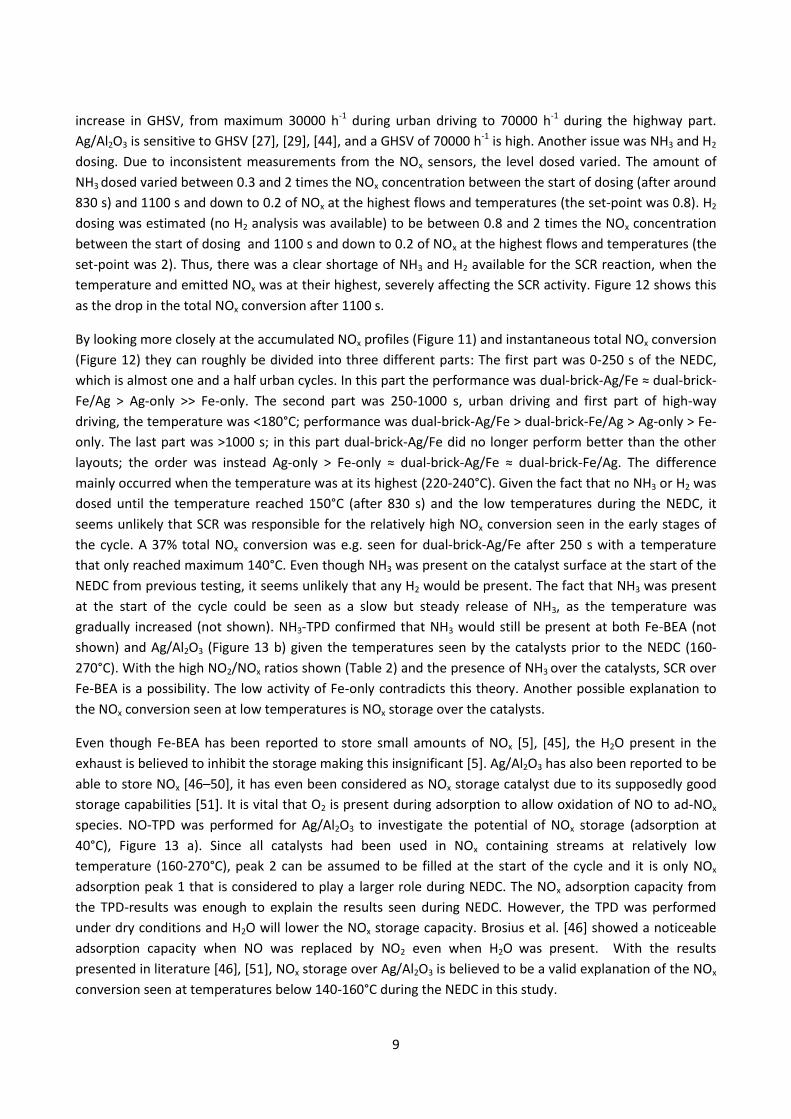
9
increase in GHSV, from maximum 30000 h-1 during urban driving to 70000 h-1 during the highway part.
Ag/Al2O3 is sensitive to GHSV [27], [29], [44], and a GHSV of 70000 h-1 is high. Another issue was NH3 and H2
dosing. Due to inconsistent measurements from the NOx sensors, the level dosed varied. The amount of
NH3 dosed varied between 0.3 and 2 times the NOx concentration between the start of dosing (after around
830 s) and 1100 s and down to 0.2 of NOx at the highest flows and temperatures (the set-point was 0.8). H2
dosing was estimated (no H2 analysis was available) to be between 0.8 and 2 times the NOx concentration
between the start of dosing and 1100 s and down to 0.2 of NOx at the highest flows and temperatures (the
set-point was 2). Thus, there was a clear shortage of NH3 and H2 available for the SCR reaction, when the
temperature and emitted NOx was at their highest, severely affecting the SCR activity. Figure 12 shows this
as the drop in the total NOx conversion after 1100 s.
By looking more closely at the accumulated NOx profiles (Figure 11) and instantaneous total NOx conversion
(Figure 12) they can roughly be divided into three different parts: The first part was 0-250 s of the NEDC,
which is almost one and a half urban cycles. In this part the performance was dual-brick-Ag/Fe ≈ dual-brick-
Fe/Ag > Ag-only >> Fe-only. The second part was 250-1000 s, urban driving and first part of high-way
driving, the temperature was <180°C; performance was dual-brick-Ag/Fe > dual-brick-Fe/Ag > Ag-only > Fe-
only. The last part was >1000 s; in this part dual-brick-Ag/Fe did no longer perform better than the other
layouts; the order was instead Ag-only > Fe-only ≈ dual-brick-Ag/Fe ≈ dual-brick-Fe/Ag. The difference
mainly occurred when the temperature was at its highest (220-240°C). Given the fact that no NH3 or H2 was
dosed until the temperature reached 150°C (after 830 s) and the low temperatures during the NEDC, it
seems unlikely that SCR was responsible for the relatively high NOx conversion seen in the early stages of
the cycle. A 37% total NOx conversion was e.g. seen for dual-brick-Ag/Fe after 250 s with a temperature
that only reached maximum 140°C. Even though NH3 was present on the catalyst surface at the start of the
NEDC from previous testing, it seems unlikely that any H2 would be present. The fact that NH3 was present
at the start of the cycle could be seen as a slow but steady release of NH3, as the temperature was
gradually increased (not shown). NH3-TPD confirmed that NH3 would still be present at both Fe-BEA (not
shown) and Ag/Al2O3 (Figure 13 b) given the temperatures seen by the catalysts prior to the NEDC (160-
270°C). With the high NO2/NOx ratios shown (Table 2) and the presence of NH3 over the catalysts, SCR over
Fe-BEA is a possibility. The low activity of Fe-only contradicts this theory. Another possible explanation to
the NOx conversion seen at low temperatures is NOx storage over the catalysts.
Even though Fe-BEA has been reported to store small amounts of NOx [5], [45], the H2O present in the
exhaust is believed to inhibit the storage making this insignificant [5]. Ag/Al2O3 has also been reported to be
able to store NOx [46–50], it has even been considered as NOx storage catalyst due to its supposedly good
storage capabilities [51]. It is vital that O2 is present during adsorption to allow oxidation of NO to ad-NOx
species. NO-TPD was performed for Ag/Al2O3 to investigate the potential of NOx storage (adsorption at
40°C), Figure 13 a). Since all catalysts had been used in NOx containing streams at relatively low
temperature (160-270°C), peak 2 can be assumed to be filled at the start of the cycle and it is only NOx
adsorption peak 1 that is considered to play a larger role during NEDC. The NOx adsorption capacity from
the TPD-results was enough to explain the results seen during NEDC. However, the TPD was performed
under dry conditions and H2O will lower the NOx storage capacity. Brosius et al. [46] showed a noticeable
adsorption capacity when NO was replaced by NO2 even when H2O was present. With the results
presented in literature [46], [51], NOx storage over Ag/Al2O3 is believed to be a valid explanation of the NOx
conversion seen at temperatures below 140-160°C during the NEDC in this study.
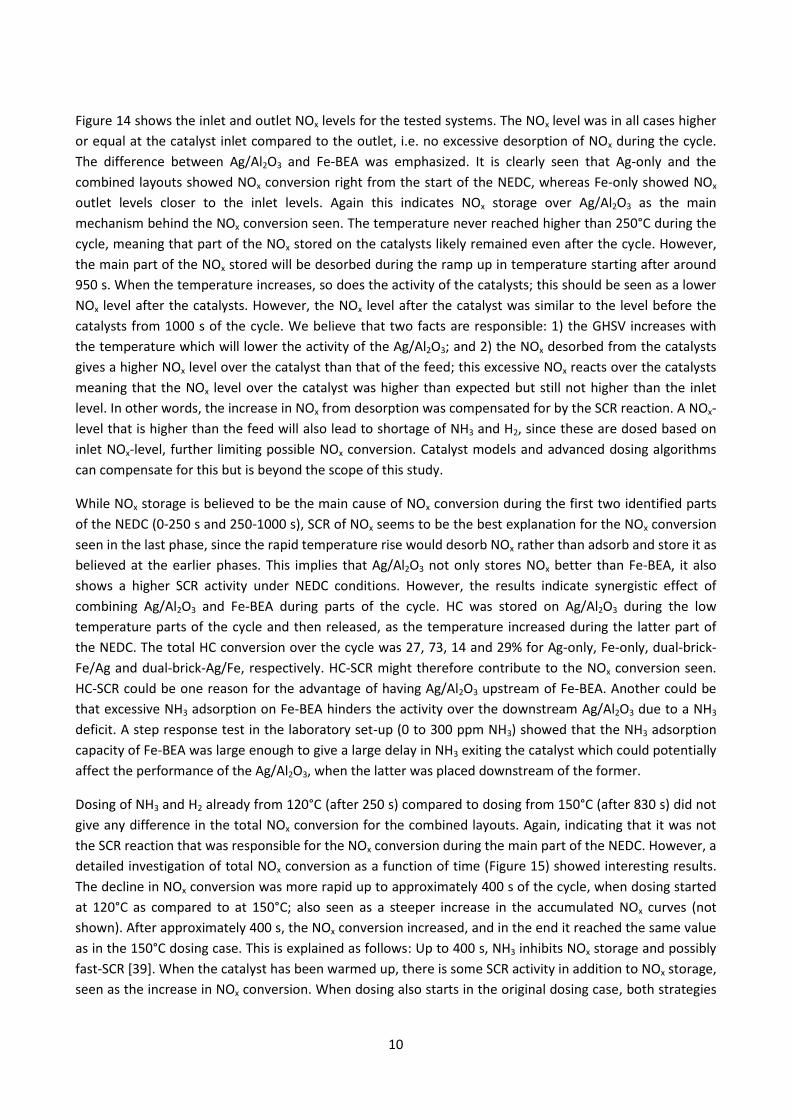
10
Figure 14 shows the inlet and outlet NOx levels for the tested systems. The NOx level was in all cases higher
or equal at the catalyst inlet compared to the outlet, i.e. no excessive desorption of NOx during the cycle.
The difference between Ag/Al2O3 and Fe-BEA was emphasized. It is clearly seen that Ag-only and the
combined layouts showed NOx conversion right from the start of the NEDC, whereas Fe-only showed NOx
outlet levels closer to the inlet levels. Again this indicates NOx storage over Ag/Al2O3 as the main
mechanism behind the NOx conversion seen. The temperature never reached higher than 250°C during the
cycle, meaning that part of the NOx stored on the catalysts likely remained even after the cycle. However,
the main part of the NOx stored will be desorbed during the ramp up in temperature starting after around
950 s. When the temperature increases, so does the activity of the catalysts; this should be seen as a lower
NOx level after the catalysts. However, the NOx level after the catalyst was similar to the level before the
catalysts from 1000 s of the cycle. We believe that two facts are responsible: 1) the GHSV increases with
the temperature which will lower the activity of the Ag/Al2O3; and 2) the NOx desorbed from the catalysts
gives a higher NOx level over the catalyst than that of the feed; this excessive NOx reacts over the catalysts
meaning that the NOx level over the catalyst was higher than expected but still not higher than the inlet
level. In other words, the increase in NOx from desorption was compensated for by the SCR reaction. A NOx-
level that is higher than the feed will also lead to shortage of NH3 and H2, since these are dosed based on
inlet NOx-level, further limiting possible NOx conversion. Catalyst models and advanced dosing algorithms
can compensate for this but is beyond the scope of this study.
While NOx storage is believed to be the main cause of NOx conversion during the first two identified parts
of the NEDC (0-250 s and 250-1000 s), SCR of NOx seems to be the best explanation for the NOx conversion
seen in the last phase, since the rapid temperature rise would desorb NOx rather than adsorb and store it as
believed at the earlier phases. This implies that Ag/Al2O3 not only stores NOx better than Fe-BEA, it also
shows a higher SCR activity under NEDC conditions. However, the results indicate synergistic effect of
combining Ag/Al2O3 and Fe-BEA during parts of the cycle. HC was stored on Ag/Al2O3 during the low
temperature parts of the cycle and then released, as the temperature increased during the latter part of
the NEDC. The total HC conversion over the cycle was 27, 73, 14 and 29% for Ag-only, Fe-only, dual-brick-
Fe/Ag and dual-brick-Ag/Fe, respectively. HC-SCR might therefore contribute to the NOx conversion seen.
HC-SCR could be one reason for the advantage of having Ag/Al2O3 upstream of Fe-BEA. Another could be
that excessive NH3 adsorption on Fe-BEA hinders the activity over the downstream Ag/Al2O3 due to a NH3
deficit. A step response test in the laboratory set-up (0 to 300 ppm NH3) showed that the NH3 adsorption
capacity of Fe-BEA was large enough to give a large delay in NH3 exiting the catalyst which could potentially
affect the performance of the Ag/Al2O3, when the latter was placed downstream of the former.
Dosing of NH3 and H2 already from 120°C (after 250 s) compared to dosing from 150°C (after 830 s) did not
give any difference in the total NOx conversion for the combined layouts. Again, indicating that it was not
the SCR reaction that was responsible for the NOx conversion during the main part of the NEDC. However, a
detailed investigation of total NOx conversion as a function of time (Figure 15) showed interesting results.
The decline in NOx conversion was more rapid up to approximately 400 s of the cycle, when dosing started
at 120°C as compared to at 150°C; also seen as a steeper increase in the accumulated NOx curves (not
shown). After approximately 400 s, the NOx conversion increased, and in the end it reached the same value
as in the 150°C dosing case. This is explained as follows: Up to 400 s, NH3 inhibits NOx storage and possibly
fast-SCR [39]. When the catalyst has been warmed up, there is some SCR activity in addition to NOx storage,
seen as the increase in NOx conversion. When dosing also starts in the original dosing case, both strategies
11
show the same NOx conversion. We believe that by optimizing the dosing further, the negative effect of
NH3 can be removed, and a higher total NOx conversion could be reached. It can thus be concluded that
there is some SCR activity even at temperatures down to 120°C.
4 Conclusions Stationary engine tests showed that a combination of Ag/Al2O3 and Fe-BEA gave the highest deNOx activity
below 270°C, while Fe-BEA only was preferred at higher temperatures. For the combined systems, it was
preferred to have Fe-BEA in an upstream position of Ag/Al2O3 compared to the opposite. The high engine
out NO2/NOx ratio giving fast-SCR over the Fe-BEA was believed to be the reason. At low temperatures, the
activity over the combined systems was higher than that of the individual catalysts showing that combining
Ag/Al2O3 and Fe-BEA gave synergy effects. Ag/Al2O3 showed an unexpectedly low activity which we
attribute to deactivation by soot and/or Ag oxidation, low H2 levels and low specific catalyst loading. Fresh
Ag/Al2O3 catalysts showed a high activity in laboratory scale tests. The catalyst was activated by subsequent
test runs pointing to the need to de-green the catalyst prior to using it. The mechanism and a more precise
de-greening protocol need to be investigated further. The catalytic activity below 250 and above 300°C was
enhanced by addition of NO2 as part of the NOx. An NO2 level of 25% was enough to give the enhancement;
increasing NO2 only showed a small effect.
Transient NEDC tests also showed synergistic effects when combining Ag/Al2O3 and Fe-BEA. However, the
overall cycle NOx conversion was low. It should be noted that the conditions for SCR were very tough during
the NEDC with 50% of the total emitted NOx being emitted below 150°C and only 32% above 200°C, which
severely affects the possibility for SCR. The order of performance based on overall conversion was dual-
brick-Ag/Fe = Ag-only > dual-brick-Fe/Ag > Fe-only. The performance varied during different parts of the
NEDC. The dual-brick layouts performed best at the lowest temperatures and before any NH3 or H2 was
dosed, and Ag-only performed best when the temperature was highest. The latter was related to a higher
SCR activity. The low overall NOx conversion seen is partly related to the same reasons as those for the
stationary tests: deactivation by soot and/or Ag oxidation, low H2 levels and low specific catalyst loading of
the Ag/Al2O3. The high GHSV during the highway part of the cycle also contributed to the low SCR activity.
The Ag/Al2O3 containing layouts showed a noticeable NOx conversion from the start of the cycle, i.e. before
any NH2 or H2 was dosed. We believe that the NOx conversion seen comes from NOx storage on the
Ag/Al2O3.
The Ag/Al2O3 – Fe-BEA system shows potential, but further studies are needed. Tests with a higher catalyst
volume and DPF filter should be conducted to obtain a lower GHSV and avoid poisoning by soot. An
advanced dosing algorithm should also be developed that includes NOx adsorption and desorption for a
more accurate NH3 and H2 dosing.
Acknowledgements This work was supported by The Danish Council for Strategic Research through grant 09-067233. Magnus
Skoglundh, Louise Olsson and Stefanie Tamm from Competence Centre of Catalysis at Chalmers University
of Technology are gratefully acknowledged for valuable discussions. Amminex A/S is gratefully
acknowledged for supplying the NH3 and H2 dosing system. Thanks also to Magnus Lewander and his team
12
at Topsøe Engine test center for their help with the engine-bench testing and to Susanne Friis Madsen for
proof reading of the manuscript.
References
[1] T. V Johnson, “Vehicular Emissions in Review,” SAE International Journal of Engines, vol. 5, no. 2, pp. 216–234, 2012.
[2] M. K. Khair and H. Jääskeläinen, “Exhaust Gas Recirculation,” DieselNet Technology Guide, 2012. [Online]. Available: http://www.dieselnet.com/tech/engine_egr.php. [Accessed: 06-Mar-2013].
[3] T. V Johnson, “Review of diesel emissions and control,” International Journal of Engine Research, vol. 10, no. June, pp. 275–285, Oct. 2009.
[4] S. Brandenberger, O. Kröcher, A. Tissler, and R. Althoff, “The State of the Art in Selective Catalytic Reduction of NOx by Ammonia Using Metal-Exchanged Zeolite Catalysts,” Catalysis Reviews, vol. 50, no. 4, pp. 492–531, Oct. 2008.
[5] K. Kamasamudram, N. W. Currier, X. Chen, and A. Yezerets, “Overview of the practically important behaviors of zeolite-based urea-SCR catalysts, using compact experimental protocol,” Catalysis Today, vol. 151, no. 3–4, pp. 212–222, Jun. 2010.
[6] M. Colombo, I. Nova, and E. Tronconi, “A comparative study of the NH3-SCR reactions over a Cu-zeolite and a Fe-zeolite catalyst,” Catalysis Today, vol. 151, no. 3–4, pp. 223–230, Jun. 2010.
[7] P. S. Metkar, M. P. Harold, and V. Balakotaiah, “Selective catalytic reduction of NOx on combined Fe- and Cu-zeolite monolithic catalysts: Sequential and dual layer configurations,” Applied Catalysis B: Environmental, vol. 111–112, pp. 67–80, Sep. 2011.
[8] D. W. Fickel, E. D. Addio, J. A. Lauterbach, and R. F. Lobo, “The ammonia selective catalytic reduction activity of copper-exchanged small-pore zeolites,” Applied Catalysis B: Environmental, vol. 102, no. 3–4, pp. 441–448, 2011.
[9] S. J. Schmieg, S. H. Oh, C. H. Kim, D. B. Brown, J. H. Lee, C. H. F. Peden, and D. Heui, “Thermal durability of Cu-CHA NH3-SCR catalysts for diesel NOx reduction,” Catalysis Today, vol. 184, no. 1, pp. 252–261, 2012.
[10] C. N. Costa and A. M. Efstathiou, “Low-temperature H2-SCR of NO on a novel Pt/MgO-CeO2 catalyst,” Applied Catalysis B: Environmental, vol. 72, no. 3–4, pp. 240–252, Mar. 2007.
[11] M. Leicht, F. J. P. Schott, M. Bruns, and S. Kureti, “NOx reduction by H2 on WOx/ZrO2-supported Pd catalysts under lean conditions,” Applied Catalysis B: Environmental, vol. 117–118, no. 2, pp. 275–282, May 2012.
[12] S. Satokawa, “Enhancing the NO/C3H8/O2 Reaction by Using H2 over Ag/Al2O3 Catalysts under Lean-Exhaust Conditions.,” Chemistry Letters, vol. 3, no. 3, pp. 294–295, 2000.
[13] S. Satokawa, J. Shibata, K. Shimizu, A. Satsuma, and T. Hattori, “Promotion effect of H2 on the low temperature activity of the selective reduction of NO by light hydrocarbons over Ag/Al2O3,” Applied Catalysis B: Environmental, vol. 42, no. 2, pp. 179–186, May 2003.
[14] M. Richter, U. Bentrup, R. Eckelt, M. Schneider, M.-M. Pohl, and R. Fricke, “The effect of hydrogen on the selective catalytic reduction of NO in excess oxygen over Ag/Al2O3,” Applied Catalysis B: Environmental, vol. 51, no. 4, pp. 261–274, Aug. 2004.
[15] M. Richter, R. Fricke, and R. Eckelt, “Unusual Activity Enhancement of NO Conversion over Ag/Al2O3 by Using a Mixed NH3/H2 Reductant Under Lean Conditions,” Catalysis Letters, vol. 94, no. 1/2, pp. 115–118, Apr. 2004.
[16] K. Shimizu and A. Satsuma, “Hydrogen assisted urea-SCR and NH3-SCR with silver–alumina as highly active and SO2-tolerant de-NOx catalysis,” Applied Catalysis B: Environmental, vol. 77, no. 1–2, pp. 202–205, Nov. 2007.
13
[17] D. E. Doronkin, S. Fogel, S. Tamm, L. Olsson, T. S. Khan, T. Bligaard, P. Gabrielsson, and S. Dahl, “Study of the ‘Fast SCR’-like mechanism of H2-assisted SCR of NOx with ammonia over Ag/Al2O3,” Applied Catalysis B: Environmental, vol. 113–114, pp. 228–236, Feb. 2012.
[18] S. Tamm, S. Fogel, P. Gabrielsson, M. Skoglundh, and L. Olsson, “The effect of the gas composition on hydrogen-assisted NH3-SCR over Ag/Al2O3,” Applied Catalysis B: Environmental, vol. 136–137, pp. 168–176, Jun. 2013.
[19] D. E. Doronkin, T. Suvra, T. Bligaard, S. Fogel, P. Gabrielsson, and S. Dahl, “Sulfur poisoning and regeneration of the Ag/g-Al2O3 catalyst for H2-assisted SCR of NOx by ammonia,” Applied Catalysis B: Environmental, vol. 117–118, pp. 49–58, 2012.
[20] S. Fogel, D. E. Doronkin, P. Gabrielsson, and S. Dahl, “Optimisation of Ag loading and alumina characteristics to give sulphur-tolerant Ag/Al2O3 catalyst for H2-assisted NH3-SCR of NOx,” Applied Catalysis B: Environmental, vol. 125, pp. 457–464, 2012.
[21] S. Fogel, D. E. Doronkin, J. W. Høj, P. Gabrielsson, and S. Dahl, “Combination of Ag/Al2O3 and Fe-BEA for High-Activity Catalyst System for H2-Assisted NH3-SCR of NOx for Light-Duty Diesel Car Applications,” Topics in Catalysis, vol. 56, no. 1, pp. 14–18, Feb. 2013.
[22] P. Balle, B. Geiger, and S. Kureti, “Selective catalytic reduction of NOx by NH3 on Fe/HBEA zeolite catalysts in oxygen-rich exhaust,” Applied Catalysis B: Environmental, vol. 85, no. 3–4, pp. 109–119, Jan. 2009.
[23] W. A. Majewski, “What Are Diesel Emissions,” DieselNet Technology Guide, 2012. [Online]. Available: http://www.dieselnet.com/tech/emi_intro.php. [Accessed: 06-Mar-2013].
[24] K. Masuda, K. Tsujimura, K. Shinoda, and T. Kato, “Silver-promoted catalyst for removal of nitrogen oxides from emission of diesel engines,” Applied Catalysis B: Environmental, vol. 8, no. 1, pp. 33–40, Feb. 1996.
[25] L.-E. Lindfors, K. Eränen, F. Klingstedt, and D. Y. Murzin, “Silver/alumina catalyst for selective catalytic reduction of NOx to N2 by hydrocarbons in diesel powered vehicles,” Topics in Catalysis, vol. 28, no. 1–4, pp. 185–189, 2004.
[26] F. Klingstedt, K. Eränen, L.-E. Lindfors, S. Andersson, L. Cider, C. Landberg, E. Jobson, L. Eriksson, T. Ilkenhans, and D. Webster, “A Highly Active Ag/Alumina Catalytic Converter for Continuous HC-SCR During Lean-Burn Conditions: From Laboratory to Full-Scale Vehicle Tests,” Topics in Catalysis, vol. 30/31, no. 1–4, pp. 27–30, Jul. 2004.
[27] M. B. Viola, “HC-SCR Catalyst Performance in Reducing NOx Emissions from a Diesel Engine Running Transient Test Cycles,” SAE Technical paper series, no. 2008–01–2487, 2008.
[28] S. Sitshebo, A. Tsolakis, and K. Theinnoi, “Promoting hydrocarbon-SCR of NOx in diesel engine exhaust by hydrogen and fuel reforming,” International Journal of Hydrogen Energy, vol. 34, no. 18, pp. 7842–7850, Sep. 2009.
[29] K. Kim, K. M. Chun, S. Song, H. S. Han, and H. Gu, “Hydrogen Effect on the DeNOx Efficiency Enhancement of Fresh and Aged Ag/Al2O3 HC-SCR in a Diesel Engine Exhaust,” SAE International, no. 2011–01–1278, 2011.
[30] M. J. Pipho, D. B. Kittelson, and D. D. Zarling, “NO2 Formation in a Diesel Engine,” SAE Technical paper series, no. 910231, 1991.
[31] H. Yamada, K. Misawa, D. Suzuki, K. Tanaka, J. Matsumoto, M. Fujii, and K. Tanaka, “Detailed analysis of diesel vehicle exhaust emissions: Nitrogen oxides, hydrocarbons and particulate size distributions,” Proceedings of the Combustion Institute, vol. 33, no. 2, pp. 2895–2902, Jan. 2011.
[32] J. J. Chong, A. Tsolakis, S. S. Gill, K. Theinnoi, and S. E. Golunski, “Enhancing the NO2/NOx ratio in compression ignition engines by hydrogen and reformate combustion, for improved aftertreatment performance,” International Journal of Hydrogen Energy, vol. 35, no. 16, pp. 8723–8732, Aug. 2010.
[33] K. Shimizu, J. Shibata, and A. Satsuma, “Kinetic and in situ infrared studies on SCR of NO with propane by silver–alumina catalyst: Role of H2 on O2 activation and retardation of nitrate poisoning,” Journal of Catalysis, vol. 239, no. 2, pp. 402–409, Apr. 2006.
14
[34] J. P. Breen, R. Burch, C. Hardacre, C. J. Hill, and C. Rioche, “A fast transient kinetic study of the effect of H2 on the selective catalytic reduction of NOx with octane using isotopically labelled 15NO,” Journal of Catalysis, vol. 246, no. 1, pp. 1–9, Feb. 2007.
[35] K. Eränen, F. Klingstedt, K. Arve, L.-E. Lindfors, and D. Y. Murzin, “On the mechanism of the selective catalytic reduction of NO with higher hydrocarbons over a silver/alumina catalyst,” Journal of Catalysis, vol. 227, no. 2, pp. 328–343, Oct. 2004.
[36] C. L. DiMaggio, G. B. Fisher, K. M. Rahmoeller, and M. Sellnau, “Dual SCR Aftertreatment for Lean NOx Reduction,” SAE International Journal of Fuels and Lubricants, vol. 2, no. 1, pp. 66–77, 2009.
[37] S. J. Schmieg, T. M. Sloane, and R. J. Blint, “Catalysts for lean-burn engine exhaust aftertreatment using hydrocarbon selective catalytic reduction,” SAE International Journal of Fuels and Lubricants, vol. 2, no. 2, pp. 323–336, 2009.
[38] B. Pereda-Ayo, D. Duraiswami, and J. R. González-Velasco, “Control of NOx storage and reduction in NSR bed for designing combined NSR–SCR systems,” Catalysis Today, vol. 172, no. 1, pp. 66–72, Aug. 2011.
[39] A. Grossale, I. Nova, and E. Tronconi, “Ammonia blocking of the ‘Fast SCR’ reactivity over a commercial Fe-zeolite catalyst for Diesel exhaust aftertreatment,” Journal of Catalysis, vol. 265, no. 2, pp. 141–147, Jul. 2009.
[40] P. Sazama, L. Capek, H. Drobna, Z. Sobalik, J. Dedecek, K. Arve, and B. Wichterlova, “Enhancement of decane-SCR-NO over Ag/alumina by hydrogen. Reaction kinetics and in situ FTIR and UV–vis study,” Journal of Catalysis, vol. 232, no. 2, pp. 302–317, Jun. 2005.
[41] K. A. Bethke and H. H. Kung, “Supported Ag Catalysts for the Lean Reduction of NO with C3H6,” Journal of Catalysis, vol. 172, pp. 93–102, 1997.
[42] F. C. Meunier and J. R. H. Ross, “Effect of ex situ treatments with SO2 on the activity of a low loading silver–alumina catalyst for the selective reduction of NO and NO2 by propene,” Applied Catalysis B: Environmental, vol. 24, no. 1, pp. 23–32, Jan. 2000.
[43] M. V Twigg, “Catalytic control of emissions from cars,” Catalysis Today, vol. 163, no. 1, pp. 33–41, Apr. 2011.
[44] S. J. Schmieg, R. J. Blint, and L. Deng, “Control strategy of the removal of NOx from diesel engine exhaust using hydrocarbon selective catalytic reduction,” SAE International Journal of Fuels and Lubricants, vol. 1, no. 1, pp. 1540–1552, 2008.
[45] D. Klukowski, P. Balle, B. Geiger, S. Wagloehner, S. Kureti, B. Kimmerle, a. Baiker, and J.-D. Grunwaldt, “On the mechanism of the SCR reaction on Fe/HBEA zeolite,” Applied Catalysis B: Environmental, vol. 93, no. 1–2, pp. 185–193, Nov. 2009.
[46] R. Brosius, K. Arve, M. Groothaert, and J. Martens, “Adsorption chemistry of NOx on Ag/Al2O3 catalyst for selective catalytic reduction of NOx using hydrocarbons,” Journal of Catalysis, vol. 231, no. 2, pp. 344–353, Apr. 2005.
[47] J. Li, Y. Zhu, R. Ke, and J. Hao, “Improvement of catalytic activity and sulfur-resistance of Ag/TiO2–Al2O3 for NO reduction with propene under lean burn conditions,” Applied Catalysis B: Environmental, vol. 80, pp. 202–213, 2008.
[48] R. Zhang and S. Kaliaguine, “Lean reduction of NO by C3H6 over Ag/alumina derived from Al2O3, AlOOH and Al(OH)3,” Applied Catalysis B: Environmental, vol. 78, no. 3–4, pp. 275–287, Feb. 2008.
[49] X. She and M. Flytzani-Stephanopoulos, “The role of AgOAl species in silver–alumina catalysts for the selective catalytic reduction of NOx with methane,” Journal of Catalysis, vol. 237, no. 1, pp. 79–93, Jan. 2006.
[50] I. Nadjar, J.-M. Trichard, P. Costa, and G. Djéga-Mariadassou, “Selective reduction of NOx in diesel exhaust with hydrocarbons over alumina in NEDC conditions,” Topics in Catalysis, vol. 42–43, no. 1–4, pp. 27–31, May 2007.
[51] Y. Tsukamoto, H. Nishioka, D. Imai, Y. Sobue, N. Takagi, T. Tanaka, and T. Hamaguchi, “Development of New Concept Catalyst for Low CO 2 Emission Diesel Engine Using NOx Adsorption at Low Temperatures,” SAE International, vol. 2012–01–03, 2012.
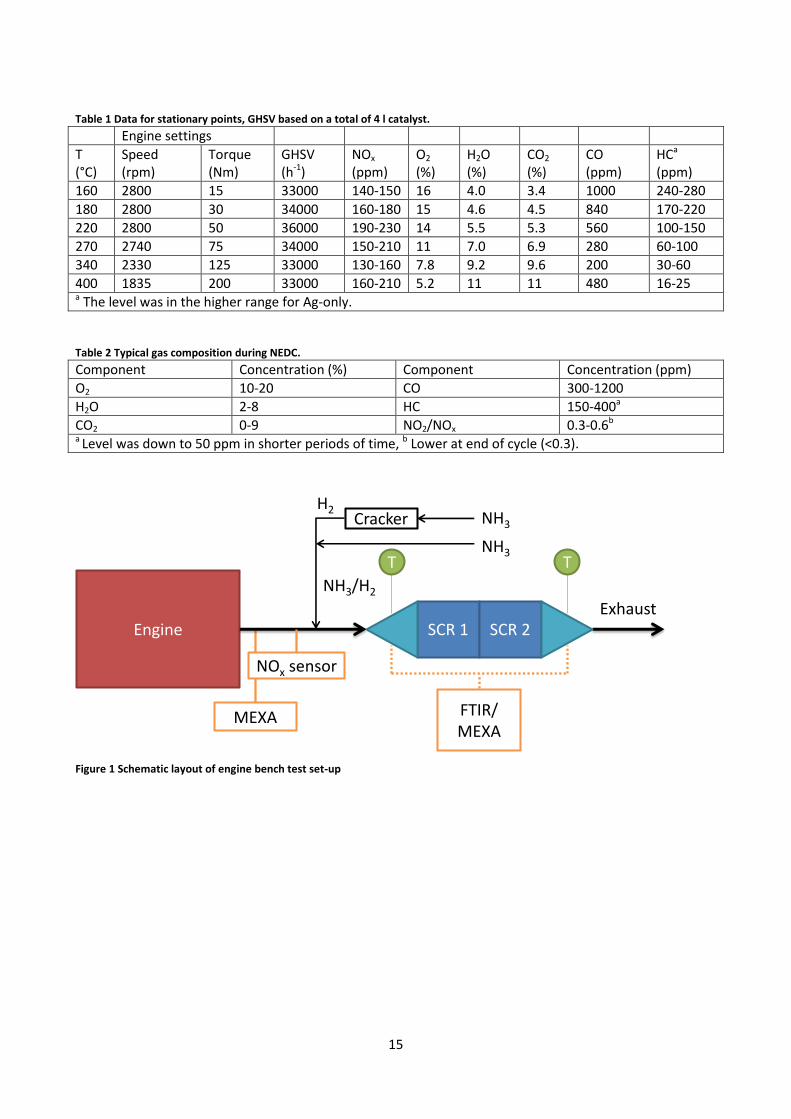
15
Table 1 Data for stationary points, GHSV based on a total of 4 l catalyst.
Engine settings
T (°C)
Speed (rpm)
Torque (Nm)
GHSV (h-1)
NOx (ppm)
O2 (%)
H2O (%)
CO2 (%)
CO (ppm)
HCa (ppm)
160 2800 15 33000 140-150 16 4.0 3.4 1000 240-280
180 2800 30 34000 160-180 15 4.6 4.5 840 170-220
220 2800 50 36000 190-230 14 5.5 5.3 560 100-150
270 2740 75 34000 150-210 11 7.0 6.9 280 60-100
340 2330 125 33000 130-160 7.8 9.2 9.6 200 30-60
400 1835 200 33000 160-210 5.2 11 11 480 16-25 a The level was in the higher range for Ag-only.
Table 2 Typical gas composition during NEDC.
Component Concentration (%) Component Concentration (ppm)
O2 10-20 CO 300-1200
H2O 2-8 HC 150-400a
CO2 0-9 NO2/NOx 0.3-0.6b a Level was down to 50 ppm in shorter periods of time, b Lower at end of cycle (<0.3).
SCR 1 SCR 2Engine
T T
FTIR/MEXA
MEXA
NOx sensor
NH3/H2
NH3
Cracker NH3
H2
Exhaust
Figure 1 Schematic layout of engine bench test set-up
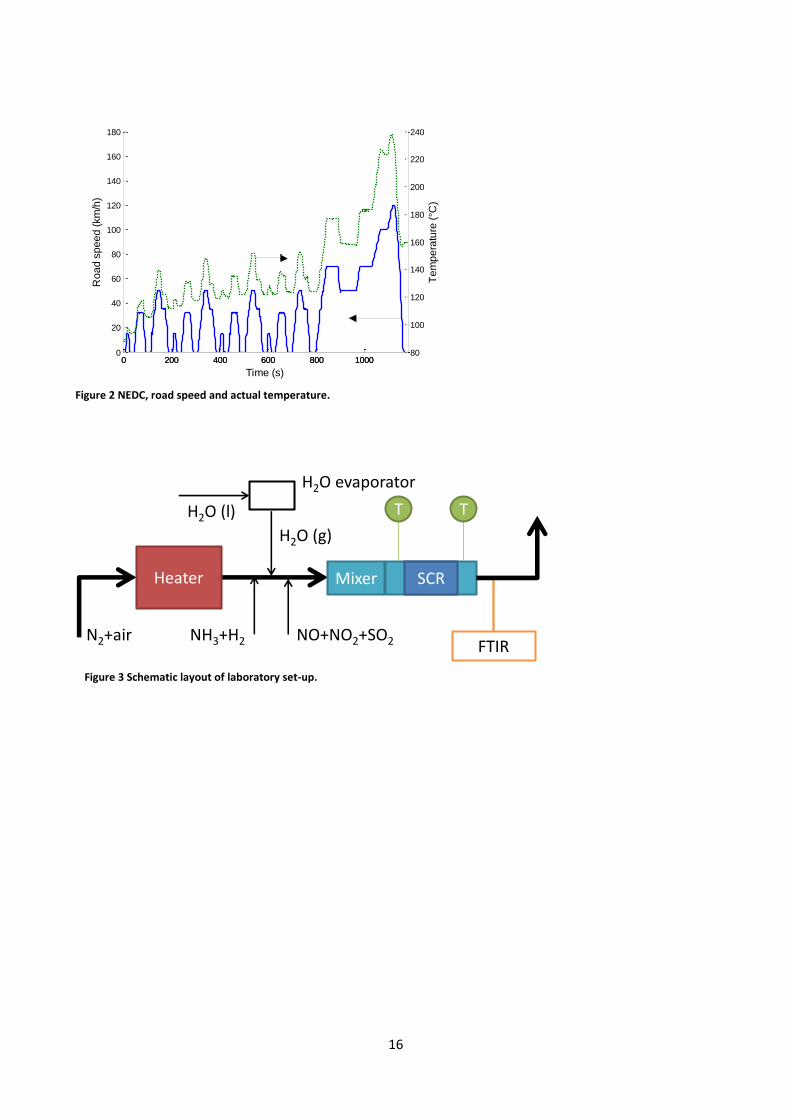
16
0 200 400 600 800 10000
20
40
60
80
100
120
140
160
180
Time (s)
Ro
ad
sp
ee
d (
km
/h)
0 200 400 600 800 100080
100
120
140
160
180
200
220
240
Te
mp
era
ture
(°C
)
Figure 2 NEDC, road speed and actual temperature.
FTIR
Mixer
TT
SCRHeater
H2O evaporator
H2O (l)
H2O (g)
NO+NO2+SO2NH3+H2N2+air
Figure 3 Schematic layout of laboratory set-up.
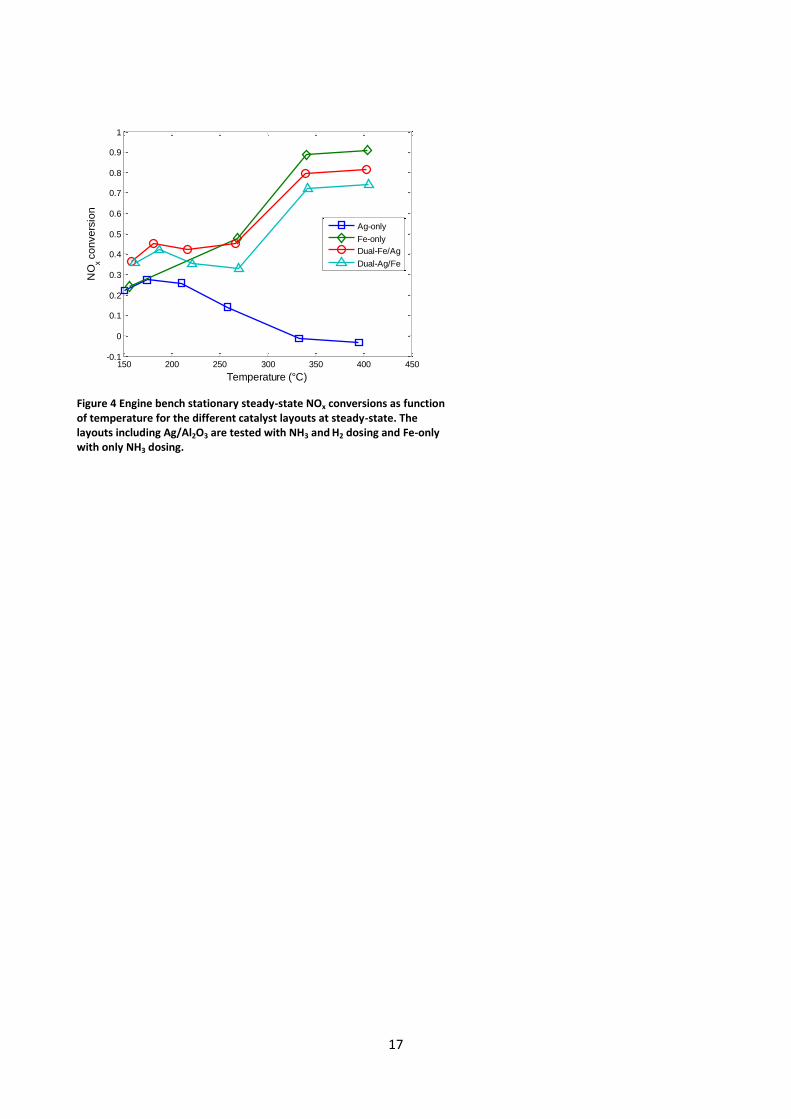
17
Figure 4 Engine bench stationary steady-state NOx conversions as function of temperature for the different catalyst layouts at steady-state. The layouts including Ag/Al2O3 are tested with NH3 and H2 dosing and Fe-only with only NH3 dosing.
150 200 250 300 350 400 450-0.1
0
0.1
0.2
0.3
0.4
0.5
0.6
0.7
0.8
0.9
1
NO
x co
nve
rsio
n
Temperature (°C)
Ag-only
Fe-only
Dual-Fe/Ag
Dual-Ag/Fe
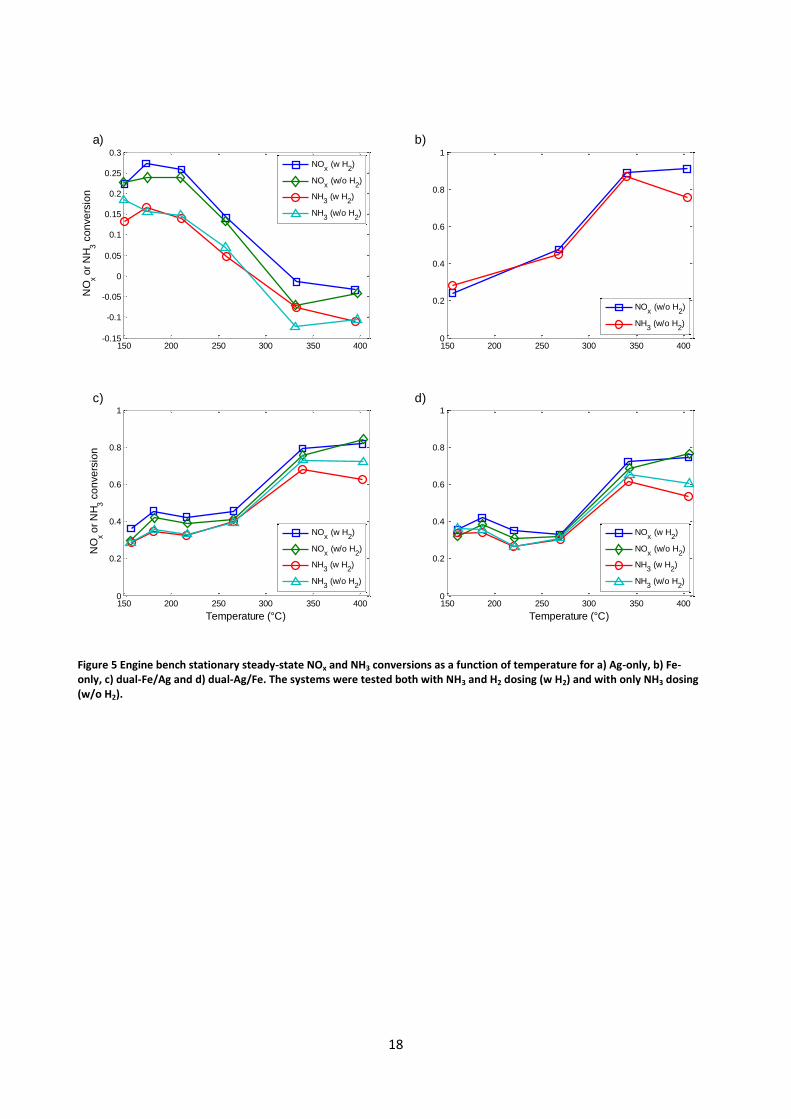
18
Figure 5 Engine bench stationary steady-state NOx and NH3 conversions as a function of temperature for a) Ag-only, b) Fe-only, c) dual-Fe/Ag and d) dual-Ag/Fe. The systems were tested both with NH3 and H2 dosing (w H2) and with only NH3 dosing (w/o H2).
150 200 250 300 350 400-0.15
-0.1
-0.05
0
0.05
0.1
0.15
0.2
0.25
0.3
NO
x or
NH
3 c
on
ve
rsio
n
NO
x (w H
2)
NOx (w/o H
2)
NH3 (w H
2)
NH3 (w/o H
2)
150 200 250 300 350 4000
0.2
0.4
0.6
0.8
1
NOx (w/o H
2)
NH3 (w/o H
2)
150 200 250 300 350 4000
0.2
0.4
0.6
0.8
1
Temperature (°C)
NO
x or
NH
3 c
on
ve
rsio
n
NOx (w H
2)
NOx (w/o H
2)
NH3 (w H
2)
NH3 (w/o H
2)
150 200 250 300 350 4000
0.2
0.4
0.6
0.8
1
Temperature (°C)
NOx (w H
2)
NOx (w/o H
2)
NH3 (w H
2)
NH3 (w/o H
2)
a) b)
c) d)
19
Figure 7 Engine bench stationary steady-state NO2/NOx ratios vs. NOx conversions as function of temperature for Ag-only, NH3 and H2 dosing.
150 200 250 300 350 400-0.1
0
0.1
0.2
0.3
0.4
0.5
0.6
0.7
Temperature (°C)
NO
2/N
Ox o
r N
Ox c
on
ve
rsio
n
NO2:NO
x
NOx conv
Figure 6 Engine bench stationary steady-state concentrations as function of temperature for Ag-only with NH3 and H2 dosing.
150 200 250 300 350 40020
40
60
80
100
120
140
Temperature (°C)
Co
nce
ntr
atio
n (
pp
m)
NOin
NOout
NO2,in
NO2,out
150 200 250 300 350 400110
120
130
140
150
160
170
180
190
200
210
220
Temperature (°C)
NOx,in
NOx,out
NH3,in
NH3,out
a) b)
20
100 150 200 250 300 350 400 450 500-0.05
0
0.05
0.1
0.15
0.2
NO
x co
nve
rsio
n
1st
2nd
3rd
4th
100 150 200 250 300 350 400 450 500-0.05
0
0.05
0.1
0.15
0.2
Temperature (°C)
NH
3 c
on
ve
rsio
n
1st
2nd
3rd
4th
a)
b)
Figure 8 Temperature dependency of NOx (a) and NH3 (b) conversion for core sample after engine tests. 1
st test and 2
nd test before and 3
rd test and
4th
test after regeneration (in-situ at 500°C and in oven at 550°C). Reaction conditions: 500 ppm NO, 500 ppm NH3, 1000 ppm H2, 8% O2, 12% H2O and balance N2, GHSV ∼33000 h
-1.
100 150 200 250 300 350 400 450 5000
0.1
0.2
0.3
0.4
0.5
0.6
0.7
0.8
0.9
1
Temperature (°C)
NO
x co
nve
rsio
n
0 - before
0 - after
0.25
0.5
0.75
0.95
100 150 200 250 300 350 400 450 5000
0.05
0.1
0.15
0.2
0.25
0.3
0.35
0.4
0.45
0.5
Temperature (°C)
0.25
0.5
0.75
0.95
a) b)
Figure 9 NOx conversion as function of temperature for different NO2/NOx ratios (indicated in legend); a) with H2 and b) without H2. Reaction conditions: 500 ppm NO, 500 ppm NH3, 0 or 1000 ppm H2, 8% O2, 12% H2O and balance N2, GHSV ∼30000 h
-1.
21
Figure 10 NOx temperature distribution on mole basis measured directly before the catalysts for transient NEDC.
0 - 100°C: 2%
100 - 125°C: 18%
125 - 150°C: 31%150 - 175°C: 9%
175 - 200°C: 7%
200 - 225°C: 8%
>225°C: 24%
0 200 400 600 800 10000
0.02
0.04
0.06
0.08
0.1
0.12
Time (s)
NO
x (m
ol)
0 200 400 600 800 100080
100
120
140
160
180
200
220
240
Te
mp
era
ture
(°C
)
Inlet
Ag-only
Fe-only
Dual-brick-Fe/Ag
Dual-brick-Ag/Fe
Temperature
Figure 11 Accumulated NOx during NEDC for Ag-only, Fe-only, dual-brick-Fe/Ag and dual-brick-Ag/Fe compared to inlet NOx, NH3 and H2 dosing (only NH3 for Fe-only).
22
0 200 400 600 800 1000 12000.1
0.2
0.3
0.4
0.5
0.6
0.7
0.8
0.9
1
To
tal N
Ox c
on
ve
rsio
n
Time (s)
Ag-only
Fe-only
Dual-brick-Fe/Ag
Dual-brick-Ag/Fe
Figure 12 Total NOx conversions as function of time during NEDC for Ag-only, Fe-only, dual-brick-Fe/Ag and dual-brick-Ag/Fe, NH3 and H2 dosing, (only NH3 for Fe-only).
50 100 150 200 250 300 350 400 450 5000
50
100
150
200
250
300
350
400
450
Temperature (°C)
Co
nce
ntr
atio
n (
pp
m)
150 200 250 300 350 400 450 5000
50
100
150
200
250
300
Temperature (°C)
a) b)
Figure 13 a) NO-TPD, saturation temperature 40°C, and b) NH3-TPD saturation temperature 150°C, of Ag/Al2O3.
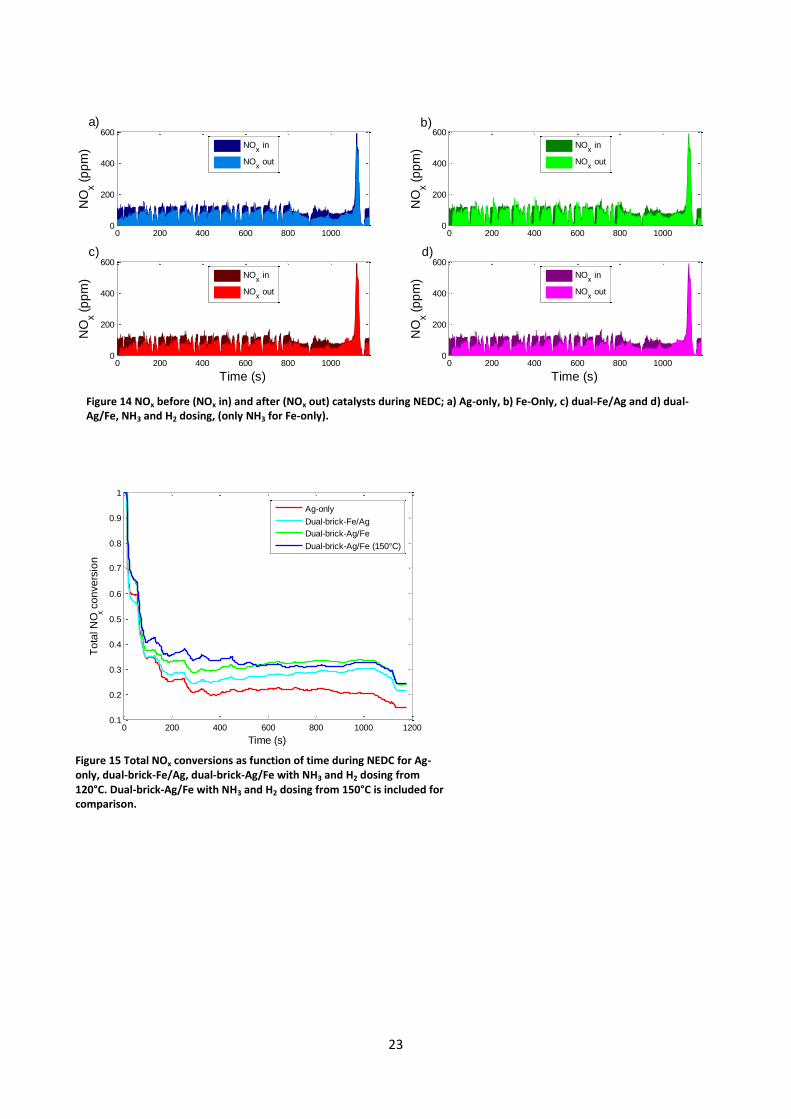
23
0 200 400 600 800 1000 12000.1
0.2
0.3
0.4
0.5
0.6
0.7
0.8
0.9
1
To
tal N
Ox c
on
ve
rsio
n
Time (s)
Ag-only
Dual-brick-Fe/Ag
Dual-brick-Ag/Fe
Dual-brick-Ag/Fe (150°C)
Figure 15 Total NOx conversions as function of time during NEDC for Ag-only, dual-brick-Fe/Ag, dual-brick-Ag/Fe with NH3 and H2 dosing from 120°C. Dual-brick-Ag/Fe with NH3 and H2 dosing from 150°C is included for comparison.
0 200 400 600 800 10000
200
400
600
NO
x (p
pm
)
NOx in
NOx out
0 200 400 600 800 10000
200
400
600
NO
x (p
pm
)
NOx in
NOx out
0 200 400 600 800 10000
200
400
600
Time (s)
NO
x (p
pm
)
NOx in
NOx out
0 200 400 600 800 10000
200
400
600
Time (s)
NO
x (p
pm
)
NOx in
NOx out
a) b)
c) d)
Figure 14 NOx before (NOx in) and after (NOx out) catalysts during NEDC; a) Ag-only, b) Fe-Only, c) dual-Fe/Ag and d) dual-Ag/Fe, NH3 and H2 dosing, (only NH3 for Fe-only).

Paper IV
So
DPa
b
c
d
a
ARR2AA
KASNPR
1
tCFhtfii
iSi[fcNt
(
0d
Applied Catalysis B: Environmental 117– 118 (2012) 49– 58
Contents lists available at SciVerse ScienceDirect
Applied Catalysis B: Environmental
jo ur n al homepage: www.elsev ier .com/ locate /apcatb
ulfur poisoning and regeneration of the Ag/�-Al2O3 catalyst for H2-assisted SCRf NOx by ammonia
mitry E. Doronkina,∗, Tuhin Suvra Khanb, Thomas Bligaardc, Sebastian Fogela,d,är Gabrielssond, Søren Dahla
Center for Individual Nanoparticle Functionality (CINF), Department of Physics, Technical University of Denmark, Fysikvej 307, 2800 Kgs. Lyngby, DenmarkCenter of Atomic-scale Materials Design (CAMD), Department of Physics, Technical University of Denmark, Fysikvej 307, 2800 Kgs. Lyngby, DenmarkSUNCAT Center for Interface Science and Catalysis, SLAC National Accelerator Laboratory, Menlo Park, CA 94025, USAHaldor Topsøe A/S, Nymøllevej 55, 2800 Kgs. Lyngby, Denmark
r t i c l e i n f o
rticle history:eceived 1 November 2011eceived in revised form7 December 2011ccepted 3 January 2012vailable online 9 January 2012
a b s t r a c t
Sulfur poisoning and regeneration mechanisms for a 2% Ag/�-Al2O3 catalyst for the H2-assisted selec-tive catalytic reduction of NOx by NH3 are investigated. The catalyst has medium sulfur tolerance at lowtemperatures, however a good capability of regeneration at 670 ◦C under lean conditions when H2 ispresent. These heating conditions can easily be established during soot filter regeneration. Furthermore,two types of active sites could be identified with different regeneration capabilities, namely finely dis-persed Ag and larger Ag nanoparticles. The most active sites are associated with the finely dispersed Ag.
eywords:g/Al2O3
O2
Ox SCR
These sites are irreversibly poisoned and cannot be regenerated under driving conditions. On the otherhand the larger Ag nanoparticles are reversibly poisoned by direct SOx adsorption. The interpretation ofthe data is supported by DFT calculations.
© 2012 Elsevier B.V. All rights reserved.
oisoningegeneration. Introduction
Selective catalytic reduction (SCR) is the leading NOx controlechnique for diesel vehicles with ammonia used as a reductant.ommonly used catalysts are vanadia-based catalysts and Cu ande-containing zeolites. However, none of the systems demonstrateigh thermal durability together with a good activity throughouthe broad temperature region from 150 to 550 ◦C which is neededor vehicle applications [1]. Therefore, research of novel non-toxic,nexpensive and durable catalytic systems for NH3-SCR is still anmportant focus area.
Recently two research groups suggested to use Ag/Al2O3, whichs a well-known catalyst for NOx SCR by hydrocarbons (HC-SCR), forCR of NOx by ammonia or urea with co-feeding hydrogen, result-ng in nearly 90% NOx conversion at temperatures as low as 200 ◦C2,3]. Still, one of the major obstacles for the application of Ag/Al2O3or NOx SCR by ammonia is its rather poor sulfur tolerance [4]. A
atalyst of 2% Ag/Al2O3 demonstrated a decrease in H2-assistedOx conversion by urea from 50% to 30% after 20 h on stream inhe presence of 50 ppm SO2 at 250 ◦C. This is a rather good result
∗ Corresponding author. Tel.: +45 4525 3275.E-mail addresses: [email protected], [email protected]
D.E. Doronkin).
926-3373/$ – see front matter © 2012 Elsevier B.V. All rights reserved.oi:10.1016/j.apcatb.2012.01.002
considering the very high GHSV = 380,000 h−1 in the tests. How-ever, the large amount of hydrogen (0.5%, 5:1 H2:NO) used in thisstudy is probably unacceptable for application in diesel vehiclesbecause such a large consumption of hydrogen leads to a high “fuelpenalty” [5].
A significant amount of data on sulfur tolerance of Ag/Al2O3catalysts exists for NOx SCR by hydrocarbons. Meunier and Ross[6] observed strong deactivation of a 1.2% Ag/Al2O3 catalyst forpropene-SCR by 100 ppm SO2 in the feed. It is noteworthy that theauthors were able to recover most of the catalyst activity by treat-ment in 10% H2/Ar at 650 ◦C or heating in the reaction mixture at750 ◦C. Park and Boyer [7] compared the catalytic behavior of 2%and 8% Ag/Al2O3 catalysts in the presence of SO2 and concludedthat high Ag loadings may be preferential for making a sulfur tol-erant catalyst. The authors demonstrated prominent activation of8% Ag/Al2O3 by SO2 in the feed and ascribed that to the formationof a very active silver sulfate phase.
When estimating the SO2 tolerance of Ag/Al2O3 catalysts atten-tion should be given also to the process temperature. Satokawa et al.[8] showed a clear dependence of the propane-SCR temperatureon the deactivation degree with permanent catalyst deactivation
at T < 500 ◦C and furthermore the ability to partially regenerate thecatalyst by heating to 600 ◦C, even without removing low amounts(1 ppm) of SO2 from the feed. Further studies [8] of sulfation-regeneration mechanisms included obtaining SO2 TPD profiles and
5 is B: E
aAtdr
cotdutSAosch
rscc
taibtnuF
2
2
ki(tct(a
2
sUcc
2
fiidtitKo
0 D.E. Doronkin et al. / Applied Catalys
ttribution of peaks to different types of adsorbed SO2, bound tog and alumina. The catalyst regeneration temperature was lower
han any of the SO2 desorption peaks, observed in the study, whichid not allow drawing a clear conclusion about the deactivation andegeneration mechanisms.
Breen et al. [9] also demonstrated a drastic dependence of theatalyst degree of poisoning on the temperature of NOx SCR byctane and toluene. The following was observed; at low tempera-ures (<235 ◦C) little deactivation, between 235 and 500 ◦C – severeeactivation and at T > 590 ◦C – activation due to a suppression ofnselective oxidation of hydrocarbons. The low temperature sulfurolerance was ascribed to low catalyst activity in SO2 oxidation toO3 with the latter considered to be the main poisoning agent forg/Al2O3. The authors have evaluated a few regeneration optionsf which heating to 650 ◦C in hydrogen-containing lean mixturehowed promising results rather than regeneration under oxidizingonditions without H2. The fastest regeneration technique includedeating the catalyst in a rich mixture containing CO and hydrogen.
The results of other research groups [10,11] agree with Breen’sesults in SO2 oxidation to SO3 by NO2 being the major step in theulfur poisoning of Ag/Al2O3 catalysts. Partial regeneration of theatalyst was observed after heating to 600 ◦C in a hydrocarbon-ontaining feed.
In this work we have attempted to reveal the Ag/Al2O3 sulfa-ion and regeneration mechanisms, which will allow us to developn efficient regeneration strategy for the ammonia SCR catalystn question. Special attention was given to the catalyst operationelow 300 ◦C, since for applications in light-duty diesel vehicles lowemperatures are of great importance [10]. The suggested mecha-ism was supported by DFT calculations. A regeneration strategysing the high temperatures developed during Diesel Particulateilter (DPF) regeneration in diesel cars was evaluated.
. Experimental
.1. Catalyst preparation
Parent �-alumina (Puralox TH 100/150, SBET = 150 m2/g) wasindly provided by SASOL. 1–3 wt.% Ag/Al2O3 were obtained byncipient wetness impregnation of parent �-alumina by AgNO3Sigma–Aldrich) dissolved in deionized water. After impregna-ion the catalyst was dried at room temperature overnight andalcined at 550 ◦C for 4 h in static air. The calcined catalyst wasableted, crushed and sieved to obtain a 0.18–0.35 mm fractionmesh 80–mesh 45) used in the catalytic tests. A new batch of cat-lyst was sulfated and used to test every new regeneration recipe.
.2. Determination of the specific surface area
The specific surface areas (SBET) of the catalysts were mea-ured by N2-adsorption with a Micromeritics Gemini instrument.ntreated catalysts were measured in powder form and for theatalysts after testing a 0.18–0.35 mm fraction of particles (as inatalytic tests) was used for the BET measurement.
.3. Catalysis
Temperature-programmed activity tests were carried out in axed-bed flow reactor (quartz tube with 4 mm inner diameter)
n a temperature programmed mode while the temperature wasecreased from 400 ◦C to 150 ◦C with a rate of 2 ◦C/min. Prior tohe temperature ramp the catalyst was heated to 470 ◦C for 30 min
n the gas mixture used for the tests. The temperature was con-rolled using an Eurotherm 2408 temperature controller with a-type thermocouple. 45 mg of catalyst was diluted with 100 mgf SiC (mesh 60) and placed on a quartz wool bed. The bed heightnvironmental 117– 118 (2012) 49– 58
was ∼11 mm and the GHSV, calculated using the volume of thepure catalyst was ∼110,000 h−1. The gas composition normally con-tained 500 ppm NO, 520 ppm NH3, 1200 ppm of H2, 8.3% O2, and 7%water balanced with Ar. For sulfur poisoning tests 10 ppm SO2 wasadmixed to the feed. Water was dosed by an ISCO 100DM syringepump through a heated capillary. Reaction products were analyzedby a Thermo Fisher Nicolet 6700 FTIR analyzer, equipped with a2 m gas cell. Gas capillaries were heated to ∼130 ◦C and the FTIRgas cell to 165 ◦C to avoid condensation of water and formation ofammonium nitrate.
Conversions were calculated using the following equations:
XNOx = 1 −Coutlet
NOx
C inletNOx
(1)
and
XNH3 = 1 −Coutlet
NH3
C inletNH3
(2)
where XNOx denotes the conversion of NOx to N2 and C inletNOx
and
CoutletNOx
are the NOx concentrations at the inlet and outlet of thereactor respectively, where:
CNOx = CNO + CNO2 + CN2O (3)
and C inletNH3
and CoutletNH3
are NH3 concentrations at the reactor inlet andoutlet.
2.4. DFT calculations
The plane wave density functional theory (DFT) code DACAPOwas used to calculate the adsorption energies and the gas phaseenergies of the adsorbates [12]. A plane wave cutoff of 340.15 eVand a density cutoff of 680 eV were used in the calculations. Thecore electrons were described by Vanderbilt ultrasoft pseudopo-tentials. The RBPE functional was used for describing the exchangecorrelation energy [13].
The adsorption energies of the SO2, SO3, and SO4 species werestudied over the Ag (1 1 1) terrace and (2 1 1) step surfaces, on a�-Al2O3 model step surface, and two single atom Ag sites.
For the Ag (1 1 1) and (2 1 1) surfaces, we used a 4 × 4 × 1Monkhorst-Pack k-point sampling in the irreducible Brillouin zone.We employed a 3 × 3 surface cell for the Ag (1 1 1) and 3 × 1 sur-face cell for the Ag (2 1 1) surfaces. For the (1 1 1) surface we useda four-layer slab where the two top-most layers were allowed torelax, whereas for the (2 1 1) surfaces we used a slab model withnine layers and the topmost three layers are allowed to relax. In allthe model calculations, neighboring slabs were separated by morethan 10 A of vacuum.
For the calculation of �-Al2O3 and the adsorption of differentspecies on �-Al2O3 we also used the DACAPO code with a planewave cutoff of 340.15 eV and a density cutoff of 680 eV. A 4 × 4 × 1Monkhorst-Pack k-point sampling in the irreducible Brillouin zonewas used for �-Al2O3. The �-Al2O3 surface was modeled by a stepon a non-spinel �-Al2O3 structure which was derived from bulk�-Al2O3 model in [14]. The cell parameters for the �-Al2O3 modelstep surface are a = 8.0680 A and b = 10.0092 A and = = � = 90◦.For the �-Al2O3 surface the bottom two layers were fixed whereasthe top-most three layers were allowed to relax. In all the model�-Al2O3 surfaces, the neighboring slabs are separated by more than10 A of vacuum.
Single atom Ag sites were constructed by replacing one Al atom
for Ag in the alumina step surface and by attaching one Ag atom tothe �-Al2O3 step (see Supplementary material for the geometries).SOx and HSOx adsorption energies were calculated relative togas phase energies of SO2(g), O2(g) and H2(g).
is B: E
u
S
S
wc
og
�
�
Sd
T
wdc(u
3
3r
3
f1silcSSTtdciwoa[ai
insm
D.E. Doronkin et al. / Applied Catalys
For calculation of desorption temperatures for SO2 and SO3 wesed the following procedure. Starting from the chemical equation:
O2 + ∗ ↔ SO2∗, (4)
O2 + 1/2O2 + ∗ ↔ SO3∗ (5)
here * is the free surface site and SOx* is the adsorbed species. Wean write down the ratio of occupied and free adsorption sites:
�SOx
�∗ = KadsPSOx = exp(
−�Gads
kT
)PSOx
= exp
(−(�G�ads − kT ln PSOx )
kT
)(6)
We assume that at the desorption temperature the numbersf occupied and free adsorption sites will equal (�SOx = �∗), whichives:
G�ads − kT ln PSOx = 0 (7)
or
Eads − �ZPEads − T�Sads − kT ln PSOx = 0 (8)
We calculate the ZPE (zero point energy) and the entropy of theOx in their adsorbed state and so it is possible to calculate theesorption temperature for a given partial pressure of SOx:
= �Eads
k ln PSOx − �Sgas(9)
The SOx entropy and ZPE found for the �-Al2O3 model surfaceere also used for the single Ag atom sites on the �-Al2O3. Stan-ard entropy values for SO2 and SO3 from [15] (neglecting entropyhange with temperature) and a partial pressure of SOx 4 × 10⁻⁷ bar0.4 ppm in Ref. [9]) and partial pressure of O2 is 0.07 bar [9] weresed in the calculations.
. Results and discussion
.1. Catalyst choice: stability of Ag/Al2O3 and options for theegeneration
.1.1. The catalyst choiceTemperature dependence of NOx and NH3 conversions for the
resh 1–3% Ag/Al2O3 catalysts is shown in Fig. 1a and b, respectively.% Ag/Al2O3 exhibits SCR onset at 130 ◦C reaching 80% NOx conver-ion at 200 ◦C and leveling NOx conversion at 90% at T > 300 ◦C. Thiss in agreement with previous studies [2]. 2% and 3% Ag/Al2O3 cata-ysts demonstrate SCR onset shifted by 7 ◦C to lower temperaturesompared 1%, but lower maximum conversion and generally lowerCR activity at higher temperatures, unlike results of Shimizu andatsuma [3]. The NH3 conversion follows the NOx conversion at
< 270–300 ◦C. At higher temperature NH3 becomes oxidized andhe NH3 conversion is higher than NOx conversion. Thus, NH3 oxi-ation plays some role in the decrease of high temperature NOx
onversion but this is not the main reason. The reason for observ-ng conversion maxima for 2% and 3% Ag/Al2O3 catalysts at 200 ◦C
ith subsequent drop in NH3 and NOx conversions could be directxidation of H2 by oxygen taking over. As it was shown earlier no NOnd NH3 is converted over an Ag/Al2O3 catalyst in the absence of H216]. Another possible reason is the lack of strong acid sites for NH3dsorption in the 2–3% Ag/Al2O3 catalysts which is demonstratedn [17].
Noteworthy, the tested catalysts demonstrate very high stabil-
ty at temperature up to 700 ◦C which has also been shown in theumber of papers on HC-SCR [3,9]. To further check the thermaltability of the 1% Ag/Al2O3 catalyst it was subjected to hydrother-al deactivation at 750 ◦C for 16 h. The activity of the obtainednvironmental 117– 118 (2012) 49– 58 51
catalyst is reported in Fig. 1a and b as gray dotted lines. The low-temperature conversion is only slightly shifted by 3 ◦C, whereasat T > 300 ◦C one may observe a decrease in NOx and NH3 conver-sions similar to that observed for catalysts with higher Ag loading.This may indicate sintering of Ag particles leading to the increasedunselective oxidation of hydrogen. At the same time, the relativelysmall decrease in the catalyst specific surface area (SBET) does notindicate any significant change in the alumina support (Table 1).
Contrary to the hydrothermal aging, sulfur poisoning ofAg/Al2O3 leads to significant catalyst deactivation. Preliminaryexperiments on the choice of sulfur poisoning temperature showedno catalyst deactivation with SO2 in the feed at 500 ◦C and themost severe deactivation in the temperature range 200–300 ◦Cin very good agreement with the earlier reported results for HC-SCR [8,9]. Therefore, preliminary SO2 deactivation studies of 1–3%Ag/Al2O3 were performed at 200–227 ◦C and all the followingdeactivation–regeneration studies of 2% Ag/Al2O3 were done at240–250 ◦C (Fig. 1c). For the comparison of regeneration methodsthe SO2 poisoning was obtained by introducing 10 ppm SO2 to theSCR feed for 4 h.
Catalytic performance of 1–3% Ag/Al2O3 in NOx SCR after suchsulfur treatment at 200–227 ◦C is shown in Fig. 1d. Lowering deacti-vation temperature from 250 ◦C to 200 ◦C leads to a very small shiftof the low-temperature activity within 5 ◦C, therefore, the tem-perature difference is not the determining factor for the observedactivity difference. 1% Ag/Al2O3 was poisoned to the highest degree,whereas higher Ag loading led to better sulfur tolerance with3% Ag/Al2O3 showing the highest NOx conversion at T < 300 ◦C. Itshould be noted that after exposure to SO2 (and even after regenera-tion of 1% and 2% Ag/Al2O3 catalysts at 670 ◦C) the NH3 conversionprofiles coincided with the NOx conversion profiles for all testedsamples. That indicates quenching of NH3 unselective oxidationover 1–3% Ag/Al2O3 by SO2. Due to the similarity of NOx and NH3conversion curves for the sulfated catalysts only NOx conversionswill be reported throughout the article.
Sulfation of 2 and 3% Ag/Al2O3 leads not only to a shift of themaximum NOx conversion to higher temperatures but also to anincrease to significantly higher values than demonstrated over thefresh catalysts. The shift of the maximum activity of 2% Ag/Al2O3along with “activation” of the catalyst at 227 ◦C (near the conver-sion maximum of the fresh catalyst) and at 250 ◦C can be seen inFig. 1c. Higher SO2 exposure leads to a shift of the maximum NOx
conversion to higher temperatures along with deterioration of thelow-temperature activity. The activity gain induced by sulfationhas been observed earlier and attributed to the redistribution of Agspecies [4]. However, as we have observed the decrease of unselec-tive NH3 oxidation after SO2 exposure, we suppose the SOx blockingof sites active in NH3 and H2 oxidation to play a major role in theincreased NOx conversion over 2 and 3% Ag/Al2O3 catalysts. At thesame time SO2 adsorption increases the alumina acidity which canalso play the role for the SCR activity as discussed in a separatepublication [17].
Several options for the catalyst regeneration under hydrocar-bon (HC) SCR have been suggested in the literature. All of theminclude heating sulfated Ag/Al2O3 in different media – oxidizing[9], hydrogen (or hydrocarbon)-containing lean exhaust [6,8–10]or rich exhaust [6,9].
Heating sulfated 2% Ag/Al2O3 to 670 ◦C for 10 min in the NOx
SCR feed without hydrogen leads only to a small 10 ◦C shift ofT50% to lower temperatures (not shown). Therefore, regenerationof Ag/Al2O3 for NOx SCR by NH3 without co-feeding hydrogen isineffective. Thus, regeneration at 670 ◦C in the reaction gas mixture
was used to test the regeneration capability of 1–3% Ag/Al2O3 cata-lysts. Activity of the catalysts regenerated during 40 min is reportedin Fig. 1e. All catalysts partially regained the low-temperature activ-ity, however, the high-temperature activity of 3% Ag/Al2O3 was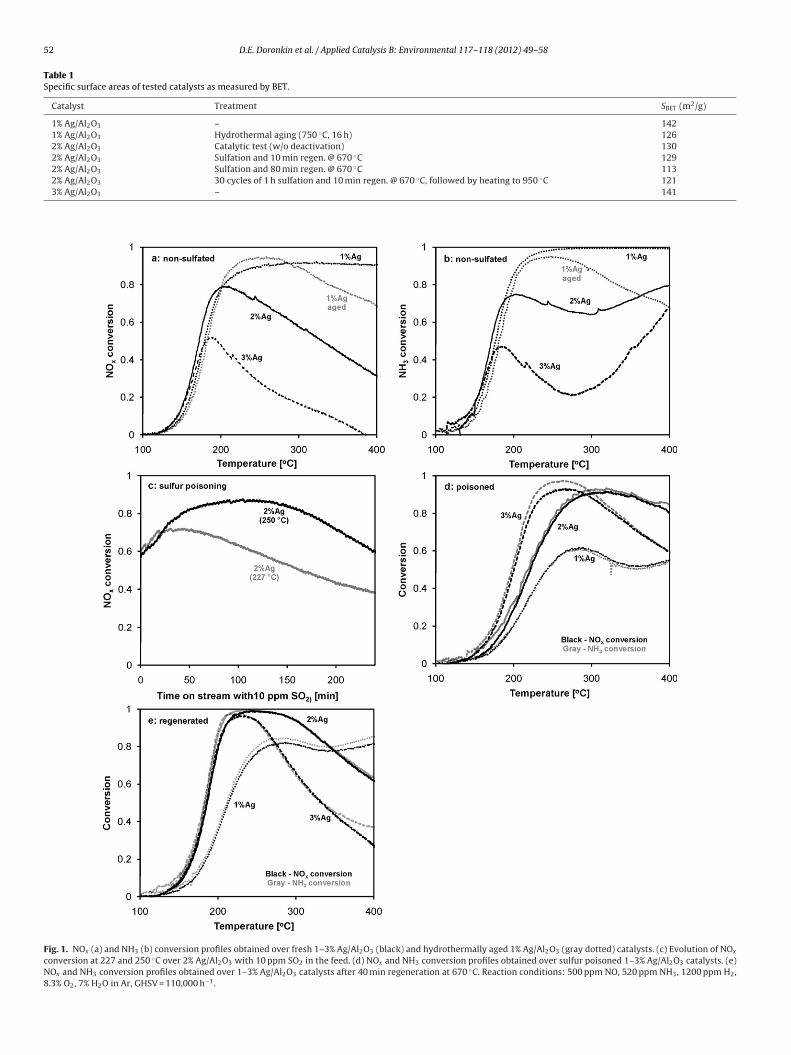
52 D.E. Doronkin et al. / Applied Catalysis B: Environmental 117– 118 (2012) 49– 58
Table 1Specific surface areas of tested catalysts as measured by BET.
Catalyst Treatment SBET (m2/g)
1% Ag/Al2O3 – 1421% Ag/Al2O3 Hydrothermal aging (750 ◦C, 16 h) 1262% Ag/Al2O3 Catalytic test (w/o deactivation) 1302% Ag/Al2O3 Sulfation and 10 min regen. @ 670 ◦C 1292% Ag/Al2O3 Sulfation and 80 min regen. @ 670 ◦C 113
FcN8
2% Ag/Al2O3 30 cycles of 1 h sulfation and 10 min regen. @ 63% Ag/Al2O3 –
ig. 1. NOx (a) and NH3 (b) conversion profiles obtained over fresh 1–3% Ag/Al2O3 (black)onversion at 227 and 250 ◦C over 2% Ag/Al2O3 with 10 ppm SO2 in the feed. (d) NOx and
Ox and NH3 conversion profiles obtained over 1–3% Ag/Al2O3 catalysts after 40 min rege.3% O2, 7% H2O in Ar, GHSV = 110,000 h−1.
70 ◦C, followed by heating to 950 ◦C 121141
and hydrothermally aged 1% Ag/Al2O3 (gray dotted) catalysts. (c) Evolution of NOx
NH3 conversion profiles obtained over sulfur poisoned 1–3% Ag/Al2O3 catalysts. (e)neration at 670 ◦C. Reaction conditions: 500 ppm NO, 520 ppm NH3, 1200 ppm H2,
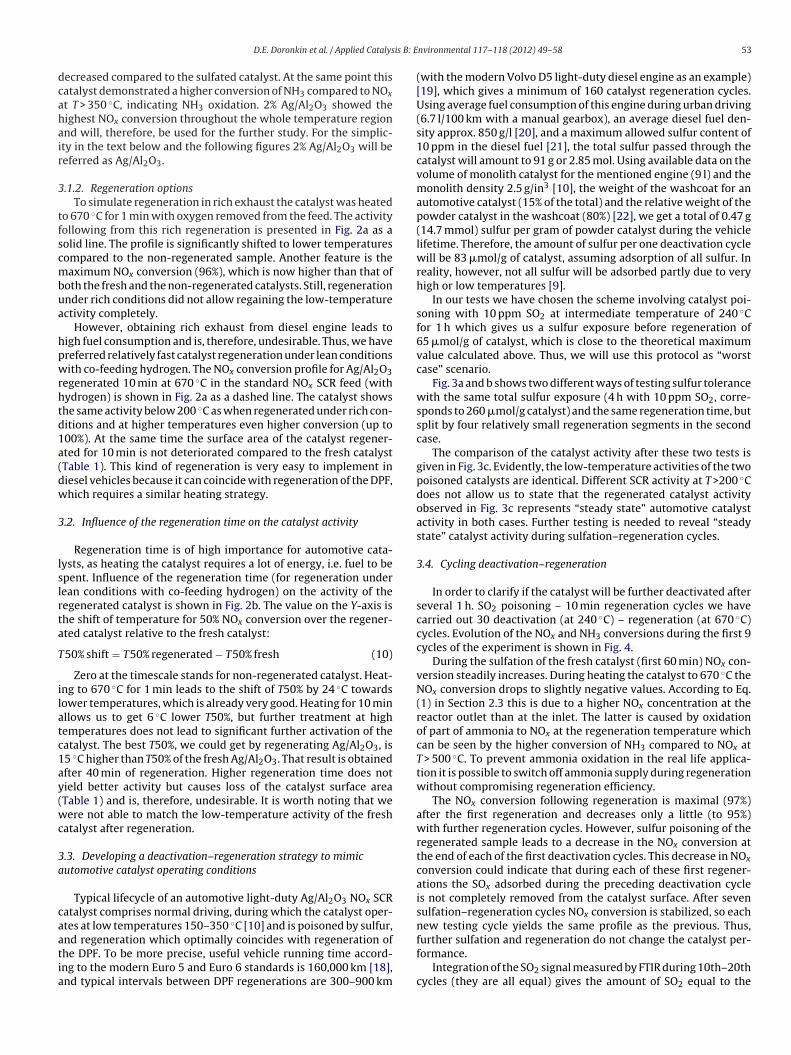
is B: E
dcahair
3
tfscmbua
hpwrhtd1a(dw
3
lslrta
T
ilatc1ay(wc
3a
caatia
D.E. Doronkin et al. / Applied Catalys
ecreased compared to the sulfated catalyst. At the same point thisatalyst demonstrated a higher conversion of NH3 compared to NOx
t T > 350 ◦C, indicating NH3 oxidation. 2% Ag/Al2O3 showed theighest NOx conversion throughout the whole temperature regionnd will, therefore, be used for the further study. For the simplic-ty in the text below and the following figures 2% Ag/Al2O3 will beeferred as Ag/Al2O3.
.1.2. Regeneration optionsTo simulate regeneration in rich exhaust the catalyst was heated
o 670 ◦C for 1 min with oxygen removed from the feed. The activityollowing from this rich regeneration is presented in Fig. 2a as aolid line. The profile is significantly shifted to lower temperaturesompared to the non-regenerated sample. Another feature is theaximum NOx conversion (96%), which is now higher than that of
oth the fresh and the non-regenerated catalysts. Still, regenerationnder rich conditions did not allow regaining the low-temperaturectivity completely.
However, obtaining rich exhaust from diesel engine leads toigh fuel consumption and is, therefore, undesirable. Thus, we havereferred relatively fast catalyst regeneration under lean conditionsith co-feeding hydrogen. The NOx conversion profile for Ag/Al2O3
egenerated 10 min at 670 ◦C in the standard NOx SCR feed (withydrogen) is shown in Fig. 2a as a dashed line. The catalyst showshe same activity below 200 ◦C as when regenerated under rich con-itions and at higher temperatures even higher conversion (up to00%). At the same time the surface area of the catalyst regener-ted for 10 min is not deteriorated compared to the fresh catalystTable 1). This kind of regeneration is very easy to implement iniesel vehicles because it can coincide with regeneration of the DPF,hich requires a similar heating strategy.
.2. Influence of the regeneration time on the catalyst activity
Regeneration time is of high importance for automotive cata-ysts, as heating the catalyst requires a lot of energy, i.e. fuel to bepent. Influence of the regeneration time (for regeneration underean conditions with co-feeding hydrogen) on the activity of theegenerated catalyst is shown in Fig. 2b. The value on the Y-axis ishe shift of temperature for 50% NOx conversion over the regener-ted catalyst relative to the fresh catalyst:
50% shift = T50% regenerated − T50% fresh (10)
Zero at the timescale stands for non-regenerated catalyst. Heat-ng to 670 ◦C for 1 min leads to the shift of T50% by 24 ◦C towardsower temperatures, which is already very good. Heating for 10 minllows us to get 6 ◦C lower T50%, but further treatment at highemperatures does not lead to significant further activation of theatalyst. The best T50%, we could get by regenerating Ag/Al2O3, is5 ◦C higher than T50% of the fresh Ag/Al2O3. That result is obtainedfter 40 min of regeneration. Higher regeneration time does notield better activity but causes loss of the catalyst surface areaTable 1) and is, therefore, undesirable. It is worth noting that weere not able to match the low-temperature activity of the fresh
atalyst after regeneration.
.3. Developing a deactivation–regeneration strategy to mimicutomotive catalyst operating conditions
Typical lifecycle of an automotive light-duty Ag/Al2O3 NOx SCRatalyst comprises normal driving, during which the catalyst oper-tes at low temperatures 150–350 ◦C [10] and is poisoned by sulfur,
nd regeneration which optimally coincides with regeneration ofhe DPF. To be more precise, useful vehicle running time accord-ng to the modern Euro 5 and Euro 6 standards is 160,000 km [18],nd typical intervals between DPF regenerations are 300–900 kmnvironmental 117– 118 (2012) 49– 58 53
(with the modern Volvo D5 light-duty diesel engine as an example)[19], which gives a minimum of 160 catalyst regeneration cycles.Using average fuel consumption of this engine during urban driving(6.7 l/100 km with a manual gearbox), an average diesel fuel den-sity approx. 850 g/l [20], and a maximum allowed sulfur content of10 ppm in the diesel fuel [21], the total sulfur passed through thecatalyst will amount to 91 g or 2.85 mol. Using available data on thevolume of monolith catalyst for the mentioned engine (9 l) and themonolith density 2.5 g/in3 [10], the weight of the washcoat for anautomotive catalyst (15% of the total) and the relative weight of thepowder catalyst in the washcoat (80%) [22], we get a total of 0.47 g(14.7 mmol) sulfur per gram of powder catalyst during the vehiclelifetime. Therefore, the amount of sulfur per one deactivation cyclewill be 83 �mol/g of catalyst, assuming adsorption of all sulfur. Inreality, however, not all sulfur will be adsorbed partly due to veryhigh or low temperatures [9].
In our tests we have chosen the scheme involving catalyst poi-soning with 10 ppm SO2 at intermediate temperature of 240 ◦Cfor 1 h which gives us a sulfur exposure before regeneration of65 �mol/g of catalyst, which is close to the theoretical maximumvalue calculated above. Thus, we will use this protocol as “worstcase” scenario.
Fig. 3a and b shows two different ways of testing sulfur tolerancewith the same total sulfur exposure (4 h with 10 ppm SO2, corre-sponds to 260 �mol/g catalyst) and the same regeneration time, butsplit by four relatively small regeneration segments in the secondcase.
The comparison of the catalyst activity after these two tests isgiven in Fig. 3c. Evidently, the low-temperature activities of the twopoisoned catalysts are identical. Different SCR activity at T >200 ◦Cdoes not allow us to state that the regenerated catalyst activityobserved in Fig. 3c represents “steady state” automotive catalystactivity in both cases. Further testing is needed to reveal “steadystate” catalyst activity during sulfation–regeneration cycles.
3.4. Cycling deactivation–regeneration
In order to clarify if the catalyst will be further deactivated afterseveral 1 h. SO2 poisoning – 10 min regeneration cycles we havecarried out 30 deactivation (at 240 ◦C) – regeneration (at 670 ◦C)cycles. Evolution of the NOx and NH3 conversions during the first 9cycles of the experiment is shown in Fig. 4.
During the sulfation of the fresh catalyst (first 60 min) NOx con-version steadily increases. During heating the catalyst to 670 ◦C theNOx conversion drops to slightly negative values. According to Eq.(1) in Section 2.3 this is due to a higher NOx concentration at thereactor outlet than at the inlet. The latter is caused by oxidationof part of ammonia to NOx at the regeneration temperature whichcan be seen by the higher conversion of NH3 compared to NOx atT > 500 ◦C. To prevent ammonia oxidation in the real life applica-tion it is possible to switch off ammonia supply during regenerationwithout compromising regeneration efficiency.
The NOx conversion following regeneration is maximal (97%)after the first regeneration and decreases only a little (to 95%)with further regeneration cycles. However, sulfur poisoning of theregenerated sample leads to a decrease in the NOx conversion atthe end of each of the first deactivation cycles. This decrease in NOx
conversion could indicate that during each of these first regener-ations the SOx adsorbed during the preceding deactivation cycleis not completely removed from the catalyst surface. After sevensulfation–regeneration cycles NOx conversion is stabilized, so eachnew testing cycle yields the same profile as the previous. Thus,
further sulfation and regeneration do not change the catalyst per-formance.Integration of the SO2 signal measured by FTIR during 10th–20thcycles (they are all equal) gives the amount of SO2 equal to the
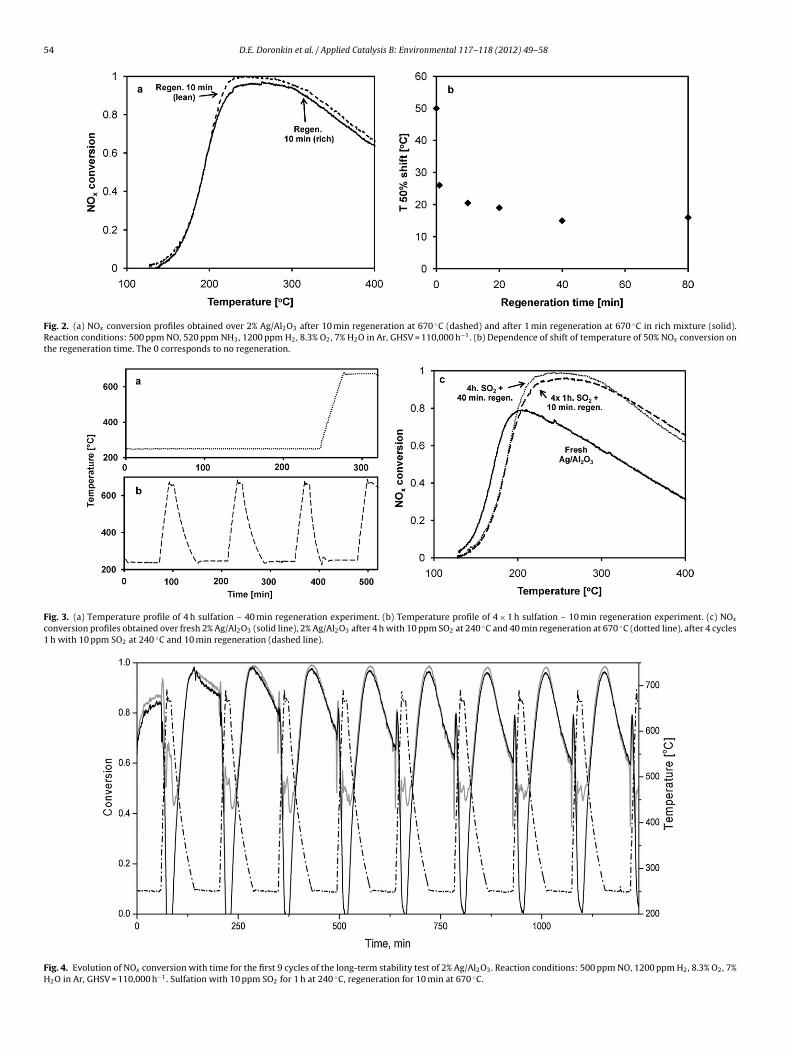
54 D.E. Doronkin et al. / Applied Catalysis B: Environmental 117– 118 (2012) 49– 58
Fig. 2. (a) NOx conversion profiles obtained over 2% Ag/Al2O3 after 10 min regeneration at 670 ◦C (dashed) and after 1 min regeneration at 670 ◦C in rich mixture (solid).Reaction conditions: 500 ppm NO, 520 ppm NH3, 1200 ppm H2, 8.3% O2, 7% H2O in Ar, GHSV = 110,000 h−1. (b) Dependence of shift of temperature of 50% NOx conversion onthe regeneration time. The 0 corresponds to no regeneration.
Fig. 3. (a) Temperature profile of 4 h sulfation – 40 min regeneration experiment. (b) Temperature profile of 4 × 1 h sulfation – 10 min regeneration experiment. (c) NOx
conversion profiles obtained over fresh 2% Ag/Al2O3 (solid line), 2% Ag/Al2O3 after 4 h with 10 ppm SO2 at 240 ◦C and 40 min regeneration at 670 ◦C (dotted line), after 4 cycles1 h with 10 ppm SO2 at 240 ◦C and 10 min regeneration (dashed line).
Fig. 4. Evolution of NOx conversion with time for the first 9 cycles of the long-term stability test of 2% Ag/Al2O3. Reaction conditions: 500 ppm NO, 1200 ppm H2, 8.3% O2, 7%H2O in Ar, GHSV = 110,000 h−1. Sulfation with 10 ppm SO2 for 1 h at 240 ◦C, regeneration for 10 min at 670 ◦C.
is B: E
aTwt
ccTai
3
fmb
eilcrstfvtlhF
isAbs
msaa
SsAhaaaAswlw
spsrtH
ga(
D.E. Doronkin et al. / Applied Catalys
mount of SO2 passed through the catalyst during these cycles.herefore, using FTIR data we can estimate the amount of SO2,hich was accumulated in the catalyst and not desorbed during
he first regenerations to be 0.11 mmol/g catalyst.Our data (not shown) suggests that the SO2 poisoning effect is
umulative in the range of SO2 concentrations 0.5–10 ppm, i.e. theatalyst deactivation degree depends only on total SO2 exposure.herefore, with the same SOx exposure between DPF regenerationss in this study real catalyst performance will be high enough evenn the end of a sulfation cycle before the next regeneration.
.5. Mechanism of Ag/Al2O3 sulfation and regeneration
The results obtained in the previous Section 3.4 set the groundor a few conclusions regarding the sulfation and regeneration
echanisms for Ag/Al2O3 catalysts of hydrogen-assisted NOx SCRy NH3.
First of all, some amount of SOx is not desorbed after regen-ration. This amount was estimated in the previous section ands reproducible. At the same time we cannot regenerate the fullow-temperature activity of Ag/Al2O3, no matter if lean hydrogen-ontaining or rich mixtures were used for the regeneration. The SCReaction onset for the sulfated and regenerated catalyst is alwayshifted to higher temperatures. Therefore, we suppose that a cer-ain type of active sites exists (name it “Type I”), which standor Ag/Al2O3 activity at low temperatures (<200 ◦C) that are irre-ersibly poisoned by SO2 and cannot be regenerated using standardechniques. Taking into account the very low sulfur tolerance ofow-loaded Ag/Al2O3 [6,7], we can attribute Type I active sites toighly dispersed silver e.g. Ag�+ atoms or Ag+ ions [23,24] (seeig. 5).
SOx adsorption on the alumina surface (where dispersed silvers localized) blocks these Type I active sites. SOx can be adsorbed oningle-atom Ag sites on the alumina as well as on the neighboringl atoms. It is impossible to desorb SOx from the alumina surfacey heating the catalyst to 670 ◦C [25] and, therefore, Type I activeites could not be regenerated.
Another evidence of irreversibly poisoned active sites is the for-ation of excess of nitrogen dioxide over the fresh catalyst (Fig. 6b,
olid line), a catalytic function which is irreversibly poisoned by SO2nd cannot be regenerated (Fig. 6b, dotted line). Therefore, we alsottribute the increased NO oxidation capacity to Type I active sites.
However, the possibility of regeneration of the most of theCR activity of Ag/Al2O3 hints on the existence of “Type II” activeites. As they are more abundant in more SO2 tolerant high-loadedg/Al2O3 [7] we attribute them to the surface of Ag nanoparticles. Itas been shown that it is possible to desorb SO2 from the Ag surfacet temperatures near 600 ◦C [25]. Thus, we assume that sulfationnd regeneration of these Type II active sites determines the SCRctivity of Ag/Al2O3 with sulfur-containing fuel in diesel vehicles.ccording to the SCR mechanism suggested in [16] these Type IIpecies are also capable of oxidizing NO to NO2 which further reactsith NH3 over alumina. However, Type II sites are less active which
eads to the deficit of NO2 and prevents observing it in the gas phasehen NH3 is present.
Our assumption about the existence and function of Type I activeites can be verified by the following. As follows from the SO2 TPDrofiles in Refs. [11,25], it is possible to desorb SOx from aluminaurface at ca. 1000 ◦C. Of course, the alumina will undergo partialestructuring at this temperature [26] accompanied by the forma-ion of the �-Al2O3 phase, which will partially ruin the catalyst.owever, this may help to test the principle.
The results of heating of sulfated Ag/Al2O3 to 950 ◦C in the SCRas mixture with further immediate cooling are shown in Fig. 6and b as dashed lines. By removing SOx from the alumina surfaceobserved by FTIR) we were able to regain SCR onset at the same
nvironmental 117– 118 (2012) 49– 58 55
temperature as for the fresh Ag/Al2O3 (Fig. 6a). At the same time wewere able to regenerate excessive NO2 production (Fig. 6b) whichwas impossible to get by any kind of regeneration at lower tempera-ture. Still, the maximum activity of the catalyst was lower than thatof the fresh catalyst resembling the activity of 3% Ag/Al2O3 (Fig. 1a).The specific surface area of the catalyst regenerated at 950 ◦C didnot change significantly compared to the fresh sample (Table 1),therefore, it is rather sintering of Ag particles which caused a dropin the maximum activity. Thus, we consider possibility of regener-ating low temperature activity as an evidence for the existence ofseveral types of active sites in Ag/Al2O3 as was previously statedfor HC-SCR Ag/Al2O3 catalysts [27].
The fact that SOx irreversibly adsorbed on the alumina surfacedoes not hinder that the SCR reaction can be explained if we assumethat Ag species participate in the oxidation of NO to NO2 and thealumina facilitates further reaction of NO, NO2 and NH3 accordingto the “Fast SCR” mechanism [28]. Since “Fast SCR” occurs over anumber of acidic surfaces, sulfated alumina should catalyze SCR aswell if SOx-free Ag surface is left to oxidize NO.
3.6. Evaluation of the proposed sulfation and regenerationmechanism of Ag/Al2O3 by DFT
Adsorption energies of SO2, SO3, and SO4 for the most energeti-cally favorable adsorption geometries for different adsorption sitesare summarized in Table 2 and the corresponding geometries forthe �-alumina model step surface are shown in Fig. 7. It shouldbe noted that SOx can be adsorbed on the �-alumina in differentconfigurations with similar energies and only the lowest energies(strongest adsorption) are shown. The DFT calculation shows thatthe SOx adsorbs strongly on the step sites which is expected fromthe low coordination of these sites and the steric freedom avail-able at the step sites [29–31]. At the same time the surface stepis representative of small 1–3 nm nanoparticles containing mostlyunder-coordinated surface atoms [32].
Two trends can be identified from these values. First global trendis that all types of SOx bind significantly stronger to the alumina sur-face than the metal surface. The adsorption sites also include singleAg sites at the alumina surface with Ag atom built in the surfacesubstituting Al is binding SOx most strongly (see Supplementarymaterial for the exact site geometry). This can be explained by athermodynamically unfavorable defect structure of this site. Sec-ondly, the oxidation of SO2 to SO3 is thermodynamically favorable,with subsequent poisoning of the catalyst surface by the resultingSO3. This has been suggested in Ref. [9] and probably involves reac-tion with NO2 [11]. SO2 alone cannot be adsorbed on the studiedmetallic Ag surfaces under reaction conditions and SOx can, thus,only poison the alumina support or single Ag sites on this surface.
The calculated desorption temperatures (Table 2) are low butthe order, at which regeneration of Type II (Ag surface) and Type I(highly dispersed Ag on the alumina) occurs is in agreement withthe mechanism of Ag/Al2O3 poisoning and regeneration suggestedin Section 3.5. The difference between calculated and experimentaldesorption temperatures [11,25] might indicate the formation ofbulk silver sulfate [7,33,34].
At the same time addition of hydrogen significantly enhancescatalyst regeneration i.e. removal of SOx which could be due tothe formation of the correspondent HSOx species with their subse-quent desorption. Table 3 shows the energies of the HSOx speciesin the gas phase and adsorbed on the most energetically favorablesites. According to the given numbers, the formation of HSOx ishighly favorable on Ag (2 1 1). As the adsorption energies of the
HSOx species with respect to the gas phase species H2SO3 (g) andH2SO4 (g) are very small they are easily desorbed. The formationof HSOx is not favorable on the model �-Al2O3 step surface and atthe site with Ag built into the �-Al2O3 model step surface. Thus,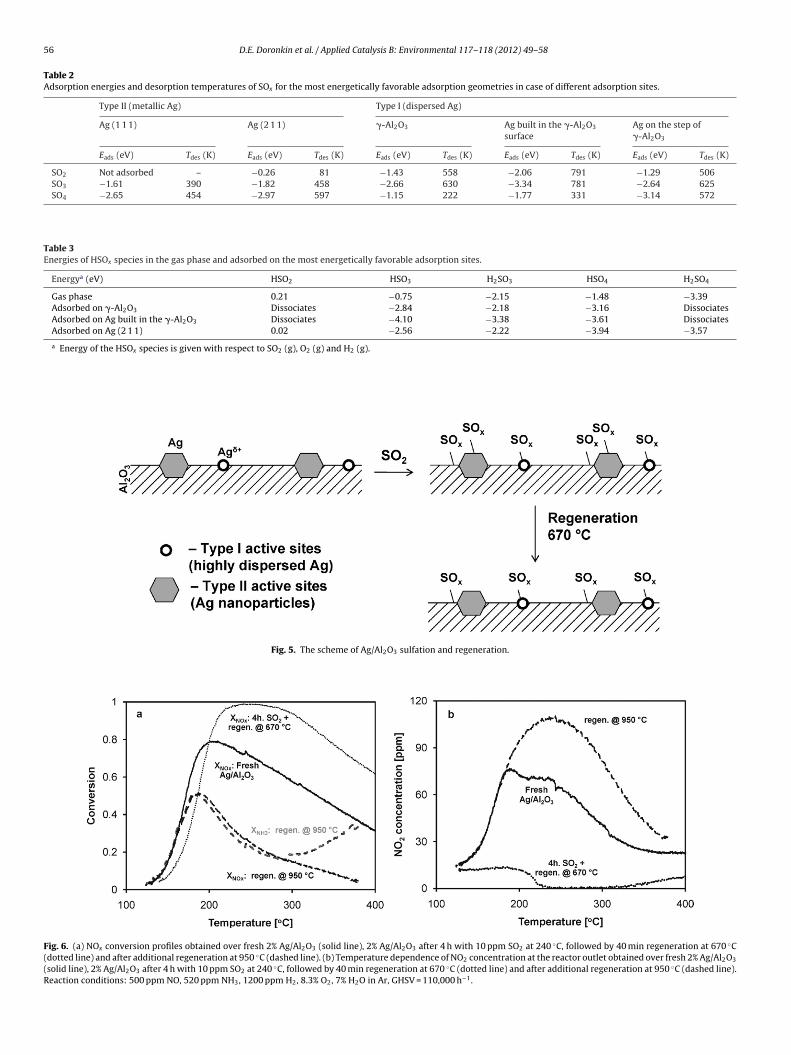
56 D.E. Doronkin et al. / Applied Catalysis B: Environmental 117– 118 (2012) 49– 58
Table 2Adsorption energies and desorption temperatures of SOx for the most energetically favorable adsorption geometries in case of different adsorption sites.
Type II (metallic Ag) Type I (dispersed Ag)
Ag (1 1 1) Ag (2 1 1) �-Al2O3 Ag built in the �-Al2O3
surfaceAg on the step of�-Al2O3
Eads (eV) Tdes (K) Eads (eV) Tdes (K) Eads (eV) Tdes (K) Eads (eV) Tdes (K) Eads (eV) Tdes (K)
SO2 Not adsorbed – −0.26 81 −1.43 558 −2.06 791 −1.29 506SO3 −1.61 390 −1.82 458 −2.66 630 −3.34 781 −2.64 625SO4 −2.65 454 −2.97 597 −1.15 222 −1.77 331 −3.14 572
Table 3Energies of HSOx species in the gas phase and adsorbed on the most energetically favorable adsorption sites.
Energya (eV) HSO2 HSO3 H2SO3 HSO4 H2SO4
Gas phase 0.21 −0.75 −2.15 −1.48 −3.39Adsorbed on �-Al2O3 Dissociates −2.84 −2.18 −3.16 DissociatesAdsorbed on Ag built in the �-Al2O3 Dissociates −4.10 −3.38 −3.61 Dissociates
F((R
Adsorbed on Ag (2 1 1) 0.02 −2.
a Energy of the HSOx species is given with respect to SO2 (g), O2 (g) and H2 (g).
Fig. 5. The scheme of Ag/Al2O3 s
ig. 6. (a) NOx conversion profiles obtained over fresh 2% Ag/Al2O3 (solid line), 2% Ag/Al2dotted line) and after additional regeneration at 950 ◦C (dashed line). (b) Temperature depsolid line), 2% Ag/Al2O3 after 4 h with 10 ppm SO2 at 240 ◦C, followed by 40 min regenerateaction conditions: 500 ppm NO, 520 ppm NH3, 1200 ppm H2, 8.3% O2, 7% H2O in Ar, GH
56 −2.22 −3.94 −3.57
ulfation and regeneration.
O3 after 4 h with 10 ppm SO2 at 240 ◦C, followed by 40 min regeneration at 670 ◦Cendence of NO2 concentration at the reactor outlet obtained over fresh 2% Ag/Al2O3
ion at 670 ◦C (dotted line) and after additional regeneration at 950 ◦C (dashed line).SV = 110,000 h−1.
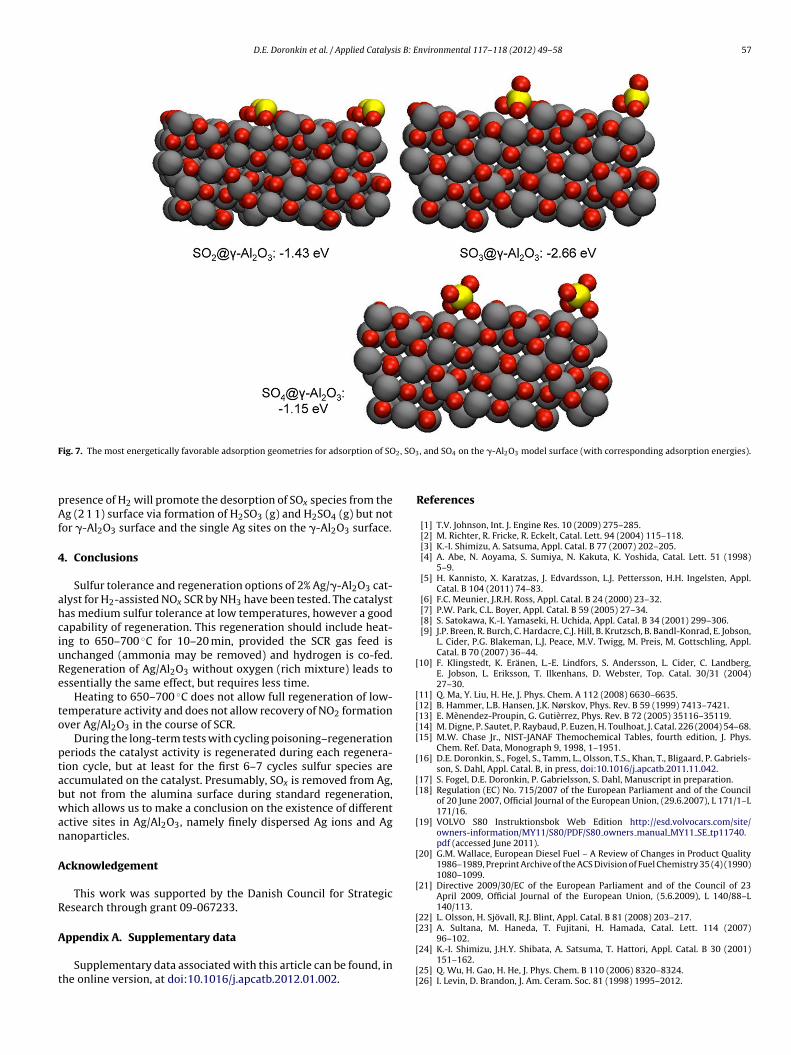
D.E. Doronkin et al. / Applied Catalysis B: Environmental 117– 118 (2012) 49– 58 57
F 2, SO3
pAf
4
ahciuRe
to
ptabwan
A
R
A
t
[
[[[[[
[
[[
[
[
[
[[
ig. 7. The most energetically favorable adsorption geometries for adsorption of SO
resence of H2 will promote the desorption of SOx species from theg (2 1 1) surface via formation of H2SO3 (g) and H2SO4 (g) but not
or �-Al2O3 surface and the single Ag sites on the �-Al2O3 surface.
. Conclusions
Sulfur tolerance and regeneration options of 2% Ag/�-Al2O3 cat-lyst for H2-assisted NOx SCR by NH3 have been tested. The catalystas medium sulfur tolerance at low temperatures, however a goodapability of regeneration. This regeneration should include heat-ng to 650–700 ◦C for 10–20 min, provided the SCR gas feed isnchanged (ammonia may be removed) and hydrogen is co-fed.egeneration of Ag/Al2O3 without oxygen (rich mixture) leads tossentially the same effect, but requires less time.
Heating to 650–700 ◦C does not allow full regeneration of low-emperature activity and does not allow recovery of NO2 formationver Ag/Al2O3 in the course of SCR.
During the long-term tests with cycling poisoning–regenerationeriods the catalyst activity is regenerated during each regenera-ion cycle, but at least for the first 6–7 cycles sulfur species areccumulated on the catalyst. Presumably, SOx is removed from Ag,ut not from the alumina surface during standard regeneration,hich allows us to make a conclusion on the existence of different
ctive sites in Ag/Al2O3, namely finely dispersed Ag ions and Aganoparticles.
cknowledgement
This work was supported by the Danish Council for Strategicesearch through grant 09-067233.
ppendix A. Supplementary data
Supplementary data associated with this article can be found, inhe online version, at doi:10.1016/j.apcatb.2012.01.002.
[
[[
, and SO4 on the �-Al2O3 model surface (with corresponding adsorption energies).
References
[1] T.V. Johnson, Int. J. Engine Res. 10 (2009) 275–285.[2] M. Richter, R. Fricke, R. Eckelt, Catal. Lett. 94 (2004) 115–118.[3] K.-I. Shimizu, A. Satsuma, Appl. Catal. B 77 (2007) 202–205.[4] A. Abe, N. Aoyama, S. Sumiya, N. Kakuta, K. Yoshida, Catal. Lett. 51 (1998)
5–9.[5] H. Kannisto, X. Karatzas, J. Edvardsson, L.J. Pettersson, H.H. Ingelsten, Appl.
Catal. B 104 (2011) 74–83.[6] F.C. Meunier, J.R.H. Ross, Appl. Catal. B 24 (2000) 23–32.[7] P.W. Park, C.L. Boyer, Appl. Catal. B 59 (2005) 27–34.[8] S. Satokawa, K.-I. Yamaseki, H. Uchida, Appl. Catal. B 34 (2001) 299–306.[9] J.P. Breen, R. Burch, C. Hardacre, C.J. Hill, B. Krutzsch, B. Bandl-Konrad, E. Jobson,
L. Cider, P.G. Blakeman, L.J. Peace, M.V. Twigg, M. Preis, M. Gottschling, Appl.Catal. B 70 (2007) 36–44.
10] F. Klingstedt, K. Eränen, L.-E. Lindfors, S. Andersson, L. Cider, C. Landberg,E. Jobson, L. Eriksson, T. Ilkenhans, D. Webster, Top. Catal. 30/31 (2004)27–30.
11] Q. Ma, Y. Liu, H. He, J. Phys. Chem. A 112 (2008) 6630–6635.12] B. Hammer, L.B. Hansen, J.K. Nørskov, Phys. Rev. B 59 (1999) 7413–7421.13] E. Mènendez-Proupin, G. Gutièrrez, Phys. Rev. B 72 (2005) 35116–35119.14] M. Digne, P. Sautet, P. Raybaud, P. Euzen, H. Toulhoat, J. Catal. 226 (2004) 54–68.15] M.W. Chase Jr., NIST-JANAF Themochemical Tables, fourth edition, J. Phys.
Chem. Ref. Data, Monograph 9, 1998, 1–1951.16] D.E. Doronkin, S., Fogel, S., Tamm, L., Olsson, T.S., Khan, T., Bligaard, P. Gabriels-
son, S. Dahl, Appl. Catal. B, in press, doi:10.1016/j.apcatb.2011.11.042.17] S. Fogel, D.E. Doronkin, P. Gabrielsson, S. Dahl, Manuscript in preparation.18] Regulation (EC) No. 715/2007 of the European Parliament and of the Council
of 20 June 2007, Official Journal of the European Union, (29.6.2007), L 171/1–L171/16.
19] VOLVO S80 Instruktionsbok Web Edition http://esd.volvocars.com/site/owners-information/MY11/S80/PDF/S80 owners manual MY11 SE tp11740.pdf (accessed June 2011).
20] G.M. Wallace, European Diesel Fuel – A Review of Changes in Product Quality1986–1989, Preprint Archive of the ACS Division of Fuel Chemistry 35 (4) (1990)1080–1099.
21] Directive 2009/30/EC of the European Parliament and of the Council of 23April 2009, Official Journal of the European Union, (5.6.2009), L 140/88–L140/113.
22] L. Olsson, H. Sjövall, R.J. Blint, Appl. Catal. B 81 (2008) 203–217.23] A. Sultana, M. Haneda, T. Fujitani, H. Hamada, Catal. Lett. 114 (2007)
96–102.24] K.-I. Shimizu, J.H.Y. Shibata, A. Satsuma, T. Hattori, Appl. Catal. B 30 (2001)
151–162.25] Q. Wu, H. Gao, H. He, J. Phys. Chem. B 110 (2006) 8320–8324.26] I. Levin, D. Brandon, J. Am. Ceram. Soc. 81 (1998) 1995–2012.

5 is B: E
[[
[[[
[
8 D.E. Doronkin et al. / Applied Catalys
27] R. Burch, J.P. Breen, F.C. Meunier, Appl. Catal. B 39 (2002) 283–303.
28] T.C. Brüggemann, D.G. Vlachos, F.J. Keil, J. Catal. 283 (2011)178–191.29] B. Hammer, J.K. Nørskov, Adv. Catal. 45 (2000) 71–129.30] B. Hammer, O.H. Nielsen, J.K. Nørskov, Catal. Lett. 46 (1997) 31–35.31] Á. Logadóttir, J.K. Nørskov, J. Catal. 220 (2003) 273–279.
[
[
nvironmental 117– 118 (2012) 49– 58
32] T.V.W. Janssens, B.S. Clausen, B. Hvolbæk, H. Falsig, C.H. Christensen, T. Bligaard,
J.K. Nørskov, Top. Catal. 44 (2007) 15–26.33] N. Jagtap, S.B. Umbarkar, P. Miquel, P. Granger, M.K. Dongare, Appl. Catal. B 90(2009) 416–425.
34] B. Kartheuser, B.K. Hodnett, Alfredo Riva, G. Centi, H. Matralis, M. Ruwet, P.Grange, N. Passarini, Ind. Eng. Chem. Res. 30 (1991) 2105–2113.

Paper V
TN
SMa
b
c
d
e
a
ARRAA
KAHRIHU
1
ocatasedi
fsf
0h
Applied Catalysis B: Environmental 136– 137 (2013) 168– 176
Contents lists available at SciVerse ScienceDirect
Applied Catalysis B: Environmental
jo u r n al hom ep age: www.elsev ier .com/ locate /apcatb
he effect of the gas composition on hydrogen-assistedH3-SCR over Ag/Al2O3
tefanie Tamma,b, Sebastian Fogelc,d, Pär Gabrielssonc,agnus Skoglundha,e, Louise Olssona,b,∗
Competence Centre for Catalysis, Chalmers University of Technology, 412 96 Göteborg, SwedenChemical Reaction Engineering, Chalmers University of Technology, 412 96 Göteborg, SwedenHaldor Topsøe A/S, Nymøllevej 55, 2800 Kgs. Lyngby, DenmarkCenter for Individual Nanoparticle Functionality (CINF), Department of Physics, Technical University of Denmark, Fysikvej 307, 2800 Kgs. Lyngby, DenmarkApplied Surface Chemistry, Chalmers University of Technology, SE-412 96 Göteborg, Sweden
r t i c l e i n f o
rticle history:eceived 4 October 2012eceived in revised form 25 January 2013ccepted 28 January 2013vailable online xxx
eywords:g/Al2O3
2-effecteaction mechanism
nfluence of gas mixture
a b s t r a c t
In addition to high activity in hydrocarbon-SCR, Ag/Al2O3 catalysts show excellent activity for NOx reduc-tion for H2-assisted NH3-SCR already at 200 ◦C. Here, we study the influence of different gas compositionson the activity of a pre-sulfated 6 wt% Ag/Al2O3 catalyst for NOx reduction, and oxidation of NO and NH3.The catalyst displays high initial activity for NOx reduction with a maximum of about 85% at 250 ◦C.Increasing the concentration of H2 results in further increased NOx reduction. Moreover, a global stoi-chiometry between NO:NH3:H2 equal to 1:1:2 is established during selective NOx reduction conditions.When increasing the concentration of one of the reducing agents only an increase of the H2 concentrationleads to an increase in NOx reduction, while an increase of the NH3 concentration only is beneficial to alimit of an equimolar ratio between NO and NH3. Under transient conditions at constant temperature, theconcentration of NO reaches steady state fast, whereas it takes longer time for NH3 due to accumulated
2-assisted NH3-SCRrea
surface species, probably on the alumina. The oxidation of NO to NO2 is sensitive to the H2 concentrationin similarity to the SCR reaction, while higher amounts of H2 suppress the oxidation of NH3. Moreover,the dependency on the O2 concentration is much higher for the NO and NH3 oxidation than for the SCRreaction. To explain all these features a reaction mechanism is proposed in which the role of H2 is to freesilver from single oxygen atoms. Ammonia and nitric oxygen can adsorb on these sites and react probably
e silv
on the border between th. Introduction
Fuel-efficiency in vehicles has become increasingly importantwing to increasing oil prices and the concern about climatehanges. A more efficient utilization of the energy in the fuel ischieved by combustion in excess oxygen. However, these condi-ions favor the formation of NOx as a by-product which needs to bebated due to its negative impact on the environment. Strict emis-ion regulations and low exhaust gas temperatures of fuel efficientngines result in a need for catalysts which can reduce NOx in oxi-
izing exhausts already below 200 ◦C. One concept to reduce NOxn excess oxygen is selective catalytic reduction (SCR) with either
∗ Corresponding author at: Chemical Reaction Engineering, Competence Centreor Catalysis, Department of Chemical and Biological Engineering, Chalmers Univer-ity of Technology, SE-412 96 Göteborg, Sweden. Tel.: +46 31 772 4390;ax: +46 31 772 3035.
E-mail address: [email protected] (L. Olsson).
926-3373/$ – see front matter © 2013 Elsevier B.V. All rights reserved.ttp://dx.doi.org/10.1016/j.apcatb.2013.01.064
er and alumina or on the alumina surface to N2.© 2013 Elsevier B.V. All rights reserved.
hydrocarbons (HC-SCR) or ammonia/urea (NH3-SCR) as reducingagent for NOx.
Silver/alumina is known as a promising catalyst for HC-SCR andshows good catalytic activity at fairly low temperatures when smallamounts of hydrogen are added as co-reductant to the feed [1,2].One major hinder for the practical application of silver/aluminacatalysts was the sensitivity to sulphur. However, recently, it wasshown, that sulphur poisoned Ag/Al2O3 catalysts can be regen-erated under conditions which are similar to those during theregeneration of a soot filter [3]. The same authors show, that theactivity of an Ag/Al2O3 catalyst which has been exposed to sul-phur stabilizes after a few exposure and regeneration cycles [3].Moreover, they showed, that the activity of a silver/alumina cata-lyst can be higher after sulphur regeneration than freshly prepared[3]. The activity for NOx reduction varies considerably with the typeof hydrocarbon [4]. However, when NH3 is used as reducing agent
90% conversion can be achieved already at 200 ◦C [5–7]. In contrastto HC-SCR where H2 lowers the temperature at which the Ag/Al2O3catalyst is active, Ag/Al2O3 is only active for NH3-SCR in thepresence of H2. The role of this co-reductant as well as the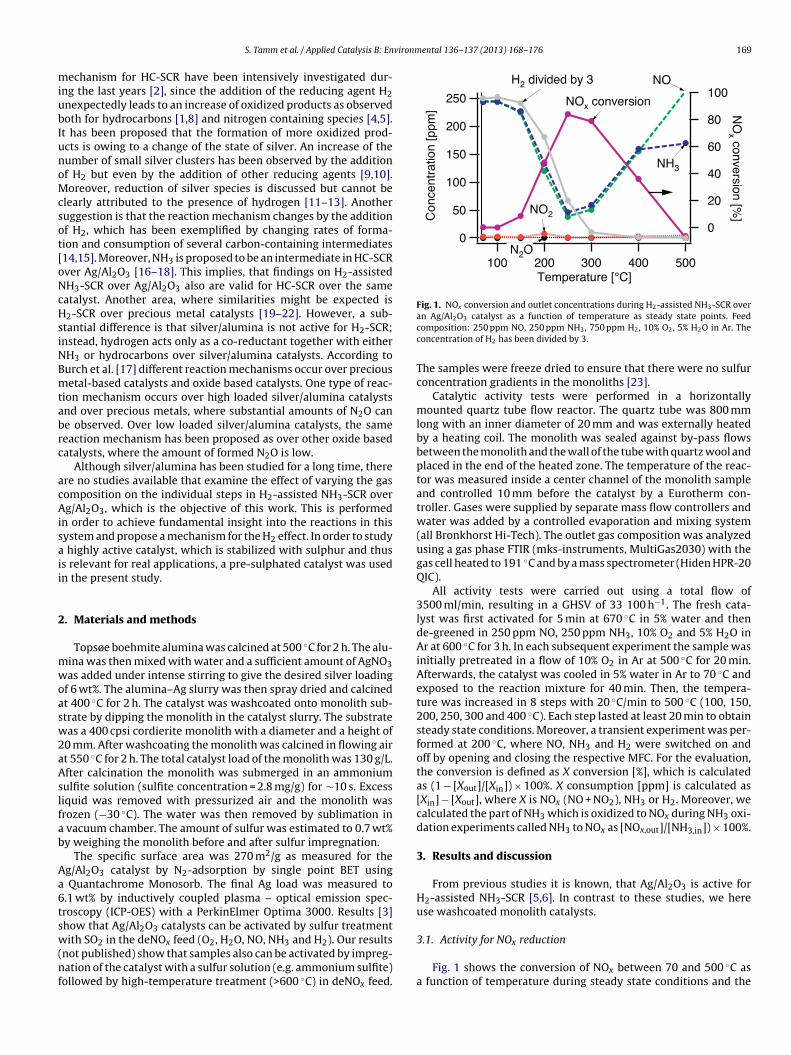
vironmental 136– 137 (2013) 168– 176 169
miubIunoMcsot[oNcHsiNBmtabrc
acAisaii
2
mwoasw2aAslfab
Aa6tsw(nf
250
200
150
100
50
0
Con
cent
ratio
n [p
pm]
500400300200100Temperature [°C ]
100
80
60
40
20
0
NO
x conversion [%]
NOx conversion
NO
NO2
N2O
NH3
H2 divided by 3
Fig. 1. NOx conversion and outlet concentrations during H2-assisted NH3-SCR over
S. Tamm et al. / Applied Catalysis B: En
echanism for HC-SCR have been intensively investigated dur-ng the last years [2], since the addition of the reducing agent H2nexpectedly leads to an increase of oxidized products as observedoth for hydrocarbons [1,8] and nitrogen containing species [4,5].t has been proposed that the formation of more oxidized prod-cts is owing to a change of the state of silver. An increase of theumber of small silver clusters has been observed by the additionf H2 but even by the addition of other reducing agents [9,10].oreover, reduction of silver species is discussed but cannot be
learly attributed to the presence of hydrogen [11–13]. Anotheruggestion is that the reaction mechanism changes by the additionf H2, which has been exemplified by changing rates of forma-ion and consumption of several carbon-containing intermediates14,15]. Moreover, NH3 is proposed to be an intermediate in HC-SCRver Ag/Al2O3 [16–18]. This implies, that findings on H2-assistedH3-SCR over Ag/Al2O3 also are valid for HC-SCR over the sameatalyst. Another area, where similarities might be expected is2-SCR over precious metal catalysts [19–22]. However, a sub-
tantial difference is that silver/alumina is not active for H2-SCR;nstead, hydrogen acts only as a co-reductant together with eitherH3 or hydrocarbons over silver/alumina catalysts. According tourch et al. [17] different reaction mechanisms occur over preciousetal-based catalysts and oxide based catalysts. One type of reac-
ion mechanism occurs over high loaded silver/alumina catalystsnd over precious metals, where substantial amounts of N2O cane observed. Over low loaded silver/alumina catalysts, the sameeaction mechanism has been proposed as over other oxide basedatalysts, where the amount of formed N2O is low.
Although silver/alumina has been studied for a long time, therere no studies available that examine the effect of varying the gasomposition on the individual steps in H2-assisted NH3-SCR overg/Al2O3, which is the objective of this work. This is performed
n order to achieve fundamental insight into the reactions in thisystem and propose a mechanism for the H2 effect. In order to study
highly active catalyst, which is stabilized with sulphur and thuss relevant for real applications, a pre-sulphated catalyst was usedn the present study.
. Materials and methods
Topsøe boehmite alumina was calcined at 500 ◦C for 2 h. The alu-ina was then mixed with water and a sufficient amount of AgNO3as added under intense stirring to give the desired silver loading
f 6 wt%. The alumina–Ag slurry was then spray dried and calcinedt 400 ◦C for 2 h. The catalyst was washcoated onto monolith sub-trate by dipping the monolith in the catalyst slurry. The substrateas a 400 cpsi cordierite monolith with a diameter and a height of
0 mm. After washcoating the monolith was calcined in flowing airt 550 ◦C for 2 h. The total catalyst load of the monolith was 130 g/L.fter calcination the monolith was submerged in an ammoniumulfite solution (sulfite concentration = 2.8 mg/g) for ∼10 s. Excessiquid was removed with pressurized air and the monolith wasrozen (−30 ◦C). The water was then removed by sublimation in
vacuum chamber. The amount of sulfur was estimated to 0.7 wt%y weighing the monolith before and after sulfur impregnation.
The specific surface area was 270 m2/g as measured for theg/Al2O3 catalyst by N2-adsorption by single point BET using
Quantachrome Monosorb. The final Ag load was measured to.1 wt% by inductively coupled plasma – optical emission spec-roscopy (ICP-OES) with a PerkinElmer Optima 3000. Results [3]how that Ag/Al2O3 catalysts can be activated by sulfur treatment
ith SO2 in the deNOx feed (O2, H2O, NO, NH3 and H2). Our resultsnot published) show that samples also can be activated by impreg-ation of the catalyst with a sulfur solution (e.g. ammonium sulfite)
ollowed by high-temperature treatment (>600 ◦C) in deNOx feed.
an Ag/Al2O3 catalyst as a function of temperature as steady state points. Feedcomposition: 250 ppm NO, 250 ppm NH3, 750 ppm H2, 10% O2, 5% H2O in Ar. Theconcentration of H2 has been divided by 3.
The samples were freeze dried to ensure that there were no sulfurconcentration gradients in the monoliths [23].
Catalytic activity tests were performed in a horizontallymounted quartz tube flow reactor. The quartz tube was 800 mmlong with an inner diameter of 20 mm and was externally heatedby a heating coil. The monolith was sealed against by-pass flowsbetween the monolith and the wall of the tube with quartz wool andplaced in the end of the heated zone. The temperature of the reac-tor was measured inside a center channel of the monolith sampleand controlled 10 mm before the catalyst by a Eurotherm con-troller. Gases were supplied by separate mass flow controllers andwater was added by a controlled evaporation and mixing system(all Bronkhorst Hi-Tech). The outlet gas composition was analyzedusing a gas phase FTIR (mks-instruments, MultiGas2030) with thegas cell heated to 191 ◦C and by a mass spectrometer (Hiden HPR-20QIC).
All activity tests were carried out using a total flow of3500 ml/min, resulting in a GHSV of 33 100 h−1. The fresh cata-lyst was first activated for 5 min at 670 ◦C in 5% water and thende-greened in 250 ppm NO, 250 ppm NH3, 10% O2 and 5% H2O inAr at 600 ◦C for 3 h. In each subsequent experiment the sample wasinitially pretreated in a flow of 10% O2 in Ar at 500 ◦C for 20 min.Afterwards, the catalyst was cooled in 5% water in Ar to 70 ◦C andexposed to the reaction mixture for 40 min. Then, the tempera-ture was increased in 8 steps with 20 ◦C/min to 500 ◦C (100, 150,200, 250, 300 and 400 ◦C). Each step lasted at least 20 min to obtainsteady state conditions. Moreover, a transient experiment was per-formed at 200 ◦C, where NO, NH3 and H2 were switched on andoff by opening and closing the respective MFC. For the evaluation,the conversion is defined as X conversion [%], which is calculatedas (1 − [Xout]/[Xin]) × 100%. X consumption [ppm] is calculated as[Xin] − [Xout], where X is NOx (NO + NO2), NH3 or H2. Moreover, wecalculated the part of NH3 which is oxidized to NOx during NH3 oxi-dation experiments called NH3 to NOx as [NOx,out]/[NH3,in]) × 100%.
3. Results and discussion
From previous studies it is known, that Ag/Al2O3 is active forH2-assisted NH3-SCR [5,6]. In contrast to these studies, we hereuse washcoated monolith catalysts.
3.1. Activity for NOx reduction
Fig. 1 shows the conversion of NOx between 70 and 500 ◦C asa function of temperature during steady state conditions and the
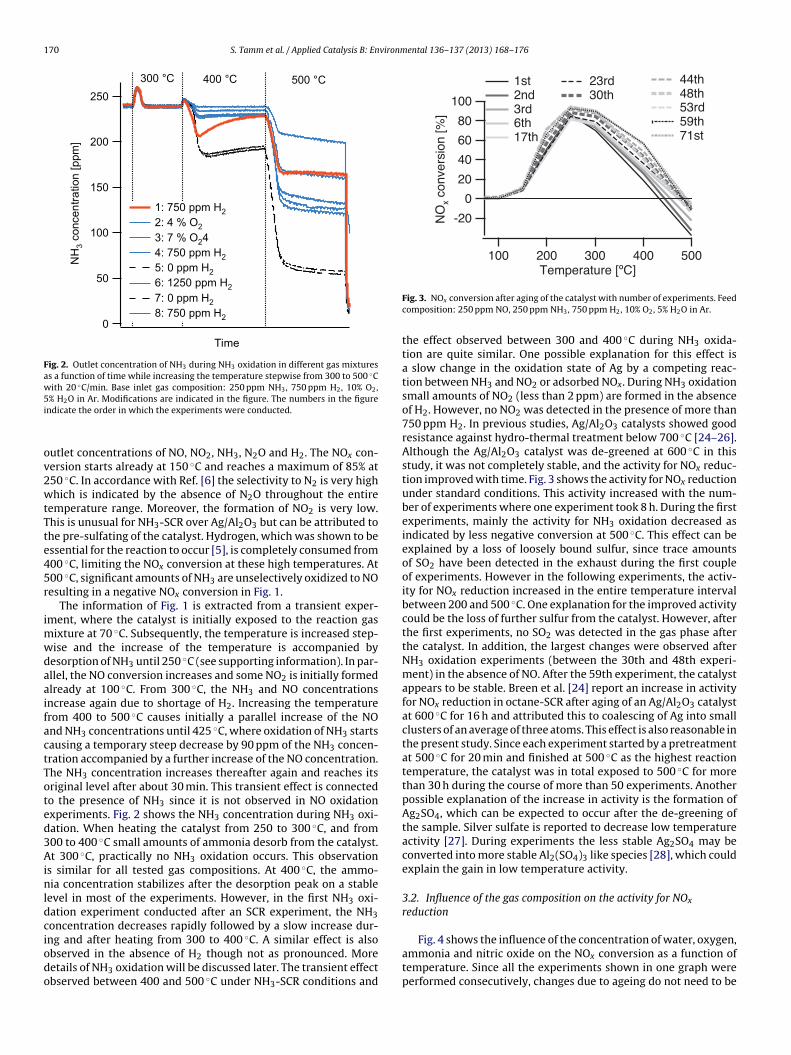
170 S. Tamm et al. / Applied Catalysis B: Environmental 136– 137 (2013) 168– 176
Fig. 2. Outlet concentration of NH3 during NH3 oxidation in different gas mixturesas a function of time while increasing the temperature stepwise from 300 to 500 ◦Cwith 20 ◦C/min. Base inlet gas composition: 250 ppm NH3, 750 ppm H2, 10% O2,5i
ov2wtTte45r
imwdaaifactToted3Ainldciodo
100
80
60
40
20
0
-20NO
x co
nver
sion
[%]
500400300200100Temperature [ºC ]
44th 48th 53rd 59th 71st
1st 23rd 2nd 30th 3rd 6th 17th
Fig. 4 shows the influence of the concentration of water, oxygen,
% H2O in Ar. Modifications are indicated in the figure. The numbers in the figurendicate the order in which the experiments were conducted.
utlet concentrations of NO, NO2, NH3, N2O and H2. The NOx con-ersion starts already at 150 ◦C and reaches a maximum of 85% at50 ◦C. In accordance with Ref. [6] the selectivity to N2 is very highhich is indicated by the absence of N2O throughout the entire
emperature range. Moreover, the formation of NO2 is very low.his is unusual for NH3-SCR over Ag/Al2O3 but can be attributed tohe pre-sulfating of the catalyst. Hydrogen, which was shown to bessential for the reaction to occur [5], is completely consumed from00 ◦C, limiting the NOx conversion at these high temperatures. At00 ◦C, significant amounts of NH3 are unselectively oxidized to NOesulting in a negative NOx conversion in Fig. 1.
The information of Fig. 1 is extracted from a transient exper-ment, where the catalyst is initially exposed to the reaction gas
ixture at 70 ◦C. Subsequently, the temperature is increased step-ise and the increase of the temperature is accompanied byesorption of NH3 until 250 ◦C (see supporting information). In par-llel, the NO conversion increases and some NO2 is initially formedlready at 100 ◦C. From 300 ◦C, the NH3 and NO concentrationsncrease again due to shortage of H2. Increasing the temperaturerom 400 to 500 ◦C causes initially a parallel increase of the NOnd NH3 concentrations until 425 ◦C, where oxidation of NH3 startsausing a temporary steep decrease by 90 ppm of the NH3 concen-ration accompanied by a further increase of the NO concentration.he NH3 concentration increases thereafter again and reaches itsriginal level after about 30 min. This transient effect is connectedo the presence of NH3 since it is not observed in NO oxidationxperiments. Fig. 2 shows the NH3 concentration during NH3 oxi-ation. When heating the catalyst from 250 to 300 ◦C, and from00 to 400 ◦C small amounts of ammonia desorb from the catalyst.t 300 ◦C, practically no NH3 oxidation occurs. This observation
s similar for all tested gas compositions. At 400 ◦C, the ammo-ia concentration stabilizes after the desorption peak on a stable
evel in most of the experiments. However, in the first NH3 oxi-ation experiment conducted after an SCR experiment, the NH3oncentration decreases rapidly followed by a slow increase dur-ng and after heating from 300 to 400 ◦C. A similar effect is also
bserved in the absence of H2 though not as pronounced. Moreetails of NH3 oxidation will be discussed later. The transient effectbserved between 400 and 500 ◦C under NH3-SCR conditions andFig. 3. NOx conversion after aging of the catalyst with number of experiments. Feedcomposition: 250 ppm NO, 250 ppm NH3, 750 ppm H2, 10% O2, 5% H2O in Ar.
the effect observed between 300 and 400 ◦C during NH3 oxida-tion are quite similar. One possible explanation for this effect isa slow change in the oxidation state of Ag by a competing reac-tion between NH3 and NO2 or adsorbed NOx. During NH3 oxidationsmall amounts of NO2 (less than 2 ppm) are formed in the absenceof H2. However, no NO2 was detected in the presence of more than750 ppm H2. In previous studies, Ag/Al2O3 catalysts showed goodresistance against hydro-thermal treatment below 700 ◦C [24–26].Although the Ag/Al2O3 catalyst was de-greened at 600 ◦C in thisstudy, it was not completely stable, and the activity for NOx reduc-tion improved with time. Fig. 3 shows the activity for NOx reductionunder standard conditions. This activity increased with the num-ber of experiments where one experiment took 8 h. During the firstexperiments, mainly the activity for NH3 oxidation decreased asindicated by less negative conversion at 500 ◦C. This effect can beexplained by a loss of loosely bound sulfur, since trace amountsof SO2 have been detected in the exhaust during the first coupleof experiments. However in the following experiments, the activ-ity for NOx reduction increased in the entire temperature intervalbetween 200 and 500 ◦C. One explanation for the improved activitycould be the loss of further sulfur from the catalyst. However, afterthe first experiments, no SO2 was detected in the gas phase afterthe catalyst. In addition, the largest changes were observed afterNH3 oxidation experiments (between the 30th and 48th experi-ment) in the absence of NO. After the 59th experiment, the catalystappears to be stable. Breen et al. [24] report an increase in activityfor NOx reduction in octane-SCR after aging of an Ag/Al2O3 catalystat 600 ◦C for 16 h and attributed this to coalescing of Ag into smallclusters of an average of three atoms. This effect is also reasonable inthe present study. Since each experiment started by a pretreatmentat 500 ◦C for 20 min and finished at 500 ◦C as the highest reactiontemperature, the catalyst was in total exposed to 500 ◦C for morethan 30 h during the course of more than 50 experiments. Anotherpossible explanation of the increase in activity is the formation ofAg2SO4, which can be expected to occur after the de-greening ofthe sample. Silver sulfate is reported to decrease low temperatureactivity [27]. During experiments the less stable Ag2SO4 may beconverted into more stable Al2(SO4)3 like species [28], which couldexplain the gain in low temperature activity.
3.2. Influence of the gas composition on the activity for NOx
reduction
ammonia and nitric oxide on the NOx conversion as a function oftemperature. Since all the experiments shown in one graph wereperformed consecutively, changes due to ageing do not need to be
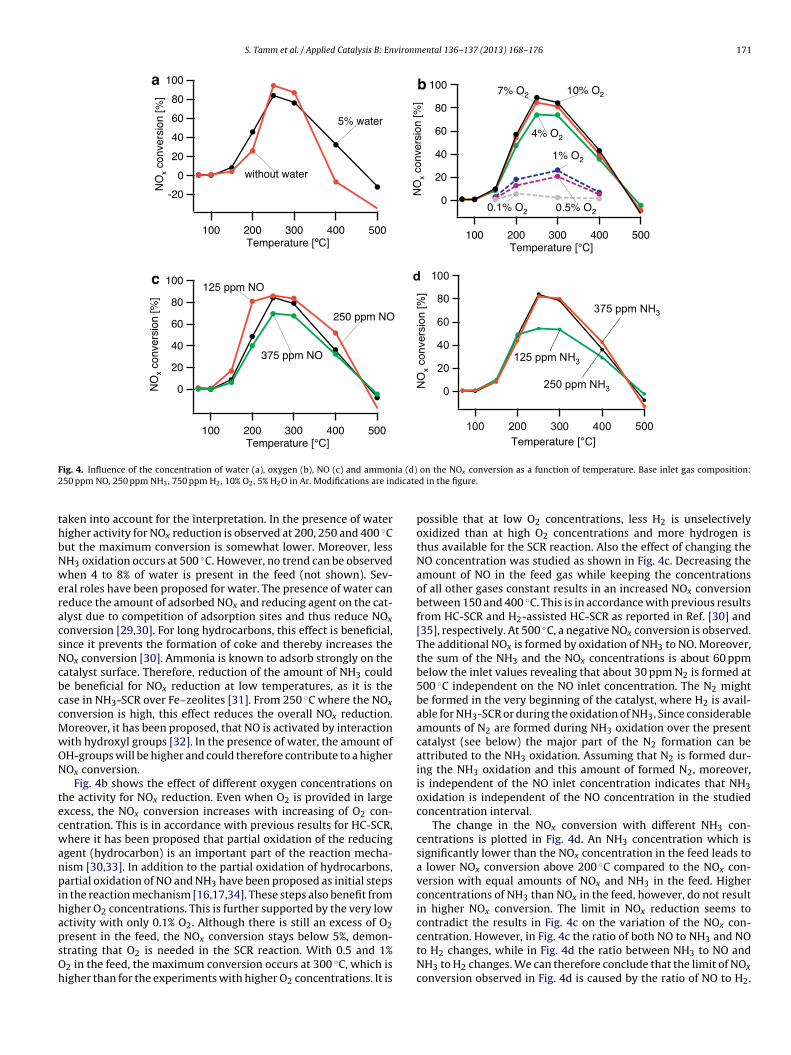
S. Tamm et al. / Applied Catalysis B: Environmental 136– 137 (2013) 168– 176 171
100
80
60
40
20
0NO
x co
nver
sion
[%]
500400300200100Temperature [°C ]
c
375 ppm NO
125 ppm NO
250 ppm NO
100
80
60
40
20
0
NO
x co
nver
sion
[%]
500400300200100Temperature [°C ]
b 10% O27% O2
4% O2
0.5% O2
1% O2
0.1% O2
100
80
60
40
20
0
-20
NO
x co
nver
sion
[%]
500400300200100Temperature [ºC ]
a
without water
5% water
F ia (d)2 dicate
thbNweracsNcbccMwON
tecwanpihapsOh
ig. 4. Influence of the concentration of water (a), oxygen (b), NO (c) and ammon50 ppm NO, 250 ppm NH3, 750 ppm H2, 10% O2, 5% H2O in Ar. Modifications are in
aken into account for the interpretation. In the presence of waterigher activity for NOx reduction is observed at 200, 250 and 400 ◦Cut the maximum conversion is somewhat lower. Moreover, lessH3 oxidation occurs at 500 ◦C. However, no trend can be observedhen 4 to 8% of water is present in the feed (not shown). Sev-
ral roles have been proposed for water. The presence of water caneduce the amount of adsorbed NOx and reducing agent on the cat-lyst due to competition of adsorption sites and thus reduce NOx
onversion [29,30]. For long hydrocarbons, this effect is beneficial,ince it prevents the formation of coke and thereby increases theOx conversion [30]. Ammonia is known to adsorb strongly on theatalyst surface. Therefore, reduction of the amount of NH3 coulde beneficial for NOx reduction at low temperatures, as it is thease in NH3-SCR over Fe–zeolites [31]. From 250 ◦C where the NOx
onversion is high, this effect reduces the overall NOx reduction.oreover, it has been proposed, that NO is activated by interactionith hydroxyl groups [32]. In the presence of water, the amount ofH-groups will be higher and could therefore contribute to a higherOx conversion.
Fig. 4b shows the effect of different oxygen concentrations onhe activity for NOx reduction. Even when O2 is provided in largexcess, the NOx conversion increases with increasing of O2 con-entration. This is in accordance with previous results for HC-SCR,here it has been proposed that partial oxidation of the reducing
gent (hydrocarbon) is an important part of the reaction mecha-ism [30,33]. In addition to the partial oxidation of hydrocarbons,artial oxidation of NO and NH3 have been proposed as initial steps
n the reaction mechanism [16,17,34]. These steps also benefit fromigher O2 concentrations. This is further supported by the very lowctivity with only 0.1% O2. Although there is still an excess of O2
resent in the feed, the NOx conversion stays below 5%, demon-trating that O2 is needed in the SCR reaction. With 0.5 and 1%2 in the feed, the maximum conversion occurs at 300 ◦C, which isigher than for the experiments with higher O2 concentrations. It ison the NOx conversion as a function of temperature. Base inlet gas composition:d in the figure.
possible that at low O2 concentrations, less H2 is unselectivelyoxidized than at high O2 concentrations and more hydrogen isthus available for the SCR reaction. Also the effect of changing theNO concentration was studied as shown in Fig. 4c. Decreasing theamount of NO in the feed gas while keeping the concentrationsof all other gases constant results in an increased NOx conversionbetween 150 and 400 ◦C. This is in accordance with previous resultsfrom HC-SCR and H2-assisted HC-SCR as reported in Ref. [30] and[35], respectively. At 500 ◦C, a negative NOx conversion is observed.The additional NOx is formed by oxidation of NH3 to NO. Moreover,the sum of the NH3 and the NOx concentrations is about 60 ppmbelow the inlet values revealing that about 30 ppm N2 is formed at500 ◦C independent on the NO inlet concentration. The N2 mightbe formed in the very beginning of the catalyst, where H2 is avail-able for NH3-SCR or during the oxidation of NH3. Since considerableamounts of N2 are formed during NH3 oxidation over the presentcatalyst (see below) the major part of the N2 formation can beattributed to the NH3 oxidation. Assuming that N2 is formed dur-ing the NH3 oxidation and this amount of formed N2, moreover,is independent of the NO inlet concentration indicates that NH3oxidation is independent of the NO concentration in the studiedconcentration interval.
The change in the NOx conversion with different NH3 con-centrations is plotted in Fig. 4d. An NH3 concentration which issignificantly lower than the NOx concentration in the feed leads toa lower NOx conversion above 200 ◦C compared to the NOx con-version with equal amounts of NOx and NH3 in the feed. Higherconcentrations of NH3 than NOx in the feed, however, do not resultin higher NOx conversion. The limit in NOx reduction seems tocontradict the results in Fig. 4c on the variation of the NOx con-
centration. However, in Fig. 4c the ratio of both NO to NH3 and NOto H2 changes, while in Fig. 4d the ratio between NH3 to NO andNH3 to H2 changes. We can therefore conclude that the limit of NOxconversion observed in Fig. 4d is caused by the ratio of NO to H2.
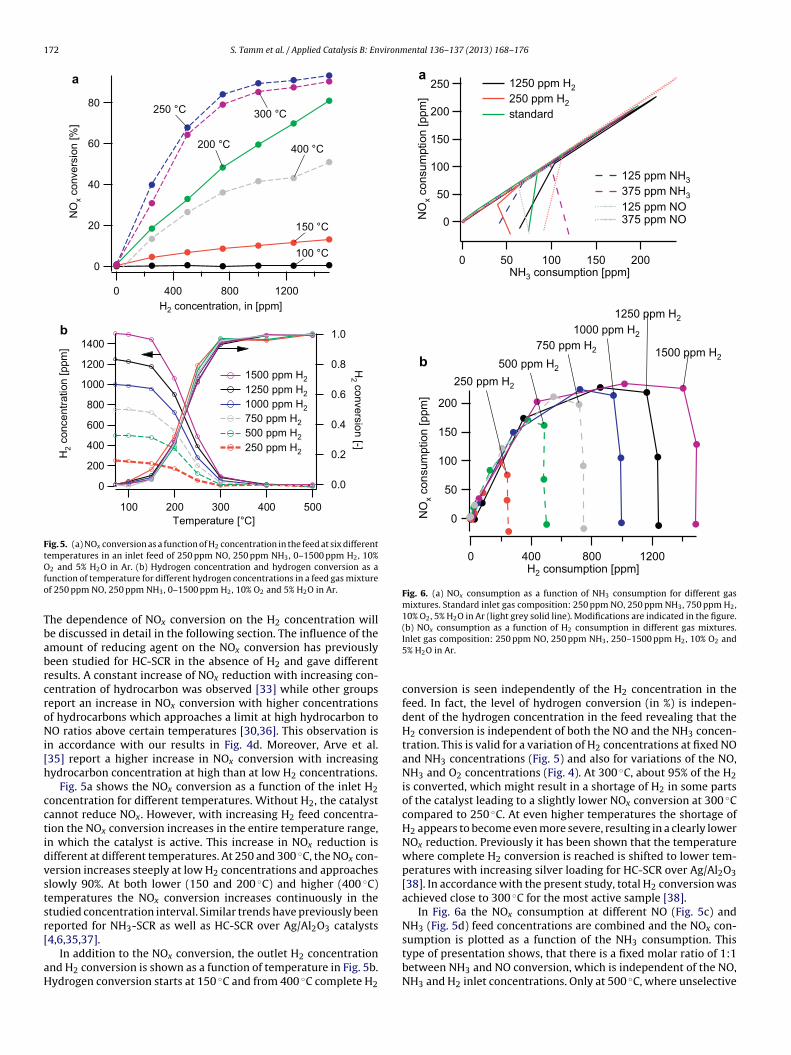
172 S. Tamm et al. / Applied Catalysis B: Environmental 136– 137 (2013) 168– 176
Fig. 5. (a) NOx conversion as a function of H2 concentration in the feed at six differenttemperatures in an inlet feed of 250 ppm NO, 250 ppm NH3, 0–1500 ppm H2, 10%Ofo
TbabrcroNi[h
cctidvstsr[
aH
Fig. 6. (a) NOx consumption as a function of NH3 consumption for different gasmixtures. Standard inlet gas composition: 250 ppm NO, 250 ppm NH3, 750 ppm H2,10% O2, 5% H2O in Ar (light grey solid line). Modifications are indicated in the figure.(b) NOx consumption as a function of H2 consumption in different gas mixtures.
2 and 5% H2O in Ar. (b) Hydrogen concentration and hydrogen conversion as aunction of temperature for different hydrogen concentrations in a feed gas mixturef 250 ppm NO, 250 ppm NH3, 0–1500 ppm H2, 10% O2 and 5% H2O in Ar.
he dependence of NOx conversion on the H2 concentration wille discussed in detail in the following section. The influence of themount of reducing agent on the NOx conversion has previouslyeen studied for HC-SCR in the absence of H2 and gave differentesults. A constant increase of NOx reduction with increasing con-entration of hydrocarbon was observed [33] while other groupseport an increase in NOx conversion with higher concentrationsf hydrocarbons which approaches a limit at high hydrocarbon toO ratios above certain temperatures [30,36]. This observation is
n accordance with our results in Fig. 4d. Moreover, Arve et al.35] report a higher increase in NOx conversion with increasingydrocarbon concentration at high than at low H2 concentrations.
Fig. 5a shows the NOx conversion as a function of the inlet H2oncentration for different temperatures. Without H2, the catalystannot reduce NOx. However, with increasing H2 feed concentra-ion the NOx conversion increases in the entire temperature range,n which the catalyst is active. This increase in NOx reduction isifferent at different temperatures. At 250 and 300 ◦C, the NOx con-ersion increases steeply at low H2 concentrations and approacheslowly 90%. At both lower (150 and 200 ◦C) and higher (400 ◦C)emperatures the NOx conversion increases continuously in thetudied concentration interval. Similar trends have previously beeneported for NH3-SCR as well as HC-SCR over Ag/Al2O3 catalysts
4,6,35,37].In addition to the NOx conversion, the outlet H2 concentrationnd H2 conversion is shown as a function of temperature in Fig. 5b.ydrogen conversion starts at 150 ◦C and from 400 ◦C complete H2
Inlet gas composition: 250 ppm NO, 250 ppm NH3, 250–1500 ppm H2, 10% O2 and5% H2O in Ar.
conversion is seen independently of the H2 concentration in thefeed. In fact, the level of hydrogen conversion (in %) is indepen-dent of the hydrogen concentration in the feed revealing that theH2 conversion is independent of both the NO and the NH3 concen-tration. This is valid for a variation of H2 concentrations at fixed NOand NH3 concentrations (Fig. 5) and also for variations of the NO,NH3 and O2 concentrations (Fig. 4). At 300 ◦C, about 95% of the H2is converted, which might result in a shortage of H2 in some partsof the catalyst leading to a slightly lower NOx conversion at 300 ◦Ccompared to 250 ◦C. At even higher temperatures the shortage ofH2 appears to become even more severe, resulting in a clearly lowerNOx reduction. Previously it has been shown that the temperaturewhere complete H2 conversion is reached is shifted to lower tem-peratures with increasing silver loading for HC-SCR over Ag/Al2O3[38]. In accordance with the present study, total H2 conversion wasachieved close to 300 ◦C for the most active sample [38].
In Fig. 6a the NOx consumption at different NO (Fig. 5c) andNH3 (Fig. 5d) feed concentrations are combined and the NOx con-sumption is plotted as a function of the NH consumption. This
3type of presentation shows, that there is a fixed molar ratio of 1:1between NH3 and NO conversion, which is independent of the NO,NH3 and H2 inlet concentrations. Only at 500 ◦C, where unselective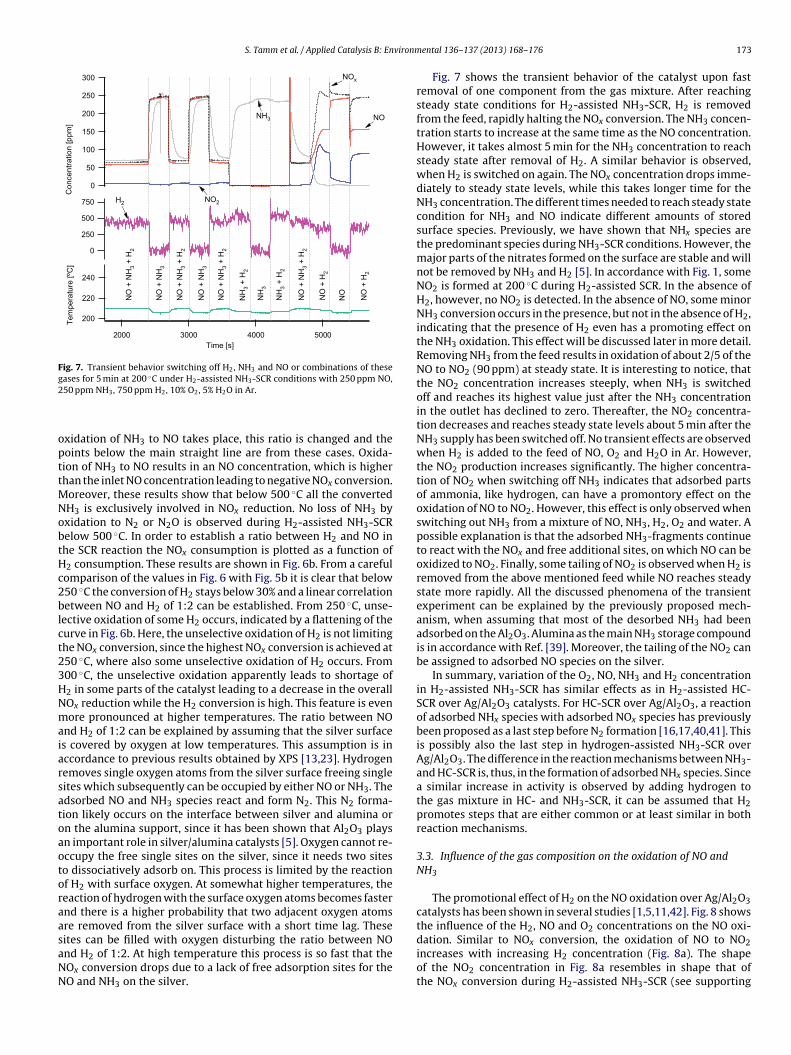
S. Tamm et al. / Applied Catalysis B: Environm
Fig. 7. Transient behavior switching off H2, NH3 and NO or combinations of thesegases for 5 min at 200 ◦C under H -assisted NH -SCR conditions with 250 ppm NO,2
opttMNobtHc2blct23HNmaiarsatoaotoraasaNN
dation. Similar to NOx conversion, the oxidation of NO to NO2
2 3
50 ppm NH3, 750 ppm H2, 10% O2, 5% H2O in Ar.
xidation of NH3 to NO takes place, this ratio is changed and theoints below the main straight line are from these cases. Oxida-ion of NH3 to NO results in an NO concentration, which is higherhan the inlet NO concentration leading to negative NOx conversion.
oreover, these results show that below 500 ◦C all the convertedH3 is exclusively involved in NOx reduction. No loss of NH3 byxidation to N2 or N2O is observed during H2-assisted NH3-SCRelow 500 ◦C. In order to establish a ratio between H2 and NO inhe SCR reaction the NOx consumption is plotted as a function of2 consumption. These results are shown in Fig. 6b. From a carefulomparison of the values in Fig. 6 with Fig. 5b it is clear that below50 ◦C the conversion of H2 stays below 30% and a linear correlationetween NO and H2 of 1:2 can be established. From 250 ◦C, unse-
ective oxidation of some H2 occurs, indicated by a flattening of theurve in Fig. 6b. Here, the unselective oxidation of H2 is not limitinghe NOx conversion, since the highest NOx conversion is achieved at50 ◦C, where also some unselective oxidation of H2 occurs. From00 ◦C, the unselective oxidation apparently leads to shortage of2 in some parts of the catalyst leading to a decrease in the overallOx reduction while the H2 conversion is high. This feature is evenore pronounced at higher temperatures. The ratio between NO
nd H2 of 1:2 can be explained by assuming that the silver surfaces covered by oxygen at low temperatures. This assumption is inccordance to previous results obtained by XPS [13,23]. Hydrogenemoves single oxygen atoms from the silver surface freeing singleites which subsequently can be occupied by either NO or NH3. Thedsorbed NO and NH3 species react and form N2. This N2 forma-ion likely occurs on the interface between silver and alumina orn the alumina support, since it has been shown that Al2O3 playsn important role in silver/alumina catalysts [5]. Oxygen cannot re-ccupy the free single sites on the silver, since it needs two siteso dissociatively adsorb on. This process is limited by the reactionf H2 with surface oxygen. At somewhat higher temperatures, theeaction of hydrogen with the surface oxygen atoms becomes fasternd there is a higher probability that two adjacent oxygen atomsre removed from the silver surface with a short time lag. Theseites can be filled with oxygen disturbing the ratio between NO
nd H2 of 1:2. At high temperature this process is so fast that theOx conversion drops due to a lack of free adsorption sites for theO and NH3 on the silver.ental 136– 137 (2013) 168– 176 173
Fig. 7 shows the transient behavior of the catalyst upon fastremoval of one component from the gas mixture. After reachingsteady state conditions for H2-assisted NH3-SCR, H2 is removedfrom the feed, rapidly halting the NOx conversion. The NH3 concen-tration starts to increase at the same time as the NO concentration.However, it takes almost 5 min for the NH3 concentration to reachsteady state after removal of H2. A similar behavior is observed,when H2 is switched on again. The NOx concentration drops imme-diately to steady state levels, while this takes longer time for theNH3 concentration. The different times needed to reach steady statecondition for NH3 and NO indicate different amounts of storedsurface species. Previously, we have shown that NHx species arethe predominant species during NH3-SCR conditions. However, themajor parts of the nitrates formed on the surface are stable and willnot be removed by NH3 and H2 [5]. In accordance with Fig. 1, someNO2 is formed at 200 ◦C during H2-assisted SCR. In the absence ofH2, however, no NO2 is detected. In the absence of NO, some minorNH3 conversion occurs in the presence, but not in the absence of H2,indicating that the presence of H2 even has a promoting effect onthe NH3 oxidation. This effect will be discussed later in more detail.Removing NH3 from the feed results in oxidation of about 2/5 of theNO to NO2 (90 ppm) at steady state. It is interesting to notice, thatthe NO2 concentration increases steeply, when NH3 is switchedoff and reaches its highest value just after the NH3 concentrationin the outlet has declined to zero. Thereafter, the NO2 concentra-tion decreases and reaches steady state levels about 5 min after theNH3 supply has been switched off. No transient effects are observedwhen H2 is added to the feed of NO, O2 and H2O in Ar. However,the NO2 production increases significantly. The higher concentra-tion of NO2 when switching off NH3 indicates that adsorbed partsof ammonia, like hydrogen, can have a promontory effect on theoxidation of NO to NO2. However, this effect is only observed whenswitching out NH3 from a mixture of NO, NH3, H2, O2 and water. Apossible explanation is that the adsorbed NH3-fragments continueto react with the NOx and free additional sites, on which NO can beoxidized to NO2. Finally, some tailing of NO2 is observed when H2 isremoved from the above mentioned feed while NO reaches steadystate more rapidly. All the discussed phenomena of the transientexperiment can be explained by the previously proposed mech-anism, when assuming that most of the desorbed NH3 had beenadsorbed on the Al2O3. Alumina as the main NH3 storage compoundis in accordance with Ref. [39]. Moreover, the tailing of the NO2 canbe assigned to adsorbed NO species on the silver.
In summary, variation of the O2, NO, NH3 and H2 concentrationin H2-assisted NH3-SCR has similar effects as in H2-assisted HC-SCR over Ag/Al2O3 catalysts. For HC-SCR over Ag/Al2O3, a reactionof adsorbed NHx species with adsorbed NOx species has previouslybeen proposed as a last step before N2 formation [16,17,40,41]. Thisis possibly also the last step in hydrogen-assisted NH3-SCR overAg/Al2O3. The difference in the reaction mechanisms between NH3-and HC-SCR is, thus, in the formation of adsorbed NHx species. Sincea similar increase in activity is observed by adding hydrogen tothe gas mixture in HC- and NH3-SCR, it can be assumed that H2promotes steps that are either common or at least similar in bothreaction mechanisms.
3.3. Influence of the gas composition on the oxidation of NO andNH3
The promotional effect of H2 on the NO oxidation over Ag/Al2O3catalysts has been shown in several studies [1,5,11,42]. Fig. 8 showsthe influence of the H2, NO and O2 concentrations on the NO oxi-
increases with increasing H2 concentration (Fig. 8a). The shapeof the NO2 concentration in Fig. 8a resembles in shape that ofthe NOx conversion during H2-assisted NH3-SCR (see supporting
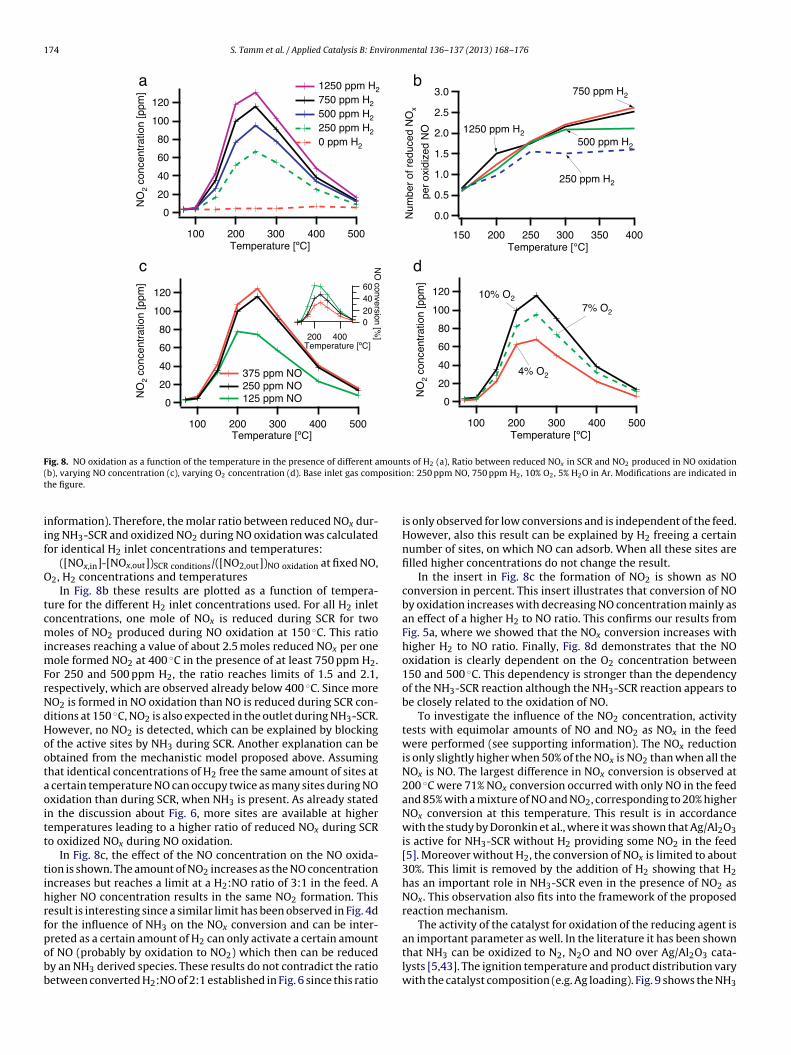
174 S. Tamm et al. / Applied Catalysis B: Environmental 136– 137 (2013) 168– 176
120
100
80
60
40
20
0N
O2
conc
entr
atio
n [p
pm]
500400300200100Temperature [ºC ]
d
10% O2
4% O2
7% O2
120
100
80
60
40
20
0
NO
2 co
ncen
trat
ion
[ppm
]
500400300200100Temperature [ºC ]
6040200
NO
conversion [%]400200
Temperature [ºC]
375 ppm NO 250 ppm NO 125 ppm NO
c
3.0
2.5
2.0
1.5
1.0
0.5
0.0Num
ber
of r
educ
ed N
Ox
400350300250200150Temperature [°C ]
per
oxid
ized
NO
1250 ppm H2
750 ppm H2
500 ppm H2
250 ppm H2
b120
100
80
60
40
20
0
NO
2 co
ncen
trat
ion
[ppm
]
500400300200100Temperature [ºC ]
1250 ppm H2
750 ppm H2
500 ppm H2
250 ppm H2
0 ppm H2
a
Fig. 8. NO oxidation as a function of the temperature in the presence of different amounts of H (a), Ratio between reduced NO in SCR and NO produced in NO oxidation( positiot
iif
O
tcmimFrNdHootaoitt
tihrfpobb
b), varying NO concentration (c), varying O2 concentration (d). Base inlet gas comhe figure.
nformation). Therefore, the molar ratio between reduced NOx dur-ng NH3-SCR and oxidized NO2 during NO oxidation was calculatedor identical H2 inlet concentrations and temperatures:
([NOx,in]-[NOx,out])SCR conditions/([NO2,out])NO oxidation at fixed NO,2, H2 concentrations and temperatures
In Fig. 8b these results are plotted as a function of tempera-ure for the different H2 inlet concentrations used. For all H2 inletoncentrations, one mole of NOx is reduced during SCR for twooles of NO2 produced during NO oxidation at 150 ◦C. This ratio
ncreases reaching a value of about 2.5 moles reduced NOx per oneole formed NO2 at 400 ◦C in the presence of at least 750 ppm H2.
or 250 and 500 ppm H2, the ratio reaches limits of 1.5 and 2.1,espectively, which are observed already below 400 ◦C. Since moreO2 is formed in NO oxidation than NO is reduced during SCR con-itions at 150 ◦C, NO2 is also expected in the outlet during NH3-SCR.owever, no NO2 is detected, which can be explained by blockingf the active sites by NH3 during SCR. Another explanation can bebtained from the mechanistic model proposed above. Assuminghat identical concentrations of H2 free the same amount of sites at
certain temperature NO can occupy twice as many sites during NOxidation than during SCR, when NH3 is present. As already statedn the discussion about Fig. 6, more sites are available at higheremperatures leading to a higher ratio of reduced NOx during SCRo oxidized NOx during NO oxidation.
In Fig. 8c, the effect of the NO concentration on the NO oxida-ion is shown. The amount of NO2 increases as the NO concentrationncreases but reaches a limit at a H2:NO ratio of 3:1 in the feed. Aigher NO concentration results in the same NO2 formation. Thisesult is interesting since a similar limit has been observed in Fig. 4dor the influence of NH3 on the NOx conversion and can be inter-
reted as a certain amount of H2 can only activate a certain amountf NO (probably by oxidation to NO2) which then can be reducedy an NH3 derived species. These results do not contradict the ratioetween converted H2:NO of 2:1 established in Fig. 6 since this ratio2 x 2
n: 250 ppm NO, 750 ppm H2, 10% O2, 5% H2O in Ar. Modifications are indicated in
is only observed for low conversions and is independent of the feed.However, also this result can be explained by H2 freeing a certainnumber of sites, on which NO can adsorb. When all these sites arefilled higher concentrations do not change the result.
In the insert in Fig. 8c the formation of NO2 is shown as NOconversion in percent. This insert illustrates that conversion of NOby oxidation increases with decreasing NO concentration mainly asan effect of a higher H2 to NO ratio. This confirms our results fromFig. 5a, where we showed that the NOx conversion increases withhigher H2 to NO ratio. Finally, Fig. 8d demonstrates that the NOoxidation is clearly dependent on the O2 concentration between150 and 500 ◦C. This dependency is stronger than the dependencyof the NH3-SCR reaction although the NH3-SCR reaction appears tobe closely related to the oxidation of NO.
To investigate the influence of the NO2 concentration, activitytests with equimolar amounts of NO and NO2 as NOx in the feedwere performed (see supporting information). The NOx reductionis only slightly higher when 50% of the NOx is NO2 than when all theNOx is NO. The largest difference in NOx conversion is observed at200 ◦C were 71% NOx conversion occurred with only NO in the feedand 85% with a mixture of NO and NO2, corresponding to 20% higherNOx conversion at this temperature. This result is in accordancewith the study by Doronkin et al., where it was shown that Ag/Al2O3is active for NH3-SCR without H2 providing some NO2 in the feed[5]. Moreover without H2, the conversion of NOx is limited to about30%. This limit is removed by the addition of H2 showing that H2has an important role in NH3-SCR even in the presence of NO2 asNOx. This observation also fits into the framework of the proposedreaction mechanism.
The activity of the catalyst for oxidation of the reducing agent is
an important parameter as well. In the literature it has been shownthat NH3 can be oxidized to N2, N2O and NO over Ag/Al2O3 cata-lysts [5,43]. The ignition temperature and product distribution varywith the catalyst composition (e.g. Ag loading). Fig. 9 shows the NH3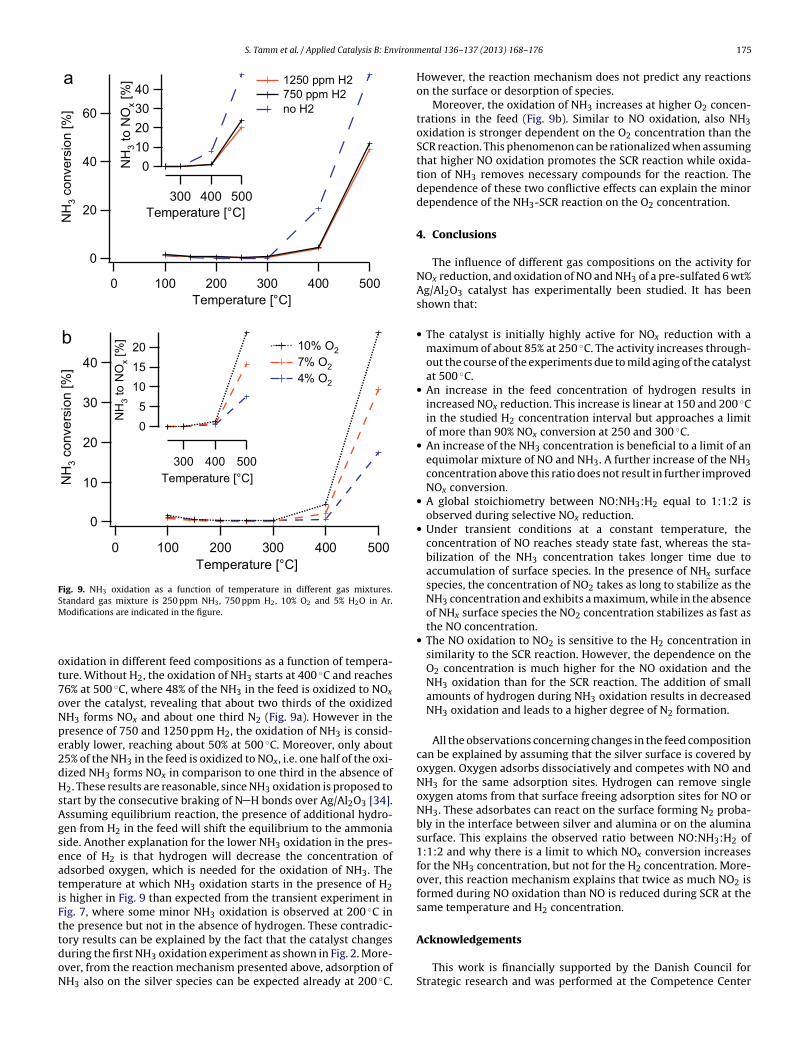
S. Tamm et al. / Applied Catalysis B: Environm
Fig. 9. NH3 oxidation as a function of temperature in different gas mixtures.Standard gas mixture is 250 ppm NH3, 750 ppm H2, 10% O2 and 5% H2O in Ar.M
ot7oNpe2dHsAgseatiFttdoN
Acknowledgements
odifications are indicated in the figure.
xidation in different feed compositions as a function of tempera-ure. Without H2, the oxidation of NH3 starts at 400 ◦C and reaches6% at 500 ◦C, where 48% of the NH3 in the feed is oxidized to NOx
ver the catalyst, revealing that about two thirds of the oxidizedH3 forms NOx and about one third N2 (Fig. 9a). However in theresence of 750 and 1250 ppm H2, the oxidation of NH3 is consid-rably lower, reaching about 50% at 500 ◦C. Moreover, only about5% of the NH3 in the feed is oxidized to NOx, i.e. one half of the oxi-ized NH3 forms NOx in comparison to one third in the absence of2. These results are reasonable, since NH3 oxidation is proposed to
tart by the consecutive braking of N H bonds over Ag/Al2O3 [34].ssuming equilibrium reaction, the presence of additional hydro-en from H2 in the feed will shift the equilibrium to the ammoniaide. Another explanation for the lower NH3 oxidation in the pres-nce of H2 is that hydrogen will decrease the concentration ofdsorbed oxygen, which is needed for the oxidation of NH3. Theemperature at which NH3 oxidation starts in the presence of H2s higher in Fig. 9 than expected from the transient experiment inig. 7, where some minor NH3 oxidation is observed at 200 ◦C inhe presence but not in the absence of hydrogen. These contradic-ory results can be explained by the fact that the catalyst changes
uring the first NH3 oxidation experiment as shown in Fig. 2. More-ver, from the reaction mechanism presented above, adsorption ofH3 also on the silver species can be expected already at 200 ◦C.ental 136– 137 (2013) 168– 176 175
However, the reaction mechanism does not predict any reactionson the surface or desorption of species.
Moreover, the oxidation of NH3 increases at higher O2 concen-trations in the feed (Fig. 9b). Similar to NO oxidation, also NH3oxidation is stronger dependent on the O2 concentration than theSCR reaction. This phenomenon can be rationalized when assumingthat higher NO oxidation promotes the SCR reaction while oxida-tion of NH3 removes necessary compounds for the reaction. Thedependence of these two conflictive effects can explain the minordependence of the NH3-SCR reaction on the O2 concentration.
4. Conclusions
The influence of different gas compositions on the activity forNOx reduction, and oxidation of NO and NH3 of a pre-sulfated 6 wt%Ag/Al2O3 catalyst has experimentally been studied. It has beenshown that:
• The catalyst is initially highly active for NOx reduction with amaximum of about 85% at 250 ◦C. The activity increases through-out the course of the experiments due to mild aging of the catalystat 500 ◦C.
• An increase in the feed concentration of hydrogen results inincreased NOx reduction. This increase is linear at 150 and 200 ◦Cin the studied H2 concentration interval but approaches a limitof more than 90% NOx conversion at 250 and 300 ◦C.
• An increase of the NH3 concentration is beneficial to a limit of anequimolar mixture of NO and NH3. A further increase of the NH3concentration above this ratio does not result in further improvedNOx conversion.
• A global stoichiometry between NO:NH3:H2 equal to 1:1:2 isobserved during selective NOx reduction.
• Under transient conditions at a constant temperature, theconcentration of NO reaches steady state fast, whereas the sta-bilization of the NH3 concentration takes longer time due toaccumulation of surface species. In the presence of NHx surfacespecies, the concentration of NO2 takes as long to stabilize as theNH3 concentration and exhibits a maximum, while in the absenceof NHx surface species the NO2 concentration stabilizes as fast asthe NO concentration.
• The NO oxidation to NO2 is sensitive to the H2 concentration insimilarity to the SCR reaction. However, the dependence on theO2 concentration is much higher for the NO oxidation and theNH3 oxidation than for the SCR reaction. The addition of smallamounts of hydrogen during NH3 oxidation results in decreasedNH3 oxidation and leads to a higher degree of N2 formation.
All the observations concerning changes in the feed compositioncan be explained by assuming that the silver surface is covered byoxygen. Oxygen adsorbs dissociatively and competes with NO andNH3 for the same adsorption sites. Hydrogen can remove singleoxygen atoms from that surface freeing adsorption sites for NO orNH3. These adsorbates can react on the surface forming N2 proba-bly in the interface between silver and alumina or on the aluminasurface. This explains the observed ratio between NO:NH3:H2 of1:1:2 and why there is a limit to which NOx conversion increasesfor the NH3 concentration, but not for the H2 concentration. More-over, this reaction mechanism explains that twice as much NO2 isformed during NO oxidation than NO is reduced during SCR at thesame temperature and H2 concentration.
This work is financially supported by the Danish Council forStrategic research and was performed at the Competence Center
1 vironm
fAg
A
f2
R
[
[
[
[
[
[
[
[
[
[
[
[
[[
[
[
[
[
[
[
[
[
[
[[
[
[
[
[
[[
[41] R. Matarrese, H.H. Ingelsten, M. Skoglundh, Journal of Catalysis 258 (2008)
76 S. Tamm et al. / Applied Catalysis B: En
or Catalysis, Chalmers University of Technology and Haldor Topsøe/S. The collaboration with Haldor Topsøe, Amminex and DTU isratefully acknowledged.
ppendix A. Supplementary data
Supplementary data associated with this article can beound, in the online version, at http://dx.doi.org/10.1016/j.apcatb.013.01.064.
eferences
[1] R. Burch, J.P. Breen, C.J. Hill, B. Krutzsch, B. Konrad, E. Jobson, L. Cider, K. Eränen,F. Klingstedt, L.E. Lindfors, Topics in Catalysis 30–31 (2004) 19–25.
[2] J.P. Breen, R. Burch, Topics in Catalysis 39 (2006) 53–58.[3] D.E. Doronkin, T.S. Khan, T. Bligaard, S. Fogel, P. Gabrielsson, S. Dahl, Applied
Catalysis B: Environmental 117 (2012) 49–58.[4] S. Satokawa, J. Shibata, K. Shimizu, S. Atsushi, T. Hattori, Applied Catalysis B:
Environmental 42 (2003) 179–186.[5] D.E. Doronkin, S. Fogel, S. Tamm, L. Olsson, T. Khan, T. Bligaard, P. Gabrielsson,
S. Dahl, Applied Catalysis B: Environmental 113–114 (2012) 228–236.[6] M. Richter, R. Fricke, R. Eckelt, Catalysis Letters 94 (2004) 115–118.[7] K.I. Shimizu, A. Satsuma, Applied Catalysis B: Environmental 77 (2007)
202–205.[8] J. Shibata, K. Shimizu, S. Satokawa, A. Satsuma, T. Hattori, Physical Chemistry
Chemical Physics 5 (2003) 2154–2160.[9] J.P. Breen, R. Burch, C. Hardacre, C.J. Hill, Journal of Physical Chemistry B 109
(2005) 4805–4807.10] J. Shibata, Y. Takada, A. Shichi, S. Satokawa, A. Satsuma, T. Hattori, Journal of
Catalysis 222 (2004) 368–376.11] P. Sazama, L. Capek, H. Drobna, Z. Sobalik, J. Dedecek, K. Arve, B. Wichterlová,
Journal of Catalysis 232 (2005) 302–317.12] R. Brosius, K. Arve, M.H. Groothaert, J.A. Martens, Journal of Catalysis 231 (2005)
344–353.13] H. Kannisto, H.H. Ingelsten, M. Skoglundh, Topics in Catalysis 52 (2009)
1817–1820.14] S. Chansai, R. Burch, C. Hardacre, J. Breen, F. Meunier, Journal of Catalysis 276
(2010) 49–55.15] X.L. Zhang, Y.B. Yu, H. He, Applied Catalysis B: Environmental 76 (2007)
241–247.16] S. Tamm, H.H. Ingelsten, A.E.C. Palmqvist, Journal of Catalysis 255 (2008)
304–312.17] R. Burch, J.P. Breen, F.C. Meunier, Applied Catalysis B: Environmental 39 (2002)
283–303.18] A. Obuchi, C. Wögerbauer, R. Köppel, A. Baiker, Applied Catalysis A-General 19
(1998) 9–22.
[
[
ental 136– 137 (2013) 168– 176
19] C.N. Costa, A.M. Efstathiou, Journal of Physical Chemistry B 108 (2004)2620–2630.
20] Z. Liu, J. Li, S.I. Woo, Energy and Environmental Science 5 (2012) 8799–8814.
21] C.N. Costa, P.G. Savva, C. Andronikou, P.S. Lambrou, K. Polychronopoulou, V.C.Belessi, V.N. Stathopoulos, P.J. Pomonis, A.M. Efstathiou, Journal of Catalysis209 (2002) 456–471.
22] P.G. Savva, A.M. Efstathiou, Journal of Catalysis 257 (2008) 324–333.23] H. Kannisto, H.H. Ingelsten, M. Skoglundh, Journal of Molecular Catalysis A 302
(2009) 86–96.24] J.P. Breen, R. Burch, C. Hardacre, C.J. Hill, B. Krutzsch, B. Bandl-Konrad, E. Jobson,
L. Cider, P.G. Blakeman, L.J. Peace, M.V. Twigg, M. Preis, M. Gottschling, AppliedCatalysis B: Environmental 70 (2007) 36–44.
25] V. Houel, D. James, P. Millington, S. Pollington, S. Poulston, R. Rajaram, R. Torbati,Journal of Catalysis 230 (2005) 150–157.
26] L. Kylhammar, A. Palmqvist, M. Skoglundh, Topics in Catalysis 42–43 (2007)119–122.
27] A. Abe, N. Aoyama, S. Sumiya, N. Kakuta, K. Yoshida, Catalysis Letters 51 (1998)5–9.
28] S. Satokawa, K.-i. Yamaseki, H. Uchida, Applied Catalysis B: Environmental 34(2001) 299–306.
29] Y. Miyahara, M. Takahashi, T. Masuda, S. Imamura, H. Kanai, S. Iwamoto,T. Watanabe, M. Inoue, Applied Catalysis B: Environmental 84 (2008)289–296.
30] K. Shimizu, A. Satsuma, T. Hattori, Applied Catalysis B: Environmental 25 (2000)239–247.
31] H. Sjövall, R.J. Blint, A. Gopinath, L. Olsson, Industrial & Engineering Chemistry49 (2010) 39–52.
32] A. Iglesias-Juez, A.B. Hungria, A. Martinez-Arias, A. Fuerte, M. Fernandez-Garcia,J.A. Anderson, J.C. Conesa, J. Soria, Journal of Catalysis 217 (2003) 310–323.
33] H.W. Jen, Catalysis Today 42 (1998) 37–44.34] E.V. Kondratenko, V.A. Kondratenko, M. Richter, R. Fricke, Journal of Catalysis
239 (2006) 23–33.35] K. Arve, H. Backman, F. Klingstedt, K. Eränen, D.Y. Murzin, Applied Catalysis
A-General 303 (2006) 96–102.36] K. Arve, F. Klingstedt, K. Eränen, J. Wärnå, L.E. Lindfors, D.Y. Murzin, Chemical
Engineering Journal 107 (2005) 215–220.37] K. Shimizu, A. Satsuma, Journal of Physical Chemistry C 111 (2007)
2259–2264.38] M. Richter, U. Bentrup, R. Eckelt, M. Schneider, M.M. Pohl, R. Fricke, Applied
Catalysis B: Environmental 51 (2004) 261–274.39] Q.Y. Liu, Z.Y. Liu, J.H. Su, Catalysis Today 158 (2010) 370–376.40] K. Eränen, F. Klingstedt, K. Arve, L.E. Lindfors, D.Y. Murzin, Journal of Catalysis
227 (2004) 328–343.
386–392.42] N.A. Sadokhina, D.E. Doronkin, P.V. Pributkov, V.I. Bukhtiyarov, R.I. Kvon, A.Y.
Stakheev, Topics in Catalysis 54 (2011) 1190–1196.43] L. Zhang, H. He, Journal of Catalysis 268 (2009) 18–25.

Paper VI
So
DTa
b
c
d
e
f
a
ARR1AA
KAANFF
1
tnterbr∼
tlHiroa
(
0d
Applied Catalysis B: Environmental 113– 114 (2012) 228– 236
Contents lists available at SciVerse ScienceDirect
Applied Catalysis B: Environmental
journa l h o me pa ge: www.elsev ier .com/ locate /apcatb
tudy of the “Fast SCR”-like mechanism of H2-assisted SCR of NOx with ammoniaver Ag/Al2O3
mitry E. Doronkina,∗, Sebastian Fogelb, Stefanie Tammc,d, Louise Olssonc,d, Tuhin Suvra Khane,homas Bligaardf, Pär Gabrielssonb, Søren Dahla
Center for Individual Nanoparticle Functionality (CINF), Department of Physics, Technical University of Denmark, Fysikvej 307, 2800 Kgs. Lyngby, DenmarkHaldor Topsøe A/S, Nymøllevej 55, 2800 Kgs. Lyngby, DenmarkCompetence Center for Catalysis, Chalmers University of Technology, SE-412 96 Göteborg, SwedenChemical Reaction Engineering, Chalmers University of Technology, SE-412 96 Göteborg, SwedenCenter for Atomic-scale Materials Design (CAMD), Department of Physics, Technical University of Denmark, Fysikvej 307, 2800 Kgs. Lyngby, DenmarkSUNCAT Center for Interface Science & Catalysis, SLAC National Accelerator Laboratory, Menlo Park, CA 94025, USA
r t i c l e i n f o
rticle history:eceived 22 September 2011eceived in revised form5 November 2011ccepted 24 November 2011vailable online 3 December 2011
a b s t r a c t
It is shown that Ag/Al2O3 is a unique catalytic system for H2-assisted selective catalytic reduction of NOx
by NH3 (NH3-SCR) with both Ag and alumina being necessary components of the catalyst. The ability ofAg/Al2O3 and pure Al2O3 to catalyse SCR of mixtures of NO and NO2 by ammonia is demonstrated, thesurface species occurring discussed, and a “Fast SCR”-like mechanism of the process is proposed. Thepossibility of catalyst surface blocking by adsorbed NOx and the influence of hydrogen on desorption of
eywords:g/Al2O3
luminaOx SCR
NOx were evaluated by FTIR and DFT calculations.© 2011 Elsevier B.V. All rights reserved.
ast SCRTIR
. Introduction
Nitrogen oxides (NOx) are the most challenging pollutantso address for light-duty diesel vehicles and sophisticated tech-iques like advanced fuel injection, exhaust gas recirculation (EGR),urbocharging, etc., are used by engine manufactures to reducemissions. But NOx removal by exhaust aftertreatment is stillequired due to stricter emmision regulations and the trade offetween fuel consumption and NOx emmision, i.e., the price foreducing fuel consumption and CO2 emission by ∼15% equals to50% increase in NOx emissions [1].
Selective catalytic reduction (SCR) is the leading NOx controlechnique with ammonia as a reductant. Commonly used cata-ysts are vanadia-based catalysts, Cu and Fe-containing zeolites.owever, none of the systems demonstrates high thermal durabil-
ty together with a good activity throughout a broad temperature
egion from 150 to 550 ◦C [1]. This fact explains the reason for then-going research of novel catalytic systems for NH3-SCR, whichre supposed to be non-toxic, inexpensive and durable.∗ Corresponding author. Tel.: +45 4525 3275.E-mail addresses: [email protected], [email protected]
D.E. Doronkin).
926-3373/$ – see front matter © 2011 Elsevier B.V. All rights reserved.oi:10.1016/j.apcatb.2011.11.042
Alumina supported metals, such as Ag, In, Sn, etc., [2–5] areknown to catalyse NOx SCR by hydrocarbons under the conditionsof lean-burn engine exhaust. The major drawback of these cat-alytic systems is their very poor activity at low temperatures. Ithas been found that addition of hydrogen to the gas feed can sub-stantially improve the low-temperature activity of Ag/Al2O3 [6–8].Interestingly, several groups have also demonstrated the possibil-ity of Ag/Al2O3 to facilitate SCR of NOx by ammonia or urea withco-feeding hydrogen, resulting in nearly 90% NOx conversion attemperatures as low as 200 ◦C [9,10].
Hydrogen for this reaction can be provided on board of thevehicule by two means depending on the used reductant. Therequired amount of hydrogen can be produced in an on-board fuelreformer without the necessity to change the existing fuel infras-tructure. This is convenient for hydrocarbon SCR systems utilizingAg/Al2O3 catalysts and currently leads to fuel penalties from 5 to10% [11,12] which might be improved by the optimisation of thesystem. For the NH3 SCR applications hydrogen can be producedby cracking of part of the ammonia. Pure NH3 required for thispurpose can be stored on board in form of solid metal ammine
salts [13]. The suggested system allows accurate and indepen-dent dosing of ammonia to the SCR catalyst and to the crackerwhere it can be decomposed to form the required hydrogen. Usingammonia for hydrogen storage has earlier been suggested for fuel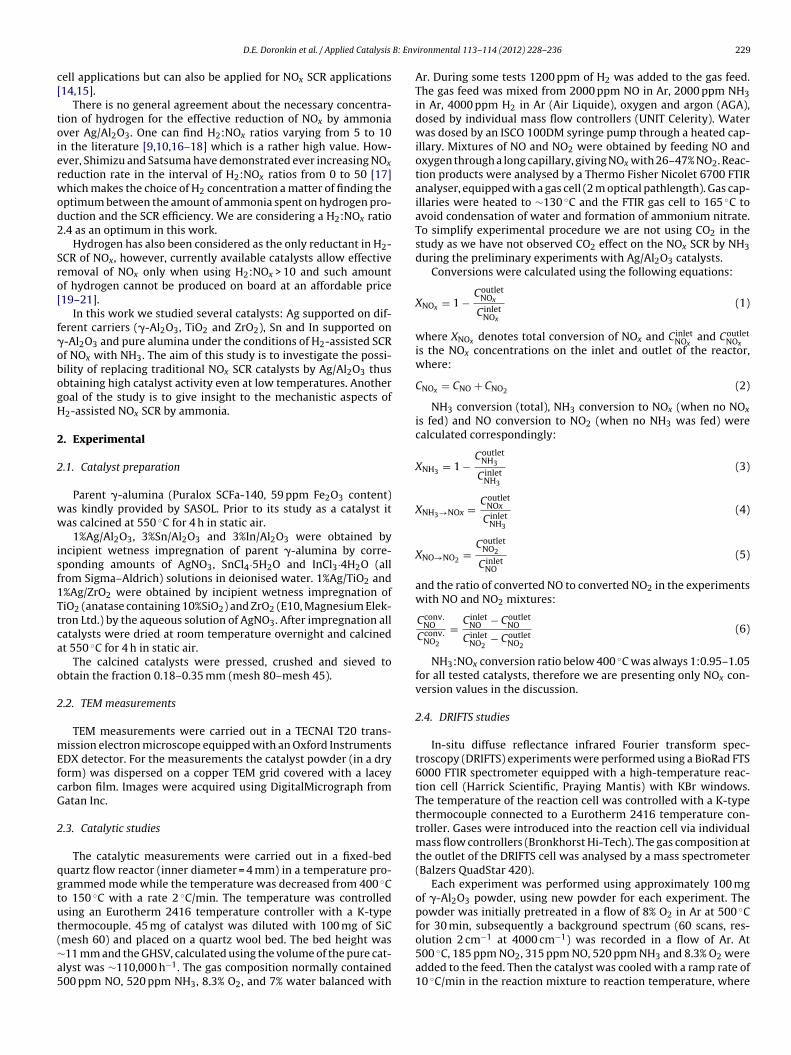
B: Env
c[
toierwod2
Sro[
f�obogH
2
2
ww
isf1Ttca
o
2
mEfcG
2
qgtut(∼a5
D.E. Doronkin et al. / Applied Catalysis
ell applications but can also be applied for NOx SCR applications14,15].
There is no general agreement about the necessary concentra-ion of hydrogen for the effective reduction of NOx by ammoniaver Ag/Al2O3. One can find H2:NOx ratios varying from 5 to 10n the literature [9,10,16–18] which is a rather high value. How-ver, Shimizu and Satsuma have demonstrated ever increasing NOx
eduction rate in the interval of H2:NOx ratios from 0 to 50 [17]hich makes the choice of H2 concentration a matter of finding the
ptimum between the amount of ammonia spent on hydrogen pro-uction and the SCR efficiency. We are considering a H2:NOx ratio.4 as an optimum in this work.
Hydrogen has also been considered as the only reductant in H2-CR of NOx, however, currently available catalysts allow effectiveemoval of NOx only when using H2:NOx > 10 and such amountf hydrogen cannot be produced on board at an affordable price19–21].
In this work we studied several catalysts: Ag supported on dif-erent carriers (�-Al2O3, TiO2 and ZrO2), Sn and In supported on-Al2O3 and pure alumina under the conditions of H2-assisted SCRf NOx with NH3. The aim of this study is to investigate the possi-ility of replacing traditional NOx SCR catalysts by Ag/Al2O3 thusbtaining high catalyst activity even at low temperatures. Anotheroal of the study is to give insight to the mechanistic aspects of2-assisted NOx SCR by ammonia.
. Experimental
.1. Catalyst preparation
Parent �-alumina (Puralox SCFa-140, 59 ppm Fe2O3 content)as kindly provided by SASOL. Prior to its study as a catalyst itas calcined at 550 ◦C for 4 h in static air.
1%Ag/Al2O3, 3%Sn/Al2O3 and 3%In/Al2O3 were obtained byncipient wetness impregnation of parent �-alumina by corre-ponding amounts of AgNO3, SnCl4·5H2O and InCl3·4H2O (allrom Sigma–Aldrich) solutions in deionised water. 1%Ag/TiO2 and%Ag/ZrO2 were obtained by incipient wetness impregnation ofiO2 (anatase containing 10%SiO2) and ZrO2 (E10, Magnesium Elek-ron Ltd.) by the aqueous solution of AgNO3. After impregnation allatalysts were dried at room temperature overnight and calcinedt 550 ◦C for 4 h in static air.
The calcined catalysts were pressed, crushed and sieved tobtain the fraction 0.18–0.35 mm (mesh 80–mesh 45).
.2. TEM measurements
TEM measurements were carried out in a TECNAI T20 trans-ission electron microscope equipped with an Oxford Instruments
DX detector. For the measurements the catalyst powder (in a dryorm) was dispersed on a copper TEM grid covered with a laceyarbon film. Images were acquired using DigitalMicrograph fromatan Inc.
.3. Catalytic studies
The catalytic measurements were carried out in a fixed-beduartz flow reactor (inner diameter = 4 mm) in a temperature pro-rammed mode while the temperature was decreased from 400 ◦Co 150 ◦C with a rate 2 ◦C/min. The temperature was controlledsing an Eurotherm 2416 temperature controller with a K-typehermocouple. 45 mg of catalyst was diluted with 100 mg of SiC
mesh 60) and placed on a quartz wool bed. The bed height was11 mm and the GHSV, calculated using the volume of the pure cat-lyst was ∼110,000 h−1. The gas composition normally contained00 ppm NO, 520 ppm NH3, 8.3% O2, and 7% water balanced withironmental 113– 114 (2012) 228– 236 229
Ar. During some tests 1200 ppm of H2 was added to the gas feed.The gas feed was mixed from 2000 ppm NO in Ar, 2000 ppm NH3in Ar, 4000 ppm H2 in Ar (Air Liquide), oxygen and argon (AGA),dosed by individual mass flow controllers (UNIT Celerity). Waterwas dosed by an ISCO 100DM syringe pump through a heated cap-illary. Mixtures of NO and NO2 were obtained by feeding NO andoxygen through a long capillary, giving NOx with 26–47% NO2. Reac-tion products were analysed by a Thermo Fisher Nicolet 6700 FTIRanalyser, equipped with a gas cell (2 m optical pathlength). Gas cap-illaries were heated to ∼130 ◦C and the FTIR gas cell to 165 ◦C toavoid condensation of water and formation of ammonium nitrate.To simplify experimental procedure we are not using CO2 in thestudy as we have not observed CO2 effect on the NOx SCR by NH3during the preliminary experiments with Ag/Al2O3 catalysts.
Conversions were calculated using the following equations:
XNOx = 1 −Coutlet
NOx
C inletNOx
(1)
where XNOx denotes total conversion of NOx and C inletNOx
and CoutletNOx
is the NOx concentrations on the inlet and outlet of the reactor,where:
CNOx = CNO + CNO2 (2)
NH3 conversion (total), NH3 conversion to NOx (when no NOx
is fed) and NO conversion to NO2 (when no NH3 was fed) werecalculated correspondingly:
XNH3 = 1 −Coutlet
NH3
C inletNH3
(3)
XNH3→NOx = CoutletNOx
C inletNH3
(4)
XNO→NO2 =Coutlet
NO2
C inletNO
(5)
and the ratio of converted NO to converted NO2 in the experimentswith NO and NO2 mixtures:
Cconv.NO
Cconv.NO2
= C inletNO − Coutlet
NO
C inletNO2
− CoutletNO2
(6)
NH3:NOx conversion ratio below 400 ◦C was always 1:0.95–1.05for all tested catalysts, therefore we are presenting only NOx con-version values in the discussion.
2.4. DRIFTS studies
In-situ diffuse reflectance infrared Fourier transform spec-troscopy (DRIFTS) experiments were performed using a BioRad FTS6000 FTIR spectrometer equipped with a high-temperature reac-tion cell (Harrick Scientific, Praying Mantis) with KBr windows.The temperature of the reaction cell was controlled with a K-typethermocouple connected to a Eurotherm 2416 temperature con-troller. Gases were introduced into the reaction cell via individualmass flow controllers (Bronkhorst Hi-Tech). The gas composition atthe outlet of the DRIFTS cell was analysed by a mass spectrometer(Balzers QuadStar 420).
Each experiment was performed using approximately 100 mgof �-Al2O3 powder, using new powder for each experiment. Thepowder was initially pretreated in a flow of 8% O2 in Ar at 500 ◦Cfor 30 min, subsequently a background spectrum (60 scans, res-
olution 2 cm−1 at 4000 cm−1) was recorded in a flow of Ar. At500 ◦C, 185 ppm NO2, 315 ppm NO, 520 ppm NH3 and 8.3% O2 wereadded to the feed. Then the catalyst was cooled with a ramp rate of10 ◦C/min in the reaction mixture to reaction temperature, where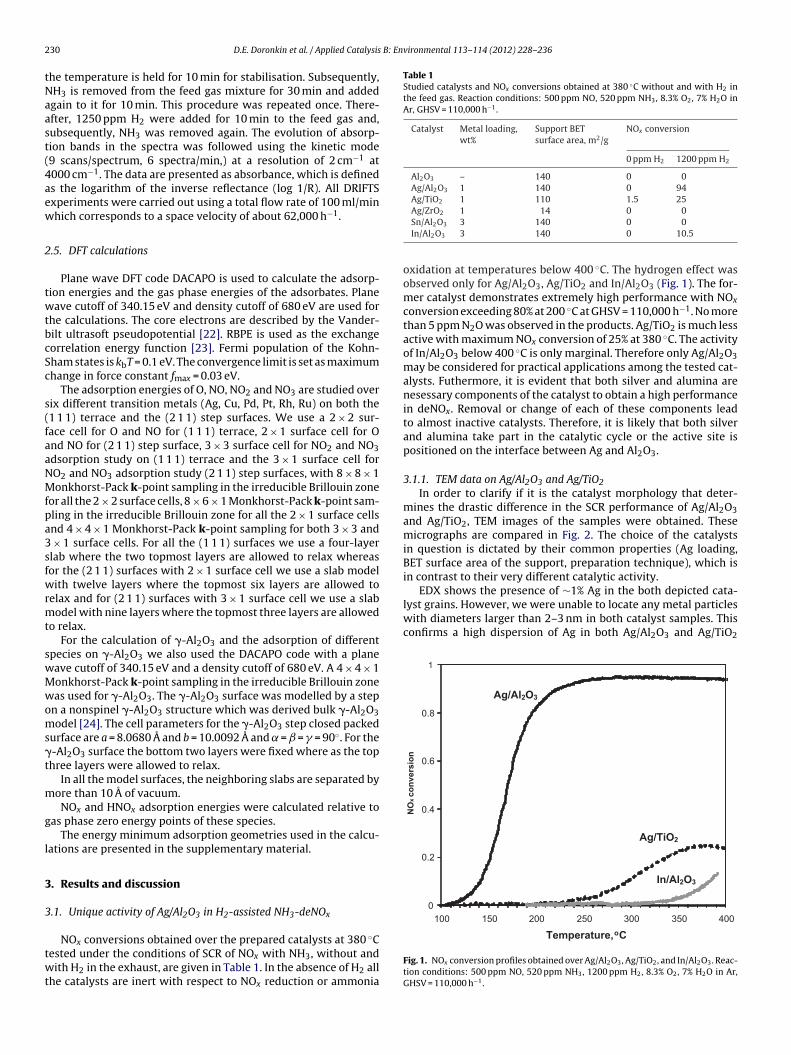
2 B: Environmental 113– 114 (2012) 228– 236
tNaast(4aew
2
twtbcSc
s(faaNMfpa3sfwrmt
swMwoms�t
m
g
l
3
3
twt
Table 1Studied catalysts and NOx conversions obtained at 380 ◦C without and with H2 inthe feed gas. Reaction conditions: 500 ppm NO, 520 ppm NH3, 8.3% O2, 7% H2O inAr, GHSV = 110,000 h−1.
Catalyst Metal loading,wt%
Support BETsurface area, m2/g
NOx conversion
0 ppm H2 1200 ppm H2
Al2O3 – 140 0 0Ag/Al2O3 1 140 0 94Ag/TiO2 1 110 1.5 25
EDX shows the presence of ∼1% Ag in the both depicted cata-lyst grains. However, we were unable to locate any metal particleswith diameters larger than 2–3 nm in both catalyst samples. Thisconfirms a high dispersion of Ag in both Ag/Al2O3 and Ag/TiO2
0
0.2
0.4
0.6
0.8
1
100 150 200 250 300 350 400
Ag/Al2O3
Ag/TiO2
In/Al2O3
NO
x co
nver
sion
30 D.E. Doronkin et al. / Applied Catalysis
he temperature is held for 10 min for stabilisation. Subsequently,H3 is removed from the feed gas mixture for 30 min and addedgain to it for 10 min. This procedure was repeated once. There-fter, 1250 ppm H2 were added for 10 min to the feed gas and,ubsequently, NH3 was removed again. The evolution of absorp-ion bands in the spectra was followed using the kinetic mode9 scans/spectrum, 6 spectra/min,) at a resolution of 2 cm−1 at000 cm−1. The data are presented as absorbance, which is defineds the logarithm of the inverse reflectance (log 1/R). All DRIFTSxperiments were carried out using a total flow rate of 100 ml/minhich corresponds to a space velocity of about 62,000 h−1.
.5. DFT calculations
Plane wave DFT code DACAPO is used to calculate the adsorp-ion energies and the gas phase energies of the adsorbates. Planeave cutoff of 340.15 eV and density cutoff of 680 eV are used for
he calculations. The core electrons are described by the Vander-ilt ultrasoft pseudopotential [22]. RBPE is used as the exchangeorrelation energy function [23]. Fermi population of the Kohn-ham states is kbT = 0.1 eV. The convergence limit is set as maximumhange in force constant fmax = 0.03 eV.
The adsorption energies of O, NO, NO2 and NO3 are studied overix different transition metals (Ag, Cu, Pd, Pt, Rh, Ru) on both the1 1 1) terrace and the (2 1 1) step surfaces. We use a 2 × 2 sur-ace cell for O and NO for (1 1 1) terrace, 2 × 1 surface cell for Ond NO for (2 1 1) step surface, 3 × 3 surface cell for NO2 and NO3dsorption study on (1 1 1) terrace and the 3 × 1 surface cell forO2 and NO3 adsorption study (2 1 1) step surfaces, with 8 × 8 × 1onkhorst-Pack k-point sampling in the irreducible Brillouin zone
or all the 2 × 2 surface cells, 8 × 6 × 1 Monkhorst-Pack k-point sam-ling in the irreducible Brillouin zone for all the 2 × 1 surface cellsnd 4 × 4 × 1 Monkhorst-Pack k-point sampling for both 3 × 3 and
× 1 surface cells. For all the (1 1 1) surfaces we use a four-layerlab where the two topmost layers are allowed to relax whereasor the (2 1 1) surfaces with 2 × 1 surface cell we use a slab modelith twelve layers where the topmost six layers are allowed to
elax and for (2 1 1) surfaces with 3 × 1 surface cell we use a slabodel with nine layers where the topmost three layers are allowed
o relax.For the calculation of �-Al2O3 and the adsorption of different
pecies on �-Al2O3 we also used the DACAPO code with a planeave cutoff of 340.15 eV and a density cutoff of 680 eV. A 4 × 4 × 1onkhorst-Pack k-point sampling in the irreducible Brillouin zoneas used for �-Al2O3. The �-Al2O3 surface was modelled by a step
n a nonspinel �-Al2O3 structure which was derived bulk �-Al2O3odel [24]. The cell parameters for the �-Al2O3 step closed packed
urface are a = 8.0680 A and b = 10.0092 A and = = � = 90◦. For the-Al2O3 surface the bottom two layers were fixed where as the tophree layers were allowed to relax.
In all the model surfaces, the neighboring slabs are separated byore than 10 A of vacuum.NOx and HNOx adsorption energies were calculated relative to
as phase zero energy points of these species.The energy minimum adsorption geometries used in the calcu-
ations are presented in the supplementary material.
. Results and discussion
.1. Unique activity of Ag/Al2O3 in H2-assisted NH3-deNOx
NOx conversions obtained over the prepared catalysts at 380 ◦Cested under the conditions of SCR of NOx with NH3, without andith H2 in the exhaust, are given in Table 1. In the absence of H2 all
he catalysts are inert with respect to NOx reduction or ammonia
Ag/ZrO2 1 14 0 0Sn/Al2O3 3 140 0 0In/Al2O3 3 140 0 10.5
oxidation at temperatures below 400 ◦C. The hydrogen effect wasobserved only for Ag/Al2O3, Ag/TiO2 and In/Al2O3 (Fig. 1). The for-mer catalyst demonstrates extremely high performance with NOx
conversion exceeding 80% at 200 ◦C at GHSV = 110,000 h−1. No morethan 5 ppm N2O was observed in the products. Ag/TiO2 is much lessactive with maximum NOx conversion of 25% at 380 ◦C. The activityof In/Al2O3 below 400 ◦C is only marginal. Therefore only Ag/Al2O3may be considered for practical applications among the tested cat-alysts. Futhermore, it is evident that both silver and alumina arenesessary components of the catalyst to obtain a high performancein deNOx. Removal or change of each of these components leadto almost inactive catalysts. Therefore, it is likely that both silverand alumina take part in the catalytic cycle or the active site ispositioned on the interface between Ag and Al2O3.
3.1.1. TEM data on Ag/Al2O3 and Ag/TiO2In order to clarify if it is the catalyst morphology that deter-
mines the drastic difference in the SCR performance of Ag/Al2O3and Ag/TiO2, TEM images of the samples were obtained. Thesemicrographs are compared in Fig. 2. The choice of the catalystsin question is dictated by their common properties (Ag loading,BET surface area of the support, preparation technique), which isin contrast to their very different catalytic activity.
Temperature, oC
Fig. 1. NOx conversion profiles obtained over Ag/Al2O3, Ag/TiO2, and In/Al2O3. Reac-tion conditions: 500 ppm NO, 520 ppm NH3, 1200 ppm H2, 8.3% O2, 7% H2O in Ar,GHSV = 110,000 h−1.
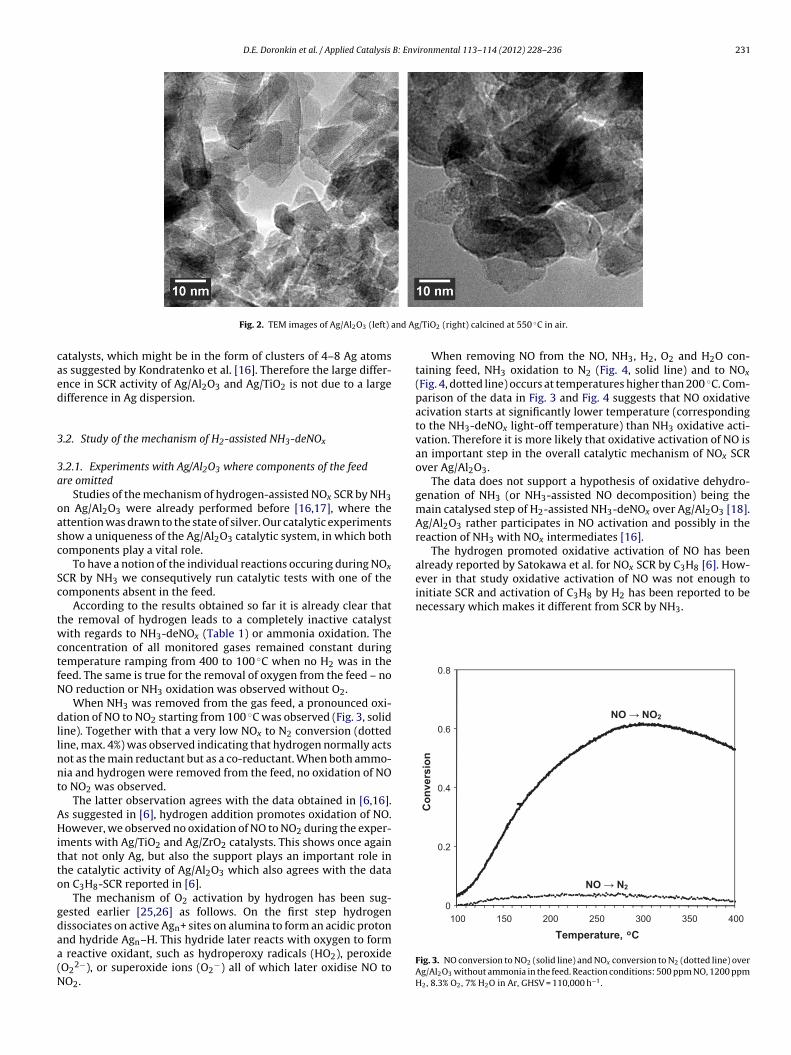
D.E. Doronkin et al. / Applied Catalysis B: Environmental 113– 114 (2012) 228– 236 231
and Ag
caed
3
3a
oasc
Sc
twctfN
dllnnt
AHitto
gdaa(N
initiate SCR and activation of C3H8 by H2 has been reported to benecessary which makes it different from SCR by NH3.
0
0.2
0.4
0.6
0.8
100 150 200 250 300 350 400
Con
vers
ion
NO NO2
NO N2
Fig. 2. TEM images of Ag/Al2O3 (left)
atalysts, which might be in the form of clusters of 4–8 Ag atomss suggested by Kondratenko et al. [16]. Therefore the large differ-nce in SCR activity of Ag/Al2O3 and Ag/TiO2 is not due to a largeifference in Ag dispersion.
.2. Study of the mechanism of H2-assisted NH3-deNOx
.2.1. Experiments with Ag/Al2O3 where components of the feedre omitted
Studies of the mechanism of hydrogen-assisted NOx SCR by NH3n Ag/Al2O3 were already performed before [16,17], where thettention was drawn to the state of silver. Our catalytic experimentshow a uniqueness of the Ag/Al2O3 catalytic system, in which bothomponents play a vital role.
To have a notion of the individual reactions occuring during NOx
CR by NH3 we consequtively run catalytic tests with one of theomponents absent in the feed.
According to the results obtained so far it is already clear thathe removal of hydrogen leads to a completely inactive catalystith regards to NH3-deNOx (Table 1) or ammonia oxidation. The
oncentration of all monitored gases remained constant duringemperature ramping from 400 to 100 ◦C when no H2 was in theeed. The same is true for the removal of oxygen from the feed – noO reduction or NH3 oxidation was observed without O2.
When NH3 was removed from the gas feed, a pronounced oxi-ation of NO to NO2 starting from 100 ◦C was observed (Fig. 3, solid
ine). Together with that a very low NOx to N2 conversion (dottedine, max. 4%) was observed indicating that hydrogen normally actsot as the main reductant but as a co-reductant. When both ammo-ia and hydrogen were removed from the feed, no oxidation of NOo NO2 was observed.
The latter observation agrees with the data obtained in [6,16].s suggested in [6], hydrogen addition promotes oxidation of NO.owever, we observed no oxidation of NO to NO2 during the exper-
ments with Ag/TiO2 and Ag/ZrO2 catalysts. This shows once againhat not only Ag, but also the support plays an important role inhe catalytic activity of Ag/Al2O3 which also agrees with the datan C3H8-SCR reported in [6].
The mechanism of O2 activation by hydrogen has been sug-ested earlier [25,26] as follows. On the first step hydrogenissociates on active Agn+ sites on alumina to form an acidic proton
nd hydride Agn–H. This hydride later reacts with oxygen to formreactive oxidant, such as hydroperoxy radicals (HO2), peroxideO2
2−), or superoxide ions (O2−) all of which later oxidise NO to
O2.
/TiO2 (right) calcined at 550 ◦C in air.
When removing NO from the NO, NH3, H2, O2 and H2O con-taining feed, NH3 oxidation to N2 (Fig. 4, solid line) and to NOx
(Fig. 4, dotted line) occurs at temperatures higher than 200 ◦C. Com-parison of the data in Fig. 3 and Fig. 4 suggests that NO oxidativeacivation starts at significantly lower temperature (correspondingto the NH3-deNOx light-off temperature) than NH3 oxidative acti-vation. Therefore it is more likely that oxidative activation of NO isan important step in the overall catalytic mechanism of NOx SCRover Ag/Al2O3.
The data does not support a hypothesis of oxidative dehydro-genation of NH3 (or NH3-assisted NO decomposition) being themain catalysed step of H2-assisted NH3-deNOx over Ag/Al2O3 [18].Ag/Al2O3 rather participates in NO activation and possibly in thereaction of NH3 with NOx intermediates [16].
The hydrogen promoted oxidative activation of NO has beenalready reported by Satokawa et al. for NOx SCR by C3H8 [6]. How-ever in that study oxidative activation of NO was not enough to
Temperature, oC
Fig. 3. NO conversion to NO2 (solid line) and NOx conversion to N2 (dotted line) overAg/Al2O3 without ammonia in the feed. Reaction conditions: 500 ppm NO, 1200 ppmH2, 8.3% O2, 7% H2O in Ar, GHSV = 110,000 h−1.
232 D.E. Doronkin et al. / Applied Catalysis B: Environmental 113– 114 (2012) 228– 236
0
0.05
0.1
0.15
0.2
100 150 200 250 300 350 400
NH 3
conv
ersi
on
Temperature, oC
NH3 NO x
NH3 N2 + NO x
FoH
3A
NtNu
w4iNcto
FN5G
-0.4
-0.2
0
0.2
0.4
0.6
0.8
1
100 150 200 250 300 350 400
NO
conv
erte
d / N
O2
conv
erte
d
Temperature, oC
47% NO2
26% NO2
34% NO2
Fig. 6. Ratio of consumed NO to consumed NO2 for simultaneous NO + NO2 reduc-tion by NH over Ag/Al O . Reaction conditions: 500 ppm NO (NO fraction is
ig. 4. Total NH3 conversion (solid line) and NH3 conversion to NOx (dotted line)ver Ag/Al2O3 with no NO in the feed. Reaction conditions: 520 ppm NH3, 1200 ppm2, 8.3% O2, 7% H2O in Ar, GHSV = 110,000 h−1.
.2.2. Experiments with feeding NO and NO2 mixtures overg/Al2O3 and Ag/ZrO2
After realizing that the hydrogen promoted oxidation of NO toO2 may be the first step in the H2-assisted NH3-deNOx we decided
o do catalytic tests with a feed containing a mixture of NO andO2 as NOx. Since H2 facilitates reversible NO-NO2 tranformation,ndesirable for these experimens, no H2 was co-fed.
Fig. 5 shows NOx conversions to N2 obtained over Ag/Al2O3hen a NO and NO2 mixture is fed as NOx (containing 26, 34 and
7% NO2) and over Ag/ZrO2 with 34% NO2 in NO as NOx. Surpris-ngly for all three cases we observe nearly equal, maximum 30%,Ox conversion which changes only slightly with temperature. NH3
onversion profiles follow the NOx conversion profiles and they areherefore not shown. This observation allows us to conclude thatxidation of NO to NO2 over Ag/Al2O3, at least, partially accounts0
0.1
0.2
0.3
0.4
100 150 200 250 300 350 400
NO
xco
nver
sion
Temperature, oC
Ag/ZrO2 (34% NO2)
Ag/Al2O3 (47% NO 2)
Ag/Al2O3 (34% NO 2)
Ag/Al2O3 (26% NO 2)
ig. 5. NOx conversion over Ag/Al2O3 and Ag/ZrO2 without H2 in the feed, whenO and NO2 mixture is fed as NOx (NO2 content is specified, NO is the rest of00 ppm NOx). Conditions: 500 ppm NOx , 520 ppm NH3, 8.3% O2, 7% H2O in Ar,HSV = 110,000 h−1.
3 2 3 x 2
stated near the corresponding curves), 520 ppm NH3, 8.3% O2, 7% H2O in Ar,GHSV = 110,000 h−1.
for the activity of this catalyst in the NOx SCR. This agrees withprevious works, evidencing oxidation of NO to NO2 involving H2[25] and supposing it to be crucial for low-temperature NOx SCR byhydrocarbons [27].
Moreover, SCR of the NO and NO2 mixture by NH3 is not aunique feature of Ag/Al2O3 but was also observed for other supportsthough to a less extent, e.g. with 15% maximum NOx conversion inthe case of Ag/ZrO2 (see Fig. 5, gray dotted line). Thus, metal oxidesother than alumina can catalyse NO + NO2 SCR by NH3 but Ag/Al2O3with H2 co-feeding is required to oxidise NO at low temperatures.Therefore, we are focusing our study on Ag/Al2O3 catalysts and thecorresponding alumina support.
The effect of increasing the NOx SCR rate by feeding NO andNO2 mixture has already been noticed for other catalytic systemsincluding vanadia-based catalysts [28] and zeolites [29]. The effectis called “Fast-SCR” and characterised by a well-defined stoichiom-etry of NO:NO2 being 1:1.
To check if the NO:NO2 conversion without H2 in the feed canbe ascribed to “Fast SCR” [29], we calculated the ratio of consumedNO to consumed NO2 (Fig. 6). In our case the ratio of consumed NOto consumed NO2 changed with temperature from negative values(only NO2 is consumed and a small amount of NO is produced fromit) to positive values up to 1 in case of feeding 26% NO2 (Fig. 6).Interestingly, the temperature at which NO starts to be consumed(∼150 ◦C) coincides with the onset temperature of H2-assisted SCR(Fig. 1). Therefore, we can suppose that parts of the mechanismsof both H2-assisted NO SCR by NH3 and NO + NO2 SCR by NH3 aresimilar. But in case of NO + NO2 SCR we observed a conversion limitat ∼30%, when almost 100% conversion is obtained in H2-assistedNOx-SCR. This could be explained by blocking of the catalyst sur-face by adsorbed nitrate species [25]. The poisoning effect of surfacenitrates for propane-SCR was observed in [26], where the authorsalso demonstrated the ability of hydrogen to effectively removeadsorbed nitrate species. Thus, introduction of hydrogen may facil-itate not only NO to NO2 conversion, but also regeneration of thecatalyst surface, which removes the 30% conversion limit.
In general, the ratio of converted NO to converted NO depends
2on the total amount of NO2 in the feed and decreases with increasein NO2 content. The higher the NO2 content – the larger is the partof NO2 in the NOx that is converted to N2. Independent on this,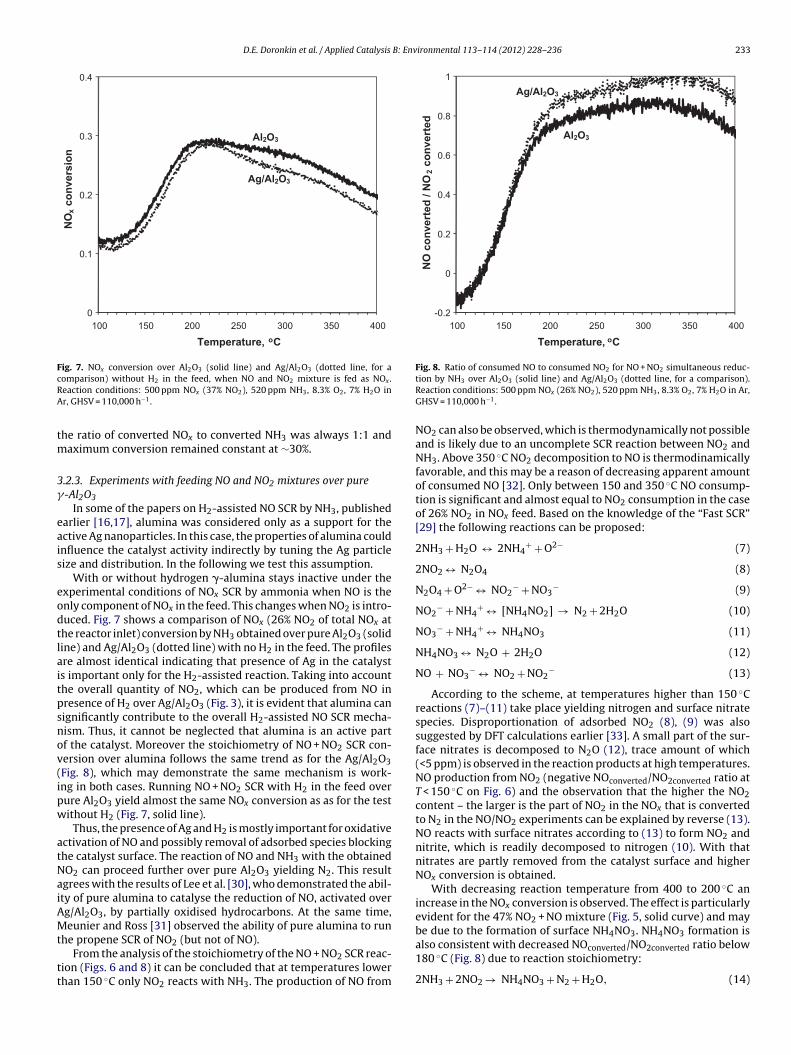
D.E. Doronkin et al. / Applied Catalysis B: Environmental 113– 114 (2012) 228– 236 233
0
0.1
0.2
0.3
0.4
100 150 200 250 300 350 400
NO
xco
nver
sion
Temperature, oC
Al2O3
Ag/Al2O3
Fig. 7. NOx conversion over Al2O3 (solid line) and Ag/Al2O3 (dotted line, for acRA
tm
3�
eais
eodtlaitpsnov(ipw
atNaiAMt
tt
-0.2
0
0.2
0.4
0.6
0.8
1
400350300250200150100
NO
con
vert
ed /
NO
2co
nver
ted
Temperature, oC
Ag/Al2O3
Al2O3
Fig. 8. Ratio of consumed NO to consumed NO2 for NO + NO2 simultaneous reduc-
be due to the formation of surface NH4NO3. NH4NO3 formation is
omparison) without H2 in the feed, when NO and NO2 mixture is fed as NOx .eaction conditions: 500 ppm NOx (37% NO2), 520 ppm NH3, 8.3% O2, 7% H2O inr, GHSV = 110,000 h−1.
he ratio of converted NOx to converted NH3 was always 1:1 andaximum conversion remained constant at ∼30%.
.2.3. Experiments with feeding NO and NO2 mixtures over pure-Al2O3
In some of the papers on H2-assisted NO SCR by NH3, publishedarlier [16,17], alumina was considered only as a support for thective Ag nanoparticles. In this case, the properties of alumina couldnfluence the catalyst activity indirectly by tuning the Ag particleize and distribution. In the following we test this assumption.
With or without hydrogen �-alumina stays inactive under thexperimental conditions of NOx SCR by ammonia when NO is thenly component of NOx in the feed. This changes when NO2 is intro-uced. Fig. 7 shows a comparison of NOx (26% NO2 of total NOx athe reactor inlet) conversion by NH3 obtained over pure Al2O3 (solidine) and Ag/Al2O3 (dotted line) with no H2 in the feed. The profilesre almost identical indicating that presence of Ag in the catalysts important only for the H2-assisted reaction. Taking into accounthe overall quantity of NO2, which can be produced from NO inresence of H2 over Ag/Al2O3 (Fig. 3), it is evident that alumina canignificantly contribute to the overall H2-assisted NO SCR mecha-ism. Thus, it cannot be neglected that alumina is an active partf the catalyst. Moreover the stoichiometry of NO + NO2 SCR con-ersion over alumina follows the same trend as for the Ag/Al2O3Fig. 8), which may demonstrate the same mechanism is work-ng in both cases. Running NO + NO2 SCR with H2 in the feed overure Al2O3 yield almost the same NOx conversion as as for the testithout H2 (Fig. 7, solid line).
Thus, the presence of Ag and H2 is mostly important for oxidativectivation of NO and possibly removal of adsorbed species blockinghe catalyst surface. The reaction of NO and NH3 with the obtainedO2 can proceed further over pure Al2O3 yielding N2. This resultgrees with the results of Lee et al. [30], who demonstrated the abil-ty of pure alumina to catalyse the reduction of NO, activated overg/Al2O3, by partially oxidised hydrocarbons. At the same time,eunier and Ross [31] observed the ability of pure alumina to run
he propene SCR of NO2 (but not of NO).From the analysis of the stoichiometry of the NO + NO2 SCR reac-
ion (Figs. 6 and 8) it can be concluded that at temperatures lowerhan 150 ◦C only NO2 reacts with NH3. The production of NO from
tion by NH3 over Al2O3 (solid line) and Ag/Al2O3 (dotted line, for a comparison).Reaction conditions: 500 ppm NOx (26% NO2), 520 ppm NH3, 8.3% O2, 7% H2O in Ar,GHSV = 110,000 h−1.
NO2 can also be observed, which is thermodynamically not possibleand is likely due to an uncomplete SCR reaction between NO2 andNH3. Above 350 ◦C NO2 decomposition to NO is thermodinamicallyfavorable, and this may be a reason of decreasing apparent amountof consumed NO [32]. Only between 150 and 350 ◦C NO consump-tion is significant and almost equal to NO2 consumption in the caseof 26% NO2 in NOx feed. Based on the knowledge of the “Fast SCR”[29] the following reactions can be proposed:
2NH3 + H2O ↔ 2NH4+ + O2− (7)
2NO2 ↔ N2O4 (8)
N2O4 + O2− ↔ NO2− + NO3
− (9)
NO2− + NH4
+ ↔ [NH4NO2] → N2 + 2H2O (10)
NO3− + NH4
+ ↔ NH4NO3 (11)
NH4NO3 ↔ N2O + 2H2O (12)
NO + NO3− ↔ NO2 + NO2
− (13)
According to the scheme, at temperatures higher than 150 ◦Creactions (7)–(11) take place yielding nitrogen and surface nitratespecies. Disproportionation of adsorbed NO2 (8), (9) was alsosuggested by DFT calculations earlier [33]. A small part of the sur-face nitrates is decomposed to N2O (12), trace amount of which(<5 ppm) is observed in the reaction products at high temperatures.NO production from NO2 (negative NOconverted/NO2converted ratio atT < 150 ◦C on Fig. 6) and the observation that the higher the NO2content – the larger is the part of NO2 in the NOx that is convertedto N2 in the NO/NO2 experiments can be explained by reverse (13).NO reacts with surface nitrates according to (13) to form NO2 andnitrite, which is readily decomposed to nitrogen (10). With thatnitrates are partly removed from the catalyst surface and higherNOx conversion is obtained.
With decreasing reaction temperature from 400 to 200 ◦C anincrease in the NOx conversion is observed. The effect is particularlyevident for the 47% NO2 + NO mixture (Fig. 5, solid curve) and may
also consistent with decreased NOconverted/NO2converted ratio below180 ◦C (Fig. 8) due to reaction stoichiometry:
2NH3 + 2NO2 → NH4NO3 + N2 + H2O, (14)
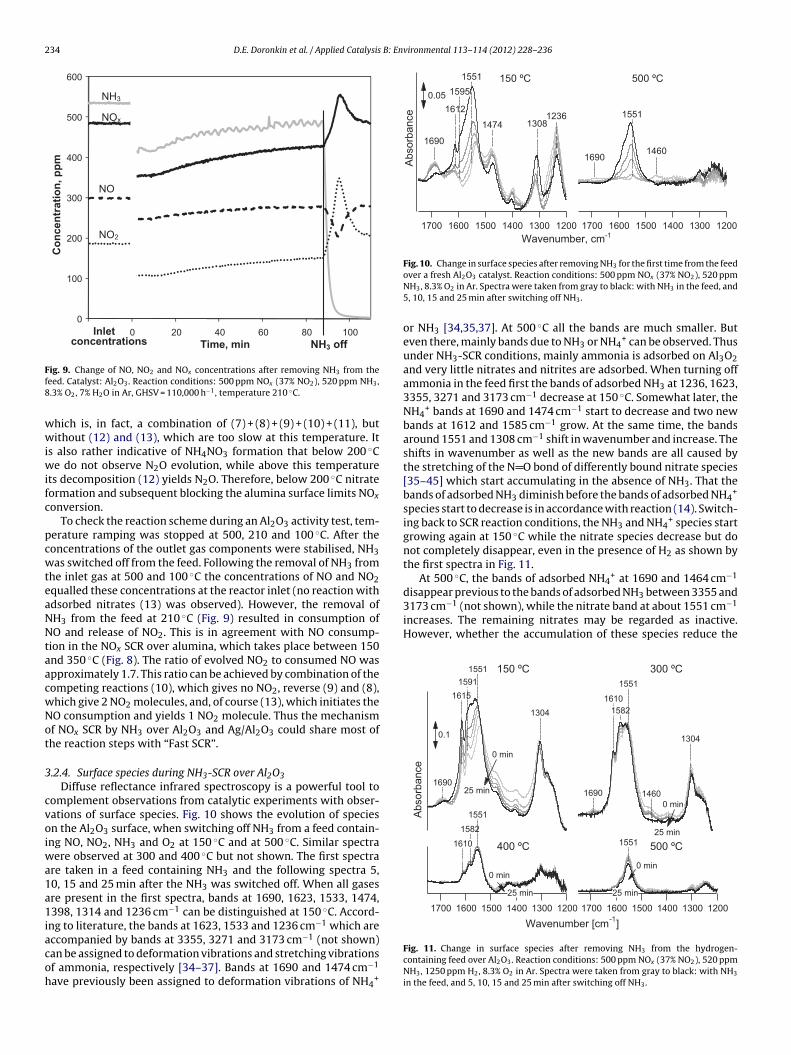
234 D.E. Doronkin et al. / Applied Catalysis B: Environmental 113– 114 (2012) 228– 236
0
100
200
300
400
500
600
-20 0 20 40 60 80 100
Con
cent
ratio
n, p
pm
Time, min
NH3
NOx
NO
NO2
Inlet concentrations NH3 off
Ff8
wwiwifc
pcwteaNNtaacwNot
3
cvoiwa1a1iacoh
Abs
orba
nce
1700 1600 1500 1400 1300 1200 1700 1600 1500 1400 1300 1200
123613081474
1551
1612
1690
0.05 1595
16901460
1551
150 ºC 500 ºC
Wavenumber, cm-1
Fig. 10. Change in surface species after removing NH3 for the first time from the feed
disappear previous to the bands of adsorbed NH3 between 3355 and3173 cm−1 (not shown), while the nitrate band at about 1551 cm−1
increases. The remaining nitrates may be regarded as inactive.However, whether the accumulation of these species reduce the
Abs
orba
nce
1700 1600 1500 1400 1300 1200
Wavenumber [cm ]1700 1600 1500 1400 1300 1200
150 ºC 300 ºC
400 ºC 500 ºC
16901690
1615 1610
1582
1582
1610
1591
1551
1551
1460
1304
13040.1
0 min
0 min25 min
25 min
0 min
25 min
0 min
25 min
1551
1551
-1
ig. 9. Change of NO, NO2 and NOx concentrations after removing NH3 from theeed. Catalyst: Al2O3. Reaction conditions: 500 ppm NOx (37% NO2), 520 ppm NH3,.3% O2, 7% H2O in Ar, GHSV = 110,000 h−1, temperature 210 ◦C.
hich is, in fact, a combination of (7) + (8) + (9) + (10) + (11), butithout (12) and (13), which are too slow at this temperature. It
s also rather indicative of NH4NO3 formation that below 200 ◦Ce do not observe N2O evolution, while above this temperature
ts decomposition (12) yields N2O. Therefore, below 200 ◦C nitrateormation and subsequent blocking the alumina surface limits NOx
onversion.To check the reaction scheme during an Al2O3 activity test, tem-
erature ramping was stopped at 500, 210 and 100 ◦C. After theoncentrations of the outlet gas components were stabilised, NH3as switched off from the feed. Following the removal of NH3 from
he inlet gas at 500 and 100 ◦C the concentrations of NO and NO2qualled these concentrations at the reactor inlet (no reaction withdsorbed nitrates (13) was observed). However, the removal ofH3 from the feed at 210 ◦C (Fig. 9) resulted in consumption ofO and release of NO2. This is in agreement with NO consump-
ion in the NOx SCR over alumina, which takes place between 150nd 350 ◦C (Fig. 8). The ratio of evolved NO2 to consumed NO waspproximately 1.7. This ratio can be achieved by combination of theompeting reactions (10), which gives no NO2, reverse (9) and (8),hich give 2 NO2 molecules, and, of course (13), which initiates theO consumption and yields 1 NO2 molecule. Thus the mechanismf NOx SCR by NH3 over Al2O3 and Ag/Al2O3 could share most ofhe reaction steps with “Fast SCR”.
.2.4. Surface species during NH3-SCR over Al2O3Diffuse reflectance infrared spectroscopy is a powerful tool to
omplement observations from catalytic experiments with obser-ations of surface species. Fig. 10 shows the evolution of speciesn the Al2O3 surface, when switching off NH3 from a feed contain-ng NO, NO2, NH3 and O2 at 150 ◦C and at 500 ◦C. Similar spectra
ere observed at 300 and 400 ◦C but not shown. The first spectrare taken in a feed containing NH3 and the following spectra 5,0, 15 and 25 min after the NH3 was switched off. When all gasesre present in the first spectra, bands at 1690, 1623, 1533, 1474,398, 1314 and 1236 cm−1 can be distinguished at 150 ◦C. Accord-
ng to literature, the bands at 1623, 1533 and 1236 cm−1 which are
ccompanied by bands at 3355, 3271 and 3173 cm−1 (not shown)an be assigned to deformation vibrations and stretching vibrationsf ammonia, respectively [34–37]. Bands at 1690 and 1474 cm−1ave previously been assigned to deformation vibrations of NH4+
over a fresh Al2O3 catalyst. Reaction conditions: 500 ppm NOx (37% NO2), 520 ppmNH3, 8.3% O2 in Ar. Spectra were taken from gray to black: with NH3 in the feed, and5, 10, 15 and 25 min after switching off NH3.
or NH3 [34,35,37]. At 500 ◦C all the bands are much smaller. Buteven there, mainly bands due to NH3 or NH4
+ can be observed. Thusunder NH3-SCR conditions, mainly ammonia is adsorbed on Al3O2and very little nitrates and nitrites are adsorbed. When turning offammonia in the feed first the bands of adsorbed NH3 at 1236, 1623,3355, 3271 and 3173 cm−1 decrease at 150 ◦C. Somewhat later, theNH4
+ bands at 1690 and 1474 cm−1 start to decrease and two newbands at 1612 and 1585 cm−1 grow. At the same time, the bandsaround 1551 and 1308 cm−1 shift in wavenumber and increase. Theshifts in wavenumber as well as the new bands are all caused bythe stretching of the N O bond of differently bound nitrate species[35–45] which start accumulating in the absence of NH3. That thebands of adsorbed NH3 diminish before the bands of adsorbed NH4
+
species start to decrease is in accordance with reaction (14). Switch-ing back to SCR reaction conditions, the NH3 and NH4
+ species startgrowing again at 150 ◦C while the nitrate species decrease but donot completely disappear, even in the presence of H2 as shown bythe first spectra in Fig. 11.
At 500 ◦C, the bands of adsorbed NH4+ at 1690 and 1464 cm−1
Fig. 11. Change in surface species after removing NH3 from the hydrogen-containing feed over Al2O3. Reaction conditions: 500 ppm NOx (37% NO2), 520 ppmNH3, 1250 ppm H2, 8.3% O2 in Ar. Spectra were taken from gray to black: with NH3
in the feed, and 5, 10, 15 and 25 min after switching off NH3.
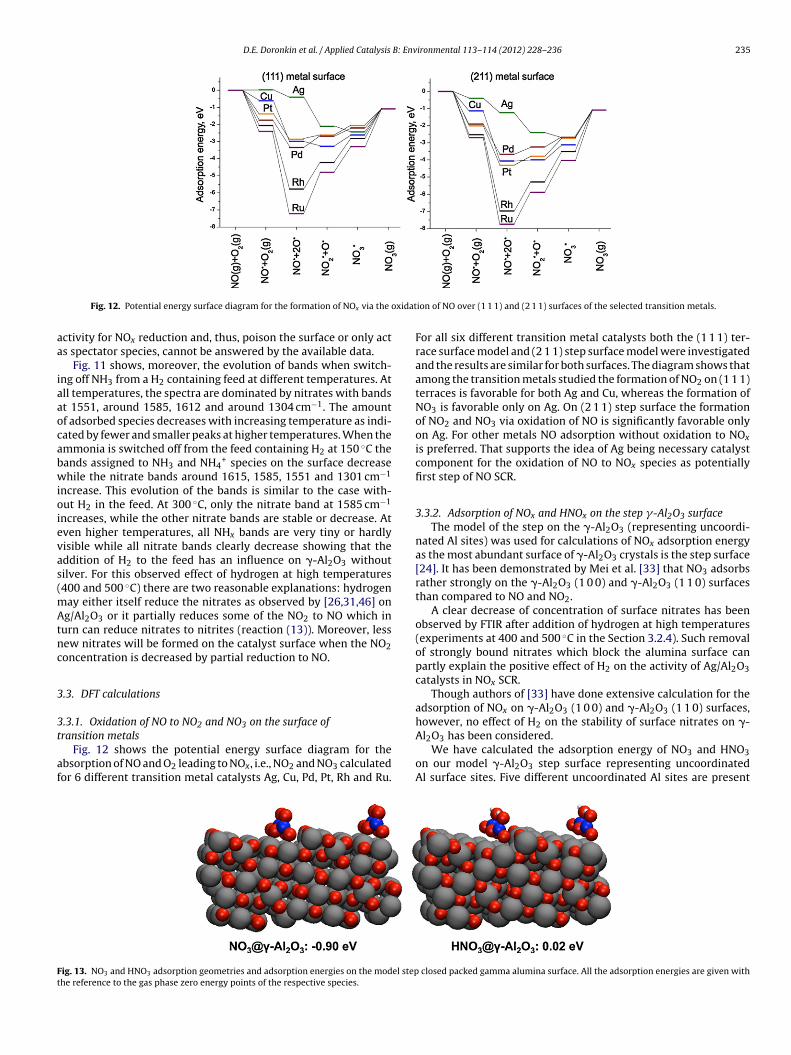
D.E. Doronkin et al. / Applied Catalysis B: Environmental 113– 114 (2012) 228– 236 235
oxidat
aa
iaaocabwioievas(mAtnc
3
3t
af
Ft
Fig. 12. Potential energy surface diagram for the formation of NOx via the
ctivity for NOx reduction and, thus, poison the surface or only acts spectator species, cannot be answered by the available data.
Fig. 11 shows, moreover, the evolution of bands when switch-ng off NH3 from a H2 containing feed at different temperatures. Atll temperatures, the spectra are dominated by nitrates with bandst 1551, around 1585, 1612 and around 1304 cm−1. The amountf adsorbed species decreases with increasing temperature as indi-ated by fewer and smaller peaks at higher temperatures. When themmonia is switched off from the feed containing H2 at 150 ◦C theands assigned to NH3 and NH4
+ species on the surface decreasehile the nitrate bands around 1615, 1585, 1551 and 1301 cm−1
ncrease. This evolution of the bands is similar to the case with-ut H2 in the feed. At 300 ◦C, only the nitrate band at 1585 cm−1
ncreases, while the other nitrate bands are stable or decrease. Atven higher temperatures, all NHx bands are very tiny or hardlyisible while all nitrate bands clearly decrease showing that theddition of H2 to the feed has an influence on �-Al2O3 withoutilver. For this observed effect of hydrogen at high temperatures400 and 500 ◦C) there are two reasonable explanations: hydrogen
ay either itself reduce the nitrates as observed by [26,31,46] ong/Al2O3 or it partially reduces some of the NO2 to NO which in
urn can reduce nitrates to nitrites (reaction (13)). Moreover, lessew nitrates will be formed on the catalyst surface when the NO2oncentration is decreased by partial reduction to NO.
.3. DFT calculations
.3.1. Oxidation of NO to NO2 and NO3 on the surface of
ransition metalsFig. 12 shows the potential energy surface diagram for thebsorption of NO and O2 leading to NOx, i.e., NO2 and NO3 calculatedor 6 different transition metal catalysts Ag, Cu, Pd, Pt, Rh and Ru.
ig. 13. NO3 and HNO3 adsorption geometries and adsorption energies on the model stephe reference to the gas phase zero energy points of the respective species.
ion of NO over (1 1 1) and (2 1 1) surfaces of the selected transition metals.
For all six different transition metal catalysts both the (1 1 1) ter-race surface model and (2 1 1) step surface model were investigatedand the results are similar for both surfaces. The diagram shows thatamong the transition metals studied the formation of NO2 on (1 1 1)terraces is favorable for both Ag and Cu, whereas the formation ofNO3 is favorable only on Ag. On (2 1 1) step surface the formationof NO2 and NO3 via oxidation of NO is significantly favorable onlyon Ag. For other metals NO adsorption without oxidation to NOx
is preferred. That supports the idea of Ag being necessary catalystcomponent for the oxidation of NO to NOx species as potentiallyfirst step of NO SCR.
3.3.2. Adsorption of NOx and HNOx on the step �-Al2O3 surfaceThe model of the step on the �-Al2O3 (representing uncoordi-
nated Al sites) was used for calculations of NOx adsorption energyas the most abundant surface of �-Al2O3 crystals is the step surface[24]. It has been demonstrated by Mei et al. [33] that NO3 adsorbsrather strongly on the �-Al2O3 (1 0 0) and �-Al2O3 (1 1 0) surfacesthan compared to NO and NO2.
A clear decrease of concentration of surface nitrates has beenobserved by FTIR after addition of hydrogen at high temperatures(experiments at 400 and 500 ◦C in the Section 3.2.4). Such removalof strongly bound nitrates which block the alumina surface canpartly explain the positive effect of H2 on the activity of Ag/Al2O3catalysts in NOx SCR.
Though authors of [33] have done extensive calculation for theadsorption of NOx on �-Al2O3 (1 0 0) and �-Al2O3 (1 1 0) surfaces,however, no effect of H2 on the stability of surface nitrates on �-
Al2O3 has been considered.We have calculated the adsorption energy of NO3 and HNO3on our model �-Al2O3 step surface representing uncoordinatedAl surface sites. Five different uncoordinated Al sites are present
closed packed gamma alumina surface. All the adsorption energies are given with
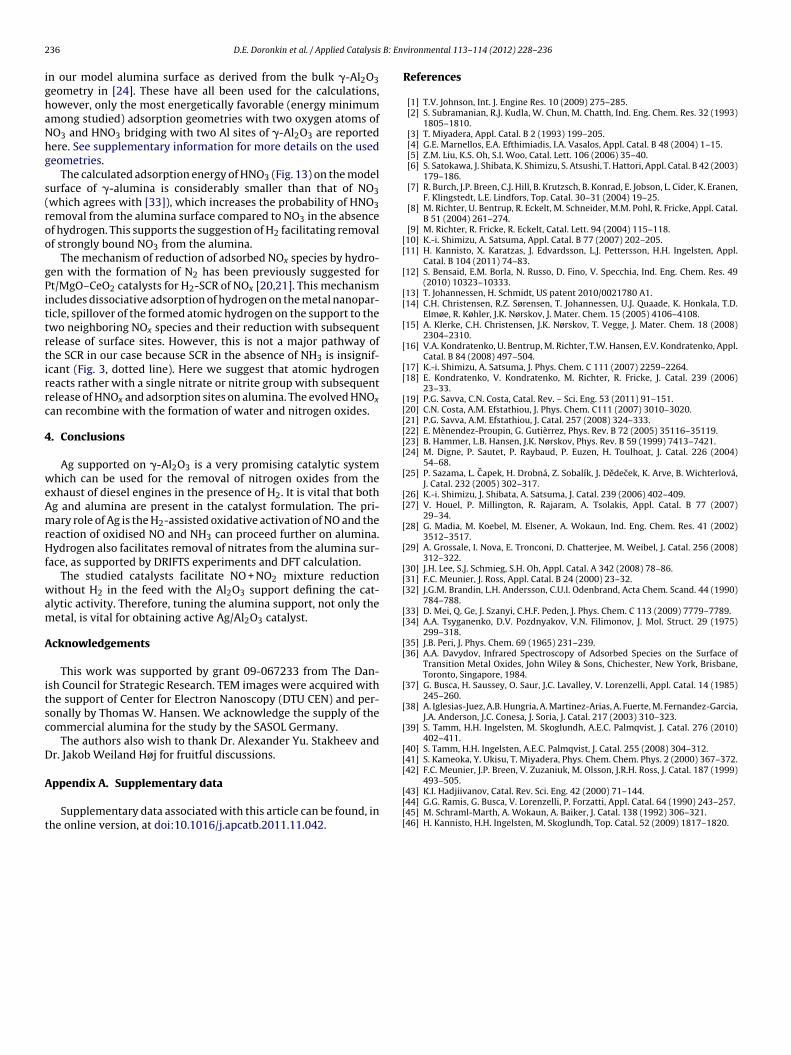
2 B: En
ighaNhg
s(roo
gPittrtirrc
4
weAmrHf
wam
A
itsc
D
A
t
[[
[
[[
[
[
[[
[[[[[[
[
[[
[
[
[[[
[[
[[
[
[
[
[[[
36 D.E. Doronkin et al. / Applied Catalysis
n our model alumina surface as derived from the bulk �-Al2O3eometry in [24]. These have all been used for the calculations,owever, only the most energetically favorable (energy minimummong studied) adsorption geometries with two oxygen atoms ofO3 and HNO3 bridging with two Al sites of �-Al2O3 are reportedere. See supplementary information for more details on the usedeometries.
The calculated adsorption energy of HNO3 (Fig. 13) on the modelurface of �-alumina is considerably smaller than that of NO3which agrees with [33]), which increases the probability of HNO3emoval from the alumina surface compared to NO3 in the absencef hydrogen. This supports the suggestion of H2 facilitating removalf strongly bound NO3 from the alumina.
The mechanism of reduction of adsorbed NOx species by hydro-en with the formation of N2 has been previously suggested fort/MgO–CeO2 catalysts for H2-SCR of NOx [20,21]. This mechanismncludes dissociative adsorption of hydrogen on the metal nanopar-icle, spillover of the formed atomic hydrogen on the support to thewo neighboring NOx species and their reduction with subsequentelease of surface sites. However, this is not a major pathway ofhe SCR in our case because SCR in the absence of NH3 is insignif-cant (Fig. 3, dotted line). Here we suggest that atomic hydrogeneacts rather with a single nitrate or nitrite group with subsequentelease of HNOx and adsorption sites on alumina. The evolved HNOx
an recombine with the formation of water and nitrogen oxides.
. Conclusions
Ag supported on �-Al2O3 is a very promising catalytic systemhich can be used for the removal of nitrogen oxides from the
xhaust of diesel engines in the presence of H2. It is vital that bothg and alumina are present in the catalyst formulation. The pri-ary role of Ag is the H2-assisted oxidative activation of NO and the
eaction of oxidised NO and NH3 can proceed further on alumina.ydrogen also facilitates removal of nitrates from the alumina sur-
ace, as supported by DRIFTS experiments and DFT calculation.The studied catalysts facilitate NO + NO2 mixture reduction
ithout H2 in the feed with the Al2O3 support defining the cat-lytic activity. Therefore, tuning the alumina support, not only theetal, is vital for obtaining active Ag/Al2O3 catalyst.
cknowledgements
This work was supported by grant 09-067233 from The Dan-sh Council for Strategic Research. TEM images were acquired withhe support of Center for Electron Nanoscopy (DTU CEN) and per-onally by Thomas W. Hansen. We acknowledge the supply of theommercial alumina for the study by the SASOL Germany.
The authors also wish to thank Dr. Alexander Yu. Stakheev andr. Jakob Weiland Høj for fruitful discussions.
ppendix A. Supplementary data
Supplementary data associated with this article can be found, inhe online version, at doi:10.1016/j.apcatb.2011.11.042.
[[[[
vironmental 113– 114 (2012) 228– 236
References
[1] T.V. Johnson, Int. J. Engine Res. 10 (2009) 275–285.[2] S. Subramanian, R.J. Kudla, W. Chun, M. Chatth, Ind. Eng. Chem. Res. 32 (1993)
1805–1810.[3] T. Miyadera, Appl. Catal. B 2 (1993) 199–205.[4] G.E. Marnellos, E.A. Efthimiadis, I.A. Vasalos, Appl. Catal. B 48 (2004) 1–15.[5] Z.M. Liu, K.S. Oh, S.I. Woo, Catal. Lett. 106 (2006) 35–40.[6] S. Satokawa, J. Shibata, K. Shimizu, S. Atsushi, T. Hattori, Appl. Catal. B 42 (2003)
179–186.[7] R. Burch, J.P. Breen, C.J. Hill, B. Krutzsch, B. Konrad, E. Jobson, L. Cider, K. Eranen,
F. Klingstedt, L.E. Lindfors, Top. Catal. 30–31 (2004) 19–25.[8] M. Richter, U. Bentrup, R. Eckelt, M. Schneider, M.M. Pohl, R. Fricke, Appl. Catal.
B 51 (2004) 261–274.[9] M. Richter, R. Fricke, R. Eckelt, Catal. Lett. 94 (2004) 115–118.10] K.-i. Shimizu, A. Satsuma, Appl. Catal. B 77 (2007) 202–205.11] H. Kannisto, X. Karatzas, J. Edvardsson, L.J. Pettersson, H.H. Ingelsten, Appl.
Catal. B 104 (2011) 74–83.12] S. Bensaid, E.M. Borla, N. Russo, D. Fino, V. Specchia, Ind. Eng. Chem. Res. 49
(2010) 10323–10333.13] T. Johannessen, H. Schmidt, US patent 2010/0021780 A1.14] C.H. Christensen, R.Z. Sørensen, T. Johannessen, U.J. Quaade, K. Honkala, T.D.
Elmøe, R. Køhler, J.K. Nørskov, J. Mater. Chem. 15 (2005) 4106–4108.15] A. Klerke, C.H. Christensen, J.K. Nørskov, T. Vegge, J. Mater. Chem. 18 (2008)
2304–2310.16] V.A. Kondratenko, U. Bentrup, M. Richter, T.W. Hansen, E.V. Kondratenko, Appl.
Catal. B 84 (2008) 497–504.17] K.-i. Shimizu, A. Satsuma, J. Phys. Chem. C 111 (2007) 2259–2264.18] E. Kondratenko, V. Kondratenko, M. Richter, R. Fricke, J. Catal. 239 (2006)
23–33.19] P.G. Savva, C.N. Costa, Catal. Rev. – Sci. Eng. 53 (2011) 91–151.20] C.N. Costa, A.M. Efstathiou, J. Phys. Chem. C111 (2007) 3010–3020.21] P.G. Savva, A.M. Efstathiou, J. Catal. 257 (2008) 324–333.22] E. Mènendez-Proupin, G. Gutièrrez, Phys. Rev. B 72 (2005) 35116–35119.23] B. Hammer, L.B. Hansen, J.K. Nørskov, Phys. Rev. B 59 (1999) 7413–7421.24] M. Digne, P. Sautet, P. Raybaud, P. Euzen, H. Toulhoat, J. Catal. 226 (2004)
54–68.25] P. Sazama, L. Capek, H. Drobná, Z. Sobalík, J. Dedecek, K. Arve, B. Wichterlová,
J. Catal. 232 (2005) 302–317.26] K.-i. Shimizu, J. Shibata, A. Satsuma, J. Catal. 239 (2006) 402–409.27] V. Houel, P. Millington, R. Rajaram, A. Tsolakis, Appl. Catal. B 77 (2007)
29–34.28] G. Madia, M. Koebel, M. Elsener, A. Wokaun, Ind. Eng. Chem. Res. 41 (2002)
3512–3517.29] A. Grossale, I. Nova, E. Tronconi, D. Chatterjee, M. Weibel, J. Catal. 256 (2008)
312–322.30] J.H. Lee, S.J. Schmieg, S.H. Oh, Appl. Catal. A 342 (2008) 78–86.31] F.C. Meunier, J. Ross, Appl. Catal. B 24 (2000) 23–32.32] J.G.M. Brandin, L.H. Andersson, C.U.I. Odenbrand, Acta Chem. Scand. 44 (1990)
784–788.33] D. Mei, Q. Ge, J. Szanyi, C.H.F. Peden, J. Phys. Chem. C 113 (2009) 7779–7789.34] A.A. Tsyganenko, D.V. Pozdnyakov, V.N. Filimonov, J. Mol. Struct. 29 (1975)
299–318.35] J.B. Peri, J. Phys. Chem. 69 (1965) 231–239.36] A.A. Davydov, Infrared Spectroscopy of Adsorbed Species on the Surface of
Transition Metal Oxides, John Wiley & Sons, Chichester, New York, Brisbane,Toronto, Singapore, 1984.
37] G. Busca, H. Saussey, O. Saur, J.C. Lavalley, V. Lorenzelli, Appl. Catal. 14 (1985)245–260.
38] A. Iglesias-Juez, A.B. Hungria, A. Martinez-Arias, A. Fuerte, M. Fernandez-Garcia,J.A. Anderson, J.C. Conesa, J. Soria, J. Catal. 217 (2003) 310–323.
39] S. Tamm, H.H. Ingelsten, M. Skoglundh, A.E.C. Palmqvist, J. Catal. 276 (2010)402–411.
40] S. Tamm, H.H. Ingelsten, A.E.C. Palmqvist, J. Catal. 255 (2008) 304–312.41] S. Kameoka, Y. Ukisu, T. Miyadera, Phys. Chem. Chem. Phys. 2 (2000) 367–372.42] F.C. Meunier, J.P. Breen, V. Zuzaniuk, M. Olsson, J.R.H. Ross, J. Catal. 187 (1999)
493–505.43] K.I. Hadjiivanov, Catal. Rev. Sci. Eng. 42 (2000) 71–144.44] G.G. Ramis, G. Busca, V. Lorenzelli, P. Forzatti, Appl. Catal. 64 (1990) 243–257.45] M. Schraml-Marth, A. Wokaun, A. Baiker, J. Catal. 138 (1992) 306–321.46] H. Kannisto, H.H. Ingelsten, M. Skoglundh, Top. Catal. 52 (2009) 1817–1820.