Embed Size (px)
Citation preview
AN EMPIRICAL STUDY OF THE DETERMINANTS OF FINANCIALPERFORMANCE IN REAL ESTATE DEVELOPMENT BY GOVERNMENT ENTERPRISES: A CASE STUDY OF NATIONAL HOUSING CORPORA TION
MKU$if\ft*/!' n l
libNH ipm■ ' . u l
&ETE
Moturi Patrick Riang ’a
A management Research Project in partial Fulfillment o f the Requirements for the Degree o f Masters in Business Administration at the University o f Nairobi
NOVEMBER 2011

DECLARATION
This Management project is my original work and has not been presented for an award of any degree in any other University.
Moturi Patrick Riang’a.
D 61/70344/2009
Signed............ .......................................................................... Date. J ^ . 1'
This Management project has been submitted with my approval as a University Supervisor.
Signed.. .......................................................................... ........Date.. .U .T!L* ?.y. < ]Mr. N g 'ang’a J.M.
Lecturer Department o f Finance and Accounting School o f Business,
University o f Nairobi
A CKNO WLEDGEMENTSThe views expressed in this research paper are those o f the researcher as a result of the findings o f the study and not those of the management o f NHC. The variables used were extracted from the policies and financial statements that were able to be accessed for analysis by the researcher w ho made a number of assumptions that may not be necessarily be the same if the management of NHC were to evaluate the ROI of the Organization. However, I would like to thank My Supervisor Mr. James Ng’ang’a, and brother Nyabayo who encouraged me throughout my study particularly at the time when circumstances and events appeared unbearable and challenging. My sincere thanks also go to the NHC management for allowing me to use the Organization to conduct my study which has been a success.
ii

DEDICATION
To my family especially my wife MaryAnn, daughters Ravine and Nelly who were supportive and understanding during my entire study in particular when 1 had to go home late as result of trying to put together my study materials. May the Almighty God bless them abundantly.
111
ABSTRACTThe study has tried to explain the determinants of financial performance o f NHC based on several factors which were firm and government based. The data used was derived from the projects undertaken for a period of six financial years. This covered from the 1SI July, 2006 to 30th June, 2011 from different counties in the republic of Kenya. By the means o f correlation and regression analysis, the researcher concluded that there were limited determinants o f financial performance in real estate development, although the study further established that the main determinant o f financial performance is disposable income of the target market. Interestingly the study further found out that the choice of a location o f a project had a negative correlation on the returns derived which therefore implied that location o f project does not directly influence the financial performance.
In addition the study found out that the size of the houses differed from one class of target market to another which effectively affected the financial performance of the organization. The researcher therefore concluded that management has a managerial role to evaluate critically the demographic composition of the target market before choice of a project is determined. The other important costs inherent in house development such as the finishes, amenities and infrastructure also played a major role to tapping a particular class o f market demand. Further ROI and Entropy analysis however failed to provide a clear relationship of financial performance between return on investment on entropy. The research interestingly found no major influence o f the cost of leverage on financial performance of NHC mainly because the case of study is a state corporation which is subsidized by the government in its cost of investment of social projects through allocation of land and other infrastructural logistics.
IV
TABLE OF CONTENTS
DECLARATION.......................................................................................................................... iACKNOWLEDGEMENTS........................................................................................................ iiLIST OF TABLES.....................................................................................................................viiLIST OF FIGURES................................................................................................................. viiiLIST OF FIGURES................................................................................................................. viiiABBREVIATIONS.................................................................................................................... ixCHAPTER ONE...........................................................................................................................11.0 INTRODUCTION................................................................................................................. 11.1 Background to the study........................................................................................................11.2 Statement of the Problem...................................................................................................... 71.3 Objective of the Study.......................................................................................................... 81.4 Importance of the study........................................................................................................ 9CHAPTER TW O....................................................................................................................... 112.0 LITERATURE REVIEW...................................................................................................112.1 Introduction.......................................................................................................................... 112.2 Financial performance in real estate................................................................................. 112.2.1 Risks associated with real estate.................................................................................... 132.3 Property prices in a low inflationary environment and easy accessibility o f credit... 142.4 Comparative Sales method.................................................................................................162.5 Risk Management in corporate Enterprises......................................................................172.5.1 The effects of Subprime mortgage crisis in the Financial System............................. 212.6 The Model............................................................................................................................ 22
v

2.7 Summary of the literature review ...................................................................................23CHAPTER THREE...................................................................................................................253.0 RESEARCH METHODOLOGY...................................................................................... 253.1 Introduction.......................................................................................................................... 253.2 Research design................................................................................................................... 253.3 Population............................................................................................................................ 263.4 Sample and sampling techniques...................................................................................... 263.5 Data Collection....................................................................................................................263.6 Data Analysis.......................................................................................................................27CHAPTER FOUR...................................................................................................................... 304.0 DATA ANALYSIS, RESULTS AND DISCUSSIONS.................................................304.1 Introduction........................................................................................................................... 304.2 Data analysis........................................................................................................................304.2.1 Descriptive statistics and bivariate relationships..........................................................314.2.2 Effects of market density and concentration on financialPerformance....................344.3 Results and Discussions......................................................................................................365.1 Summary of the findings.................................................................................................... 395.2 Conclusions and recommendations...................................................................................405.3 The limitations to the study................................................................................................415.4 Recommendation for further study...................................................................................41APPENDIX I ................................................................................................................................ IAPPENDIX II..............................................................................................................................II
vi

LIST OF TABLESTable 1: Return on Investment on projects based on the location o f the project..............32Table 2: Desripttive Statistics Table of the main variables................................................ 34Table 3: Average Returns on Investment based on Government regulation and control,
Disposable Income and Cost of leverage............................................................... 36Table 4: Correlation o f Continuous variables with Return on Investment........................37
vii

LIST OF FIGURESFigure: 1 Distribution o f Return on Investment 2006-2011 based on location................ 33Figure 2: Return on Investment Vs Entropy..........................................................................34
VIU
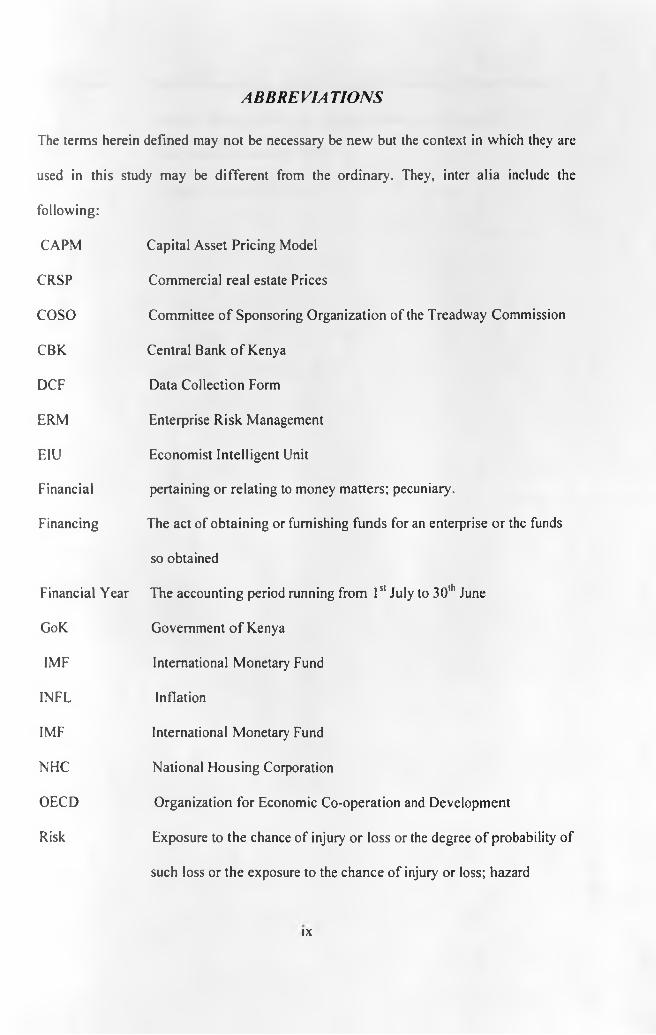
ABBREVIATIONSThe terms herein defined may not be necessary be new but the context in which they are used in this study may be different from the ordinary. They, inter alia include thefollowing:CAPM Capital Asset Pricing ModelCRSP Commercial real estate PricesCOSO Committee o f Sponsoring Organization of the Treadway CommissionCBK Central Bank o f KenyaDCF Data Collection FormERM Enterprise Risk ManagementEIU Economist Intelligent UnitFinancial pertaining or relating to money matters; pecuniary.Financing The act of obtaining or furnishing funds for an enterprise or the funds
so obtainedFinancial Year The accounting period running from Is' July to 30th JuneGoK Government o f KenyaIMF International Monetary Fund
INFL InflationIMF International Monetary FundNHC National Housing CorporationOECD Organization for Economic Co-operation and DevelopmentRisk Exposure to the chance of injury or loss or the degree of probability of
such loss or the exposure to the chance of injury or loss; hazard
IX

Real Estate
REITSIV
Property, especially on land or property consisting of land, building mineral rights, and the like (distinct from personal property)Real Estate Investment Trusts Special Investment Vehicle
x

CHAPTER ONE
1.0 INTRODUCTIONProperty in Kenya is highly regulated by public policy (Syagga, 1999) however investment in real estate sector is not well regulated and monitored as is the case in the financial sector (Njiru, 2008). Corporate managers therefore to be able to manage the financial risks associated with real estate properties well, then they need a framework to identify the sources of the financial risks in a similar way to that developed for strategic businesses (Simmons, 1999). This paper will provide a coherent way o f identifying, grouping and managing the determinants of financial performance in real estate development that are associated with financial risks by taking each one in turn and finally evaluate their relationship in corporate real estate financial performance by government enterprises.
1.1 Background to the studyThe body of empirical research on the determinants o f financial performance is large and (Capon et al, 1990) provided a meta-analysis on 320 studies which were published between 1921 and 1987. However this suffered the limitation of data being US based, applied on manufacturing industries and small firms were left out (Kotha and Nair, 1995 and Birley & Westhead, 1990). Roquebert et al, (1996) presented a concise lively data between the school o f industrial organization and the school of strategic management whether it is industry structure or firm competencies and behaviour which determine success. Measuring financial performance is not an easy task, especially in the case of small business as assets tend to be of little importance and difficult to measure in real
estate industry. Moreover accounting data carry accounting noise (Pelepu, 1985) and are unreliable to certain extent.
Mehra, (1996) distinguishes three dimensions of financial performance: profitability, productivity and the ability to raise long term resources. Productivity is calculated as net profit divided by number o f projects undertaken because the projects started and completed is the main source of leverage lend to the public. Porter, (1980) distinguishes five forces influencing competition at the industry level: competition among existing firms, threats of new entrants, bargaining power o f both supplier and clients and substitute products. Financial performance is measured by various determinants which includes both internal and external that in most cases out of control by the organization and therefore managers of corporations need to draw financial framework on the good management of such eventualities.
Risk management is not for corporations or public organizations, but for any activity whether short or long term. The benefits and opportunities should be viewed not just in the context of the activity but in relation to the many and varied stakeholders who can be affected. Risk can be defined as the combination of the probability of an event and its consequences (ISO/IEC Guide 73). Enterprise risk management is a structured, consistent and continues process across the whole organization for identifying, assessing, deciding on responses to and reporting on opportunities and threats that affect the achievement of its objectives. COSO, (2004) defines Enterprise risk as a process, effected by an entity’s governing body, management and other personnel, applied in strategy setting and across
2

the organization, designed to identify potential events that may affect the entity, and manage risk to be within its risk appetite, to provide reasonable assurance regarding the achievement of the organization’s objectives.
The sources of strategic risks are often articulated in the strategic management literature in general terms such as technological and production risk, financial risk, product and market diversification risk, managerial ability and competence, environmental risk and competitive risk (Thompson, 2001). In addition Simons, (1999) categorizes strategic risks that impacts on organizations into three as, operations risk, asset impairment risk and competitive risk. These factors in one way or another has a negative impact on the financial performance in the organizations and further affects the determinants of the financial performance in real estate development.
Financial risks immensely affect enterprises on the performance and managers should know that they have awesome power, and they control it (Robbins, 1986).Managers when developing and implementing strategies are exposed to various risks and as a result they require tools to determine if and when these risks will become acceptable in the organizational performance when they marshal their resources. Simons, (1999) defines strategic risks as an unexpected event or set of conditions that significantly reduces the ability o f managers to implement their intended business strategy. According to Webster college dictionary risk is exposure to the chance o f injury or loss, the degree of probability of loss or the amount the insurance company may lose.
3
The financial risk. Property market risk and business risk are the main risks yet few Government enterprises can predict their on-going workplace costs with any degree of certainty which therefore exposes them to the financial risks (Hellwig, 2008). The Financial risks are both direct and indirect which potentially affect both the short run cash flow events and have long-run impact on total enterprise value. In this element of risk the focus relates to the impact of real estate on both the income statement and the balance sheet. Management o f financial risk in this context therefore will be evaluated three fold as; first in evaluating the management’s strategies in identifying, measuring and mitigation of financial risks, secondly the overall impact of financial risks in the organizations value and finally the influence of financial risks in pricing of real estate properties.
The history of real estate finance provides ample material to illustrate the risks associated with maturity mismatch in real estate finance (Hellwig, 2008).In many countries, real estate finance was provided through the fixed rate mortgages, for instance before the 1980’s these mortgages were provided by savings and loans institutions that were themselves financed by short term deposits at regulated rates of interest o f three to five percent. However, in the late seventies and early eighties, when nominal rates of interest were high, these institutions found that their depositors were leaving them for money market funds that were offering interest rates above ten percent (IMF, 2007). This inconsistence of customer royalty lead to organizations’ low productivity thus returns.
4

Corporate Real Estate managers have long understood the concept of risk and much of their work is driven by transactions and projects related to new or changing workplace requirements. They have developed tools to ensure that these projects come in on time and within budget in an attempt to manage both the financial and operational risk at the single asset level. The 1990’s was a period that raised the awareness of occupiers of the strategic risks which corporate real estate could expose the enterprises to. During the growth phase the ability to locate and fit out new facilities was paramount to the success o f the business strategy and organizations that could keep pace with the growth in demand had a competitive advantage over their rivals (Virginia and Louargand, 2002).
The major challenges in the mortgage industry ranges from elusive borrowers, cash strapped house buyers and employees who can not keep up with change. After the 80’s and the introduction o f liberalization in Kenya in the 90’s , other several factors has had a direct impact on the housing market by first, freeing o f interest rates which has seen house prices skyrocket and with them monthly mortgage repayments are drastically affected. Secondly the economy has started declining and with it the per capita income making house buying more o f a luxury than a necessity. A recent review of risk management practices in 14 large global corporations revealed that by the end of the 1990’s, the range of risks that companies felt they needed to manage had vastly expanded and was continuing to grow in number (Hunt, 2001).
Chan et al, (1990) analyzed earlier research on real estate returns by (Brueggeman, Chen and Thibodeau, 1984) and Ibbotson and Siegel, (1984) which concluded that real estate
5
both earned substantial risk-adjusted excess returns and served as a good hedge against inflation. Unfortunately, he argued that these studies employed return data based on market appraisals, rather than actual transaction prices which are now considered as being smoothed therefore understating the volatility o f real estate returns and overstating the risk -adjusted returns (Firstenberg, Ross and zisler, 1988 and Gelter, 1989).Unlike in the banking industry where giant regulations like BASEL II have been developed which out rightly require formal risk management systems for financial institutions, only small numbers o f public listed Corporate in Kenya are embedding ERM in their organizations in its daily business operations.
There are widespread concerns over e-commerce, which has become accepted and embedded in society with startling speed, the Economist intelligence Unit (EIU) survey “Enterprise Risk Management, implementing new solutions” highlighted many companies perceived a rise in the number and severity of the risks they face, some industries confront unfamiliar risks stemming from deregulation, others worry about increasing dependence on business -to-business information systems and just -in-time supply/inventory systems.
The uniqueness of land and landed properties in land poses a problem, thus a risk to the participants in the market. The inherent characteristics of real estate while offering an entrepreneur numerous opportunities to operate extraordinary profits made in real estate are far reaching and is a risky venture (Charles and Nearchs, 1997). Proper analysis of the industry and further development of a strategy leads to increased returns relative to the
6
risks. The immobility o f land presents a problem in that once an investor purchases a product in a prime area, but years later due to environmental degradation the investor perception changes causing a slump in the value of the investment and resultant returns.
1.2 Statement o f the ProblemThe property market in Kenya is greatly affected by public policy in many ways especially in terms o f administration, taxation, credit control, land use controls and provision o f new buildings (Syagga, 1999). Certain types of levies have a direct impact on the operation of the property and include development charges, taxes on capital gain and stamp duty. The influences o f some of the taxes are to influence the market rather than to secure revenue. In addition rates levied by Local authorities on the site value of the property and stamp duty charged at 4% of purchase price are some of the examples of extraneous levies. Karanja, (2002) identified the greatest challenges on the real estate as rising levels of inflation, interest rates and reduced disposable income.
A survey done by CBK in 2007 established that 19 percent of Kenyans have the ability to borrow through the formal financial services while 73 percent are excluded. Further the Fifth Session paper of 2010 approximates that about 60-70 percent of urban dwellers in Kenya cities live in slums which confirms the inability of the majority from borrowing to finance in real estate. A more recent baseline study done by Central bank of Kenya in 2011 on the primary mortgage market estimated the average mortgage at USD 60,000 at a rate o f 16% for a period of fifteen years. In an attempt to address the challenges of housing sector, the Government o f Kenya through the budget speech for the financial year 2011/2012, the Hon. Deputy Prime Minister and Minister for Finance proposed the
7
introduction of REIT as a special investment vehicle (SIV) to address the challenges in this sector.
NHC being the main government implementing agency in national housing policies and the vision 2030 housing objectives, it is expected therefore to play a major role in the establishment of this SIV. The main questions that management of NHC need to address in order to curb these challenges then lies on considering questions that are relevant in identifying the determinants of financial performance in real estate development. These questions therefore are centered on first, how does location, disposable income, cost of leverage, entropy and government regulations and controls affect their organization’s financial performance. Secondly, how will the determinants identified managed in order for the organization to maximize on its financial performance? Thirdly, how will the management apply its resources in a liberalized economy at low cost to achieve the mandate o f government to house its citizens in a cost effective manner while its financial performance is not compromised or at break even? Finally, how can corporate real estate managers establish the major determinants of financial performance in real estate development and further appraise these determinants within a portfolio context in order to decide which factors are critical in mitigating or minimizing loss on ROl of their organizations.
\
1.3 Objective o f the StudyThe objective of this study is to establish the determinants of financial performance inreal estate development.
8
1.4 Importance o f the studyIt is imperative to note that real estate prices are not readily available in the NSE since there are no listed companies in the market that trade in real estate nor registered rating agency that provide data for the public, this therefore has left the market to operate on speculative prices. Despite this shortcoming other markets in the developed stock exchange has real estate prices available. For instance Slacalek, (2006) used a sample of OECD countries and gave mean ratios of housing wealth to income of 4.89 and net Financial wealth to income of 2.68.Quingly and Shiller, (2005) came up with mean ratios o f 3.01 and 3.84 in the United States and concluded that this finding in the United States were as a result of the stock market boom since the early eighties.
This study will be of importance to various groups in society as enumerated herein especially Kenya where there is no asymmetrical information in the real estate sector.
(i) The students of Research: The study will stimulate students o f research to expand their knowledge base in the area of determinants of Financial performance in real estate development. This will also be a basis on which further research will be conducted in Kenya given that this is an area with asymmetrical information.
(ii) Enterprise managers, board of directors and business community: This study is intended to help enterprises know the most significant Financial performance risks facing organization, and know how organization will manage a crisis in order to formulate a clear risk policy. Further actors in
9

business will be aware of financial risks which fall into their area ofresponsibilities, the possible impacts these may have on the value of the organization and other areas of operation.
(iii) The Government and other regulating Agencies: In order to ensure orderly and efficient management o f real estate in Kenya there is need to establish an authority to regulate and manage the sector. This study is therefore aimed at bringing to light the challenges that the sector faces particularly on identification and management of the determinants of financial performance .Finally the study will help governments to structure their organizations in a manner that will enable them properly regulate and manage all forms of factors that determine financial performance in order to maximize their ROI from the emerging financial risks .
10

CHAPTER TWO
2.0 LITERA TORE REVIEW
2.1 IntroductionThis Chapter will give an analytical summary of various studies done on the research topic in view of the intended study at NHC. The researcher will therefore, review available literatures on real estate pricing, its financing risks, the effects on the determinants of real estate development and the management’s financial risk management techniques that are being employed in the organization in maximizing its ROl. The review will be done from a general perspective particularly from books, journals, conference papers, magazines, Masterial papers and appropriate internet sites owing to limited time on the study in a view of gaining deeper understanding of the topic and research questions.
2.2 Financial performance in real estateReal estate market has little product differentiation however, in a regime of no fixed prices there is price competition, which implies that client bargaining power is relevant. Cyert et al, (1993) note that in a market without product and price competition, products and services are commodities and firms compete through quality of service, reliability of deliverance and reputation. Hall, (1993) measures the impact of such intangibilities, and the rate at which they can be sustained and concluded that know how and reputation are key factors.
11

Market concentration in real estate industry, expertise on local markerts and access to local networks are key tenets and Risseeuw,(1993), Lukkes and Van Rooden,( 1986( and Palm, (1976) reports that half o f real estate firms compete locally and therefore competition intensity can only be derived from local markets. The number o f firms in a market is a measure for the size o f the market and large markets provides opportunities for the creation of niches thus higher profits. Birley and Westhead, (1990) found an evidence o f negative relationship between the number of direct competitors and individual firm’s performance in real estate development.
Specialization is an indication o f a niche market but if a combination of various products enhances operations, in other words if there are economies of scope, a high rate of specialization does not pay. A switch of profile implies switching costs, and sunk costs for the old profile. Hunnan and Freeman, (1977) showed that a certain amount of inertia is an asset in terms of reliability and accountability and therefore concluded that prudent firms should not change their market profile too often.
The great contribution o f real estate industry to GPD, many governments keep the growth rate of investment in real estate in some degree, and then speed up the economy development. Since real estate industry is capital intensive, which characters with big investment, long period and high risk the rate of return is not necessarily high. The corporate finance literature has generally found the following financial variables to significantly influence corporate leverage: Firm size, as proxied by the log o f total sales.
12

Under the pecking order model and the Trade-off theory greater size may lead to inclusion in large cap indices (Thornton, 2006).
2.2.1 Risks associated with real estateThe adverse economic consequence of a firm’s exposure is risk and managers in business are duty bound to estimate the likely risks in their operations. The rate of interest charged on loans by government entities are regulated by the act of parliament as one-half per centum (Housing Act, 1972). Such regulations therefore deny government institutions creativity in the industry thus limited cash flows. According to real estate theories, investment is referred as money utilized for buying property for the purpose o f ownership or leasing and sometimes it involves capital risk (Mutava, 2011).
The Kenyan housing sector is characterized by inadequate housing, extensive and inappropriate dwelling units including slums (GoK, 2007). The sectors also shows an under investment in low and middle income housing by public and private sector (Mwaura, 2009). This preposition in the sector therefore calls for a stable financial stability analysis to cover all of the sources of risks and vulnerabilities since this requires systematic monitoring o f individual parts of the financial systems and the real economy. Real estate management in Kenya is not well coordinated and very little is published regarding the indexing (Njiru, 2003). The information available on the sector is firm based and the bases of their computations on such indices are not available therefore casting doubt on their credibility. Research on real estate still lags far behind other financial sector (Njiru, 2003) which then implies that despite the failure of the
13

government in setting up a credible institution to regulate this sector information is not freely available in the market to the public.
The housing Act, (1972) Chapter 117 of the laws of Kenya mandates the Corporation to make loans to any company, society or individual person for the purpose of enabling such company, society or individual person to acquire land and construct thereon approved dwellings or to carry out approved schemes. In an effort to satisfy the governments mandate o f decent housing of its citizens NHC therefore is the sole government entity that the government implements its policies and therefore need to determine the prudent financial performance.
2.3 Property prices in a low inflationary environment and easy accessibility o f creditFranklin, (2005) researched on real estate companies in the UK and concluded that there was a large increase in property prices while at the same time consumer price inflation were moderate. The major question then to be answered is what are the causes of the increase in property prices in an environment of low inflation? Is the rise in property prices due to the availability of ease credit or a change in fundamental? If the increase is due to easy credit rather than an improvement in the underlying fundamentals, does this mean that property prices will crash at some point and lead to financial instability? Borio, (2005) gave a number of examples of monetary expansion and lending booms and apparent bubbles in real estate and stocks, which are triggered by lending booms and financial deregulation. Further Borio, (2005) concluded that the subsequent bursting of these bubbles will lead to a financial crisis.
14

Martha and Nalin, (1999) assessed Pindyck, 1993b and 1994 work on Price fluctuations in commodity markets and concluded that Price fluctuations can be episodic in the market and cleaning such prices that generally fluctuates about one stable level, with an occasional price shock that sends it soaring is not an easy task. The Exchange rate constant changes or fluctuations in a restively short space of time are not uncommon and this could effectively increase the price of property. Uncertainty is the randomness of the external environment and managers cannot change its level, thus a firm’s exposure to uncertainty. The sensitivity of the firm's cash flows and value to a source o f uncertainty is determined by a number of factors, including the line o f business, the cost structure and the nature o f contracts to obtain inputs and sell outputs. Managers change asset exposure through investments, after they analyze the external uncertainty (Firstenberg et al, 1988).
The idea that the amount of money and credit available is an important factor in the determination of asset prices is not new and Kindlerberger, (1978) emphasized this fact in the research he conducted on the speculative manias through expansion o f money and credit. The best known example o f this type o f phenomenon is the dramatic rise in real estate and stock prices in Japan in the late 1980’s and the subsequent collapse of 1990. Further recently in 2008 the US real estate collapse greatly affected the world financial sectors significantly which as a result spread to the banking and stock market. Financial liberalization throughout the 1980’s and the desire to support the United States dollar in the latter part of the decade led to an expansion in credit which lead to bubbles in asset prices in three typical distinct phases. The first phase started with financial liberalization
15

or a conscious decision by the central bank to increase lending or some other similar event, second was in the stock market and finally in the real estate(Alfaro et al, 2009).
The Kenyan collateral process is broken; it fails to protect lenders, conveys little benefits to borrowers and imposes substantial economic costs on enterprises Kenya Bankers association, (2009). The rules and requirements o f the registries present further complications on the collateral process, as each registry has different registration and priority rules. For example, the Companies Registry requires a security instrument to be registered within 42 days of its creation, the land registry requires an instrument to be registered within 30 days of its creation and the Chattels registry requires registration of a Chattel’s instrument within 21 days of execution (Kenya Bankers association, 2009). Real estate lending institutions keep higher ratios of fixed rate loans to total assets and therefore face higher probabilities of insolvency. The increasing proportion of banks specializing in real estate financing stipulates the incentives of regulatory discipline, and the weaknesses o f risk-management strategies could stress the condition o f the banking system during periods o f large unexpected increases in interest rate.
2.4 Comparative Sales methodSyagga, (1985) concluded that the Comparative sales method is the most realistic of all valuation methods as it is based on the comparison o f the property to be valued with similar properties and the prices achieved for them, taking account of the differences between them. Syagga, (1985) further reduced the comparability factors to a mathematical regression function as:Y=f(X|, X2..........................Xn) specifically further stated as;
16

Y=a+b,XI+b2X2+............ b„Xn.Where Y= average price for all properties for which prices are available.
a = constant representing intercept obtained after analyzing several properties, b 1- bn = partial regression co-efficient, being proportional contributions of each of the independent Variables andX r Xn = Independent variables assumed to affect property price.
K.abisa,( 1991) critiqued Syagga’s 1985 model of comparative sales method and observed that since most real estate transactions are fairly secretive due to the controlled nature of the property market and restrictive legislation, the sales data often become historic due to effects of hyper-inflation prevailing in the country, making comparable sales analysis difficult. He therefore concluded that the sales comparison data is inadequate to reflect an acceptable consensus of buyers and sellers who have recently made transactions in the market.
2.5 Risk Management in corporate EnterprisesFinancial risk leads to economic crisis consequently there is need for regulators and financial lending institutions in the real estate sector to be prudent in their financial management. Stulz, (2008) argued that there are five ways in which financial risk management can break down, first failure to use an appropriate risk metrics and mismanagement of known risk, secondly failure to take known risks into account and failure to communicate risks to top management and finally failure in monitoring and managing risks. A survey carried out by KPMG, (2009) also summarized the weaknesses in risk management as weaknesses in risk culture and governance, lack of risk experience
17

and skill amongst senior executive and none executive managers, lack of influence of the risk function and business models that were overly reliant on ample liquidity, ignoring the liquidity risk.
The recent financial crisis has clearly raised issues with current applications of tests Alfaro et al, (2009) discusses the US supervisory Capital assessment Program on the stress tests applied to largest US bank holding companies from February to May 2009 in which they concluded that there is need for Governments to institutionalize or intervene in the control of the real estate sector. The Kenyan government is not exempted from this investment and there is an effort through NHC to address the housing shortages.
Risk management to be well managed in the real estate sector, there is need for prudent financial stability to cover all sources of risk and vulnerabilities. This will thus lead to a systematic monitoring o f individual parts of the financial system and the real estate economy which includes households, firms and the public sector. For example if inflation (INFL) is a strong or instable inflation rate then this may reflect a mismanagement of the country’s monetary policy which is likely to spread to the real estate sector. As high inflation rates tend to generate uncertainty, we expect a positive relationship between the inflation rates and the real estate which mean therefore that managers in the sector needs to continuously monitor the consumer prices which are largely used as a measure of inflation.
18

In order to demonstrate how the risks might be assessed across the three dimensions outlined as Asset types, use and Environmental Risks setting Virginia and Louargand, (2002) developed a Corporate Real estate Risk Matrix, a tool for organizing and prioritizing the analytical and decision - making process associated with accommodation decisions. Using standard linear (OLS) regression techniques specifications the following two general models were tested: Risk (i) = f (risk factors, portfolio characteristics, demographic trends) and Sharpe’s Index (i) = f (risk factors, portfolio characteristics, demographic trends). The dependent variables were specified as one of several alternative markets -driven risk and performance measures. Levi, (1996) used the REIT’s returnlvolatility measured as the variance or the standard deviation o f the CRSP daily or monthly returns in the specification of risk. He later in his studies used REIT’s beta, with the value - weighted CRSP index as the market proxy to perform another specification for risk.
Thomas and Cheng, (2006) assessed how real estate property risk is priced in the public real estate investment market. The result revealed the degree to which real property portfolio risk factors, such as the degree of diversification and portfolio obsolescence, affect various measures o f financial risk and risk adjusted performance, namely return volatility, beta and Sharpe's index. Intuitively, the results also showed how investors in aggregate perceived the various factors. In turn, the results can be used to implement financial decisions such as pricing and portfolio rebalancing. The relationship between systematic risk and the market enables market players to price securities which is no exemption to the real estate properties. However, though systematic risk and the market
19

risk are out o f the control of the management and even as a major determinant in asset pricing it is a major deterrent to management’s decision in real estate pricing (Ndegwa,2001).
The fundamental fact to keep in mind about residential housing and real estate is that they form part o f the economy’s aggregate wealth, in many countries more important than net financial assets (Slacalek, 2006). Secondly, houses and real estate are very long lived assets and the economic lifetime of these assets are on the order of several decades, much longer than the time spans for which most people plan their savings and investments. A term account may have a maturity of a few years, but this is still far short o f the forty or more years o f economic life of a house. Hardly is anybody willing to tie his funds up for such a long time span and even people who plan so far a head want to give themselves the option to change their investments at some intervening time. If housing finance is obtained from investors with shorter horizons, someone must bear the risk that is inherent in the fact that, when the initial contract is signed, it is not clear what will happen when the financier wants to liquidate his position (Hellwig, 2008).
Martin Hellwig further ponders o f what will happen if the maturity of mismatch in real estate investment is a source of risk at all and why can’t we just say that in a well functioning system of financial markets, finance is always forthcoming at the going price? There are two complications, first Financial markets are not always well functioning, and the going price may be unaffordable. Hellwig, (1994 a) gives a systematic account of the different risks associated with changes in market rates which
20

precisely gives a symmetric consideration that investors holding short term assets may find that, if they want to invest their funds after all, the rate of interest at which they can do so is rather too low and long term assets are expensive to buy.
2.5.1 The effects o f Subprime mortgage crisis in the Financial SystemReal estate is capital intensive and this lead to the flaws in the system o f sub prime mortgage finance and securitization will result to the collapse o f the system. Indeed, long before the outbreak of the crisis, quite a few observers had warned that residential real estate markets were experiencing a bubble and the only question was when the bubble would break (Shiller, 2005). However, the flaws in sub prime mortgage finance and securitization and the collapse of this system provide only one part of the explanation for the current financial crisis. The IMF Global Financial Stability Report o f April, 2007 gave a fairly detailed account of problems with sub prime mortgage and mortgage-backed securities in the United States, but concluded that the problem would not affect the rest of the financial system.
Trade analysis o f real estate industry done in China during 1998-2007 indicated that the average annual GDP, the total investment in fixed assets and the real estate development were 8.9% ,18.9% and 23% , respectively (Han,2007). Further, the great increasing investment in the real estate brought the fast growth o f investment in fixed assets, which drove further growth o f GDP, enlarged investment multiplier effect, and then improved the contribution of the real estate industry to GDP from 6.3% to 10.7%, averaged 9.28%.
21

The economy consist of two types of economic agents(project sponsors and creditors), two points in time and a single commodity ( Shah and Anjan, 1987) which implies therefore that in real estate development critical among the financiers are the creditors and sponsors. Real estate development critically relies on the sponsors capital structure therefore the seminal Modigliani and Miller theorem’s capital structure appears to be key financial decision.
2.6 The M odel
John and Frederic, (2007) analyzed Jude and Winicher, (1995) Sivitanidou and Sivitanides, (1999) Hendershott and MacGregor, (2005) and Yiu and Hui, (2006) research papers and regarded the Capitalization rate as the growth -adjusted required nominal return on property. The capitalization rate o f a given real estate investment is typically defined as the ratio of net operating income (NOIt) on the value o f property (Vt) at time t. Ct=NOIt /Vt
z
Pt = 1 CFj
z
+ z CFjt= 1 (l+d,)t t = z + 1 (1 + d,), J
The property value can be based on the market sales prices of the property at time t. If investors are rational, this price should exactly reflect the sum of present cash flows they expect to receive in the present and future.
z
P t = I
22

t=l (l+d,)«Where T is the property’s life expectancy, dt is the discount rate and the second expression is a bracket represents the resale value of the property at time z+1 and Y is an approximation parameter. The equation is simplified as;
Source: E C O R E Discussion paper 2008/8
John and Fredric further used the Capitalization rate and CAPM Model and restated the model which will relate the Capitalization rate to a nominal risk -free rate, the spread in the return on an alternative investment, a specific real estate risk component and some variables approximating the expected growth in cash flows. A firm’s decisions are the outcome o f an internal negotiation process among external shareholders, working owners and employees. The theory of bounded rationality (Simon, 1982) teaches that even if clear goals exist, there is not necessarily a direct relation between stated goals and applied strategies.
2.7 Summary o f the literature reviewFrom the research done this study will envisage to find out the determinants of financial performance in real estate developments and how they influence the choice of location for development of such properties. The study will also evaluate the effects of market density and concentration on pricing of such properties are determined given Kabisa,
Pt = Y Rentit= I (1 + dt)‘
23
(1991) findings and conclusion that sales comparative method is difficult to ascertain. A financial access landscape survey done by CBK in 2007 established that 19 percent of Kenyans have access to formal financial services through regulated institutions while close to three quarters (73%) of all adult Kenyans are excluded from formal financial services. Further the report indicated that 38% of Kenyans are classified as financially excluded from usage of either formal or informal products.
Stulz, (2008) argued that financial risk management can break down due to failure to use of an appropriate risk matrix and KPMG, (2009) concluded that weaknesses in risk management is caused by lack of fundamental factors amongst the senior executive such as lack of risk management skills. From the foregoing therefore there is indications that there is a gap in financial risk management by majority in property financing in Kenya either corporate or individually which as a result forms the basis of this study.
Further research indicates that disposable incomes, population and business confidence are major determinants that cause residential property market. The relatively small coefficients o f real interest rates and planning regulations suggest that they have significant but modest impacts on residential investment.
24
CHAPTER THREE
3.0 RESEARCH METHODOLOGY
3.1 IntroductionThis chapter outlines how the research was conducted particularly on research design, size of the population, sampling technique, data collection method and further explains how this data was analyzed by the researcher to arrive the conclusions and recommendations made.
3.2 Research designNjiru.(2003) researched in real estate management in Kenya Nairobi district which was established that very little is indexed in the sector and further noted that research in real estate still lags behind the financial sector. A case analysis of NHC is preferred in this study as it is the only Government owned Enterprise that is involved directly in real estate while the Ministry of Housing is tasked with the responsibilities of Policy formulation and Implementation in the Housing Sector. The case study is ideal because it gives the researcher an in-depth understanding of the behavioral pattern o f the industry given that the Kenyan economy is liberalized with no institution that readily provides information on real estate. Martin, (2008) when researching on residential real estate established prior researches had been conducted in the USA but little had been done in the developing countries. Martin, (2008) further noted that failure of top managers to recognize financial risks in real estate and small business lending lead to the financial crisis in the nineties.
25

For purposes o f this research an event study is being used where both primary and secondary data will be used in the study to collect data. In the primary, data was collected through designed data collection form which was completed by the Chief Architect was in most cases is the project Manager in the Organization while in the secondary, data was analyzed from policies and financial statements which was collected from previous financial reporting on which dividends and taxes were paid.
3.3 PopulationThe target population o f the study was based on fifty projects of different categories undertaken in different counties across the county. This is because the project location, type and size of the leverage, disposable income of the market and finally the market density and concentration were the major variables used by the researcher to determine the expected returns from the projects which were undertaken.
3.4 Sample and sampling techniquesStratified random sampling technique was used to obtain a sample from the population that was being viewed as representative from the projects undertaken over the study period. The strata were based on a proportion of 0.3 o f the population across the entire country which was therefore determined to be about fifteen projects.
3.5 Data CollectionBoth Primary and secondary methods were used to collect data for this study for a period
of the last six financial years from 2006-2011. The study considered on how the location
26
of the project was arrived at, nature and costs of leverage to finance the projects, what effects market density and concentration has on the projects and finally the other micro economic variables such as financial risks and disposable income o f target market affect the expected returns of the projects undertaken. Data collection was done through interviewing o f the Chief Architect with the aid of the data collection form (DCF) which was completed during the interview. Further Financial Statements and other relevant Policies on property development and pricing were reviewed for a period o f the past six financial years which were of much help to the researcher to evaluate the data collected through the interview.
The nature o f data that was collected included be the type and cost of leverage, location of the project and the disposable income of the expected target market in the area that the projects were undertaken further market density and concentration of the market on the location o f the projects undertaken was considered in the study. These variables were used to determine the expected returns and consequently evaluated the cost effectiveness of projects undertaken by the corporation.
3.6 Data AnalysisIn assessing the determinants o f financial performance of real estate development, descriptive statistics and multiple regression analysis were used since this model was covered the effects of various Macroeconomic factors. Further combined influences of all variables by means of regression analysis, in which differences in return on sales among projects are explained by the properties of the projects and their market. NHC being a government institution was therefore established that government regulations and
27
controls affects real estate returns in order to satisfy the government goals o f housing her citizens. This study therefore evaluated and conducted the effect of government directives on NHC financial performance. Data was also grouped and coded in order o f importance in a manner that is presentable by way of graphs and tables for interpretation purposes with the help o f SPSS.
Regression analysis was of help in relating one variable to another and provided an estimating equation that was helpful in data interpretation. Odipo, (2000) when researching on the Accounting determined measures on systematic risk at NSE reviewed Lagan, (1990) and Levin, (1987) and concluded that regression and correlation analysis can be used to determine both the nature and strength of a relationship between two variables which formed the basis o f further research analysis on accounting determined measures o f systematic risk. In interpreting the regression analysis the variables b, t- statistics o f b and R2of the regression was determined and interpreted.
This study used a multiple regression analysis in the estimation method of the form: (ROI,)= / (Id&L, Md, Lc, and FR & GRC).Where ROI = Return on Investment from the projects
Id = disposable income o f the target market L = Geographical Location of the projectsMd = Market density and concentration in the area the development is undertaken
Lc = the cost of leverageFR & GRC = Financial risk and government regulation and controls.
28
The analytical Model of the study took the form o f a regression analysis in which differences in return on sales among projects are explained by the influencing project based variables as follows.ROl, = a + Pj Idij + PjL.j + Pj X,j+ p.Where X,j is the market density and concentration, financial risk, level cost of leverage and government regulation and controls and pj is the error term.
In the interpretation of the regression analysis and for purposes of this study the variables p, t-statistics and R: will be interpreted as; when the P>0, then it infered to mean that the variable had a positive influence on ROI consequently a good financial performance in real estate development project undertaken, p< 0 the independent variable had a negative impact on the ROI o f the project undertaken and therefore a low financial performance and when P=0 there is no cost benefit on the development of project choice based on the determinants of the project considered. The T-statistics was necessary for determining the confidence level in the results while R2 measured the percentage of variation in the market value explained by the determinants of the financial performance in real estate development.
29

CHAPTER FOUR
4.0 DATA ANALYSIS, RESULTS AND DISCUSSIONS
4.1 IntroductionThis chapter presents analysis and interpretation o f the data obtained from the respondents. The study sought to establish the determinants that influence the financial performance in project development by NHC. Data collected from respondents was analyzed using multiple regression analysis to establish the research findings.
4.2 Data analysisThe expected returns of all projects by NHC management is 0.13, therefore as a rule of thumb a percentage is added to cumulative costs of particular project to determine the selling price. The major components of pricing their projects identified on the projects were the Cost of construction materials, land, leverage costs, inflationary costs and a mark-up. In addition the main regulatory bodies which were identified in the industry included Municipalities, NEMA and department of Physical Planning which according to the research in one way or another affect the cost o f the projects either indirectly or directly.
The major financial risks identified in project development were contract price variation which translates to legal battles to long time period taken to complete the project development and high legal costs. Since these costs are all factor into cost o f the projects therefore these leads to low financial performance. It was established that choice of
30
Projects is highly dependent of Location and Neighborhood, disposable income of target group and the demographic population of target group. The expected return o f the project was evaluated with a probability o f 0.5 for purposes of this research and was used in computing the ROI, standard deviation of all the projects.
Below a brief statistical description o f operating profits and the explanatory variables in the analysis, as well as the way they correlate with performance is evaluated. Later in this chapter an analysis by use of a multivariate regression analysis is used to where the impact of all variables on financial performance is tackled.
4.2.1 Descriptive statistics and bivariate relationshipsProjects Operating
profit(pjt)Sales of a project
(Sit)
Return onInvestment(ROI)
Langata 1 145,236,804 736,000,000 0.1227
Pumwani II 27,900,794 176,000,000 0.0236
Mamboleo (KSM) 21,948,498 151,250,000 0.0185
Kiambu III 10,857,721 136,200.000 0.0073
Dam Infil 8,953,583 51,000,000 0.0054
Langata II 175,540,757 1,391,500,000 0.1062
Kileleshwa 132,062,763 1,190,000,000 0.1147
31

Madaraka Infil - Sec “A” 84,500,000 615,500,000 0.0947
Bububu(MSA) (13,495,320) 45,490,000 (-0.0028)
Langata III 56,155,315 491,500,000 0.0756
Kakamega 54,538,988 212,000,000 0.2849
Kisii 28,603,296 106,000,000 0.0041
Standard deviation (o) 579,720,000 457,736,000 0.0828
Table 1: R e tu rn on Investm ent on projects based on the location o f the project
Return on Investment and average relative operating profits of the projects in the sample are 28.77% with a standard deviation of 0.0828 and the median is 0.07124; only 11 projects in the sample selected had positive profits during all the six years under study while Bububu in Mombasa registered a persistent dismal loss.
From the study and figure 1 below distribution of project development based on location showed a great disparity on expected ROI. For purposes of this study major cities such as Nairobi, Mombasa and Kisumu was assumed be in a good location to provide high returns but however, the study results with exception o f Nairobi all other cities performed dismally. Further the research showed other smaller Counties like Kisii and Kakamega perfomed better than big cities like Mombasa and Kisumu which therefore confirmed to the researcher that the location did not quite influence ROI of the projects. In addition Kiambu which is in the vicinity with only 15 Kilometers from Nairobi and also assumed
32

to be in a good location had a lower RIO than the counties assumed to be located far from the main cities.
The research surprisingly does not clearly explain why location does not influence the return on investment in Kenya. This is because all projects undertaken by NHC under the period of study were within the municipalities or cities which then could not explain the variability in determining ROI.
Figure: 1 Distribution o f Return on Investm ent 2006-2011 based on location
33

4.2.2 Effects o f market density and concentration on financial Performance
Market concentration is measured by use of entropy (the Theil-coefllcient) which is calculated as E=£, X* (In 1/ Xj ) where x, is the project’s profit share in the Organization’s profits in years 2006...2011, (the x,’s add to 1). Figure 2 shows the entropy and mean performance for 12 projects. However there is no clear relationship that can be derived from this figure. Figure 3 shows the project density and ROI in various locations. Below is the descriptive statistics of the listed variables that are critical in the valuation of the model which are mainly Operating Profits, Sale o f projects and Return on investment.
Descriptive Statistics
N Range Mean Std. Deviation
Operating proflt(pit) 12 1.67E8 6.3316E7 5.79720E7
Sales of a project (Sit) 12 1.35E9 4.4187E8 4.57736E8
Return on Investment(ROI)
12 .287700 .07124167 .082815836
Valid N (listwise) 12
Table 2: Desripttive Statistics Table o f the main variables
Table 2 above shows that the projects operating profits ranges at 1.67 with a mean of 6.3316 and standard deviation of 5.79720 which in overall is a good indicator of a health financial performance of the projects undertaken by NHC during the period o f study. The ROI from the study was established at 28.77% as opposed to the organizational assumed ROI of 15% which indicated a good financial management of the organization.
34

Figure 2: R eturn on Investm ent Vs Entropy
4.2.3 Effects o f leverage costs, financial risk and government regulation and controls on financial Performance
In the analysis costs of leverage where financing of projects are contractor financed or short term borrowing are used which were all constructed in the high income areas. The government regulation and controls particularly on the directive of constructing in a low income area as a social economic project are quantified as a cost of foregone income had the same funds invested in a high income area. Disposable income in this study is was assumed to be the cumulative project costs and a percentage of a mark up used by the organization o f 15%.
35
UNIVERSITY 0? NAIROBI ’ ~WEfi K A B E T E
U B R A f t Y

Project Disposable Cost o f Leverage Cost of government Operating
Income Regulation and Control Profits
Kileleshwa 1,057,937,237.00 1,056,049,276.00 1,887,961.00 132,062,763.00
Kakamega 157,461,011.65 154,651,011.65 2,810,000.00 54,538,988.35
Mamboleo 129,301,502.00 125,732,459.00 3,569,043.00 21,948,498.00
Bububu 58,985,319.65 56,437,519.65 2,547,800.00 (13,495,319.65)
Langata III 435,344,685.25 432,836,724.25 2,507,961.00 56,155,314.75
Langata II 1,216,094,243.53 1,213,956,281.53 2,137,962.00 175,405,756.47
Dam Infill 42,046,417.05 22,167,763.05 19,878,654.00 8,953,582.95
Kiambu III 125,342,279.20 90,663,656.20 34,678,623.00 10,857,720.80
Pumwani II 148,099,206.00 124,644,839.00 23,454,367.00 27,900,794.00
Langata I 590,763,196.00 573,077,551.00 17,685,645.00 145,236,804.00
Kisii 77,396,704.00 65,053,452.00 12,343,252.00 28,603,296.00
Table 3: A verage Returns on Investm ent bused on G overnm ent regulation a n d control,
Disposable In com e and Cost o f leverage.
4.3 Results and DiscussionsThe correlation between the return on investment and the various explanatory variables is shown in Tables 1,2 and 3. In Table 1 the relationship between the financial performance and location of the project is presented while in Table 2 the correlation between the average return on investment based on government regulation and control, and cost of
36

leverage are shown. Finally the correlations between various continuous variables with returns on investment are shown in Table 3.
Correlations
DisposableIncome
Government regulation and control
Cost of leverage
Return on Investment
Disposable Income PearsonCorrelation
1 -.394 1.000” .357
Sig. (2-tailed) .230 .000 .282N 11 11 11 11
Government regulation Pearson and control Correlation
-.394 1 -.417 -.401
Sig. (2-tailed) .230 .202 .221N 11 11 11 11
Cost of leverage PearsonCorrelation
1.000" -.417 1 .363
Sig. (2-tailed) .000 .202 .272N 11 11 11 11
Return on Investment PearsonCorrelation
.357 -.401 .363 1
Sig. (2-tailed) .282 .221 .272N 11 11 11 11
**. Correlation is significant at the 0.01 level (2-tailed).
Table 4: Correlation o f C ontinuous variables with R eturn on Investm ent
An analysis o f the combined influencing variables by regressing return on sales among different projects is explained by the properties of the projects and their markets. The
estimating regression analysis of the form: ROIj = a + Id.j + PjL.j + Pj Xjj+ p; is used.
37

The design and sizes of houses varies from location to location and is dependent on the target group. The High income housing is generally housed with a one bed roomed Flats or Apartments o f 550-1,000 square feet in size, two bed roomed flats or apartments of 1.500 square feet. Return on investments is directly related with disposable income with a correlation coefficient of 0.357. The negative sign means that the variables are inversely related and therefore as one variable increases the other decreases and the reverse is true.
In summary therefore the study established that disposable income is very critical in the ROI and Financial performance of the organization among all the variables evaluated in the study while other variables such as government regulation and control had negative correlation implying that there is no relationship between ROI and financial performance
with the respective variable.
38
CHAPTER FIVE
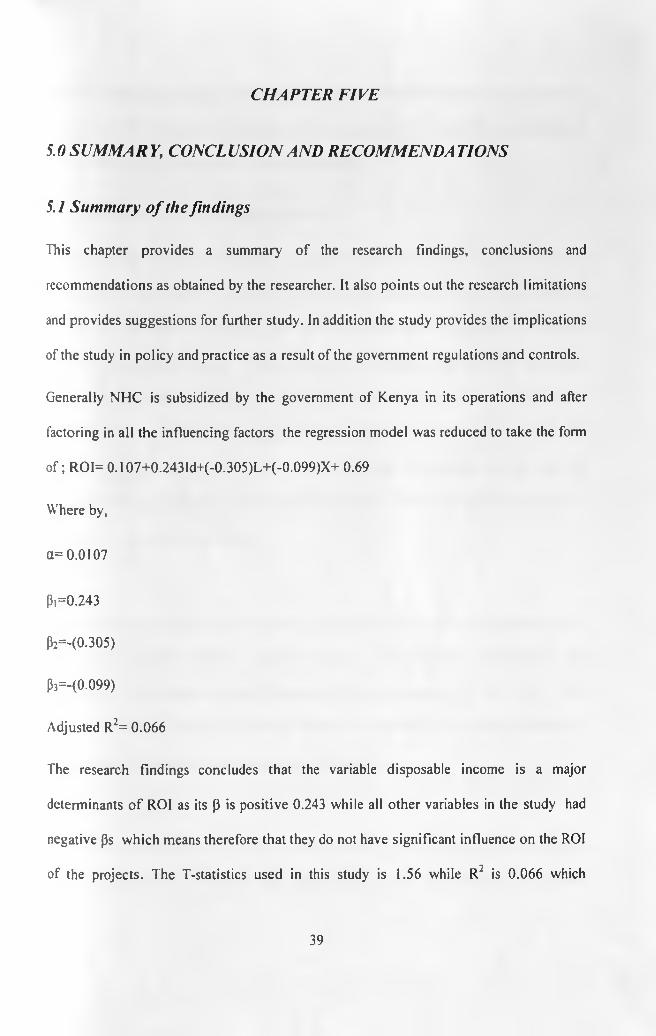
5.0 SUMMAR Y, CONCL USION AND RECOMMENDA TIONS
5.1 Summary o f the findingsThis chapter provides a summary of the research findings, conclusions and recommendations as obtained by the researcher. It also points out the research limitations and provides suggestions for further study. In addition the study provides the implications of the study in policy and practice as a result of the government regulations and controls.
Generally NHC is subsidized by the government of Kenya in its operations and after factoring in all the influencing factors the regression model was reduced to take the form o f ; ROI= 0.107+0.243Id+(-0.305)L+(-0.099)X+ 0.69
Where by,
a= 0.0107
P, =0.243
p2=-(0.305)
p3=-(0-099)
Adjusted R2= 0.066
The research findings concludes that the variable disposable income is a major determinants o f ROI as its p is positive 0.243 while all other variables in the study had negative ps which means therefore that they do not have significant influence on the ROI of the projects. The T-statistics used in this study is 1.56 while R: is 0.066 which
39
indicated a lower variability o f the ROI as a result of the determinants of the financial performance in real estate development. The error term o f the model was established to be 0.69 which implied that this is a one tailed model.
5.2 Conclusions and recommendationsThe data in this study was influenced by singular circumstances due to unavailability of information in the industry. Secondly, NHC was the only government owned entity in this industry therefore resulting to a monopolistic environment consequently not of much use in a liberalized economy. Thirdly, most of the projects undertaken by NHC were politically influenced as opposed to policy resulting into poor choice of location and more importantly in a good demographic target market that will yield a good ROI. Finally, the variability of the study is low while the determinants of the financial performance were limited to higher disposable income of the target population that was interested in the project developed.
The lower relative entropy is not necessary a better firm’s financial performance while a high market density yielded a negative impact on the financial performance was confirmed by the research findings. Entropy had no relationship with the ROI of the projects undertaken during the period of the study neither did the competitors matter on the financial performance o f the organization in the study.
From the academic point o f view, it has been established that within this specific sector, it is a combination of personal and organization’s traits that determines successful
40

financial performance. It is therefore recommended in future research to be based on the influences of managerial decisions in financial performance of real estate in Kenya. Further research can also be based on the effects of threat to entrants, increasing bargaining power and threat of substitute technology risks in real estate development in real estate development in Kenya when the government does not provide subsides.
5.3 The limitations to the studyThe major limitation of the study was the fact that NHC was the only Government entity at the time of the study in the real estate industry which meant therefore that it is not possible to simulate the study in a liberalized economy in Kenya. Financial performance are influenced by both internal and external factors however, the time that was available to the research was not adequate to evaluate all the factors in order to give a conclusive opinion on the determinants of financial performance in real estate development in Kenya.
5.4 Recommendation for further studyThe industry o f real estate provides enormous areas of study as it suffers from information asymmetry in pricing, costs of project development and risk management in private and government entities in the industry. Further research is necessary in real estate rating and REITS, and finally how business risks affect financial performance in real estate development in Kenya.
41
REFERENCES
Alfaro, Rodrigo and Mathias Drehmann, (2009), Macro stress Tests and Crisis: What can we learn? Bank for international settlements quarterly review.
Brueggeman, William, Andrew Chen and Thomas Thibodean, Real Estate InvestmentFunds, (1984), Performance and Portfolio consideration, AREUEA Journal, Fall.
Basel Committee on Banking Supervision, (2009), Principles for sound stress Testing Practices and supervision
Beirly,S.and P. Westhead, (1990), 'Growth and performance contrast between types of small firms, Strategic management Journal
Beirly, S. and P. westhead, (1994), A taxonomy of Business start-up reasons and their impact on firm growth and size, Journal of Business Venturing
Catherine Mutava, (2011), Investment Decisions, The Kenya Surveyor’ journal:APublication of the Institute of Surveyors of Kenya; Investment Decisions surveying profession in Kenya Capacity Gaps among land Sector professionals reviewing of Valuations- Technological Advances and Emerging opportunities
Capon, N., J.U. Farley and S. Hoenig, (1990), Determinants of financial performance: a Menta-analysis, Management Science
Cyert, R.M., P. Kumar, and J.R. Williams (1993), Information, market imperfections and strategy, Strategic Management Journal
Cooper D.R and Emory C.W, (1995), Business Research Methods, 5Ih Edition, McGraw
Hill Company Inc. USA.
42

Cooper D.R and Schindler P.S, (2003), Business Research Methods, 8Ih Edition, McGraw
Hill Higher Education, NY USA.
Committee of Sponsoring Organizations of the Treadway Commission, (2004),
Enterprise Risk Management - Integrated Framework
Charles F. and Nearchs T, (1997), Real Estate Principles, 5th Ed. Real estate Education
Company.
Hall, R. (1993), A Framework linking intangible resources and capabilities to sustainable
competitive advantage, Strategic Management Journal
Hannan, M.T.,J. Ranger-Moore and J.Banaszak-Holl (1990), Competition and the
evolution o f organizational size distributions
Hellwing, M., (1994 a), Liquidity Provision, Banking and the Allocation of Interest Rate
Risk, European Economic Review 38.
Firstenberg, Faul M. Stephen A. Ross, and Randell C. Zisler, Real Estate (1988), The
Whole Story; The Journal of Portfolio management
Franklin Allen, Modelling Financial Instability, (2005), National Institute Economic
Review No. 192
Garry' J. Schinasi, (2008), International Monetary Fund: Economic Issue No.36
Government o f Kenya, (2007), Kenya Vision 2030: A globally competitive and
prosperous Kenya, Nairobi (Unpublished)
43

International Monetary Fund, (2007), Market Developments and Issues, Global Financial
Stability Report, Washington, D.C.
http:www.imf.org/Extemal/pubs/FT/GFSR/20Q7/01/text.pdf.
John-John and D ’Argensio Frederic Laurin, (2007), The real Estate Premium: A
discussion paper on a developed/Emerging Country panel data analysis.
Chan K.C., Patric FI. Hendershott and Anthony B. Sanders, (1990), NBER Working
Paper Series, No.3311: Risk and Return on real Estate, Evidence from Equity
REITS.
Kindleberger. C, Manias, Panics, and Crashes, (1978), A History of Financial Crises,
New York, NY, Basic Books.
Kenya Bankers Association, (2009), Cost of Collateral in Kenya
KPMG, 2009, ‘Never again? Risk management in banking beyond the credit crisis’
Karanja P.K., (2002), Competitive Strategies of Real Estate Firm’s: the perspective of
porter’s generic model MBA project UON(unpublished)
Laws of Kenya, (1972), The Housing Act Chapter 117 Clause 7 (1) b pg 6
Martha Amram and Nalin Kulatilaka, (1999), Real Options: Managing Strategic
Investment in an Uncertain World, Harvard Business School Press, Boston
Massachusetts.
44

Martin Hellwig, (2008), Systemic Risk in the Financial Sector: An analysis of the
Subprime-Mortgage Financial Crisis. Preprint of the Max Planck Institute for
Research on Collective Goods.
Mwaura Jackson Muiruri, (2009), Performance contracts and entrepreneurial
development in state corporations: A case o f National Housing Corporation
(NHC) Kenya Unpublished MBA Thesis.
Martin Khoya Odipo,( 2000), Accounting determined measures of systematic risk at
Nairobi stock exchange: an empirical study, Unpublished MBA project UON.
Ndegwa Sarah,(2001), Systematic Risk and Business Risk: A case of Companies listed at
the Nairobi stock exchange, unpublished MBA Project UON.
Njiru Josua Gitonga, (2003), The performance of real estate market- the case o f central
business district (CBD) of Nairobi, Unpublished MBA Project UON.
Odum. H. W. and Jocher. K., (1992), An introduction to social research, New York,
Henry Holt and Co.
Odipo Martin, (2000), Accounting determined Measures o f systematic Risk at NSE: An
Empirical Study, unpublished MBA project UON.
Ross, Stephen A., (1976), The Arbitrage Theory of Capital Asset Pricing: The Journal of
45

Economic Theory.
Rio de Janeiro, (2010), The right to the city: Bridging the Urban divide. The country
Report Fifth Session o f World Urban Forum.
Shah S. and Anjan V.T.( 1987), Optimal Capital Structure and Project Financing: Journal
o f Economic theory vol.42,209-243.
Saunders M., Lewis P and Thornhill A., (2007), Research Methods for Business Students,
4th Edition, Pearson Education Limited, Edinburgh Gate, England
Simon, H.A. 91982), Models of bounded rationality: behavioral economics and business
organizations, Cambridge,Mass: MIT Press.
Syagga P.M. (1999), Management of Local Authority Housing Estates in Kenya .M.A. Thesis, University of Nairobi
Slacalek J., (2006), What Drives Personal Consumption? The Role of Housing and Financial Wealth, Discussion Paper 647, http://www.diw.de/documents/publication/73/44944/dp647.Ddf.
Stulz rene, (2008). Risk management failures: What are they and when do they happen, Journal of Applied Corporate Finance, volume 20
Thomas M. Springer and Ping Cheng, (2006). Real Estate Property Portfolio Risk:Evidence from REIT Portfolios. Presented at the Real Estate Research Institute,
Annual Conference Chicago, Illinois on April 27-28.Thornton Matheson, (2006), the effects of the corporate Income tax on Leverage in
Public corporation.Virginia A. Gibson,( 2002), Senior Lecturer & BT Property Research fellow department
46

of land Management & Development: Risk Management and the Corporate Real Estate Portfolio Paper presented at American Real Estate society Annual meeting.
Virginia Gibson and Marc Louargand, (2002). Risk Management and the Corporate Real Estate Portfolio.
Webster’s college dictionary Random House, New York Toronto London Sydney Auckland, (2001), ISBN 0-375-42600-0, 2001 Second Revised and Updated Random House Edition.
Young, P. V., (1996), Scientific social survey and research, 3rd ed. New York, Prentice- Hall.
47

APPENDIX IINTRODUCTION LETTER17th June, 2011 The Managing Director National Housing Corporation Po Box 30257-00100 Nairobi.Dear Sir,Re: A U T H O R IT Y TO CONDUCT A R E SE A R C H O N T H E D E T E R M IN A N T S OF
FINANCIAL P E R F O R M A N C E I N R E A L E S T A T E D E V E L O P M E N T I N YOUR
ORGANIZA T IO N FOR A D EG REE I N MBA
I am undertaking a degree in Master o f Business Administration (Finance option) at the University of Nairobi and as a requirement am scheduled to undertake a research project which is strictly academic. I therefore request authority to research in your organization on the determinants of Financial Performance in real estate development by Government entities: A case National housing Corporation.The research findings will be for academic purposes only and can be availed to you at your request upon completion of the project subject to approved authority by the University.I w ill be glad if the authority is granted to facilitate a successful completion of my study. Thank you.
Patrick Riang’a Moturi.
1

APPENDIX IIPART 1: RESEARCH QUESTIONS
1. Approximately how many employees are involved in price setting of real estate properties in your institution?
below 10
|____ Other Specify........................................2. What do you consider critical in pricing your properties?
(i) ................................................................................................(ii) ..............................................................................................(iii) .............................................................................................(iv) .............................................................................................
3. What is the anticipated growth rate in production in the next 5 years?
Above 3% 1-2% None Down by 1 -2%
Down by 3% (Specify)4. How does your organization finance its operations?
From its internal sources Short term loans Mortgages
Security backed Mortgages ____ Contractor Finance
II
5. What are the major regulatory bodies in real estate in Kenya? Specify.....................................................................................................................................
6. How do these regulatory bodies affect the pricing of the real estate properties in your company?Specify.....................................................................................................................................
7. Do you think the prices o f real estate are affected by inflationary cost?No I don’t know
(i) If your answer in 7 above is yes, to what extent is the effect?
Significant 5%
Averagely 4%
Normal 3%
Below average 2%
III

Insignificant 1%
(ii) In your view how should management mitigate such costs?....................................................................................................................
(iii) Do you know of any other financial risks that might be critical in pricing o f your real properties in your organization?
No I don’t Know(iv) If your answer to (iii) above is yes please specify such risks
8. What are other factors that your company is likely to consider in real estate development?Specify.....................................................................................................................................
IV

9. From (8) above specify how the company will in its choice(i) identify................................................................................................................(ii) evaluate................................................................................................................(iii) rank those factors............................................................................................
10. In your own view what is the major factors to be considered in the choice o f projects development?Specify.....................................................................................................................................
11. From your answer in 10 above by what percentage does it affect your cash flows?5% above 10% 1 don t know Not at all
12. In what way has choice o f location affected project development in your organization?Specify.................................................................................................................
(i) From your answer in 12 above what are the major causes of differentiation in pricing of the projects in the various locations? specify..................................................................................................................
How were they
V
(a) Identified?
(b) Mitigated?
(ii) In your view what proportion of the returns on sales o f the organization is affected by project location?
above 10% | 1 Insignificant I 15% 10%
13. Have you ever had cases of maturity mismatch of borrowed funds? Yes No I don’t Know
14. If your answer in 13 above is yes, how
(i) did it affect the value o f the properties?Significantly Not significant I don’t know
(ii) was the mismatch addressed?. Specify.................................................15. Does market density and concentration affect the value of the project pricing?
Yes I i No
16. If your answer in 15 above if yes(i) how do you determine the level of density and market concentration
Specify................................................................................................................
VI

(ii) to what extent does it affect the price setting o f your projects?
17. In your view does disposable income of the target market affect choice of project development? Yes I I N oF
18. if your answer in 17 above is yes specify how it affects(i) choice of project..............................................(ii) Pricing of project.............................................(iii) Financing of project........................................
VII

PART II: DA TA C O L LE C T IO N F O R M A N D S T A T IST IC A L TAB LE S
1.0 Extract of Statement of Comprehensive statement
2006 (’000’) 2007 ('000) 2008 ('000') 2009('000') 2010(’000') 2011 ('000')Turnover 591,787 719,010 743,119 826,395 840,876 1,151,695Operating Profit 162,658 193,105 226,819 238,154 191,400 619,748Proposed dividends 22,325 27,951 33,234 28,876 21,580 87,413
2.0 Extract of Financial Statements
2006('000') 2007(’000’) 2008(’000') 2009('000') 2010('OOO') 2011 ('000')Equity 4,819,319 5,320,000 5,536,000 5,786,000 6,036,000 6,936,000LTLA 1,290,102 1,928,666 1,827,643 1,896,101 2,813,381 3,716,713Cash and Bank 183,335 584,256 813,115 759,224 1,044,447 512,127
3.0 Statistical tables Model Summary
Model R R2 Adjusted R2 Std. Error of the Estimate
1 .43 la .186 .095 .08228905
2 .503b .253 .066 .08359696
3 .508c .258 -.060 .08908648
a. Predictors: (Constant), Location
b. Predictors: (Constant), Location, Total cost
VIII
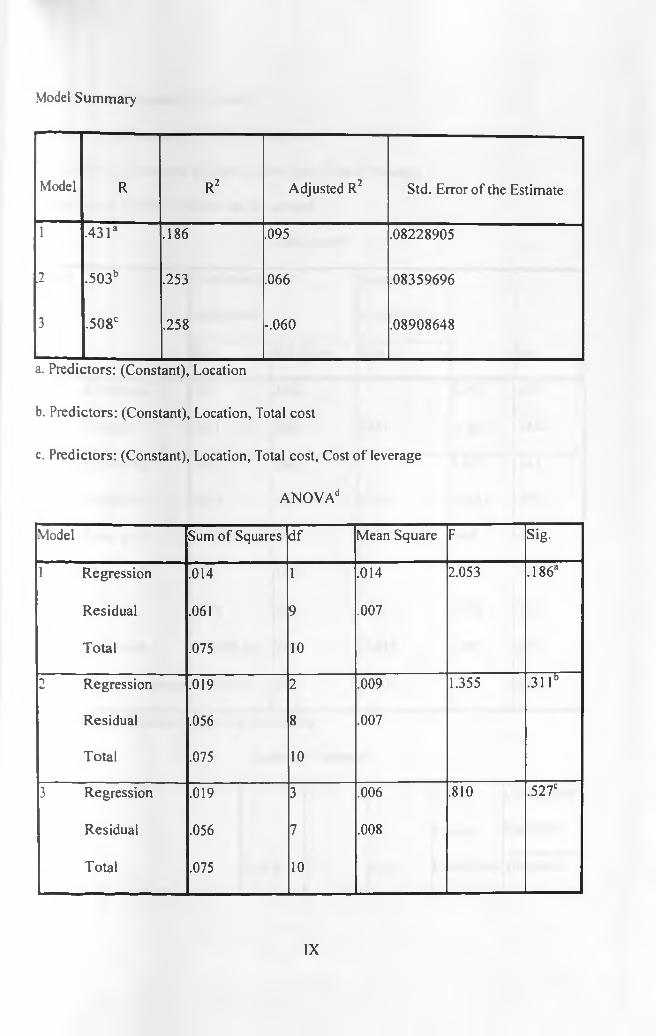
Model Summary
Model R R2 Adjusted R2 Std. Error of the Estimate
1 .43 l a .186 .095 .08228905
2 .503b .253 .066 .08359696
3 .508c .258 -.060 .08908648
a. Predictors: (Constant), Location
b. Predictors: (Constant), Location, Total cost
c. Predictors: (Constant), Location, Total cost, Cost o f leverage
ANOVAd
Model Sum of Squares d f Mean Square F Sig.
1 Regression .014 1 .014 2.053 .186a
Residual .061 9 .007
Total .075 102 Regression .019 2 .009 1.355 .31 l b
Residual .056 8 .007
Total .075 103 Regression .019 3 .006 .810 .527c
Residual .056 7 .008
Total .075 10
IX
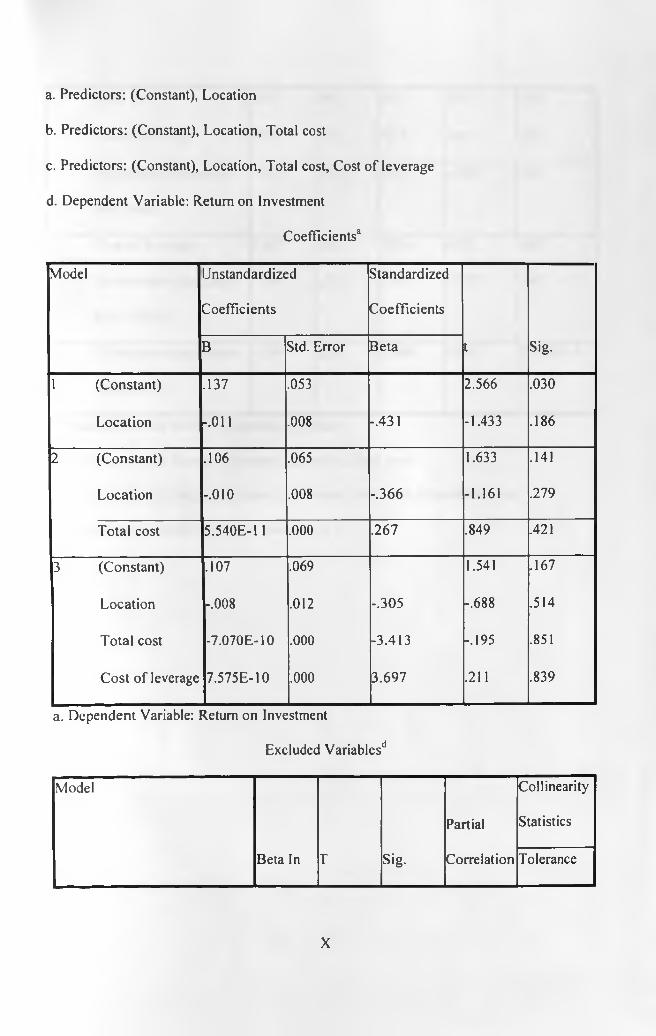
a. Predictors: (Constant), Locationb. Predictors: (Constant), Location, Total costc. Predictors: (Constant), Location, Total cost, Cost of leveraged. Dependent Variable: Return on Investment
Coefficients3
Model JnstandardizedCoefficients
StandardizedCoefficients
t Sig.B Std. Error Beta
1 (Constant) .137 .053 2.566 .030
Location -.011 .008 -.431 -1.433 .186
2 (Constant) .106 .065 1.633 .141
Location -.010 .008 -.366 -1.161 .279
Total cost 5.540E-11 .000 .267 .849 .421
3 (Constant) .107 .069 1.541 .167
Location -.008 .012 -.305 -.688 .514
Total cost -7.070E-10 .000 -3.413 -.195 .851
Cost of leverage 7.575E-10 .000 3.697 .211 .839
a. Dependent Variable: Return on InvestmentExcluded Variables11
Model Collinearity
Partial Statistics
Beta In T Sig. Correlation Tolerance
X
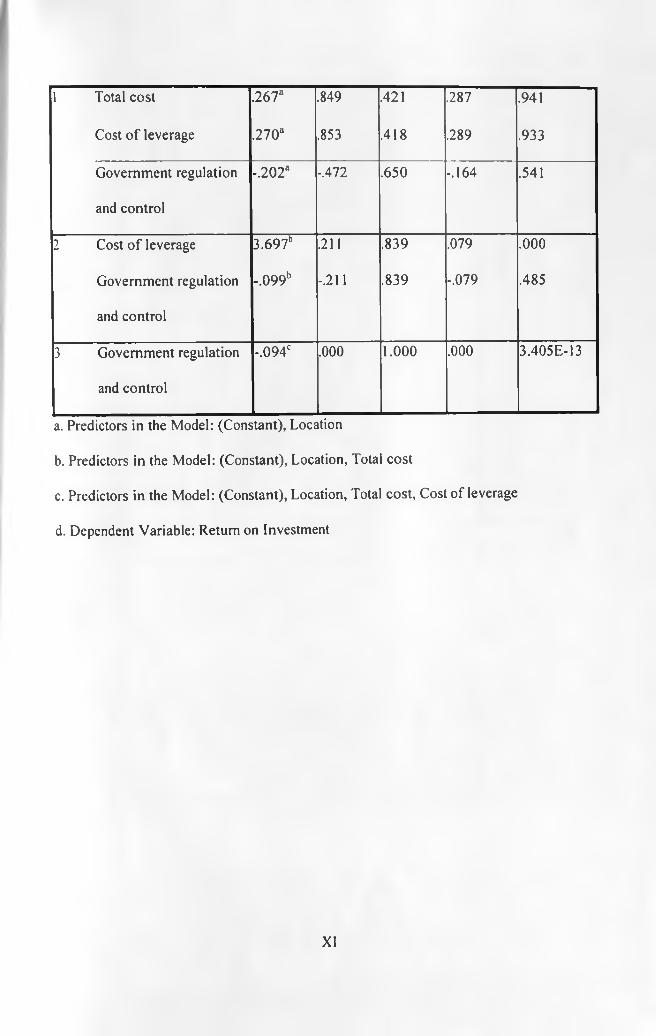
1 Total cost .267a .849 .421 .287 .941
Cost o f leverage .270a .853 .418 .289 .933
Government regulation -.202a -.472 .650 -.164 .541and control
2 Cost o f leverage 3.697” .211 .839 .079 .000
Government regulation -.099b -.211 .839 -.079 .485
and control
3 Government regulation -.094c .000 1.000 .000 3.405E-13
and control
a. Predictors in the Model: (Constant), Locationb. Predictors in the Model: (Constant), Location, Total costc. Predictors in the Model: (Constant), Location, Total cost, Cost of leveraged. Dependent Variable: Return on Investment
XI

![ETE 204 - Digital Electronics Counters [Lecture:14] Instructor: Sajib Roy Lecturer, ETE, ULAB](https://img.pdfslide.us/doc/110x75/56649da35503460f94a90407/ete-204-digital-electronics-counters-lecture14-instructor-sajib-roy-lecturer.jpg)