Embed Size (px)
Citation preview
H. Dinwiddie NRAO-EVLA 1
X-Band OMT EvaluationSOC Design Thermal Analysis
2009/10/01
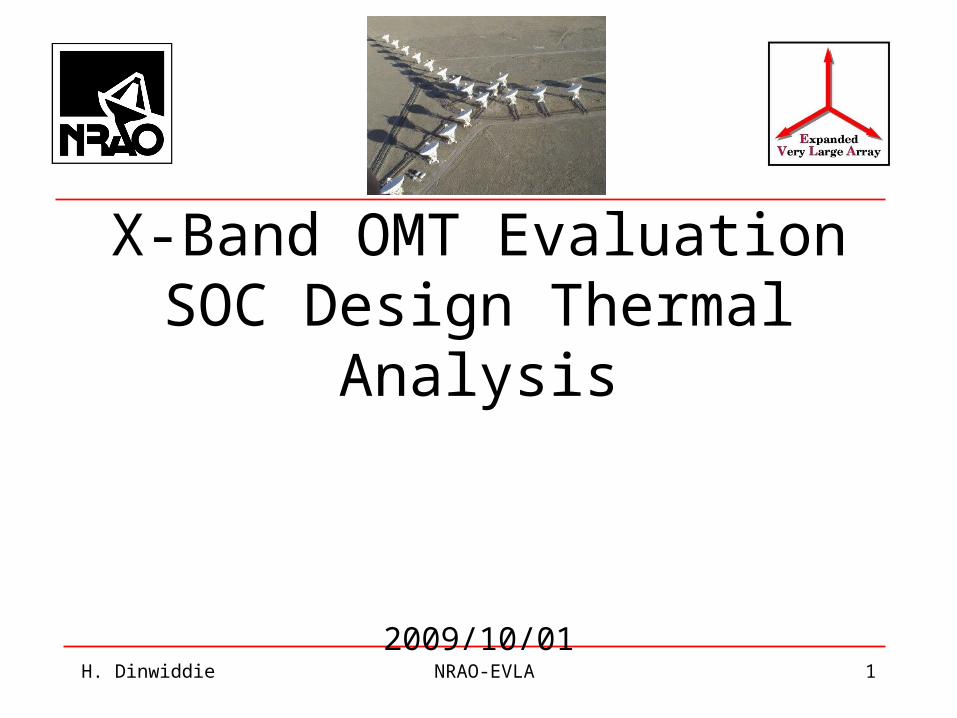
Approach
• Finite Element Analysis
– Have the tools (CFDesign)
– No verified models
– Learning curve
– Limited time
• Simplified Approach
– Treat the complex surfaces as cylinders and plates
– Only evaluate critical areas ( large surface areas with large temperature differences)
– Evaluate for the worst case thermal conductivity and emissivity
– Calculate all of the 300K to 50K and 50K to 15K loads
– Compare with the cold head capabilities
H. Dinwiddie NRAO-EVLA 2
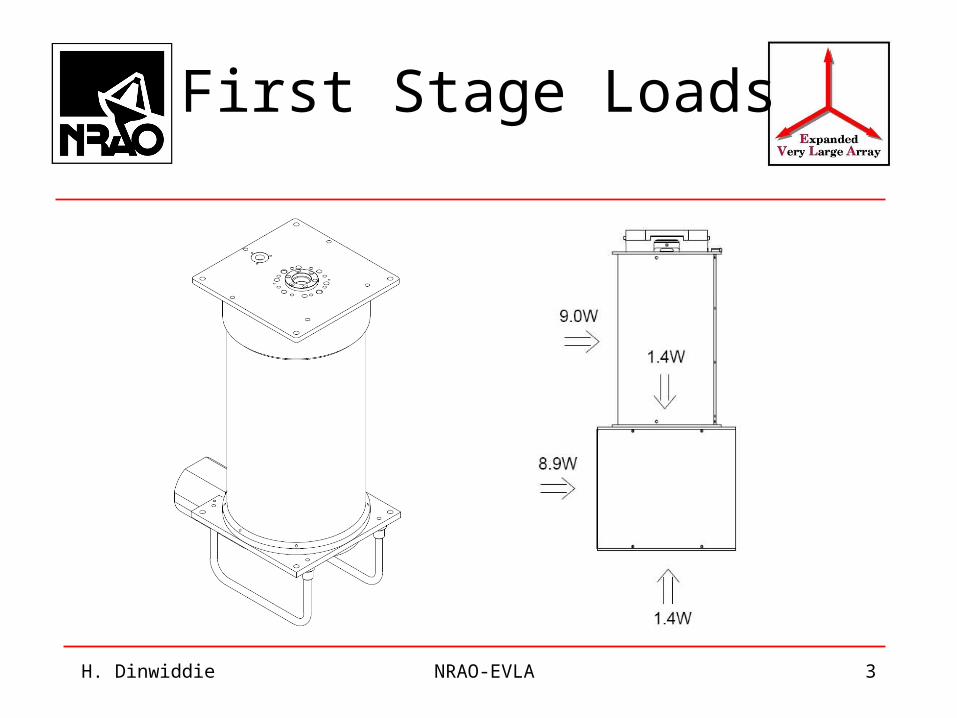
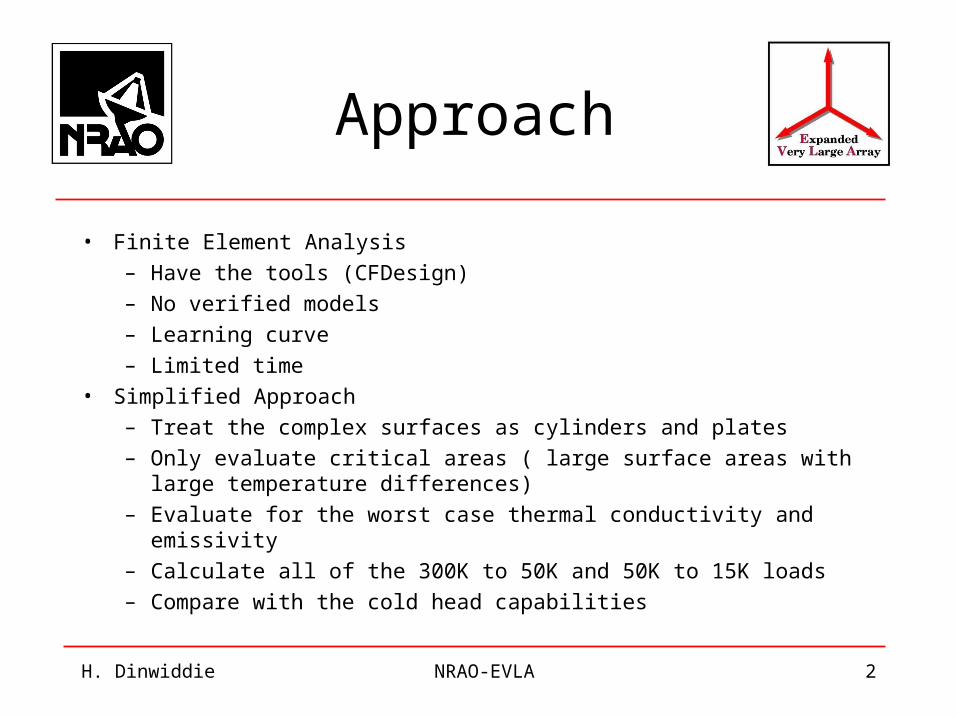
First Stage Loads
H. Dinwiddie NRAO-EVLA 3
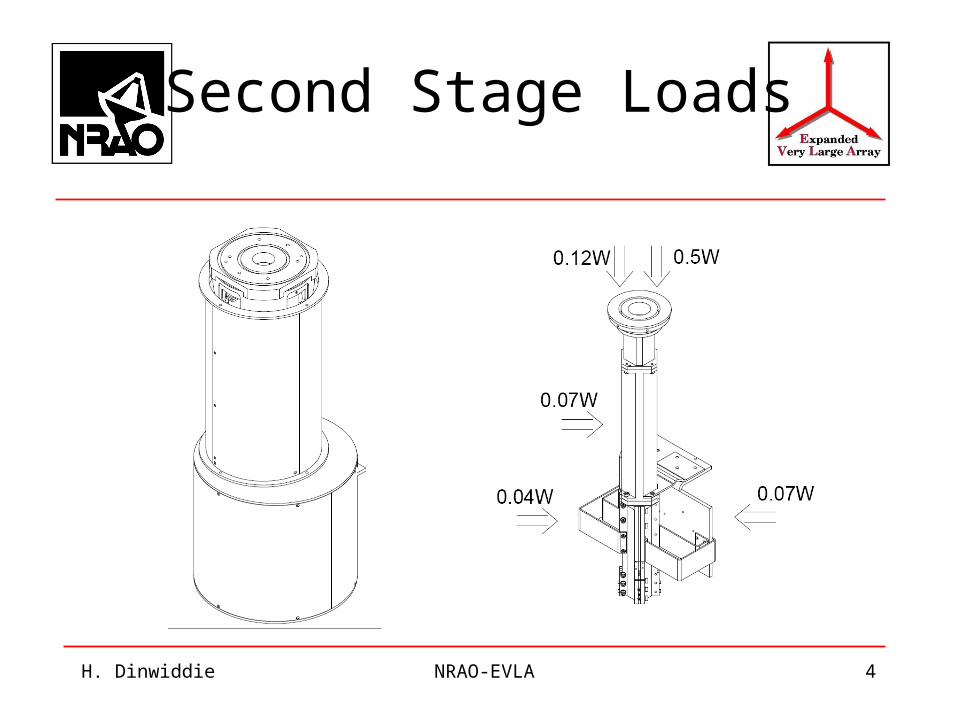
Second Stage Loads
H. Dinwiddie NRAO-EVLA 4
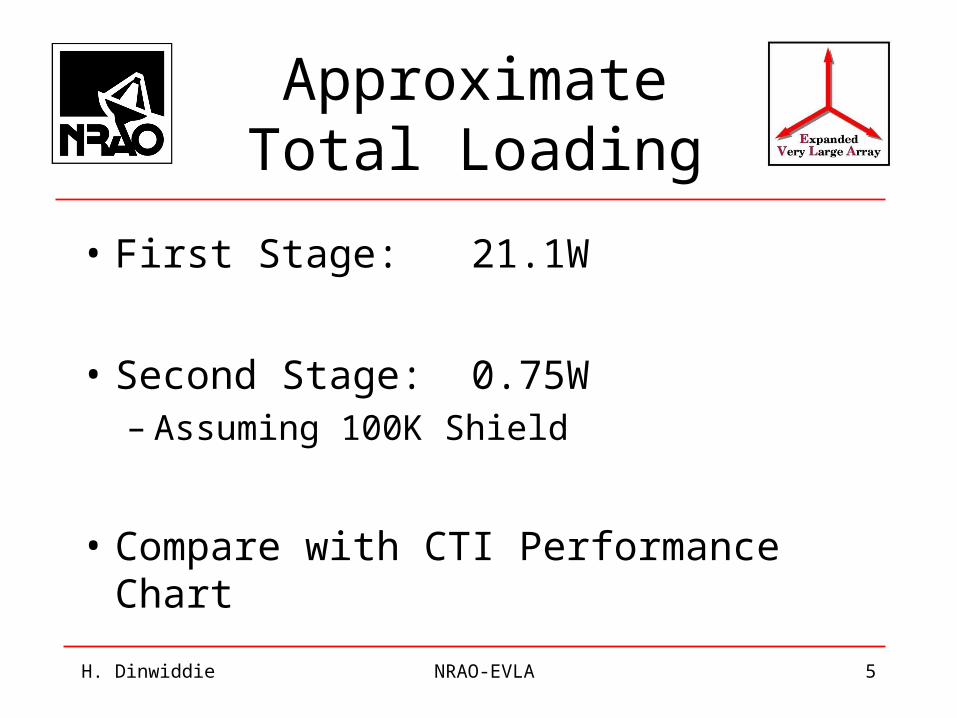
Approximate Total Loading
• First Stage: 21.1W
• Second Stage: 0.75W– Assuming 100K Shield
• Compare with CTI Performance Chart
H. Dinwiddie NRAO-EVLA 5

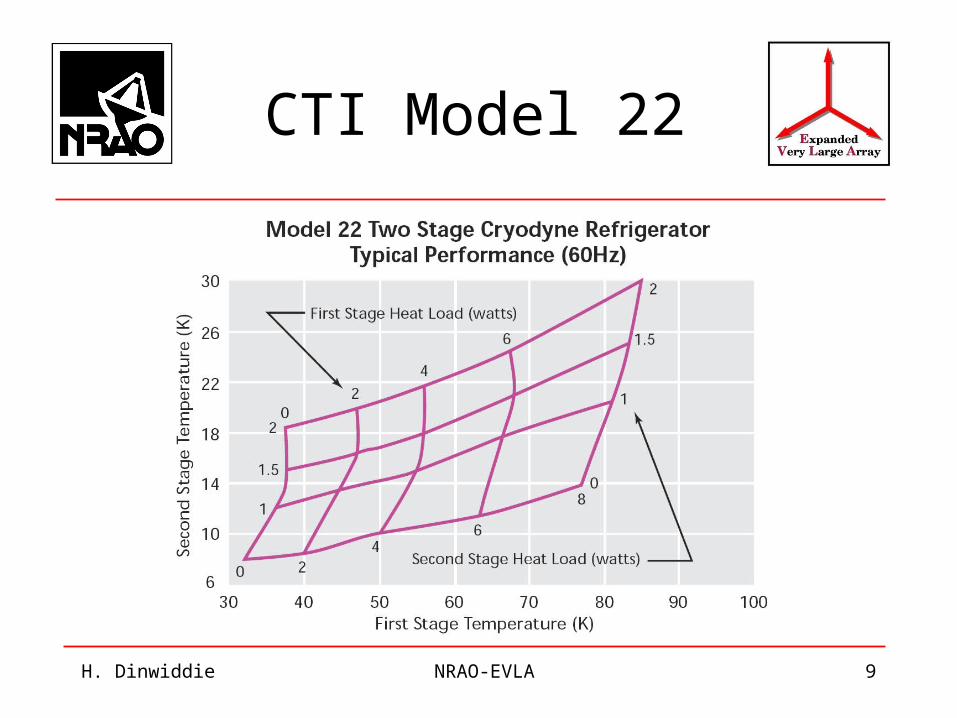
CTI Model 22
H. Dinwiddie NRAO-EVLA 6
Evaluations
• The loads are within the range of the second stage
• To get the OMT below 20K the first stage needs to be around 100K
– Previous second stage load was calculated from a 100K second stage
• At least 10W off the chart on the first stage
– Add radiation blankets (floating shields) to provide protection from the 300K environment
H. Dinwiddie NRAO-EVLA 7
Floating Shields
• The use of independently floating, cascading shields should provide a reduction of transferred power by a factor of N+1
• Use of a 4 layer radiation blanket should gives an 80% reduction in transferred power
• Reduces the load on the first stage to 5.4W
H. Dinwiddie NRAO-EVLA 8
CTI Model 22
H. Dinwiddie NRAO-EVLA 9
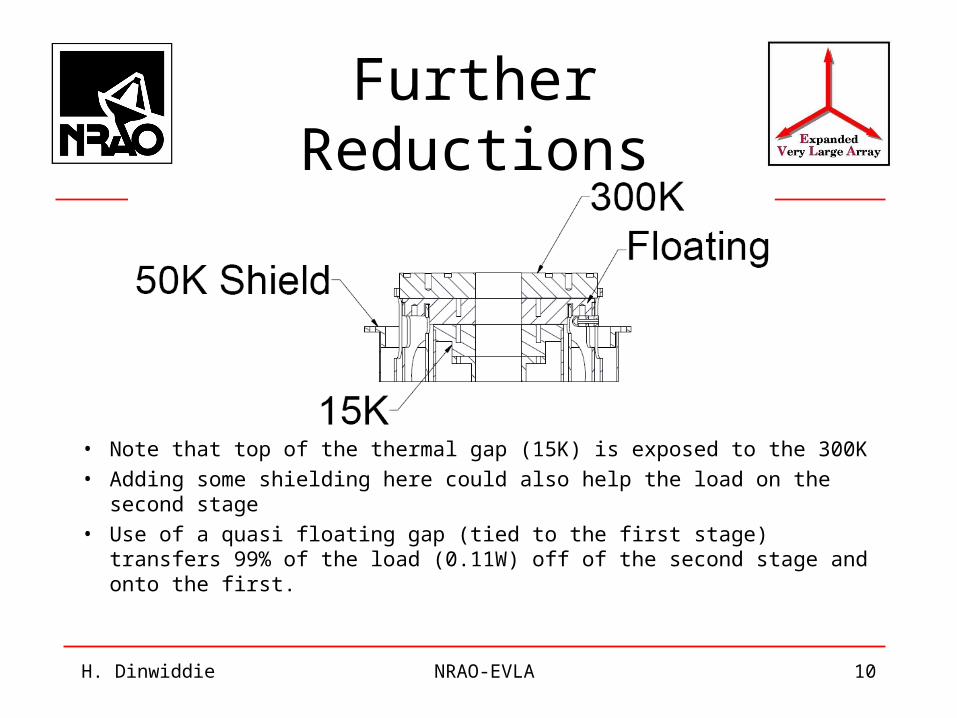
Further Reductions
• Note that top of the thermal gap (15K) is exposed to the 300K
• Adding some shielding here could also help the load on the second stage
• Use of a quasi floating gap (tied to the first stage) transfers 99% of the load (0.11W) off of the second stage and onto the first.
H. Dinwiddie NRAO-EVLA 10
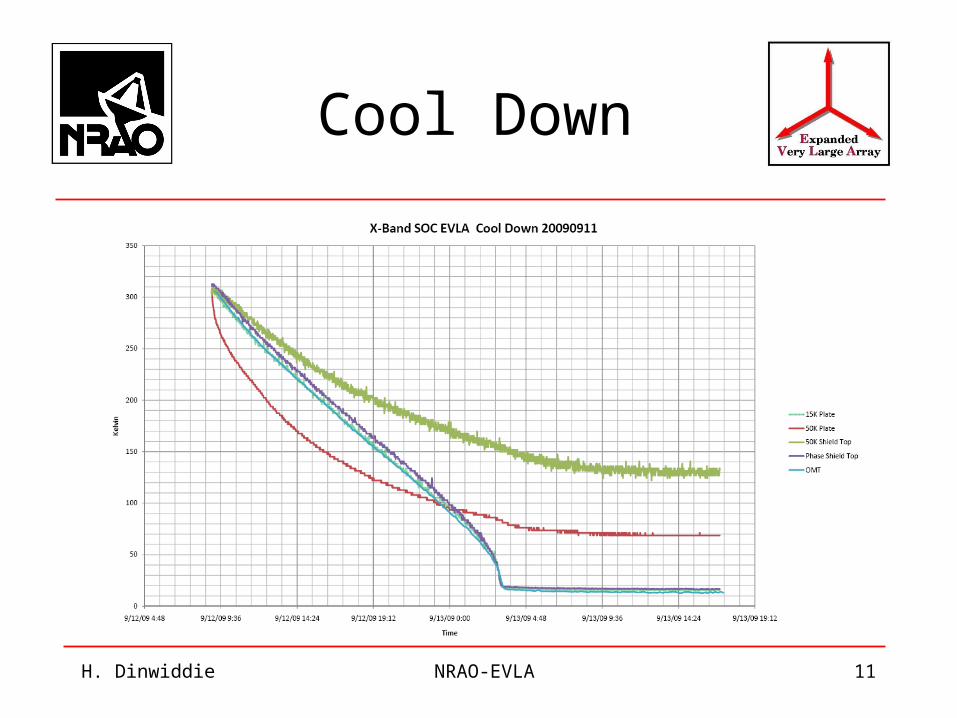
Cool Down
H. Dinwiddie NRAO-EVLA 11
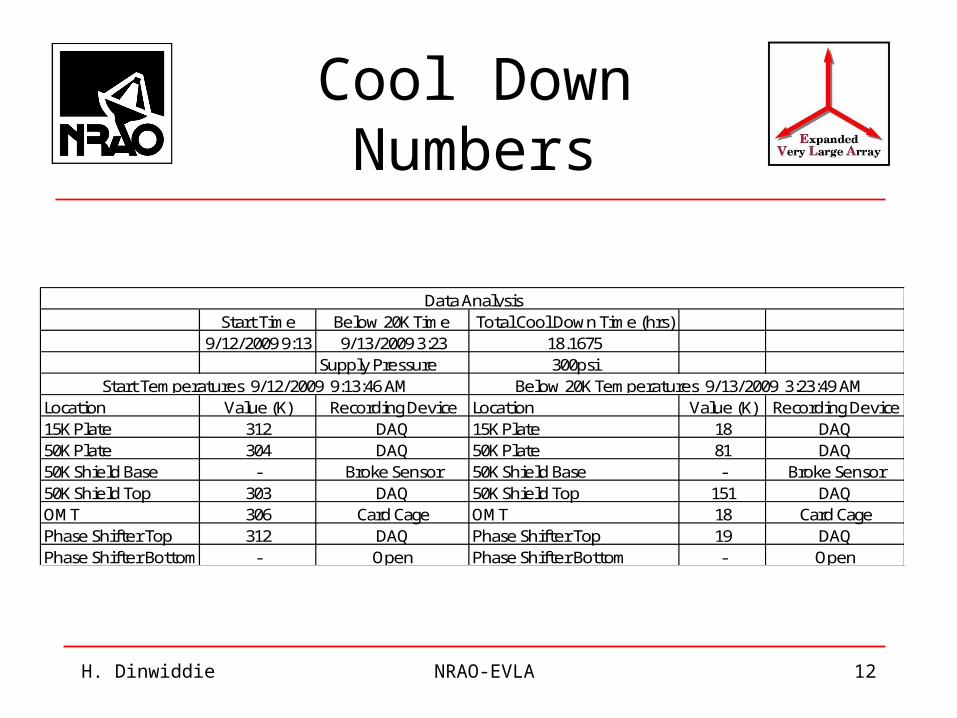
Cool Down Numbers
H. Dinwiddie NRAO-EVLA 12
Start Time Below 20K Time Total Cool Down Time (hrs)9/12/2009 9:13 9/13/2009 3:23 18.1675
Supply Pressure 300psi
Location Value (K) Recording Device Location Value (K) Recording Device15K Plate 312 DAQ 15K Plate 18 DAQ50K Plate 304 DAQ 50K Plate 81 DAQ50K Shield Base - Broke Sensor 50K Shield Base - Broke Sensor50K Shield Top 303 DAQ 50K Shield Top 151 DAQOMT 306 Card Cage OMT 18 Card CagePhase Shifter Top 312 DAQ Phase Shifter Top 19 DAQPhase Shifter Bottom - Open Phase Shifter Bottom - Open
Data Analysis
Start Temperatures 9/12/2009 9:13:46 AM Below 20K Temperatures 9/13/2009 3:23:49 AM
Success?
• Within the target range of 20K on the second stage
• But no heat load from the stainless coaxial cables and amplifiers
• Next Step
– Apply a 50mW load thru the heating resisters to simulate the electronic heat load
– Miscommunication and applied a 2W heat load
H. Dinwiddie NRAO-EVLA 13
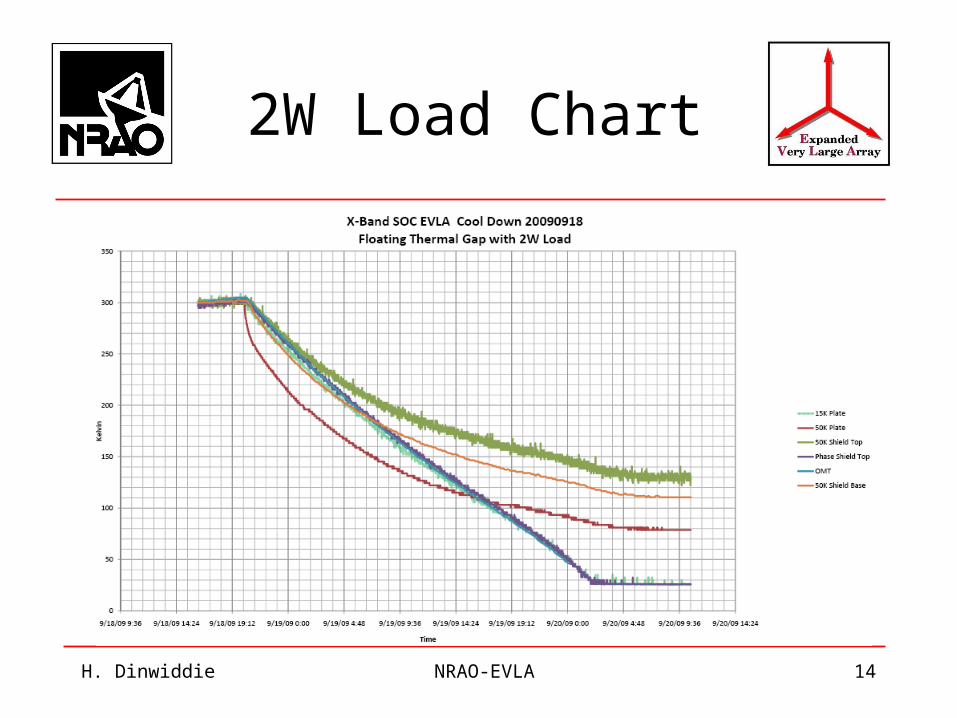
2W Load Chart
H. Dinwiddie NRAO-EVLA 14
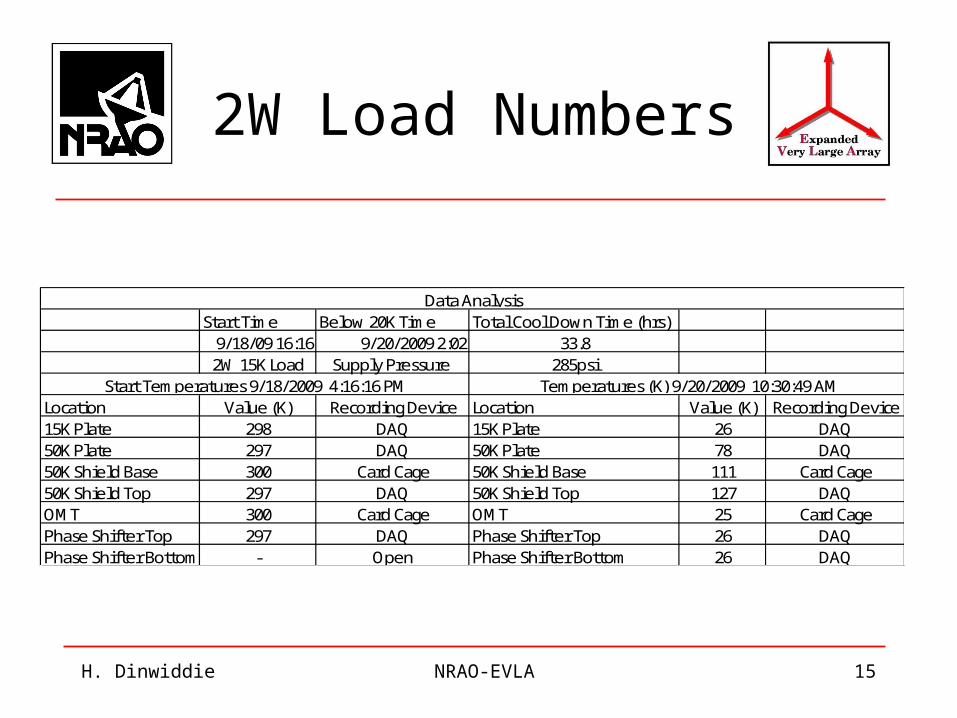
2W Load Numbers
H. Dinwiddie NRAO-EVLA 15
Start Time Below 20K Time Total Cool Down Time (hrs)9/18/09 16:16 9/20/2009 2:02 33.82W 15K Load Supply Pressure 285psi
Location Value (K) Recording Device Location Value (K) Recording Device15K Plate 298 DAQ 15K Plate 26 DAQ50K Plate 297 DAQ 50K Plate 78 DAQ50K Shield Base 300 Card Cage 50K Shield Base 111 Card Cage50K Shield Top 297 DAQ 50K Shield Top 127 DAQOMT 300 Card Cage OMT 25 Card CagePhase Shifter Top 297 DAQ Phase Shifter Top 26 DAQPhase Shifter Bottom - Open Phase Shifter Bottom 26 DAQ
Data Analysis
Start Temperatures 9/18/2009 4:16:16 PM Temperatures (K) 9/20/2009 10:30:49 AM
No Such Thing As Bad Data
• Extremely long cool down time: 33hrs
• Failed to reach the 20K target range: 25K
• Floating gap settled at 220K
• Second Stage over loaded by 400 times
• Next Step
– Apply a 50mW load thru the heating resisters to simulate the electronic heat load
H. Dinwiddie NRAO-EVLA 16
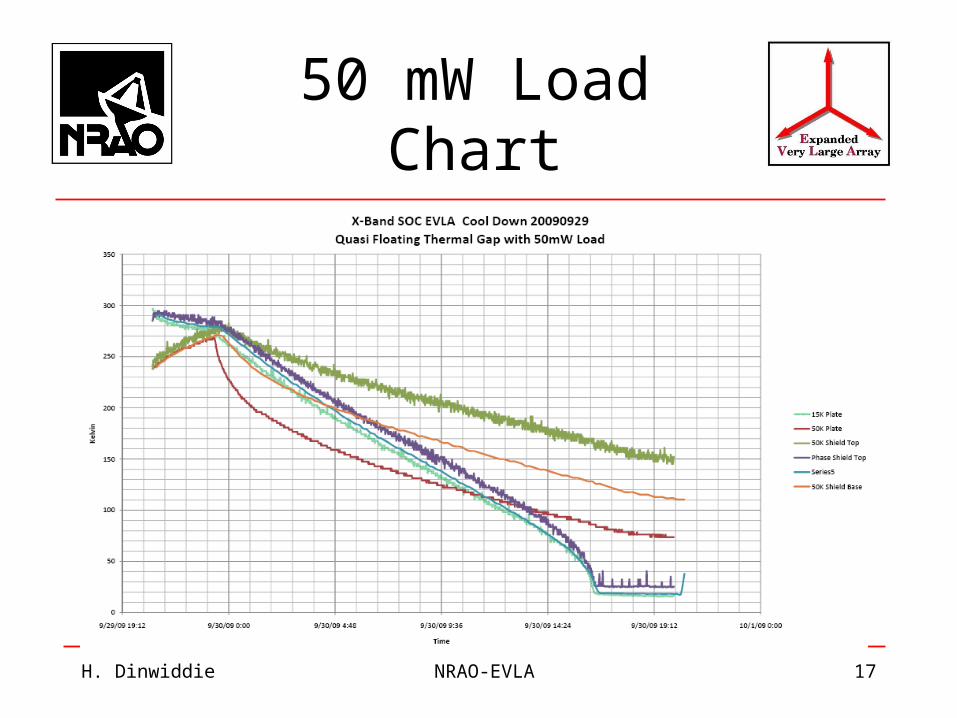
50 mW Load Chart
H. Dinwiddie NRAO-EVLA 17
50 mW Load Notes
• Cool down time*: 17hrs
• Within the 20K target range
• Not an official cool down, unstable starting points
• The CTI Model 22 can handle the electronics heat load
H. Dinwiddie NRAO-EVLA 18
Future Work
• Reduce the resistance between the first stage shields be adding thermal strapping
• Reduce the 300K effects through the waveguide by adding a foam plug into the floating gap
• Reduce the size of the dewar and radiation shields
H. Dinwiddie NRAO-EVLA 19
Conclusion
• The proposed X-Band Quad-Ridge OMT is capable of being cooled with a CTI Model 22 in the 20K range.
• Cool down time in the current configuration are approximately18hrs.
• Appears to be room for improvement
H. Dinwiddie NRAO-EVLA 20
Questions
H. Dinwiddie NRAO-EVLA 21