Embed Size (px)
Citation preview
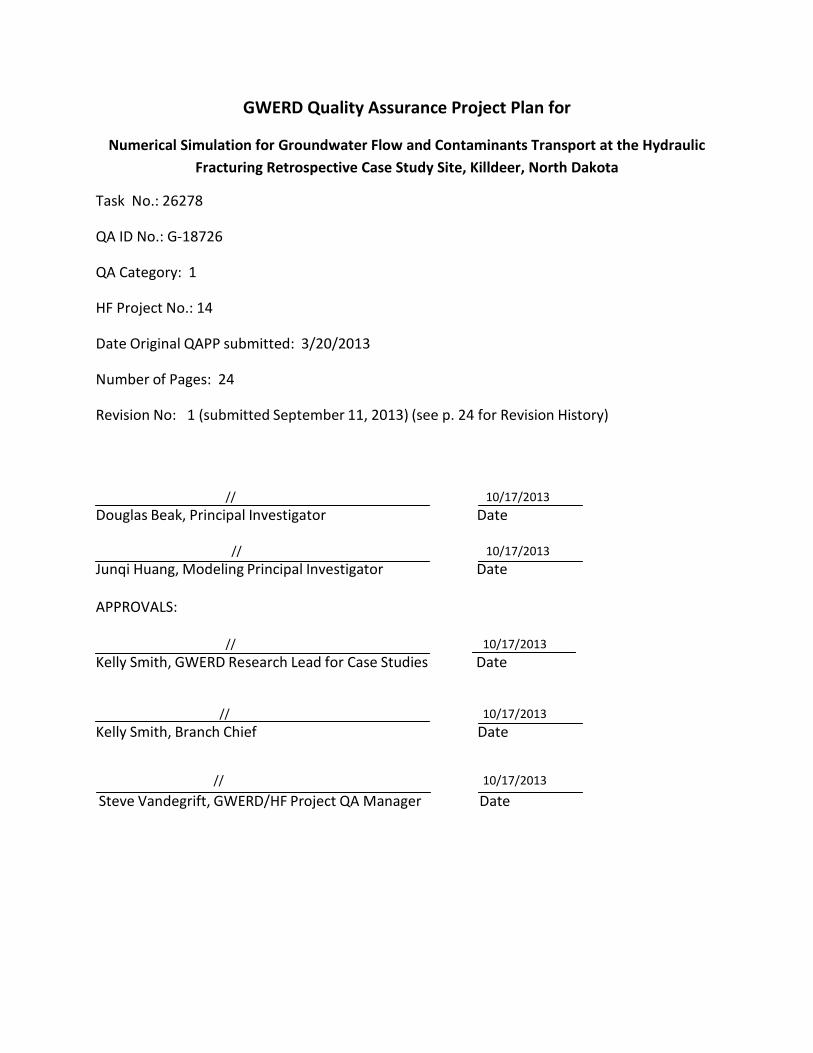
GWERD Quality Assurance Project Plan for
Numerical Simulation for Groundwater Flow and Contaminants Transport at the Hydraulic
Fracturing Retrospective Case Study Site, Killdeer, North Dakota
Task No.: 26278
QA ID No.: G-18726
QA Category: 1
HF Project No.: 14
Date Original QAPP submitted: 3/20/2013
Number of Pages: 24
Revision No: 1 (submitted September 11, 2013) (see p. 24 for Revision History)
// 10/17/2013 Douglas Beak, Principal Investigator Date
// 10/17/2013 Junqi Huang, Modeling Principal Investigator Date
APPROVALS:
// 10/17/2013 Kelly Smith, GWERD Research Lead for Case Studies Date
// 10/17/2013 Kelly Smith, Branch Chief Date
// 10/17/2013
Steve Vandegrift, GWERD/HF Project QA Manager Date

Disclaimer�
EPA does not consider this internal planning document an official Agency dissemination of
information under the Agency's Information Quality Guidelines, because it is not being used to
formulate or support a regulation or guidance; or to represent a final Agency decision or
position. This planning document describes the overall quality assurance approach that will be
used during the research study. Mention of trade names or commercial products in this
planning document does not constitute endorsement or recommendation for use.
The EPA Quality System and the HF Research Study
EPA requires that all data collected for the characterization of environmental processes and
conditions are of the appropriate type and quality for their intended use. This is accomplished
through an Agency-wide quality system for environmental data. Components of the EPA
quality system can be found at http://www.epa.gov/quality/. EPA policy is based on the
national consensus standard ANSI/ASQ E4-2004 Quality Systems for Environmental Data and
Technology Programs: Requirements with Guidance for Use. This standard recommends a
tiered approach that includes the development and use of Quality Management Plans (QMPs).
The organizational units in EPA that generate and/or use environmental data are required to
have Agency-approved QMPs. Programmatic QMPs are also written when program managers
and their QA staff decide a program is of sufficient complexity to benefit from a QMP, as was
done for the study of the potential impacts of hydraulic fracturing (HF) on drinking water
resources. The HF QMP describes the program’s organizational structure, defines and assigns
quality assurance (QA) and quality control (QC) responsibilities, and describes the processes
and procedures used to plan, implement and assess the effectiveness of the quality system.
The HF QMP is then supported by project-specific QA project plans (QAPPs). The QAPPs
provide the technical details and associated QA/QC procedures for the research projects that
address questions posed by EPA about the HF water cycle and as described in the Plan to Study
the Potential Impacts of Hydraulic Fracturing on Drinking Water Resources (EPA/600/R-
11/122/November 2011/www.epa.gov/hydraulic fracturing). The results of the research
projects will provide the foundation for EPA’s 2014 study report.
This QAPP provides information concerning the Chemical Mixing and Well Injection stages of
the HF water cycle as found in Figure 1 of the HF QMP and as described in the HF Study Plan.
Appendix A of the HF QMP includes the links between the HF Study Plan questions and those
QAPPs available at the time the HF QMP was published.
Revision No. 1
September 11, 2013
Page 2 of 24

Table of Contents�Project Management …………………………………………………………………………………….. 1
Title and Approval Sheet ……………………………………………………………………………….. 1
Table of Contents ………………………………………………………………………………………….. 3
Distribution List …………………………………………………………………………………………….. 4
Project / Task Organization ………………………………………………….……………………….. 5
Problem Definition / Background ………………………………………………………………….. 6
Project/Task Description and Schedule ………………………………..……………………….. 8
Quality Objectives and Criteria for Model Inputs/Outputs …..……………………….. 12
Special Training Requirements / Certification ……………………………………………….. 16
Documents and Records ……………………………………………………………………………….. 16
Measurement and Data Acquisition …………………………………….……………………….. 17
Data Management and Hardware/Software Configuration …..………………………. 19
Assessment and Oversight …………………………………………………….………………………. 20
Data Validation and Usability ………………………………………………..………………………. 21
References …………………………………………………………………………….………………………. 21
QAPP revision history…………….……………………………………………….……………………… 24
Revision No. 1September 11, 2013Page 3 of 24
Distribution List
The following individuals will be provided copies of the approved QA Project Plan.
Douglas Beak, GWERD/NRMRL/ORD/EPA, Ada, OK
Junqi Huang, GWERD/NRMRL/ORD/EPA, Ada, OK
Steve Vandegrift, GWERD/NRMRL/ORD/EPA, Ada, OK
Kelly Smith, GWERD/NRMRL/ORD/EPA, Ada, OK
Steve Acree, GWERD/NRMRL/ORD/EPA, Ada, OK
Randall Ross, GWERD/NRMRL/ORD/EPA, Ada, OK
Gregory Oberley, EPA Region VIII
Revision No. 1
September 11, 2013
Page 4 of 24

Project / Task Organization�
Kelly Smith, GWERD. Ms. Smith is the GWERD Research Lead for case studies, replacing Dr.
David Jewett. She is also assisting in the coordination of the Hydraulic Fracturing Case
Studies with EPA NRMRL management and other parts of EPA ORD and EPA Offices. In
addition, Ms. Smith is responsible for review and approval of QAPP, and review of draft
deliverables.
Steve Vandegrift, GWERD, Quality Assurance Manager, responsible for QA review and approval
of QAPP and final report, QA guidance, and management of QA audits.
Douglas Beak, GWERD, Principal Investigator, responsible for ensuring completion of all aspects
of the Hydraulic Fracturing Retrospective Case study in the Bakken Shale, Killdeer, ND. Dr.
Beak will lead the collection, analysis, and interpretation of groundwater and surface water
samples. In addition, he will lead the GWERD efforts to synthesize and incorporate all
aspects of the project into the final report.
Junqi Huang, GWERD, Principal Investigator for the modeling aspects of the Hydraulic
Fracturing Retrospective Case study in the Bakken Shale at the Killdeer, ND location, Dr.
Huang will be responsible for models creation, site data preparation, implementation of
model simulation and analysis of flow and transport and explanation of modeling results.
Steve Acree, GWERD. Mr. Acree is responsible for the testing, survey and acquisition of site
hydrogeological information at the Killdeer site.
Randall Ross, GWERD. Dr. Ross is responsible for the testing, survey and acquisition of site
hydrogeological information at the Killdeer site.
Gregory Oberley, U.S. Environmental Protection Agency – Region VIII, Denver, CO. Mr. Oberley is
responsible for coordinating technical discussion and activities between NRMRL-Ada and EPA Region
VIII and Region VIII Analytical Lab, as well as coordinating data collection activities with the state
officials in North Dakota. He will also assist in ground water sampling. His HAZWOPER certification is
current.
Revision No. 1
September 11, 2013
Page 5 of 24

und
ht reservoirs has grown rapidly over the last few years
sses
to support flow
s provided by a number of
lop a new system of
ubstantial increase in
e fracturing process could create or extend
ng aquifer
hes
undwater resources
vestigating the potential impacts of HF on groundwater
five selected sites. One
The study
rea surrounding Killdeer is currently experiencing renewed oil
horizontal drilling technology and hydraulic fracturing is being
oduction
n Basin and Bakken shale d
curred near
y Denbury) (Figures
fracturing
g of approximately
surface. At this time it is suspected that hydraulic fracturing
the subsurface because the surface casing was compromised at
Problem Definition and Backgr
duction from ti w years
Enhanced oil/gas recovery proc ause
permeability is too lo n conditions.
enhancement/stimulation (HF) methods,
all of which are designed to dev rease
This HF has been
t ctures linking
the producing zone to an overly y for gas
fracturing fluids to migrate into igration
gr
ase studies i ndwater
resources were implemented at akk
Dunn County, near Killdeer, ND. illiston Basin
The ng renewed oil
and natural gas exploration usin acturing is being
p
Willist
hydraulic fracturing incident o re the oil well
20SWH, operated olled blow out
stage of a 23 stag rmediate casing
burst. This resulted in the spilli s) of hydraulic
fracturing fluids and oil on to th ulic fracturing
and oil were released into compromised at
duction from tight reservoirs has grown rapidly over the last f
stimulation be
conventional producti
hydraulic fracturing
artificial fractures that in
gas production from
fr
provide a pathw
. The potential for contaminant
ase studies investigating the potential impacts of HF on gro
in the
The area surrounding Killdeer is currently experienc
and natural gas exploration using horizontal drilling technology and hydraulic f
September, 2010, wh
) experienced an uncont
operation when the seven inch int
gallo
fracturing fluids and oil on to the surface. At this time it is suspected that hydr
and oil were released into the subsurface because the surface casing was
Problem Definition and Backgro ound�
Hydrocarbon production from tigght reservoirs has grown rapidly over the last fe ew years.
Enhanced oil/gas recovery proce esses require well and reservoir stimulation bec cause the
formation permeability is too low w to support flow under conventional productio on conditions.
Such enhancement/stimulation iis provided by a number of hydraulic fracturing (HF) methods,
all of which are designed to deve elop a new system of artificial fractures that inc crease the
mobility of reservoir fluids. This ssubstantial increase in oil/gas production from HF has been
accompanied by concerns that thhe fracturing process could create or extend fra actures linking
the producing zone to an overlyi ing aquifer. This in turn could provide a pathwa ay for gas or
fracturing fluids to migrate into tthese aquifers. The potential for contaminant m migration could
result in pollution of potable gro oundwater resources.
The retrospective case studies in nvestigating the potential impacts of HF on grou undwater
resources were implemented at five selected sites. One of these sites is in the B Bakken Shale in
Dunn County, near Killdeer, ND. The study area is situated near the center of WWilliston Basin
(Murphy, 2001) (Figure 1). The a area surrounding Killdeer is currently experienci ing renewed oil
and natural gas exploration usingg horizontal drilling technology and hydraulic fr racturing is being
employed to stimulate oil/gas pr roduction.
Figure 1, Willisto on Basin and Bakken shale distribution (From USGS)
A hydraulic fracturing incident occcurred near Killdeer on September, 2010, whe ere the oil well
(Franchuk 44-20SWH, operated bby Denbury) (Figures 2) experienced an uncontrrolled blow out
during the 5th
stage of a 23 stage e fracturing operation when the seven inch inte ermediate casing
burst. This resulted in the spillin ng of approximately 2553 barrels (107,276 gallonns) of hydraulic
fracturing fluids and oil on to the e surface. At this time it is suspected that hydra aulic fracturing
fluids and oil were released into the subsurface because the surface casing was compromised at
Revision No. 1
September 11, 2013
Page 6 of 24

38.5 ft below land surface and there is still a question about whether the conductor casing was
compromised at 60 ft below land surface. During the clean up process approximately 2300
(96,600 gallons) barrels of water and 253 barrels (10626 gallons) of oil were recovered. To date
it is unknown if groundwater contamination occurred and what the extent of the groundwater
contamination might have been. The Franchuk well is just outside the City of Killdeers
Municipal Water Supply Wells, well head protection zone (~2.5 miles). In addition, there are
several farm wells in the vicinity of the Franchuk well and supply wells for drilling and hydraulic
fracturing activities is approximately 0.5 miles down gradient of the Franchuk well (Figure 2).
Figure 2, Aerial view of the Franchuk 44-20SWH well and surrounding area (From Doug Beak
et al, Quality Assurance Project Plan for Hydraulic Fracturing Retrospective Case Study,
Bakken Shale, Killdeer and Dunn County, ND, 2011).
The objective of this modeling study is listed below.
Primary Objective: Carry out numerical simulation to investigate the flow pattern of
groundwater and evaluate the fate and transport of contaminants in the study area. The
modeling will be conducted in conjunction with the retrospective case study in this area.
The specific tasks of the modeling study include:
Revision No. 1
September 11, 2013
Page 7 of 24

Task 1: Establish the stratigraphic model.
Task 2: Delineate spatial distribution of the shallow aquifer system including the Killdeer Aquiferand the Sentinel Butte Aquifer in the study area.
Task 3: Create groundwater flow model.
Task 4: Investigate flow pattern of groundwater in the aquifer system.
Task 5: Create the fate and transport model.
Task 6: Simulate the fate and transport of the contaminants under the mass loading conditions
associated with the incident of the hydraulic fracturing activities.
Project/Task Description and Schedule
To accomplish the primary objective, the work is organized into five tasks as follows:
Task 1: Establish the stratigraphic model.
The model domain is selected to cover a geological unit for which the hydrogeological
boundaries could be adequately determined. The model domain is bounded on the north by
the Little Missouri River, on the east by an artificial boundary, on the south by the Knife River,
and on the west by the Killdeer Mountains Range; totally encompass an area of 493 square
miles (1277 square kilometers), as shown in figure 3.
Figure 3, the extent of modeling area which is bounded on the north by the Little
Missouri River, on the east by an artificial boundary, on the south by the Knife River, and
on the west by the Killdeer Mountains Range.
Revision No. 1
September 11, 2013
Page 8 of 24

The stratigraphic model will be developed through a combination of data sources including
products and data from USGS Earth Resources Observation and Science Center, North Dakota
oil and gas layers information from North Dakota Industrial Commission, Department of
Mineral Resources, Oil and Gas Division, Data reported from the project: Williston and Powder
River Basins Groundwater Availability Study by USGS, and hydrogeological information explored
from the case study. The model will refine the understanding of the stratigraphy of the study
area through the analysis, integration and interpretation of: (1) borehole data acquired from
the information source (existing oil/gas wells and water wells); (2) geospatial data set for
geologic structural frameworks created by USGS. The stratigraphic data from all of the various
data sources will be used to assess three-dimensional interpolation and modeling techniques
for investigating subsurface stratigraphy and alluvial architecture. With the support by GIS
(geographic information systems), a static three-dimensional model will be produced using
these data sets that will cover the entire study region.
Task Duration: From the beginning of the project to 7/31/2013
Task 2: Delineate spatial distribution of the shallow aquifer system including the Killdeer Aquifer
and the Sentinel Butte Aquifer in the study area.
Based on the framework from task 1, this task aims to investigate the shallow and deeper
section to delineate the groundwater aquifers. According to the report of ground-water
resources of Dunn County, North Dakota (Klausing, 1979), two main aquifers, including the
Killdeer Aquifer and the underlying Sentinel Butte water yielding formation, are potentially hydraulically
linked to the HF fluids releasing site. The subsurface would be dissected and generalized to provide
the geologic section and aquifer characteristics of geologic units in the study area. Two main
water-yield formations would be delineate with digital map. The basic hydrogeological features,
including the boundaries of aquifer system, the top and bottom elevation of the formations,
rock properties and hydraulic conductivities will be digitally available. This model may serve as
the basis for creating more detailed flow and transport model.
Task Duration: From 8/1/2013 to 8/15/2013.
Task 3: Create groundwater flow.
This task creates a three-dimensional groundwater flow model using the data explored from
Task 1, Task 2 and the case study. The model domain encompasses an area depicted in Figure 3,
vertically including all aquifers from the ground surface to the bottom of the Sentinel Butte
formation. The model boundaries are chosen to coincide with specific hydrological features that
provide physical boundary conditions. On the north and south, the Little Missouri River and the
Knife River may provide a suitable model boundary where the constant water heads are given
to represent the river stage. On the west, the Killdeer mountain range acts as the groundwater
flow divides where no-flow conditions are assumed. On the east edge of mode domain, there is
no physical boundary available in an adequate distance. However, a large number of water
Revision No. 1
September 11, 2013
Page 9 of 24

wells exist along the boundary, which may provide a known water head condition based on
observed multi-year water levels in the wells. The model domain is set in a relatively large area,
spanning about 25 miles (40 kilometers) from the west to the east and 31 miles (50 kilometers)
from the south to the north.
Model Inputs
The simulation of groundwater flow requires a thorough understanding of the hydrogeologic
characteristics of the study area. The basic information used for creation of groundwater flow
model will include the following:
• Extent and thickness of aquifers, confining units, and structural controls.
• Hydrologic boundaries that control the rate and direction of movement of groundwater.
• Hydraulic properties of the aquifers and confining units.
• Initial distribution of hydraulic head throughout the modeled area.
• Distribution of groundwater recharge, pumping, leakage to or from surface water bodies.
Creation of Flow Model
GMS 8.3, (Groundwater Modeling System) will be used to create the flow model. The model
packages will include:
• Basic package, including 3D finite difference grid and layer type setting
• Layer Property Flow
• Wells
• Recharge
• River
• lake
• Observation
Task Duration: From 8/16/2013 to 8/31/2013
Task 4: Investigate flow pattern of groundwater in the aquifer system.
This task focuses on the flow processes in the aquifer system, investigating flow characteristics
of groundwater under the specific model conditions such as precipitation, evapotranspiration,
water extraction from wells, and interaction of groundwater and surface water, as well as water
loading from the location where the hydraulic fracturing incident occurred. The simulations are
intended to:
• Understand system dynamics to identify and quantify controlling and significantprocesses.
• Predict a future change or impact in response to the intense recharge of HF fluids.
• Evaluate sensitivity of the system to model uncertainty and/or magnitude of stresses.
• Identify capture zones or source protection areas.
Revision No. 1
September 11, 2013
Page 10 of 24

• Characterize preferential flow of groundwater that is potentially connected with HFfluids releasing site.
Task Duration: From 8/17/2013 to 9/30/2013
Task 5: Create the fate and transport model.
This task creates a three-dimensional groundwater transport model using the data gained from
the flow model. The model focuses on the basic characteristics of the transport around the
incident site. The model domain is selected to cover the area of the flow model. The location of
the contamination source (Franchuk 44-20SWH well) is approximately located at the center of the
area. The zero concentration boundary condition for the transport model could be reasonably accepted
for such space scale. To capture the characteristics of rapidly varying fluid fronts in a full field model, the
model grid will be refined around the well Franchuk 44-20SWH.
Model Inputs
The simulation of the contaminants transport requires successful modeling of the groundwater
flow in the study area. Model inputs will include:
• Spatial distribution of groundwater heads and velocity determined by a calibratedgroundwater flow model.
• Boundary conditions for the concentration of contaminants.
• Initial distribution of the contaminants.
• Location, history and mass loading rate of the contaminants.
• Effective porosity.
• Soil bulk density.
• Adsorption and degradation parameters.
Creation of Transport Model
GMS 8.3, (Groundwater Modeling System) will be used to create the transport model. The
model packages will include:
• Advection
• Dispersion
• Adsorption
• Reaction
• Source and Sink
• Observation
A specific work in this task is to develop the user-defined reaction package that can be
integrated into RT3D. The decay chain of two species (tBuOOH and TBA) will be involved in
the model. The reaction equation system is described as:
dC ktBuOOH tBuOOh = − CtBuOOH dt RtBuOOH
Revision No. 1
September 11, 2013
Page 11 of 24

dC k w kTBA tBuOOh TBA TBA = C − CtBuOOH TBA dt R w RTBA tBuOOH TBA
Where, C is the concentration of species [mg/L]; k is the first order decay constant [1/day];
R is the retardation factor associated with the adsorption of species; w is the molecular
weight; the subscript tBuOOH and TBA respectively indicates tert-Butyl hydroperoxide and
tert-Butyl alcohol, the indicator compounds. The reaction model will be coded in FORTRAN
and tested under Intel Visual Fortran development environment with a small scale test
model, and then integrated into RT3D as the user-defined reaction package.
Task Duration: From 10/1/2013 to 10/15/2013
Task 6: Simulate the fate and transport of the contaminants under the mass loading conditions
associated with the incident of the hydraulic fracturing activities.
Based on the results of flow modeling, this task will implement the fate and transport models to
simulate the movement and chemical change of contaminants as they move with groundwater
through the subsurface. The contaminants will include the following indicator compounds that
are used to detect the possible presence of HF fluids in the aquifer:
• tert-Butyl hydroperoxide (tBuOOH), as the parent species
• tert-Butyl alcohol (TBA), as the daughter products of the decaying contaminants
Fate and transport models require the development of a calibrated groundwater flow model
that is based on field data. The model simulates the following:
• Movement of contaminants by advection and diffusion
• Removal or release of contaminants by sorption or desorption
• Decay of the contaminants, tBuOOH → TBA
Task Duration: From 10/16/2013 to 11/15/2013
Quality Objectives and Criteria for Model Inputs/Outputs
In this project the quality objectives are:
• To obtain data to support modeling studies that are of known quality
• To document the correct application of data interpretation and analysis methods
• To document steps in model development
• To ensure the consistency of model input and outputs
• To assess uncertainty in the model results
• To retain records that document the activities of the project
Acceptance criteria: the site hydrogeological and environmental data will be acquired from the
case study, from The National Geologic Map Database of USGS, from published peer-reviewed
Revision No. 1
September 11, 2013
Page 12 of 24

journal papers, federal agency reports, and state agency-accepted data. The quality of data
acquired from the case study will have been evaluated as part of the project (Hydraulic
Fracturing Retrospective Case Study, Bakken Shale, Killdeer and Dunn County, ND, TASK No.
26278, QA ID No. G-16094). Data acquired from the case study is expected to include: water
heads at existing wells, measured concentration of target contaminants at monitoring wells,
and locations of HF wells.
Performance criteria: The concept of target population is applied to measurements, estimates,
or predictions of quantities of environmental concern (USEPA 2006, Section 4.1). In this case,
the predicted quantities will be the predicted spatial distributions of (a) water heads, (b)
groundwater velocities, (c) flow path of tracking particles, (d) characteristics of captured zones,
and (e) concentration of compounds of HF fluids. The performance criterion for these
predictions will be their consistency with the input data. The uncertainty of predicted values
will be assessed by sensitivity studies in which input data will be varied through ranges consistent with the uncertainty of the input data.
Selection of modeling tools: GMS (Groundwater Modeling System) will be employed to build
the numerical models. GMS is a complete program for building and simulating groundwater
models. It features 2D and 3D geostatistics, stratigraphic modeling and a unique conceptual
model approach. GMS fully supports MODFLOW2005 (Harbaugh, 2005) and RT3D (Clement,
1997). MODFLOW2005 will be used as the simulator to model flow in the aquifer system.
MODFLOW2005 is popular model in ground water community, which is commonly used for
simulating flow in subsurface environment. MODFLOW2005 can model three-dimensional
ground flow process and involve most hydrogeological features and conditions that naturally
occur. The model consists of modules which correspond to specific hydrogeological features
and can be easily assembled. The model is of deterministic characteristics; giving the
parameters, such as hydraulic conductivity, geometric domain and other definition conditions,
the model outputs hydraulic head and flux in model cells. The model provides several available
solvers (algorithm for solving matrix equations), including pre-conditioned conjugate gradient
method (PCG) (Hills, 1990), strong implicit procedure (SIP) (Weinstein, Stone, and Kwan, 1969),
and direct solver (DE4) (Harbaugh, 1995). Depending on the computer resources available,
space grid can be refined to capture geological heterogeneity. RT3D will be used to model the
transport of compounds of HF fluids in groundwater. RT3D is a three-dimensional transport
simulator that accounts for many build-in and user-defined reaction packages. RT3D models the
migration of contaminants in the flow field simulated by MODFLOW2005. RT3D solves the
convection-dispersion equations, the time step automatically determined in accordance with
the stability condition. RT3D is also a modular model. The main input parameters include:
porosity, dispersivity, and reaction-related parameters.
A specific reason for selecting RT3D is that the user-defined reaction package is available and
supported by RT3D. The reaction package can be developed by users based on the specific
reaction process occur in Killdeer site. In the study area, the contaminants include two species
Revision No. 1
September 11, 2013
Page 13 of 24

which form a decay chain (tBuOOH → TBA). The fate and transport of the decay chain can be fully
simulated by RT3D.
Availability of model tools: MODFLOW2005 and RT3D both are public domain sources. There
are no specific requirements for application of the selected models. MODFOW2005 and RT3D
are both written in FORTRAN and can be compiled and executed under Windows environment.
MODFLOW2005 and RT3D are both fully supported by GMS (Ground water Modeling System),
in which pre- and post-treatment tools are adequately provided. In addition, GMS is developed
and sponsored by DoD (Department of Defense) and freely available for EPA.
Analysis of uncertainty: Any numerical model is of uncertainties, including uncertainties of
input and uncertainties of model results. The uncertainties will be assessed by sensitivity
analyses in which the important input parameters will be varied and their effects investigated.
All significant input data that can reasonably be expected to affect the results will be varied
through a range of expected or typical values. The OAAT (one-at-a-time) method will be used
for the analysis, i.e. one variable will be varied and others held constant when evaluating the
model.
Conceptual model: The conceptual model is described in Figure 4. Flow and transport in three-
dimensional space will be simulated. The key processes to be simulated in the models are fluid
flow in aquifer system, advection, dispersion, mass loading and dissolution of contaminants
(compounds of HF fluids) in groundwater.
Figure 4, Conceptual model of study area
Revision No. 1
September 11, 2013
Page 14 of 24

Characteristics of subsurface are the stratigraphy, properties of various rock layers (e.g.
porosity, density, hydraulic conductivity, dispersivity, and adsorption and degradation
parameters). The subsurface environment (flow status and contaminants concentration)
change as a result of water extraction and releasing of composites of HF fluids, and these
changes must be incorporated in the models.
The final project report will explicitly state and justify all assumptions used to the models. The
assumptions that are specific to this work are: 1) groundwater flow and transport in saturated
zones, 2) flow model has the constant water head boundary conditions along the northern,
eastern and southern boundaries, and no-flux boundary condition along the western boundary,
3) contaminants are treated as a solute, 4) reaction includes adsorption and natural
attenuation; adsorption complies with the equilibrium linear isotherm and natural attenuation
is described by first-order decay process.
Input data required for these simulations will be obtained from the case study (Hydraulic
Fracturing Retrospective Case Study, Bakken Shale, Killdeer and Dunn County, ND) and the
technical literatures. Table 1 lists the parameters and their availability.
Table 1, Data and parameters for flow and transport modeling
Data/Parameters Availability
Geographic coordinates of study area National map viewer, downloadable from
http://nmviewogc.cr.usgs.gov/viewer.htm
Area of model domain 25 miles by 31 miles centered at the Killdeer site
Information of oil/gas wells
Database of API, Database of North Dakota
Industrial Commission, Department of Mineral
Resources, Oil and Gas Division
Information of water wells
National Water Information System (NWIS)
groundwater database of USGS , the Map and
Data Resources of the State Water Commission,
North Dakota
Water heads in water wells Case study, Map and Data Resources from North
Dakota State Water Commission
Contaminants concentration in monitoring wells Case study
Hydraulic conductivity Literatures, Klausing (1979), Fischer (2013)
Specific storage Literatures, Klausing (1979), Fischer (2013)
Dispersivity Estimation, in accordance with properties of
aquifer materials
Porosity of formations Estimation, in accordance with properties of
aquifer materials
Recharge (precipitation/evapotranspiration) Estimation, The National Water Information
System of USGS
Adsorption parameter estimation based on empirical data
Revision No. 1
September 11, 2013
Page 15 of 24

Degradation parameter estimation based on empirical data
Soil/rock density estimation based on empirical data
It is not expected that all these data have been, or can be, measured in the field. For data not
available from direct measurements, values will be taken from the scientific literature or
assumed and justified based upon values in the literature. Uncertainty of input data will be
justified based upon values in the literature.
Special Training Requirements / Certification
The required qualifications of the members of the project team are:
1) Advanced degree in the field: geophysics, geochemistry, environmental sciences and engineering, or hydrogeology.
2) Experience in numerical computation of hydrogeological problems. 3) Record of peer- reviewed publications.
No special training is necessary other than to the QA requirements of this project.
Documents and Records
To ensure that all personnel identified in project have the current version of the QAPP, email
will be used to distribute electronic copies of the QAPP and record acknowledgment of receipt.
The product of this work will be development and application of the models for flow and
transport of groundwater in the Killdeer site, North Dakota.
This work will be documented in
1)EPA report describing the method and approach, and presenting representative
simulations. This report will provide information on model structure, model data file,
and modeling analysis results.
The following documents will be stored electronically on GWERD computers assigned to the
researchers:
1) Model files created in the course of development of the models, including site
geographic and geological map files.
2) Final GMS project files and input and output files used to generate results.
3) Records documenting planning and communication between project team member.
4) Records documenting in-house review of final report.
All documentation shall provide enough detail to allow for reconstruction of the project
activities. All records will be deliverable in electronic format at the end of the project for
archiving. The record package will include a directory to facilitate location of particular records.
The final project report will contain the following elements:
1) Background and description of the problem2) Development of stratigraphic model
Revision No. 1
September 11, 2013
Page 16 of 24

3) Development of numerical models to simulate groundwater flow
4) Development of numerical models to simulate the contaminants transport
5) Model assumptions, referenced data and estimated data
6) Calibration for groundwater flow model
7) Simulation of flow and transport for specified model scenarios
8) Discussion of simulation results
9) Conclusions and recommendations
Proper document control and distribution procedures
1) Details on document storage
2) Backup plan for records stored electronically
Work will be done on personal computers and backed up automatically on remote servers.
Copies will be maintained of all work documents, including script codes, input files, and output
files necessary for a qualified individual to reproduce the work.
Description of the change control process: Any change to this QAPP will be approved by the
Principal Investigator, case study Technical Lead and EPA QA Manager. The revised QAPP will be
distributed to all participants of this project.
Length of retention periods for each record: All records will be deliverable in electronic format
at the end of the project for archiving. The record package will include a directory to facilitate
location of particular records. Because this is a level 1 QA Category project, all project records
require permanent retention per the Agency Records Schedule 501, Applied and Directed
Scientific Research. Records will be stored in Dr. Huang’s office in the GWERD until they are
transferred to GWERD’s Records Storage Room. At some point in the future, records will be
transferred to a National Archive facility. In addition, records shall be moved to the HF project
O: drive when work is completed.
Data assessment reports, interim project progress reports: Interim project progress reports will
be submitted to the case study Technical Lead as requested by the EPA project manager.
Model science formulation report, peer review reports: The model science formulation will be
documented in the final project report which will be peer-reviewed.
Measurement and Data Acquisition
Sampling Process Design:This project includes no sampling. This section is not applicable.
Sampling Methods:This project includes no sampling. This section is not applicable.
Sample Handling and Custody:This project includes no sampling. This section is not applicable.
Analytical Methods:This project includes no analysis of samples. This section is not applicable.Revision No. 1September 11, 2013Page 17 of 24

Quality Control:This project includes no direct measurement or data acquisition. This section is not applicable.
Instrument/Equipment Testing, Inspection, and Maintenance:This project will use no measurement or test equipment. This section is not applicable.
Model Calibration:Calibration is the process of modifying the input parameters to a groundwater model until theoutput from the model matches an observed set of data. The tool of automated parameterestimation (Doherty J. and Hunt R. J., 2010) provided in GMS 8.3 (MODFLOW PES) will be usedto assist in the process of calibrating the flow model. The trial and error method (Neuman,1973, 1982; Yeh, 1988; Brooks et al., 1994; Rama Rao et al., 1995; Sun et al., 1995) will be usedto calibrate the fate and transport model.
As an optional approach used to calibrate the flow model, a parallel genetic algorithm will bedeveloped based on the microGA [Carroll, 1996]. The approach will integrate parallel GA andMODFLOW2005 into an optimizer running under parallel computation environment supportedby Environmental Modeling and Visualization Laboratory of EPA. The model domain will bedivided into 13 zones for hydraulic conductivity and 14 zones for recharge rate in accordancewith the local geological sediment environment. In total, 27 model parameters will beestimated by fitting the water head observations. Several subroutines are required to set modelparameters and extract water head. The subroutines will be coded in FORTRAN and integratedinto MODFLOW2005. The modified MODFLOW2005 will then be called by parallel GA tominimize the objective function.
Calibration Criterion for flow model:
The flow model will be calibrated to the steady-state conditions. The criterion proposed in thecalibration of flow model is to minimize the water head error residual term. When computedwater heads are imported, the residual errors can be calculated as (objective function):
Fobj = 1 ∑
N
(Hi − hi )2
N i=1
where, Hi and hi are respectively the observed and computed water heads at monitoring well i , N is
the total number of observation points. The objective function depends on the model parameters. In
the calibration, the model parameters include hydraulic conductivities defined in number of model
parameter zones. The model parameter zones will be divided based on the surficial geology (Killdeer
aquifer) and shallow geology (Sentinel Butte Formation). The optimized hydraulic conductivities will be
used to simulate the flow and transport in the aquifer system.
Calibration Criterion for fate and transport:
The criterion proposed in the calibration of fate and transport model is to minimize the
contaminants concentration error residual term. When computed concentrations are imported, the
residual errors can be calculated as (objective function):
Revision No. 1
September 11, 2013
Page 18 of 24

∑∑ = =
−= M
j
N
i jijiobj tctC
NM T
1 1
2))()((1
where, Ci and ci are respectively the observed and computed concentration at observation point i , t j
is the observed time point, N is the total number of observation points, M the total number of time
series records at the observation point. The objective function depends on the hydrodynamic
dispersivities and adsorption and decay constants defined in the parameters zones. The fate and
transport model will be calibrated by manually adjusting the model parameters to fit the observation
data.
Inspection/Acceptance of Supplies and Consumables:This project will use no supplies or consumables. This section is not applicable.
Non-Direct Measurements (Data Acquisition Requirements):The case study has completed acquiring data, in another project (Hydraulic FracturingRetrospective Case Study, Bakken Shale, Killdeer and Dunn County, ND). Input data for themodels will be acquired from the case study and from scientific literature. This project will notuse any measuring or test equipment.
Data Management and Hardware/Software Configuration
The following data (including script codes and input and output files) will be managed by this
project:
1) DATA
Environmental and process data will be acquired from the case study or from the scientific
literature as described earlier. The quality of data from the case study has been evaluated as
part of another project (Hydraulic Fracturing Retrospective Case Study, Bakken Shale, Killdeer
and Dunn County, ND). Data quality from both these sources will be accepted for use on this
project as described in section on Data Validation. Accurate transcription of these data into
input files will be verified by line-by-line hand checking (direct comparison of input files with
the source data).
2) SOFTWARE
Simulators, MODFLOW2005 and RT3D both are highly credible sources. Code verification is
unnecessary. Both simulators are supported by GMS (Groundwater Modeling System). The
project files of GMS will be archived and documented in the project reports. GIS (Geographic
Information System) will be used to manage ground surface elevation, water wells location and
hydrological features of the study area. The data set is exported to the format compatible with
GMS. The scripts of MATLAB will be used to reformat data downloaded from the data sources,
the scripts also will be used to verify the correctness of the data set.
Revision No. 1
September 11, 2013
Page 19 of 24

Assessment and Oversight
1) Assessments and Response ActionsPlans for science and product peer review: The final project report will be peer reviewed.
Audit: A Technical Systems Audit will be conducted by a QA support contractor with oversightby the EPA QA Manager, early enough in the project to allow for identification and correction ofany issues that may affect data quality. Detailed checklists, based on the procedures andrequirements specified in this QAPP will be prepared and used during the audit.
Assessors do not have stop work authority; however, they can advise the PI if a stop work orderis needed in situations where data quality may be significantly impacted, or for safety reasons.The PI makes the final determination as to whether or not to issue a stop work order.
For assessments that identify deficiencies requiring corrective action, the audited party mustprovide a written response to each Finding and Observation to the QA Manager, which shallinclude a plan for corrective action and a schedule. The PI is responsible for ensuring that auditfindings are resolved. The QA Manager will review the written response to determine theirappropriateness. If the audited party is other than the PI, then the PI shall also review andconcur with the corrective actions. The QA Manager will track implementation and completionof corrective actions. After all corrective actions have been implemented and confirmed to becompleted, the QA Manager shall send documentation to the PI and his supervisor that theaudit is closed. Audit reports and responses shall be maintained by the PI in the project file andthe QA Manager in the QA files, including QLOG.
At the conclusion of a TSA, a debriefing shall be held between the auditor and the PI or auditedparty to discuss the assessment results. Assessment results will be documented in reports tothe PI, the PIs first-line manager, and the Technical Research Lead. If any serious problems areidentified that require immediate action, the QAM will verbally convey these problems at thetime of the audit to the PI.
The PI is responsible for responding to the reports as well as ensuring that corrective actionsare implemented in a timely manner to ensure that quality impacts to project results areminimal.
2) Reports to ManagementQuarterly progress reports and a final report will be submitted to the GWERD Research Lead,Ms. Smith and the principal Investigator Dr. Douglas Beak.
All final audit reports shall be sent to the first-line manager of the PI, the Technical ResearchLead, and copied to the PI. Audit reports will be prepared by the QA Manager with input fromthe QA support contractor where audit performance was delegated. Specific actions will beidentified in the reports.
Revision No. 1
September 11, 2013
Page 20 of 24

Data Validation and Usability
1) Data Validation
Environmental and hydrogeological data will be acquired from the case study or from the
scientific literature. Attributes to be considered for acceptance will include whether the data
were collected: (1) using standard methods, (2) according to approved procedures, and (3)
under a QA program.
2) Validation methods
Model compounds such as three-dimensional stratigraphic model, model package options and
model boundaries assignment will be validated by technical review. To a great extent, the
theory and mathematical and numerical procedures used in these simulators have already been
validated by technical review, peer review, and acceptance by the scientific community.
Outputs of simulations are not guarantees but are reasonable expectations, based upon the
quality of input data, and uncertainty estimated from sensitivity of outputs to uncertainty of
inputs. Limitations on the use of outputs of simulations will be discussed in the reports.
The scripts of MATLAB will be used to check the reasonability of data sets: borehole screen
elevations will be checked to confirm that the vertical coordinates are higher than that of the
borehole bottom and bed rock surface elevations are not larger than the ground surface
elevation. Data identified with this check will prompt further review and if confirmed, this data
will not be used. GIS mapping will be used to check the location of water wells. The spatial
coordinates of wells should be bounded by the study area. Well locations identified to be
outside the study area will not be used.
3) Reconciliation with User Requirements
The project final reports will describe and justify any deviations from this plan, and will include
discussion of assumptions and results, and will discuss limitations of the use of output data for
users of the report.
References
Anderson, F. J., C. B. Gudmunsen and E. L. Kadrmas, 2010, Field screening for shallow gas in
Dunn County, North Dakota, North Dakota Geological Survey, North Dakota Industrial
Commission, Dept. of Mineral Resources.
Brooks, R. J., Lerner, D. N., and Tobias, A. M., 1994, Determining the range of predictions of
a groundwater model which arises from alternative calibrations, Wat. Resour. Res., 30,
2993:3000.
Carroll, D. L. (1996), Chemical laser modeling with genetic algorithms, Am. Inst. Aeronaut.
Astronaut. J., 34(2), 338–346.
Douglas Beak, 2011, Gwerd Quality Assurance Project Plan for Hydraulic Fracturing Retrospective Case
Study, Bakken Shale, Killdeer and Dunn County, ND, Task Number 26278, QA ID Number G-
Revision No. 1
September 11, 2013
Page 21 of 24

16094, U.S. Environmental Protection Agency, Office of Research and Development, National Risk
Management Research Laboratory, Robert S. Kerr Environmental Research Center, Ada, OK.
Clement, T.P., 1997, RT3D - A modular computer code for simulating reactive multi-species
transport in 3-dimensional groundwater aquifers. PNNL-SA-28967. Richland, Washington:
Pacific Northwest National Laboratory.
Doherty, J., and Hunt, R.J., 2010, Approaches to Highly Parameterized Inversion: A Guide to
Using PEST for Groundwater-Model Calibration: U.S. Geological Survey Scientific
Investigations Report 2010-5169, 60 p.
Fischer, Kimberly, 2013, Groundwater Flow Model Inversion to Assess Water Availability in the
Fox Hills-Hell Creek Aquifer, ND Water Resource Investigation No. 54 North Dakota State
Water Commission.
Harbaugh, A.W., 2005, MODFLOW-2005, The U.S. Geological Survey modular ground-water
model—the Ground-Water Flow Process: U.S. Geological Survey Techniques and Methods
6-A16, variously p.
Hill, Mary C., 1990, Preconditioned Conjugate-Gradient 2 (Pcg2), A Computer Program for
Solving Ground-Water Flow Equations, U.S. Geological Survey, Water-Resources
Investigations Report 90-4048.
Klausing, Robert L., 1979. Ground-Water Resources of Dunn County, North Dakota. Report
prepared by the U.S. Geological survey for the North Dakota Geological Survey, North
Dakota State Water Commission and Dunn County Water Management District. Bismarck,
North Dakota.
Murphy, Edward C., 2001, Geology of Dunn County, North Dakota, BULLETIN 68—PART I, North
Dakota Geological Survey.
Neuman, S. P., 1973, Calibration of distributed parameter groundwater flow models viewed as
a multiple-objective decision process under uncertainty, Wat. Resour. Res., 9, 1006:1021.
Neuman, S. P., 1982, Statistical characterization of aquifer heterogeneities: an overview, in
Narasumhan, T. N. (ed.), Recent Trends in Hydrogeology, Spec. Pap. Geol. Soc. Am., 189,
81:102.
Owen, S.J.; Jones, N.L., and Holland, J.P., 1996, A comprehensive modeling environment for the
simulation of groundwater flow and transport, Engineering with Computers 12 (3–4):
235–242, doi:10.1007/BF01198737.
Rama Rao, B. S., LaVenue, A. M., de Marsily, G., and Marietta, M. G. 1995, Pilot point
methodology for automated calibration of an ensemble of conditionally simulated
transmissivity fields: 1. Theory and computational experiments, Wat. Resour. Res., 31,
475:493.
Revision No. 1
September 11, 2013
Page 22 of 24

Sun, N.Z., Jeng, M.C., and Yeh, W. W.-G., 1995, A proposed geological parameterization method
for parameter identification in three-dimensional groundwater modeling, Wat. Resour.
Res., 31, 89:102.
Weinstein H. G., Stone H. L., Kwan T. V., 1969, Iterative procedure for solution of systems of
parabolic and elliptic equations in three dimensions, Indust. Eng. Chem. Fund., 8 (2), 281–
287.
USEPA, 2006, Guidance on Systematic Planning Using the Data Quality Objectives Process EPA
QA/G-4.
Yeh, W. W.-G., 1988, Experimental design for parameters estimation in groundwater, 1988
Hydraulic Engineering National Conference, Am. Soc. Civ. Eng., Colorado Spring, Colorado.
Revision No. 1
September 11, 2013
Page 23 of 24

Table 2. QAPP revision history.�
Revision
Number
Date Approved Revision
0 5/16/2013 New document
1 9/19/2013 QAPP revised to address Observations from Technical Systems
Audit:
• Task 5: added description of user-defined reaction
package
• Quality Objectives and Criteria for Model
Inputs/Outputs: added justification for using RT3D
• Documents and Records; Assessment and Oversight:
removed peer reviewed journal article as a product
• Measurement and Data Acquisition: added model
calibration using a parallel genetic algorithm
• Data Management and Hardware/Software
Configuration: added information on using GIS to
manage certain information and the use of scripts to
reformat downloaded data and to verify correctness
• Data Validation and Usability: added use of scripts in
MATLAB to check reasonableness of data
• References: added a reference
• Added Revision History Table
Revision No. 1
September 11, 2013
Page 24 of 24