Embed Size (px)
Citation preview

Gulf of Finland Year 2014 opening, January 21, 2014 S.Kondratyev, A.Ershova
Nutrient load estimates in the Russian part of the
Gulf of Finland catchment
Sergey Kondratyev, Alexandra Ershova
Institute of Limnology, RASRussian State Hydrometeorological University
St.Petersburg, Russia

Gulf of Finland Year 2014 opening, January 21, 2014 S.Kondratyev, A.Ershova
Lake Ladoga (1)
2/3 of Narva catchment (2)
Neva immediate catchment (3)
Luga catchment (3)
GoF immediate catchment (3)
(unmonitored)
St.Petersburg (WWTPs)
Main components of nutrient load on GoF from Russia

Gulf of Finland Year 2014 opening, January 21, 2014 S.Kondratyev, A.Ershova
Estimates are based on:
Data for last 5 years (2009-2013) Monitoring data: North-West Hydromet Service, Vodokanal (Luga,
Narva) Longterm observations of Institute of Limnology (Ladoga) Modelling (Neva, Luga) Observations+modelling (2013, GoF imm.catch.)
Work done by IL RAS, RSHU, NLBWA together with SYKE –
contribution to the GoFYear2014

Gulf of Finland Year 2014 opening, January 21, 2014 S.Kondratyev, A.Ershova
Load from Lake Ladoga with Neva River(nutrient budget of Lake Ladoga)
1 – load from catchment, 2 – internal load, 3 – atmospheric deposition, 4 – retention, 5 – outflow
1000 t Ptot/year40100 t Ntot/year

Gulf of Finland Year 2014 opening, January 21, 2014 S.Kondratyev, A.Ershova
Outflow from Lake Chudsko-Pskovskoye and Narva Reservoir with Narva River
Ptot и Ntot discharges in Narva River (Ivangorod)
300 t Рtot /year 6500 t Ntot /year
Gulf of Finland Year 2014 opening, January 21, 2014 S.Kondratyev, A.Ershova
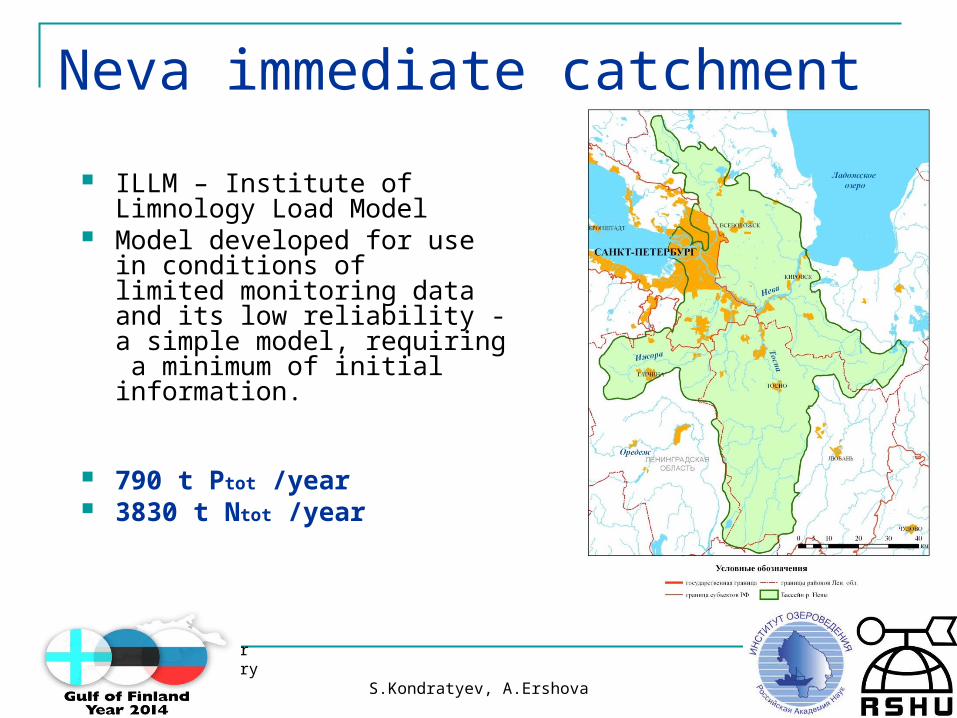
Neva immediate catchment
ILLM – Institute of Limnology Load Model
Model developed for use in conditions of limited monitoring data and its low reliability -a simple model, requiring a minimum of initial information.
790 t Рtot /year 3830 t Ntot /year

Gulf of Finland Year 2014 opening, January 21, 2014 S.Kondratyev, A.Ershova
Luga catchment
Testing of ILLM model in frames of PRIMER project and BaltHazAR II project, Component 2.2
Mean load from Luga catchment Ptot = 310 t/y Ntot = 5240 t/y

Gulf of Finland Year 2014 opening, January 21, 2014 S.Kondratyev, A.Ershova
St.Petersburg (WWTPs)
“Vodokanal”:~550 t P/year~10 000 t N/year

Gulf of Finland Year 2014 opening, January 21, 2014 S.Kondratyev, A.Ershova
GoF immediate catchment (unmonitored)
1 - Peschanaya, 2 - Velikaya, 3 - Chulkovka,4 - Polevaya, 5 – Drema, 6 - Matrosovka, 7 – Gorohovka, 8 – Chernaya__________1877 km2
Southern Catchment – 3903 km2
9 – Strelka, 10 – Shingarka, 11 – Karasta, 12 - Chenaya, 13 - Lebyazhya, 14 – Kovashi, 15 – Volonka, 16 – Sista, 17 – Habolovka_2385 km2
Northern Catchment – 5262 km2
Joint project in 2013: measurements on 17 tributaries of GoF

Gulf of Finland Year 2014 opening, January 21, 2014 S.Kondratyev, A.Ershova
GoF immediate catchment (unmonitored)
Ptot, t/y Ntot, t/y
Measurements 129 2880
Modelling (for the rest part of the catchment)
115 1880
Direct load from point sources
78 272
Total load on GoF 322 5032

Gulf of Finland Year 2014 opening, January 21, 2014 S.Kondratyev, A.Ershova
Load source P tot, t/year N tot, t/year
1 Lake Ladoga 1000 40100
2 Lake Chudskoye (Narva river) 300 6500
3 Neva river imm. catchment 790 3800
4 Luga river catchment 310 5240
5 St.Petersburg 550 10000
6 GoF imm. catchment 320 5030
Total 3270 70670
BSAP recommendations on nutrient maximum allowable input in the GoF: 4860 t P/year и 106680 t N/year
Note: estimated load is formed on app. 75% of the GoF catchment area
Results of present assessment and BSAP recommendations
~79% ~66%

Gulf of Finland Year 2014 opening, January 21, 2014 S.Kondratyev, A.Ershova
Possible ways to reduce nutrient load Diffuse sources: optimization of use of organic
fertilizers
St.Petersburg WWTPs: “Vodokanal” load reduction plan
Point sources: difficult to assess (RusNIP project)

Gulf of Finland Year 2014 opening, January 21, 2014 S.Kondratyev, A.Ershova
Perspectives and recommendations to improve our knowledge Modernization of data collection system: field works
according to SYKE recommendations – every other week each season
Modernization of the mathematical model, development of a determination-stochastic model of nutrient load allowing to get not only mean annual load values but also parameters of a distribution function of nutrient fluxes and loads that is very important for applied calculations and predictions
Use of climatic scenarios for model predictions

Gulf of Finland Year 2014 opening, January 21, 2014 S.Kondratyev, A.Ershova
THANK YOU