Embed Size (px)
Citation preview
Level 19, Tower B, Citadel Towers, 799 Pacific Hwy Chatswood NSW 2067 Australia PO Box 5275 West Chatswood NSW 1515 Australia T +612 9406 1000 F +612 9406 1002 coffey.com
GUJARAT NRE NO.1 COLLIERY MAJOR EXPANSION PART 3A APPLICATION GROUNDWATER ANALYSIS
NSW Department of Planning and Infrastructure
GEOTLCOV24840AA-AB 19 June 2013

Level 19, Tower B, Citadel Towers, 799 Pacific Hwy GEOTLCOV24840AA-AB Chatswood NSW 2067 Australia PO Box 5275 West Chatswood NSW 1515 Australia T +612 9406 1000 F +612 9406 1002 coffey.com
19 June 2013
NSW Department of Planning and Infrastructure Mining and Industry Projects GPO Box 39 Sydney NSW 2001
Attention: Howard Reed
Dear Howard
RE: Gujarat NRE No.1 Colliery Major Expansion
Part 3A Application Groundwater Analysis
Coffey Projects Pty Ltd (Coffey) is pleased to provide the NSW Department of Planning and Infrastructure with our report on Groundwater Analysis for the Gujarat NRE No.1 Colliery Major Expansion Part 3A Application.
We draw your attention to the enclosed sheet entitled “Important Information about your Coffey Report” which should be read in conjunction with this report. Should you have any questions regarding this report please contact the undersigned.
For and on behalf of Coffey Projects Pty Ltd
Paul Tammetta
Associate Subsurface Hydrologist
Distribution: Original held by Coffey Projects Pty Ltd
1 electronic copy to NSW Department of Planning and Infrastructure

CONTENTS
Coffey Geotechnics GEOTLCOV24840AA-AB 19 June 2013
i
1 INTRODUCTION 1
2 BACKGROUND 1
2.1 Proposed Development 1
2.2 Previous Mining 4
2.3 Stakeholder Concerns 4
3 REPORT REVIEW 5
3.1 Data 5
3.1.1 Hydraulic Heads 5
3.1.2 Hydraulic Properties 6
3.1.3 Hydraulic Controls 6
3.1.4 Hydrogeological Conceptual Model 8
3.2 Impact Assessment Method 9
3.2.1 Model Architecture 9
3.2.2 Model Parameters 10
3.2.3 Model Calibration 10
3.2.4 Swamps 11
4 SEPARATE ANALYSIS 12
4.1 Hydraulic Conductivity 12
4.2 Height of the Desaturated Zone above Full Extraction Workings 15
4.2.1 Hydraulic Heads and Previous Mining 17
4.2.2 Predicted Height of the Collapsed Zone 22
4.3 Swamps 26
4.3.1 Potential Impact Mechanisms 26
4.3.2 Observed Impacts on the Swamp Sealing Layer 27
4.3.3 Potential Impacts on the Swamp Substrate 32
4.4 Goaf Salts 32
5 CONCLUSIONS AND RECOMMENDATIONS 34
5.1 Water Courses 34
5.1.1 Cataract Creek 34
5.1.2 Lizard and Wallandoola Creeks 35
5.2 Swamps 36
5.3 Numerical Groundwater Flow Simulation 37
5.3.1 Model Calibration 37
5.3.2 Assessment of Groundwater Exchange with Lake Cataract 38
5.3.3 Time Constraints for the Proponent 38
CONTENTS
Coffey Geotechnics GEOTLCOV24840AA-AB 19 June 2013
ii
5.4 Monitoring 39
5.5 Goaf Salts 39
6 REFERENCES 40
Important Information About Your Coffey Report
Tables
Table 1: Interpretation of groundwater monitoring hydrographs for mining under, or adjacent to, swamps at Angus Place and Dendrobium Coal Mines.
Figures
Figure 1a. Proposed Development in Wonga East.
Figure 1b. Proposed Development in Wonga West.
Figure 2. Hydraulic conductivity measurements from packer tests for strata in the Southern Coalfield, and from the NRE Gujarat No.1 Mine Lease.
Figure 3. Measured pre- and post-mining hydraulic conductivity at a site in Kentucky (data from Hutcheson et al. 2000).
Figure 4. Measured pre- and post-mining hydraulic conductivity at a site in Illinois (data from Booth and Spande, 1992).
Figure 5. Conceptual model for ground deformation above a caved longwall panel (after Tammetta, 2012).
Figure 6. Height of desaturation estimated from the pressure head profile at GW1 for pillar extraction workings at GW1.
Figure 7. Calculated heights of the collapsed zones of previous workings along a cross section in Wonga East.
Figure 8a. Interpreted hydraulic head distribution (broadly representative of early 2012) along the cross section.
Figure 8b. Vertical pressure head profiles (broadly representative of early 2012).
Figure 9. Protrusion of the calculated potential drainage thickness above ground surface for Wonga East
Figure 10. Protrusion of the calculated potential drainage thickness above ground surface for Wonga West
Figure 11. Undermined swamps at Dendrobium and Angus Place collieries.
Figure 12a. Modelled hydrograph for Piezometer 12_01, Swamp 12, Dendrobium Mine.

CONTENTS
Coffey Geotechnics GEOTLCOV24840AA-AB 19 June 2013
iii
Figure 12b. Modelled hydrograph for Piezometer WW1, West Wolgan Swamp, Angus Place Mine.
Figure 13. Hydrographs for Swamp 15b piezometers at Dendrobium Mine (modified from Krogh, 2012).
Figure 14a. Interpreted risk zones for Cataract Creek.
Figure 14b. Interpreted risk zones for Wallandoola and Lizard Creeks.
Figure 15. Model-calculated mine inflows and lake seepage for a typical longwall mining situation in the Southern Coalfield.
Appendices
Appendix A: Logic for Accumulation of Collapsed Zone Heights

Gujarat NRE No.1 Colliery Major Expansion Part 3A Application Groundwater Analysis
Coffey Projects GEOTLCOV24840AA-AB 19 June 2013
1
1 INTRODUCTION
This report presents the results of a review of the groundwater component of the Gujarat NRE No.1 Colliery Major Expansion Part 3A Application. The review (and associated separate analysis of data presented in the application) was conducted by Paul Tammetta of Coffey for the NSW Department of Planning and Infrastructure (DPI). The scope of the review comprised the following:
• Review of the data and hydrogeological conceptual model used by the proponent in assessing impacts on the groundwater system.
• Review of the methods employed in assessing impacts on the groundwater system. Numerical groundwater flow modelling used for impact assessment was also reviewed.
• Where necessary, undertaking separate analyses of the data used by the proponent, and other data, for the purpose of identifying risks posed by the proposed development to drainage courses and swamps. The potential migration of goaf salts to the surface environment is also discussed.
• Development of recommendations to provide more certainty to predictions of impacts, and reduce the risks to the environment.
The subject of the review is the following document, however data are also drawn from other documents (not subjects of the review) in the data analysis phase:
• GeoTerra Pty Ltd. 2012. NRE No.1 Colliery Major Expansion Groundwater Assessment. Report GUJ1-GWR1C, prepared for Gujarat NRE Coking Coal Pty Ltd. November.
2 BACKGROUND
2.1 Proposed Development
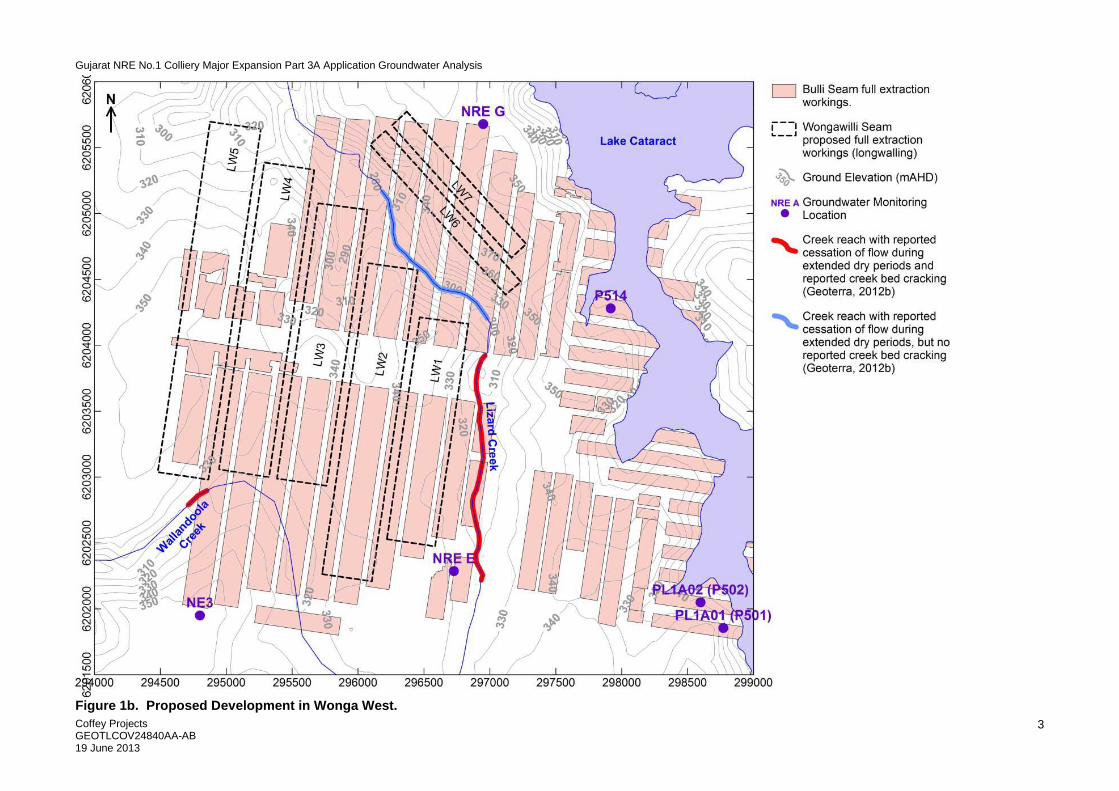
Gujarat NRE Coking Coal Pty Ltd (Gujarat) proposes to mine 11 longwall panels to the southeast of Lake Cataract (Wonga East) and seven longwall panels to the west of Lake Cataract (Wonga West). At Wonga East, three panels of 105m width are to be located southeast of Mt Ousley Road, and 8 panels of 150m width are to be located to the northwest of this road, as shown in Figure 1a. At Wonga West, two panels of 155m width are to be located immediately northeast of Lizard Creek, and five panels with an average width of about 385m are to be located immediately southwest of Lizard Creek, immediately north of Wallandoola Creek, as shown in Figure 1b. All proposed panels will mine the Wongawilli coal seam.
LW4, and part of LW5, has been completed in Wonga East, with a mined height of 3.1m for LW4 (Geoterra, 2012a). SG (2012) reports a mined height of 3.2m for this panel. Mining is currently occurring in LW5, with face advance for all panels in Wonga East to be from west to east. LW8 and LW9 underlie Cataract Creek, which is perennial (Geoterra, 2012b). The average maximum subsidence along the LW4 centreline was measured as 1.33m (SG, 2013). This is about twice the amount predicted for a single seam operation using the database of Holla and Barclay (2000) for the Southern Coalfield.

Gujarat NRE No.1 Colliery Major Expansion Part 3A Application Groundwater Analysis
Coffey Projects GEOTLCOV24840AA-AB 19 June 2013
2
Figure 1a. Proposed Development in Wonga East.
Gujarat NRE No.1 Colliery Major Expansion Part 3A Application Groundwater Analysis
Coffey Projects GEOTLCOV24840AA-AB 19 June 2013
3
Figure 1b. Proposed Development in Wonga West.

Gujarat NRE No.1 Colliery Major Expansion Part 3A Application Groundwater Analysis
Coffey Projects GEOTLCOV24840AA-AB 19 June 2013
4
2.2 Previous Mining
The proposed development underlies previous workings in the Balgownie and Bulli coal seams. The stratigraphic order of the seams (from top to bottom) is the Bulli Seam, Balgownie Seam, and Wongwailli Seam.
All previous mining has a component of partial extraction (development drives or room and pillar operations). This review focuses on full extraction mining, where overlying ground deformation occurs. With multi-seam mining, as is the case here, existing pillars in partial extraction workings may crush, and this has been taken into account.
Full extraction Bulli Seam workings comprise room and pillar mining with pillar extraction in Wonga East, and longwalling in Wonga West. The locations of full extraction Bulli Seam blocks and panels are shown in Figures 1a and 1b. An historic photo of mine workers in a mine heading in a room and pillar operation in the Southern Coalfield (Figure 3.11 of GML, 2004) suggests a 1.9m mining height for these operations. The Bulli seam is 2m to 4.7m thick in this area (Geoterra, 2012a).
Full extraction Balgownie Seam workings comprise 11 longwalls in Wonga East as shown in Figure 1a. The seam thickness is reported as approximately 1.35m (Geoterra, 2012a), with the acknowledgement that the mined height was probably greater. Panel widths ranged between 144m and 186m. The northwestern panels are split by a structural feature. The average maximum subsidence caused by these panels, for locations under Bulli seam full extraction blocks, was measured as 1.1m (SG, 2012). The average vertical subsidence for these panels under Bulli seam full extraction blocks is about 80% of the extracted thickness (SG, 2012), implying a mined height of around 1.5m. SE (2012), in an analysis for pillar run potential, adopted a mined height of 1.8m for these panels, citing practical mining considerations.
Previous workings in Wonga West comprise longwalling with a variety of panel widths. No information was found for mined heights for the panels overlying the proposed development. Mined heights are available for LW501 and LW502 (Singh and Jakeman, 1999; 2001).
2.3 Stakeholder Concerns
Submissions from stakeholders list various groundwater-related concerns that revolve around the following issues:
• The ability of Lake Cataract to maintain its water collection and storage capability (this includes associated tributaries).
• The ability of undermined upland swamps to maintain their ecology.
The first issue also has associated ecological issues in the event that the water transmission capabilities of tributary water courses are compromised by the proposed mining.

Gujarat NRE No.1 Colliery Major Expansion Part 3A Application Groundwater Analysis
Coffey Projects GEOTLCOV24840AA-AB 19 June 2013
5
3 REPORT REVIEW
In this review, no distinction is made between Appendix D of Geoterra (2012a), which presents the groundwater modelling of GA (2012) and the body of Geoterra (2012a). The initial part of the report provides a detailed discussion of relevant legislation pertaining to groundwater-related aspects of the development.
3.1 Data
The review of data used by the proponent focuses on the following three data streams, which are required for the development of a hydrogeological conceptual model.
• Hydraulic heads in the subsurface media.
• Hydraulic properties of the subsurface media.
• Hydraulic controls on groundwater flow in the media (comprising the geometry of the hydrogeological units, rainfall recharge, stream baseflow, structural impediments / enhancements to groundwater flow, and various other aspects).
3.1.1 Hydraulic Heads
The hydraulic head monitoring network comprises 40 measuring devices (8 standpipe piezometers and 32 vibrating wire piezometers) distributed throughout the depth profile at 11 locations. This is considered a reasonable number for the size of the mining lease. However, none of the locations have provided drawdown measurements close to a panel, during mining of LW4 and/or LW5. Drawdown information is important for model calibration for a model where large stresses, causing large changes in hydraulic heads, will be simulated,.
Monitoring locations P501 and P502 in Wonga West overlie historical Bulli seam longwalls LW501 and LW502. Hydraulic heads from these piezometers are presented and interpreted to indicate vertical fracturing extending to less than 153m above the Bulli Seam. These monitoring locations are WB17 and WB18 respectively, from Singh and Jakeman (2001). These data (augmented with microseismic data) were interpreted in Tammetta (2012) as indicating a height of desaturation of 92m, due to the short panel width (110m) and moderate mined height (2.6m). This result is not applicable to wider longwall panels since the height of desaturation is a function of panel width, mined height, and overburden thickness (Tammetta, 2012).
The pressure head profile for GW1 is presented and interpreted to indicate a restriction to downward flow in the upper Bulgo Sandstone. This is not considered to be the case. This pattern is observed elsewhere in the southern coalfield, and worldwide, where claystone does not exist at the base of the profile. The pressure head profile indicates the presence of an inverted water table at about 170m depth, representing the height of desaturation above the Bulli workings at that location. The profile shape resembles a half tear-drop, commonly seen above collapsed workings prior to, or at, equilibration throughout the profile. The base of the tear represents a significant downward gradient, with vertical flow dependent on the vertical hydraulic conductivity, not the lateral conductivity measured by the packer tests. These data are analysed separately by the reviewer later in this report.
Device depths at NRE D listed in Table 5 of Geoterra (2012a) are inconsistent with depths shown in Figure 20 of Geoterra (2012a) and inconsistent with depths shown in the NRE D log in Figure 3 of

Gujarat NRE No.1 Colliery Major Expansion Part 3A Application Groundwater Analysis
Coffey Projects GEOTLCOV24840AA-AB 19 June 2013
6
Appendix B. For the separate analysis undertaken below, device depths from Figure 20 and Appendix B (consistent with each other) have been used.
The report interprets hydraulic heads at NRE A, GW1, and Cataract Creek to indicate that Cataract Creek loses channel water to the subsurface. This is not considered to be the case. The hydraulic head field exhibits large vertical hydraulic head gradients, so that hydraulic heads from the uppermost devices at those monitoring locations are not representative of the water table. These data are analysed separately by the reviewer later in this report.
The hydraulic head surface of Drawing 8 (“Standing Water Levels” for the Upper Hawkesbury Sandstone) appears to suffer from the effect of vertical hydraulic head gradients, and is not useful for indicating lateral hydraulic head gradients. In an environment of significant vertical gradients, hydraulic head surfaces, to be of use, must be compiled using measurements from a group of devices that is located in a vertical interval (of not more than 20m thickness but preferably 15m or less, depending on the magnitude of the vertical hydraulic head gradient) which is a specified distance above or below a key depositional marker horizon (such as the Bald Hill Claystone).
3.1.2 Hydraulic Properties
The site-specific hydraulic conductivity database accrued by the proponent comprises six short duration pump tests at six locations, and 65 packer tests at eight locations. This is considered reasonable. The results have been interpreted taking into account the effect of depth on conductivity.
Packer testing from bore GW1 shows decreasing hydraulic conductivity versus depth. From three tests (out of 22) at this location, the report interprets that the Stanwell Park Claystone has lower lateral conductivity than adjacent strata. Although these three test results are consistent, they lie within the typical variation in conductivity for a fractured rock unit at a given depth (typically about 1 decade around the geometric mean, as displayed over the rest of the profile for GW1). The interpretation in the report is therefore considered tenuous on statistical grounds, and because of results from other areas in the Southern Coalfield.
A discussion of storativity of the subsurface media is not provided. Although this information is less prevalent than hydraulic conductivity information, and more difficult to measure, a discussion on literature estimates would have served as a precursor for numerical simulation.
3.1.3 Hydraulic Controls
The report provides a reasonable summary of the geology and distribution of sedimentary rock layers. Structure contours for key horizons (such as the Wongawilli Seam floor) are not provided, however these are assumed to have been made available by the proponent to the consultant for use in numerical simulation. Structural features are discussed. Discussion of the hydraulic behaviour of the subsurface media is provided for individual hydrogeological units. The discussion is mostly of a qualitative nature.
Previous mining is adequately discussed.
3.1.3.1 Water Course Baseflows
Recharge to the groundwater system from rainfall is a fundamental control. In a numerical model, recharge is positively correlated with hydraulic conductivity, meaning that without quality a-priori information to constrain one, it is not possible to reliably estimate the other. Given the large uncertainty
Gujarat NRE No.1 Colliery Major Expansion Part 3A Application Groundwater Analysis
Coffey Projects GEOTLCOV24840AA-AB 19 June 2013
7
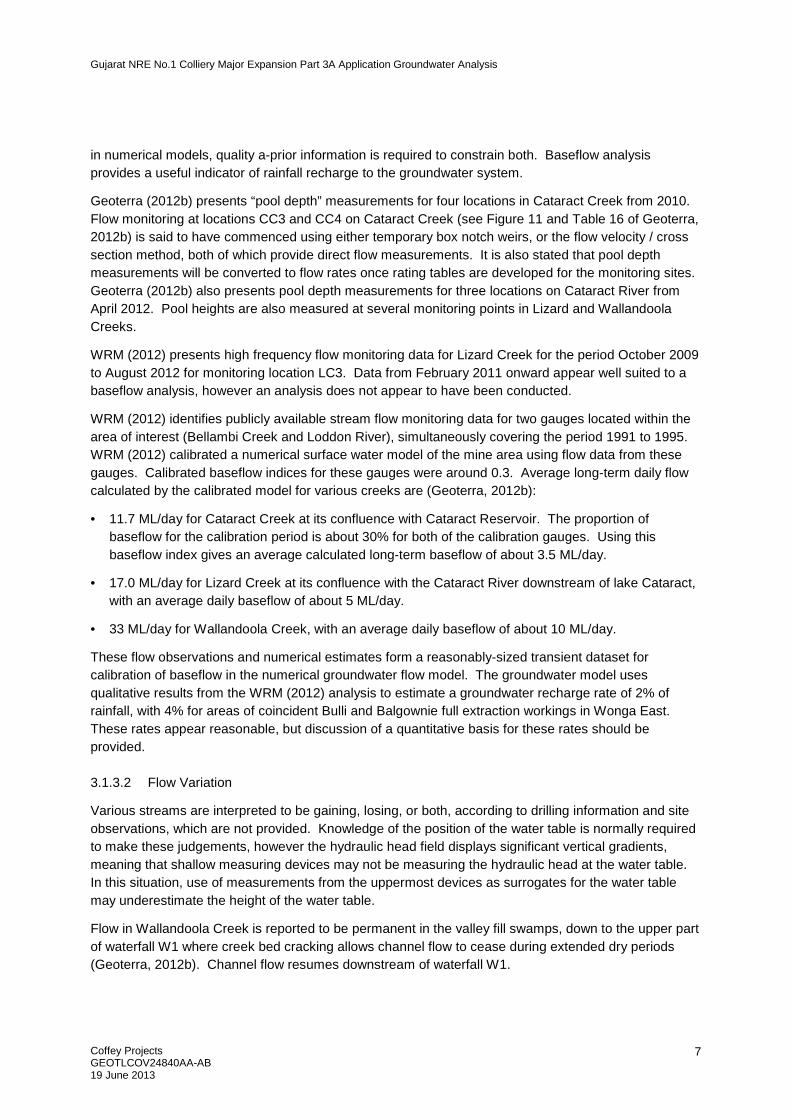
in numerical models, quality a-prior information is required to constrain both. Baseflow analysis provides a useful indicator of rainfall recharge to the groundwater system.
Geoterra (2012b) presents “pool depth” measurements for four locations in Cataract Creek from 2010. Flow monitoring at locations CC3 and CC4 on Cataract Creek (see Figure 11 and Table 16 of Geoterra, 2012b) is said to have commenced using either temporary box notch weirs, or the flow velocity / cross section method, both of which provide direct flow measurements. It is also stated that pool depth measurements will be converted to flow rates once rating tables are developed for the monitoring sites. Geoterra (2012b) also presents pool depth measurements for three locations on Cataract River from April 2012. Pool heights are also measured at several monitoring points in Lizard and Wallandoola Creeks.
WRM (2012) presents high frequency flow monitoring data for Lizard Creek for the period October 2009 to August 2012 for monitoring location LC3. Data from February 2011 onward appear well suited to a baseflow analysis, however an analysis does not appear to have been conducted.
WRM (2012) identifies publicly available stream flow monitoring data for two gauges located within the area of interest (Bellambi Creek and Loddon River), simultaneously covering the period 1991 to 1995. WRM (2012) calibrated a numerical surface water model of the mine area using flow data from these gauges. Calibrated baseflow indices for these gauges were around 0.3. Average long-term daily flow calculated by the calibrated model for various creeks are (Geoterra, 2012b):
• 11.7 ML/day for Cataract Creek at its confluence with Cataract Reservoir. The proportion of baseflow for the calibration period is about 30% for both of the calibration gauges. Using this baseflow index gives an average calculated long-term baseflow of about 3.5 ML/day.
• 17.0 ML/day for Lizard Creek at its confluence with the Cataract River downstream of lake Cataract, with an average daily baseflow of about 5 ML/day.
• 33 ML/day for Wallandoola Creek, with an average daily baseflow of about 10 ML/day.
These flow observations and numerical estimates form a reasonably-sized transient dataset for calibration of baseflow in the numerical groundwater flow model. The groundwater model uses qualitative results from the WRM (2012) analysis to estimate a groundwater recharge rate of 2% of rainfall, with 4% for areas of coincident Bulli and Balgownie full extraction workings in Wonga East. These rates appear reasonable, but discussion of a quantitative basis for these rates should be provided.
3.1.3.2 Flow Variation
Various streams are interpreted to be gaining, losing, or both, according to drilling information and site observations, which are not provided. Knowledge of the position of the water table is normally required to make these judgements, however the hydraulic head field displays significant vertical gradients, meaning that shallow measuring devices may not be measuring the hydraulic head at the water table. In this situation, use of measurements from the uppermost devices as surrogates for the water table may underestimate the height of the water table.
Flow in Wallandoola Creek is reported to be permanent in the valley fill swamps, down to the upper part of waterfall W1 where creek bed cracking allows channel flow to cease during extended dry periods (Geoterra, 2012b). Channel flow resumes downstream of waterfall W1.

Gujarat NRE No.1 Colliery Major Expansion Part 3A Application Groundwater Analysis
Coffey Projects GEOTLCOV24840AA-AB 19 June 2013
8
Flow in Lizard Creek is reported to be permanent in the valley fill swamps, down to site LC3, where creek bed cracking allows channel flow to cease during extended dry periods (Geoterra, 2012b), with permanent flow resuming about 200m upstream of waterfall L1, down to site LC5. Between sites LC5 and LC6, channel flow can cease during extended dry periods, however no streambed cracking is reported. Permanent flow is resumed downstream of site LC6.
The locations where creek bed cracking has been observed in Wallandoola and Lizard Creeks coincides with the edges of the southwest Bulli seam longwall block in Wonga West (see Figure 1b). Geoterra (2012b) interprets that the previous Bulli seam longwall mining has caused “conventional and non-conventional” impacts (as defined in NSW PAC, 2010) on stream flow and / or water quality in these creeks.
Flow in Cataract Creek has been observed to be perennial (Geoterra, 2012b). Geoterra (2012b) reports that no adverse impacts on stream flow or water quality have occurred. However, unlike Wonga West, the creek is underlain only by pillar extraction workings (except for a reach over the ends of Balgownie LW9 and LW10, and a short reach over LW11 – see Figure 1a) which create smaller collapsed zones than longwall mining.
3.1.3.3 Groundwater Inflows to Mine Voids
Information regarding water pumped out of mine voids is vague. In discussing the historic 200 and 300 series Bulli seam longwalls, the report states that voids in the Wonga West area, located to the west of Cataract Reservoir, are “essentially dry”. This is inferred to mean that the voids are maintained dewatered, since it is subsequently stated that water is being pumped out of mine voids “to the west of Cataract Reservoir”. Pumping rates would have been useful, if available. Void water level information (and void geometries), and void injection rates (if applicable) would assist in converting pumping rates into groundwater inflows. Void water level information may be irrelevant since it appears that the voids have minimal standing water.
Quantitative information is provided for water extracted from the Wonga East workings (27 Cut Through) from 2010. These data presumably apply for drained workings, and are useful as a calibration target (taking into account evaporation and coal moisture losses). As before, any injection into the void would be required to process the data.
3.1.4 Hydrogeological Conceptual Model
The hydrogeological conceptual model is discussed without illustration and confounds the discussion of groundwater sources and sinks with discussion of modelling mechanisms.
The following aspects of the adopted hydrogeological conceptual model are considered to be tenuous:
• That the “deeper” Hawkesbury Sandstone is hydraulically separate from overlying and underlying units at Wonga West (presumably because of the presence of the Bald Hill Claystone (for the underlying units)).
• That the height of fracturing allowing desaturation (due to proposed mining) is assumed to extend only up to the mid to upper Bulgo Sandstone (the Bald Hill Claystone is assumed to be unaffected, except for a localised area in Wonga East).

Gujarat NRE No.1 Colliery Major Expansion Part 3A Application Groundwater Analysis
Coffey Projects GEOTLCOV24840AA-AB 19 June 2013
9
The first aspect is circumvented in the numerical simulation since all model layers communicate hydraulically with adjacent layers via the vertical hydraulic conductivity parameter. The second aspect is a crucial one for the conceptual model; it is analysed separately by the reviewer later in this report.
The assumption of surface tensile fracturing occurring to a depth of 20m is reasonable. 15m is a widely used estimate for single seam longwalling; the depth for multiple seam mining is likely to be larger.
3.2 Impact Assessment Method
The impact assessment relies heavily on the results of numerical simulation. The review of the assessment method therefore focuses on the development and use of the numerical model. The electronic version of the model was not available, and an understanding of the functioning of the model has relied on the report only. It is recognised that there may have been time and budgetary constraints applied to the impact assessment which are not known to the reviewer.
The assessment has used FEFLOW, a finite-element numerical groundwater flow model produced by DHI-WASY. It assumes laminar flow in its governing equation for saturated conditions. The use of this model is appropriate for the problem at hand. Models of this type are useful for predicting changes in the hydraulic head field outside collapsed zones, and for estimating changes in baseflow to, or leakage from, surface water bodies through changes in hydraulic head in the subsurface media, but are inappropriate where severe trauma occurs near the body. These types of model are not appropriate for assessing hydraulic conductivity changes at the base of individual swamps. The use of a numerical model for a problem of this nature (prediction of depressurisation due to underground mining) is predicated on stringent calibration.
The purpose of the numerical simulation is reported as being to “assess the relative changes in the groundwater regime and recharge to surface water bodies due to the proposed mining”. Later in the report the aim is stated as being “to assess the influence that the proposed extraction of Wonga East, Wonga West, and VMains may have on current conditions”. Model output presented later comprises hydraulic head drawdown, changes in flow exchange with surface water features, and groundwater inflow to the mine void.
The model does not attempt to simulate discrete structural features. The capacity for these structures to create high conductivity pathways through deformation cannot be modelled soundly with models of the type used here. These analyses would generally require a discrete feature approach with geotechnical simulation of deformation, perhaps in a probabilistic way.
3.2.1 Model Architecture
The number of model layers is more than satisfactory, and would have been a solid platform for replication of vertical hydraulic gradients. Layer geometries are detailed and are reported to have been developed from elevation data for topography, Bulli seam, and Wongawilli seam structure contours. These data were presumably supplied by the proponent as digital structure contour surfaces interpolated from resource drilling.
Model domain extremities are reasonable however the northern and western extremities in the Wonga West area would have benefited from extension further north and west, since mine voids (strong hydraulic controls) are further away in these areas. The extremities are reported to be catchment boundaries. It is sound practice to extend model extremities to discharge boundaries which are a reasonable distance from the proposed stresses, so that the pre-mining hydraulic head field is set up by

Gujarat NRE No.1 Colliery Major Expansion Part 3A Application Groundwater Analysis
Coffey Projects GEOTLCOV24840AA-AB 19 June 2013
10
rainfall recharge and groundwater discharge at discharge boundaries, and modelled stresses have negligible effect at the domain extremities. For an area such as this, a combination of distant line sinks / mine voids would be advantageous. This would also allow more distant water course baseflows to be calibrated.
Potential lateral flow out of the model domain is not discussed. The potential for fluxes of this nature to be significant, compared to discharge to surrounding mine voids in the model domain, will most likely be in the upper model layers.
Lake Cataract is simulated as a constant head boundary, meaning that leakage will be controlled by the hydraulic conductivity of the layers in which the boundary is set (the lake may intersect several units due to layer dips and outcropping). While this is acceptable, it may cause problems during the detailed calibration which will be required (this is further discussed below), and it may be prudent to simulate the lake using a variable head boundary that controls flux (such as the river package in MODFLOW SURFACT), otherwise lake fluxes will be more volatile, and may cause difficulty, during calibration.
3.2.2 Model Parameters
Hydraulic conductivity in the model is reported to be based on packer testing undertaken for this project, and from model calibration results for the Metropolitan Mine (operated by Helensburgh Coal).
The report specifies the uncertainties inherent in hydraulic conductivity above subsided strata, and the difficulty in simulating conductivity change (from virgin conditions) caused by multiple seam mining. Where significant uncertainties in parameters and boundary conditions exist, the use of numerical simulation becomes questionable. For the model results to be considered by external parties, the uncertainty must be reduced by additional a-priori information. The model is considered uncalibrated at present (this is further discussed below), and model results are not considered to be reliable. However, information on hydraulic conductivity from the site itself, and other sources, is presented in the separate analysis by the reviewer below, to assist in reducing uncertainty and constraining model parameters during the required recalibration.
The goaf zone immediately above the mined floor has extreme conductivity, and values selected for model simulation are considered very low.
3.2.3 Model Calibration
Model calibration is discussed in a deficient manner. It is not stated which parameters were selected for calibration, and which were adopted without variation.
It appears that the model has been calibrated in steady state mode only, using only hydraulic head targets. Transient calibration, to a calibration target data set including (in addition to hydraulic head time series measurements) water course baseflow estimates and measured void discharges, has not been undertaken. This is considered a significant deficiency. A calibrated hydraulic head surface is presented in Figure 19 of Appendix D. The contoured quantity is called “resultant heads” and it is not known if it is the calibrated water table or the hydraulic head surface for some key depositional horizon. A correlation of observed and calibrated hydraulic heads is provided in Figure 20 of Appendix D, however no performance measure is provided.
A steady state calibration (where it is normally difficult to sustain vertical hydraulic head gradients, since the hydraulic head field equilibrates to an infinite time), coupled with the presentation of one calibrated hydraulic head surface, implies that calibrated vertical hydraulic head gradients are negligible. If this is
Gujarat NRE No.1 Colliery Major Expansion Part 3A Application Groundwater Analysis
Coffey Projects GEOTLCOV24840AA-AB 19 June 2013
11
the case, it is in disagreement to observations and represents a further deficiency. If pre-mining pressure heads, at depth, in the model are overestimated (negligible hydraulic head gradient), this underestimates drawdown in upper layers and the associated leakage from surface water bodies caused by this drawdown. It also leads to an unrepresentative evolution of the hydraulic head field from imposed stresses.
No water balances for the model domain, at any time instant, are provided, precluding an assessment of boundary conditions and hydrogeological units that feature heavily in the flow system.
3.2.4 Swamps
Impact assessment for swamps was undertaken by BR (2012). The method comprised an initial risk assessment according to regulatory agency subsidence criteria, followed by a comparative analysis (with past mining) and review of flow accumulation and predicted strains (tensile and compressive) for site-specific swamps. Based on a risk assessment using predicted strains for the proposed development, and observed strains at other locations, and focusing on interpreted “special significance” swamps, BR (2012) concluded:
• Swamps CRUS1 to CRUS3, LCUS1, LCUS6, LCUS27, WCUS1, and valley infill sections of WCUS4 showed no significant risk factors that would indicate susceptibility to impact.
• Swamps CCUS1, CCUS4, CCUS5, CCUS10, WCUS4, and WCUS11 may be subject to strains that would result in fracturing of the bedrock below these swamps.
• Swamp WCUS7 is likely to be subject to tensile strains sufficient to result in fracturing of bedrock below this swamp.
• There is some potential for fracturing of the bedrock below the headwater section of LCUS8, however it is likely to be limited in extent and degree.
Based on additional assessments for each swamp, the overall conclusion in BR (2012) is that there is a significant likelihood of negative environmental consequences for swamps CCUS1 and CCUS5.
Regarding the presence of peat in the substrate of site specific swamps, Geoterra (2012a) describes swamp Lcus4 in Wonga West as having up to 1.5m of peat. BR (2012) reports that only some swamps within the study area generate peat, but they are not identified. The thickness of swamp substrate from rudimentary logs shown in Figure 11 of Geoterra (2012a) is an average of around 1m.
The impact assessment adopts the following two assumptions, which are considered tenuous:
• That changes in hydraulic parameters (deformation) of swamp bedrock is estimated to have no effect on groundwater levels in the bedrock, in excess of typical climatic variability.
• That connective cracking to deeper strata is not predicted, and therefore free drainage of swamps into deeper strata (the mine void) is not anticipated.
An analysis of these aspects has been undertaken separately by the reviewer below.
Gujarat NRE No.1 Colliery Major Expansion Part 3A Application Groundwater Analysis
Coffey Projects GEOTLCOV24840AA-AB 19 June 2013
12
4 SEPARATE ANALYSIS
In the analyses that follow, mapping information has been sourced from the following:
• Wongawilli and Bulli seam floors, and topography: NSW DPI (from NRE Gujarat). The supplied structure contours for the Bulli and Balgownie seam floors are noted to be exactly 42m apart for all nodes in the digitial elevation model.
• Bulli seam pillar extraction mining in Wonga East: Plan 2e, Cardno (2012).
• Balgownie seam longwalling: Plan 2e, Cardno (2012).
• Proposed NRE Gujarat WW longwalls: Drawing 1, Geoterra (2012a)
• Georeferenced computer files of existing and proposed workings supplied by the proponent via NSW DPI.
The reaches of Cataract and Lizard Creeks were digitised from Drawing 1 in Geoterra (2012a), assuming the coordinate axes are the MGA. Wherever digitising was undertaken on figures with unlabelled coordinate axes, the coordinate system was assumed to be the MGA. The reach for Wallandoola Creek was taken from georeferenced mapping files provided by Geoscience Australia (via web service) for its 1:250000 scale map series.
4.1 Hydraulic Conductivity
An analysis of measured hydraulic conductivity in the Southern Coalfield has been undertaken for the purpose of providing (if needed) a basis for constraints in the hydraulic conductivity field for model calibration, and a basis for the recommended probabilistic numerical analysis of potential leakage from Lake Cataract.
Hydraulic conductivity measurements from packer tests for strata in the Southern Coalfield are shown in Figure 2. Decreasing permeability with depth is a conspicuous feature of the strata. Structural features such as dykes or faults may reduce or enhance the normal hydraulic characteristics of the strata. Superimposed on the distribution are the packer tests for the NRE lease. Results for GW1 and NE3 are broadly similar to other data. Results from other bores show significant variation.
Results in Reid (1996) for strata impacted by mining are from packer tests undertaken in strata directly overlying the mined seam, where caving has occurred from full extraction (from boreholes adjacent to Avon Reservoir and at Wongawilli Colliery). Mining occurred in either the Bulli or Wongawilli Seams, and the Bulli Seam would be at an average depth of about 320m (with respect to the impacted strata packer test results) on Figure 2. Panel widths are thought to have been about 250m or less. The effect of mining on overburden hydraulic conductivity is seen as a trend centred around 0.15m/day at the surface, with conductivity increasing slightly with depth, and probably indicates a significant loss of confining pressure in the tested strata.

Gujarat NRE No.1 Colliery Major Expansion Part 3A Application Groundwater Analysis
Coffey Projects GEOTLCOV24840AA-AB 19 June 2013
13
Figure 2. Hydraulic conductivity measurements from packer tests for strata in the Southern Coalfield, and from the NRE Gujarat No.1 Mine Lease.
At a mine site in Kentucky, USA, changes in hydraulic conductivity were measured in detail (Hutcheson et al, 2000). At that location, overburden strata comprise about 250m of interbedded coal seams, shale, limestone, and massive sandstone of Middle Carboniferous age. The panel width was 213m at a depth of about 250m, with a mined seam thickness of 2.3m. Two major sandstone sequences of about 30m thickness each, occur within overlying strata. Hutcheson et al (2000) report measured pre-mining and post-mining hydraulic conductivities over a single longwall (LW7). Results are shown in Figure 3. These results are similar to those of Reid (1996), also indicating that the normal relationship of decreasing permeability with depth for undisturbed strata is significantly affected by longwall mining.

Gujarat NRE No.1 Colliery Major Expansion Part 3A Application Groundwater Analysis
Coffey Projects GEOTLCOV24840AA-AB 19 June 2013
14
Figure 3. Measured pre- and post-mining hydraulic conductivity at a site in Kentucky (data from Hutcheson et al. 2000).
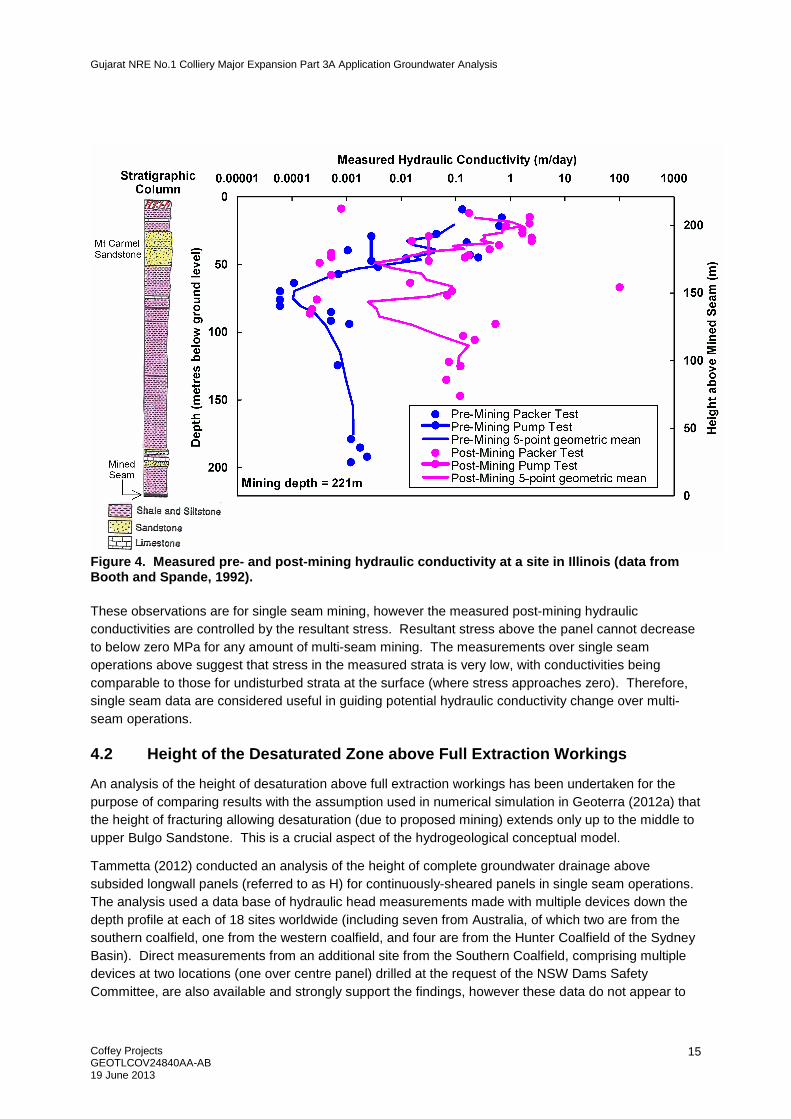
At a coal mine in Illinois, USA (Booth and Spande, 1992), hydraulic conductivity was measured from packer tests for pre- and post-mining scenarios over the centre of a longwall at a depth of 221m (panel width 183m, and mined seam thickness 2.7m). Rock strata comprise mostly Permian age coal measures. Changes in hydraulic conductivity are shown in Figure 4. Below the Mount Carmel Sandstone Member, post-mining hydraulic conductivities are about 100 times greater than pre-mining.
Booth et al (1998) recorded an average increase of one to two orders of magnitude in hydraulic conductivity from pre-mining to post-mining conditions, assessed from packer tests in a sandstone layer approximately 170m above a longwall in the USA. Confined storativities assessed from long-term pump tests increased by a factor of around 10 (from the 10-4 range to the 10-3 range), resulting from the increased compressibility available from increased void volume due to separation of bedding planes and dilation of fractures and joints.
Gujarat NRE No.1 Colliery Major Expansion Part 3A Application Groundwater Analysis
Coffey Projects GEOTLCOV24840AA-AB 19 June 2013
15
Figure 4. Measured pre- and post-mining hydraulic conductivity at a site in Illinois (data from Booth and Spande, 1992).
These observations are for single seam mining, however the measured post-mining hydraulic conductivities are controlled by the resultant stress. Resultant stress above the panel cannot decrease to below zero MPa for any amount of multi-seam mining. The measurements over single seam operations above suggest that stress in the measured strata is very low, with conductivities being comparable to those for undisturbed strata at the surface (where stress approaches zero). Therefore, single seam data are considered useful in guiding potential hydraulic conductivity change over multi-seam operations.
4.2 Height of the Desaturated Zone above Full Extraction Workings
An analysis of the height of desaturation above full extraction workings has been undertaken for the purpose of comparing results with the assumption used in numerical simulation in Geoterra (2012a) that the height of fracturing allowing desaturation (due to proposed mining) extends only up to the middle to upper Bulgo Sandstone. This is a crucial aspect of the hydrogeological conceptual model.
Tammetta (2012) conducted an analysis of the height of complete groundwater drainage above subsided longwall panels (referred to as H) for continuously-sheared panels in single seam operations. The analysis used a data base of hydraulic head measurements made with multiple devices down the depth profile at each of 18 sites worldwide (including seven from Australia, of which two are from the southern coalfield, one from the western coalfield, and four are from the Hunter Coalfield of the Sydney Basin). Direct measurements from an additional site from the Southern Coalfield, comprising multiple devices at two locations (one over centre panel) drilled at the request of the NSW Dams Safety Committee, are also available and strongly support the findings, however these data do not appear to

Gujarat NRE No.1 Colliery Major Expansion Part 3A Application Groundwater Analysis
Coffey Projects GEOTLCOV24840AA-AB 19 June 2013
16
be available in the public domain. In the analysis by Tammetta (2012), H was shown to be relatively independent of most parameters except the geometry of the mined void and the overburden thickness. An empirical equation linking H (in metres) over centre panel to these parameters was developed and is given by:
H = 1438 ln(4.315 x 10⁻⁵ u + 0.9818) + 26
where u = w t1.4 d0.2, w is the mined width (equal to the panel width plus the adjacent heading widths), d is the overburden thickness, and t is the mined height. All dimensions are in metres. The equation applies to a variety of strata types, and strata lithology plays only a minor role. H was also shown to be equivalent to the height above the mined seam where a large change in downward movement of rock strata above a subsided longwall panel occurs, as measured by extensometer arrays. That is, H is equal to the top of the zone of large downward movement. The desaturated zone and the zone of large downward movement are coincident, and are referred to as the collapsed zone.
The height of desaturation above full extraction for the following special situations is shown to be consistently smaller than estimates made for continuously-sheared panels (Tammetta, 2012):
• Above chain pillars of continuously sheared panels (with either a panel on one side only or panels on both sides).
• Above the centreline of room and pillar panels with pillar extraction being undertaken.
• Above the centreline of continuously sheared panels, underneath flowing rivers or saturated high-permeability alluvium.
The reasons for this are discussed in Tammetta (2012). Of special interest for the current project is the estimation of H for Bulli Seam pillar extraction workings in Wonga East.
Tammetta (2012) presents a conceptual model of ground deformation above a subsided longwall panel from a groundwater perspective. The model consists of a collapsed zone and a disturbed zone, as shown in Figure 5.
The Collapsed Zone is parabolic in cross-section, and reaches from the mined seam to a maximum height equal to H over centre panel. This zone is severely disturbed and is completely drained of groundwater during caving. It is subsequently unable to maintain a positive pressure head. It will behave as a drain while the mine is kept dewatered. Within this zone, the matrix of rock blocks may continue draining for extended periods however the defects will immediately transport this water downward to the mine. Groundwater flow will not be laminar, and Darcy’s equation is unlikely to be obeyed.
The Disturbed Zone overlies the Collapsed Zone. Positive groundwater pressure heads are maintained over most of the zone. Limited data for long-term groundwater behaviour in this zone suggest that hydraulic heads remain relatively stable, except for immediate lowering associated with drainage of lower strata and minor increases in void space after caving. Groundwater flow will be laminar, and Darcy’s equation is likely to be obeyed. Desaturation in the disturbed zone occurs above the chain pillars. Here, H is smaller than over centre panel, and may reduce to zero if the pillar is flanked by one panel only. H above the pillars is likely to be more strongly dependent on d than for centre panel, and will probably also be dependent on the pillar width.

Gujarat NRE No.1 Colliery Major Expansion Part 3A Application Groundwater Analysis
Coffey Projects GEOTLCOV24840AA-AB 19 June 2013
17
Figure 5. Conceptual model for ground deformation above a caved longwall panel (after Tammetta, 2012).
4.2.1 Hydraulic Heads and Previous Mining
The first stage of the analysis of the collapsed zone comprised testing the interrelationship between estimated collapsed zone heights for previous workings (using the results of Tammetta, 2012) and the hydraulic head information collected by the proponent. Monitoring site GW1 is located over Bulli seam pillar extraction workings and just off the edge of Balgownie LW7. For the Balgownie panel, GW1 is in a location similar to that over chain pillars with a mined panel on one side only, and its u parameter is so small that the height of desaturation contributed by Balgownie LW7 at nest GW1 is conservatively assumed to be nil (refer to Tammetta, 2012).
The height of desaturation at GW1 is thus assumed to be due only to Bulli pillar extraction. From the GW1 pressure head profile H is assessed to be 225m (overburden thickness) minus 170m (base of saturation), giving 55m. This fits the distribution in Figure 4 of Tammetta (2012), and is shown in Figure 6. GW1 is slightly off the centreline of the Bulli block so H is less than the maximum.

Gujarat NRE No.1 Colliery Major Expansion Part 3A Application Groundwater Analysis
Coffey Projects GEOTLCOV24840AA-AB 19 June 2013
18
Figure 6. Height of desaturation estimated from the pressure head profile at GW1 for pillar extraction workings at GW1.
This result provides added reliability for estimating H for other Bulli workings and the Balgownie longwalls in Wonga East, along a cross section from NRE A to NRE B, through GW1, as shown in Figure 7. The figure shows the calculated collapsed zone heights for the Bulli and Balgownie full extraction workings seperately, and the summed height. The cross-section cuts the parabolic cone formed by Balgownie LW7 along an off-centre line, so that the maximum H is not shown on the cross section. In addition, truncation of Balgownie LW7 at the fault (see Figure 1a) further reduces H for the Balgownie LW7 block in the section (this block is northwest of the fault, with width 180m and “length” 145m, with the rest of Balgownie LW7 being continued on the other side of the fault). For this short panel, H is estimated assuming a “width” (w) of 145m.
The collapsed zone heights for both seams were summed arithmetically, based on the logic discussed in Appendix A (which also includes a discussion of potential pillar crushing). It is recognised that the total H may in fact be larger than a simple arithmetic sum of the individual H, however insufficient hydraulic head data are available to test this. Surface subsidence measurements for Wongawilli LW4 at Wonga East are reported to be in excess of typical observations in the southern Coalfield (SG, 2013; Holla and Barclay, 2000), suggesting that surface subsidence is not a simple arithmetic accumulation for multiple seam mining.

Gujarat NRE No.1 Colliery Major Expansion Part 3A Application Groundwater Analysis
Coffey Projects GEOTLCOV24840AA-AB 19 June 2013
19
Figure 7. Calculated heights of the collapsed zones of previous workings along a cross section in Wonga East.

Gujarat NRE No.1 Colliery Major Expansion Part 3A Application Groundwater Analysis
Coffey Projects GEOTLCOV24840AA-AB 19 June 2013
20
The interrelationship between the summed H from all workings and the measured hydraulic heads was assessed along the cross section. Figure 8a shows the interpreted hydraulic head distribution (broadly representative of early 2012) and the calculated collapsed zone height. The curvature in the hydraulic head contours resulting from the control exerted by the collapsed zones is considered most reasonable and is observed at other locations in the Southern Coalfield, as is the vertical hydraulic head gradient. The interrelationship is therefore considered strong, with hydraulic heads representative of the collapsed zones as calculated here.
The vertical hydraulic head gradient steepens considerably in the vicinity of the collapsed zones, typical of this situation. The hydraulic heads at NRE A, in conjunction with the reported response of deeper devices there to rainfall events (Geoterra, 2012a), may represent a subvertical feature of reasonable width, oriented at some angle to the section, which has increased hydraulic conductivity along its plane (compared to adjacent strata), but not normal to its plane.
The water table was estimated at each location by upward extrapolation of the pressure head profiles to zero pressure. The water table along the section is interpreted to be higher than the water level in Cataract Creek, indicating a gaining stream. A stream of such short length would not be expected to be perennial (as reported) unless a sustained baseflow input was available. This accords with observations made during a site visit on 10 April 2013 where Cataract Creek was visually estimated to be flowing (following several dry days) at a rate significantly in excess of 2 L/s.

Gujarat NRE No.1 Colliery Major Expansion Part 3A Application Groundwater Analysis
Coffey Projects GEOTLCOV24840AA-AB 19 June 2013
21
Figure 8a. Interpreted hydraulic head distribution (broadly representative of early 2012) along the cross section.
Gujarat NRE No.1 Colliery Major Expansion Part 3A Application Groundwater Analysis
Coffey Projects GEOTLCOV24840AA-AB 19 June 2013
22
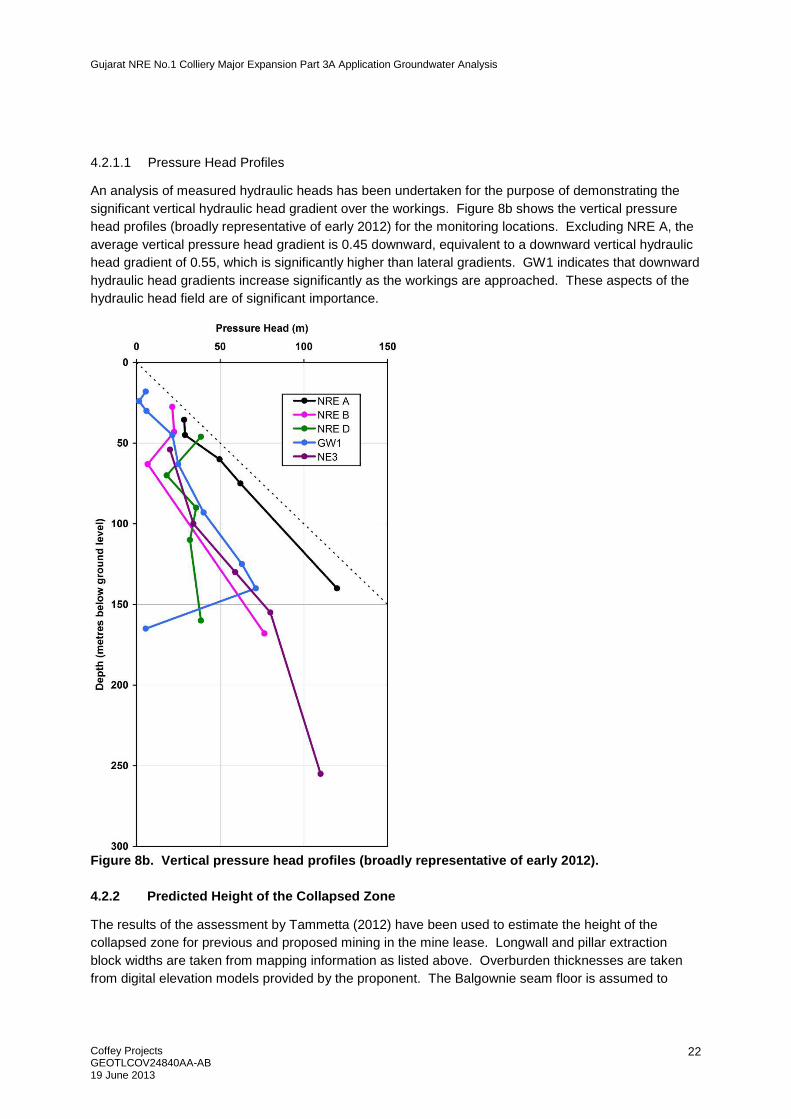
4.2.1.1 Pressure Head Profiles
An analysis of measured hydraulic heads has been undertaken for the purpose of demonstrating the significant vertical hydraulic head gradient over the workings. Figure 8b shows the vertical pressure head profiles (broadly representative of early 2012) for the monitoring locations. Excluding NRE A, the average vertical pressure head gradient is 0.45 downward, equivalent to a downward vertical hydraulic head gradient of 0.55, which is significantly higher than lateral gradients. GW1 indicates that downward hydraulic head gradients increase significantly as the workings are approached. These aspects of the hydraulic head field are of significant importance.
Figure 8b. Vertical pressure head profiles (broadly representative of early 2012).
4.2.2 Predicted Height of the Collapsed Zone
The results of the assessment by Tammetta (2012) have been used to estimate the height of the collapsed zone for previous and proposed mining in the mine lease. Longwall and pillar extraction block widths are taken from mapping information as listed above. Overburden thicknesses are taken from digital elevation models provided by the proponent. The Balgownie seam floor is assumed to

Gujarat NRE No.1 Colliery Major Expansion Part 3A Application Groundwater Analysis
Coffey Projects GEOTLCOV24840AA-AB 19 June 2013
23
overlie the Wongawilli seam roof by about 19m in the lease area (Geoterra, 2012a), or a floor to floor interval of about 30m. The following assumptions are made regarding mined heights:
• t = 1.9m for Bulli seam pillar extraction in Wonga East.
• t = 1.8m for Balgownie seam longwalls (SE, 2012).
• t = 2.6m for Bulli seam longwalls in Wonga West (from LW501 and LW502, Singh and Jakeman, 1999; 2001).
• t = 3.1m for proposed Wongawilli seam panels in Wonga West and Wonga East (from a reported t of 3.1m for LW4 in Wonga East, Geoterra, 2012a).
H above pillar extraction blocks for a single seam is assumed to be 50% of H calculated for a dimensionally equivalent continuously sheared longwall panel.
The assessment method comprises calculation of collapsed zones heights for each seam, then simple summation of these heights to develop an isopach of the combined collapsed zone thickness. To this isopach is added 20m (the estimate for the thickness of the surface tensile cracking zone), to create an isopach that represents a combined collapsed zone / surface tensile zone thickness, referred to as the potential drainage thickness (if the collapsed and surface tensile zones connect, the profile is assumed to fully drain, with resultant groundwater pressure heads of zero or less). The potential drainage thickness is then subtracted from the Wongawilli seam overburden thickness. Negative values indicate the protrusion of the potential drainage thickness above ground surface, and indicate the condition where the collapsed and surface tensile zones have connected, allowing complete drainage of the overlying profile and surface water features into the mined void.
In the figures presented below, contours of protrusion generally apply to the panel (or block) centres (the height of desaturation over centre panel was applied along the whole width of a panel in obtaining the contours, to simplify spatial data processing).
4.2.2.1 Wonga East
Figure 9 shows the protrusion of the interpreted potential drainage thickness above ground surface for Wonga East. Outlines of significant swamps are also shown. Complete drainage is calculated to occur over parts of LW3 to LW8.
A serious risk to Cataract Creek is present in the area where Cataract Creek, Balgownie LW11, a Bulli pillar extraction block, and Wongawilli panels LW7 and LW8 coincide (see Figures 9 and 1a). The interpretation indicates that the collapsed zone and surface tensile fracturing zones will connect in this area, and lead to creek drainage into the mined void. The calculated baseflow of Cataract Creek is 11.7 ML/day (see above), which is 6% of the average water volume generated by Lake Cataract between 2006 and 2012 (from the SCA water balance reports web page, sighted 14 May 2012: http://www.sca.nsw.gov.au/publications/publications/sca-water-balance).

Gujarat NRE No.1 Colliery Major Expansion Part 3A Application Groundwater Analysis
Coffey Projects GEOTLCOV24840AA-AB 19 June 2013
24
Figure 9. Protrusion of the calculated potential drainage thickness above ground surface for Wonga East.
The ground elevation at the point of serious risk is estimated to be about 310mAHD from supplied topographic information, however the channel invert is likely to be a few metres lower. The base of the surface tensile zone is assumed to be around 290mAHD or lower, but dipping down towards the west along LW7 and LW8. The full supply level for Lake Cataract is 289.5mAHD (from NSW Department of Environment and Heritage web page, sighted 13 May 2012: http://www.environment.nsw.gov.au/heritageapp/ViewHeritageItemDetails.aspx?ID=5051469). LW7 and LW8 fall short of the lake, according to an uncontrolled mapping file used for the lake, however the presence of LW9 and LW10 extending to underneath the lake (with the associated surface tensile cracking zones) adds another dimension to the risk, with continued integrity of the ground over the chain pillars between LW9 and LW8 being required to prevent water at around, or above, the full supply level draining to the workings at the zone of serious risk, if Cataract Creek is breached.
Where H intersects a water course, then the baseflow in the water course will be lost. The nature of connections observed elsewhere (for example at South Wambo Creek at the Wambo Mine) is such that the compromised ground may consume significant flows, allowing little (if any) water to survive the journey across the compromised ground during times of peak flow.
The western end of LW10, and possibly LW9, in Wonga East underlies Lake Cataract. Assuming single seam mining conditions, the approximate height of the collapsed zone is 140m. The overburden thickness is about 280m here, leaving a vertical thickness of 120m between the collapsed zone and the

Gujarat NRE No.1 Colliery Major Expansion Part 3A Application Groundwater Analysis
Coffey Projects GEOTLCOV24840AA-AB 19 June 2013
25
base of the surface tensile fracturing zone. However, the surface tensile fracturing zone extends along the entire panel, to the high risk zone at Cataract Creek. Where a panel underlies a surface water body, the effective base of the body becomes the base of the surface tensile fractured zone, and the effective extension of the body (for a specified water level elevation for the water body) may occur to the point where the base of the surface tensile fractured zone intersects the specified water level elevation (assuming the ground slopes up from the body, and surface tensile cracks are in reasonable communication with each other). This provides additional risk at the high risk area.
Using Figure 4 of BR (2012), most of swamp CCUS6 is located over a zone of interpreted protrusion, and is at risk of permanent ecosystem change.
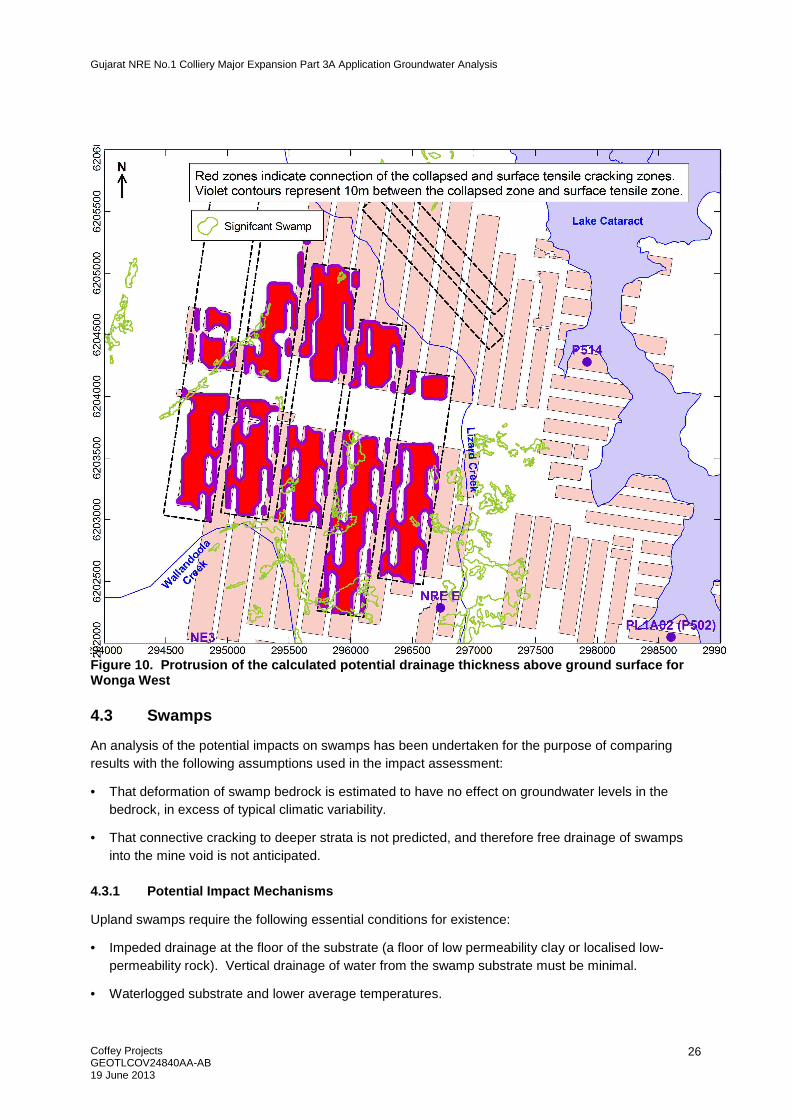
4.2.2.2 Wonga West
Figure 10 shows the protrusion of the interpreted potential drainage thickness above ground surface for Wonga West. Outlines of significant swamps are also shown. Complete drainage is calculated to occur over the proposed wide panels (LW1 to LW5) wherever they underlie Bulli seam workings. The zone of complete drainage comes to within about 100m of Lizard Creek at the northern end of LW2, and to within 100m of Wallandoola Creek at the southern ends of LW4 and LW5 (see Figures 10 and 1b). The interpretation indicates that the collapsed zone and surface tensile fracturing zone will connect in these areas, which may lead to creek drainage into the mined void.
The calculated baseflow of Wallandoola and Lizard Creeks is 33 and 17.0 ML/day respectively (see above). These creeks do not flow into Lake Cataract, however these calculated average flows are collectively about 25% of the average water volume generated by Lake Cataract between 2006 and 2012 (from the SCA water balance reports web page, sighted 14 May 2012: http://www.sca.nsw.gov.au/publications/publications/sca-water-balance).
Any swamp overlying a Wongawilli seam panel that underlies a Bulli seam panel will also overlie a zone of interpreted protrusion. Using Figure 5 of BR (2012), the largest four of these swamps are LCUS9, LCUS18, LCUS25, and WCUS4.
Gujarat NRE No.1 Colliery Major Expansion Part 3A Application Groundwater Analysis
Coffey Projects GEOTLCOV24840AA-AB 19 June 2013
26
Figure 10. Protrusion of the calculated potential drainage thickness above ground surface for Wonga West
4.3 Swamps
An analysis of the potential impacts on swamps has been undertaken for the purpose of comparing results with the following assumptions used in the impact assessment:
• That deformation of swamp bedrock is estimated to have no effect on groundwater levels in the bedrock, in excess of typical climatic variability.
• That connective cracking to deeper strata is not predicted, and therefore free drainage of swamps into the mine void is not anticipated.
4.3.1 Potential Impact Mechanisms
Upland swamps require the following essential conditions for existence:
• Impeded drainage at the floor of the substrate (a floor of low permeability clay or localised low-permeability rock). Vertical drainage of water from the swamp substrate must be minimal.
• Waterlogged substrate and lower average temperatures.

Gujarat NRE No.1 Colliery Major Expansion Part 3A Application Groundwater Analysis
Coffey Projects GEOTLCOV24840AA-AB 19 June 2013
27
To maintain waterlogged conditions, a swamp requires a location with high soil water credit (rainfall minus evaporation). If peat is present, it requires a quasi-continual, uninterrupted supply of water to avoid drying out. Much of the water supply comes from surface runoff or springflow. Groundwater accession to the substrate may also occur as a secondary recharge process. For a continual water supply to be available, the runoff behaviour must be advantageous for swamp development. Runoff patterns are dependent on regional topography and sedimentation. Sediment chokes can trap low-flow runoff. The best exponents of these swamps occur on Mesozoic sandstones, at altitude, in the western and southern areas of the Sydney Basin.
Hydraulic conductivity measurements for Hawkesbury Sandstone show a variation of about ±1 log cycle around the geometric mean at a fixed depth. A surface outcrop layer, therefore, may show a random layout of zones ranging from very low to very high conductivity. This, together with advantageous surface runoff conditions, creates the regional spatial pattern typical for these swamps.
There are three key threatening processes to swamps from longwall mining, as follows:
• Breach of the sealing layer under the swamp substrate (by surface tensile fracturing or intersection with the collapsed zone).
• Reduction or elimination of the substrate water supply (for example, if runoff is diverted by distant subsidence troughs or consumed by distant surface cracking).
• Fouling of the substrate water supply (for example, where surface discharge of low pH / high sulphate goaf water reports to a swamp).
A much rarer form of impact might be underground mine fires which may heat surficial media by a few degrees or more and compromise the flora and fauna habitat. No such situation is known to have occurred in the Southern Coalfield, however goaf fires have been reported in old mine workings at Lithgow, but it is understood that, since the time the fires were first discovered, swamps have not been observed above these workings.
4.3.2 Observed Impacts on the Swamp Sealing Layer
Wherever a swamp is undermined by a longwall panel, surface tensile cracking will compromise the sealing capacity of the rock supporting the swamp substrate. This effect is illustrated by most available monitoring records, that cover a sufficient time period, in the public domain. Wherever surface subsidence occurs, cracking is also likely to occur, to accommodate the tilts and strains to which the ground is subject. Mills (2012) reports that, based on an analysis of surface subsidence data from the Newcastle Coalfield (Tobin, 1998), the zone in the subsurface which is above a height of about three times the panel width generally shows no ground movement (full bridging), which suggests surface tensile fractures may not develop in this situation.
Detailed groundwater monitoring records for rock immediately underlying (and supporting) the swamp substrate are available for undermined swamps at Angus Place and Dendrobium collieries from public domain documents (environmental assessments and annual environmental reports available on the mine websites). Figure 11 illustrates swamp and longwall layouts, and monitoring locations, at Angus Place and Dendrobium mines.

Gujarat NRE No.1 Colliery Major Expansion Part 3A Application Groundwater Analysis
Coffey Projects GEOTLCOV24840AA-AB 19 June 2013
28
Figure 11. Undermined swamps at Dendrobium and Angus Place collieries.
Gujarat NRE No.1 Colliery Major Expansion Part 3A Application Groundwater Analysis
Coffey Projects GEOTLCOV24840AA-AB 19 June 2013
29
The assessment has been undertaken by first finding a relationship that equates monitored groundwater levels to rainfall and evaporation, and then using groundwater monitoring hydrographs for the rock sealing layer to identify variations in the hydraulic head of the sealing rock layer that are not due to climatic factors. Most swamp monitoring hydrographs for mines in the Sydney Basin have records that are too short to be able to unambiguously identify mine effects (with many piezometers installed after effects have occurred), however hydrographs for the following monitoring piezometers are exceptions and are the subject of this analysis:
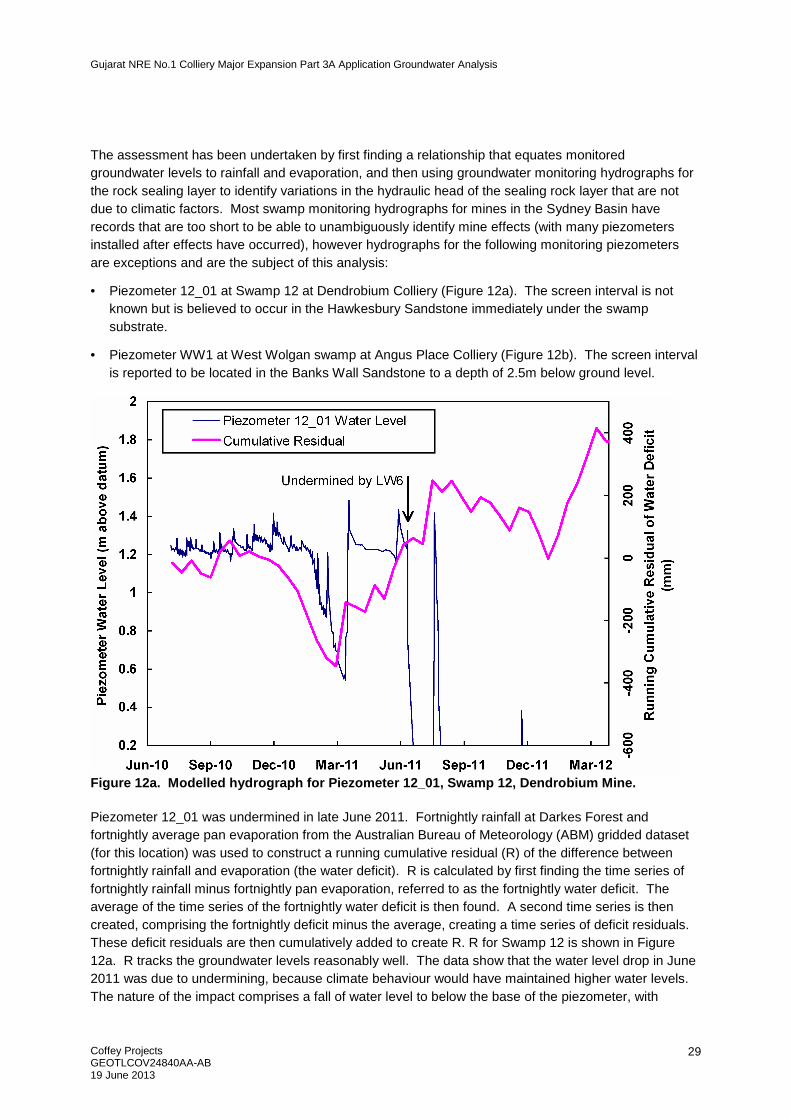
• Piezometer 12_01 at Swamp 12 at Dendrobium Colliery (Figure 12a). The screen interval is not known but is believed to occur in the Hawkesbury Sandstone immediately under the swamp substrate.
• Piezometer WW1 at West Wolgan swamp at Angus Place Colliery (Figure 12b). The screen interval is reported to be located in the Banks Wall Sandstone to a depth of 2.5m below ground level.
Figure 12a. Modelled hydrograph for Piezometer 12_01, Swamp 12, Dendrobium Mine.
Piezometer 12_01 was undermined in late June 2011. Fortnightly rainfall at Darkes Forest and fortnightly average pan evaporation from the Australian Bureau of Meteorology (ABM) gridded dataset (for this location) was used to construct a running cumulative residual (R) of the difference between fortnightly rainfall and evaporation (the water deficit). R is calculated by first finding the time series of fortnightly rainfall minus fortnightly pan evaporation, referred to as the fortnightly water deficit. The average of the time series of the fortnightly water deficit is then found. A second time series is then created, comprising the fortnightly deficit minus the average, creating a time series of deficit residuals. These deficit residuals are then cumulatively added to create R. R for Swamp 12 is shown in Figure 12a. R tracks the groundwater levels reasonably well. The data show that the water level drop in June 2011 was due to undermining, because climate behaviour would have maintained higher water levels. The nature of the impact comprises a fall of water level to below the base of the piezometer, with

Gujarat NRE No.1 Colliery Major Expansion Part 3A Application Groundwater Analysis
Coffey Projects GEOTLCOV24840AA-AB 19 June 2013
30
recharge events exhibiting much higher peaks and shorter duration. Krogh (2012) describes the impact as showing very abrupt recession of water levels compared to pre-mining conditions. The lowering of the hydraulic head in the sealing layer is caused by increased void space created by surface tensile fracturing. Associated increases in hydraulic conductivity cause the smaller recession times following recharge events.
Figure 12b. Modelled hydrograph for Piezometer WW1, West Wolgan Swamp, Angus Place Mine.
The impact at piezometer WW1 at Angus Place Mine is interpreted using an R comprising rainfall from Katoomba and average pan evaporation from the ABM gridded data set for this location. The hydrograph for piezometer WW1 is shown in Figure 12b. Undermining by LW940 in late 2008 appears to have had negligible impact. However, passage of the adjacent LW950, in mid July 2009, caused WW1 water levels to fall further than would have been expected from natural processes. Water levels following passage of LW950 do not match the rainfall deficit. Water level falls in mid-2011 occur a few months after passage of LW960, and do not appear to have been caused by natural processes.
Krogh (2012) presents the hydrographs for piezometers 15b_H1 to 15b_H3 for Swamp 15b at Dendrobium Mine (Figure 13). 15b_H1 lies over the centreline of LW8, while the others lie over chain pillars between LW7 and LW8. The piezometer screens are understood to be located in the rock sealing layer. Krogh (2012) interprets clear impact at 15b_H2 and 15b_H3 (during passage of the LW7 face adjacent to these locations in October 2011) in contrast to the hydrograph for 15b_H1 which was not undermined.

Gujarat NRE No.1 Colliery Major Expansion Part 3A Application Groundwater Analysis
Coffey Projects GEOTLCOV24840AA-AB 19 June 2013
31
Figure 13. Hydrographs for Swamp 15b piezometers at Dendrobium Mine (modified from Krogh, 2012).
4.3.2.1 Summary
Using the method of plotting R and hydrographs, a list of impacted swamps and mining geometry can be compiled. Table 1 lists other sites that have been studied, and the interpretation at each site. The data are interpreted to indicate the following:
• Clear impacts on the swamp sealing layer occurred for ground surfaces as high as 86m above the top of the collapsed zone. Results indicate that where the collapsed zone does not intersect the surface tensile fractured zone, the surface zone alone is the cause of cracking in the sealing layer.
• The responses at WE1 and WE2 (East Wolgan Swamp), and at WW1 and WW2 (West Wolgan Swamp), suggest that the most severe impact occurs at the fringes of a panel (in the tensional zone), to a minimum distance of half the panel width (0.5w) past the edge of the panel (that is, a distance of 1 panel width from the centre of the panel).
• LW930 passed alongside WW1 and WW2 in late June 2006. The groundwater level response appears to be due to drought conditions and suggests no impact from mining at distances of 1.6w (WW1) and 1.5w (WW2) from LW930.
• From all results in Table 1, the angle of influence for impacts (defined as the angle whose tangent is the lateral distance to an impact at the surface, divided by the overburden thickness) is a maximum of approximately 45° (WE1 and LW411 Springvale). These impacts are characterised by deformation of the rock underneath the swamp. Impacts were not interpreted to occur at two locations where the angle was approximately 50° (WW1 and LW930) and 45° (WW2 and LW930). These results agree closely with field observations discussed in Ouyang and Elsworth (1993) where

Gujarat NRE No.1 Colliery Major Expansion Part 3A Application Groundwater Analysis
Coffey Projects GEOTLCOV24840AA-AB 19 June 2013
32
an angle of influence of 42° was interpreted from a large database of dewatering information for water supply wells.
4.3.3 Potential Impacts on the Swamp Substrate
Once a swamp rock sealing layer is invaded by surface tensile cracks, there are a number of possible fates for the swamp ecological community, which may take significant amounts of time to become manifest. The ecology of a swamp is directly dependent on the moisture content of the substrate (this aspect defines the swamp). The fate of the moisture content is dependent on several factors. For example, if a low conductivity clay layer exists between the substrate and the cracked sealing layer, and the clay is not cracked during deformation, drainage of the swamp substrate may be impeded, and ecological impacts may be masked for some time. If the substrate is peat, and no clay layer exists between the peat and the cracked sealing layer, immediate drainage results, since peat usually has high lateral and vertical hydraulic conductivity. If the pre-mining water budget for the swamp is in excess (perennial drainage from the swamp via some water course), then post-mining substrate drainage may be mitigated (but at the expense of discharge to the water course).
In discussing time frames of impact on the swamp substrate and associated ecosystem, resulting from a compromised sealing layer due to longwall mining, NSW SC (2005) reports that changes in vegetation may not occur immediately. With time, impacted areas may experience changes in the original vegetation community, with species being favoured that prefer the new conditions. NSW SC report that the timeframe of these changes is likely to be long-term. While subsidence may be detected in the short term, displacement of susceptible species by those suited to altered conditions is likely to extend over years to decades as the vegetation equilibrates to the new hydrological regime (NSW SC, 2005).
It is likely that if a swamp is located where the collapsed zone and surface tensile zone intersect, the swamp substrate is likely to be completely drained, and permanent change to the swamp ecosystem will result.
4.4 Goaf Salts
The analysis of the height of the collapsed zone, and the areas where this zone connects with the surface tensile zone, identify areas where migration of high salinity water from the goafs can easily exit the surface, depending on the geometry of the mine workings and the post mining hydraulic head field (especially the equilibrium void water levels). The lowest point of the connected workings that intersects the ground surface will be the point where there is the highest risk of discharge of impacted groundwater. Where the top of the collapsed zone reaches to above the base of discharge boundaries (such as Cataract Creek), there will be the potential for impacted groundwater to travel towards the discharge point.
Underground void water levels will recover (from rainfall recharge) to the first point of drainage, therefore the potential for increases in salt concentration is mitigated. However, these processes may take in the order of decades to centuries.

Gujarat NRE No.1 Colliery Major Expansion Part 3A Application Groundwater Analysis
Coffey Projects GEOTLCOV24840AA-AB 19 June 2013
33
Table 1. Interpretation of groundwater monitoring hydrographs for mining under, or adjacent to, swamps at Angus Place and Dendrobium Coal Mines.
Site Date Undermined (and Longwall Panel)
Position* (panel widths from centre
panel)
Panel width (m)
Mined height (m)#
Overburden thickness
(m)
Angle of influence (Degrees)
Height of collapsed zone (m above mined
seam) ^
Top of Collapsed
Zone (mbgl)
Interpretation
KC1 Late May 2008 (LW940) 0.4 260 3.7 295 Over panel 289 6 Clear impact
WW1
Late June 2006 (LW930) 1.6 255 3.7 365 50 295 70 No mining impact.
Early Nov 2007 (LW940) 0.5 260 3.7 365 Over panel 300 65 No clear impact until passage of LW950 (next panel south)
Mid July 2009 (LW950) 0.8 270 3.7 375 30 312 63 Impact
WW2
Late June 2006 (LW930) 1.5 255 3.7 365 45 295 70 No mining impact
Late Oct 2007 (LW940) 0.3 260 3.7 361 Over panel 299 62 No clear impact until passage of LW950 (next panel south)
Mid July 2009 (LW950) 0.9 270 3.7 375 35 312 63 Impact
WW3 Mid Jun 2006 (LW930) 0.6 260 3.7 355 25 298 57 No pre-impact water level data available. Late Oct 2007 (LW940 0.5 260 3.7 355 Over panel 298 57 No pre-impact water level data available.
WW4 Early May 2006 (LW930) 0 260 3.7 352 Over panel 298 54 No pre-impact water level data available.
WE1
Late Jul 2006 (LW411 Springvale) 1 310 3.2 347 45 290 57 Impact masked by drought effect.
Early Apr 2010 (LW960) 0.5 295 3.7 350 Over panel 333 17 Reduced number of spikes after LW960, despite LDP04 discharges affecting groundwater levels.
WE2
Early Aug 2006 (LW411 Springvale) 0.9 310 3.2 342 40 289 53 Clear impact (water periodically above
ground pre-impact)
Early Apr 2010 (LW960) 0.6 295 3.7 345 30 333 12 Reduced number of spikes after LW960, despite LDP04 discharges affecting groundwater levels.
12_01 Mid Jun 2011 (LW7) 0 240 3.6 330 Over panel 264 66 Clear impact 15b_H2 Mid Oct 2011 (LW7) 0.6 240 3.6 322 30 263 59 Clear impact LC3_02 Mid Aug 2010 (LW6) 0.7 240 3.4 332 25 246 86 Clear impact
NS1 Early Feb 2009 (LW950) 0.3 260 3.7 346 Over panel 297 49 Impact masked by very last discharges at LDP06. Following water levels show impact.
NS2 Early Feb 2009 (LW950) 0 280 3.7 346 Over panel 317 29 Impact masked by very last discharges at LDP06. Following water levels show impact.
NS4 Early March 2004 (LW27) 0.5 280 3.7 307 Over panel 311 -4 No pre-impact water level data available.
* In units of panel width, from panel centre. Distance of 0.5 is at panel edge. Distance > 0.5 is off-panel. ^ Calculated using the equation in Tammetta (2012). # Estimate only.
Gujarat NRE No.1 Colliery Major Expansion Part 3A Application Groundwater Analysis
Coffey Projects GEOTLCOV24840AA-AB 19 June 2013
34
5 CONCLUSIONS AND RECOMMENDATIONS
5.1 Water Courses
Interpretation of risk areas for water courses is based on examining the calculated zones of protrusion, and taking into account the potential for the cumulative collapsed height to be larger than a simple summation of collapsed zone heights for individual seams (see Appendix A). This is done in a qualitative way (and based on past experience) by conservatively assuming the protruded area sizes represent minimum sizes.
5.1.1 Cataract Creek
A serious risk of cracking from the mined seam up to creek base is assessed for Cataract Creek, in the area shown in Figure 14a. According to calculations by the proponent, and Upper Nepean water supply water balances viewed online, Cataract Creek supplies about 6% of the total water generated by Lake Cataract. The author knows of no post-mining hydraulic head measurements over multiple longwall-mined coal seams. Unfortunately, reduction of risk using historical observations will not be possible until a world-wide database of direct hydraulic head measurements down the profile at (at least) about 10 locations over multiple mined seams world-wide is available. The risk to Cataract Creek is therefore considered immitigable.
Where surface tensile cracking does not connect to the collapsed zone, the surface tensile cracking may cause channel water to fall below the creek bed (entering the zone of increased storage in the surface cracking zone), reappearing downgradient where the surface tensile cracking zone is not of sufficient capacity to carry the flow. Most of the flow might be maintained, with an initial loss to storage created by the tensile cracking zone. The most well-known example of this type of impact is that suffered by the bed of Cataract River downstream of Broughtons Pass Weir in 1994, due to mining of longwall panels. NSW SC (2005) reports that water re-emerging downstream of the impacted zone was deoxygenated and contaminated with iron deposits, with absence of aquatic life. In 1998, a Mining Wardens Court Hearing concluded that 80% of the drying of the Cataract River was due to longwall mining operations, with the balance attributed to reduced flows regulated by Sydney Water (NSW SC, 2005). Further information on this impact is provided in NSW SC (2005).

Gujarat NRE No.1 Colliery Major Expansion Part 3A Application Groundwater Analysis
Coffey Projects GEOTLCOV24840AA-AB 19 June 2013
35
Figure 14a. Interpreted risk zone for Cataract Creek.
5.1.2 Lizard and Wallandoola Creeks
A serious risk of cracking from the mined seam up to the creek base is assessed for Wallandoola and Lizard Creeks, in the areas shown in Figure 14b. These creeks do not flow into Lake Cataract, however according to calculations by the proponent, and Upper Nepean water supply water balances viewed online, Lizard and Wallandoola Creeks have a combined average flow equal to about 25% of the total water generated by Lake Cataract.
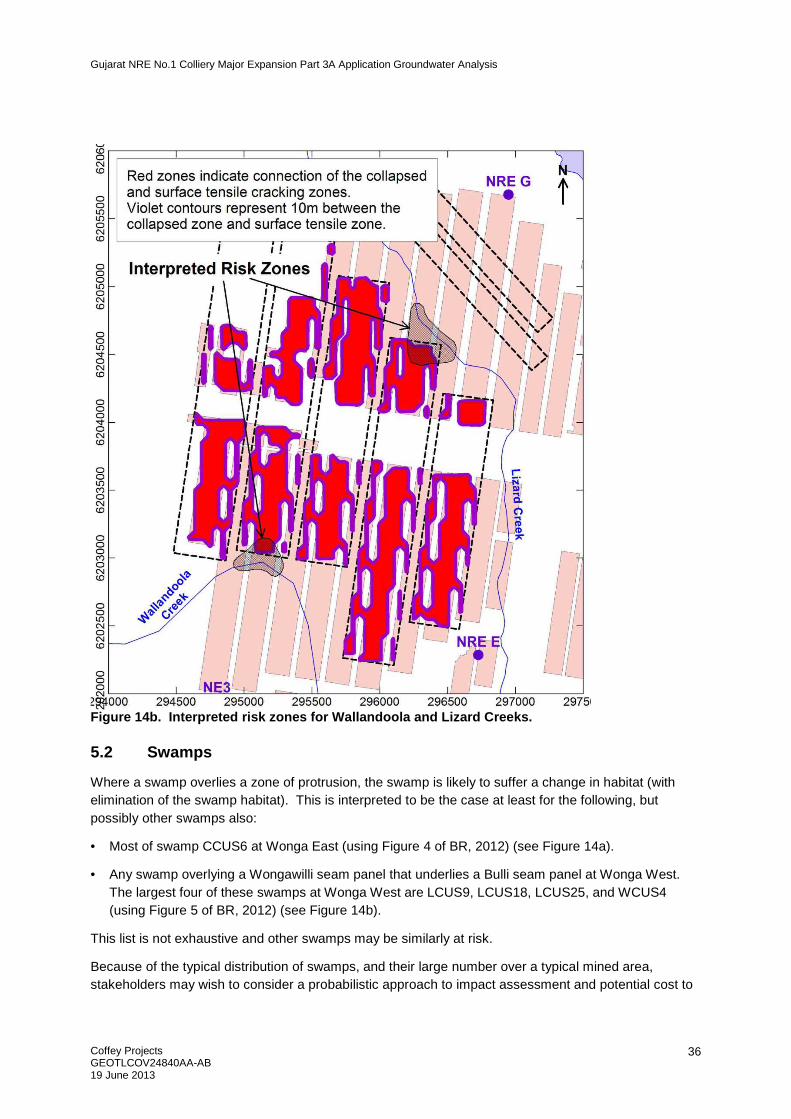
Gujarat NRE No.1 Colliery Major Expansion Part 3A Application Groundwater Analysis
Coffey Projects GEOTLCOV24840AA-AB 19 June 2013
36
Figure 14b. Interpreted risk zones for Wallandoola and Lizard Creeks.
5.2 Swamps
Where a swamp overlies a zone of protrusion, the swamp is likely to suffer a change in habitat (with elimination of the swamp habitat). This is interpreted to be the case at least for the following, but possibly other swamps also:
• Most of swamp CCUS6 at Wonga East (using Figure 4 of BR, 2012) (see Figure 14a).
• Any swamp overlying a Wongawilli seam panel that underlies a Bulli seam panel at Wonga West. The largest four of these swamps at Wonga West are LCUS9, LCUS18, LCUS25, and WCUS4 (using Figure 5 of BR, 2012) (see Figure 14b).
This list is not exhaustive and other swamps may be similarly at risk.
Because of the typical distribution of swamps, and their large number over a typical mined area, stakeholders may wish to consider a probabilistic approach to impact assessment and potential cost to

Gujarat NRE No.1 Colliery Major Expansion Part 3A Application Groundwater Analysis
Coffey Projects GEOTLCOV24840AA-AB 19 June 2013
37
society. GE (2009) conducted a socio-economic assessment of the proposed Bulli Seam Operations (at Appin and West Cliff collieries). Based on questionnaires posed to the public (for the Bulli Seam Operations), and results from a similar assessment for the Metropolitan Colliery, the community value associated with impacted swamps was estimated to be $2M per ha. If this cost is assumed to apply to a swamp with 100% probability of irreversible ecosystem change (elimination of the swamp habitat), then values may be developed for other probabilities of elimination, for mining outside zones of protrusion, and applied to the summed swamp areas in the entire proposed panel footprint. Typical peer-reviewed subsidence parameters estimated in the course of an environmental impact assessment, combined with a relationship between these parameters and observed impacts, may be one of several approaches to estimating probabilistic costs.
This approach mitigates the uncertainty involved in attempting to predict the potential ecological change for each individual swamp. Instead, the approach adopts some percentage, based on available historical observations in the Western and Southern Coalfields, as a best estimate of the proportion of the total swamp habitat likely to be eliminated over a proposed mine area (for example, in the Wonga West area as a whole). The monetary value associated with the adopted probability for an area can then be used in a cost-benefit analysis of the return (monetary, aesthetic, etc.) to society provided by the following two competing processes:
• Continued swamp survival.
• Longwall mining.
The method does not preclude the option of individual analysis of larger, more significant swamps, if required.
5.3 Numerical Groundwater Flow Simulation
Using a calibrated model, numerical simulation is appropriate for calculating the reduced baseflow to, or increased seepage from, water courses and Lake Cataract, resulting from drawdown in hydraulic heads underneath these features, caused by mining. Common algorithms employed for these simulations assume no catastrophic deformation (however some, such as FEFLOW, can incorporate time-varying hydraulic parameters). The models can calculate drawdowns resulting from imposed hydraulic head boundary conditions (that may vary with time) within cells or elements.
5.3.1 Model Calibration
The current model is considered uncalibrated and model results cannot be used for impact assessment. If the proponent wishes to assess impacts using model results, the model will require simultaneous transient calibration to measured hydraulic heads (throughout the depth profile), estimated baseflow to water courses, and measured void discharges, as has been undertaken for other mines in the Southern Coalfield. Sufficient data are available for this to be undertaken, and to significantly reduce uncertainty and improve the reliability of model results. In conjunction with hydraulic heads, simultaneous calibration of surface discharges and deep discharges is a vital way of attempting to calibrate the crucial vertical hydraulic conductivity distribution of the subsurface, and the degree of insulation afforded by this distribution between shallow and deep flow processes.
To obtain a starting heads distribution, for the transient calibration period, that will not destabilise at commencement of simulation (severe departures over the initial period from incompatible parameters), a pre-calibration transient model is likely to be required.
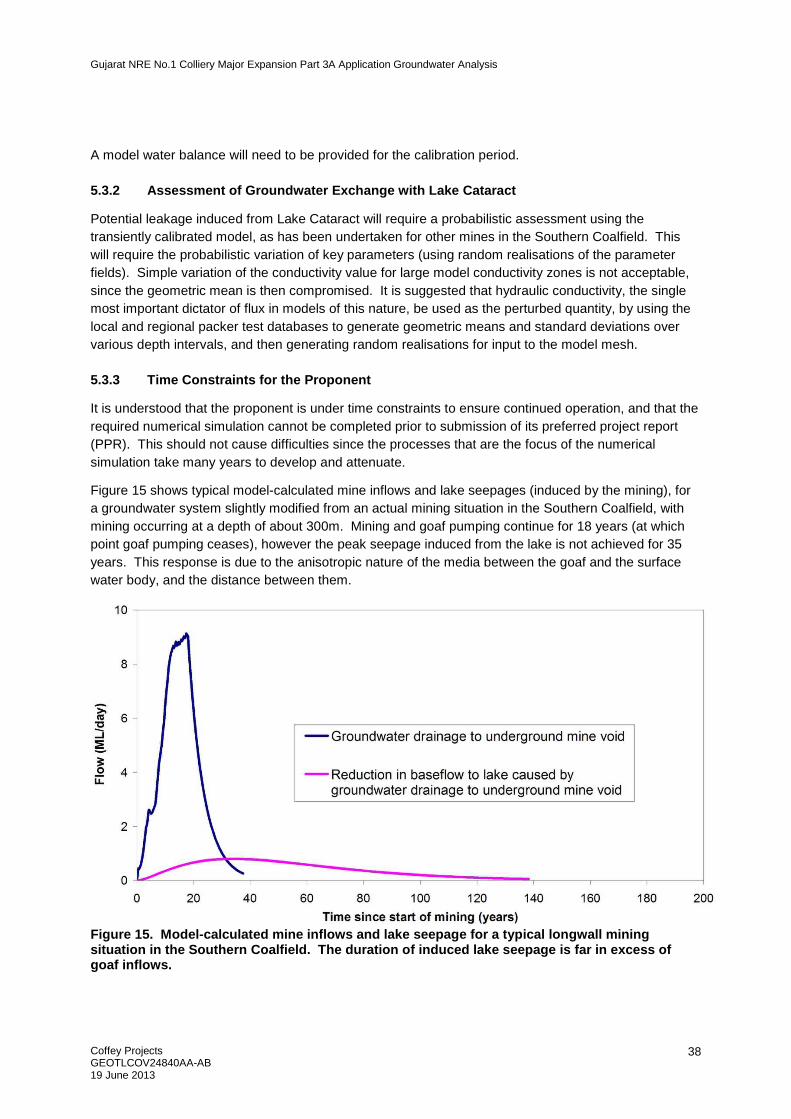
Gujarat NRE No.1 Colliery Major Expansion Part 3A Application Groundwater Analysis
Coffey Projects GEOTLCOV24840AA-AB 19 June 2013
38
A model water balance will need to be provided for the calibration period.
5.3.2 Assessment of Groundwater Exchange with Lake Cataract
Potential leakage induced from Lake Cataract will require a probabilistic assessment using the transiently calibrated model, as has been undertaken for other mines in the Southern Coalfield. This will require the probabilistic variation of key parameters (using random realisations of the parameter fields). Simple variation of the conductivity value for large model conductivity zones is not acceptable, since the geometric mean is then compromised. It is suggested that hydraulic conductivity, the single most important dictator of flux in models of this nature, be used as the perturbed quantity, by using the local and regional packer test databases to generate geometric means and standard deviations over various depth intervals, and then generating random realisations for input to the model mesh.
5.3.3 Time Constraints for the Proponent
It is understood that the proponent is under time constraints to ensure continued operation, and that the required numerical simulation cannot be completed prior to submission of its preferred project report (PPR). This should not cause difficulties since the processes that are the focus of the numerical simulation take many years to develop and attenuate.
Figure 15 shows typical model-calculated mine inflows and lake seepages (induced by the mining), for a groundwater system slightly modified from an actual mining situation in the Southern Coalfield, with mining occurring at a depth of about 300m. Mining and goaf pumping continue for 18 years (at which point goaf pumping ceases), however the peak seepage induced from the lake is not achieved for 35 years. This response is due to the anisotropic nature of the media between the goaf and the surface water body, and the distance between them.
Figure 15. Model-calculated mine inflows and lake seepage for a typical longwall mining situation in the Southern Coalfield. The duration of induced lake seepage is far in excess of goaf inflows.

Gujarat NRE No.1 Colliery Major Expansion Part 3A Application Groundwater Analysis
Coffey Projects GEOTLCOV24840AA-AB 19 June 2013
39
A reasonable course of action would be that stakeholders allow an extension of three months for assessment of groundwater impacts, at which point the proponent must provide the groundwater impact assessment according to the recommendations given above (assuming the calibration is successful). The proponent can be allowed to continue operations between the submission date for the PPR and three months from notification being given to the proponent to undertake the recommendations above, subject to a condition that the proponent provides results within the allotted time frame, from a successfully calibrated model. The effects being modelled are long-term, and an extension of a few months, particularly at the beginning of mining, will make minimal difference.
5.4 Monitoring
To assist with model calibration, drawdown information should be sourced from:
• If available, groundwater monitoring data collected during mining of the Balgownie seam longwalls.
• Installation and monitoring of a multiple device installation located on the northern edge of LW6 somewhere near the start (but not at the start), based on the position of the working face at the end of April 2013. The most important information will come from mid range strata such as the Bulgo Sandstone and adjacent units.
For the purpose of swamp impact assessment, the proponent may wish to install a multiple device installation over the centre of a mined longwall to compare subsequent monitoring data to the calculations made for the height of the accumulated collapsed zone in the separate analysis above. Given the equivalence between the height of desaturation and the top of the zone of large downward movement, a multiple point borehole extensometer array could also be installed, but over an unmined panel.
With the present state of knowledge, it is unlikely that sufficient field measurements could be obtained by the proponent, prior to completion of the groundwater impact assessment, to justify an assessment attempting to reduce the risk to Cataract, Wallandoola, and Lizard Creeks from impacts caused by the proposed development.
5.5 Goaf Salts
High salinity water from the goafs might easily exit the surface wherever the collapsed zone intersects the surface tensile cracking zone, depending on the geometry of the mine workings and the post mining hydraulic head field (especially the equilibrium void water levels). The lowest point of the connected workings that intersects the ground surface will be the point where there is the highest risk of discharge of impacted groundwater. Where the top of the collapsed zone reaches to above the base of discharge boundaries (such as Cataract Creek), there will be the potential for impacted groundwater to travel towards the discharge point.
Gujarat NRE No.1 Colliery Major Expansion Part 3A Application Groundwater Analysis
Coffey Projects GEOTLCOV24840AA-AB 19 June 2013
40
6 REFERENCES
Biosis Research Pty Ltd (BR). 2012. NRE No.1 Colliery Major Expansion – Upland Swamp Assessment. Report 15094 prepared for Gujarat NRE Coking Coal Ltd. November.
Booth CJ and Spande ED. 1992. Potentiometric and Aquifer Property Changes above Subsiding Longwall Mine Panels, Illinois Basin Coalfield. Ground Water, Volume 30, No. 3, pp 362-368.
Booth CJ, Spande ED, Pattee CT, Miller JD, and Bertsch LP. 1998. Positive and negative impacts of longwall mine subsidence on a sandstone aquifer. Environmental Geology, 34 (2/3), pp 223-233.
Cardno (NSW/ACT) Pty Ltd. 2012. Longwalls 4 and 5;Maingates 6, 7 and 8: Application for s75W Modification 1 to MP 10_0046 – Preliminary Works. Report 112069-01/Report 001 Ver 2, prepared for Gujarat NRE. August.
Coffey Geosciences Pty Ltd. 1982. Assessment of Water Inflows to Shaft, Wilton, NSW. Report No. S6955/1-AB. November. Prepared for Crooks Mitchell Peacock Stewart Pty Ltd and Methane Drainage Pty Ltd.
Coffey Geotechnics Pty Ltd (Coffey). 2008. Transient Groundwater Modelling Study Upper Nepean (Kangaloon) Borefield. Report GEOTLCOV23386AB-AA. Report prepared for the Sydney Catchment Authority. December.
GeoTerra Pty Ltd. 2012a. NRE No.1 Colliery Major Expansion Groundwater Assessment. Report GUJ1-GWR1C, prepared for Gujarat NRE Coking Coal Pty Ltd. November.
GeoTerra Pty Ltd. 2012b. NRE No.1 Colliery Major Expansion Stream Assessment. Report GUJ1-SWR1D, prepared for Gujarat NRE Coking Coal Pty Ltd. November.
Gillespie Economics (GE). 2009. Bulli Seam Operations Socio-Economic Assessment. Prepared for Illawarra Coal Holdings Pty Limited.
Goddon MacKay Logan (GML). 2004. South Bulli Colliery Conservation Management Plan, Part 1. June.
Golder Associates (GA). 2012. NRE No.1 Colliery: Wonga East and Wonga West Groundwater Modelling. Report 107636001-003-Rev4 prepared for Geoterra Pty Ltd. November.
Holla L and Barclay E. 2000. Mine subsidence in the southern coalfield, NSW, Australia. NSW Department of Mineral Resources.
Hutcheson SM, Kipp JA, Dinger JS, Carey DI, Sendlein LVA, and Secrist GI. 2000. Effects of Longwall Mining on Hydrogeology, Leslie County, Kentucky; Part 3: Post-Mining Conditions. Kentucky Geological Survey, Report of Investigations 6, Series XI
Krogh M. 2012. Assessment of impacts over Dendrobium Mine. Final Report, Office of Environment and Heritage. NSW Department of Premiers and Cabinet. August.
Mills K. 2012. Observations of ground movements within the overburden strata above longwall panels and implications for groundwater impacts. 38th Symposium on the Advances in the Study of the Sydney Basin. Coalfield Geology Council of NSW. 10 to 11 May 2012, Pokolbin, NSW.
NSW Planning Assessment Commission (PAC). 2010. The PAC Review of the Bulli Seam Operations Project. Sydney. July.
Gujarat NRE No.1 Colliery Major Expansion Part 3A Application Groundwater Analysis
Coffey Projects GEOTLCOV24840AA-AB 19 June 2013
41
NSW Scientific Committee (SC). 2005. Final Determination, Alteration of habitat following subsidence due to longwall mining, Key threatening process listing. Gazetted Friday, July 15, 2005 under Schedule 3 of the Threatened Species Conservation Act 1995.
Ouyang Z and Elsworth D. 1993. Evaluation of groundwater flow into mined panels. International Journal of Rock Mechanics, Mining Sciences, and Geomechanics. Abstracts, Vol. 30, No. 2, pp. 71 – 80.
Reid P. 1996. Effect of mining on permeability of rock strata in the Southern Coalfield. Symposium on Geology in Longwall Mining, 12–13 November, pp 273-280.
Seedsman Geotechnics Pty Ltd (SG). 2012. Gujarat NRE No.1 Colliery: Management of subsidence risks and associated with Wongawilli Seam Extraction. Report GNE-136.docx, prepared for Gujarat NRE Minerals. July.
Seedsman Geotechnics Pty Ltd (SG). 2013. Gujarat NRE No.1 Colliery: Review of subsidence predictions after the extraction of LW4. Report GNE-143.docx, prepared for Gujarat NRE Minerals. February.
Singh RN and Jakeman M. 1999. Longwall mining under the Cataract Reservoir. Proceedings, Mine, Water and Environment, IMWA Congress, Sevilla, Spain, 1999, p27-34.
Singh RN and Jakeman M. 2001. Strata monitoring investigations around longwall panels beneath the Cataract Reservoir. Mine Water and the Environment, Volume 20 (2), p55-64.
Strata Engineering (Australia) Pty Ltd. 2012. The potential for a pillar run in the Balgownie and Bulli Seams following the extraction of the Wongawilli East longwall panels. Letter Report 06-001-NRE-2, prepared for Gujarat NRE Coking Coal Limited. October.
Tammetta P. 2012. Estimation of the height of complete groundwater drainage above mined longwall panels. Groundwater, DOI number 10.1111/gwat.12003.
Tobin C. 1998. A Review of the Newcastle Subsidence Prediction Curve. Proceedings of the Australian Institute of Mining and Metallurgy, No. 1, p. 59-63.
WRM Water and Environment (WRM). 2012. NRE No.1 Colliery Surface Water Modelling. Report 0637-01-B[Rev7] prepared for Gujarat NRE Coking Coal Limited. November.

Gujarat NRE No.1 Colliery Major Expansion Part 3A Application Groundwater Analysis
Coffey Projects GEOTLCOV24840AA-AB 19 June 2013
42
For and on behalf of Coffey Projects Pty Ltd
Paul Tammetta
Associate Subsurface Hydrologist

Coffey Geotechnics Pty Ltd ABN 93 056 929 483
As a client of Coffey you should know that site subsurface conditions cause more constructionproblems than any other factor. These notes have been prepared by Coffey to help youinterpret and understand the limitations of your report.
Your report is based on project specific criteria
Your report has been developed on the basis of yourunique project specific requirements as understoodby Coffey and applies only to the site investigated.Project criteria typically include the general nature ofthe project; its size and configuration; the location ofany structures on the site; other site improvements;the presence of underground utilities; and the additionalrisk imposed by scope-of-service limitations imposedby the client. Your report should not be used if thereare any changes to the project without first askingCoffey to assess how factors that changed subsequentto the date of the report affect the report'srecommendations. Coffey cannot accept responsibilityfor problems that may occur due to changed factorsif they are not consulted.
Subsurface conditions can change
Subsurface conditions are created by natural processesand the activity of man. For example, water levelscan vary with time, fill may be placed on a site andpollutants may migrate with time. Because a reportis based on conditions which existed at the time ofsubsurface exploration, decisions should not be basedon a report whose adequacy may have been affectedby time. Consult Coffey to be advised how time mayhave impacted on the project.
Interpretation of factual data
Site assessment identifies actual subsurface conditionsonly at those points where samples are taken andwhen they are taken. Data derived from literatureand external data source review, sampling and subsequent laboratory testing are interpreted bygeologists, engineers or scientists to provide anopinion about overall site conditions, their likelyimpact on the proposed development and recommendedactions. Actual conditions may differ from those inferredto exist, because no professional, no matter howqualified, can reveal what is hidden by
Your report will only givepreliminary recommendationsYour report is based on the assumption that thesite conditions as revealed through selectivepoint sampling are indicative of actual conditionsthroughout an area. This assumption cannot besubstantiated until project implementation hascommenced and therefore your report recommendationscan only be regarded as preliminary. Only Coffey,who prepared the report, is fully familiar with thebackground information needed to assess whetheror not the report's recommendations are valid andwhether or not changes should be considered asthe project develops. If another party undertakesthe implementation of the recommendations of thisreport there is a risk that the report will be misinterpretedand Coffey cannot be held responsible for suchmisinterpretation.
earth, rock and time. The actual interface betweenmaterials may be far more gradual or abrupt thanassumed based on the facts obtained. Nothing canbe done to change the actual site conditions whichexist, but steps can be taken to reduce the impact ofunexpected conditions. For this reason, ownersshould retain the services of Coffey through thedevelopment stage, to identify variances, conductadditional tests if required, and recommend solutionsto problems encountered on site.
Your report is prepared forspecific purposes and personsTo avoid misuse of the information contained in yourreport it is recommended that you confer with Coffeybefore passing your report on to another party whomay not be familiar with the background and thepurpose of the report. Your report should not beapplied to any project other than that originallyspecified at the time the report was issued.
Important information about your Coffey Report

* For further information on this aspect reference should bemade to "Guidelines for the Provision of Geotechnicalinformation in Construction Contracts" published by theInstitution of Engineers Australia, National headquarters,Canberra, 1987.
Interpretation by other design professionals
Costly problems can occur when other design professionals develop their plans based on misinterpretationsof a report. To help avoid misinterpretations, retainCoffey to work with other project design professionalswho are affected by the report. Have Coffey explainthe report implications to design professionals affectedby them and then review plans and specificationsproduced to see how they incorporate the reportfindings.
Data should not be separated from the report*
The report as a whole presents the findings of the siteassessment and the report should not be copied inpart or altered in any way.
Logs, figures, drawings, etc. are customarily includedin our reports and are developed by scientists,engineers or geologists based on their interpretationof field logs (assembled by field personnel) andlaboratory evaluation of field samples. These logs etc.should not under any circumstances be redrawn forinclusion in other documents or separated from thereport in any way.
Geoenvironmental concerns are not at issue
Your report is not likely to relate any findings,conclusions, or recommendations about the potentialfor hazardous materials existing at the site unlessspecifically required to do so by the client. Specialistequipment, techniques, and personnel are used toperform a geoenvironmental assessment.Contamination can create major health, safety andenvironmental risks. If you have no information aboutthe potential for your site to be contaminated or createan environmental hazard, you are advised to contactCoffey for information relating to geoenvironmentalissues.
Rely on Coffey for additional assistance
Coffey is familiar with a variety of techniques andapproaches that can be used to help reduce risks forall parties to a project, from design to construction. Itis common that not all approaches will be necessarilydealt with in your site assessment report due toconcepts proposed at that time. As the projectprogresses through design towards construction,speak with Coffey to develop alternative approachesto problems that may be of genuine benefit both intime and cost.
Responsibility
Reporting relies on interpretation of factual informationbased on judgement and opinion and has a level ofuncertainty attached to it, which is far less exact thanthe design disciplines. This has often resulted in claimsbeing lodged against consultants, which are unfounded.To help prevent this problem, a number of clauseshave been developed for use in contracts, reports andother documents. Responsibility clauses do not transferappropriate liabilities from Coffey to other parties butare included to identify where Coffey's responsibilitiesbegin and end. Their use is intended to help all partiesinvolved to recognise their individual responsibilities.Read all documents from Coffey closely and do nothesitate to ask any questions you may have.
Coffey Geotechnics Pty Ltd ABN 93 056 929 483
Important information about your Coffey Report

Appendix A Logic for Accumulation of Collapsed Zone Heights

Accumulation of Individual Collapsed Zone heights
Collapsed zone heights for full extraction workings in single seam operations have been estimated using the results of Tammetta (2012). In a multiple seam mining situation, the total height of the collapsed zone is assessed by considering two extremes.
In the first extreme, two identical seams are separated exactly by H, so that H for the lower seam touches the floor of the upper seam (assuming identical panel widths and mined heights, and a small variation in the d0.2 term). In this situation the total height of the collapsed zone above the lower seam is 2H (arithmetic accrual).
In the second extreme, the two seams are adjacent. If, theoretically, they were to be mined simultaneously, then H due to both seams would be about 2.5H (assuming a mined height of 3.1m per seam). If each seam was mined at different times, the total H could be less than 2.5H (but not less than 2H).
The assessment in the report assumes a linear accrual. However, in identifying areas of risk to water courses, the interpretation takes into account the potential for the cumulative collapsed height to be larger than an arithmetic accrual of collapsed zones for individual seams, but only in a qualitative way (and based on past experience) due to an absence of direct measurements for these situations.
Pillar Crushing
Crushing of remnant pillars due to proposed mining is likely to increase collapsed zone heights. However, in an assessment of the potential for the extraction of the proposed Wongawilli panels to induce catastrophic pillar failure between Balgownie Seam panels 6 and 7, SE (2012) concludes that it is unlikely to induce this type of failure in the Balgownie and Bulli Seams. For calculating H, this information is used to support the assumption that pillars in the Balgownie and Bulli Seams remain largely intact following mining of the Wongawilli Seam.
SE (2012) also concludes that, based on surface subsidence measurements for the Balgownie longwalls (above the maximum subsidence predictions for the Southern Coalfield), pillars in the Bulli seam overlying these panels are likely to have failed. This has been taken into account in designation of full extraction blocks for the Bulli Seam.

NSW Department of Planning and Infrastructure
GUJARAT NRE NO.1 COLLIERY MAJOR EXPANSION PROJECT PART 3A APPLICATION
Preferred Project Groundwater Assessment
26 November 2013

i
TABLE OF CONTENTS
1. Introduction ................................................................................................................................... 1
2. Review of the PPR ......................................................................................................................... 2
2.1. Changes to the Mine Plan ....................................................................................................... 2
2.2. Longwall LW7.......................................................................................................................... 4
2.3. Numerical Simulation Strategy ................................................................................................ 7
2.3.1. Probabilistic Analysis ...................................................................................................... 7
2.3.2. Calibration Database ...................................................................................................... 7
2.3.3. Other Clarifications ......................................................................................................... 9
2.4. Swamps ................................................................................................................................ 10
3. Conclusions and Recommendations ........................................................................................ 11
4. References ................................................................................................................................... 12
TABLES
Table 1. Changes to Longwall Dimensions from the Original Mine Plan.
FIGURES
Figure 1. Comparison of Previous and Current Mine Plans for Wonga East.
Figure 2. Subsidence Monitoring Results for the Balgownie and Wongawilli Panels at Wonga East.
Figure 3. Estimated Angle of Hydraulic Head Influence for Longwall Panels.
Figure 4. VWP Hydrographs for Monitoring Location GW1.
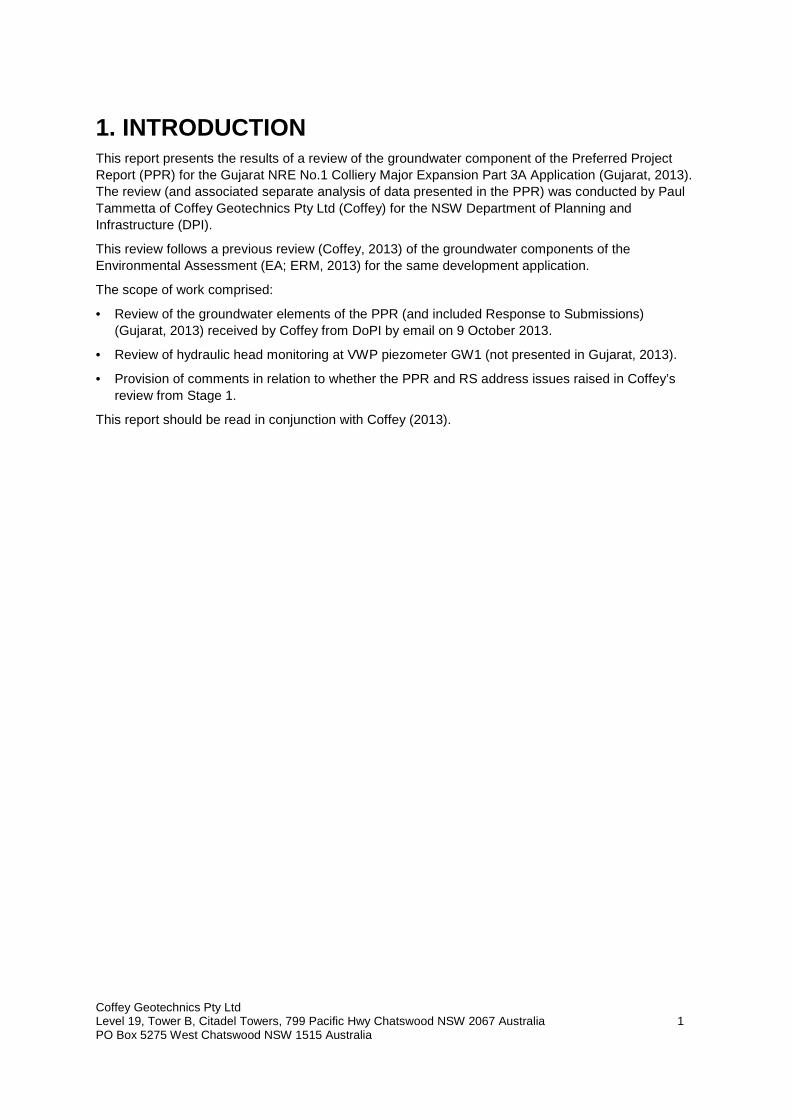
Coffey Geotechnics Pty Ltd Level 19, Tower B, Citadel Towers, 799 Pacific Hwy Chatswood NSW 2067 Australia PO Box 5275 West Chatswood NSW 1515 Australia
1
1. INTRODUCTION This report presents the results of a review of the groundwater component of the Preferred Project Report (PPR) for the Gujarat NRE No.1 Colliery Major Expansion Part 3A Application (Gujarat, 2013). The review (and associated separate analysis of data presented in the PPR) was conducted by Paul Tammetta of Coffey Geotechnics Pty Ltd (Coffey) for the NSW Department of Planning and Infrastructure (DPI).
This review follows a previous review (Coffey, 2013) of the groundwater components of the Environmental Assessment (EA; ERM, 2013) for the same development application.
The scope of work comprised:
• Review of the groundwater elements of the PPR (and included Response to Submissions) (Gujarat, 2013) received by Coffey from DoPI by email on 9 October 2013.
• Review of hydraulic head monitoring at VWP piezometer GW1 (not presented in Gujarat, 2013).
• Provision of comments in relation to whether the PPR and RS address issues raised in Coffey’s review from Stage 1.
This report should be read in conjunction with Coffey (2013).

2
2. REVIEW OF THE PPR
2.1. Changes to the Mine Plan The proponent has made changes to the longwall layout from the EA (ERM, 2013) to the PPR (Gujarat, 2013). Longwalls LW4 and LW5 have already been mined and are not are part of the future mine plan being considered.
In the PPR, the Wonga West longwalls will no longer be mined. The Wonga East longwalls have been changed as follows:
• LW1 to LW3: Length, Width, Orientation (towards the south).
• LW6: Length.
• LW7: Length, Width, Position.
• LW8 removed.
• LW9 to LW11: Length, Position, Orientation (towards the west).
Table 1 (after Table 4 of the PPR) lists the dimensions of the changes to the Wonga East longwalls.
Table 1. Changes to Longwall Dimensions from the Original Mine Plan.
Longwall Width (rib to rib) (m) Length (m) Pillar Width (m)
EA PPR EA PPR EA PPR 1 105 131 1040 805 40 40 2 105 125 1080 858 40 40 3 105 150 1150 863 40 40 6 150 150 1125 1120 60 45 7 150 131 1230 1175 60 45 8 150 Removed 1375 Removed 60 Removed 9 150 150 1280 796 60 45 10 150 150 1020 896 60 45 11 150 150 780 630 60 40
The new mine plan is presented in Figure 4 of the PPR however no scale is shown and it is not georeferenced. This mine plan was positioned with respect to the MGA by overlaying the EA and PPR mine plans of Figure 4 of the PPR onto a georeferenced drawing of the EA mine plan, and scaling it until a visual match was obtained between the two versions of the EA mine plan. The result is shown in Figure 1. This process allowed positioning of Cataract Creek (not shown in Figure 4 of the PPR) with respect to LW7 of the PPR mine plan. However, the positioning error from this process is unknown.
The mined thickness will vary between 2.5m and 3.0m (depending mainly on coal quality). The mined height for LW4 was previously reported as 3.1m (Geoterra, 2012a). SG (2012) reported a mined height of 3.2m for this panel.
Based on the new mine plane, the PPR states that there is an interpreted risk of significant secondary impact to swamps BCUS4 and CCUS4.
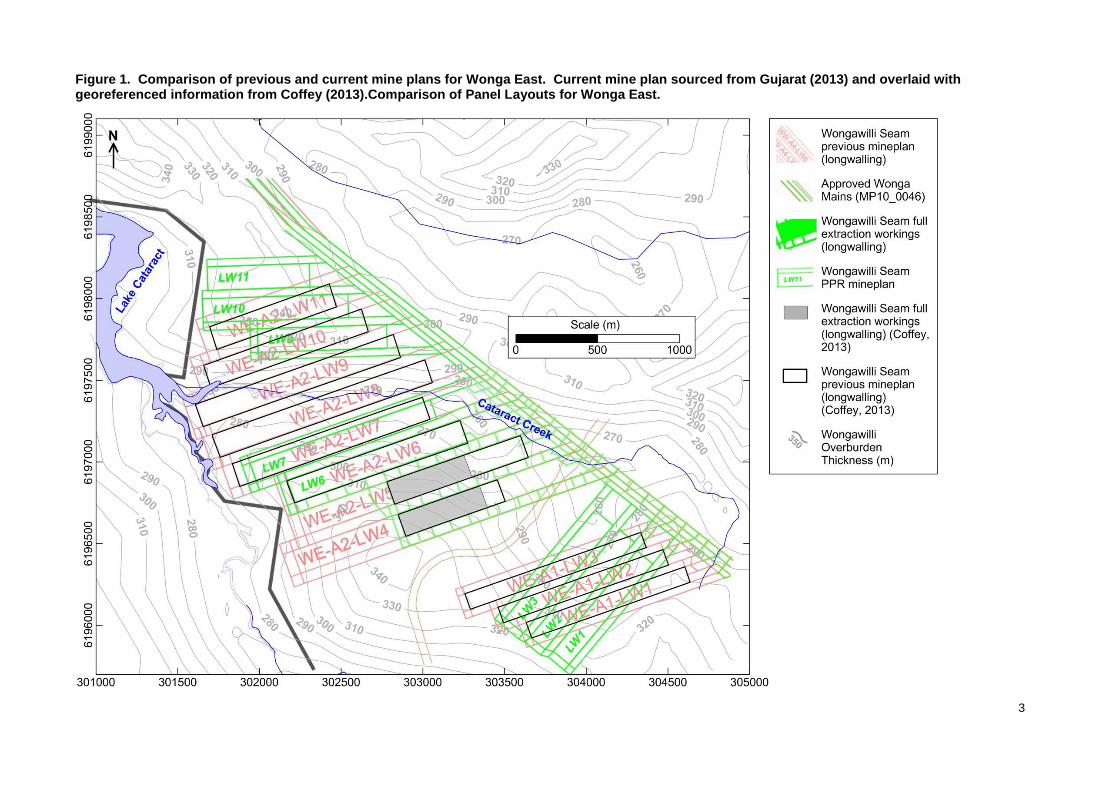
3
Figure 1. Comparison of previous and current mine plans for Wonga East. Current mine plan sourced from Gujarat (2013) and overlaid with georeferenced information from Coffey (2013).Comparison of Panel Layouts for Wonga East.

2.2. Longwall LW7 The new layout of LW7 (Figure 1) is still considered to pose a risk to the capacity of the channel of Cataract Creek to transmit surface water. A significant element of the risk is demonstrated by the indication provided by subsidence monitoring of Balgownie and Wongawilli Seam panels in Wonga East as discussed in the PPR. Incremental Balgownie panel subsidence ranged between 0.9m and 1.2m where overlying Bulli goaf (room and pillar panels with pillar extraction) was present, approaching 80% of the mined height (implying a mined height of about 1.5m for the Balgownie panels). In unusual areas (latent subsidence, goaf edge), the incremental subsidence reached 1.4m, approaching 100% of the mined height. Figure 2a (after Figure 49 of the PPR) shows these results.
Maximum incremental subsidence at Wongawilli LW4 was 1.4m. For the mining geometry of LW4, and assuming single seam mining, surface subsidence would be expected to range between 0.1m and 0.3m, about 14% of the observed subsidence where Balgownie and Bulli goafs are present. The PPR states that cross panel subsidence profiles indicate that the maximum subsidence in the centre of the Wongawilli panels is controlled by overburden bridging capacity rather than strata recompression. The presence of overlying goafs reduces the bridging capacity of overlying strata, having a significant effect on maximum incremental subsidence for the Wongawilli panels. It was also observed that the additional subsidence was confined to the panel footprint. Figure 2b (after Figure 58 of the PPR) shows these results.
Although a relationship between surface subsidence and the height of desaturation (H) is unavailable (due to the significantly greater dependence of surface subsidence on overburden depth compared to H), these results indicate that there is a high likelihood that the height of H for a Wongawilli panel will be larger than that calculated using the relationship for single seam mining (Tammetta, 2012). Since the LW7 width has only been reduced by 19m (about 13% of the original width), it is reasonable to conservatively assume that the height of the collapsed zone (H) intersects the ground surface at the northern corner of LW7. The minimum separation distance between the LW7 collapsed zone and the Cataract Creek channel centreline is approximately 45m (at the northern corner of LW7, see Figure 1). The positioning of the new mine plan is approximate (see above) and the channel centreline was digitised from information in Geoterra (2012a, 2012b) and ERM (2013) (see Coffey, 2013).
Information relating to changes in hydraulic conductivity just off the panel footprint is particularly sparse, however several authors have estimated the extent of an impact zone from observations of dewatering in water supply wells off the panel footprint. This zone is just off-panel, and adjacent to the panel. It is where a relatively fast response is observed in hydraulic heads following caving, usually because of an immediate change in void ratio from fracturing. Long-term effects on hydraulic heads extend further, but are caused by laminar flow induced by drainage. In the off-panel impact zone, deformation is generally less than, and of a different character to, deformation within the collapsed zone. However, given the small lateral distance to the potential collapsed zone of the panel, and the potential effects of topography on subsidence, there is a risk of direct connection of the creek channel to the collapsed zone, through deformed media having enhanced hydraulic conductivity in the impact zone.

5
Figure 2. Subsidence monitoring results for the (a) Balgownie and (b) Wongawilli panels at Wonga East (after Figures 49 and 58 of the PPR).

6
Ouyang and Elsworth (1993) estimated a probable angle of influence (defined as the angle whose tangent is the lateral distance to an impact at the surface, divided by the overburden thickness) of 42° from 39 off-panel wells (Figure 3). Cifelli and Rauch (1986) estimated an average angle of influence of about 20°, with several observations of impact outside this angle. The Australian Federal Government (2013) estimated a maximum angle of influence for impacts to peat swamps of approximately 45°. These impacts were characterised by deformation of the rock underneath the swamp.
Figure 3. Estimated angle of hydraulic head influence for longwall panels (after Ouyang and Elsworth, 1993).
The overburden thickness at the northern corner of LW7 is approximately 260m, so that the creek channel falls within interpreted zones of impacts to hydraulic heads from longwall mining. Using 45° as an upper limit, the angle of influence would extend surface impacts to a distance of about 260m from the boundary of LW7 in the vicinity of its northern corner. This estimate does not include the effects of multiple mined seams, nor the effects of topographic gradients, both of which may alter the zone of influence.
Where the top of a collapsed zone is some distance below the surface, the surface disturbance at a channel bed may not be strongly hydraulically linked to the collapsed zone. In the case of LW7, there is considered to be a risk of direct hydraulic connection between the creek channel and goaf, through the collapsed zone, where the channel comes to close to the panel edge. The level of risk is difficult

7
to quantify but warrants consideration. Monitoring of groundwater response and ground deformation in this area during the early stages of LW7 retreat may be useful in better informing the risk.
2.3. Numerical Simulation Strategy In the PPR, the proponent presents a strategy for groundwater numerical simulation which largely satisfies the recommendations made in Coffey (2013). However, this strategy discusses potential or perceived limitations with the recommended probability analysis and the database available for calibration. Further clarification is provided below on these facets.
The strategy also makes assumptions which are stated as being based on recommendations in Coffey (2013). The relevant recommendations in Coffey (2013) are clarified in relation to the assumptions made in the proponent’s strategy. These clarifications are also provided below.
2.3.1. Probabilistic Analysis The probabilistic analysis of induced seepage from Lake Cataract does not need to be undertaken using the Monte Carlo process. This was not stipulated in Coffey (2013).
It is considered that manual running of around 30 to 40 cases, with hydraulic conductivity arrays varied for each, would be sufficient to guide the assessment of uncertainty. Required output would comprise the change in baseflow to, or direct seepage from, the lake and other associated drainages (such as Cataract Creek).
2.3.2. Calibration Database The EA identified a large number of data sources which were considered sufficient (subject to acquisition of near-field drawdown data) to undertake a transient calibration as requested. These are sufficient to undertake a calibration as requested, and develop a useful and robust model. These data are listed in the following sections, and are of sufficient size to allow the development of a reasonable transiently calibrated model.
Hydraulic Heads
The hydraulic head monitoring network comprises 40 measuring devices (8 standpipe piezometers and 32 vibrating wire piezometers) distributed throughout the depth profile at 11 locations. Project-specific monitoring locations include a number where frequent monitoring has been undertaken since mid 2012.
Hydraulic head monitoring data from the vibrating wire piezometer (VWP) nest at GW1 (see Coffey, 2013) were selected by the proponent for collection of near-field drawdown from longwall advance, for the purpose of model calibration. The monitoring data were not presented in the PPR but were supplied by Gujarat by email on 19 November 2013, at the request of the reviewer. Figure 4 shows the supplied data. The key in Figure 4 shows the depth below ground for each VWP, and the lithology at that depth (HBSS, BACS, BGSS, and SPCS denote the Hawkesbury Sandstone, Bald Hill Claystone, Bulgo Sandstone, and Stanwell Park Claystone respectively). The hydrographs for Bulgo Sandstone VWPs capture the effect of depressurisation from LW5 in late 2012. The measured drawdown is considered useful for model calibration of near-field disturbance.
Monitoring locations P501 and P502 in Wonga West (monitoring locations WB17 and WB18 respectively, from Singh and Jakeman, 2001) have detailed monitoring data from 1993. These overlie historical Bulli seam longwalls LW501 and LW502 in the Wonga West area, but are still useful for calibration since they are located in the model domain and contain important information regarding vertical hydraulic head gradients.
8
Figure 4. VWP hydrographs for Monitoring Location GW1 (see Coffey, 2013).
Groundwater Fluxes
The following data were identified in Coffey (2013) for use in model calibration.
• Regular flow monitoring data for Lizard Creek for the period October 2009 to August 2012 for monitoring location LC3 (WRM, 2012). Data from February 2011 onward appear well suited to a baseflow analysis.
• Publicly available stream flow monitoring data for two gauges located within the area of interest (Bellambi Creek and Loddon River), simultaneously covering the period 1991 to 1995 (WRM, 2012).
• Flow monitoring at locations CC3 and CC4 on Cataract Creek (see Figure 11 and Table 16 of Geoterra, 2012b), reported to have been commenced using either temporary box notch weirs, or the flow velocity / cross section method, both of which provide direct flow measurements.
• Pool depth monitoring at four locations in Cataract Creek since 2010, and at three locations since April 2012. Pool heights are also measured at several monitoring points in Lizard and Wallandoola Creeks. Geoterra (2012b) states that pool depth measurements will be converted to flow rates once rating tables are developed for the monitoring sites.
• Detailed monitoring of water extracted from the Wonga East workings (27 Cut Through) from 2010.
• Water being pumped out of previous mine workings to the west of Cataract Reservoir. Should pumping rates be available, they would be most useful.
Hydraulic Conductivity
The site-specific hydraulic conductivity database accrued by the proponent comprises six short duration pump tests at six locations, and 65 packer tests at eight locations. This is considered reasonable.
Coffey (2013) presented other published data for the Southern Coalfield for the purpose of providing (if needed) a basis for constraints in the hydraulic conductivity field for model calibration, and a basis
150
170
190
210
230
250
270
290
310
1-Jul-12 31-Dec-12 2-Jul-13 1-Jan-14
Hyd
rau
lic H
ead
(m
AH
D)
18m HBSS
30m BACS
45m BGSS
63m BGSS
93m BGSS
125m BGSS
140m BGSS
165m SPCS
9
for probabilistic numerical analysis of potential leakage from Lake Cataract. Large databases of pre- and post-mining hydraulic conductivity over centre panel were provided to the proponent in Coffey (2013), for the purpose of being considered during model calibration. Of these, Reid (1996) contains useful data for strata impacted by mining, and for undisturbed strata, for the Southern Coalfield.
2.3.3. Other Clarifications
Model Class
The PPR states that a Class 3 model, as defined in Barnett et al (2012), will be required. No class of model was stipulated in Coffey (2013) for the recommended simulation. This is because a strict application of the criteria in Barnett et al (2012) (for example, that predictive stresses should not be more than double the calibration stresses) could rule out an otherwise useful model and leave no tool available for impact prediction.
Regardless of model class, any model will have some level of uncertainty which is directly dependent on (amongst other things) the calibration data base and the performance of calibration. Such a model may not meet predictive criteria in Barnett et al (2012) however this is not considered detrimental, particularly if the uncertainty is explored with a probabilistic analysis taking account of observed variations in hydraulic properties. The available calibration data base for the subject area (see above) is considered very large in relation to many other areas in the world, and is considered sufficient to support the development of a numerical model that can provide results that will be useful for decision making.
Provided that calibration is conducted as requested, and the uncertainty of the model is addressed as recommended, non-compliance with some criteria in Barnett et al (2012) may be tolerable. Any non-compliances can be raised with an external reviewer, during the modelling effort, for consultation and consideration. The recommendations in Coffey (2013), combined with the available calibration data, might translate to a Class 2 / Class 3 hybrid model, according to the criteria in Barnett (2012).
General Calibration
The questioning of the model calibration in ERM (2013) was completely independent of the criteria in Barnett (2012). That calibration was undertaken for steady state conditions and is considered substandard for the purpose of the model.
The modelling strategy in the PPR discusses proposed transient calibration using hydraulic heads and fluxes. Calibration to measured hydraulic conductivities is not explicitly stated but these observations would need to be incorporated into the calibration.
Clarification of Severe Deformation
Coffey (2013) indicated that laminar flow models are inappropriate for simulation of media where severe deformation has occurred. Severe deformation is defined as the case where strains are exceptionally large and laminar flow no longer occurs. The collapsed zone is a typical example. Strains are typically greater than 6mm/m and flow occurs in unsaturated conditions. The model will need to use approximations for the collapsed zone. Severe strains at the surface (the tensile cracking zone) create hydraulic conductivity fields with extremely high uncertainty ranges. Outside these zones, the laminar flow formulation is appropriate.

10
2.4. Swamps The PPR states that swamps have undergone subsidence due to previous mining, and that despite this, they are reported as thriving. The height of the collapsed zone from previous mining is calculated to not have reached the surface tensile cracking zone, therefore permanent drainage from the swamp to a goaf did not occur. With H reaching to the surface, permanent drainage will occur. Where H does not reach to surface, filling of only a finite surface storage (increased void ratio from surface tensile fracturing) occurs, frequently resulting in temporary water loss.

11
3. CONCLUSIONS AND RECOMMENDATIONS The new layout of LW7 is still considered to pose a risk to the capacity of the channel of Cataract Creek to transmit surface water. Surface subsidence monitoring for Balgownie Seam and Wongawilli Seam longwalls indicates incremental subsidence that is in excess of that expected for a single seam case. Although a relationship between surface subsidence and the height of desaturation (H) is unavailable, subsidence monitoring results indicate that there is a high likelihood that the height of H for a Wongawilli panel will be larger than that calculated using the relationship for single seam mining (Tammetta, 2012). Since the LW7 width has only been reduced by 19m (about 13% of the original width), it is reasonable to conservatively assume that the height of the collapsed zone (H) intersects the ground surface at the northern corner of LW7. Where the top of a collapsed zone is some distance below the surface, the surface disturbance at a channel bed may not link to the collapsed zone. In the case of LW7, there is considered to be a risk of direct hydraulic connection between the creek channel and goaf, through the collapsed zone, where the channel comes to close to the panel edge. The level of risk is difficult to quantify but warrants consideration.
The strategy presented by the proponent for groundwater numerical simulation largely satisfies the recommendations made in Coffey (2013). However, this strategy discusses potential or perceived limitations, and several assumptions (see above), which are not necessarily real. Recommendations in Coffey (2013) are further clarified in relation to the assumptions made by the proponent, and discussion is provided to ameliorate the limitations perceived by the proponent.
12
4. REFERENCES Australian Federal Government Department of Sustainability, Environment, Water, Population and
Communities. Water Science Operations Branch. 2013. Final Report Project 2: Peat Swamps and Longwall Mine Engineering.
Barnett B, Townley LR, Post V, Evans RE, Hunt RJ, Peeters L, Richardson S, Werner AD, Knapton A, and Boronkay A. 2012. Australian groundwater modelling guidelines. Waterlines Report, National Water Commission, Canberra. June.
Cifelli, R.C., and H.W. Rauch. 1986. Dewatering effects from selected underground coal mines in north-central West Virginia. Proceedings of the 2nd Workshop on Surface Subsidence due to Underground Mining, West Virginia University, Morgantown, WV, p. 249-263.
Coffey Geotechnics Pty Ltd. 2013. Gujarat NRE No.1 Colliery Major Expansion Part 3A Application Groundwater Analysis. Report GEOTLCOV24840AA-AB prepared for the NSW Department of Planning and Infrastructure. June.
ERM. 2013. NRE No.1 Colliery Project Application (09_0013) Environmental Assessment. Report 0079393RP01 prepared for Gujarat NRE Coking Coal Pty Ltd. February.
GeoTerra Pty Ltd. 2012a. NRE No.1 Colliery Major Expansion Groundwater Assessment. Report GUJ1-GWR1C, prepared for Gujarat NRE Coking Coal Pty Ltd. November.
GeoTerra Pty Ltd. 2012b. NRE No.1 Colliery Major Expansion Stream Assessment. Report GUJ1-SWR1D, prepared for Gujarat NRE Coking Coal Pty Ltd. November.
Gujarat NRE Coking Coal Ltd. 2013. Underground Expansion Project Preferred Project Report, Including Response to Submissions. October.
Ouyang, Z., and D. Elsworth. 1993. Evaluation of groundwater flow into mined panels. Int. J. R. Mechs. Min. Sci. & Geomechs. Abstracts, Volume 30, No. 2, p. 71-79.
Seedsman Geotechnics Pty Ltd (SG). 2012. Gujarat NRE No.1 Colliery: Management of subsidence risks and associated with Wongawilli Seam Extraction. Report GNE-136.docx, prepared for Gujarat NRE Minerals. July.
Singh RN and Jakeman M. 1999. Longwall mining under the Cataract Reservoir. Proceedings, Mine, Water and Environment, IMWA Congress, Sevilla, Spain, 1999, p27-34.
Singh RN and Jakeman M. 2001. Strata monitoring investigations around longwall panels beneath the Cataract Reservoir. Mine Water and the Environment, Volume 20 (2), p55-64.
WRM Water and Environment (WRM). 2012. NRE No.1 Colliery Surface Water Modelling. Report 0637-01-B[Rev7] prepared for Gujarat NRE Coking Coal Limited. November.
NSW Department of Planning and Infrastructure
GUJARAT NRE NO.1 COLLIERY MAJOR EXPANSION PROJECT PART 3A APPLICATION
Preferred Project Groundwater Assessment
20 December 2013
GEOTLCOV24840AB-AB
i
TABLE OF CONTENTS
1. Introduction ................................................................................................................................... 1
2. Review of the PPR ......................................................................................................................... 2
2.1. Changes to the Mine Plan ....................................................................................................... 2
2.2. Longwall LW7.......................................................................................................................... 4
2.2.1. Surface Subsidence Monitoring at Other Panels and Implications for the Height of the Collapsed Zone .................................................................................................................................................. 4
2.2.2. Surface Impacts outside the Panel Footprint .................................................................. 6
2.2.3. New Proposed Position of LW7 ...................................................................................... 7
2.3. Numerical Simulation Strategy ................................................................................................ 8
2.3.1. Probabilistic Analysis ...................................................................................................... 8
2.3.2. Calibration Database ...................................................................................................... 9
2.3.3. Other Clarifications ....................................................................................................... 10
2.4. Swamps ................................................................................................................................ 11
3. Conclusions and Recommendations ........................................................................................ 12
3.1. LW7 ....................................................................................................................................... 12
3.2. Numerical Simulation Strategy .............................................................................................. 12
3.3. Recommendations ................................................................................................................ 12
4. References ................................................................................................................................... 13
TABLES
Table 1. Changes to Longwall Dimensions from the Original Mine Plan.
FIGURES
Figure 1. Comparison of Previous and Current Mine Plans for Wonga East.
Figure 2. Subsidence Monitoring Results for the Balgownie and Wongawilli Panels at Wonga East.
Figure 3. Estimated Angle of Hydraulic Head Influence for Longwall Panels.
Figure 4. New proposed position of Wongawilli LW7 as per the PPR.
Figure 5. VWP Hydrographs for Monitoring Location GW1.

Coffey Geotechnics Pty Ltd Level 19, Tower B, Citadel Towers, 799 Pacific Hwy Chatswood NSW 2067 Australia PO Box 5275 West Chatswood NSW 1515 Australia
1
1. INTRODUCTION This report presents the results of a review of the groundwater component of the Preferred Project Report (PPR) for the Gujarat NRE No.1 Colliery Major Expansion Part 3A Application (Gujarat, 2013). The review (and associated separate analysis of data presented in the PPR) was conducted by Paul Tammetta of Coffey Geotechnics Pty Ltd (Coffey) for the NSW Department of Planning and Infrastructure (DPI).
This review follows a previous review (Coffey, 2013) of the groundwater components of the Environmental Assessment (EA; ERM, 2013) for the same development application.
The scope of work comprised:
• Review of the groundwater elements of the PPR (and included Response to Submissions) (Gujarat, 2013) received by Coffey from DoPI by email on 9 October 2013.
• Review of hydraulic head monitoring at VWP piezometer GW1 (not presented in Gujarat, 2013).
• Provision of comments in relation to whether the PPR and RS address issues raised in Coffey’s review from Stage 1.
This report should be read in conjunction with Coffey (2013).
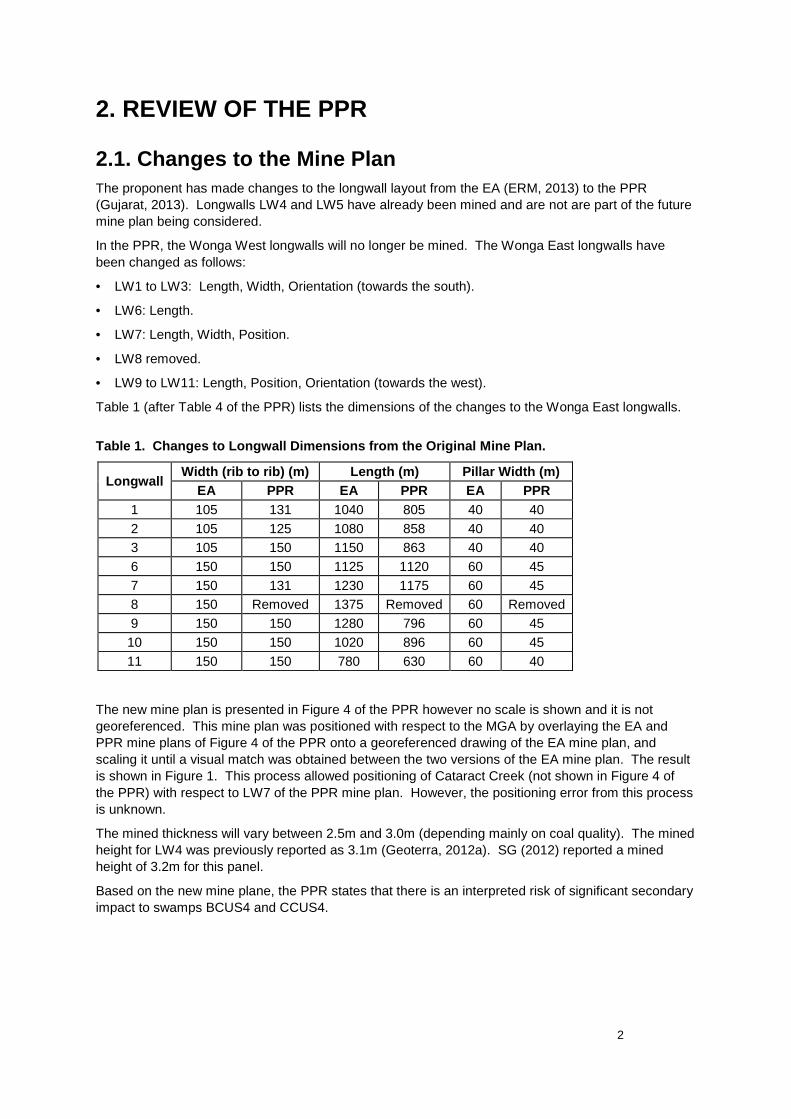
2
2. REVIEW OF THE PPR
2.1. Changes to the Mine Plan The proponent has made changes to the longwall layout from the EA (ERM, 2013) to the PPR (Gujarat, 2013). Longwalls LW4 and LW5 have already been mined and are not are part of the future mine plan being considered.
In the PPR, the Wonga West longwalls will no longer be mined. The Wonga East longwalls have been changed as follows:
• LW1 to LW3: Length, Width, Orientation (towards the south).
• LW6: Length.
• LW7: Length, Width, Position.
• LW8 removed.
• LW9 to LW11: Length, Position, Orientation (towards the west).
Table 1 (after Table 4 of the PPR) lists the dimensions of the changes to the Wonga East longwalls.
Table 1. Changes to Longwall Dimensions from the Original Mine Plan.
Longwall Width (rib to rib) (m) Length (m) Pillar Width (m)
EA PPR EA PPR EA PPR 1 105 131 1040 805 40 40 2 105 125 1080 858 40 40 3 105 150 1150 863 40 40 6 150 150 1125 1120 60 45 7 150 131 1230 1175 60 45 8 150 Removed 1375 Removed 60 Removed 9 150 150 1280 796 60 45 10 150 150 1020 896 60 45 11 150 150 780 630 60 40
The new mine plan is presented in Figure 4 of the PPR however no scale is shown and it is not georeferenced. This mine plan was positioned with respect to the MGA by overlaying the EA and PPR mine plans of Figure 4 of the PPR onto a georeferenced drawing of the EA mine plan, and scaling it until a visual match was obtained between the two versions of the EA mine plan. The result is shown in Figure 1. This process allowed positioning of Cataract Creek (not shown in Figure 4 of the PPR) with respect to LW7 of the PPR mine plan. However, the positioning error from this process is unknown.
The mined thickness will vary between 2.5m and 3.0m (depending mainly on coal quality). The mined height for LW4 was previously reported as 3.1m (Geoterra, 2012a). SG (2012) reported a mined height of 3.2m for this panel.
Based on the new mine plane, the PPR states that there is an interpreted risk of significant secondary impact to swamps BCUS4 and CCUS4.

3
Figure 1. Comparison of previous and current mine plans for Wonga East. Current mine plan sourced from Gujarat (2013) and overlaid with georeferenced information from Coffey (2013).Comparison of Panel Layouts for Wonga East.
2.2. Longwall LW7
2.2.1. Surface Subsidence Monitoring at Other Panels and Implications for the Height of the Collapsed Zone Subsidence measurements over existing total extraction workings in the Wongawilli East area are presented in detail in the PPR. These measurements are important as an indicator for the subsidence behaviour in a multiple seam mining environment. Subsidence monitoring of Balgownie and Wongawilli Seam panels in Wonga East indicates that incremental Balgownie panel subsidence ranged between 0.9m and 1.2m where overlying Bulli goaf (room and pillar panels with pillar extraction) was present, approaching 80% of the mined height (implying a mined height of about 1.5m for the Balgownie panels). In unusual areas (latent subsidence, goaf edge), the incremental subsidence reached 1.4m, approaching 100% of the mined height. Figure 2a (after Figure 49 of the PPR) shows these results.
Maximum incremental subsidence at Wongawilli LW4 was 1.4m. For the mining geometry of LW4, and assuming single seam mining, surface subsidence would be expected to range between 0.1m and 0.3m, about 14% of the observed subsidence where Balgownie and Bulli goafs are present. The PPR states that cross panel subsidence profiles indicate that the maximum subsidence in the centre of the Wongawilli panels is controlled by overburden bridging capacity rather than strata recompression. The presence of overlying goafs reduces the bridging capacity of overlying strata, having a significant effect on maximum incremental subsidence for the Wongawilli panels. It was also observed that the additional subsidence was confined to the panel footprint. Figure 2b (after Figure 58 of the PPR) shows these results.
Surface subsidence results presented in the PPR indicate that the accrued surface subsidence from mulitple seam operations is more than an addition of estimated single seam subsidences. Although a relationship between surface subsidence and the height of desaturation (H) is unavailable (due to the significantly greater dependence of surface subsidence on overburden depth compared to H), the surface subsidence results would suggest that the accrued height of the collapsed zone for multiple seam operations also may be more than an addition of estimated single-seam H values (Tammetta, 2012). If this is the case, the consequence is that, where a Wongawilli panel underlies existing full extraction workings, the height of H for the Wongawilli panel will be larger than that calculated using the relationship for single seam mining (Tammetta, 2012).

5
Figure 2. Subsidence monitoring results for the (a) Balgownie and (b) Wongawilli panels at Wonga East (after Figures 49 and 58 of the PPR).
6
2.2.2. Surface Impacts outside the Panel Footprint Information relating to changes in hydraulic conductivity just off the panel footprint is particularly sparse, however several authors have estimated the extent of an impact zone from observations of dewatering in water supply wells off the panel footprint. This zone is just off-panel, and adjacent to the panel. It is where a relatively fast response is observed in hydraulic heads following caving, usually because of an immediate change in void ratio from fracturing. Long-term effects on hydraulic heads extend further, but are caused by laminar flow induced by drainage. In the off-panel impact zone, deformation is generally less than, and of a different character to, deformation within the collapsed zone.
Ouyang and Elsworth (1993) estimated a probable angle of influence (defined as the angle whose tangent is the lateral distance to an impact at the surface, divided by the overburden thickness) of 42° from 39 off-panel wells (Figure 3). Cifelli and Rauch (1986) estimated an average angle of influence of about 20°, with several observations of impact outside this angle. The Australian Federal Government (2013) estimated a maximum angle of influence for impacts to peat swamps of approximately 45°. These impacts were characterised by deformation of the rock underneath the swamp.
Where there may be a small lateral distance between the surface impact zone and the potential collapsed zone of the panel, there is a risk of direct connection between the fracturing of the surface impact zone and the collapsed zone, through deformed media having enhanced hydraulic conductivity in the impact zone. High-relief topography may exacerbate this connection through enhanced lateral movement. Where the top of a collapsed zone is some distance below the surface, the surface disturbance may not be strongly hydraulically linked to the collapsed zone.
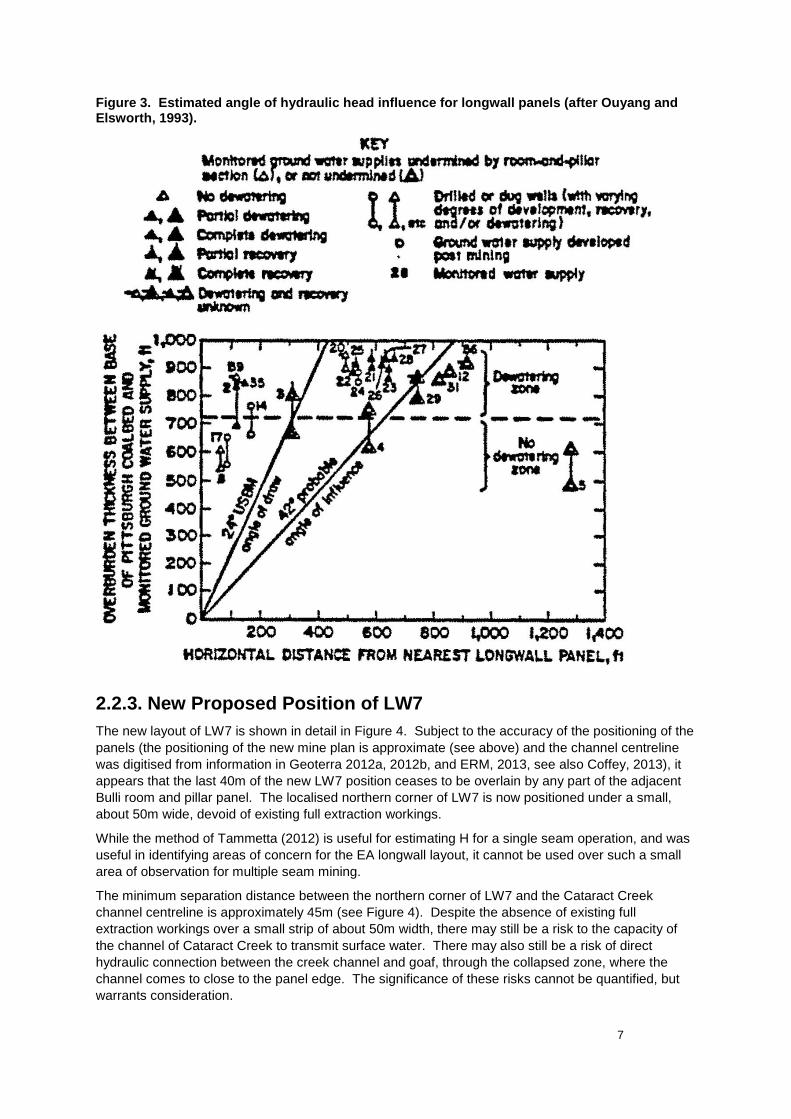
7
Figure 3. Estimated angle of hydraulic head influence for longwall panels (after Ouyang and Elsworth, 1993).
2.2.3. New Proposed Position of LW7 The new layout of LW7 is shown in detail in Figure 4. Subject to the accuracy of the positioning of the panels (the positioning of the new mine plan is approximate (see above) and the channel centreline was digitised from information in Geoterra 2012a, 2012b, and ERM, 2013, see also Coffey, 2013), it appears that the last 40m of the new LW7 position ceases to be overlain by any part of the adjacent Bulli room and pillar panel. The localised northern corner of LW7 is now positioned under a small, about 50m wide, devoid of existing full extraction workings.
While the method of Tammetta (2012) is useful for estimating H for a single seam operation, and was useful in identifying areas of concern for the EA longwall layout, it cannot be used over such a small area of observation for multiple seam mining.
The minimum separation distance between the northern corner of LW7 and the Cataract Creek channel centreline is approximately 45m (see Figure 4). Despite the absence of existing full extraction workings over a small strip of about 50m width, there may still be a risk to the capacity of the channel of Cataract Creek to transmit surface water. There may also still be a risk of direct hydraulic connection between the creek channel and goaf, through the collapsed zone, where the channel comes to close to the panel edge. The significance of these risks cannot be quantified, but warrants consideration.

8
Figure 4. New proposed position of Wongawilli LW7 as per the PPR.
2.3. Numerical Simulation Strategy In the PPR, the proponent presents a strategy for groundwater numerical simulation which largely satisfies the recommendations made in Coffey (2013). However, this strategy discusses potential or perceived limitations with the recommended probability analysis and the database available for calibration. Further clarification is provided below on these facets.
The strategy also makes assumptions which are stated as being based on recommendations in Coffey (2013). The relevant recommendations in Coffey (2013) are clarified in relation to the assumptions made in the proponent’s strategy. These clarifications are also provided below.
2.3.1. Probabilistic Analysis The probabilistic analysis of induced seepage from Lake Cataract does not need to be undertaken using the Monte Carlo process. This was not stipulated in Coffey (2013).
It is considered that manual running of around 30 to 40 cases, with hydraulic conductivity arrays varied for each, would be sufficient to guide the assessment of uncertainty. Required output would comprise the change in baseflow to, or direct seepage from, the lake and other associated drainages (such as Cataract Creek).

9
2.3.2. Calibration Database The EA identified a large number of data sources which were considered sufficient (subject to acquisition of near-field drawdown data) to undertake a transient calibration as requested. These are sufficient to undertake a calibration as requested, and develop a useful and robust model. These data are listed in the following sections, and are of sufficient size to allow the development of a reasonable transiently calibrated model.
Hydraulic Heads
The hydraulic head monitoring network comprises 40 measuring devices (8 standpipe piezometers and 32 vibrating wire piezometers) distributed throughout the depth profile at 11 locations. Project-specific monitoring locations include a number where frequent monitoring has been undertaken since mid 2012.
Hydraulic head monitoring data from the vibrating wire piezometer (VWP) nest at GW1 (see Coffey, 2013) were selected by the proponent for collection of near-field drawdown from longwall advance, for the purpose of model calibration. The monitoring data were not presented in the PPR but were supplied by Gujarat by email on 19 November 2013, at the request of the reviewer. Figure 5 shows the supplied data. The key in Figure 5 shows the depth below ground for each VWP, and the lithology at that depth (HBSS, BACS, BGSS, and SPCS denote the Hawkesbury Sandstone, Bald Hill Claystone, Bulgo Sandstone, and Stanwell Park Claystone respectively). The hydrographs for Bulgo Sandstone VWPs capture the effect of depressurisation from LW5 in late 2012. The measured drawdown is considered useful for model calibration of near-field disturbance.
Monitoring locations P501 and P502 in Wonga West (monitoring locations WB17 and WB18 respectively, from Singh and Jakeman, 2001) have detailed monitoring data from 1993. These overlie historical Bulli seam longwalls LW501 and LW502 in the Wonga West area, but are still useful for calibration since they are located in the model domain and contain important information regarding vertical hydraulic head gradients.
Figure 5. VWP hydrographs for Monitoring Location GW1 (see Coffey, 2013).
150
170
190
210
230
250
270
290
310
1-Jul-12 31-Dec-12 2-Jul-13 1-Jan-14
Hyd
rau
lic H
ead
(m
AH
D)
18m HBSS
30m BACS
45m BGSS
63m BGSS
93m BGSS
125m BGSS
140m BGSS
165m SPCS

10
Groundwater Fluxes
The following data were identified in Coffey (2013) for use in model calibration.
• Regular flow monitoring data for Lizard Creek for the period October 2009 to August 2012 for monitoring location LC3 (WRM, 2012). Data from February 2011 onward appear well suited to a baseflow analysis.
• Publicly available stream flow monitoring data for two gauges located within the area of interest (Bellambi Creek and Loddon River), simultaneously covering the period 1991 to 1995 (WRM, 2012).
• Flow monitoring at locations CC3 and CC4 on Cataract Creek (see Figure 11 and Table 16 of Geoterra, 2012b), reported to have been commenced using either temporary box notch weirs, or the flow velocity / cross section method, both of which provide direct flow measurements.
• Pool depth monitoring at four locations in Cataract Creek since 2010, and at three locations since April 2012. Pool heights are also measured at several monitoring points in Lizard and Wallandoola Creeks. Geoterra (2012b) states that pool depth measurements will be converted to flow rates once rating tables are developed for the monitoring sites.
• Detailed monitoring of water extracted from the Wonga East workings (27 Cut Through) from 2010.
• Water being pumped out of previous mine workings to the west of Cataract Reservoir. Should pumping rates be available, they would be most useful.
Hydraulic Conductivity
The site-specific hydraulic conductivity database accrued by the proponent comprises six short duration pump tests at six locations, and 65 packer tests at eight locations. This is considered reasonable.
Coffey (2013) presented other published data for the Southern Coalfield for the purpose of providing (if needed) a basis for constraints in the hydraulic conductivity field for model calibration, and a basis for probabilistic numerical analysis of potential leakage from Lake Cataract. Large databases of pre- and post-mining hydraulic conductivity over centre panel were provided to the proponent in Coffey (2013), for the purpose of being considered during model calibration. Of these, Reid (1996) contains useful data for strata impacted by mining, and for undisturbed strata, for the Southern Coalfield.
2.3.3. Other Clarifications
Model Class
The PPR states that a Class 3 model, as defined in Barnett et al (2012), will be required. No class of model was stipulated in Coffey (2013) for the recommended simulation. This is because a strict application of the criteria in Barnett et al (2012) (for example, that predictive stresses should not be more than double the calibration stresses) could rule out an otherwise useful model and leave no tool available for impact prediction.
Regardless of model class, any model will have some level of uncertainty which is directly dependent on (amongst other things) the calibration data base and the performance of calibration. Such a model may not meet predictive criteria in Barnett et al (2012) however this is not considered detrimental, particularly if the uncertainty is explored with a probabilistic analysis taking account of observed variations in hydraulic properties. The available calibration data base for the subject area (see above) is considered very large in relation to many other areas in the world, and is considered sufficient to support the development of a numerical model that can provide results that will be useful for decision making.
Provided that calibration is conducted as requested, and the uncertainty of the model is addressed as recommended, non-compliance with some criteria in Barnett et al (2012) may be tolerable. Any non-

11
compliances can be raised with an external reviewer, during the modelling effort, for consultation and consideration. The recommendations in Coffey (2013), combined with the available calibration data, might translate to a Class 2 / Class 3 hybrid model, according to the criteria in Barnett (2012).
General Calibration
The questioning of the model calibration in ERM (2013) was completely independent of the criteria in Barnett (2012). That calibration was undertaken for steady state conditions and is considered substandard for the purpose of the model.
The modelling strategy in the PPR discusses proposed transient calibration using hydraulic heads and fluxes. Calibration to measured hydraulic conductivities is not explicitly stated but these observations would need to be incorporated into the calibration.
Clarification of Severe Deformation
Coffey (2013) indicated that laminar flow models are inappropriate for simulation of media where severe deformation has occurred. Severe deformation is defined as the case where strains are exceptionally large and laminar flow no longer occurs. The collapsed zone is a typical example. Strains are typically greater than 6mm/m and flow occurs in unsaturated conditions. The model will need to use approximations for the collapsed zone. Severe strains at the surface (the tensile cracking zone) create hydraulic conductivity fields with extremely high uncertainty ranges. Outside these zones, the laminar flow formulation is appropriate.
2.4. Swamps The PPR states that swamps have undergone subsidence due to previous mining, and that despite this, they are reported as thriving. The height of the collapsed zone from previous mining is calculated to not have reached the surface tensile cracking zone, therefore permanent drainage from the swamp to a goaf is unlikely to have occurred. If H intersects the ground surface, permanent drainage will occur. Where H does not reach to surface, filling of only a finite surface storage (increased void ratio from surface tensile fracturing) occurs, frequently resulting in temporary water loss.
12
3. CONCLUSIONS AND RECOMMENDATIONS
3.1. LW7 By corollary, surface subsidence results presented in the PPR suggest that the accrued height of the collapsed zone for multiple seam operations may be more than an addition of estimated single-seam H values. If this is the case, the consequence is that, where a Wongawilli panel underlies existing full extraction workings, the height of H for the Wongawilli panel will be larger than that calculated using the relationship for single seam mining (Tammetta, 2012).
The new layout of LW7 places its northern corner under a small localised strip, of about 50m width, devoid of existing full-extraction workings. Despite the absence of existing full extraction workings over this strip, there may still be a risk to the capacity of the channel of Cataract Creek to transmit surface water. Where the top of a collapsed zone is some distance below the surface, the surface disturbance at a channel bed may not link to the collapsed zone. Where the collapsed zone intersects ground surface, there is considered to be a risk of direct hydraulic connection between the creek channel and goaf, through the collapsed zone, for small separation distances between a channel and the panel edge. The level of risk is difficult to quantify but warrants consideration.
No groundwater tools or theory are known that could provide a quantification of this risk, however the risk warrants consideration, and deferral is made on this issue to subsidence engineers.
3.2. Numerical Simulation Strategy The strategy presented by the proponent for groundwater numerical simulation largely satisfies the recommendations made in Coffey (2013). However, this strategy discusses potential or perceived limitations, and several assumptions (see above), which are not necessarily real. Recommendations in Coffey (2013) are further clarified in relation to the assumptions made by the proponent, and discussion is provided to ameliorate the limitations perceived by the proponent.
3.3. Recommendations Since the potential risk to Cataract Creek revolves around H for LW7, it is recommended that the height of the collapsed zone be measured at LW4 or LW5, at a location where all three coal seams have been mined. At least one borehole should be installed for this purpose, however two would be preferable. Since this survey would benefit all parties, and the cost is not small, perhaps some of the cost can be born by government. Should this be possible, the government should retain rights to the data.
Appropriate monitoring of groundwater response and ground deformation should be undertaken for LW7, from LW7 startup or earlier, whereby sufficient warning is available to allow termination of LW7 before connection of the creek channel to the goaf occurs. Deferral is made to ground movement experts on the appropriate type of ground movement monitoring and instrumentation (and its location) to fulfil this purpose.

13
4. REFERENCES Australian Federal Government Department of Sustainability, Environment, Water, Population and
Communities. Water Science Operations Branch. 2013. Final Report Project 2: Peat Swamps and Longwall Mine Engineering.
Barnett B, Townley LR, Post V, Evans RE, Hunt RJ, Peeters L, Richardson S, Werner AD, Knapton A, and Boronkay A. 2012. Australian groundwater modelling guidelines. Waterlines Report, National Water Commission, Canberra. June.
Cifelli, R.C., and H.W. Rauch. 1986. Dewatering effects from selected underground coal mines in north-central West Virginia. Proceedings of the 2nd Workshop on Surface Subsidence due to Underground Mining, West Virginia University, Morgantown, WV, p. 249-263.
Coffey Geotechnics Pty Ltd. 2013. Gujarat NRE No.1 Colliery Major Expansion Part 3A Application Groundwater Analysis. Report GEOTLCOV24840AA-AB prepared for the NSW Department of Planning and Infrastructure. June.
ERM. 2013. NRE No.1 Colliery Project Application (09_0013) Environmental Assessment. Report 0079393RP01 prepared for Gujarat NRE Coking Coal Pty Ltd. February.
GeoTerra Pty Ltd. 2012a. NRE No.1 Colliery Major Expansion Groundwater Assessment. Report GUJ1-GWR1C, prepared for Gujarat NRE Coking Coal Pty Ltd. November.
GeoTerra Pty Ltd. 2012b. NRE No.1 Colliery Major Expansion Stream Assessment. Report GUJ1-SWR1D, prepared for Gujarat NRE Coking Coal Pty Ltd. November.
Gujarat NRE Coking Coal Ltd. 2013. Underground Expansion Project Preferred Project Report, Including Response to Submissions. October.
Ouyang, Z., and D. Elsworth. 1993. Evaluation of groundwater flow into mined panels. Int. J. R. Mechs. Min. Sci. & Geomechs. Abstracts, Volume 30, No. 2, p. 71-79.
Seedsman Geotechnics Pty Ltd (SG). 2012. Gujarat NRE No.1 Colliery: Management of subsidence risks and associated with Wongawilli Seam Extraction. Report GNE-136.docx, prepared for Gujarat NRE Minerals. July.
Singh RN and Jakeman M. 1999. Longwall mining under the Cataract Reservoir. Proceedings, Mine, Water and Environment, IMWA Congress, Sevilla, Spain, 1999, p27-34.
Singh RN and Jakeman M. 2001. Strata monitoring investigations around longwall panels beneath the Cataract Reservoir. Mine Water and the Environment, Volume 20 (2), p55-64.
WRM Water and Environment (WRM). 2012. NRE No.1 Colliery Surface Water Modelling. Report 0637-01-B[Rev7] prepared for Gujarat NRE Coking Coal Limited. November.

Coffey Geotechnics Pty Ltd ABN: 93 056 929 483
i
NSW Department of Planning and Infrastructure
Russell Vale Colliery (formerly the NRE No. 1 Mine) Underground Expansion Project
Groundwater Review
22 September 2014
Coffey Geotechnics Pty Ltd ABN: 93 056 929 483
ii
Russell Vale Colliery (formerly the NRE No. 1 Mine) Underground Expansion Project
Prepared for NSW Department of Planning and Infrastructure
Prepared by Coffey Geotechnics Pty Ltd Level 19, Tower B, 799 Pacific Highway Chatswood NSW 2067 Australia t: +61 2 9406 1026 f: +61 2 9406 1002 ABN: 93 056 929 483
22 September 2014
Document authorisation
Our ref: GEOTLCOV24840AC-AB
For and on behalf of Coffey
Paul Tammetta Associate Hydrogeologist
Quality information
Revision history
Revision Description Date Author Reviewer Signatory
v1 Final 22 Sep 2014 Paul Tammetta
Peter Waddell Paul Tammetta
Distribution
Report Status No. of copies Format Distributed to Date
v1 1 PDF NSW Department of Planning and Infrastructure
22 Sep 2014

Coffey Geotechnics Pty Ltd ABN: 93 056 929 483
iii
Table of contents
1. Introduction .................................................................................................................................. 4
2. Review ......................................................................................................................................... 4
2.1. Conceptualisation .............................................................................................................. 4
2.2. Model Development and Use ............................................................................................ 7
3. Conclusions ................................................................................................................................. 7
4. References .................................................................................................................................. 8
Important information about your Coffey Report
Figures
Figure 1. Interpreted hydraulic head distribution (broadly representative of early 2012) along a cross section through the area (after Coffey 2013a).
Appendices
Appendix A - Clarification
Appendix B - Figure 1 of AGE (2014)

Russell Vale Colliery Underground Expansion Project Groundwater Review
Coffey GEOTLCOV24840AC-AB 22 September 2014
4
1. Introduction This report presents the results of a review of the groundwater component of the Russell Vale Colliery (formerly NRE No. 1 Mine) Underground Expansion Project. The review was undertaken by Paul Tammetta of Coffey Geotechnics Pty Ltd (Coffey) for the NSW Department of Planning and Infrastructure (DPI). The scope comprised a review of the development, calibration, and use of a numerical groundwater flow model for the project. The subject of the review was the following report:
• GeoTerra Pty Ltd. 2014 (Geoterra). Russell Vale Colliery Underground Expansion Project, Preferred Project Report, Wonga East Groundwater Assessment. Report NRE1 - R1C GW prepared for Wollongong Coal Ltd. June.
This review follows two previous reviews for the same project (Coffey 2013a, 2013b).
Review of the electronic version of the model was outside the scope of this report. For the purpose of this review, an understanding of the functioning of the model has been based on the report only. It is recognised that there may have been time and budgetary constraints applied to the impact assessment which are not known to the reviewer.
This review also provides clarification, in relation to the results of Tammetta (2013), as they pertain to comments made in the Geoterra report. This is provided in Appendix A, and may be relevant for coal developments in the southern part of the Newcastle Coalfield.
2. Review
2.1. Conceptualisation
The Geoterra report (page 44) interprets that the pressure head profile at VWP site GW1 indicates a restriction to downward flow. Assuming a vertical 1-dimensional system (upon which the interpretation in the report appears to be based), a restriction would cause the basal pressure heads to increase, not decrease as is observed.
In Figure 13 of the Geoterra report, packer testing from bore GW1 is shown. Hydraulic conductivity (K) decreases with depth. From four tests (out of 22) at this location, the Geoterra report interprets that the Stanwell Park Claystone has lower lateral K than adjacent strata. Although these four test results are consistent, they are closely spaced and lie within the statistical band of variation in K for that location, as indicated by the rest of the results. The interpretation in the Geoterra report is therefore considered tenuous (Coffey 2013a).
The Geoterra report (page 52) discusses the results of Tammetta (2013) (referencing the digital version of Tammetta 2013, dated 2012, which is identical to Tammetta 2013) and states that the “assumption” that the geology of the overburden strata plays a minor role in caving is questionable (referring to a personal communication from Seedsman RW, page 52). In Tammetta (2013) an analysis of piezometer water level data from 18 locations found that for those locations, observations of the maximum height of desaturation above the panel (at centre panel), referred to as H, could be reproduced to better than 8% RMS error without requiring knowledge of the lithology of the consolidated overburden, by use of a fitted empirical equation. Tammetta (2013) noted that this had been observed by other researchers in the literature. The finding is not an assumption, as stated in the Geoterra report, but is a result (of the analysis that relates to H over centre panel). Tammetta (2013) discussed super-strong dolerite sills in South Africa which showed H slightly lower than calculated using the equation. Despite a thorough search of the literature, no other published data could be found to show significant deviations from the equation. This issue is further discussed in Appendix A, where groundwater monitoring data from the Mandalong mine are analysed and shown

Russell Vale Colliery Underground Expansion Project Groundwater Review
Coffey GEOTLCOV24840AC-AB 22 September 2014
5
to provide a good example of accord with the equation of Tammetta (2013), and to results from Springvale Colliery. The analysis of observations from Mandalong are used to highlight the importance of ensuring that adequate review is carried out on estimates made by proponents of heights of desaturation for underground mining projects, so that unrepresentative or erroneous results are not incorporated into impact assessments. The accord between Mandalong results and those of Tammetta (2013) will be relevant for coal developments in the southern Newcastle Coalfield.
In Section 8.3.1 of the Geoterra report, use is made of the equation of Tammetta (2013) for the height of complete groundwater drainage (H) above mined longwall panels, and concludes that the equation overestimates observed H at GW1. Coffey (2013a) tested the interrelationship between estimated collapsed zone heights for previous workings (using the results of Tammetta, 2013) and the hydraulic head information collected by the proponent. GW1 is located over Bulli seam pillar extraction workings and just off the edge of Balgownie LW7.
For the Balgownie panel, GW1 is in a location similar to that over chain pillars with a mined panel on one side only, and its u parameter is so small that the height of desaturation contributed by Balgownie LW7 at nest GW1 was conservatively assumed to be nil in Coffey (2013a). H at GW1 is thus assumed to be due only to Bulli pillar extraction. From the GW1 pressure head profile, H is assessed to be 225m (overburden thickness) minus 170m (base of saturation), giving 55m. This fits the distribution in Figure 4 of Tammetta (2013), and is shown in Figure 1 below (from Coffey 2013a). GW1 is slightly off the centreline of the Bulli block so H is less than the maximum. Therefore, we disagree with the conclusion in the Geoterra report that the equation overestimates the observed H at GW1.
The following aspect of the hydrogeological conceptual model presented in the Geoterra report (page 76) is considered tenuous:
• That the “deeper” Hawkesbury Sandstone is hydraulically separate from overlying and underlying units at Wonga West (presumably because of the presence of the Bald Hill Claystone (for the underlying units)).
This interpretation requires an unsaturated zone between the sandstone and Bald Hill claystone, which is not supported by data. However, this assumption may not impact the project since in the numerical simulation all model layers communicate hydraulically with adjacent layers via the vertical hydraulic conductivity parameter (or its unsaturated function).

Russell Vale Colliery Underground Expansion Project Groundwater Review
Coffey GEOTLCOV24840AC-AB 22 September 2014
6
Figure 1. Interpreted hydraulic head distribution (broadly representative of early 2012) along a cross section through the area (after Coffey 2013a).

Russell Vale Colliery Underground Expansion Project Groundwater Review
Coffey GEOTLCOV24840AC-AB 22 September 2014
7
2.2. Model Development and Use
The model domain boundary is shown as a rectangle in Figure 30 of the Geoterra report. However, the description of the boundary conditions at the domain boundary suggests the domain is not rectangular. The textual description of the type of boundary conditions suggests they are reasonable.
We consider that the model code is adequate for the required purpose, the grid is reasonable, and calibration to hydraulic heads is reasonable.
Calibration to mine inflows has not been demonstrated, nor has calibration to stream baseflows. The water balance for the calibrated model lists only an instantaneous flow for what appears to be an aggregated discharge to all the workings present in the model domain. Likewise, discharge to streams is a single value. Table 13, well into the predictive section, lists two modelled values for inflows to the workings, with a single comparison for modelled and observed inflow at the end of LW5. Figure 63 shows predicted inflows, with values for the calibration period. It is not known if the calibration period data are modelled or observed.
The calibrated model indicates a net loss from streams of about 16ML/day (Table 11 of the Geoterra report). We consider that this value should be compared to an estimate made from streamflow observations, derived from a baseflow assessment.
Rainfall recharge and the hydraulic conductivity field are positively correlated. Therefore, we consider that demonstration of reasonable matching of model discharges to observed deep and shallow discharges is an important part of the model calibration process. Reasonable matches should be established to demonstrate adequate representation of the K field (particularly the vertical anisotropy, or the ratio of vertical K to lateral K, which is a crucial distribution for impact assessment).
The strategy of predictive simulations appears reasonable, however, given the conceptualisation presented in the report, a clear demonstration of reasonable matching of modelled to observed deep and shallow discharges should be made before the model is considered fit for use.
3. Conclusions In our opinion:
• There are some tenuous interpretations made for the conceptual model, which are not supported by observation. The discussion in the report regarding hydraulic isolation of the medium, and the distribution of losing and gaining stream segments, are conspicuous in this regard. However, the interpretations may not detract from the aims of the groundwater study if the model is acceptably calibrated.
• The model structure appears reasonable, however the domain boundary that is shown appears inconsistent with the applied boundary conditions at the extremities.
• Calibration to hydraulic heads is reasonable.
• The predictive approach appears reasonable.
• A clear demonstration of the matching of shallow and deep discharges has not been made. We recommend that baseflow for the model domain be estimated using measured streamflows. Adequate matching of calibrated model output with measured mine inflows and the baseflow estimate for the model domain should then be demonstrated by the proponent before model results are considered fit for use.
Russell Vale Colliery Underground Expansion Project Groundwater Review
Coffey GEOTLCOV24840AC-AB 22 September 2014
8
4. References Australasian Groundwater and Environmental Consultants Pty Ltd (AGE). 2012. Mandalong
Longwall Mine groundwater Monitoring Review for AEMR 2011. Report G1455/G prepared for Centennial Mandalong Pty Ltd. February.
Australasian Groundwater and Environmental Consultants Pty Ltd (AGE). 2014. Mandalong Longwall Mine groundwater Monitoring Review for AEMR 2013. Report G1455/J prepared for Centennial Mandalong Pty Ltd. January.
Bai, M., and D. Elsworth. 1989. Some aspects of mining under aquifers in China. Mining Science and Technology, Volume 10, Issue 1, p. 81-91.
Centennial Coal. 2010. Mandalong Mine Longwall 9 End of Panel Report. December.
Centennial Coal. 2014. End of Panel Report Longwall 15 Mandalong Mine. July.
Chappell, B A, Williams, J R and Pollard, A.N. 1984. Stress and slabbing in massive rock, Quart. J. Engineering Geol., Vol. 17, pp357-365.
Coffey Geotechnics Pty Ltd. 2013a. Gujarat NRE No.1 Colliery Major Expansion Part 3A Application Groundwater Analysis. Report GEOTLCOV24840AA-AB prepared for the NSW Department of Planning and Infrastructure. June.
Coffey Geotechnics Pty Ltd. 2013b. Gujarat NRE No.1 Colliery Major Expansion Project Part 3A Preferred Project Groundwater Assessment. Report GEOTLCOV24840AB-AB prepared for the NSW Department of Planning and Infrastructure. December.
Commonwealth of Australia (CA). 2014. Temperate Highland Peat Swamps on Sandstone: longwall mining engineering design—subsidence prediction, buffer distances and mine design options, Knowledge report, prepared by Coffey Geotechnics for the Department of the Environment, Commonwealth of Australia.
Dolinar, DR. 2003. Variation of horizontal stresses and strains in mines in bedded deposits in the eastern and midwestern United States. Proceedings of the 22nd International Conference on Ground Control in Mining, p. 178-185.
Guo H, Adhikary DP & Gaveva D 2007, Hydrogeology response to longwall mining, report to ACARP, project C14033.
Iannacchione, A. T., Bajpayee, T.S., and Edwards, J. L. 2005. Forecasting Roof Falls with Monitoring Technologies - A Look at the Moonee Colliery Experience. National Institute for Occupational Safety and Health, NIOSH-Pittsburgh Research Laboratory, Pittsburgh, PA.
Li, G, Forster, I, Fellowes, M and Myers, A. 2006. A Case Study on Longwall Mining under the Tidal Waters of Lake Macquarie, in Aziz, N (ed), Coal 2006: Coal Operators' Conference, University of Wollongong and the Australasian Institute of Mining and Metallurgy, p. 293-304.
McNally, G. 1995. Engineering geology of the Narrabeen Group in the Gosford-Newcastle Region. In Engineering Geology of the Newcastle-Gosford Region (ed. by S. Sloan and M. Allman), p. 40-63. Australian Geomechanics Society, Springwood.
Tammetta P. 2013. Estimation of the height of complete groundwater drainage above mined longwall panels. Groundwater, Volume 51, No. 5, p. 723–734.
Wachel E. W. 2012. Establishing Longwall Gob Porosity from Compaction in Western US Coal Mines. Masters Thesis, Colorado School of Mines (Mining and Earth Systems Engineering).

Russell Vale Colliery Underground Expansion Project Groundwater Review
Coffey GEOTLCOV24840AC-AB 22 September 2014
9
Wagner H and Schumann EHR. 1991. Surface effects of total coal-seam extraction by underground mining methods. Journal of the South African Institute of Mining and Metallurgy, Volume 91, No. 7, July 1991, pp 221-231.
Xu, Z., Y. Sun, Q. Dong, G. Zhang, and S. Li. 2010. Predicting the height of water-flow fractured zone during coal mining under the Xiaolangdi Reservoir. Mining Science and Technology (China), Volume 20, Issue 3, p. 434-438.
Zhang D, G Fan, L Ma, and X Wang. 2011. Aquifer protection during longwall mining of shallow coal seams: A case study in the Shendong Coalfield of China. International Journal of Coal Geology, Volume 86, Issues 2–3, Pages 190–196.
Zhang, J., and B. Shen. 2004. Coal mining under aquifers in China: a case study. International Journal of Rock Mechanics and Mining Sciences, Volume 41, Issue 4, p. 629-639.

Important information about your Coffey Report
As a client of Coffey you should know that site subsurface conditions cause more construction problems than any other factor. These notes have been prepared by Coffey to help you interpret and understand the limitations of your report.
Your report is based on project specific criteria
Your report has been developed on the basis of your unique project specific requirements as understood by Coffey and applies only to the site investigated. Project criteria typically include the general nature of the project; its size and configuration; the location of any structures on the site; other site improvements; the presence of underground utilities; and the additional risk imposed by scope-of-service limitations imposed by the client. Your report should not be used if there are any changes to the project without first asking Coffey to assess how factors that changed subsequent to the date of the report affect the report's recommendations. Coffey cannot accept responsibility for problems that may occur due to changed factors if they are not consulted.
Subsurface conditions can change
Subsurface conditions are created by natural processes and the activity of man. For example, water levels can vary with time, fill may be placed on a site and pollutants may migrate with time. Because a report is based on conditions which existed at the time of subsurface exploration, decisions should not be based on a report whose adequacy may have been affected by time. Consult Coffey to be advised how time may have impacted on the project.
Interpretation of factual data
Site assessment identifies actual subsurface conditions only at those points where samples are taken and when they are taken. Data derived from literature and external data source review, sampling and subsequent laboratory testing are interpreted by geologists, engineers or scientists to provide an opinion about overall site conditions, their likely impact on the proposed development and recommended actions. Actual conditions may differ from those inferred to exist, because no professional, no matter how qualified, can reveal what is hidden by earth, rock and time. The actual interface between materials may be far more gradual or abrupt than assumed based on the facts obtained. Nothing can be done to change the actual site conditions which exist, but steps can be taken to reduce the impact of unexpected conditions. For this reason, owners should retain the services of Coffey through the development stage, to identify variances, conduct additional tests if required, and recommend solutions to problems encountered on site.
Your report will only give preliminary recommendations
Your report is based on the assumption that the site conditions as revealed through selective point sampling are indicative of actual conditions throughout an area. This assumption cannot be substantiated until project implementation has commenced and therefore your report recommendations can only be regarded as preliminary. Only Coffey, who prepared the report, is fully familiar with the background information needed to assess whether or not the report's recommendations are valid and whether or not changes should be considered as the project develops. If another party undertakes the implementation of the recommendations of this report there is a risk that the report will be misinterpreted and Coffey cannot be held responsible for such misinterpretation.
Your report is prepared for specific purposes and persons
To avoid misuse of the information contained in your report it is recommended that you confer with Coffey before passing your report on to another party who may not be familiar with the background and the purpose of the report. Your report should not be applied to any project other than that originally specified at the time the report was issued.
Interpretation by other design professionals
Costly problems can occur when other design professionals develop their plans based on misinterpretations of a report. To help avoid misinterpretations, retain Coffey to work with other project design professionals who are affected by the report. Have Coffey explain the report implications to design professionals affected by them and then review plans and specifications produced to see how they incorporate the report findings.

Important information about your Coffey Report
Data should not be separated from the report*
The report as a whole presents the findings of the site assessment and the report should not be copied in part or altered in any way. Logs, figures, drawings, etc. are customarily included in our reports and are developed by scientists, engineers or geologists based on their interpretation of field logs (assembled by field personnel) and laboratory evaluation of field samples. These logs etc. should not under any circumstances be redrawn for inclusion in other documents or separated from the report in any way.
Geoenvironmental concerns are not at issue
Your report is not likely to relate any findings, conclusions, or recommendations about the potential for hazardous materials existing at the site unless specifically required to do so by the client. Specialist equipment, techniques, and personnel are used to perform a geoenvironmental assessment. Contamination can create major health, safety and environmental risks. If you have no information about the potential for your site to be contaminated or create an environmental hazard, you are advised to contact Coffey for information relating to geoenvironmental issues.
Rely on Coffey for additional assistance
Coffey is familiar with a variety of techniques and approaches that can be used to help reduce risks for all parties to a project, from design to construction. It is common that not all approaches will be necessarily dealt with in your site assessment report due to concepts proposed at that time. As the project progresses through design towards construction, speak with Coffey to develop alternative approaches to problems that may be of genuine benefit both in time and cost.
Responsibility
Reporting relies on interpretation of factual information based on judgement and opinion and has a level of uncertainty attached to it, which is far less exact than the design disciplines. This has often resulted in claims being lodged against consultants, which are unfounded. To help prevent this problem, a number of clauses have been developed for use in contracts, reports and other documents. Responsibility clauses do not transfer appropriate liabilities from Coffey to other parties but are included to identify where Coffey's responsibilities begin and end. Their use is intended to help all parties involved to recognise their individual responsibilities. Read all documents from Coffey closely and do not hesitate to ask any questions you may have.
* For further information on this aspect reference should be
made to "Guidelines for the Provision of Geotechnical information in Construction Contracts" published by the Institution of Engineers Australia, National headquarters, Canberra, 1987.

Appendix A - Clarification

Clarification The Geoterra report (page 52) discusses the results of Tammetta (2013) (referencing the digital version of Tammetta 2013, dated 2012, which is identical to Tammetta 2013) and states that the “assumption” that the geology of the overburden strata plays a minor role in caving is questionable (referring to a personal communication from Seedsman RW, page 52). In Tammetta (2013) an analysis of piezometer water level data from 18 locations found that for those locations, observations of the maximum height of desaturation above the panel (at centre panel), referred to as H, could be reproduced to better than 8% RMS error without requiring knowledge of the lithology of the consolidated overburden, by use of a fitted empirical equation. Tammetta (2013) noted that this had been observed by other researchers in the literature. The finding is not an assumption, as stated in the Geoterra report, but is a result (of the analysis that relates to H over centre panel). Tammetta (2013) discussed super-strong dolerite sills in South Africa which showed H slightly lower than calculated using the equation. Despite a thorough search of the literature, no other published data could be found to show significant deviations from the equation.
It is understood (pers. comm, C. Watson, Office of Water Science, 14/08/2014) that groundwater monitoring data from the Mandalong Mine may have been considered by others as a basis for questioning the results of Tammetta (2013). We understand that the interpretation in Tammetta (2013) of water level monitoring data from piezometer nest BH22 at Mandalong Mine has been questioned, but we have not been provided with the basis of the question. Ross Seedsman (pers. comm., 6 December 2013) indicates his disagreement with the interpretation of water level data from BH22 in Tammetta (2013), but has provided no counter-interpretation for comment.
Further, CA (2014) provide the following peer review comment:
“Ross Seedsman believes that some of the larger figures for complete height of groundwater drainage (CHGD) provided in Tammetta (2012) should be considered in relation to a paper by Guo et al. (2007), which provides a different interpretation. Ross suggests that the representation of the collapsed zone in Figure 7.10 is questionable and also that there is a fundamental difficulty in using complete groundwater drainage as a measure of impact as it is difficult to allow for the time factor. The dilated zones in the current models allow for a temporary drop in piezometric level, which may take an extended period of time to recover if the pre-mining hydraulic conductivities are low.”
The issue of water level monitoring data from Mandalong Mine (particularly BH22), and their interpretation, will be discussed in detail in this appendix. While no published observations could be found that could support the peer review comments above, many of the issues raised by Mr Seedsman will be reserved for discussion in a journal publication at some time in the future, as clarification of these issues is of fundamental importance for regulatory agencies attempting to determine coal mining applications.
Mandalong Mine is located near Wyee and Moonee Collieries. These mines are located in a localised area around Lake Macquarie, characterised by horizontal stresses with magnitudes about 5 times the vertical stress (McNally 1995). Li et al. (2006) cite Chappell et al. (1984) as measuring horizontal stresses of between 5 and 7 times the vertical stress at Kangy Angy. This stress field does not eliminate caving but does retard it, creating difficulties in forecasting roof falls (Iannacchione et al. 2005). These horizontal stress magnitudes are far in excess of those commonly seen in the near surface around the world (where the horizontal stress is commonly about 2 to 3 times the vertical stress). This stress regime is a phenomenon of the near surface (from ground surface to depths nearing 1000m, depending on topographic relief). It is common in hilly terrain and is prominent in the eastern USA and eastern Australia. Figure A1 shows measured principal horizontal stresses in the eastern USA (Dolinar 2003) as a typical example. Several of the results from Tammetta (2013) were from this area.
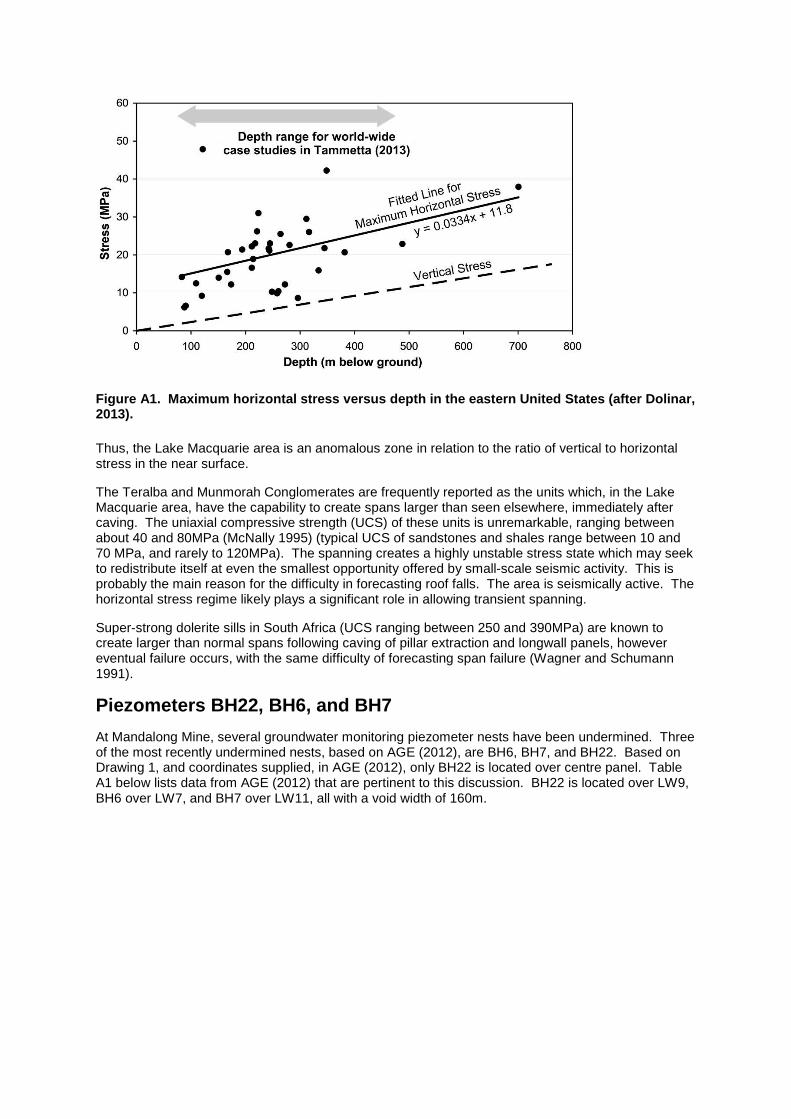
Figure A1. Maximum horizontal stress versus depth in the eastern United States (after Dolinar, 2013).
Thus, the Lake Macquarie area is an anomalous zone in relation to the ratio of vertical to horizontal stress in the near surface.
The Teralba and Munmorah Conglomerates are frequently reported as the units which, in the Lake Macquarie area, have the capability to create spans larger than seen elsewhere, immediately after caving. The uniaxial compressive strength (UCS) of these units is unremarkable, ranging between about 40 and 80MPa (McNally 1995) (typical UCS of sandstones and shales range between 10 and 70 MPa, and rarely to 120MPa). The spanning creates a highly unstable stress state which may seek to redistribute itself at even the smallest opportunity offered by small-scale seismic activity. This is probably the main reason for the difficulty in forecasting roof falls. The area is seismically active. The horizontal stress regime likely plays a significant role in allowing transient spanning.
Super-strong dolerite sills in South Africa (UCS ranging between 250 and 390MPa) are known to create larger than normal spans following caving of pillar extraction and longwall panels, however eventual failure occurs, with the same difficulty of forecasting span failure (Wagner and Schumann 1991).
Piezometers BH22, BH6, and BH7
At Mandalong Mine, several groundwater monitoring piezometer nests have been undermined. Three of the most recently undermined nests, based on AGE (2012), are BH6, BH7, and BH22. Based on Drawing 1, and coordinates supplied, in AGE (2012), only BH22 is located over centre panel. Table A1 below lists data from AGE (2012) that are pertinent to this discussion. BH22 is located over LW9, BH6 over LW7, and BH7 over LW11, all with a void width of 160m.
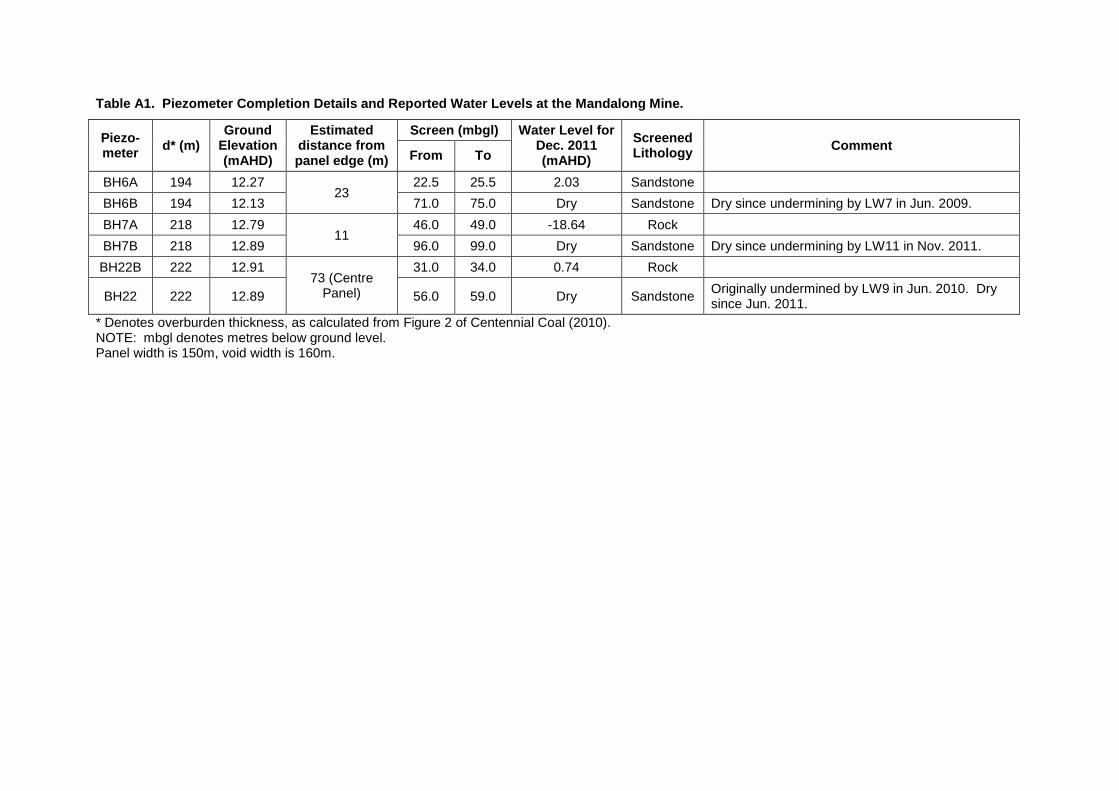
Table A1. Piezometer Completion Details and Reported Water Levels at the Mandalong Mine.
Piezo-meter d* (m)
Ground Elevation (mAHD)
Estimated distance from panel edge (m)
Screen (mbgl) Water Level for Dec. 2011 (mAHD)
Screened Lithology Comment
From To
BH6A 194 12.27 23
22.5 25.5 2.03 Sandstone
BH6B 194 12.13 71.0 75.0 Dry Sandstone Dry since undermining by LW7 in Jun. 2009.
BH7A 218 12.79 11
46.0 49.0 -18.64 Rock
BH7B 218 12.89 96.0 99.0 Dry Sandstone Dry since undermining by LW11 in Nov. 2011.
BH22B 222 12.91 73 (Centre
Panel)
31.0 34.0 0.74 Rock
BH22 222 12.89 56.0 59.0 Dry Sandstone Originally undermined by LW9 in Jun. 2010. Dry since Jun. 2011.
* Denotes overburden thickness, as calculated from Figure 2 of Centennial Coal (2010). NOTE: mbgl denotes metres below ground level. Panel width is 150m, void width is 160m.

Figure A2 shows the data from Table A1 plotted as pressure head versus height above the seam. Dry piezometers are plotted as zero pressure at the location of the screen. Given the mass of data available from other piezometers, and the severe gradient in water level fall at BH6B and BH22 when undermined, saturation below dry piezometers is considered highly unlikely. BH18 also overlies a panel, however it went dry with dh/dt typical of a far field sink, and is not incorporated into these calculations.
Figure A2. Pressure head versus height above the mined seam for fractured rock media at Mandalong Mine.
From Figure A2, the height above the seam at which pressure head becomes zero is as follows:
• BH6 nest: Between 121m and 170m (average of 146m)
• BH7 nest: Between 121m and 171m (average of 146m)
• BH22 nest: Between 165m and 190m (average of 178m)
The height of desaturation at BH6 and BH7 became fully developed immediately after undermining. However, at BH22 (centre panel), H became fully developed about 1 year after undermining, probably related to the time required for the stress field to fully redistribute itself.
The average observed H at BH22 is 178m. The equation of Tammetta (2013) predicts an H of about 190m. These results accord well with the results of Tammetta (2013), and constitute a good example of demonstrating the base of saturation over centre panel, and also in moving away from centre panel. Tammetta (2013) incorporated monitoring data from BH22 in that study, interpreting an H of 175m. Figure A3 shows the estimated boundary of the collapsed zone specifically for a Mandalong panel, with an average overburden thickness of 211m (the average for BH6, BH7, and BH22), and the estimated heights at which pressure head becomes zero.
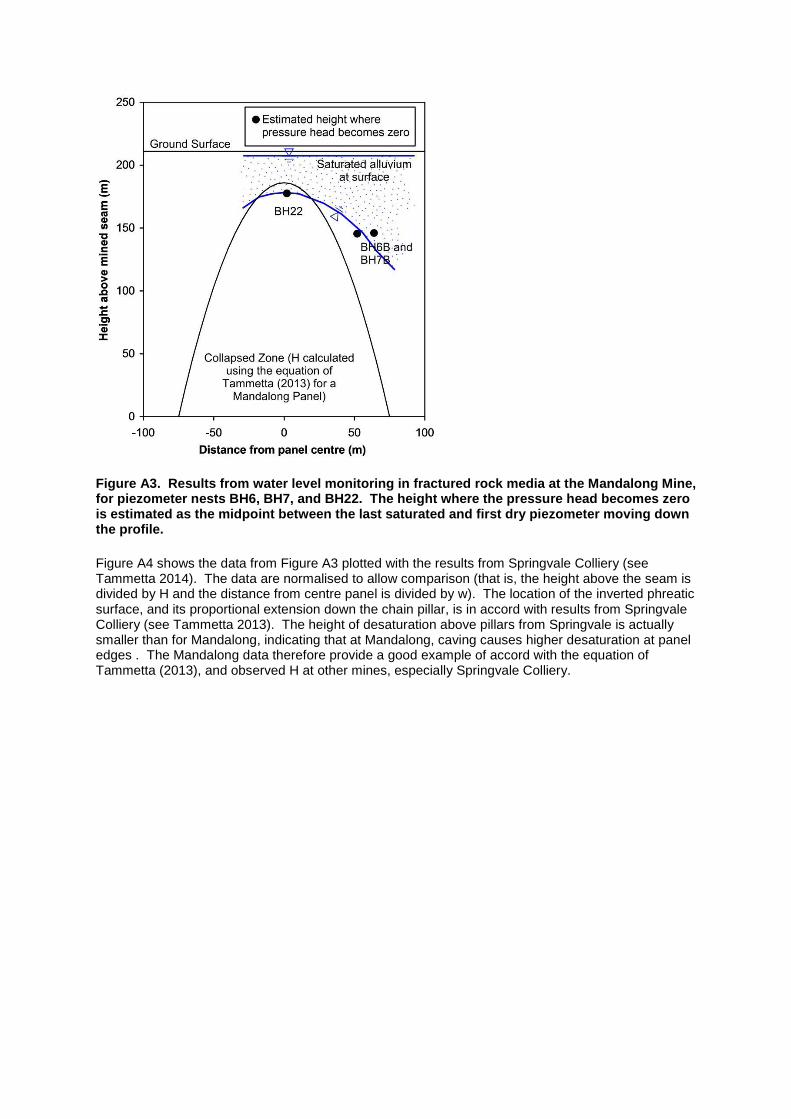
Figure A3. Results from water level monitoring in fractured rock media at the Mandalong Mine, for piezometer nests BH6, BH7, and BH22. The height where the pressure head becomes zero is estimated as the midpoint between the last saturated and first dry piezometer moving down the profile.
Figure A4 shows the data from Figure A3 plotted with the results from Springvale Colliery (see Tammetta 2014). The data are normalised to allow comparison (that is, the height above the seam is divided by H and the distance from centre panel is divided by w). The location of the inverted phreatic surface, and its proportional extension down the chain pillar, is in accord with results from Springvale Colliery (see Tammetta 2013). The height of desaturation above pillars from Springvale is actually smaller than for Mandalong, indicating that at Mandalong, caving causes higher desaturation at panel edges . The Mandalong data therefore provide a good example of accord with the equation of Tammetta (2013), and observed H at other mines, especially Springvale Colliery.
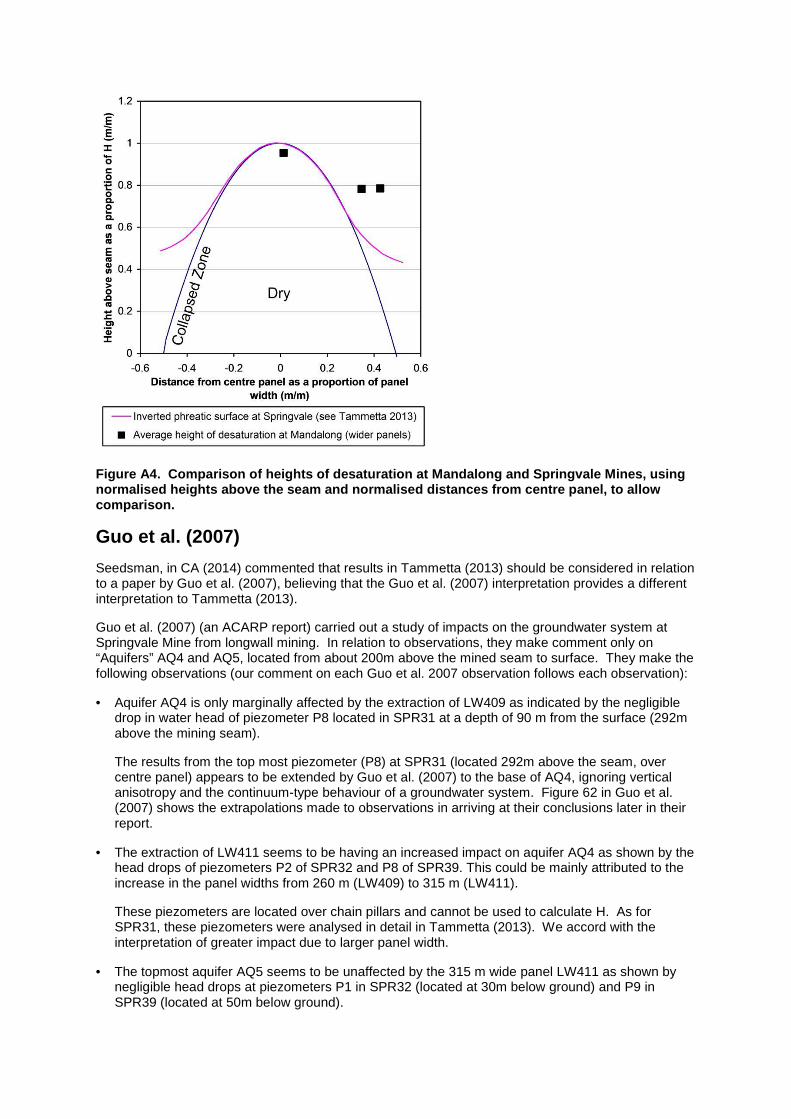
Figure A4. Comparison of heights of desaturation at Mandalong and Springvale Mines, using normalised heights above the seam and normalised distances from centre panel, to allow comparison.
Guo et al. (2007)
Seedsman, in CA (2014) commented that results in Tammetta (2013) should be considered in relation to a paper by Guo et al. (2007), believing that the Guo et al. (2007) interpretation provides a different interpretation to Tammetta (2013).
Guo et al. (2007) (an ACARP report) carried out a study of impacts on the groundwater system at Springvale Mine from longwall mining. In relation to observations, they make comment only on “Aquifers” AQ4 and AQ5, located from about 200m above the mined seam to surface. They make the following observations (our comment on each Guo et al. 2007 observation follows each observation):
• Aquifer AQ4 is only marginally affected by the extraction of LW409 as indicated by the negligible drop in water head of piezometer P8 located in SPR31 at a depth of 90 m from the surface (292m above the mining seam).
The results from the top most piezometer (P8) at SPR31 (located 292m above the seam, over centre panel) appears to be extended by Guo et al. (2007) to the base of AQ4, ignoring vertical anisotropy and the continuum-type behaviour of a groundwater system. Figure 62 in Guo et al. (2007) shows the extrapolations made to observations in arriving at their conclusions later in their report.
• The extraction of LW411 seems to be having an increased impact on aquifer AQ4 as shown by the head drops of piezometers P2 of SPR32 and P8 of SPR39. This could be mainly attributed to the increase in the panel widths from 260 m (LW409) to 315 m (LW411).
These piezometers are located over chain pillars and cannot be used to calculate H. As for SPR31, these piezometers were analysed in detail in Tammetta (2013). We accord with the interpretation of greater impact due to larger panel width.
• The topmost aquifer AQ5 seems to be unaffected by the 315 m wide panel LW411 as shown by negligible head drops at piezometers P1 in SPR32 (located at 30m below ground) and P9 in SPR39 (located at 50m below ground).

These locations are a height of about 320m above the mined seam or higher, and outside the collapsed zone.
Guo et al. (2007) conclude the following:
The piezometer monitoring data indicate that the zone of influence of longwall extractions can extend as high as 250 m and 275 m above the mining seam for 260m and 315m wide panels respectively. The influence of longwall extraction in the lateral directions ahead of the mining face can be seen to extend even further up to a distance of 350 m closer to the mining seam horizon.
The quantitative definition of the hydrogeological characteristics of the “zone of influence” do not appear to be provided by Guo et al in defining this zone. H calculated using the equation of Tammetta (2013) at the location for SPR31 is 258m above the mined seam. There appears to be no conflict between the interpretation in Tammetta (2013) and that in Guo et al. (2014).
Piezometers BH2, BH20, and BH21
A localised cluster of piezometer nests further northeast (BH2, BH20, and BH21, see Figure A5) have also been undermined but appear to show maintenance of saturation. These piezometers are located over panels LW1 to LW3, which are thinner (void width of approximately 120m from AGE 2012) than panels underlying the piezometers analysed above. These piezometers are located down topographic gradient where the surface alluvium may be thicker (alluvial thickness measurements were unavailable) and may constitute the presence of a potential high conductivity saturated body at the surface, which could reduce H. Figure A5 shows the piezometer nest locations. The average H calculated from Tammetta (2013) is approximately 145m at these locations.

Figure A5. Locations of piezometer nests and longwall panels, and boundary of the Wyong soil. The figure base is from Figure 2 of Centennial Coal (2010).
Records in AGE (2012) indicate the presence of a fault that was intersected at LW1 (see Figure A5) in mid-2005 and which appears to have markedly accentuated the drawdown at BH17. The statement that intersection was at the outbye side of the panel, and taking into account the impact vector to BH17, suggests the fault forms a small angle with the panel (and possibly runs nearly north-south, parallel with a water course about 500m to the east) and would therefore be of little influence at the locations of BH6, BH7, and BH12 further west.
The fault may accentuate the role played by the alluvium (with potentially high K) in reducing H at the locations of BH2, BH20, and BH21, by increasing the vertical downward flux from the alluvial body to the fractured rock media, thereby reducing H. Figure A6 shows the pressure heads for BH2, BH20, and BH21, versus mined height. Observations indicate H of between about 100m and 110m above the mined seam. This is about 40m lower than the calculated H. This accords strongly with other locations where in Tammetta (2013) where the panel underlies a flowing river or saturated high permeability alluvium. The other locations indicate a height of desaturation which is consistently 40m to 50m smaller than for the ordinary case (see Tammetta 2013). The Mandalong data demonstrate another example of this situation.
Figure A6. Pressure heads versus height above the mined seam for BH2, BH20, and BH21.
Recent Monitoring Data Recent monitoring data from Mandalong groundwater piezometer nests BH9 and BH25, in AGE (2014) provide further insight. BH9 is located over LW12, about 23m from the edge, and was undermined in January 2013. BH25 is located approximately over the centre of LW14 (about 70m from the edge), was undermined in July 2013, and is located at the end of the panel, only about 80m from the final face position (it is approximately equally spaced between the final face, and either panel edge), so that 2-dimensionality in impacts from caving cannot be assumed. Nest locations are shown in Figure 1 of AGE (2014), provided in Appendix A. Overburden thicknesses are estimated from

Figure 2 of Centennial Coal (2014) as about 255m and 234m for the BH9 and BH25 nests respectively. Relevant piezometer information is listed in Table A2.
Figure A7 shows the data from Table A2 plotted as pressure head versus height above the seam, compared to pressure heads for VH6, BH7, and BH22.
Table A2. Recent monitoring results for piezometer nests BH9 and BH25 at the Mandalong Mine
Piezo-meter
d * (m)
Ground Elevation (mAHD)
Estimated distance
from panel edge (m)
Screened Interval (mbgl)
Water Level for Dec. 2013 (mAHD)
Screened Lithology From To
BH09A 255 18.07 23
29 33 1.92 Mudstone/Sandstone
BH09B 255 17.95 54 60 -1.66 Mudstone/Sandstone
BH25B 234 14.31 70 (Centre Panel)^
20 30 9.89 Sandstone
BH25C 234 14.43 52 58 5.13 Mudstone/Sandstone * Denotes overburden thickness, as calculated from Figure 2 of Centennial Coal (2014). ^ BH25 is 80m away from the final face position. NOTE: mbgl denotes metres below ground level. Panel width is 150m, void width is 160m.
Figure A7. Pressure head versus height above the mined seam for fractured rock media at Mandalong Mine.
The average H calculated from Tammetta (2013) is approximately 190m at these locations. The following salient features are interpreted:
• The lower screen at BH9 is probably too high in the profile to show desaturation (the height of desaturation at BH9 will be markedly smaller than calculated H).

• Given the location of the BH25 nest, water levels at BH25 will behave as if it were near the side of a panel. This is because of the attenuation of deformation due to end effects. Thus, the height of desaturation at BH25 will be markedly smaller than calculated H. As a result, the lower screen at BH25 is likely to be too high in the profile to show desaturation either now or in the future. The reason for the behaviour at BH25 is due to the pattern of goaf compaction, which is an indicator of overburden deformation. The distribution of goaf compaction is as shown in Figure A8 (data from Wachell 2012). This pattern accords with field observations from drilling investigations (Zhang and Shen 2004, Xu et al. 2010, Bai and Elsworth 1989, and Zhang et al. 2011) where the shape of the goaf zone is interpreted as being squat in cross-section with vertically extended lobes near the panel edges. At the final face position, deformation is thought to be much reduced compared to centre panel further back along the long dimension of the panel.
Figure A8. Typical simulated compaction of a longwall goaf (data from Wachel 2012).
Conclusion The example of the Mandalong water level database highlights the necessity of undertaking adequate review of estimates made by proponents of heights of desaturation for underground mining projects, so that unrepresentative or erroneous results are not incorporated into impact assessments. Despite the anomalous stress regime near Lake Macquarie, the behaviour of the groundwater system to longwall caving accords well with results from Tammetta (2013). This will be relevant for coal developments in the southern Newcastle Coalfield.
Comments made by Seedsman have been addressed in brief above. The time-series issue raised by Seedsman is discussed in a journal article due to be released.
A thorough discussion of the comments by Seedsman (in CA 2014) is not possible in the current report, however the issue of impacts on the groundwater system from longwall caving is considered to be of the utmost importance. Thus, it is anticipated that a more thorough discussion of the above will be compiled for journal publication.

Appendix B - Figure 1 of AGE (2014)