Embed Size (px)
Citation preview
COMPREHENSIVE ANNUAL FINANCIAL REPORT
of the
GUILFORD COUNTY BOARD OF EDUCATION
Greensboro, North Carolina
For the Fiscal Year Ended June 30, 2010
Prepared by:
Sharon Ozment, Chief Financial Officer
Angela Henry, Assistant Financial Officer

THIS PAGE LEFT INTENTIONALLY BLANK.
Guilford County Board of Education
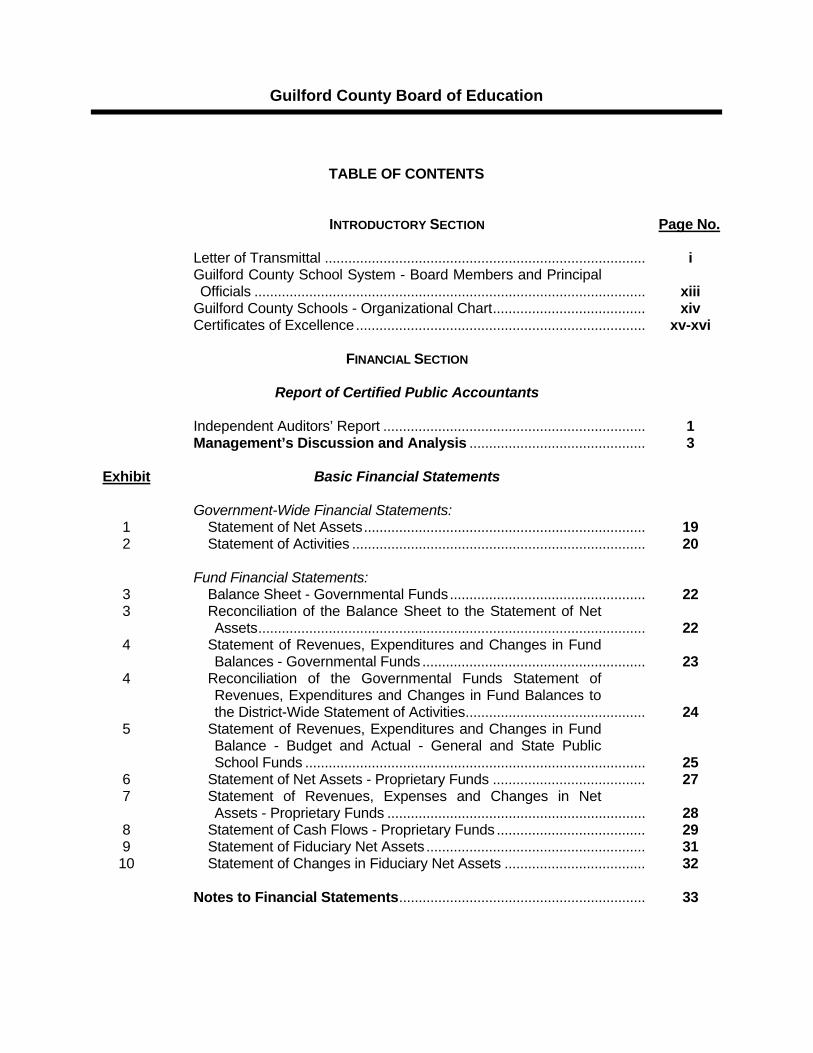
TABLE OF CONTENTS INTRODUCTORY SECTION Page No. Letter of Transmittal .................................................................................. i Guilford County School System - Board Members and Principal
Officials .................................................................................................... xiii Guilford County Schools - Organizational Chart ....................................... xiv Certificates of Excellence .......................................................................... xv-xvi FINANCIAL SECTION Report of Certified Public Accountants Independent Auditors’ Report ................................................................... 1 Management’s Discussion and Analysis ............................................. 3 Exhibit Basic Financial Statements Government-Wide Financial Statements: 1 Statement of Net Assets ........................................................................ 19 2 Statement of Activities ........................................................................... 20 Fund Financial Statements: 3 Balance Sheet - Governmental Funds .................................................. 22 3 Reconciliation of the Balance Sheet to the Statement of Net
Assets ................................................................................................... 22 4 Statement of Revenues, Expenditures and Changes in Fund
Balances - Governmental Funds ......................................................... 23 4 Reconciliation of the Governmental Funds Statement of
Revenues, Expenditures and Changes in Fund Balances to the District-Wide Statement of Activities .............................................. 24
5 Statement of Revenues, Expenditures and Changes in Fund Balance - Budget and Actual - General and State Public School Funds ....................................................................................... 25
6 Statement of Net Assets - Proprietary Funds ....................................... 27 7 Statement of Revenues, Expenses and Changes in Net
Assets - Proprietary Funds .................................................................. 28 8 Statement of Cash Flows - Proprietary Funds ...................................... 29 9 Statement of Fiduciary Net Assets ........................................................ 31 10 Statement of Changes in Fiduciary Net Assets .................................... 32 Notes to Financial Statements ............................................................... 33
Guilford County Board of Education
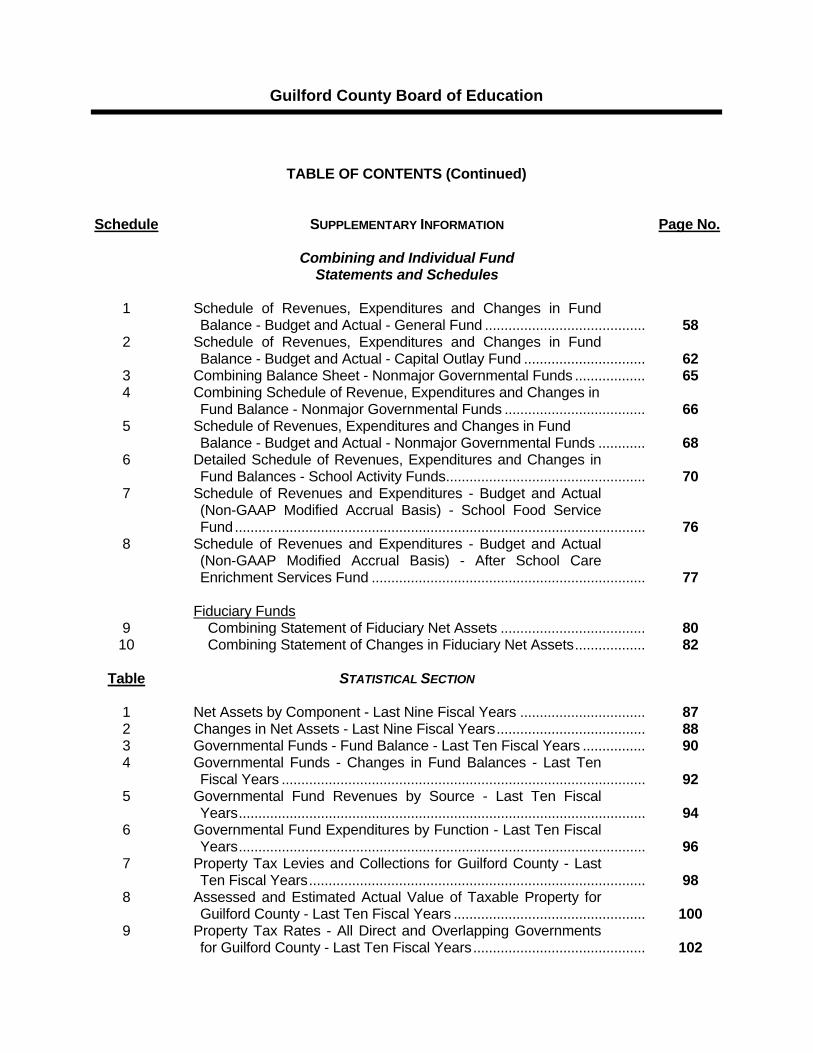
TABLE OF CONTENTS (Continued) Schedule SUPPLEMENTARY INFORMATION Page No. Combining and Individual Fund Statements and Schedules 1 Schedule of Revenues, Expenditures and Changes in Fund
Balance - Budget and Actual - General Fund ......................................... 58 2 Schedule of Revenues, Expenditures and Changes in Fund
Balance - Budget and Actual - Capital Outlay Fund ............................... 62 3 Combining Balance Sheet - Nonmajor Governmental Funds .................. 65 4 Combining Schedule of Revenue, Expenditures and Changes in Fund Balance - Nonmajor Governmental Funds .................................... 66 5 Schedule of Revenues, Expenditures and Changes in Fund Balance - Budget and Actual - Nonmajor Governmental Funds ............ 68 6 Detailed Schedule of Revenues, Expenditures and Changes in
Fund Balances - School Activity Funds ................................................... 70 7 Schedule of Revenues and Expenditures - Budget and Actual
(Non-GAAP Modified Accrual Basis) - School Food Service Fund ......................................................................................................... 76
8 Schedule of Revenues and Expenditures - Budget and Actual (Non-GAAP Modified Accrual Basis) - After School Care Enrichment Services Fund ...................................................................... 77
Fiduciary Funds 9 Combining Statement of Fiduciary Net Assets ..................................... 80 10 Combining Statement of Changes in Fiduciary Net Assets .................. 82 Table STATISTICAL SECTION 1 Net Assets by Component - Last Nine Fiscal Years ................................ 87 2 Changes in Net Assets - Last Nine Fiscal Years ...................................... 88 3 Governmental Funds - Fund Balance - Last Ten Fiscal Years ................ 90 4 Governmental Funds - Changes in Fund Balances - Last Ten
Fiscal Years ............................................................................................. 92 5 Governmental Fund Revenues by Source - Last Ten Fiscal
Years ........................................................................................................ 94 6 Governmental Fund Expenditures by Function - Last Ten Fiscal
Years ........................................................................................................ 96 7 Property Tax Levies and Collections for Guilford County - Last
Ten Fiscal Years ...................................................................................... 98 8 Assessed and Estimated Actual Value of Taxable Property for
Guilford County - Last Ten Fiscal Years ................................................. 100 9 Property Tax Rates - All Direct and Overlapping Governments
for Guilford County - Last Ten Fiscal Years ............................................ 102
Guilford County Board of Education
TABLE OF CONTENTS (Continued) Table STATISTICAL SECTION (CONTINUED) Page No. 10 Ratio of Outstanding Debt by Type for Guilford County - Last
Ten Fiscal Years ...................................................................................... 104 11 Direct and Overlapping Governmental Activities Debt for
Guilford County - June 30, 2010 ............................................................. 105 12 Principal Taxpayers in Guilford County - Current Year and Nine
Years Ago ................................................................................................ 107 13 Legal Debt Margin Information - Guilford County - Last Ten
Fiscal Years ............................................................................................. 108 14 Demographic Statistics for Guilford County - Last Ten Fiscal
Years ........................................................................................................ 110 15 Principal Employers - Current Year and Nine Years Ago......................... 111 16 Full-time Equivalent Employers by Function - Last Ten Fiscal
Years ........................................................................................................ 112 17 Comparative Average Daily Membership - School and Special
Programs - Last Ten Fiscal Years ........................................................... 114 18 Operating Statistics - Last Ten Fiscal Years ............................................. 118 19 Instructional Personnel - Last Ten Fiscal Years ....................................... 120 20 School Building Data - Elementary, Middle, High Schools and
Special Use Facilities ............................................................................... 121 Schedule COMPLIANCE SECTION Report on Internal Control Over Financial Reporting and on
Compliance and Other Matters Based on an Audit of Financial Statements Performed in Accordance with Government Auditing Standards ......................................................... 125
Report on Compliance with Requirements That Could Have a Direct and Material Effect on Each Major Federal Program and Internal Control Over Compliance in Accordance with OMB Circular A-133 and the State Single Audit Implementation Act ..................................................................... 127
Report on Compliance with Requirements That Could Have a Direct and Material Effect on Each Major State Program and Internal Control Over Compliance in Accordance with OMB Circular A-133 and the State Single Audit Implementation Act ............................................................................... 129
11 Schedule of Findings and Questioned Costs ........................................... 131 12 Summary Schedule of Prior Year Audit Findings ..................................... 135 13 Corrective Action Plan ............................................................................... 136 14 Schedule of Expenditures of Federal and State Awards .......................... 137

THIS PAGE LEFT INTENTIONALLY BLANK.
INTRODUCTORY SECTION

THIS PAGE LEFT INTENTIONALLY BLANK.
- ii -
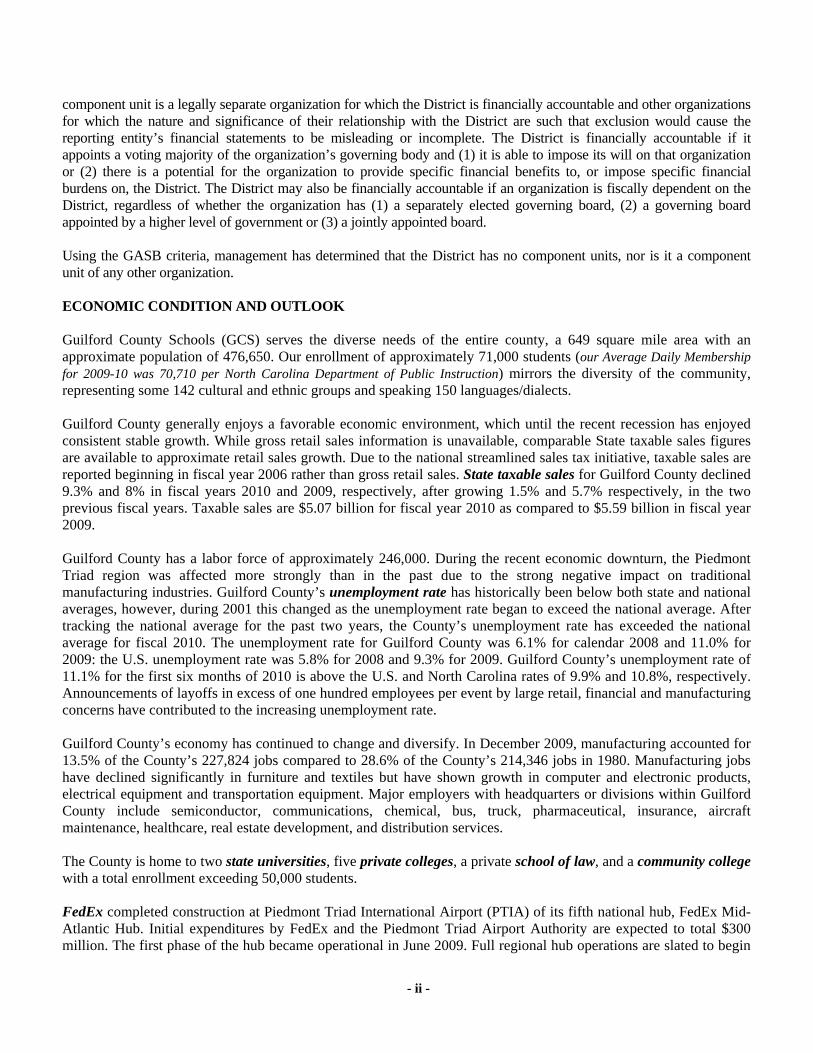
component unit is a legally separate organization for which the District is financially accountable and other organizations for which the nature and significance of their relationship with the District are such that exclusion would cause the reporting entity’s financial statements to be misleading or incomplete. The District is financially accountable if it appoints a voting majority of the organization’s governing body and (1) it is able to impose its will on that organization or (2) there is a potential for the organization to provide specific financial benefits to, or impose specific financial burdens on, the District. The District may also be financially accountable if an organization is fiscally dependent on the District, regardless of whether the organization has (1) a separately elected governing board, (2) a governing board appointed by a higher level of government or (3) a jointly appointed board. Using the GASB criteria, management has determined that the District has no component units, nor is it a component unit of any other organization. ECONOMIC CONDITION AND OUTLOOK Guilford County Schools (GCS) serves the diverse needs of the entire county, a 649 square mile area with an approximate population of 476,650. Our enrollment of approximately 71,000 students (our Average Daily Membership for 2009-10 was 70,710 per North Carolina Department of Public Instruction) mirrors the diversity of the community, representing some 142 cultural and ethnic groups and speaking 150 languages/dialects. Guilford County generally enjoys a favorable economic environment, which until the recent recession has enjoyed consistent stable growth. While gross retail sales information is unavailable, comparable State taxable sales figures are available to approximate retail sales growth. Due to the national streamlined sales tax initiative, taxable sales are reported beginning in fiscal year 2006 rather than gross retail sales. State taxable sales for Guilford County declined 9.3% and 8% in fiscal years 2010 and 2009, respectively, after growing 1.5% and 5.7% respectively, in the two previous fiscal years. Taxable sales are $5.07 billion for fiscal year 2010 as compared to $5.59 billion in fiscal year 2009. Guilford County has a labor force of approximately 246,000. During the recent economic downturn, the Piedmont Triad region was affected more strongly than in the past due to the strong negative impact on traditional manufacturing industries. Guilford County’s unemployment rate has historically been below both state and national averages, however, during 2001 this changed as the unemployment rate began to exceed the national average. After tracking the national average for the past two years, the County’s unemployment rate has exceeded the national average for fiscal 2010. The unemployment rate for Guilford County was 6.1% for calendar 2008 and 11.0% for 2009: the U.S. unemployment rate was 5.8% for 2008 and 9.3% for 2009. Guilford County’s unemployment rate of 11.1% for the first six months of 2010 is above the U.S. and North Carolina rates of 9.9% and 10.8%, respectively. Announcements of layoffs in excess of one hundred employees per event by large retail, financial and manufacturing concerns have contributed to the increasing unemployment rate. Guilford County’s economy has continued to change and diversify. In December 2009, manufacturing accounted for 13.5% of the County’s 227,824 jobs compared to 28.6% of the County’s 214,346 jobs in 1980. Manufacturing jobs have declined significantly in furniture and textiles but have shown growth in computer and electronic products, electrical equipment and transportation equipment. Major employers with headquarters or divisions within Guilford County include semiconductor, communications, chemical, bus, truck, pharmaceutical, insurance, aircraft maintenance, healthcare, real estate development, and distribution services. The County is home to two state universities, five private colleges, a private school of law, and a community college with a total enrollment exceeding 50,000 students. FedEx completed construction at Piedmont Triad International Airport (PTIA) of its fifth national hub, FedEx Mid-Atlantic Hub. Initial expenditures by FedEx and the Piedmont Triad Airport Authority are expected to total $300 million. The first phase of the hub became operational in June 2009. Full regional hub operations are slated to begin
- iii -
in the future. FedEx has 200 workers in Phase I, with a planned expansion to a total of 1,500 workers in Phase II. A 9,000-foot runway was constructed at PTIA to accommodate the FedEx hub. The $150 million runway was dedicated in June 2010. FedEx Ground continues construction of its $100 million distribution hub on its 125 acre, $13.3 million site in Triad Business Park. The 400,000 square-foot ground shipping hub will initially bring about 270 new jobs to the Triad. Ultimately, the operation could employ as many as 1,400 workers and contract drivers. Construction began in Spring 2009, with a 2011 projected opening date. Honda Aircraft Company, Inc. announced in February 2007 that it planned to locate its world headquarters and production facility at PTIA. The Company currently occupies an administrative building and its World Research and Development Center at PTIA and began construction of its 250,000 square-foot production hangar in late summer 2009 with expected completion in early 2011. The delivery of the first HondaJet (priced at $4.5 million) is projected to be in the 3rd quarter of 2012. The revitalization of downtown Greensboro continues to thrive. In 2009-2010, Downtown gained a net of 14 new storefront businesses with a total financial investment of $20.9 million. Downtown had 107 building renovation and construction projects generating $8 million, with 52 properties purchased generating investment of $12.9 million. The redevelopment of a vacant 17-story office tower including over 100 condominium units, one floor of office space, retail shops and a restaurant opened for occupancy in the Spring of 2009. A restaurant and bank opened on the first floor in August and December 2009, respectively. Mack Trucks, Inc., one of North America’s largest producers of heavy-duty trucks, celebrated the grand opening of its new world headquarters in Greensboro in September 2009, bringing or creating 493 jobs and investing an expected $17.7 million over the next three years. Ameritox, Ltd., specializing in pain prescription monitoring, opened its new laboratory and material analysis facility in a 70,000 square-foot facility in Greensboro in June 2010. At full capacity, the company will employ 228 people. Precor Incorporated, an exercise equipment manufacturer, celebrated a grand opening of its 230,000 square foot, $26.2 million facility in Rock Creek Center in March 2010. Precor plans to hire 142 new employees at an average salary in excess of $38,000 by 2011. Approximately 90 full-time employees have been hired as of September 2010. The County’s Board of Commissioners approved $294,000 in incentives for Precor in November 2008. American Express confirmed in May 2010 that it will invest up to $600 million in construction of a data center on two sites near Interstate 40 at Rock Creek Dairy Road. Timco Aviation Services officials announced in August 2010 that the Company has hired more than 200 employees since the beginning of 2010 to support its many contracts, and will need another 80 employees by the end of the year. High Point has continued to experience growth in its downtown as well as in outlying areas with $29.4 million of commercial additions or expansions, while creating or announcing 1,405 jobs in 2009. High Point University completed projects totaling $110 million and created 176 new jobs in 2009. Harland Clarke Corporation opened its 135,000 square-foot order fulfillment facility on Premier Drive in High Point in May 2009. The Company initially moved 200 employees from within the County; by August 2009, it had transferred 80 employees from facilities outside the County and by November 2009 it had hired an additional 70 new employees, resulting in 350 jobs at its High Point location.
- iv -
Three interrelated companies, Trans Tech Pharma, PharmaCore, and the Mendenhall Clinical Research Center opened new facilities in 2009 on their campus in High Point. The new facilities are a part of an ongoing project announced in 2007 which will create 205 new jobs over five years. BUDGET PROCESS The North Carolina School Budget and Fiscal Control Act mandates a uniform budget format and the adoption of an annual balanced budget resolution for the State Public School Fund, the Local Current Expense Fund, federal grants restricted as to use, and the Capital Outlay Fund. The district’s budget resolution also includes the Child Nutrition or School Food Service Fund and the ACES (After-School Care Enrichment Services) fund. Budget development is a year-round process that begins in the fall of each year and continues until a budget resolution is adopted by the Guilford County Board of Education on or before July 1. Participation at all levels of the school system is evident in this ongoing process. Schools and central office departments review their budget needs and submit their requests. Parent Teacher Associations (PTAs) offer input. The superintendent, chief financial officer and division chiefs develop the superintendent's budget request prioritizing all requests based on the vision, mission, goals, objectives and strategies outlined in the district’s strategic plan, Achieving Educational Excellence. Initial state and federal budget calculations are based on budget information provided by the North Carolina Department of Public Instruction, if any, and the state and federal planning allotments. A multi-year budget forecasting model was developed for the Local Current Expense Fund in order to facilitate long-range budget/financial planning for the school district by the Board of Education and the County Commission. Previous years’ budgets and development processes were reviewed in order to identify the major budgetary assumptions/variables of federal, state and local origin impacting the school district’s budget development/adoption. The Multi-Year Budget Forecasting Model includes the following budgetary assumptions/variables identified as a result of that review:
salary increase percentage for teachers/licensed staff; salary increase percentage for principals/assistant principals; salary increase percentage for classified employees; changes in employee benefit rates/amounts (social security, retirement, hospitalization, workers’
compensation, unemployment, dental insurance, life insurance); percentage of increase for annual utility/energy and gas/diesel fuel costs; percentage of increase for various risk management areas (i.e., liability/fleet/property/pupil scholastic
accident insurance lines of coverage); additional energy costs for newly constructed and or air conditioned square footage associated with the
district’s Capital Improvement Plan (CIP) Program; additional maintenance/staffing costs associated with newly constructed and/or renovated square footage
associated with the CIP Program; and increase in funding associated with projected growth in student enrollment (the County has, in several
recent fiscal years, funded the projected increase in tenth-day enrollment for the upcoming fiscal year at the same level of county appropriation per pupil funding as the district received in the current fiscal year).
- v -
The forecasting model does not include: strategic plan initiatives; funds to address “No Child Left Behind” accountability/achievement goals/requirements; or funds to offset anticipated state/federal budget cuts.
These items are funded from the increase in funding associated with projected growth in student enrollment, if available, and/or from the redirection of existing state/local/federal dollars and/or from additional funding requested from the county commission.
The district has two proprietary (enterprise) funds - the Child Nutrition or School Food Service Fund and the After School Care Enrichment Services (ACES) fund. Budgets for these funds are developed based on historical revenue, expenditure and participation data as well as anticipated legislated salary increases and/or changes in employee benefit rates/amounts and/or inflationary increases for food or supplies and/or student enrollment projections and/or changes in child nutrition meal costs or weekly ACES fees.
Nearly $100 billion in federal stimulus or American Recovery and Reinvestment Act of 2009 (ARRA) funds are dedicated to education. The U.S. Department of Education (USED) distributed ARRA funds to states to save and create jobs while advancing reforms and improvements that will create long-lasting results for K-12 students.
ARRA provides funding to North Carolina schools through existing federal formula and competitive grant programs including Title I, the Individuals with Disabilities Education Act (IDEA), and the McKinney-Vento Homeless Assistance program. Funds must be used consistent with statutory and regulatory requirements per each formula grant with some exceptions.
To receive these funds, states must agree to use the funds to: Improve teacher effectiveness and the equitable distribution of effective teachers in schools and
classrooms. Make progress toward college and career-ready standards and rigorous assessments. Improve student achievement in low-performing schools. Enhance data systems to track student progress.
Monitoring of budgets and funds: There are several avenues available to anyone suspecting fraud, waste or abuse of ARRA funds.
The hotline to report claims to the NC Office of Economic Recovery and Investment (OERI) of waste, mismanagement or any abuse related to use of federal recovery funds is 919.733.1433.
Internal Audit and Advisory Services manages the Department of Public Instruction Fraud Hotline established by the agency as part of its ongoing fraud detection and prevention efforts. Anyone suspecting fraud, waste, or abuse involving the Department's funds or programs should call the Internal Auditor at 919.807.3685 or submit a written complaint to: Internal Audit Hotline
North Carolina Department of Public Instruction 6301 Mail Service Center Raleigh, NC 27699-6301
The US Education Department Office of Inspector General Hotline is a toll free number: 1-800-MIS-USED, or you may complete and submit a complaint form (available at https://wdcrobcolp01.ed.gov/CFAPPS/OIG/englishhotlineform.cfm) to:
Inspector General's Hotline Office of Inspector General U.S. Department of Education 400 Maryland Avenue, SW Washington, DC 20202-1500
- vi -
Budget management includes three separate areas: pre-audit of disbursements and encumbrances amendments to the budget resolution
accounts for transfers of funds from one account to another within guidelines of the respective funding source(s)
tracks increases (new funds added to budget) or decreases (funds removed from budget) budget resolution specifies transfer authority and reporting requirements
meeting applicable reporting requirements (local, state and federal) Some of the tools/mechanisms used to evaluate budgets include:
internal audits external audits program audits analyzing expenditures and revenues analyzing staffing patterns developing multi-year budgets
The district incorporates the following practices in budget development and implementation:
integrating long-term planning with the budget process establishing measures for continuous performance monitoring obtaining citizen and other stakeholder involvement early in the budget process communicating goals, objectives, strategies and desired outcomes promoting a sense of ownership and empowerment to budget managers to implement effective practices
and achieve goals incorporating realistic revenue and expenditure forecasts reviewing budget-to-actual or budget-to-projected actual comparisons of revenues, expenditures, cash flow,
and fund balance periodically during budget development providing monthly summary and detail expenditure reports to budget managers providing quarterly financial reports to the Board of Education and the Board of County Commissioners using the district’s accounts payable, general ledger, payroll and purchasing systems to monitor available
funds before encumbering/spending occurs preparing a comprehensive annual financial report of the district’s operations
MAJOR INITIATIVES, SERVICE EFFORTS AND ACCOMPLISHMENTS
Our vision (what we will become), our mission and thematic goals (how we will get there), and our core values (what we believe) solidify the underlying foundation for all Guilford County Schools’ decisions and actions. Our vision is to become the top performing academic metropolitan school district in America. The mission of the district is that Guilford County students will graduate as responsible citizens prepared to succeed in higher education, or in the career of their choice.
The Board in partnership with parents and community members wants to share these district core values in order to strengthen our schools and improve the quality of life for all of our citizens.
Diversity. We are committed to creating an educational organization where a variety of persons and perspectives are welcome. We are committed to providing an environment where students and staff from all cultures and backgrounds may succeed.
- vii -
Empathy. We are committed to developing a culture where our employees identify with and understand the feelings of our students and parents and their colleagues.
Equality. We are committed to creating a school system where everyone is appreciated and judged based solely on their contributions and performance. Through the work of this institution, we will create awareness of and develop strategies to understand and eradicate prejudice, discrimination and racism on the individual and organizational level.
Innovativeness. We are committed to fostering a work environment where the goal is not to manage innovations, but to become innovative. Problems are identified, ownership of those problems is assumed by the adults in the district, and everyone works together as agents of the solution until the problems are solved. We will not stop until obstacles are removed, solutions found and clear and compelling goals are established.
Integrity. We are committed to creating a school district that acts with honesty and forthrightness, holding ourselves to high academic and ethical standards, and dealing with everyone with respect.
The Guilford County Schools (GCS) Strategic Plan serves as the district’s road map for achieving educational excellence. The plan includes strategies designed to boost student achievement, increase family and community involvement, improve district service, increase the teacher retention rate and improve school safety and discipline. Information captured through the “Mo Wants to Know” campaign and the superintendent’s listening and learning tour—along with the Board of Education’s mission and core values—guided the development of the strategic plan. The plan is divided into eight key areas: improving academic achievement; supportive family and community involvement; strategic human resource management; respectful and responsive service; safe schools and character development; optimal operations; transformational technology; and, clear baseline and equitable standards.
- viii -
ACHIEVING EDUCATIONAL EXCELLENCE GCS Points of Pride:
The number of schools earning the top Honor School of Excellence/School of Excellence rating based on the
state’s ABCs has increased from one in 2007-08 to 13 in 2009-10.
ABCs results showed that 91.4 percent of the district’s schools made expected or high growth in student academic achievement during the 2009-10 school year. This number is up from 75.4 percent in 2008-09.
Eighty-eight of 113 regular schools made positive gains on overall proficiency, and 39 schools exceeded a five-
percentage point gain. The GCS Class of 2010 earned $110 million in scholarships this year. This is almost $32 million more than the Class of
2009 earned last year. In 2009-10, five of the district’s high schools achieved 100 percent graduation rates - Weaver Academy, Penn-Griffin
School for the Arts, The Academy at Smith, Greensboro College Middle College and The Early College at Guilford. Seven other schools had graduation rates higher than 90 percent.
Overall performance on the AP exams rose from 43 percent passing in 2005 to more than 53 percent in 2010. Twelve district high schools made Newsweek’s Top High Schools. The Early College at Guilford was named to the
Elite Schools. GCS’ Alternative Certification Track (ACT) program was the first program in the state to offer lateral entry
candidates an in-house teacher preparation program that leads to licensure. The first Summer Arts Institute and district-wide musical were developed in response to the district’s Strategic Plan,
which calls for enrichment activities that support the academic and social growth of students. The musical, “Willy Wonka,” gathered the talents of hundreds of students, teachers and parent volunteers from across the county, while 240 students participated in week-long classes in visual art, orchestra, dance, theater, band and chorus.
About 290 GCS employee and student volunteers completed the district’s Habitat for Humanity house as part of
GCS’ character development initiative. Service learning, a component of character development, will be a major focus for all students across the district during the 2010-11 school year.
GCS Students Show Intelligence Plus Character:
Southeast High senior Alex Hughes was one of three winners in the “I Am What I Learn” video contest sponsored by
the U.S. Department of Education. His video and two others received the highest number of votes from viewers. Each student will receive a prize of $1,000.
Elizabeth Dzugan, a 2010 graduate of The Early College at Guilford, held the lucky key that unlocked the door to a new
2011 Scion xB at the 2010 Cool to Be Smart event. She was among more than 400 GCS graduates that qualified to win the car and other high-tech prizes. Thanks to Rice Toyota, Dzugan drove home in the new car, with taxes, tags and title included.
Edward Myers was outside near his house when he found a purse with $2,000 inside. Edward was a fifth-grader at Irving Park Elementary when he immediately knew what to do. He showed his mom, and they turned the money in to police. The student’s actions are an example of why character education is a priority for Guilford County Schools.
- ix -
Weaver Academy students supported literacy and helped to expand character education throughout GCS by publishing their own original children’s books. They donated the books to 12 schools during a presentation at Vandalia Elementary. During the past two years, music production and art students have written stories, provided illustrations and recorded sound effects for children’s books that focus on character education.
Nathanael Greene Elementary collected 818 pounds of cans for recycling as part of their involvement with the Guilford
County Environmental Services program, Kids, Cans & Ca$h Recycle Challenge. Nathanael Greene not only collected the most cans in their category, but they also collected more cans than any school that participated.
Students and faculty at the Doris Henderson Newcomers School planted a sustainable garden on the school’s campus.
The “Community in Peace Gardens” is rooted in the belief that gardening supports the wellbeing of the entire school community. While helping with the garden, students learn about life cycles, ecosystems, species diversity, environmental pollution and food economics.
Dickson “Doc” Hendley, a 1997 graduate of Ragsdale High, was one of CNN’s 10 finalists for Hero of the Year. He
was recognized for his efforts to provide clean water to communities worldwide. After learning about the world’s water crisis while travelling during college, Hendley started Wine to Water, a nonprofit organization that provides water to people in developing nations and gives them the means to solve their own water crisis in a sustainable way.
GCS Staff – Teaching Excellence By Example:
Rodney Boone, principal of The Academy at Lincoln, was the GCS nominee for Magnet Principal of the Year, which recognizes outstanding school leaders who succeed in providing innovative programs that promote equity, diversity and academic excellence for students in magnet schools.
Chief Financial Officer, Sharon Ozment, was named a co-winner of the Chief Financial Officer of the Year in the government category of the Business Journal.
Dr. Gongshu Zhang, the district’s Chief Accountability and Research Officer, was recognized by the Council of the Great City Schools with the Houghton Mifflin Harcourt Research and Assessment Leadership Award.
Pearce Elementary teacher Angela Osborne and Archer Elementary teacher Brandy Pinnix Widener each received a
Bright Ideas Grant from Energy United. Together, the two received nearly $4,000. Cynthia Sevier, the director of school nutrition services for GCS, received the annual Friend of Child Nutrition
award from the N.C. Department of Public Instruction.
Nora Carr, the district’s Chief of Staff, received the 2010 NSPRA Presidents Award given by the National School Public Relations Association (NSPRA).
Wanda Smith, a pre-K teacher at Archer Elementary, received a Certificate of Merit from the American Red Cross for actions she took to save a student’s life. The American Red Cross awards the Certificate of Merit as its highest honor to individuals who save a life using skills and knowledge learned in a Red Cross course.
INTERNAL CONTROLS Management of the district is responsible for establishing and maintaining internal controls designed to ensure that the assets of the district are protected from loss, theft, or misuse and to ensure that adequate accounting data are compiled to allow the preparation of financial statements in conformity with generally accepted accounting principles. The internal controls are designed to provide reasonable, but not absolute, assurance that these objectives are met. The concept of reasonable assurance recognizes that: (1) the cost of a control should not exceed the benefits likely to be derived; and (2) the evaluation of costs and benefits requires estimates and judgments by management. We believe the Board’s internal accounting controls adequately safeguard assets and provide reasonable assurance of proper recording of financial transactions.
- x -
As a recipient of federal, state and county financial assistance, the district also is responsible for ensuring that adequate internal controls are in place to ensure compliance with applicable laws and regulations related to those programs. The internal controls are subject to periodic evaluation by management and the external auditor for the district. The program administrators for school accounting monitor the activity funds of the individual schools for compliance with applicable federal, state, and local laws/regulations/policies/procedures. As a part of the district’s single audit, tests are made to determine the adequacy of the internal controls, including that portion related to state and federal financial assistance programs, as well as to determine that the district has complied with applicable laws and regulations. The district’s single audit for the fiscal year ended June 30, 2010 resulted in no instances of material weaknesses in internal controls, material violations of applicable laws and regulations or questioned costs. INDEPENDENT AUDIT North Carolina General Statutes require an annual audit by independent certified public accountants. The financial records and transactions of the Guilford County Board of Education for the year ended June 30, 2010 have been audited by Dixon Hughes PLLC, a firm of independent certified public accountants. Their audit of the basic financial statements and accompanying combining and individual fund statements and schedules was performed in accordance with generally accepted auditing standards and, accordingly, included a review of the Board’s system of budgetary and accounting controls. In addition to meeting the requirements set forth by the statutes, the audit also was designed to meet the single audit requirements. Guilford County Schools received an unqualified opinion on the basic financial statements. The auditors’ report on the basic financial statements and the combining and individual fund statements and schedules are included in the financial section of this Report. FINANCIAL REPORTING The Guilford County Board of Education has prepared the Comprehensive Annual Financial Report in conformance with Governmental Accounting Standards Board (GASB) Statement No. 34, Basic Financial Statements – and Management’s Discussion and Analysis–- for State and Local Governments. GASB Statement 34 is an all encompassing and sweeping change to financial reporting requirements for governments. The timing of GASB Statement 34 implementation depends upon the reporting entity’s total revenues. Public school districts with annual revenues of $100 million or more were subject to the provisions of GASB Statement 34 starting with fiscal years ending June 30, 2002. GASB 34 creates the following financial statements that had not previously been published: Statement of net assets to report all assets and liabilities of the district as a whole; Statement of activities to report all revenues and expenses of the district as a whole, and Budgetary comparison statements to inform readers of changes in the budget during the fiscal year as well as
compare year-end results with the final budget.
Management’s Discussion and Analysis provides an overview of the school district’s financial activities and condition for the fiscal year ended June 30, 2009. The analysis focuses on school district financial performance as a whole. Please read it in conjunction with this transmittal letter and the school district’s financial statements.
AWARDS The Government Finance Officers Association of the United States and Canada (GFOA) awarded a Certificate of Achievement for Excellence in Financial Reporting and the Association of School Business Officials International (ASBO) awarded a Certificate of Excellence in Financial Reporting to the Guilford County Board of Education for its comprehensive annual financial report for the fiscal year ended June 30, 2009. These are prestigious awards recognizing conformance with the highest standards for preparation of state and local government financial reports.
- xi -
These awards are made only to governmental units that publish a comprehensive annual financial report that is easily readable, efficiently organized, and conforms to program standards as well as satisfies generally accepted accounting principles and applicable legal requirements. The awards are valid for a period of one year only. We believe the accompanying Report continues to conform to GFOA and ASBO program requirements; therefore, we will submit it to these respective organizations for consideration of renewed certificate eligibility and award. In addition, the GFOA presented a Distinguished Budget Presentation Award to the Guilford County Board of Education for its annual budget document for the fiscal year beginning July 1, 2009. The Board has received this award for nine consecutive years. In order to receive this award, the district must publish a budget document that meets program criteria as a policy document, as an operations guide, as a financial plan, and as a communications device. ACKNOWLEDGEMENTS The preparation of this Report could not have been accomplished without the efforts and dedication of the Financial Services staff of Guilford County Schools and the independent audit firm. We would like to express our appreciation to all of the employees who contributed in the development of this Report and to the Guilford County government for providing statistical data. Also, we would like to thank members of the Guilford County Board of Education for supporting the financial operation of the school system in a dedicated and responsible manner. Respectfully submitted, Maurice O. Green Sharon S. Ozment Superintendent Chief Financial Officer

xii
THIS PAGE LEFT INTENTIONALLY BLANK.
- xiii -
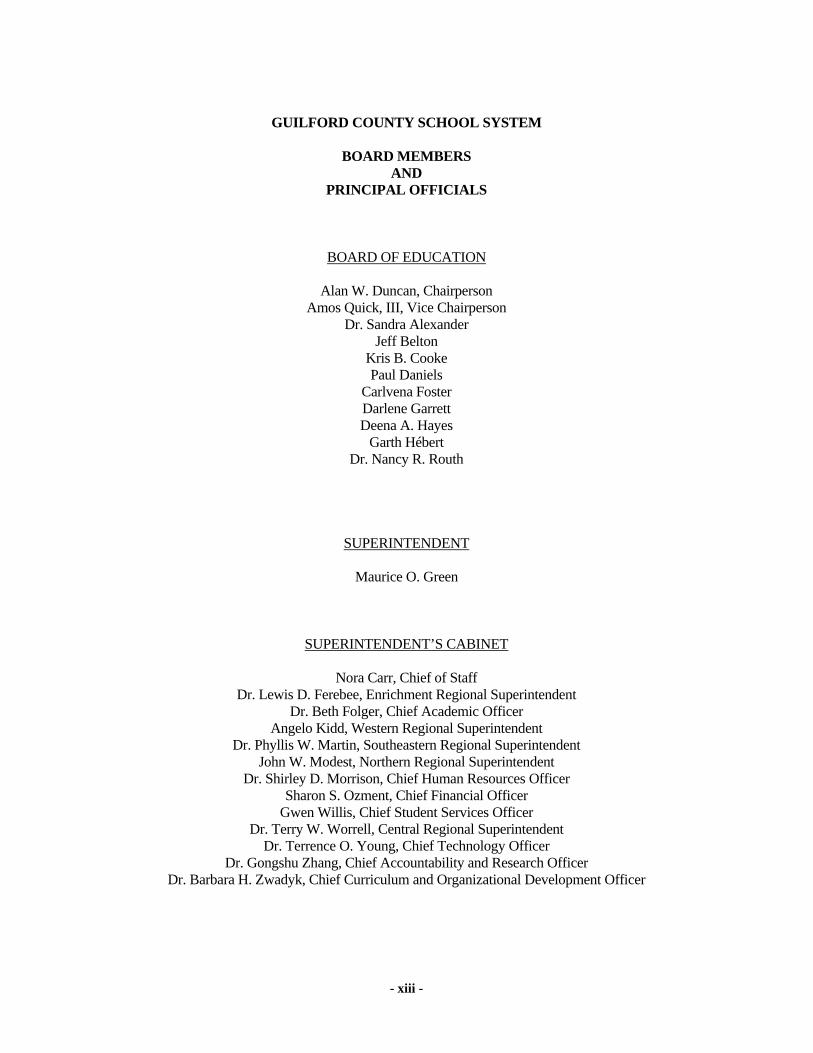
GUILFORD COUNTY SCHOOL SYSTEM
BOARD MEMBERS AND
PRINCIPAL OFFICIALS
BOARD OF EDUCATION
Alan W. Duncan, Chairperson Amos Quick, III, Vice Chairperson
Dr. Sandra Alexander Jeff Belton
Kris B. Cooke Paul Daniels
Carlvena Foster Darlene Garrett Deena A. Hayes
Garth Hébert Dr. Nancy R. Routh
SUPERINTENDENT
Maurice O. Green
SUPERINTENDENT’S CABINET
Nora Carr, Chief of Staff Dr. Lewis D. Ferebee, Enrichment Regional Superintendent
Dr. Beth Folger, Chief Academic Officer Angelo Kidd, Western Regional Superintendent
Dr. Phyllis W. Martin, Southeastern Regional Superintendent John W. Modest, Northern Regional Superintendent
Dr. Shirley D. Morrison, Chief Human Resources Officer Sharon S. Ozment, Chief Financial Officer
Gwen Willis, Chief Student Services Officer Dr. Terry W. Worrell, Central Regional Superintendent
Dr. Terrence O. Young, Chief Technology Officer Dr. Gongshu Zhang, Chief Accountability and Research Officer
Dr. Barbara H. Zwadyk, Chief Curriculum and Organizational Development Officer
- xiv -
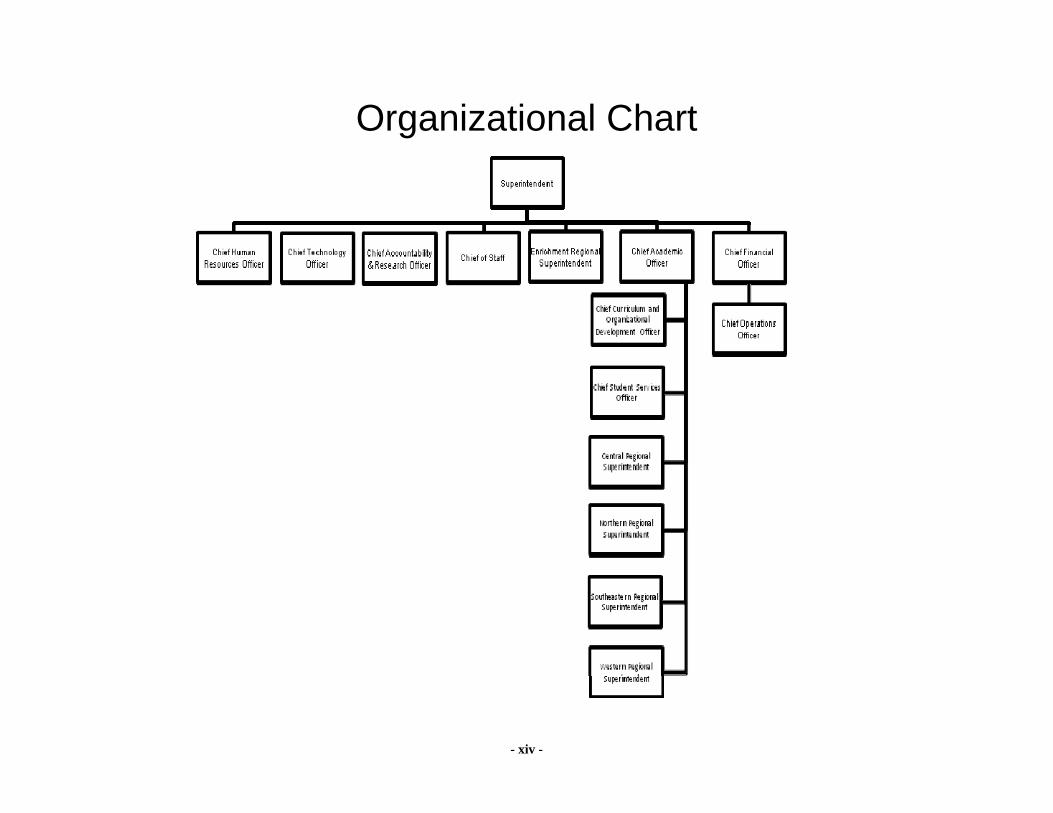
Organizational Chart


FINANCIAL SECTION

THIS PAGE LEFT INTENTIONALLY BLANK.
- 1 -
INDEPENDENT AUDITORS’ REPORT Guilford County Board of Education Greensboro, North Carolina We have audited the accompanying financial statements of the governmental activities, the business-type activities, each major fund, budget to actual comparison for the General and State Public School Funds, and the aggregate remaining fund information of the Guilford County Board of Education, North Carolina, as of and for the year ended June 30, 2010, which collectively comprise the Board’s basic financial statements as listed in the table of contents. These financial statements are the responsibility of the Guilford County Board of Education’s management. Our responsibility is to express opinions on these financial statements based on our audit. We conducted our audit in accordance with auditing standards generally accepted in the United States of America and the standards applicable to financial audits contained in Government Auditing Standards, issued by the Comptroller General of the United States. Those standards require that we plan and perform the audit to obtain reasonable assurance about whether the financial statements are free of material misstatement. An audit includes consideration of internal control over financial reporting as a basis for designing audit procedures that are appropriate in the circumstances, but not for the purpose of expressing an opinion on the effectiveness of the Board’s internal control over financial reporting. Accordingly, we express no such opinion. An audit includes examining, on a test basis, evidence supporting the amounts and disclosures in the financial statements. An audit also includes assessing the accounting principles used and significant estimates made by management, as well as evaluating the overall financial statement presentation. We believe that our audit provides a reasonable basis for our opinions. In our opinion, the financial statements referred to above present fairly, in all material respects, the financial position of the governmental activities, the business-type activities, each major fund, and the aggregate remaining fund information of the Guilford County Board of Education as of June 30, 2010, and the respective changes in financial position and cash flows, where applicable, thereof and the respective budgetary comparison for the General Fund and the State Public School Fund for the year then ended in conformity with accounting principles generally accepted in the United States of America.
- 2 -
In accordance with Government Auditing Standards, we have also issued our report dated December 18, 2010 on our consideration of the Guilford County Board of Education’s internal control over financial reporting and on our tests of its compliance with certain provisions of laws, regulations, contracts, and grant agreements and other matters. The purpose of that report is to describe the scope of our testing of internal control over financial reporting and compliance and the results of that testing, and not to provide an opinion on the internal control over financial reporting or on compliance. Accordingly, we express no such opinion. That report is an integral part of an audit performed in accordance with Government Auditing Standards and should be considered in assessing the results of our audit. Management’s Discussion and Analysis on pages 3 through 15 is not a required part of the basic financial statements but is supplementary information required by accounting principals generally accepted in the United States of America. We have applied certain limited procedures, which consisted principally of inquiries of management regarding the methods of measurement and presentation of the required supplementary information. However, we did not audit the information and express no opinion on it. Our audit was conducted for the purpose of forming an opinion on the financial statements that collectively comprise the basic financial statements of the Guilford County Board of Education. The combining and individual nonmajor fund financial statements and schedules, as well as the accompanying schedule of expenditures of federal and state awards as required by U. S. Office of Management and Budget Circular A-133, Audits of States, Local Governments and Non-Profit Organizations, and the State Single Audit Implementation Act, and other schedules listed in the table of contents are presented for purposes of additional analysis and are not a required part of the basic financial statements. Such information has been subjected to the auditing procedures applied in our audit of the basic financial statements and, in our opinion, is fairly stated in all material respects in relation to the basic financial statements taken as a whole. The introductory and statistical sections listed in the table of contents have not been subjected to the auditing procedures applied in the audit of the basic financial statements and, accordingly, we express no opinion on them.
December 18, 2010
- 3 -
Management’s Discussion and Analysis This section of the Guilford County Board of Education’s (the Board) financial report represents our discussion and analysis of the financial performance of the Board for the year ended June 30, 2010. This information should be read in conjunction with the audited financial statements included in this report. Financial Highlights The district’s average daily membership (ADM) decreased by 258 students (or .4%) from the previous year.
[ADM is calculated by dividing the number of students enrolled each school day (whether in attendance or not) by the number of school days.] In the past decade our student enrollment has increased by more than 8,800 students.
The Board’s total net assets increased 3.3% during the year due primarily because of the increase in capital assets in the governmental activities due to new school construction and/or major renovation projects associated with the district’s Capital Improvement Plan (CIP). The CIP was designed to create permanent classroom seats to accommodate growing student enrollment; to provide technology for the education program; to air-condition schools where air-conditioning was lacking; and to make efficient utilization of all facilities.
Total fund balance in the district’s General Fund increased from $11.7 million at June 30, 2009 to $14.2 million at June 30, 2010. Undesignated fund balance remained at zero as of June 30, 2010. The increase in the total fund balance is due to the Board of Education’s decision to set aside $3 million in the 2009-10 budget to fund a possible state budget cut or spending freeze. Fortunately, it was not necessary to draw on the $3 million in 2009-10 so those dollars are included in the total fund balance of the General Fund at June 30, 2010. The Board did designate those dollars to be included in the 2010-11 budget.
The American Recovery and Reinvestment Act of 2009 (ARRA), signed into law by President Obama on February 17, 2009, provides approximately $100 billion for education. The ARRA expenditures included in this report total approximately $31.8 million. Of that amount, nearly $31.2 million or 98.2%, is comprised of the following three components of ARRA education funding: the State Fiscal Stabilization Fund (SFSF), Title I, Part A of the Elementary and Secondary Education Act (Title I), and Title VI, Part B of the Individuals with Disabilities Education Act (IDEA).
GCS was able to save 964 jobs, or approximately 750-full-time equivalent positions, as a result of having access to ARRA funds in 2009-10: 836-school-based custodians, school treasurers, NC WISE data managers, office support
(guidance/attendance/registrar), etc, jobs were funded with SFSF dollars; 30 positions were funded with ARRA Title I funds; and 98 positions serving children with special needs were funded ARRA Title VI-B funds.
Four principles guide the distribution and use of ARRA funds:
(a) Spend funds quickly to save and create jobs
(b) Improve student achievement through school improvement and reform ARRA funds should be used to close the achievement gap, help students from all backgrounds
achieve high standards, and address four specific areas that are authorized under bipartisan
- 4 -
education legislation – including the Elementary and Secondary Education Act and the America Competes Act of 2007:
1. Making progress toward rigorous college- and career-ready standards and high-quality assessments that are valid and reliable for all students, including English language learners and students with disabilities;
2. Establishing pre-K-to college and career data systems that track progress and foster continuous improvement;
3. Making improvements in teacher effectiveness and in the equitable distribution of qualified teachers for all students, particularly students who are most in need; and
4. Providing intensive support and effective interventions for the lowest-performing schools.
(c) Ensure transparency, reporting and accountability To prevent fraud and abuse, support the most effective uses of ARRA funds, and accurately
measure and track results, recipients must publicly report on how funds are used. Due to the unprecedented scope and importance of this investment, ARRA funds are subject to additional and more rigorous reporting requirements than normally apply to grant recipients.
(d) Invest one-time ARRA funds thoughtfully to minimize the "funding cliff"
ARRA represents a historic infusion of funds that is expected to be temporary. Depending on the program, these funds are available for only two to three years (2008-09 through 2010-11). These funds should be invested in ways that do not result in unsustainable continuing commitments after the funding expires.
The 2009-10 county appropriation to the capital outlay fund was $4 million - $3 million less than was
appropriated in the previous fiscal year. Therefore, on July 23, 2009, the Board of Education approved utilizing $1,169,189 in local red light camera citation proceeds to fund the following 2009-10 capital outlay items: $759,189 for school-based instructional equipment allotments $60,000 for replacement of band uniforms/instruments $50,000 for district-wide equipment/furniture replacement (primarily school-based) $300,000 for the district’s school technology plan
Per NCGS 115C-102.6, each local school district is required to submit an updated technology plan to the North Carolina Department of Public Instruction that is written to support and enhance the following defined priorities: globally competitive students 21st Century professionals healthy and responsible students leadership that will guide innovation 21st Century systems
Subsequently, on August 20, 2009, the county commissioners approved a Board of Education request to
amend/increase the Board’s 2009-10 capital outlay budget by the $1,169,189 in local red light camera citation proceeds. This report reflects the transfer of $1,169,189 to the Capital Outlay Fund from the General Fund.
In 2009-10 Guilford County Schools established a special revenue fund to account for reimbursements,
including fees for actual costs, gifts and grants restricted as to use, trust funds, federal appropriations made
- 5 -
directly to local school administrative units, funds received for prekindergarten programs, and special programs.
On May 6 2008, Guilford County residents also approved an additional $412 million in school bonds. The package contains 27 projects, which include five new schools and 6,571 new student seats. Thirteen schools will receive major renovations and additions. Projects included in the bond are prioritized with 93.5 percent of the request relieving overcrowding, 3.5 percent targeting repairs and renovations and 3 percent improving heating and air conditioning systems district wide. Projects included in the May 2008 $412 million school bonds are:
Jamestown Middle School - Funding for new 1,112 student replacement school on new site (site
has been purchased) Ragsdale High School - Combine existing Jamestown MS with Ragsdale HS and add new gym and
media center Ragsdale Autism Wing - Autism wing at Ragsdale High School for 48 students Special Education Center West - Additional funding to be added to current funding Southeast High School - New classrooms, media center and gymnasium addition Alamance Elementary School - Addition, demolition and renovations to convert to 700 student
elementary school Summerfield Elementary School - New classrooms and media center addition including expansion
of the dining room Southwest High School - New classrooms, media center and gymnasium addition Southeast Area Elementary School - New 700 student school in Southeast area Southeast Area Autism Wing - Autism Wing at Southeast Area Elementary School for 48 students Allen Middle School - New classrooms and auxiliary gym addition Southeast Middle School - New media center, auxiliary gym and dining room expansion. Convert
existing media center to classrooms North Greensboro Area Elementary School - New 700 student school to help relieve Jesse
Wharton and Brightwood areas Grimsley High School - New cafeteria addition, renovate main gym and Jameson Stadium; convert
existing cafeteria to classrooms Airport Area High School - New high school facilities in airport area for 1,200 students Airport Area Autism Wing - Autism wing at Airport Area High School for 48 students Airport Middle School Land - Purchase land for future airport area middle school Northwest Middle School - New auxiliary gym and classrooms addition Allen Jay Middle School - Renovation of existing facility for use as a small middle school Dudley High School - Renovation of existing English building for use as additional classrooms Dudley High School (athletics) - Funding to improve athletic facilities including football stadium Mobile Classrooms - Relocation costs for mobile classrooms at construction projects High Point Central High School - Lighting system/technology upgrades and renovations to main
gym McLeansville Elementary School - Classrooms addition and media center expansion Northwest High School (site & athletics) - Site improvements for traffic control and
improvements to athletic facilities Simeon Stadium - Funding to improve athletic facilities including new lighting Tracks - Systemwide improvements to high school running tracks Tennis Courts - Systemwide improvements and additions to high school tennis courts HVAC - Systemwide improvements to heating and air conditioning systems Page HS (athletics) - Funding to improve athletic facilities
- 6 -
It is important to note that the Board of Education has no tax levying authority; therefore, bond debt is issued and reported by Guilford County while the capital assets and associated depreciation are reported by the Guilford County Board of Education.
Overview of the Financial Section The audited financial statements of the Guilford County Board of Education consist of four components. They are as follows: Independent Auditors’ Report; Management's Discussion and Analysis (required supplementary information); Basic Financial Statements; and Supplemental section that presents combining and budgetary statements for non-major governmental
funds and budgetary statements for major governmental and enterprise funds. The Basic Financial Statements include two types of statements that present different views of the Board’s finances. The first is the government-wide statements. The government-wide statements are presented on the full accrual basis of accounting and include the statement of net assets and the statement of activities. The Statement of Net Assets includes all of the Board’s assets and liabilities. Assets and liabilities are classified in the order of relative liquidity for assets and due date for liabilities. This statement provides a summary of the Board's investment in assets and obligations to creditors. Liquidity and financial flexibility can be evaluated using the information contained in this statement. The Statement of Activities summarizes the Board’s revenues and expenses for the current year. A net (expense) revenue format is used to indicate to what extent each function is self-sufficient. The second set of statements included in the basic financial statements is the fund financial statements, which is presented for the Board’s governmental funds, proprietary funds, and fiduciary funds. These statements present the governmental funds on the modified accrual basis of accounting, measuring the near term inflows and outflows of financial resources and what is available at year end to spend in the next fiscal year. The proprietary and fiduciary funds are presented on the full accrual basis of accounting. The fund financial statements focus on the Board’s most significant funds. Because a different basis of accounting is used in the government wide statements, reconciliation from the governmental fund financial statements to the government-wide statements is required. The government-wide statements provide information about the Board as an economic unit while the fund financial statements provide information on the financial resources of each of the Board’s major funds. Government-Wide Statements The government-wide statements report information about the unit as a whole using accounting methods similar to those used by private-sector companies. The Statement of Net Assets includes all of the Board’s assets and liabilities, except for fiduciary fund assets and liabilities. All of the current year’s revenues and expenses are accounted for in the statement of activities regardless of when cash is received or paid. The two government-wide statements report the Board’s net assets and how they have changed. Net assets – the difference between the board’s assets and liabilities – is one way to measure the unit’s financial health or position. Over time, increases or decreases in the Board’s net assets are an indicator of whether its financial
position is improving or deteriorating. To assess the district’s overall health, factors such as the condition of its school buildings and other
physical assets must also be considered. The unit’s activities are divided into two categories in the government-wide statements:
- 7 -
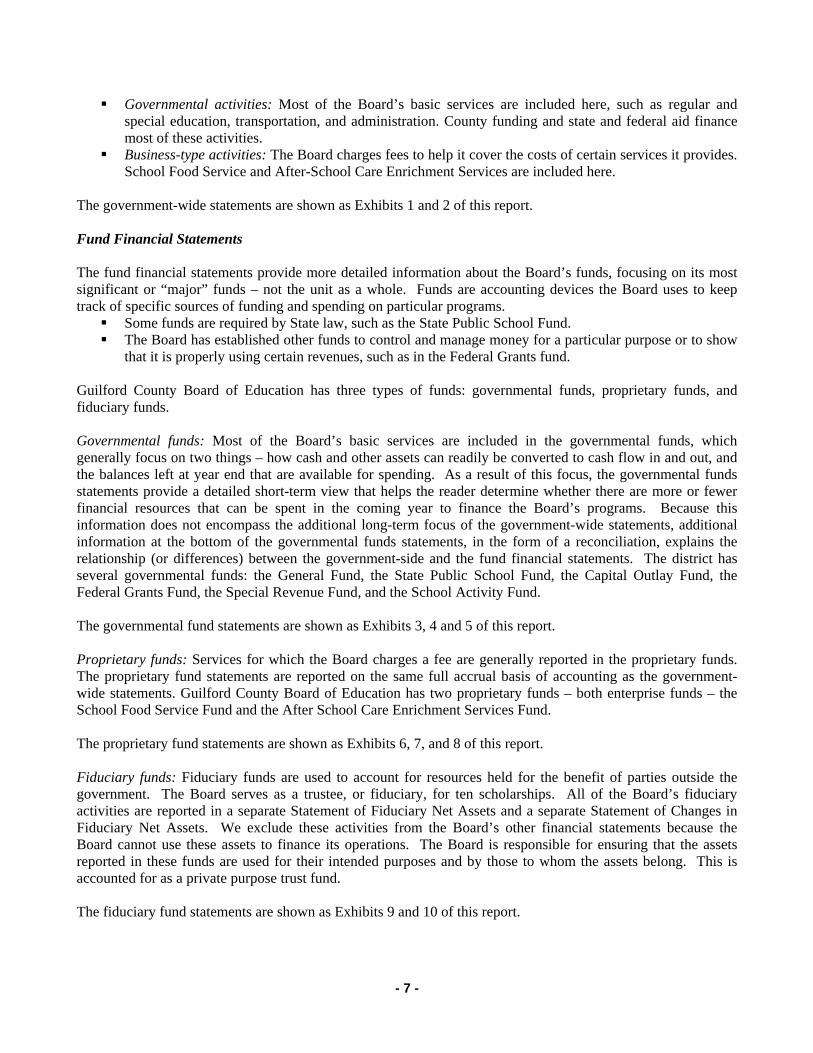
Governmental activities: Most of the Board’s basic services are included here, such as regular and special education, transportation, and administration. County funding and state and federal aid finance most of these activities.
Business-type activities: The Board charges fees to help it cover the costs of certain services it provides. School Food Service and After-School Care Enrichment Services are included here.
The government-wide statements are shown as Exhibits 1 and 2 of this report. Fund Financial Statements The fund financial statements provide more detailed information about the Board’s funds, focusing on its most significant or “major” funds – not the unit as a whole. Funds are accounting devices the Board uses to keep track of specific sources of funding and spending on particular programs. Some funds are required by State law, such as the State Public School Fund. The Board has established other funds to control and manage money for a particular purpose or to show
that it is properly using certain revenues, such as in the Federal Grants fund. Guilford County Board of Education has three types of funds: governmental funds, proprietary funds, and fiduciary funds. Governmental funds: Most of the Board’s basic services are included in the governmental funds, which generally focus on two things – how cash and other assets can readily be converted to cash flow in and out, and the balances left at year end that are available for spending. As a result of this focus, the governmental funds statements provide a detailed short-term view that helps the reader determine whether there are more or fewer financial resources that can be spent in the coming year to finance the Board’s programs. Because this information does not encompass the additional long-term focus of the government-wide statements, additional information at the bottom of the governmental funds statements, in the form of a reconciliation, explains the relationship (or differences) between the government-side and the fund financial statements. The district has several governmental funds: the General Fund, the State Public School Fund, the Capital Outlay Fund, the Federal Grants Fund, the Special Revenue Fund, and the School Activity Fund. The governmental fund statements are shown as Exhibits 3, 4 and 5 of this report. Proprietary funds: Services for which the Board charges a fee are generally reported in the proprietary funds. The proprietary fund statements are reported on the same full accrual basis of accounting as the government-wide statements. Guilford County Board of Education has two proprietary funds – both enterprise funds – the School Food Service Fund and the After School Care Enrichment Services Fund. The proprietary fund statements are shown as Exhibits 6, 7, and 8 of this report. Fiduciary funds: Fiduciary funds are used to account for resources held for the benefit of parties outside the government. The Board serves as a trustee, or fiduciary, for ten scholarships. All of the Board’s fiduciary activities are reported in a separate Statement of Fiduciary Net Assets and a separate Statement of Changes in Fiduciary Net Assets. We exclude these activities from the Board’s other financial statements because the Board cannot use these assets to finance its operations. The Board is responsible for ensuring that the assets reported in these funds are used for their intended purposes and by those to whom the assets belong. This is accounted for as a private purpose trust fund. The fiduciary fund statements are shown as Exhibits 9 and 10 of this report.
- 8 -
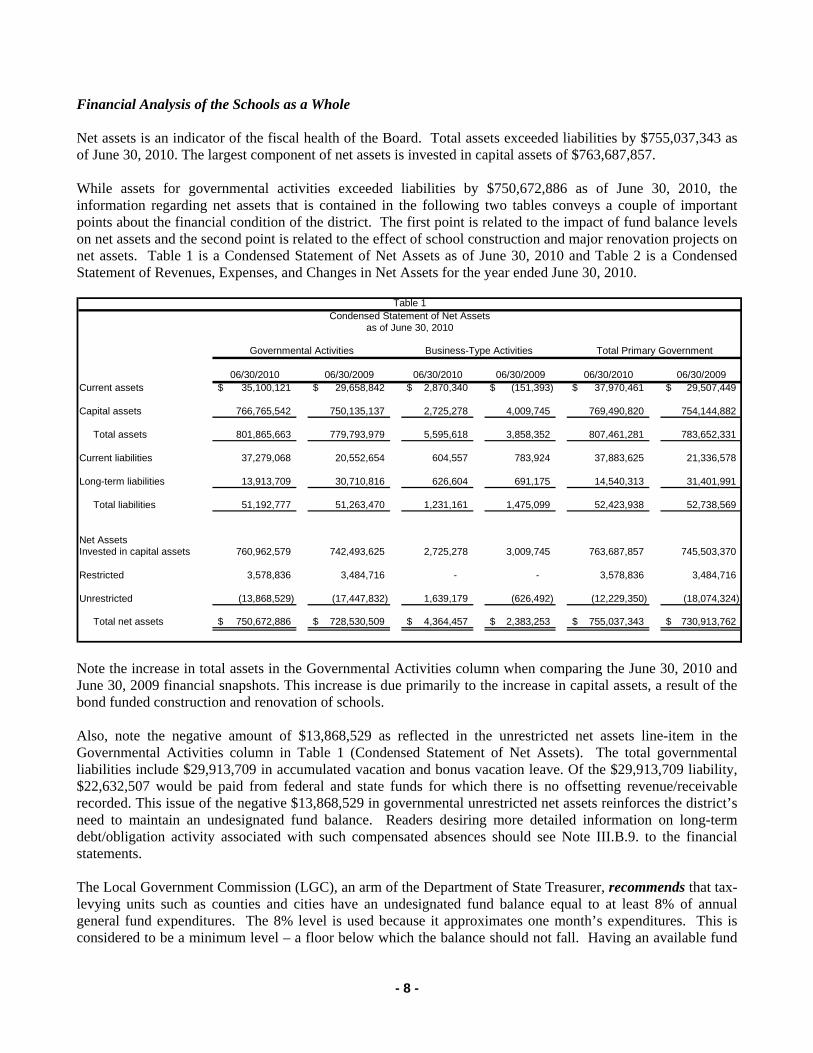
Financial Analysis of the Schools as a Whole Net assets is an indicator of the fiscal health of the Board. Total assets exceeded liabilities by $755,037,343 as of June 30, 2010. The largest component of net assets is invested in capital assets of $763,687,857. While assets for governmental activities exceeded liabilities by $750,672,886 as of June 30, 2010, the information regarding net assets that is contained in the following two tables conveys a couple of important points about the financial condition of the district. The first point is related to the impact of fund balance levels on net assets and the second point is related to the effect of school construction and major renovation projects on net assets. Table 1 is a Condensed Statement of Net Assets as of June 30, 2010 and Table 2 is a Condensed Statement of Revenues, Expenses, and Changes in Net Assets for the year ended June 30, 2010.
06/30/2010 06/30/2009 06/30/2010 06/30/2009 06/30/2010 06/30/2009Current assets 35,100,121$ 29,658,842$ 2,870,340$ (151,393)$ 37,970,461$ 29,507,449$
Capital assets 766,765,542 750,135,137 2,725,278 4,009,745 769,490,820 754,144,882
Total assets 801,865,663 779,793,979 5,595,618 3,858,352 807,461,281 783,652,331
Current liabilities 37,279,068 20,552,654 604,557 783,924 37,883,625 21,336,578
Long-term liabilities 13,913,709 30,710,816 626,604 691,175 14,540,313 31,401,991
Total liabilities 51,192,777 51,263,470 1,231,161 1,475,099 52,423,938 52,738,569
Net AssetsInvested in capital assets 760,962,579 742,493,625 2,725,278 3,009,745 763,687,857 745,503,370
Restricted 3,578,836 3,484,716 - - 3,578,836 3,484,716
Unrestricted (13,868,529) (17,447,832) 1,639,179 (626,492) (12,229,350) (18,074,324)
Total net assets 750,672,886$ 728,530,509$ 4,364,457$ 2,383,253$ 755,037,343$ 730,913,762$
Table 1Condensed Statement of Net Assets
as of June 30, 2010
Total Primary GovernmentBusiness-Type ActivitiesGovernmental Activities
Note the increase in total assets in the Governmental Activities column when comparing the June 30, 2010 and June 30, 2009 financial snapshots. This increase is due primarily to the increase in capital assets, a result of the bond funded construction and renovation of schools. Also, note the negative amount of $13,868,529 as reflected in the unrestricted net assets line-item in the Governmental Activities column in Table 1 (Condensed Statement of Net Assets). The total governmental liabilities include $29,913,709 in accumulated vacation and bonus vacation leave. Of the $29,913,709 liability, $22,632,507 would be paid from federal and state funds for which there is no offsetting revenue/receivable recorded. This issue of the negative $13,868,529 in governmental unrestricted net assets reinforces the district’s need to maintain an undesignated fund balance. Readers desiring more detailed information on long-term debt/obligation activity associated with such compensated absences should see Note III.B.9. to the financial statements. The Local Government Commission (LGC), an arm of the Department of State Treasurer, recommends that tax-levying units such as counties and cities have an undesignated fund balance equal to at least 8% of annual general fund expenditures. The 8% level is used because it approximates one month’s expenditures. This is considered to be a minimum level – a floor below which the balance should not fall. Having an available fund
- 9 -
balance that is less than the recommended minimum for tax-levying units could have an adverse impact on a unit’s credit rating, causing it to pay more in interest when issuing bonds. For units such as school districts which do not levy taxes, the LGC makes no recommendation(s) with respect to undesignated fund balance levels. The Budgeting section of the North Carolina Department of State Treasurer Policies Manual indicates that “the appropriate level of fund balance for non tax levying units is likely to be dependent upon the frequency and amount of funding received from State, federal and other sources”. In an article entitled “Fund Balance in Local Government Budgeting and Finance” authored by Lee Carter and A. John Vogt that appeared in the Winter 1989 edition of Popular Government, Carter and Vogt write that “school systems do not need available operating fund balances as large as those of counties and cities for several reasons. First, school systems receive most of their operating revenues in monthly installments or as needed to match cash disbursements and therefore do not need large balances to cover cash-flow shortfalls. Second, if a school system confronts an unexpected need requiring expenditures in excess of its available balance, it can turn for additional funds to the county, which is responsible for providing them if the need is legitimate. Third, because counties, not school systems, issue bonds for school capital improvement projects, the bond rating agencies do not rate the school systems”. At the time the article was published, Carter was the assistant director of the Fiscal Management Section, State and Local Government Finance Division, North Carolina Department of State Treasurer and Vogt was a faculty member of the Institute of Government at the University of North Carolina at Chapel Hill specializing in budgeting and finance. While we do not dispute the reasoning cited above regarding counties and cities needing sufficient levels of fund balance in order to maintain favorable credit/bond ratings, the fiscal reality in Guilford County is such that the second reason cited above for schools to maintain a lesser amount of fund balance (turning to the county for additional funds) is problematic if not impossible. Previous fiscal policy decisions and financial/economic conditions such as those that existed in recent history and those with which we are currently faced have rendered available county fund balance figures that hover within a percentage point or two of the LGC’s recommended minimums. Per the Letter of Transmittal in the Comprehensive Annual Financial Report of Guilford County, North Carolina for the year ended June 30, 2008, the unreserved, undesignated fund balance of the County’s general fund at fiscal year end stood at only 8.6% of the subsequent year’s budget. Therefore, if circumstances such as war in the middle east and/or soaring fuel/gas prices cause the district to need a substantial amount of additional funding for heating and/or transportation purposes, the minimum undesignated fund balance level of 8% as established by the Guilford County Board of County Commissioners in concert with the LGC guideline would, in all likelihood, prohibit the appropriation of any such additional funds despite the legitimacy of the request. A small fund balance limits the ability of a school system to meet emergency or unforeseen needs; limits investment earnings on available funds thus forcing increased reliance on county tax dollars; and increases the probability of a school system reducing services due to revenue shortfalls such as cuts in state and/or federal funding.
- 10 -
06/30/2010 06/30/2009 06/30/2010 06/30/2009 06/30/2010 06/30/2009Revenues:
Program revenues: Charges for services 4,012,438$ 3,675,473$ 16,244,524$ 17,010,211$ 20,256,962$ 20,685,684$
Operating grants and contributions 427,772,583 442,394,490 22,352,473 22,518,803 450,125,056 464,913,293 Capital grants and contributions - - 176,678 613,970 176,678 613,970
General revenues:Unrestricted county
appropriations 231,236,374 236,217,282 - - 231,236,374 236,217,282 Unrestricted state
appropriations 2,722,642 8,200,810 - - 2,722,642 8,200,810 Investment earnings, net 423,112 753,739 110 7,305 423,222 761,044 Other revenues 9,333,841 4,169,455 - - 9,333,841 4,169,455
Total revenues 675,500,990 695,411,249 38,773,785 40,150,289 714,274,775 735,561,538
Expenses:
Governmental activities: Instructional programs 495,000,385 500,295,334 - - 495,000,385 500,295,334 Supporting services 130,083,201 132,947,980 - - 130,083,201 132,947,980 Ancillary service 248,331 127,852 - - 248,331 127,852 Non-program charges 7,885,127 5,905,810 - - 7,885,127 5,905,810 Depreciation 20,141,569 18,763,312 - - 20,141,569 18,763,312
Business-type activities: Food service - - 30,701,147 33,521,249 30,701,147 33,521,249 Child care - - 6,091,434 6,580,507 6,091,434 6,580,507
Total expenses 653,358,613 658,040,288 36,792,581 40,101,756 690,151,194 698,142,044
Increase in net assets 22,142,377 37,370,961 1,981,204 48,533 24,123,581 37,419,494 Beginning net assets 728,530,509 691,159,548 2,383,253 2,334,720 730,913,762 693,494,268 Ending net assets 750,672,886$ 728,530,509$ 4,364,457$ 2,383,253$ 755,037,343$ 730,913,762$
Table 2Condensed Statement of Revenues, Expenses and Changes in Net Assets
as of June 30, 2010
Total Primary GovernmentBusiness-Type ActivitiesGovernmental Activities
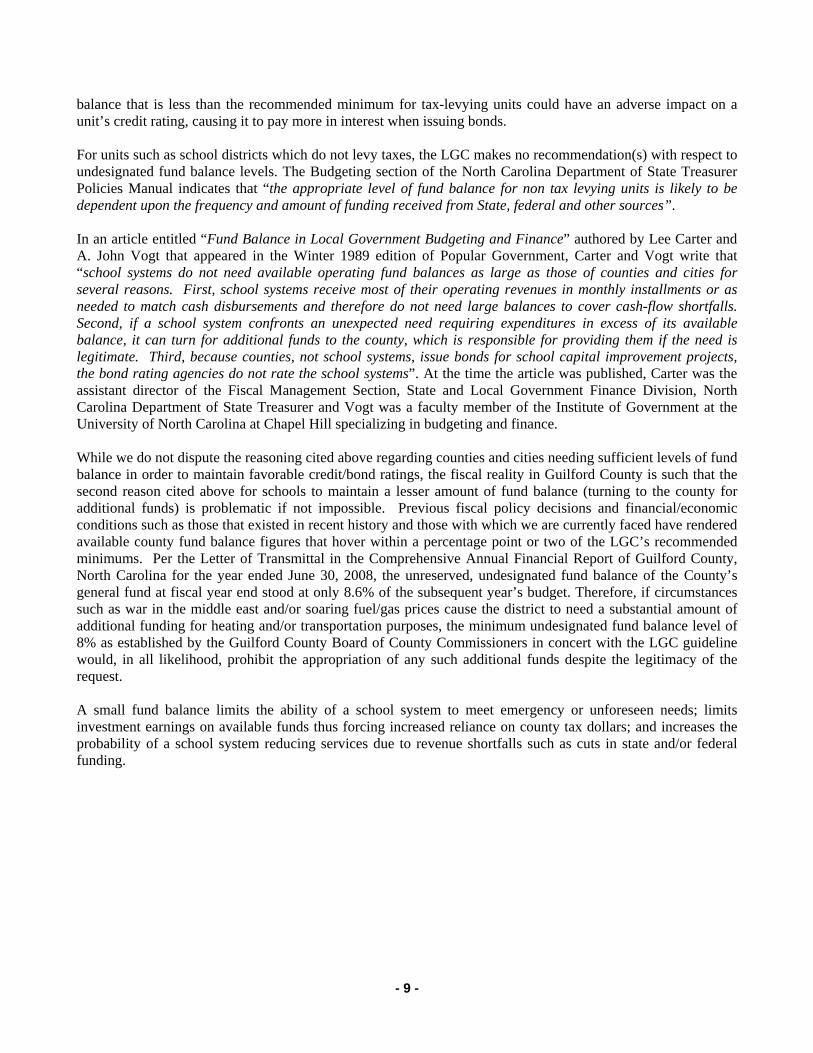
Table 2 (Condensed Statement of Revenues, Expenses, and Changes in Net Assets) reflects an increase in net assets of $22,142,377 for governmental activities (or 3.0%). This increase was due largely to the increase in capital assets in the governmental activities associated with new school construction and major renovation projects. Total net assets in the business-type activities increased by $1,981,204 in 2009-10. Also note that the Board carries capital assets for which Guilford County carries the offsetting debt. Total governmental activities generated revenues of $675.5 million while expenses in this category totaled $653.4 million for the year ended June 30, 2010. Comparatively, revenues were $695.4 million and expenses totaled $658 million for the year ended June 30, 2009. The increase in net assets for total governmental activities stands at $22.1 million at June 30, 2010, compared to $37.4 million in 2009. Instructional expenses comprised 75.8% of total governmental-type expenses while support services made up 19.9% of those expenses for 2010. County funding comprised 34.2% of total governmental revenue while unrestricted State funding added another .4% for 2010. In 2009, county funding was 33.97% and unrestricted State funding added 1.18%. Much of the remaining 65.4% of total governmental revenue for 2010 consists of restricted State and federal money. This revenue represented 64.85% of total revenue in 2009. The increase in net assets for business-type activities stands at approximately $2.0 million at June 30, 2010, compared to a slight increase in net assets of $48,533 in 2009 (see the Financial Analysis of the District’s Funds below for an explanation of the factors/conditions prompting this change).
- 11 -
Financial Analysis of the District’s Funds Governmental Funds: The focus of the Board’s governmental funds is to provide information on near-term inflows, outflows, and balances of usable resources. Such information is useful in assessing the Board’s financing requirements. The Board’s governmental funds (general, state, federal, capital outlay and individual school funds) reported a combined fund balance of $22.7 million, an increase of approximately $4.7 million from last year. This increase was created primarily by a $2.5 million increase in the fund balance of the General Fund along with a $2.0 million increase in the fund balance of the Capital Outlay Fund. The increase in the General Fund fund balance is due to the Board of Education’s decision to set aside $3 million in the 2009-10 budget to fund a possible state budget cut or spending freeze. Fortunately, it was not necessary to draw on the $3 million in 2009-10 so those dollars are included in the total fund balance of the General Fund at June 30, 2010. The increase in the Capital Outlay Fund fund balance is due to unspent dollars from the county appropriation and transfer from the general fund. Of the $2 million carryover, more than $715,000 was encumbered at June 30, 2010 and the remaining amount will be spent in FY2011. Proprietary Funds: As mentioned previously, the Board has two proprietary funds – both enterprise funds – the School Food Service Fund and the After School Care Enrichment Services Fund. The activity in these two funds is categorized as business-type activity because the district charges fees to help it cover the costs of services provided.
For the year ended June 30, 2010, revenues exceeded expenses in the School Food Service Fund by $1.8 million. The primary reason for this increase was Board approval of the following recommendations from staff in order for the 2009-10 School Food Service Fund operation to generate sufficient revenues to cover expenses including the assessment of indirect cost:
reduce menu/food choices (i.e., offer two versus four entrees, use 25% less whole grain products); reduce amount of processing supplies purchased (i.e., reduce use of cups for serving individual
portions); reduce or eliminate breaks in serving time schedules where appropriate/possible; reduce number of serving lines where appropriate/possible (determine number of lines based on
participation); defer computer equipment replacement at elementary schools; limit other computer equipment replacement to that deemed mission critical/emergency; allow replacement only of small wares (i.e., serving utensils, food thermometers, pans); purchase uniforms for new employees only (i.e., postpone purchasing additional set of uniforms for
existing employees); and increase lunch prices by fifty cents at elementary (increase from $1.80 to $2.30) and by thirty cents at
middle and high school (increase from $2.10 to $2.40 at middle school and from $2.20 to $2.50 at high school).
The After School Care Enrichment Services (ACES) was provided to an average enrollment of 4,250 students at 64 elementary school sites in the district during the 2008-09 academic year. However, due to the local economic downturn and rising unemployment in Guilford County ACES enrollment decreased to an average of 3,500 students in 2009-10. The 2009-10 weekly program fee was $45 and all ACES programs were licensed by the North Carolina Division of Child Development and each was eligible to accept Department of Social Services child care vouchers. For the year ended June 30, 2010, revenues exceeded expenses in the After School Care Enrichment Services Fund by $222,391. This increase was in part due to the Board’s approval of the following recommendations
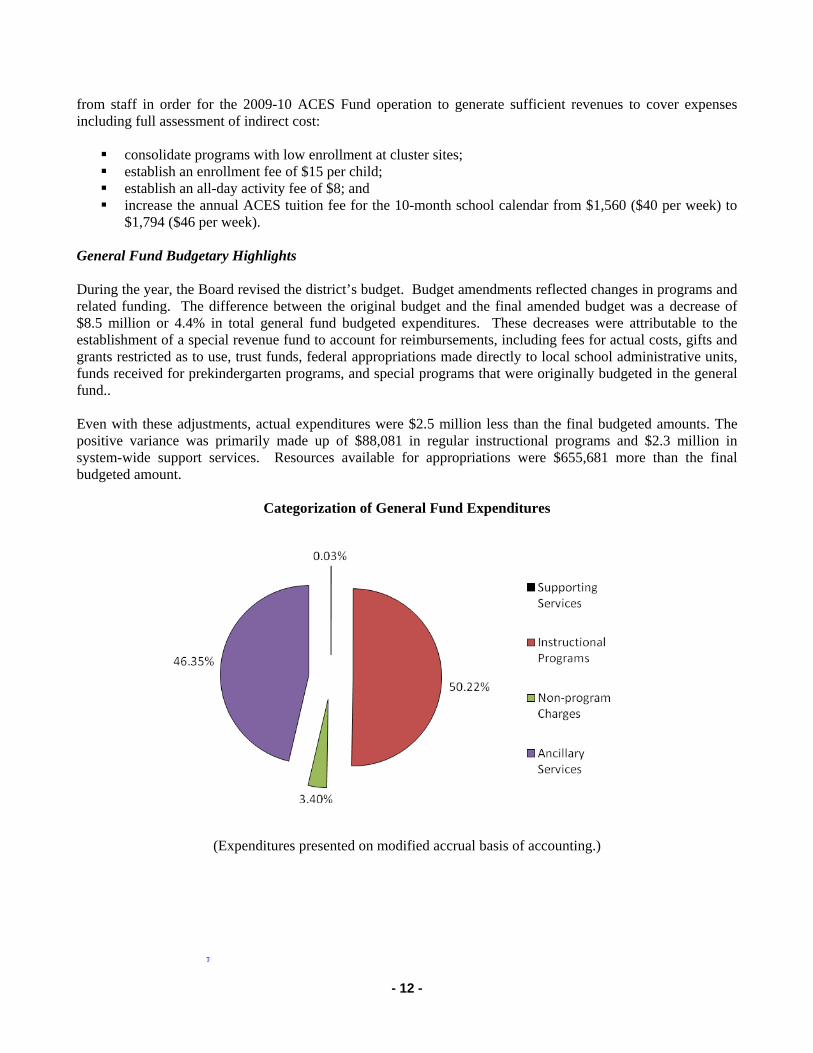
- 12 -
from staff in order for the 2009-10 ACES Fund operation to generate sufficient revenues to cover expenses including full assessment of indirect cost: consolidate programs with low enrollment at cluster sites; establish an enrollment fee of $15 per child; establish an all-day activity fee of $8; and increase the annual ACES tuition fee for the 10-month school calendar from $1,560 ($40 per week) to
$1,794 ($46 per week). General Fund Budgetary Highlights During the year, the Board revised the district’s budget. Budget amendments reflected changes in programs and related funding. The difference between the original budget and the final amended budget was a decrease of $8.5 million or 4.4% in total general fund budgeted expenditures. These decreases were attributable to the establishment of a special revenue fund to account for reimbursements, including fees for actual costs, gifts and grants restricted as to use, trust funds, federal appropriations made directly to local school administrative units, funds received for prekindergarten programs, and special programs that were originally budgeted in the general fund.. Even with these adjustments, actual expenditures were $2.5 million less than the final budgeted amounts. The positive variance was primarily made up of $88,081 in regular instructional programs and $2.3 million in system-wide support services. Resources available for appropriations were $655,681 more than the final budgeted amount.
Categorization of General Fund Expenditures
(Expenditures presented on modified accrual basis of accounting.)
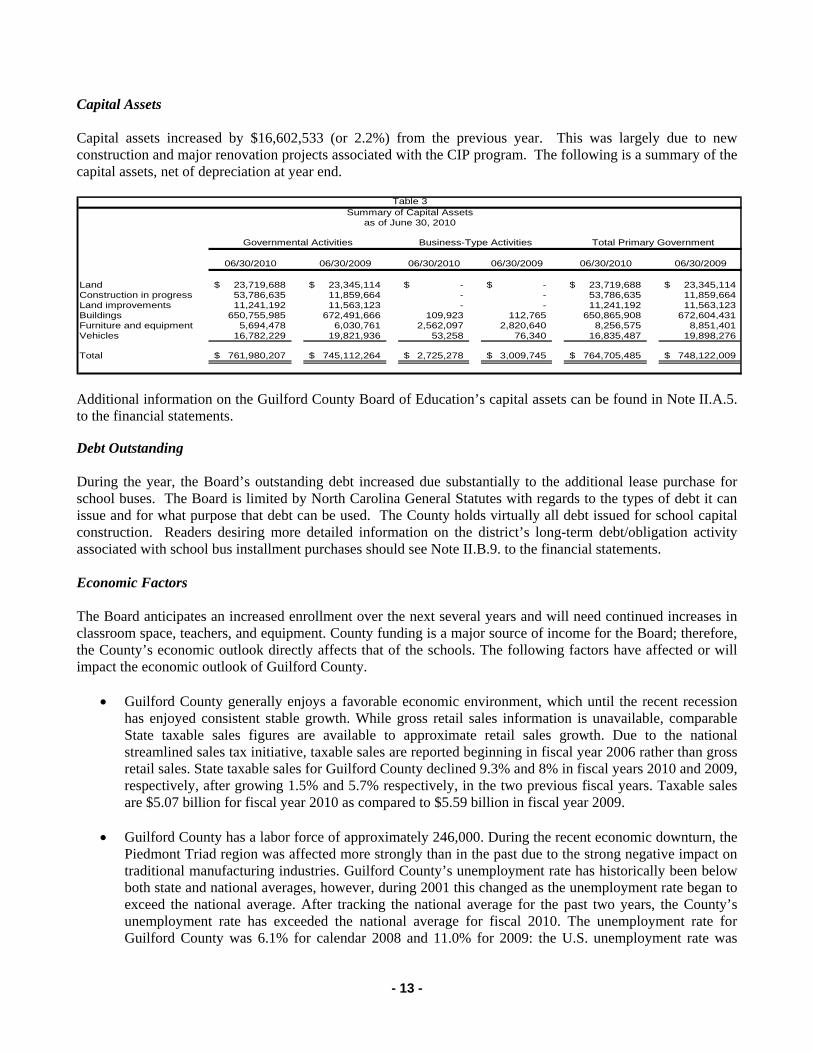
- 13 -
Capital Assets Capital assets increased by $16,602,533 (or 2.2%) from the previous year. This was largely due to new construction and major renovation projects associated with the CIP program. The following is a summary of the capital assets, net of depreciation at year end.
06/30/2010 06/30/2009 06/30/2010 06/30/2009 06/30/2010 06/30/2009
Land 23,719,688$ 23,345,114$ -$ -$ 23,719,688$ 23,345,114$ Construction in progress 53,786,635 11,859,664 - - 53,786,635 11,859,664 Land improvements 11,241,192 11,563,123 - - 11,241,192 11,563,123 Buildings 650,755,985 672,491,666 109,923 112,765 650,865,908 672,604,431 Furniture and equipment 5,694,478 6,030,761 2,562,097 2,820,640 8,256,575 8,851,401 Vehicles 16,782,229 19,821,936 53,258 76,340 16,835,487 19,898,276
Total 761,980,207$ 745,112,264$ 2,725,278$ 3,009,745$ 764,705,485$ 748,122,009$
Table 3Summary of Capital Assets
as of June 30, 2010
Total Primary GovernmentBusiness-Type ActivitiesGovernmental Activities
Additional information on the Guilford County Board of Education’s capital assets can be found in Note II.A.5. to the financial statements. Debt Outstanding During the year, the Board’s outstanding debt increased due substantially to the additional lease purchase for school buses. The Board is limited by North Carolina General Statutes with regards to the types of debt it can issue and for what purpose that debt can be used. The County holds virtually all debt issued for school capital construction. Readers desiring more detailed information on the district’s long-term debt/obligation activity associated with school bus installment purchases should see Note II.B.9. to the financial statements. Economic Factors The Board anticipates an increased enrollment over the next several years and will need continued increases in classroom space, teachers, and equipment. County funding is a major source of income for the Board; therefore, the County’s economic outlook directly affects that of the schools. The following factors have affected or will impact the economic outlook of Guilford County.
Guilford County generally enjoys a favorable economic environment, which until the recent recession has enjoyed consistent stable growth. While gross retail sales information is unavailable, comparable State taxable sales figures are available to approximate retail sales growth. Due to the national streamlined sales tax initiative, taxable sales are reported beginning in fiscal year 2006 rather than gross retail sales. State taxable sales for Guilford County declined 9.3% and 8% in fiscal years 2010 and 2009, respectively, after growing 1.5% and 5.7% respectively, in the two previous fiscal years. Taxable sales are $5.07 billion for fiscal year 2010 as compared to $5.59 billion in fiscal year 2009.
Guilford County has a labor force of approximately 246,000. During the recent economic downturn, the
Piedmont Triad region was affected more strongly than in the past due to the strong negative impact on traditional manufacturing industries. Guilford County’s unemployment rate has historically been below both state and national averages, however, during 2001 this changed as the unemployment rate began to exceed the national average. After tracking the national average for the past two years, the County’s unemployment rate has exceeded the national average for fiscal 2010. The unemployment rate for Guilford County was 6.1% for calendar 2008 and 11.0% for 2009: the U.S. unemployment rate was
- 14 -
5.8% for 2008 and 9.3% for 2009. Guilford County’s unemployment rate of 11.1% for the first six months of 2010 is above the U.S. and North Carolina rates of 9.9% and 10.8%, respectively. Announcements of layoffs in excess of one hundred employees per event by large retail, financial and manufacturing concerns have contributed to the increasing unemployment rate.
Guilford County’s economy has continued to change and diversify. In December 2009, manufacturing
accounted for 13.5% of the County’s 227,824 jobs compared to 28.6% of the County’s 214,346 jobs in 1980. Manufacturing jobs have declined significantly in furniture and textiles but have shown growth in computer and electronic products, electrical equipment and transportation equipment. Major employers with headquarters or divisions within Guilford County include semiconductor, communications, chemical, bus, truck, pharmaceutical, insurance, aircraft maintenance, healthcare, real estate development, and distribution services.
The County is home to two state universities, five private colleges, a private school of law, and a
community college with a total enrollment exceeding 50,000 students.
FedEx completed construction at Piedmont Triad International Airport (PTIA) of its fifth national hub, FedEx Mid-Atlantic Hub. Initial expenditures by FedEx and the Piedmont Triad Airport Authority are expected to total $300 million. The first phase of the hub became operational in June 2009. Full regional hub operations are slated to begin in the future. FedEx has 200 workers in Phase I, with a planned expansion to a total of 1,500 workers in Phase II. A 9,000-foot runway was constructed at PTIA to accommodate the FedEx hub. The $150 million runway was dedicated in June 2010.
FedEx Ground continues construction of its $100 million distribution hub on its 125 acre, $13.3 million site in Triad Business Park. The 400,000 square-foot ground shipping hub will initially bring about 270 new jobs to the Triad. Ultimately, the operation could employ as many as 1,400 workers and contract drivers. Construction began in spring 2009, with a 2011 projected opening date.
Honda Aircraft Company, Inc. announced in February 2007 that it planned to locate its world
headquarters and production facility at PTIA. The company currently occupies an administrative building and its World Research and Development Center at PTIA and began construction of its 250,000 square-foot production hangar in late summer 2009 with expected completion in early 2011. The delivery of the first HondaJet (priced at $4.5 million) is projected to be in the 3rd quarter of 2012.
The revitalization of downtown Greensboro (Downtown) continues to thrive. In 2009-2010, Downtown
gained a net of 14 new storefront businesses with a total financial investment of $20.9 million. Downtown had 107 building renovation and construction projects generating $8 million, with 52 properties purchased generating investment of $12.9 million. The redevelopment of a vacant 17-story office tower including over 100 condominium units, one floor of office space, retail shops and a restaurant opened for occupancy in the spring of 2009. A restaurant and bank opened on the first floor in August and December 2009, respectively.
Mack Trucks, Inc., one of North America’s largest producers of heavy-duty trucks, celebrated the grand
opening of its new world headquarters in Greensboro in September 2009, bringing or creating 493 jobs and investing an expected $17.7 million over the next three years.
Ameritox, Ltd., specializing in pain prescription monitoring, opened its new laboratory and material
analysis facility in a 70,000 square-foot facility in Greensboro in June 2010. At full capacity, the company will employ 228 people.
- 15 -
Precor Incorporated, an exercise equipment manufacturer, celebrated a grand opening of its 230,000 square foot, $26.2 million facility in Rock Creek Center in March 2010. Precor plans to hire 142 new employees at an average salary in excess of $38,000 by 2011. Approximately 90 full-time employees have been hired as of September 2010. The County’s Board of Commissioners approved $294,000 in incentives for Precor in November 2008.
American Express confirmed in May 2010 that it will invest up to $600 million in construction of a data
center on two sites near Interstate 40 at Rock Creek Dairy Road.
Timco Aviation Services officials announced in August 2010 that the company has hired more than 200 employees since the beginning of 2010 to support its many contracts, and will need another 80 employees by the end of the year.
High Point has continued to experience growth in its downtown as well as in outlying areas with $29.4
million of commercial additions or expansions, while creating or announcing 1,405 jobs in 2009. High Point University completed projects totaling $110 million and created 176 new jobs in 2009.
Harland Clarke Corporation opened its 135,000 square-foot order fulfillment facility on Premier Drive
in High Point in May 2009. The company initially moved 200 employees from within the County; by August 2009, it had transferred 80 employees from facilities outside the County and by November 2009 it had hired an additional 70 new employees, resulting in 350 jobs at its High Point location.
Three interrelated companies, Trans Tech Pharma, PharmaCore, and the Mendenhall Clinical
Research Center opened new facilities in 2009 on their campus in High Point. The new facilities are a part of an ongoing project announced in 2007, which will create 205 new jobs over five years.
Requests for Information This report is intended to provide a summary of the financial condition of Guilford County Board of Education. Questions or requests for additional information should be addressed to:
Sharon S. Ozment, Chief Financial Officer or
Angela C. Henry, Assistant Financial Officer Guilford County Board of Education
712 North Eugene Street P. O. Box 880
Greensboro, NC 27402-0880

- 16 -
THIS PAGE LEFT INTENTIONALLY BLANK.
- 17 -
BASIC FINANCIAL STATEMENTS

- 18 -
THIS PAGE LEFT INTENTIONALLY BLANK.
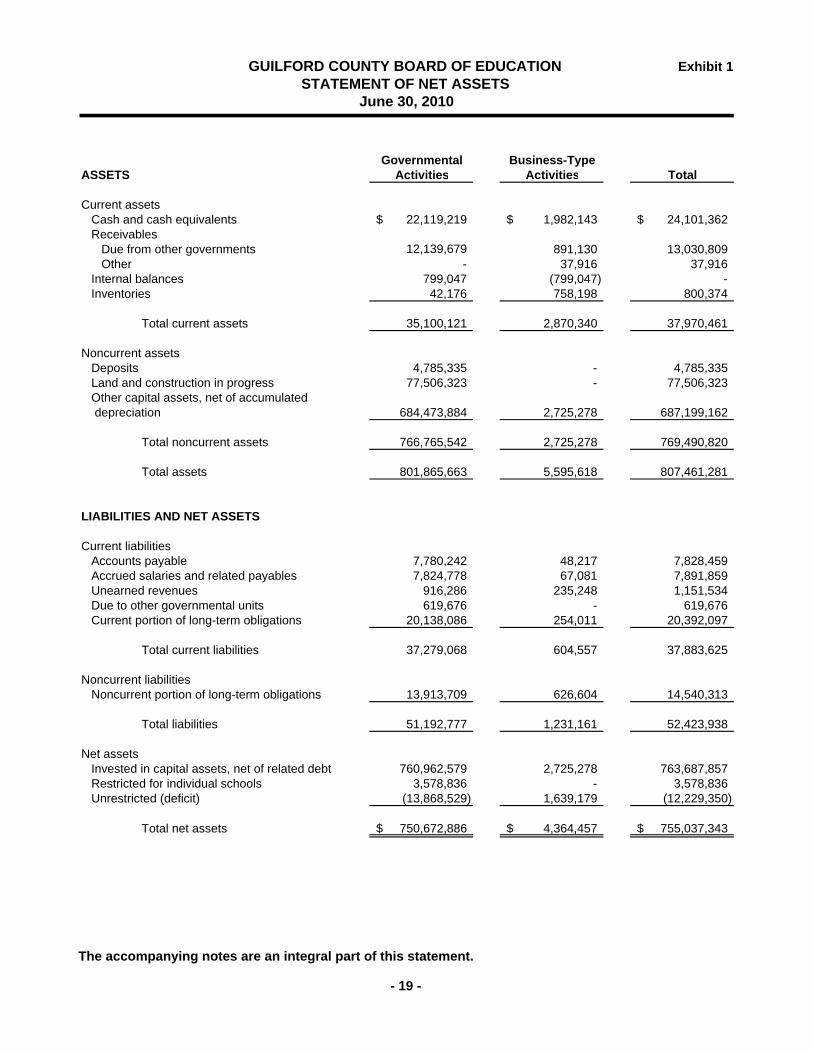
Exhibit 1
Governmental Business-TypeASSETS Activities Activities Total
Current assetsCash and cash equivalents 22,119,219$ 1,982,143$ 24,101,362$ Receivables
Due from other governments 12,139,679 891,130 13,030,809 Other - 37,916 37,916
Internal balances 799,047 (799,047) - Inventories 42,176 758,198 800,374
Total current assets 35,100,121 2,870,340 37,970,461
Noncurrent assetsDeposits 4,785,335 - 4,785,335 Land and construction in progress 77,506,323 - 77,506,323 Other capital assets, net of accumulated depreciation 684,473,884 2,725,278 687,199,162
Total noncurrent assets 766,765,542 2,725,278 769,490,820
Total assets 801,865,663 5,595,618 807,461,281
LIABILITIES AND NET ASSETS
Current liabilitiesAccounts payable 7,780,242 48,217 7,828,459 Accrued salaries and related payables 7,824,778 67,081 7,891,859 Unearned revenues 916,286 235,248 1,151,534 Due to other governmental units 619,676 - 619,676 Current portion of long-term obligations 20,138,086 254,011 20,392,097
Total current liabilities 37,279,068 604,557 37,883,625
Noncurrent liabilitiesNoncurrent portion of long-term obligations 13,913,709 626,604 14,540,313
Total liabilities 51,192,777 1,231,161 52,423,938
Net assetsInvested in capital assets, net of related debt 760,962,579 2,725,278 763,687,857 Restricted for individual schools 3,578,836 - 3,578,836 Unrestricted (deficit) (13,868,529) 1,639,179 (12,229,350)
Total net assets 750,672,886$ 4,364,457$ 755,037,343$
GUILFORD COUNTY BOARD OF EDUCATION STATEMENT OF NET ASSETS
June 30, 2010
The accompanying notes are an integral part of this statement.
- 19 -
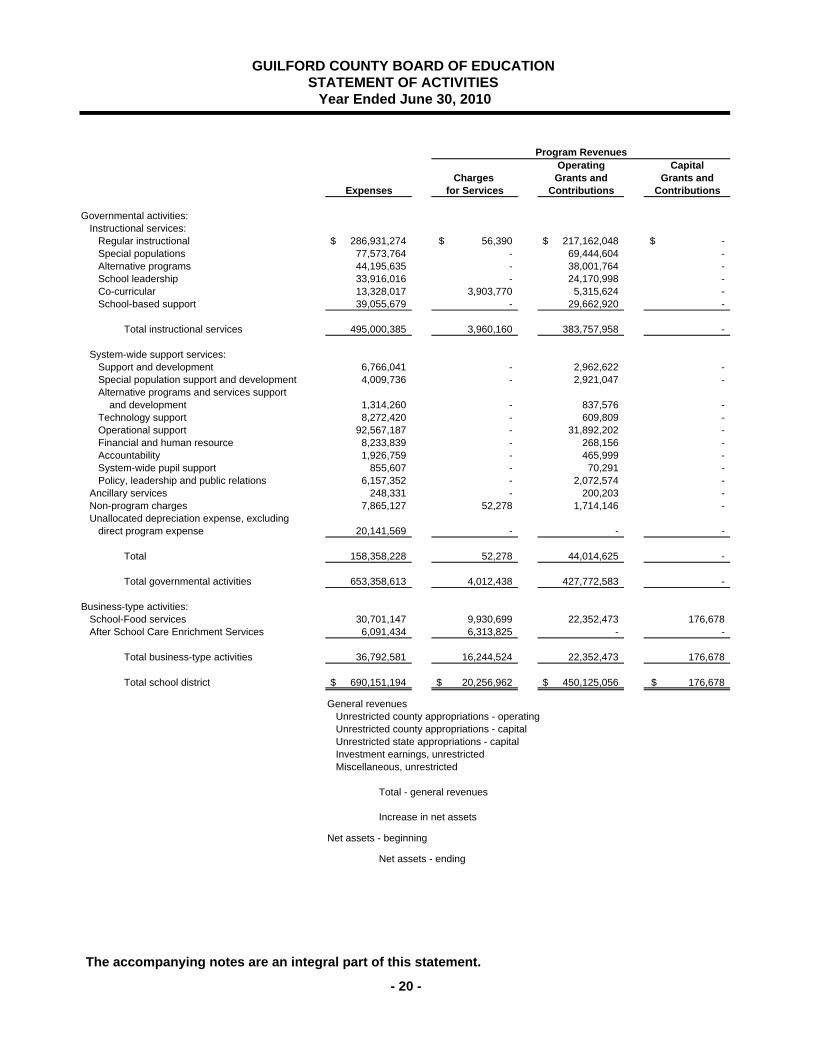
Operating CapitalCharges Grants and Grants and
Expenses for Services Contributions Contributions
Governmental activities:Instructional services:
Regular instructional 286,931,274$ 56,390$ 217,162,048$ -$ Special populations 77,573,764 - 69,444,604 - Alternative programs 44,195,635 - 38,001,764 - School leadership 33,916,016 - 24,170,998 - Co-curricular 13,328,017 3,903,770 5,315,624 - School-based support 39,055,679 - 29,662,920 -
Total instructional services 495,000,385 3,960,160 383,757,958 -
System-wide support services:Support and development 6,766,041 - 2,962,622 - Special population support and development 4,009,736 - 2,921,047 - Alternative programs and services support and development 1,314,260 - 837,576 - Technology support 8,272,420 - 609,809 - Operational support 92,567,187 - 31,892,202 - Financial and human resource 8,233,839 - 268,156 - Accountability 1,926,759 - 465,999 - System-wide pupil support 855,607 - 70,291 - Policy, leadership and public relations 6,157,352 - 2,072,574 -
Ancillary services 248,331 - 200,203 - Non-program charges 7,865,127 52,278 1,714,146 - Unallocated depreciation expense, excluding
direct program expense 20,141,569 - - -
Total 158,358,228 52,278 44,014,625 -
Total governmental activities 653,358,613 4,012,438 427,772,583 -
Business-type activities:School-Food services 30,701,147 9,930,699 22,352,473 176,678 After School Care Enrichment Services 6,091,434 6,313,825 - -
Total business-type activities 36,792,581 16,244,524 22,352,473 176,678
Total school district 690,151,194$ 20,256,962$ 450,125,056$ 176,678$
General revenuesUnrestricted county appropriations - operatingUnrestricted county appropriations - capitalUnrestricted state appropriations - capitalInvestment earnings, unrestrictedMiscellaneous, unrestricted
Total - general revenues
Increase in net assets
Net assets - beginning
Net assets - ending
Program Revenues
GUILFORD COUNTY BOARD OF EDUCATION STATEMENT OF ACTIVITIES
Year Ended June 30, 2010
The accompanying notes are an integral part of this statement.
- 20 -
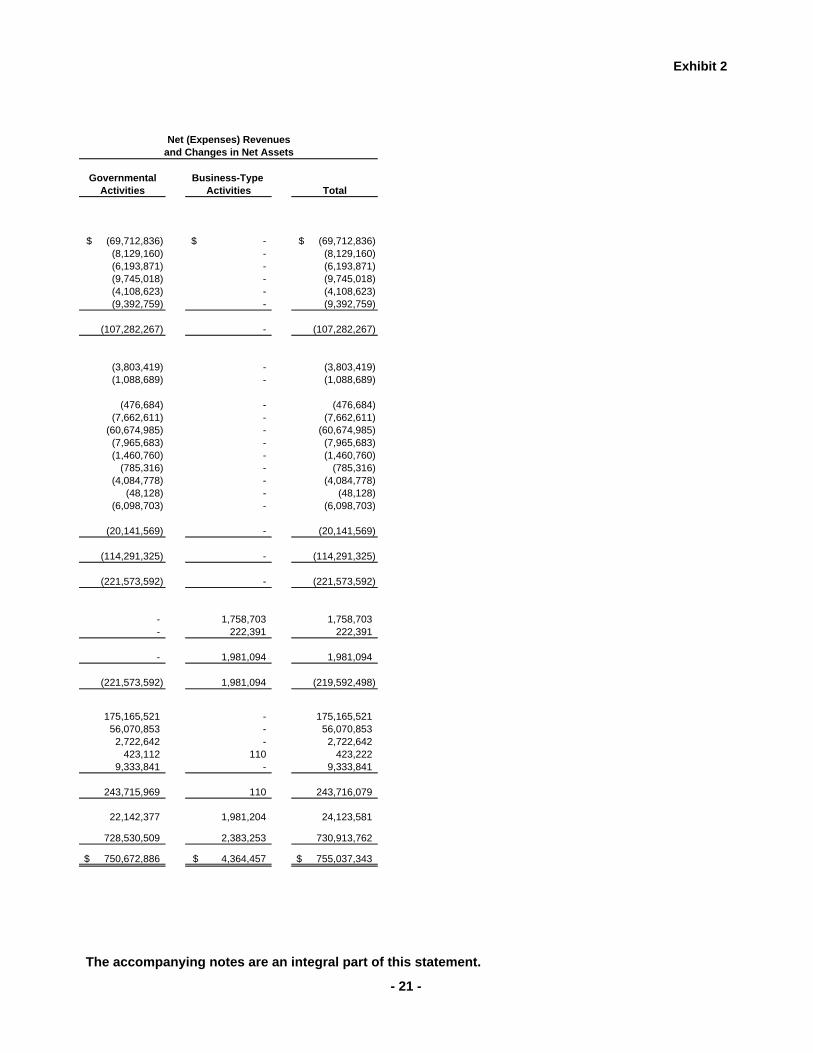
Exhibit 2
Governmental Business-Type Activities Activities Total
(69,712,836)$ -$ (69,712,836)$ (8,129,160) - (8,129,160) (6,193,871) - (6,193,871) (9,745,018) - (9,745,018) (4,108,623) - (4,108,623) (9,392,759) - (9,392,759)
(107,282,267) - (107,282,267)
(3,803,419) - (3,803,419) (1,088,689) - (1,088,689)
(476,684) - (476,684) (7,662,611) - (7,662,611)
(60,674,985) - (60,674,985) (7,965,683) - (7,965,683) (1,460,760) - (1,460,760)
(785,316) - (785,316) (4,084,778) - (4,084,778)
(48,128) - (48,128) (6,098,703) - (6,098,703)
(20,141,569) - (20,141,569)
(114,291,325) - (114,291,325)
(221,573,592) - (221,573,592)
- 1,758,703 1,758,703 - 222,391 222,391
- 1,981,094 1,981,094
(221,573,592) 1,981,094 (219,592,498)
175,165,521 - 175,165,521 56,070,853 - 56,070,853 2,722,642 - 2,722,642
423,112 110 423,222 9,333,841 - 9,333,841
243,715,969 110 243,716,079
22,142,377 1,981,204 24,123,581
728,530,509 2,383,253 730,913,762
750,672,886$ 4,364,457$ 755,037,343$
and Changes in Net AssetsNet (Expenses) Revenues
The accompanying notes are an integral part of this statement.
- 21 -
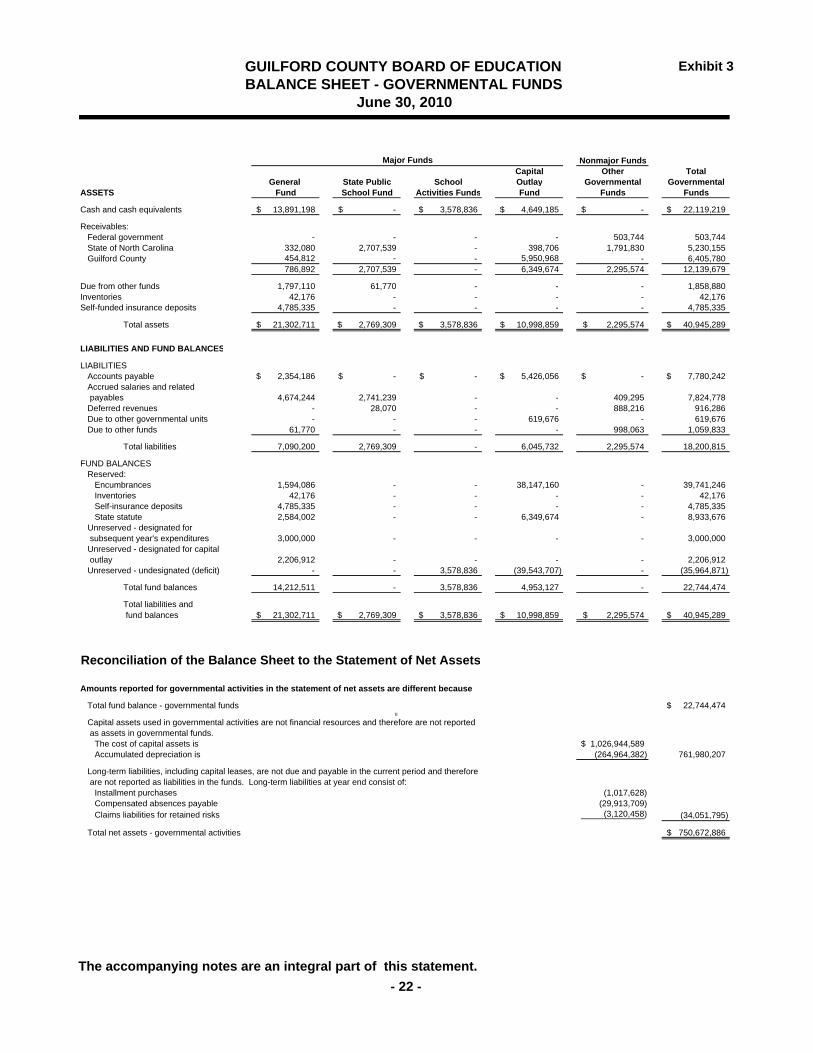
Exhibit 3
Nonmajor FundsCapital Other Total
General State Public School Outlay Governmental GovernmentalASSETS Fund School Fund Activities Funds Fund Funds Funds
Cash and cash equivalents 13,891,198$ -$ 3,578,836$ 4,649,185$ -$ 22,119,219$
Receivables:Federal government - - - - 503,744 503,744 State of North Carolina 332,080 2,707,539 - 398,706 1,791,830 5,230,155 Guilford County 454,812 - - 5,950,968 - 6,405,780
786,892 2,707,539 - 6,349,674 2,295,574 12,139,679
Due from other funds 1,797,110 61,770 - - - 1,858,880 Inventories 42,176 - - - - 42,176 Self-funded insurance deposits 4,785,335 - - - - 4,785,335
Total assets 21,302,711$ 2,769,309$ 3,578,836$ 10,998,859$ 2,295,574$ 40,945,289$
LIABILITIES AND FUND BALANCES
LIABILITIESAccounts payable 2,354,186$ -$ -$ 5,426,056$ -$ 7,780,242$ Accrued salaries and related payables 4,674,244 2,741,239 - - 409,295 7,824,778 Deferred revenues - 28,070 - - 888,216 916,286 Due to other governmental units - - - 619,676 - 619,676 Due to other funds 61,770 - - - 998,063 1,059,833
Total liabilities 7,090,200 2,769,309 - 6,045,732 2,295,574 18,200,815
FUND BALANCES Reserved:
Encumbrances 1,594,086 - - 38,147,160 - 39,741,246 Inventories 42,176 - - - - 42,176 Self-insurance deposits 4,785,335 - - - - 4,785,335 State statute 2,584,002 - - 6,349,674 - 8,933,676
Unreserved - designated for subsequent year's expenditures 3,000,000 - - - - 3,000,000 Unreserved - designated for capital outlay 2,206,912 - - - - 2,206,912 Unreserved - undesignated (deficit) - - 3,578,836 (39,543,707) - (35,964,871)
Total fund balances 14,212,511 - 3,578,836 4,953,127 - 22,744,474
Total liabilities and fund balances 21,302,711$ 2,769,309$ 3,578,836$ 10,998,859$ 2,295,574$ 40,945,289$
Reconciliation of the Balance Sheet to the Statement of Net Assets
Amounts reported for governmental activities in the statement of net assets are different because:
Total fund balance - governmental funds 22,744,474$ u
Capital assets used in governmental activities are not financial resources and therefore are not reported as assets in governmental funds.
The cost of capital assets is 1,026,944,589$ Accumulated depreciation is (264,964,382) 761,980,207
Long-term liabilities, including capital leases, are not due and payable in the current period and therefore are not reported as liabilities in the funds. Long-term liabilities at year end consist of:
Installment purchases (1,017,628) Compensated absences payable (29,913,709) Claims liabilities for retained risks (3,120,458) (34,051,795)
Total net assets - governmental activities 750,672,886$
GUILFORD COUNTY BOARD OF EDUCATION BALANCE SHEET - GOVERNMENTAL FUNDS
June 30, 2010
Major Funds
The accompanying notes are an integral part of this statement.
- 22 -
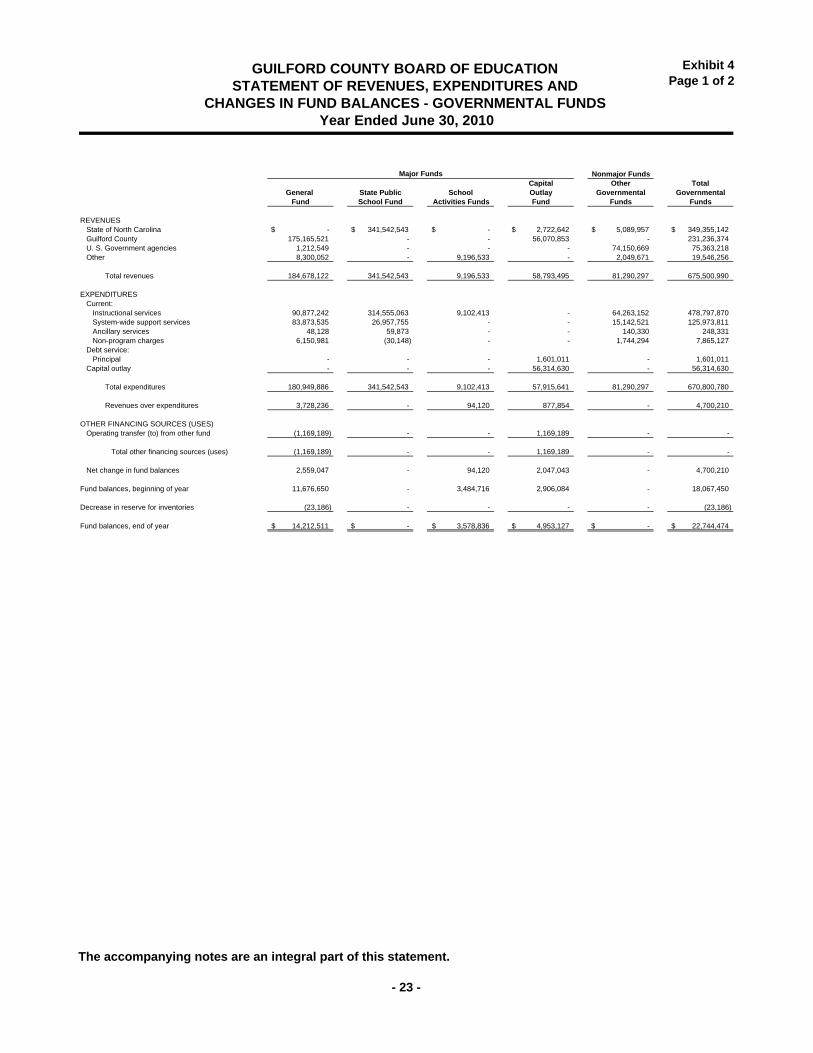
Exhibit 4Page 1 of 2
Nonmajor FundsCapital Other Total
General State Public School Outlay Governmental GovernmentalFund School Fund Activities Funds Fund Funds Funds
REVENUESState of North Carolina -$ 341,542,543$ -$ 2,722,642$ 5,089,957$ 349,355,142$ Guilford County 175,165,521 - - 56,070,853 - 231,236,374 U. S. Government agencies 1,212,549 - - - 74,150,669 75,363,218 Other 8,300,052 - 9,196,533 - 2,049,671 19,546,256
Total revenues 184,678,122 341,542,543 9,196,533 58,793,495 81,290,297 675,500,990
EXPENDITURESCurrent:
Instructional services 90,877,242 314,555,063 9,102,413 - 64,263,152 478,797,870 System-wide support services 83,873,535 26,957,755 - - 15,142,521 125,973,811 Ancillary services 48,128 59,873 - - 140,330 248,331 Non-program charges 6,150,981 (30,148) - - 1,744,294 7,865,127
Debt service:Principal - - - 1,601,011 - 1,601,011
Capital outlay - - - 56,314,630 - 56,314,630
Total expenditures 180,949,886 341,542,543 9,102,413 57,915,641 81,290,297 670,800,780
Revenues over expenditures 3,728,236 - 94,120 877,854 - 4,700,210
OTHER FINANCING SOURCES (USES)Operating transfer (to) from other fund (1,169,189) - - 1,169,189 - -
Total other financing sources (uses) (1,169,189) - - 1,169,189 - -
Net change in fund balances 2,559,047 - 94,120 2,047,043 - 4,700,210
Fund balances, beginning of year 11,676,650 - 3,484,716 2,906,084 - 18,067,450
Decrease in reserve for inventories (23,186) - - - - (23,186)
Fund balances, end of year 14,212,511$ -$ 3,578,836$ 4,953,127$ -$ 22,744,474$
Major Funds
GUILFORD COUNTY BOARD OF EDUCATION
CHANGES IN FUND BALANCES - GOVERNMENTAL FUNDS Year Ended June 30, 2010
STATEMENT OF REVENUES, EXPENDITURES AND
The accompanying notes are an integral part of this statement.
- 23 -
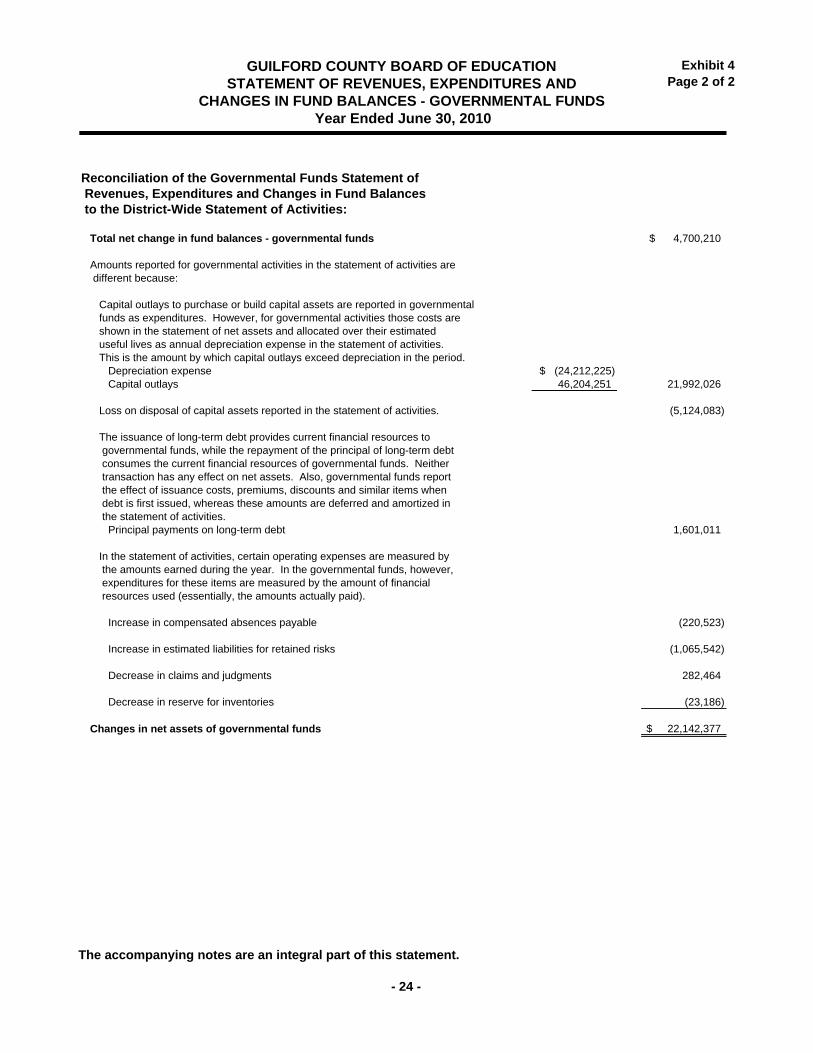
Exhibit 4Page 2 of 2
Reconciliation of the Governmental Funds Statement of Revenues, Expenditures and Changes in Fund Balances to the District-Wide Statement of Activities:
Total net change in fund balances - governmental funds 4,700,210$
Amounts reported for governmental activities in the statement of activities are different because:
Capital outlays to purchase or build capital assets are reported in governmentalfunds as expenditures. However, for governmental activities those costs areshown in the statement of net assets and allocated over their estimateduseful lives as annual depreciation expense in the statement of activities.This is the amount by which capital outlays exceed depreciation in the period.
Depreciation expense (24,212,225)$ Capital outlays 46,204,251 21,992,026
Loss on disposal of capital assets reported in the statement of activities. (5,124,083)
The issuance of long-term debt provides current financial resources to governmental funds, while the repayment of the principal of long-term debt consumes the current financial resources of governmental funds. Neither transaction has any effect on net assets. Also, governmental funds report the effect of issuance costs, premiums, discounts and similar items when debt is first issued, whereas these amounts are deferred and amortized in the statement of activities.
Principal payments on long-term debt 1,601,011
In the statement of activities, certain operating expenses are measured by the amounts earned during the year. In the governmental funds, however, expenditures for these items are measured by the amount of financial resources used (essentially, the amounts actually paid).
Increase in compensated absences payable (220,523)
Increase in estimated liabilities for retained risks (1,065,542)
Decrease in claims and judgments 282,464
Decrease in reserve for inventories (23,186)
Changes in net assets of governmental funds 22,142,377$
GUILFORD COUNTY BOARD OF EDUCATION STATEMENT OF REVENUES, EXPENDITURES AND
CHANGES IN FUND BALANCES - GOVERNMENTAL FUNDS Year Ended June 30, 2010
The accompanying notes are an integral part of this statement.
- 24 -
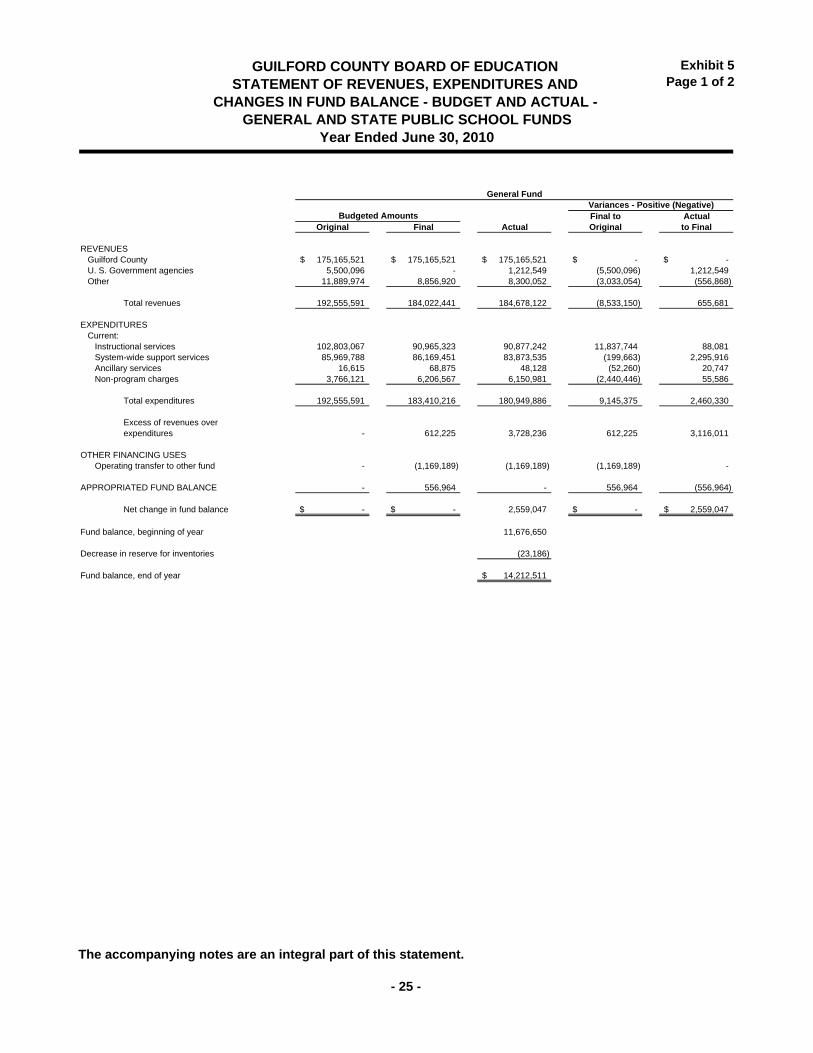
Exhibit 5Page 1 of 2
Final to ActualOriginal Final Actual Original to Final
REVENUESGuilford County 175,165,521$ 175,165,521$ 175,165,521$ -$ -$ U. S. Government agencies 5,500,096 - 1,212,549 (5,500,096) 1,212,549 Other 11,889,974 8,856,920 8,300,052 (3,033,054) (556,868)
Total revenues 192,555,591 184,022,441 184,678,122 (8,533,150) 655,681
EXPENDITURESCurrent:
Instructional services 102,803,067 90,965,323 90,877,242 11,837,744 88,081 System-wide support services 85,969,788 86,169,451 83,873,535 (199,663) 2,295,916 Ancillary services 16,615 68,875 48,128 (52,260) 20,747 Non-program charges 3,766,121 6,206,567 6,150,981 (2,440,446) 55,586
Total expenditures 192,555,591 183,410,216 180,949,886 9,145,375 2,460,330
Excess of revenues overexpenditures - 612,225 3,728,236 612,225 3,116,011
OTHER FINANCING USESOperating transfer to other fund - (1,169,189) (1,169,189) (1,169,189) -
APPROPRIATED FUND BALANCE - 556,964 - 556,964 (556,964)
Net change in fund balance -$ -$ 2,559,047 -$ 2,559,047$
Fund balance, beginning of year 11,676,650
Decrease in reserve for inventories (23,186)
Fund balance, end of year 14,212,511$
Budgeted AmountsVariances - Positive (Negative)
GUILFORD COUNTY BOARD OF EDUCATION
GENERAL AND STATE PUBLIC SCHOOL FUNDS Year Ended June 30, 2010
STATEMENT OF REVENUES, EXPENDITURES AND CHANGES IN FUND BALANCE - BUDGET AND ACTUAL -
General Fund
The accompanying notes are an integral part of this statement.
- 25 -
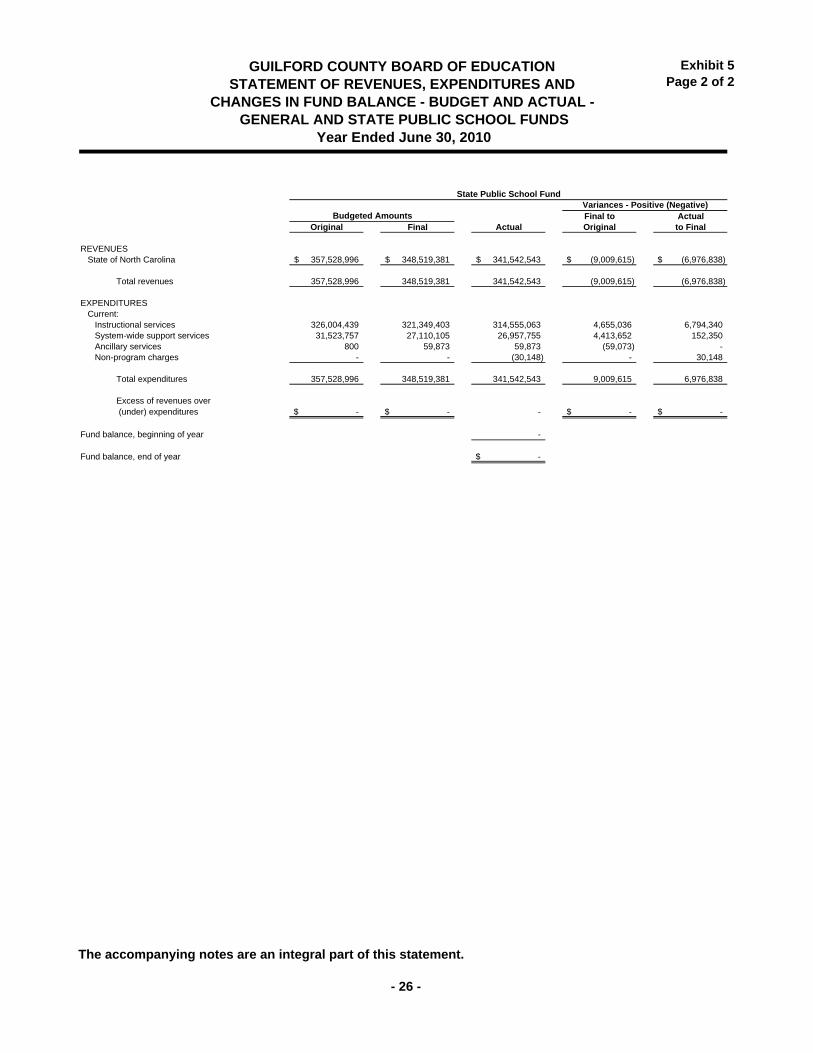
Exhibit 5 Page 2 of 2
Final to ActualOriginal Final Actual Original to Final
REVENUESState of North Carolina 357,528,996$ 348,519,381$ 341,542,543$ (9,009,615)$ (6,976,838)$
Total revenues 357,528,996 348,519,381 341,542,543 (9,009,615) (6,976,838)
EXPENDITURESCurrent:
Instructional services 326,004,439 321,349,403 314,555,063 4,655,036 6,794,340 System-wide support services 31,523,757 27,110,105 26,957,755 4,413,652 152,350 Ancillary services 800 59,873 59,873 (59,073) - Non-program charges - - (30,148) - 30,148
Total expenditures 357,528,996 348,519,381 341,542,543 9,009,615 6,976,838
Excess of revenues over (under) expenditures -$ -$ - -$ -$
Fund balance, beginning of year -
Fund balance, end of year -$
Budgeted AmountsVariances - Positive (Negative)
GUILFORD COUNTY BOARD OF EDUCATION
GENERAL AND STATE PUBLIC SCHOOL FUNDS Year Ended June 30, 2010
STATEMENT OF REVENUES, EXPENDITURES AND CHANGES IN FUND BALANCE - BUDGET AND ACTUAL -
State Public School Fund
The accompanying notes are an integral part of this statement.
- 26 -
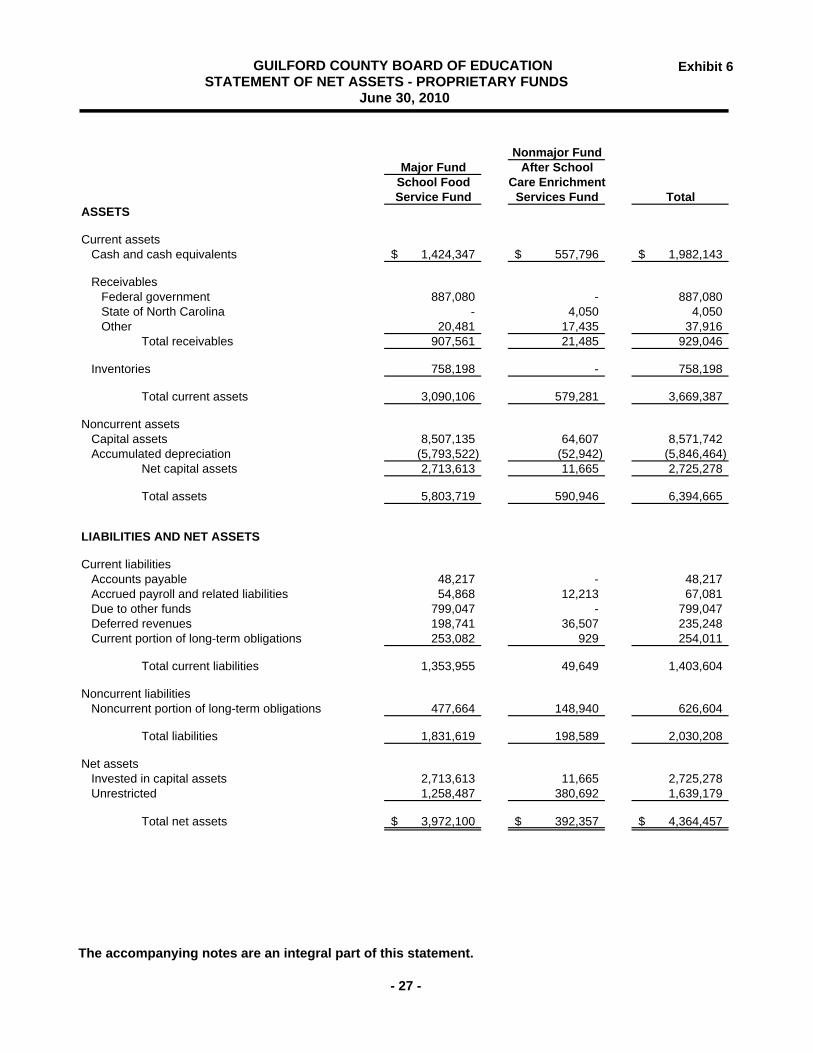
Exhibit 6
Nonmajor FundMajor Fund After School
School Food Care EnrichmentService Fund Services Fund Total
ASSETS
Current assetsCash and cash equivalents 1,424,347$ 557,796$ 1,982,143$
ReceivablesFederal government 887,080 - 887,080 State of North Carolina - 4,050 4,050 Other 20,481 17,435 37,916
Total receivables 907,561 21,485 929,046
Inventories 758,198 - 758,198
Total current assets 3,090,106 579,281 3,669,387
Noncurrent assetsCapital assets 8,507,135 64,607 8,571,742 Accumulated depreciation (5,793,522) (52,942) (5,846,464)
Net capital assets 2,713,613 11,665 2,725,278
Total assets 5,803,719 590,946 6,394,665
LIABILITIES AND NET ASSETS
Current liabilitiesAccounts payable 48,217 - 48,217 Accrued payroll and related liabilities 54,868 12,213 67,081 Due to other funds 799,047 - 799,047 Deferred revenues 198,741 36,507 235,248 Current portion of long-term obligations 253,082 929 254,011
Total current liabilities 1,353,955 49,649 1,403,604
Noncurrent liabilitiesNoncurrent portion of long-term obligations 477,664 148,940 626,604
Total liabilities 1,831,619 198,589 2,030,208
Net assetsInvested in capital assets 2,713,613 11,665 2,725,278 Unrestricted 1,258,487 380,692 1,639,179
Total net assets 3,972,100$ 392,357$ 4,364,457$
GUILFORD COUNTY BOARD OF EDUCATION STATEMENT OF NET ASSETS - PROPRIETARY FUNDS
June 30, 2010
The accompanying notes are an integral part of this statement.
- 27 -
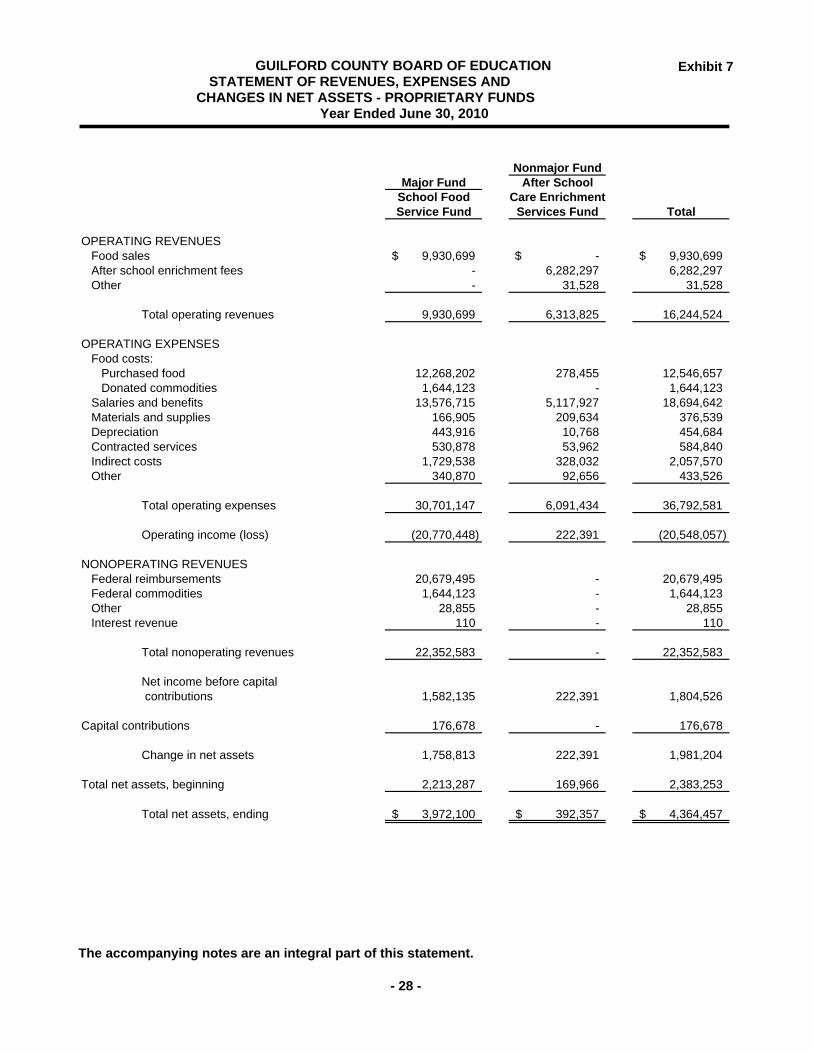
Exhibit 7
Nonmajor FundMajor Fund After School
School Food Care EnrichmentService Fund Services Fund Total
OPERATING REVENUESFood sales 9,930,699$ -$ 9,930,699$ After school enrichment fees - 6,282,297 6,282,297 Other - 31,528 31,528
Total operating revenues 9,930,699 6,313,825 16,244,524
OPERATING EXPENSESFood costs:
Purchased food 12,268,202 278,455 12,546,657 Donated commodities 1,644,123 - 1,644,123
Salaries and benefits 13,576,715 5,117,927 18,694,642 Materials and supplies 166,905 209,634 376,539 Depreciation 443,916 10,768 454,684 Contracted services 530,878 53,962 584,840 Indirect costs 1,729,538 328,032 2,057,570 Other 340,870 92,656 433,526
Total operating expenses 30,701,147 6,091,434 36,792,581
Operating income (loss) (20,770,448) 222,391 (20,548,057)
NONOPERATING REVENUES Federal reimbursements 20,679,495 - 20,679,495 Federal commodities 1,644,123 - 1,644,123 Other 28,855 - 28,855 Interest revenue 110 - 110
Total nonoperating revenues 22,352,583 - 22,352,583
Net income before capital contributions 1,582,135 222,391 1,804,526
Capital contributions 176,678 - 176,678
Change in net assets 1,758,813 222,391 1,981,204
Total net assets, beginning 2,213,287 169,966 2,383,253
Total net assets, ending 3,972,100$ 392,357$ 4,364,457$
GUILFORD COUNTY BOARD OF EDUCATION STATEMENT OF REVENUES, EXPENSES AND
CHANGES IN NET ASSETS - PROPRIETARY FUNDS Year Ended June 30, 2010
The accompanying notes are an integral part of this statement.
- 28 -
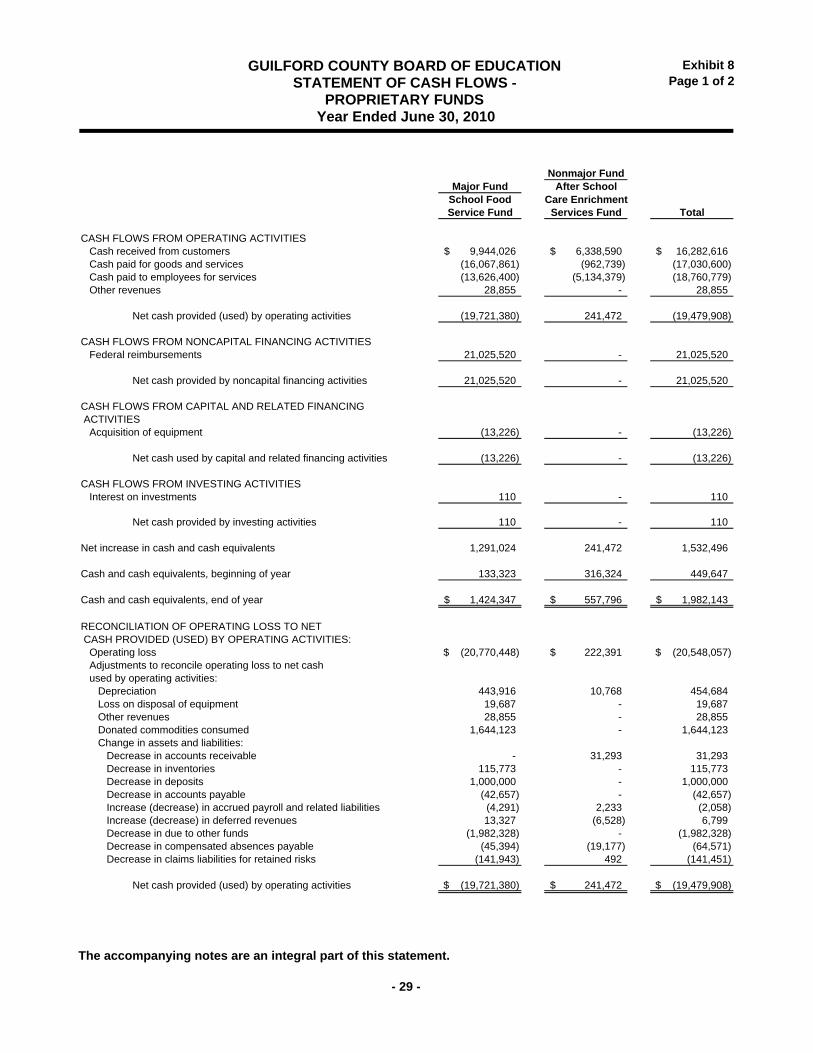
Exhibit 8Page 1 of 2
Nonmajor FundMajor Fund After School
School Food Care EnrichmentService Fund Services Fund Total
CASH FLOWS FROM OPERATING ACTIVITIESCash received from customers 9,944,026$ 6,338,590$ 16,282,616$ Cash paid for goods and services (16,067,861) (962,739) (17,030,600) Cash paid to employees for services (13,626,400) (5,134,379) (18,760,779) Other revenues 28,855 - 28,855
Net cash provided (used) by operating activities (19,721,380) 241,472 (19,479,908)
CASH FLOWS FROM NONCAPITAL FINANCING ACTIVITIESFederal reimbursements 21,025,520 - 21,025,520
Net cash provided by noncapital financing activities 21,025,520 - 21,025,520
CASH FLOWS FROM CAPITAL AND RELATED FINANCING ACTIVITIES
Acquisition of equipment (13,226) - (13,226)
Net cash used by capital and related financing activities (13,226) - (13,226)
CASH FLOWS FROM INVESTING ACTIVITIESInterest on investments 110 - 110
Net cash provided by investing activities 110 - 110
Net increase in cash and cash equivalents 1,291,024 241,472 1,532,496
Cash and cash equivalents, beginning of year 133,323 316,324 449,647
Cash and cash equivalents, end of year 1,424,347$ 557,796$ 1,982,143$
RECONCILIATION OF OPERATING LOSS TO NET CASH PROVIDED (USED) BY OPERATING ACTIVITIES:
Operating loss (20,770,448)$ 222,391$ (20,548,057)$ Adjustments to reconcile operating loss to net cashused by operating activities:
Depreciation 443,916 10,768 454,684 Loss on disposal of equipment 19,687 - 19,687 Other revenues 28,855 - 28,855 Donated commodities consumed 1,644,123 - 1,644,123 Change in assets and liabilities:
Decrease in accounts receivable - 31,293 31,293 Decrease in inventories 115,773 - 115,773 Decrease in deposits 1,000,000 - 1,000,000 Decrease in accounts payable (42,657) - (42,657) Increase (decrease) in accrued payroll and related liabilities (4,291) 2,233 (2,058) Increase (decrease) in deferred revenues 13,327 (6,528) 6,799 Decrease in due to other funds (1,982,328) - (1,982,328) Decrease in compensated absences payable (45,394) (19,177) (64,571) Decrease in claims liabilities for retained risks (141,943) 492 (141,451)
Net cash provided (used) by operating activities (19,721,380)$ 241,472$ (19,479,908)$
GUILFORD COUNTY BOARD OF EDUCATION STATEMENT OF CASH FLOWS -
PROPRIETARY FUNDS Year Ended June 30, 2010
The accompanying notes are an integral part of this statement.
- 29 -
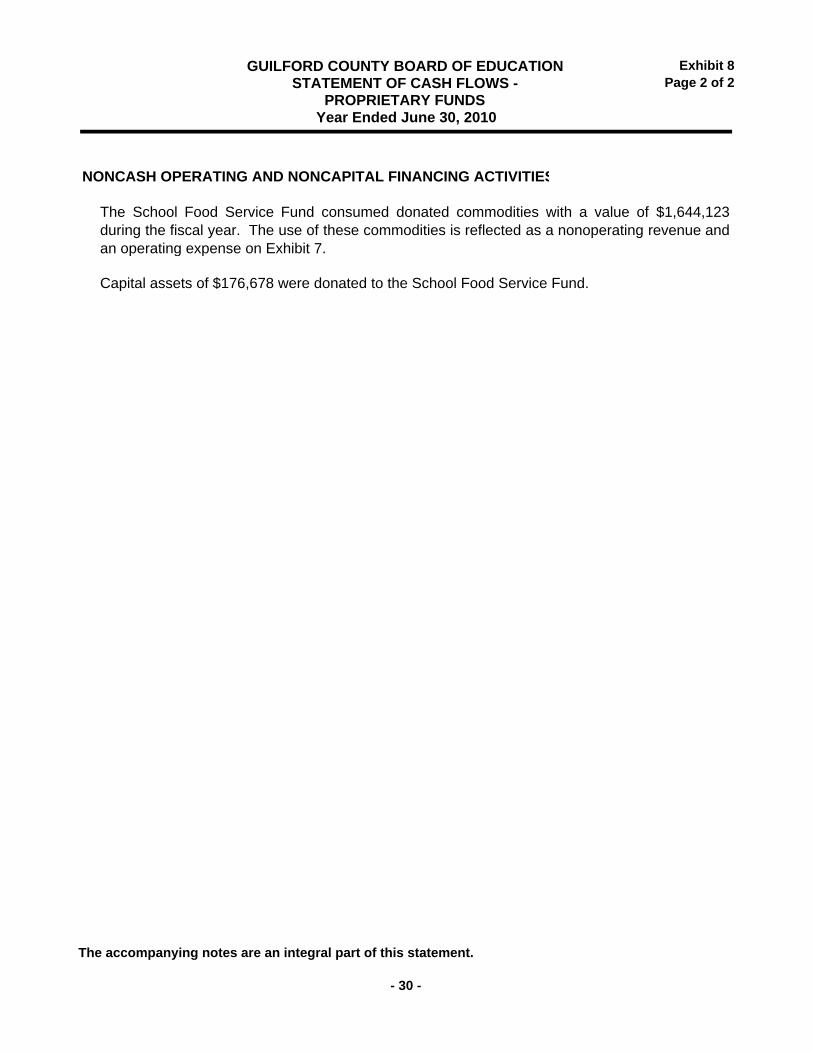
Exhibit 8Page 2 of 2
NONCASH OPERATING AND NONCAPITAL FINANCING ACTIVITIES
Capital assets of $176,678 were donated to the School Food Service Fund.
Year Ended June 30, 2010
GUILFORD COUNTY BOARD OF EDUCATION STATEMENT OF CASH FLOWS -
PROPRIETARY FUNDS
The School Food Service Fund consumed donated commodities with a value of $1,644,123during the fiscal year. The use of these commodities is reflected as a nonoperating revenue andan operating expense on Exhibit 7.
The accompanying notes are an integral part of this statement.
- 30 -
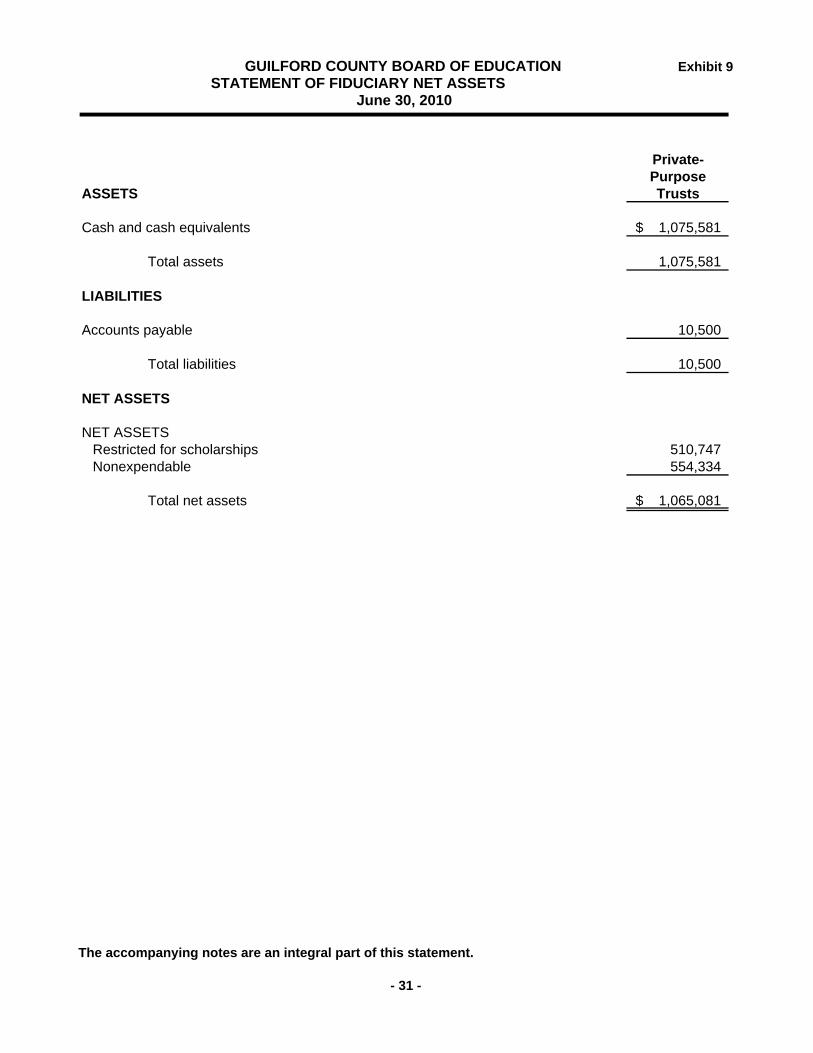
Exhibit 9
Private-Purpose
ASSETS Trusts
Cash and cash equivalents 1,075,581$
Total assets 1,075,581
LIABILITIES
Accounts payable 10,500
Total liabilities 10,500
NET ASSETS
NET ASSETSRestricted for scholarships 510,747 Nonexpendable 554,334
Total net assets 1,065,081$
GUILFORD COUNTY BOARD OF EDUCATION STATEMENT OF FIDUCIARY NET ASSETS
June 30, 2010
The accompanying notes are an integral part of this statement.
- 31 -
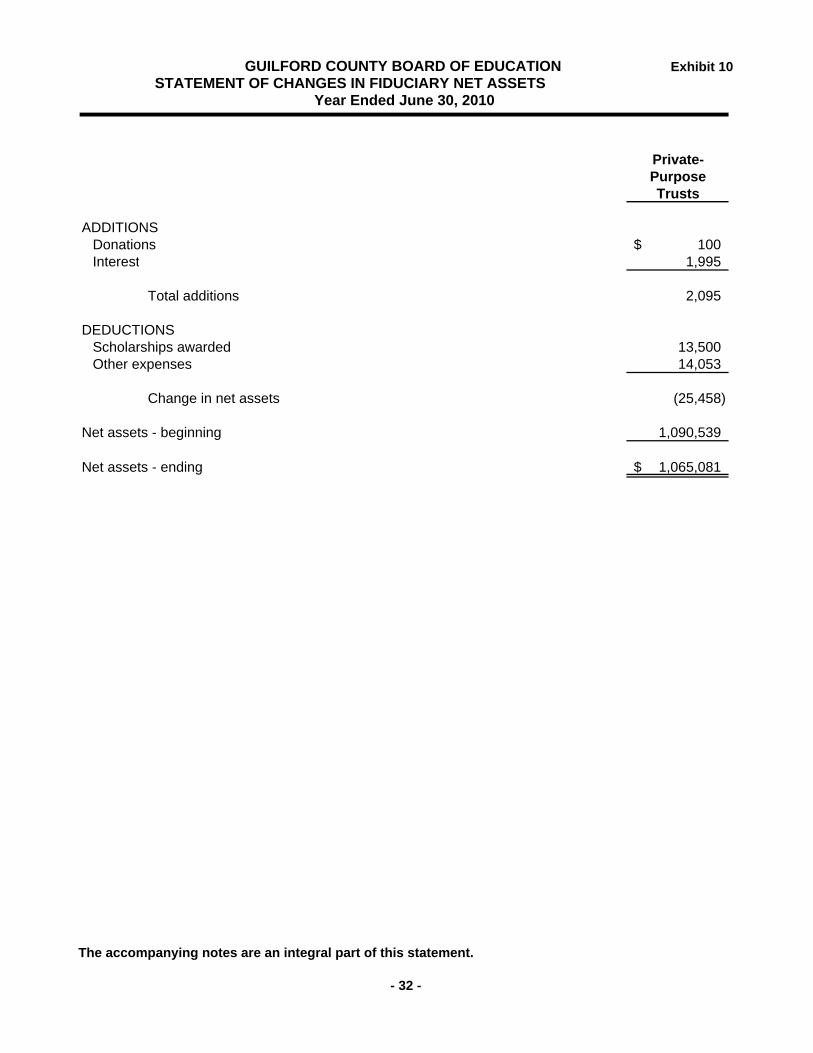
Exhibit 10
Private-PurposeTrusts
ADDITIONSDonations 100$ Interest 1,995
Total additions 2,095
DEDUCTIONSScholarships awarded 13,500 Other expenses 14,053
Change in net assets (25,458)
Net assets - beginning 1,090,539
Net assets - ending 1,065,081$
GUILFORD COUNTY BOARD OF EDUCATION STATEMENT OF CHANGES IN FIDUCIARY NET ASSETS
Year Ended June 30, 2010
The accompanying notes are an integral part of this statement.
- 32 -
- 33 -
GUILFORD COUNTY BOARD OF EDUCATION NOTES TO FINANCIAL STATEMENTS June 30, 2010
I. Summary of Significant Accounting Policies The accounting policies of the Guilford County Board of Education conform to generally accepted
accounting principles as applicable to governments. The following is a summary of the more significant accounting policies:
A. Reporting Entity The Guilford County Board of Education (Board) is a Local Education Agency empowered by
Chapter 115C of the North Carolina General Statutes with the responsibility to oversee and control all activities related to public school education in Guilford County, North Carolina. The Board receives local, state, and federal government funding and must adhere to the legal requirements of each funding entity.
The Board is governed by an eleven-member governing body elected by the citizens of
Guilford County. The County provides approximately 34% of the total funding for the Board and has the authority to control how its funding is spent. However, beyond this, the County does not have legal authority over the Board’s budget. Accordingly, the Board is not considered to be a component unit of Guilford County.
B. Basis of Presentation Government-Wide Statements: The Statement of Net Assets and the Statement of
Activities display information about the Board. These statements include the financial activities of the overall government, except for fiduciary activities. Eliminations have been made to minimize the effect of internal activities upon revenues and expenses. These statements distinguish between the governmental and business-type activities of the Board. Governmental activities generally are financed through intergovernmental revenues and other nonexchange transactions. Business-type activities are financed in whole or in part by fees charged to external parties.
The Statement of Activities presents a comparison between direct expenses and program
revenues for the different business-type activities of the Board and for each function of the Board’s governmental activities. Direct expenses are those that are specifically associated with a program or function and, therefore, are clearly identifiable to a particular function. Indirect expense allocations that have been made in the funds have been reversed for the Statement of Activities. Program revenues include (a) fees and charges paid by the recipients of goods or services offered by the programs, and (b) grants and contributions that are restricted to meeting the operational or capital requirements of a particular program. Revenues that are not classified as program revenues are presented as general revenues.
NOTES TO FINANCIAL STATEMENTS (Continued)
- 34 -
I. Summary of Significant Accounting Policies (Continued) B. Basis of Presentation (Continued) Fund Financial Statements: The fund financial statements provide information about the
Board’s funds, including its fiduciary funds. Separate statements for each fund category - governmental, proprietary and fiduciary - are presented. The emphasis of fund financial statements is on major governmental and enterprise funds, each displayed in a separate column. All remaining governmental and enterprise funds are aggregated and reported as nonmajor funds. The fiduciary funds are presented separately.
Proprietary fund operating revenues, such as charges for services, result from exchange
transactions associated with the principal activity of the fund. Exchange transactions are those in which each party receives and gives up essentially equal values. Nonoperating revenues, such as subsidies and investment earnings, result from nonexchange transactions or ancillary activities. Operating expenses for the proprietary funds include all costs of operations such as costs of sales, salaries and benefits, materials and supplies, depreciation, contracted services, indirect costs, loss on disposal of capital assets and other miscellaneous operating expenses. Any expenses not meeting this definition are reported as nonoperating expenses.
The Board reports the following major governmental funds: General Fund - The General Fund is the general operating fund of the Board. The
General Fund accounts for all financial resources except those that are required to be accounted for in another fund. This fund is the “Local Current Expense Fund,” which is mandated by state law [G. S. 115C-426].
State Public School Fund - The State Public School Fund includes appropriations
from the Department of Public Instruction for the current operating expenditures of the public school system.
School Activities Fund - The Individual Schools Fund includes revenues and expenditures of the activity funds of the individual schools. The primary revenue sources include funds held on the behalf of various clubs and organizations, receipts from athletic events, and proceeds from various fund raising activities. The primary expenditures are for athletic teams, club programs, activity buses and instructional needs.
Capital Outlay Fund - The Capital Outlay Fund accounts for financial resources to be used for the acquisition and construction of major capital facilities (other than those financed by proprietary funds and trust funds). It is mandated by state law [G. S. 115C-426]. Capital projects are funded by Guilford County appropriations, restricted sales tax monies, proceeds from Guilford County bonds issued for public school construction, lottery proceeds, as well as certain state assistance.
The Board reports the following major enterprise fund:
School Food Service Fund - The School Food Service Fund is used to account for the food service program within the school system.
NOTES TO FINANCIAL STATEMENTS (Continued)
- 35 -
I. Summary of Significant Accounting Policies (Continued) B. Basis of Presentation (Continued) The Board reports the following fiduciary funds: Private-Purpose Trusts - Private-Purpose Trust Funds are accounted for in a manner
similar to proprietary funds. The Board has eleven such funds: the E. P. Pearce, Jr. Scholarship Trust Fund, the Elizabeth Hanner Holt Scholarship Trust Fund, the Bill Vielkanowitz Scholarship Fund, the Southeast High School Scholarship Fund, the A. B. Hunter Scholarship Fund, the Nathanael Greene Scholarship Fund, the Ora Sublett Scholarship Fund, the Hanner Scholarship Fund, the Ben L. Smith Scholarship Fund, the Dr. Randall S. Brooks, Sr. Preschool Handicapped Fund, and the Violet G. Hutchens Music Fund. The Ben L. Smith Scholarship Fund, funded by private contributions, was established by the Board to recognize and honor professional staff members and to help make possible further study for worthy staff members. The Dr. Randall S. Brooks, Sr. Preschool Handicapped Fund is funded by private contributions and is to be used to purchase items and provide services that are not covered by federal and state monies for students in the preschool handicapped program. The Violet G. Hutchens Music Fund, funded by private contributions, is to be used for musical training and the purchase of musical instruments and supplies at Johnson Street Elementary, Oak Hill Elementary, Ferndale Middle, and High Point Central High School. Nonexpendable principal assets in the eight remaining Scholarship Funds of $10,190, $61,000, $18,870, $6,000, $10,000, $8,106, $220,000 and $220,168, respectively, are maintained in these funds, the earnings of which are used to fund scholarship grants for graduating seniors.
C. Measurement Focus and Basis of Accounting Government-Wide, Proprietary and Fiduciary Fund Financial Statements. The government-
wide, proprietary and fiduciary fund financial statements are reported using the economic resources measurement focus and the accrual basis of accounting. Revenues are recorded when earned and expenses are recorded at the time liabilities are incurred, regardless of when the related cash flows take place. Nonexchange transactions, in which the Board gives (or receives) value without directly receiving (or giving) equal value in exchange, include grants and donations. Revenue from grants and donations is recognized in the fiscal year in which all eligibility requirements have been satisfied.
Governmental Fund Financial Statements. Governmental funds are reported using the
current financial resources measurement focus and the modified accrual basis of accounting. Under this method, revenues are recognized when measurable and available. The Board considers all revenues reported in the governmental funds to be available if the revenues are collected within sixty days after year end. These could include federal, state, and county grants, and some charges for services. Expenditures are recorded when the related fund liability is incurred, except for claims and judgments and compensated absences, which are recognized as expenditures to the extent they have matured. General capital asset acquisitions are reported as expenditures in governmental funds. Acquisitions under capital leases are reported as other financing sources. Payments made under capital leases are also reported as expenditures.
NOTES TO FINANCIAL STATEMENTS (Continued)
- 36 -
I. Summary of Significant Accounting Policies (Continued)
C. Measurement Focus and Basis of Accounting (Continued)
Under the terms of grant agreements, the Board funds certain programs by a combination of specific cost-reimbursement grants and general revenues. Thus, when program expenses are incurred, there are both restricted and unrestricted net assets available to finance the program. It is the Board’s policy to first apply cost-reimbursement grant resources to such programs and then general revenues.
All governmental and business-type activities and enterprise funds of the Board follow FASB Statements and Interpretations issued on or before November 30, 1989, Accounting Principles Board Opinions, and Accounting Research Bulletins, unless those pronouncements conflict with GASB pronouncements.
D. Budgetary Data
The Board’s budgets are adopted as required by the North Carolina General Statutes. Annual budgets are adopted for all funds, except for the individual school special revenue funds and trust funds, as required by North Carolina General Statutes. All appropriations lapse at fiscal year end. All budgets are prepared using the modified accrual basis of accounting, except for the School Food Service Fund, which is adopted on the full accrual basis as adjusted for capital outlay expenditures. Expenditures may not legally exceed appropriations at the purpose level for all annually budgeted funds. The Finance Officer, with the approval of the Superintendent, is authorized by the governing board to transfer monies not to exceed 10% between functions of the same fund. Such transfers must be reported to the governing board at its next regular meeting. Transfers in excess of this amount or transfers between funds require governing board approval. Amendments which alter the county appropriation or transfer monies to or from the Capital Projects Fund also require the approval of the Guilford County Board of Commissioners.
A budget calendar is included in G. S. 115C, Article 31, and prescribes the last day on which certain steps of the budget procedure are to be performed. The following schedule lists the tasks to be performed and the date each is required to be completed.
May 1 The Superintendent must submit the budget request along with a copy of the budget message to the Board of Education not later than May 1.
May 15 The Board of Education should make changes, if necessary, to the budget request as submitted by the Superintendent and forward an approved budget request to the Board of County Commissioners not later than May 15, unless the County Commissioners have established a later date.
July 1 The Board of County Commissioners must complete its actions on the school budget not later than July 1, unless a later date is agreed upon between the Board of Education and the County Commissioners.
Month of July The Board of Education must adopt its balanced budget resolution after the
Board of County Commissioners has decided upon the amount of appropriations to be provided by the County or after the appeal procedures as set forth in state law [G. S. 115C-431].
NOTES TO FINANCIAL STATEMENTS (Continued)
- 37 -
I. Summary of Significant Accounting Policies (Continued)
D. Budgetary Data (Continued)
As required by state law, the Board maintains encumbrance accounts which are considered to be “budgetary accounts.” Encumbrances outstanding at year end represent the estimated amounts of the expenditures ultimately to result if unperformed contracts in process at year end are completed. Encumbrances outstanding at year end do not constitute expenditures or liabilities. At June 30, 2010, the General Fund and the Capital Projects Fund have outstanding encumbrances of $1,594,086 and $38,147,160, respectively. These encumbrances outstanding are reported as “Reserved for encumbrances” in the fund balance section of the Balance Sheet - Governmental Funds. Encumbrances are reappropriated in the subsequent fiscal year since appropriations lapse at year end.
E. Assets, Liabilities and Net Assets/Fund Balances
1. Deposits and Investments
All deposits of the Board are made in board-designated official depositories and are secured as required by state law [G. S. 115C-444]. The Board may designate, as an official depository, any bank or savings association whose principal office is located in North Carolina. Also, the Board may establish time deposit accounts such as NOW and SuperNOW accounts, money market accounts, and certificates of deposit. The Board also has money credited in its name with the State Treasurer and may issue state warrants against these funds.
State law [G. S. 115C-443] authorizes the Board to invest in obligations of the United States or obligations fully guaranteed both as to principal and interest by the United States; obligations of the state of North Carolina; bonds and notes of any North Carolina local government or public authority; obligations of certain non-guaranteed federal agencies; certain high quality issues of commercial paper and bankers’ acceptances; the North Carolina Capital Management Trust (NCCMT), an SEC-registered (2a-7) money market mutual fund; and the North Carolina State Treasurer’s Short-Term Investment Fund (STIF). The STIF consists of an internal portion and an external portion in which the Board participates. Investments are restricted by state law to those enumerated in G. S. 147-69.1.
The Board’s investments are reported at fair value as determined by quoted market prices. The NCCMT Cash Portfolio’s securities are valued at fair value, which is the NCCMT’s share price. The STIF securities are reported at cost and maintain a constant $1 per share value. Under the authority of G. S. 147-69.3, no unrealized gains or losses of the STIF are distributed to external participants of the fund.
2. Cash and Cash Equivalents
The Board pools money from several funds to facilitate disbursement and investment and to maximize investment income. Therefore, all cash and investments are essentially demand deposits and are considered cash and cash equivalents.
NOTES TO FINANCIAL STATEMENTS (Continued)
- 38 -
I. Summary of Significant Accounting Policies (Continued) E. Assets, Liabilities and Net Assets/Fund Balances (Continued) 3. Inventories Inventories are valued at cost using the first-in, first-out (FIFO) flow assumption. The
inventories of the Board’s General Fund consist of expendable supplies. Expendable supplies are recorded as expenditures when purchased. These inventories do not reflect current appropriable resources; therefore, an equivalent portion of fund balance is reserved.
Proprietary fund inventories consist of food and supplies and are recorded as expenses
when consumed. 4. Capital Assets The Board’s capital assets are recorded at original cost. Donated assets are listed at their
estimated fair value at the date of donation. Improvements are capitalized and depreciated over the remaining useful lives of the related capital assets.
It is the policy of the Board to capitalize all capital assets costing more than $5,000 with
an estimated useful life of two or more years. In addition, other items which are purchased and used in large quantities such as student desks and library books are capitalized. The cost of normal maintenance and repairs that do not add to the value of the asset or materially extend asset lives is not capitalized.
Capital assets are depreciated using the straight-line method over the following
estimated useful lives: Land improvements 15 to 20 years Buildings 20 to 45 years Equipment and furniture 10 to 15 years Vehicles 6 to 14 years Computer equipment 3 years Depreciation for buildings and equipment that serve multiple purposes cannot be
allocated ratably and is, therefore, reported separately as “depreciation expense” on the statement of activities.
5. Long-Term Obligations In the government-wide financial statements, long-term debt and other long-term
obligations are reported as liabilities in the applicable governmental activities.
NOTES TO FINANCIAL STATEMENTS (Continued)
- 39 -
I. Summary of Significant Accounting Policies (Continued) E. Assets, Liabilities and Net Assets/Fund Balances (Continued) 6. Compensated Absences The Board follows the state’s policy for vacation and sick leave. Employees may
accumulate up to thirty (30) days earned vacation leave with such leave being fully vested when earned. The Board’s liability for accumulated earned vacation and the salary-related payments as of June 30, 2010 is recorded in the government-wide and proprietary fund financial statements on the FIFO basis. An estimate has been made based on prior years’ records, of the current portion of compensated absences.
The sick leave policy of the Board provides for an unlimited accumulation of earned sick
leave. Sick leave does not vest, but unused sick leave accumulated at the time of retirement may be used in the determination of length of service for retirement benefit purposes. Since the Board has no obligation for accumulated sick leave until it is actually taken, no accrual for sick leave has been made.
7. Net Assets/Fund Balances Net assets in the government-wide and proprietary fund financial statements are
classified as invested in capital assets, net of related debt; restricted; and unrestricted. Restricted net assets represent constraints on resources that are either externally imposed by creditors, grantors, contributors, or the laws or regulations of other governments, or imposed by law through state statute.
In the governmental fund financial statements, reservations of fund balance represent
amounts that are not appropriable, are legally segregated for a specific purpose, or are restricted by the grant agreement. Designations of fund balance represent tentative management plans that are subject to change.
State law [G. S. 115C-425(a)] restricts the appropriation of fund balance or fund equity to
an amount not to exceed the sum of cash and investments minus the sum of liabilities, encumbrances, and deferred revenues arising from cash receipts as those amounts stand at the close of the fiscal year preceding the budget year.
The governmental fund types classify fund balances as follows: Reserved Reserved for encumbrances - portion of fund balance available for
appropriation to pay for commitments related to purchase orders and contracts which remain unperformed at year end.
Reserved for inventories - portion of fund balance not available for
appropriation because it represents the year-end balance of inventories, which are not expendable, available resources.
NOTES TO FINANCIAL STATEMENTS (Continued)
- 40 -
I. Summary of Significant Accounting Policies (Continued)
E. Assets, Liabilities and Net Assets/Fund Balances (Continued)
7. Net Assets/Fund Balances (Continued)
Reserved (Continued)
Reserved for self-insurance deposits - portion of fund balance not available for appropriation because it represents the year-end balance of deposits on hand with the Local Government Excess Liability Fund, Inc. and the Local Government Property Insurance Deductible Fund, Inc. to provide reserves for the Board’s retained risks.
Reserved by state statute - portion of fund balance, in addition to reserves for encumbrances and inventories, which is not available for appropriation under state law. This amount is usually comprised of accounts receivable and inter-fund receivables which are not offset by deferred revenues.
Unreserved
Designated for subsequent year’s expenditures - portion of total fund balance available which has been designated for the adopted 2010-11 budget ordinance.
Designated for capital outlay - portion of total fund balance available for appropriation representing unexpended red light camera monies earmarked by management for future capital outlay expenditures.
Undesignated - portion of total fund balance available for appropriation which is uncommitted at year end.
II. Detail Notes on All Funds
A. Assets
1. Deposits
All of the Board’s deposits are either insured or collateralized by using one of two methods. Under the Dedicated Method, all deposits exceeding the federal depository insurance coverage level are collateralized with securities held by the Board’s agent in the unit’s name. Under the Pooling Method, which is a collateral pool, all uninsured deposits are collateralized with securities held by the State Treasurer’s agent in the name of the State Treasurer. Since the State Treasurer is acting in a fiduciary capacity for the Board, these deposits are considered to be held by the agent in the entity’s name. The amount of the pledged collateral is based on an approved averaging method for non-interest-bearing deposits and the actual current balance for interest-bearing deposits. Depositories using the Pooling Method report to the State Treasurer the adequacy of their pooled collateral covering uninsured deposits. The State Treasurer does not confirm this information with the Board or the escrow agent.
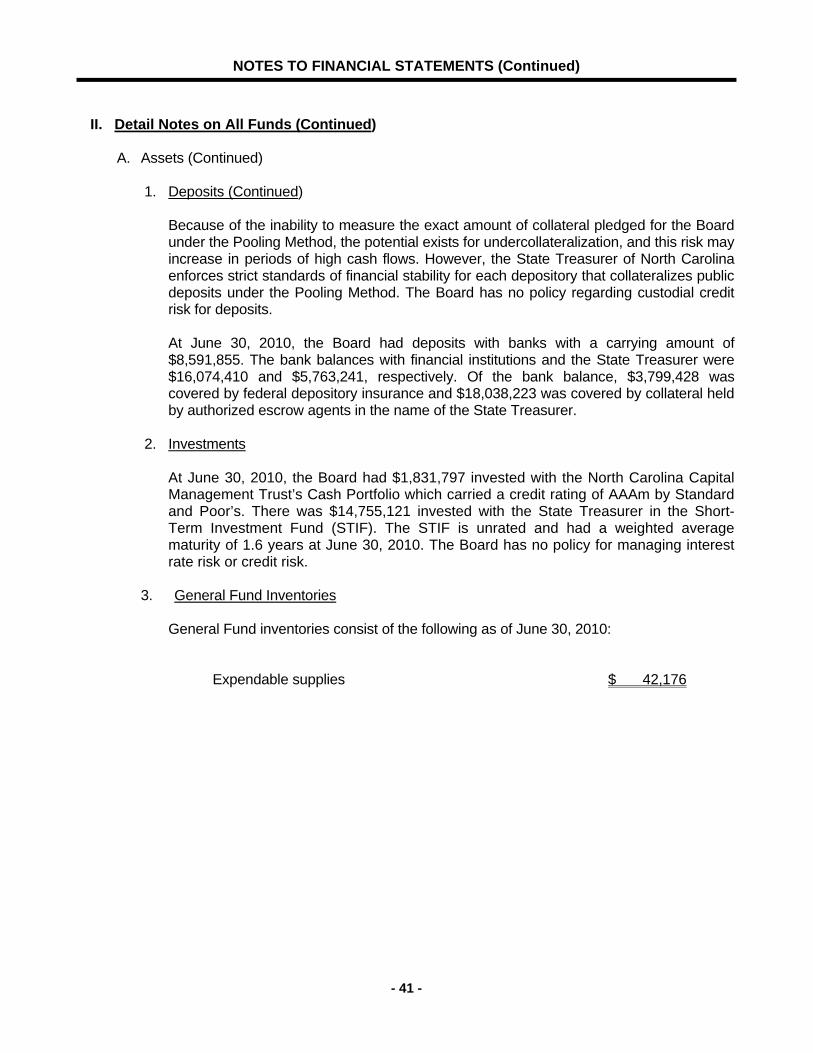
NOTES TO FINANCIAL STATEMENTS (Continued)
- 41 -
II. Detail Notes on All Funds (Continued) A. Assets (Continued)
1. Deposits (Continued)
Because of the inability to measure the exact amount of collateral pledged for the Board under the Pooling Method, the potential exists for undercollateralization, and this risk may increase in periods of high cash flows. However, the State Treasurer of North Carolina enforces strict standards of financial stability for each depository that collateralizes public deposits under the Pooling Method. The Board has no policy regarding custodial credit risk for deposits.
At June 30, 2010, the Board had deposits with banks with a carrying amount of $8,591,855. The bank balances with financial institutions and the State Treasurer were $16,074,410 and $5,763,241, respectively. Of the bank balance, $3,799,428 was covered by federal depository insurance and $18,038,223 was covered by collateral held by authorized escrow agents in the name of the State Treasurer.
2. Investments At June 30, 2010, the Board had $1,831,797 invested with the North Carolina Capital Management Trust’s Cash Portfolio which carried a credit rating of AAAm by Standard and Poor’s. There was $14,755,121 invested with the State Treasurer in the Short-Term Investment Fund (STIF). The STIF is unrated and had a weighted average maturity of 1.6 years at June 30, 2010. The Board has no policy for managing interest rate risk or credit risk.
3. General Fund Inventories General Fund inventories consist of the following as of June 30, 2010: Expendable supplies $ 42,176
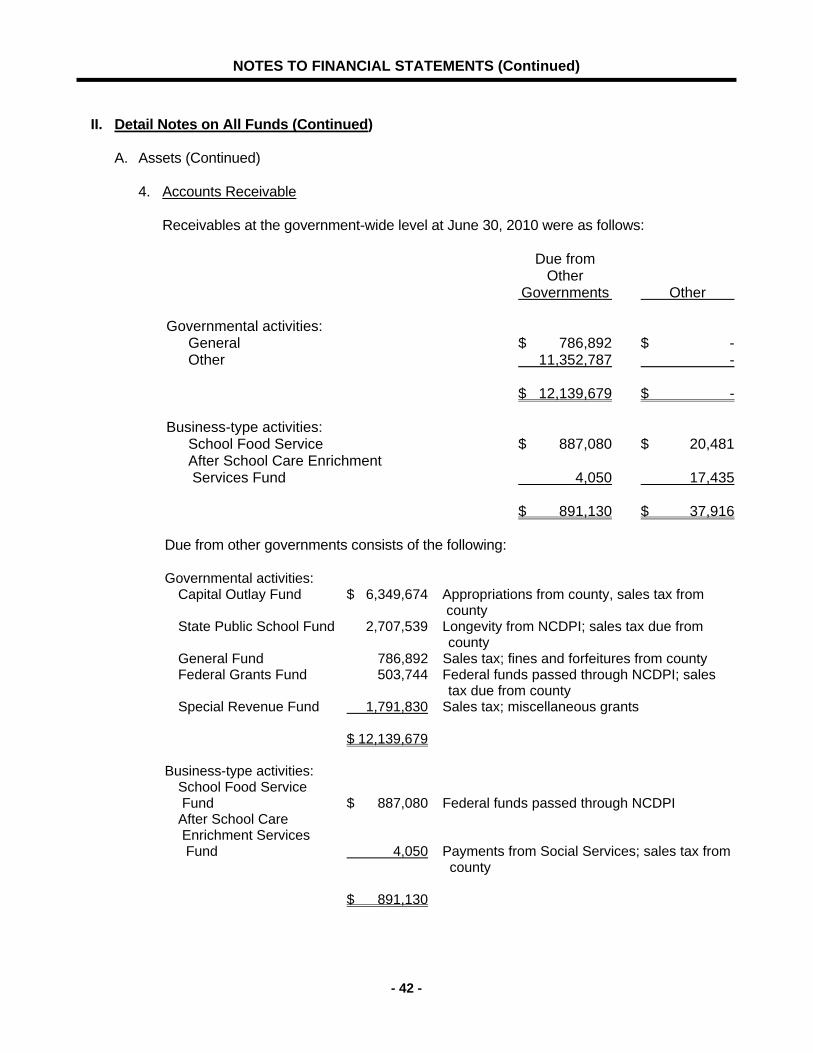
NOTES TO FINANCIAL STATEMENTS (Continued)
- 42 -
II. Detail Notes on All Funds (Continued) A. Assets (Continued) 4. Accounts Receivable Receivables at the government-wide level at June 30, 2010 were as follows: Due from Other Governments Other Governmental activities: General $ 786,892 $ - Other 11,352,787 - $ 12,139,679 $ - Business-type activities: School Food Service $ 887,080 $ 20,481 After School Care Enrichment Services Fund 4,050 17,435 $ 891,130 $ 37,916 Due from other governments consists of the following: Governmental activities: Capital Outlay Fund $ 6,349,674 Appropriations from county, sales tax from county State Public School Fund 2,707,539 Longevity from NCDPI; sales tax due from
county General Fund 786,892 Sales tax; fines and forfeitures from county Federal Grants Fund 503,744 Federal funds passed through NCDPI; sales
tax due from county Special Revenue Fund 1,791,830 Sales tax; miscellaneous grants $ 12,139,679 Business-type activities: School Food Service Fund $ 887,080 Federal funds passed through NCDPI After School Care Enrichment Services Fund 4,050 Payments from Social Services; sales tax from
county $ 891,130
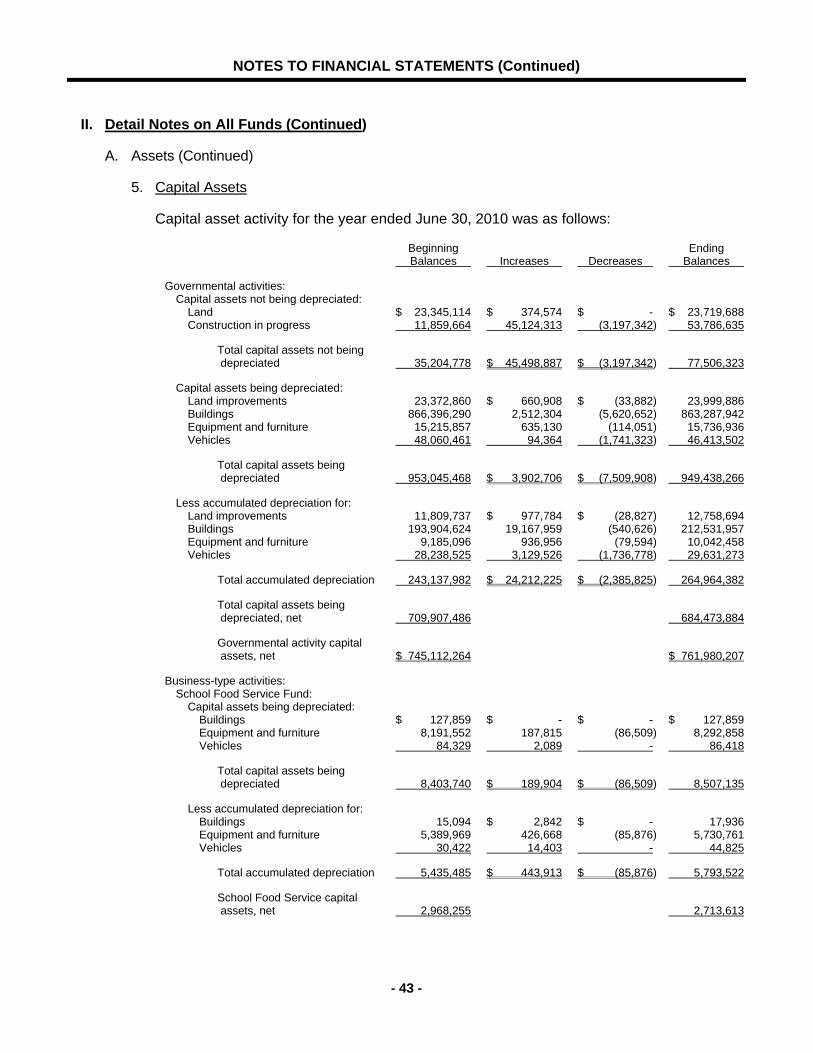
NOTES TO FINANCIAL STATEMENTS (Continued)
- 43 -
II. Detail Notes on All Funds (Continued)
A. Assets (Continued)
5. Capital Assets
Capital asset activity for the year ended June 30, 2010 was as follows:
Beginning Ending Balances Increases Decreases Balances
Governmental activities: Capital assets not being depreciated: Land $ 23,345,114 $ 374,574 $ - $ 23,719,688 Construction in progress 11,859,664 45,124,313 (3,197,342) 53,786,635
Total capital assets not being depreciated 35,204,778 $ 45,498,887 $ (3,197,342) 77,506,323
Capital assets being depreciated: Land improvements 23,372,860 $ 660,908 $ (33,882) 23,999,886 Buildings 866,396,290 2,512,304 (5,620,652) 863,287,942 Equipment and furniture 15,215,857 635,130 (114,051) 15,736,936 Vehicles 48,060,461 94,364 (1,741,323) 46,413,502
Total capital assets being depreciated 953,045,468 $ 3,902,706 $ (7,509,908) 949,438,266
Less accumulated depreciation for: Land improvements 11,809,737 $ 977,784 $ (28,827) 12,758,694 Buildings 193,904,624 19,167,959 (540,626) 212,531,957 Equipment and furniture 9,185,096 936,956 (79,594) 10,042,458 Vehicles 28,238,525 3,129,526 (1,736,778) 29,631,273
Total accumulated depreciation 243,137,982 $ 24,212,225 $ (2,385,825) 264,964,382
Total capital assets being depreciated, net 709,907,486 684,473,884
Governmental activity capital assets, net $ 745,112,264 $ 761,980,207
Business-type activities: School Food Service Fund: Capital assets being depreciated: Buildings $ 127,859 $ - $ - $ 127,859 Equipment and furniture 8,191,552 187,815 (86,509) 8,292,858 Vehicles 84,329 2,089 - 86,418
Total capital assets being depreciated 8,403,740 $ 189,904 $ (86,509) 8,507,135
Less accumulated depreciation for: Buildings 15,094 $ 2,842 $ - 17,936 Equipment and furniture 5,389,969 426,668 (85,876) 5,730,761 Vehicles 30,422 14,403 - 44,825
Total accumulated depreciation 5,435,485 $ 443,913 $ (85,876) 5,793,522
School Food Service capital assets, net 2,968,255 2,713,613
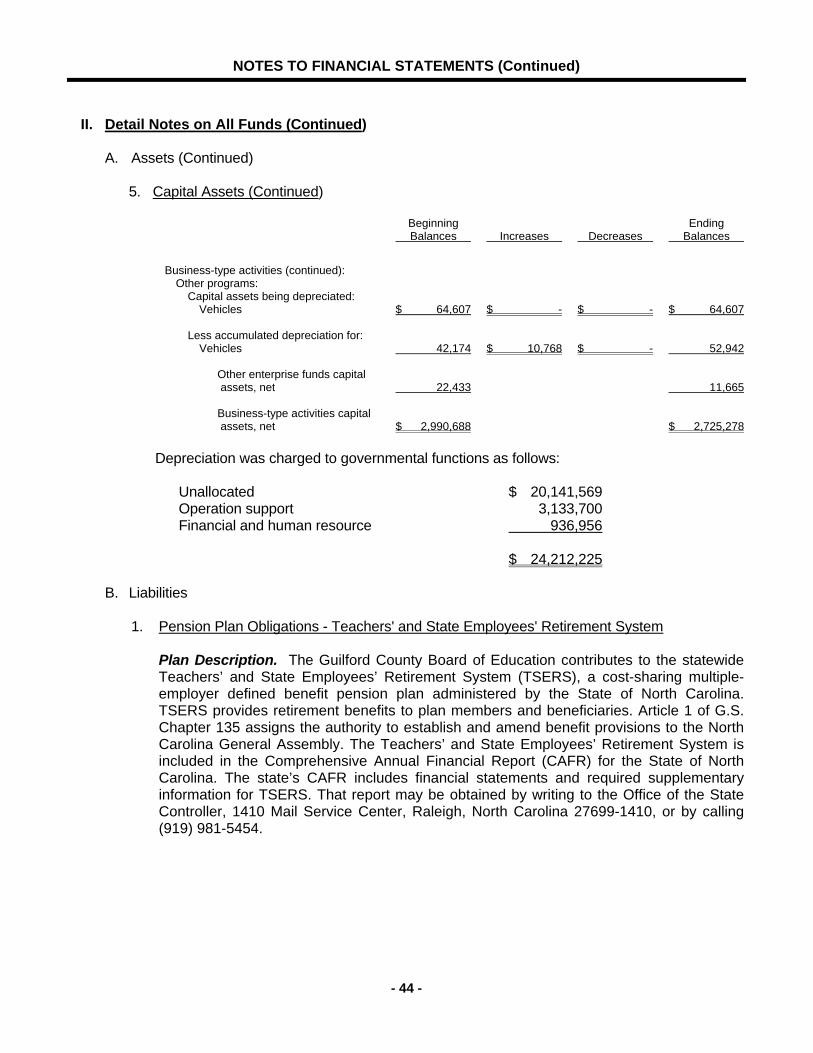
NOTES TO FINANCIAL STATEMENTS (Continued)
- 44 -
II. Detail Notes on All Funds (Continued) A. Assets (Continued) 5. Capital Assets (Continued) Beginning Ending Balances Increases Decreases Balances
Business-type activities (continued): Other programs: Capital assets being depreciated: Vehicles $ 64,607 $ - $ - $ 64,607 Less accumulated depreciation for: Vehicles 42,174 $ 10,768 $ - 52,942 Other enterprise funds capital assets, net 22,433 11,665 Business-type activities capital assets, net $ 2,990,688 $ 2,725,278
Depreciation was charged to governmental functions as follows: Unallocated $ 20,141,569 Operation support 3,133,700 Financial and human resource 936,956 $ 24,212,225 B. Liabilities 1. Pension Plan Obligations - Teachers' and State Employees' Retirement System
Plan Description. The Guilford County Board of Education contributes to the statewide Teachers’ and State Employees’ Retirement System (TSERS), a cost-sharing multiple-employer defined benefit pension plan administered by the State of North Carolina. TSERS provides retirement benefits to plan members and beneficiaries. Article 1 of G.S. Chapter 135 assigns the authority to establish and amend benefit provisions to the North Carolina General Assembly. The Teachers’ and State Employees’ Retirement System is included in the Comprehensive Annual Financial Report (CAFR) for the State of North Carolina. The state’s CAFR includes financial statements and required supplementary information for TSERS. That report may be obtained by writing to the Office of the State Controller, 1410 Mail Service Center, Raleigh, North Carolina 27699-1410, or by calling (919) 981-5454.
NOTES TO FINANCIAL STATEMENTS (Continued)
- 45 -
II. Detail Notes on All Funds (Continued) B. Liabilities (Continued)
1. Pension Plan Obligations - Teachers' and State Employees' Retirement System (Continued) Funding Policy. Plan members are required to contribute 6% of their annual covered salary and the Board is required to contribute at an actuarially determined rate. The current rate is 3.57% of annual covered payroll. The contribution requirements of plan members and the Guilford County Board of Education are established and may be amended by the North Carolina General Assembly. The Board’s contributions to TSERS for the years ended June 30, 2010, 2009 and 2008 were $13,808,272, $13,498,211 and $11,309,891, respectively, equal to the required contributions for each year.
2. Other Postemployment Benefits a. Postemployment Healthcare Benefits
Plan Description. The postemployment healthcare benefits are provided through a cost-sharing multiple-employer defined benefit plan administered by the Executive Administrator and the Board of Trustees of the Comprehensive Major Medical Plan (the Plan). The Executive Administrator and the Board of Trustees of the Plan establishes premium rates except as may be established by the General Assembly in an appropriation act. The Plan's benefit and contribution provisions are established by Chapter 135-7, Article 1, and Chapter 135, Article 3 of the General Statutes and may be amended only by the North Carolina General Assembly. By General Statute, the Plan accumulates contributions from employers and any earnings on those contributions in the Retiree Health Benefit Fund. These assets shall be used to provide health benefits to retired and disabled employees and their applicable beneficiaries. These contributions are irrevocable. Also by law, these assets are not subject to the claims of creditors of the employers making contributions to the Plan. The state of North Carolina issues a publicly available financial report that includes financial statements and required supplementary information for the State's Comprehensive Major Medical Plan (also, referred to as the State Health Plan). An electronic version of this report is available by accessing the North Carolina Office of the State Controller's Internet home page http://www.ncosc.net/ and clicking on "Financial Reports," or by calling the State Controller's Financial Reporting Section at (919) 981-5454. Funding Policy. The Comprehensive Major Medical Plan is administered by the Executive Administrator and Board of Trustees of the Plan, which establish premium rates except as may be established by the General Assembly in an appropriation act. The healthcare benefits for retired and disabled employees are the same as for active employees, except that the coverage becomes secondary when former employees become eligible for Medicare. For employees first hired on
NOTES TO FINANCIAL STATEMENTS (Continued)
- 46 -
II. Detail Notes on All Funds (Continued) B. Liabilities (Continued) 2. Other Postemployment Benefits (Continued) a. Postemployment Healthcare Benefits (Continued)
and after October 1, 2006, future coverage as retired employees is subject to the requirement that future retirees have 20 or more years of retirement service credit in order to receive coverage on a noncontributory basis. Employees first hired on and after October 1, 2006 with 10, but less than 20, years of retirement service credit are eligible for coverage on a partially contributory basis. For such retirees, the state will pay 50% of the State Health Plan's total noncontributory premium. For employees hired before October 1, 2006, healthcare benefits are provided to retirees (at no charge to the retirees) who have at least five years of contributing retirement membership prior to disability or retirement. In addition, persons who became surviving spouses of retirees prior to October 1, 1986, receive the same coverage as retirees at the state's expense. Contributions are determined as a percentage of covered monthly payroll. Annually, the monthly contribution rates to the Plan, which are intended to finance benefits and administrative expenses on a pay-as-you-go basis, are determined by the General Assembly in the Appropriations Bill. For the fiscal years ended June 30, 2010, 2009 and 2008, the School Board paid all annual required contributions to the Plan for postemployment healthcare benefits of $17,405,385, $16,471,032 and $15,203,459, respectively. These contributions represented 4.50%, 4.10% and 4.10% of covered payroll, respectively.
b. Long-Term Disability Benefits
Plan Description. Short-term and long-term disability benefits are provided through the Disability Income Plan of North Carolina (DIPNC), a cost-sharing, multiple-employer defined benefit plan. The DIPNC is administered by the Board of Trustees of the Teachers' and State Employees' Retirement System. Long-term disability benefits are payable as an other postemployment benefit from DIPNC after the conclusion of the short-term disability period or after salary continuation payments cease, whichever is later, for as long as an employee is disabled. Benefit and contribution provision are established by Chapter 135, Article 6, of the General Statutes and may be amended only by the North Carolina General Assembly. The Plan accumulates contributions from employees and any earnings on those contributions in the Disability Income Plan Trust Fund. The Plan does not provide for automatic post-retirement benefit increases. The state of North Carolina issues a publicly available financial report that includes financial statements and required supplementary information for the DIPNC. An electronic version of this report is available by accessing the North Carolina Office of the State Controller's Internet home page http://www.ncosc.net/ and clicking on "Financial Reports," or by calling the State Controller's Financial Reporting Section at (919) 981-5454.
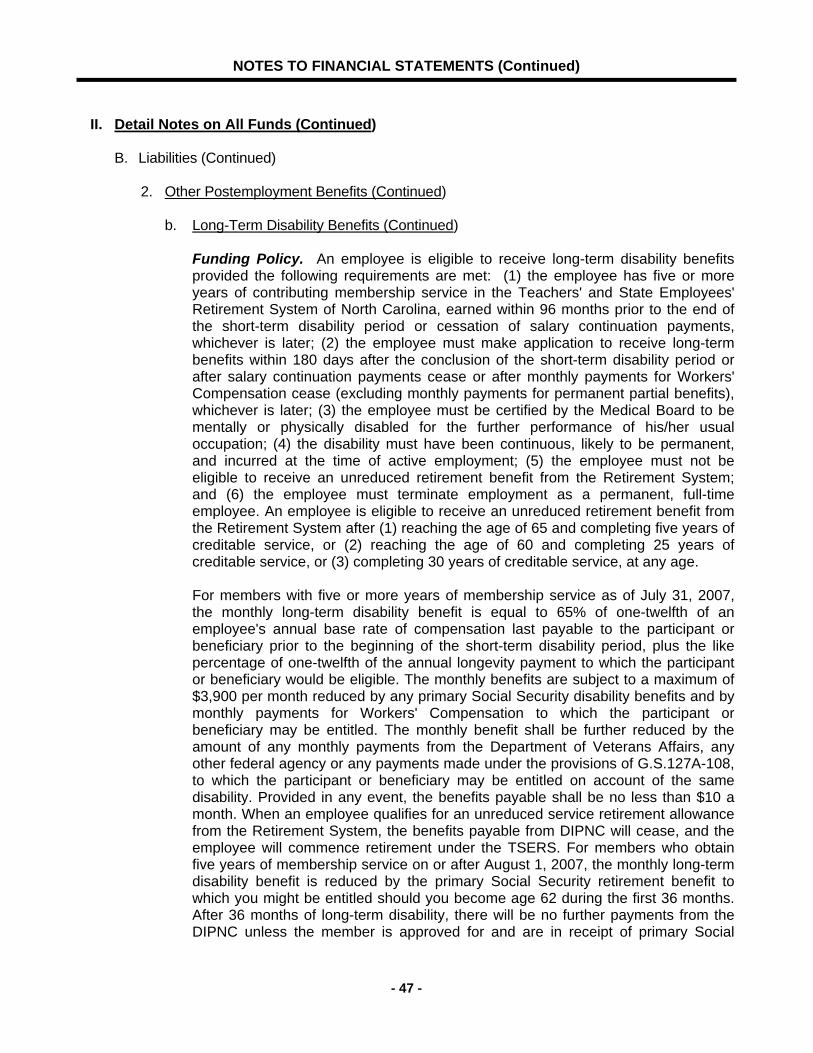
NOTES TO FINANCIAL STATEMENTS (Continued)
- 47 -
II. Detail Notes on All Funds (Continued) B. Liabilities (Continued) 2. Other Postemployment Benefits (Continued) b. Long-Term Disability Benefits (Continued)
Funding Policy. An employee is eligible to receive long-term disability benefits provided the following requirements are met: (1) the employee has five or more years of contributing membership service in the Teachers' and State Employees' Retirement System of North Carolina, earned within 96 months prior to the end of the short-term disability period or cessation of salary continuation payments, whichever is later; (2) the employee must make application to receive long-term benefits within 180 days after the conclusion of the short-term disability period or after salary continuation payments cease or after monthly payments for Workers' Compensation cease (excluding monthly payments for permanent partial benefits), whichever is later; (3) the employee must be certified by the Medical Board to be mentally or physically disabled for the further performance of his/her usual occupation; (4) the disability must have been continuous, likely to be permanent, and incurred at the time of active employment; (5) the employee must not be eligible to receive an unreduced retirement benefit from the Retirement System; and (6) the employee must terminate employment as a permanent, full-time employee. An employee is eligible to receive an unreduced retirement benefit from the Retirement System after (1) reaching the age of 65 and completing five years of creditable service, or (2) reaching the age of 60 and completing 25 years of creditable service, or (3) completing 30 years of creditable service, at any age.
For members with five or more years of membership service as of July 31, 2007, the monthly long-term disability benefit is equal to 65% of one-twelfth of an employee's annual base rate of compensation last payable to the participant or beneficiary prior to the beginning of the short-term disability period, plus the like percentage of one-twelfth of the annual longevity payment to which the participant or beneficiary would be eligible. The monthly benefits are subject to a maximum of $3,900 per month reduced by any primary Social Security disability benefits and by monthly payments for Workers' Compensation to which the participant or beneficiary may be entitled. The monthly benefit shall be further reduced by the amount of any monthly payments from the Department of Veterans Affairs, any other federal agency or any payments made under the provisions of G.S.127A-108, to which the participant or beneficiary may be entitled on account of the same disability. Provided in any event, the benefits payable shall be no less than $10 a month. When an employee qualifies for an unreduced service retirement allowance from the Retirement System, the benefits payable from DIPNC will cease, and the employee will commence retirement under the TSERS. For members who obtain five years of membership service on or after August 1, 2007, the monthly long-term disability benefit is reduced by the primary Social Security retirement benefit to which you might be entitled should you become age 62 during the first 36 months. After 36 months of long-term disability, there will be no further payments from the DIPNC unless the member is approved for and are in receipt of primary Social
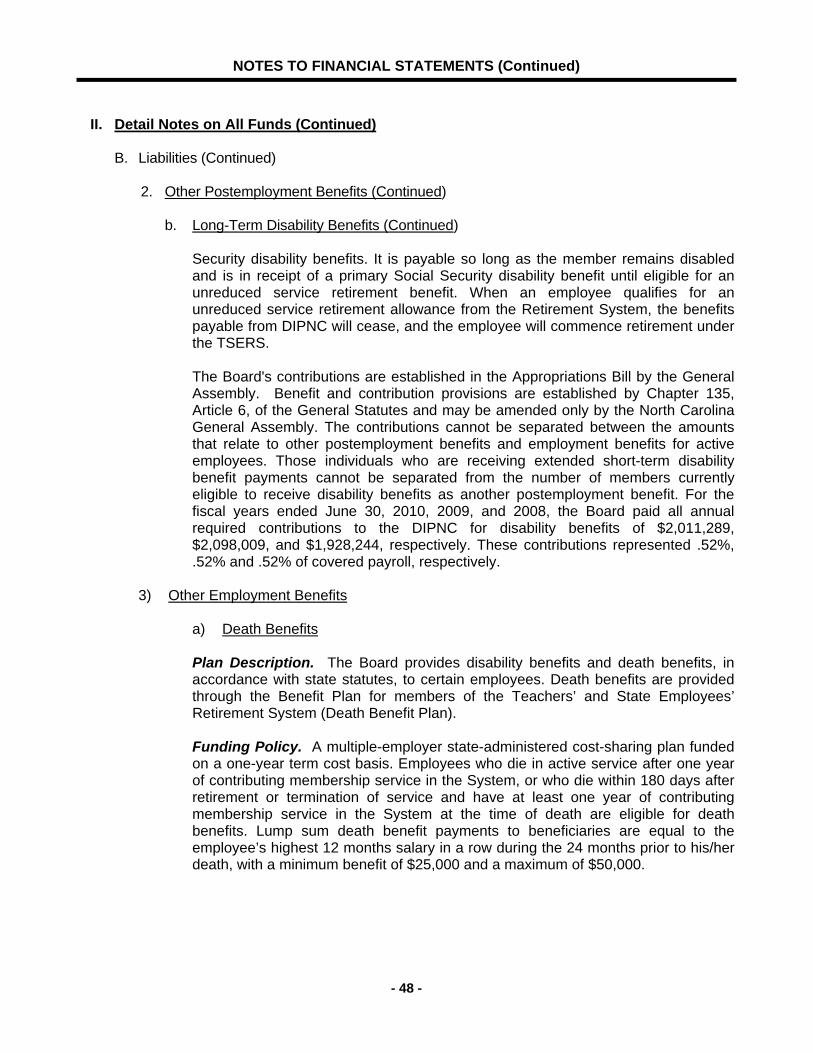
NOTES TO FINANCIAL STATEMENTS (Continued)
- 48 -
II. Detail Notes on All Funds (Continued) B. Liabilities (Continued) 2. Other Postemployment Benefits (Continued) b. Long-Term Disability Benefits (Continued)
Security disability benefits. It is payable so long as the member remains disabled and is in receipt of a primary Social Security disability benefit until eligible for an unreduced service retirement benefit. When an employee qualifies for an unreduced service retirement allowance from the Retirement System, the benefits payable from DIPNC will cease, and the employee will commence retirement under the TSERS.
The Board's contributions are established in the Appropriations Bill by the General Assembly. Benefit and contribution provisions are established by Chapter 135, Article 6, of the General Statutes and may be amended only by the North Carolina General Assembly. The contributions cannot be separated between the amounts that relate to other postemployment benefits and employment benefits for active employees. Those individuals who are receiving extended short-term disability benefit payments cannot be separated from the number of members currently eligible to receive disability benefits as another postemployment benefit. For the fiscal years ended June 30, 2010, 2009, and 2008, the Board paid all annual required contributions to the DIPNC for disability benefits of $2,011,289, $2,098,009, and $1,928,244, respectively. These contributions represented .52%, .52% and .52% of covered payroll, respectively.
3) Other Employment Benefits
a) Death Benefits Plan Description. The Board provides disability benefits and death benefits, in accordance with state statutes, to certain employees. Death benefits are provided through the Benefit Plan for members of the Teachers’ and State Employees’ Retirement System (Death Benefit Plan). Funding Policy. A multiple-employer state-administered cost-sharing plan funded on a one-year term cost basis. Employees who die in active service after one year of contributing membership service in the System, or who die within 180 days after retirement or termination of service and have at least one year of contributing membership service in the System at the time of death are eligible for death benefits. Lump sum death benefit payments to beneficiaries are equal to the employee’s highest 12 months salary in a row during the 24 months prior to his/her death, with a minimum benefit of $25,000 and a maximum of $50,000.
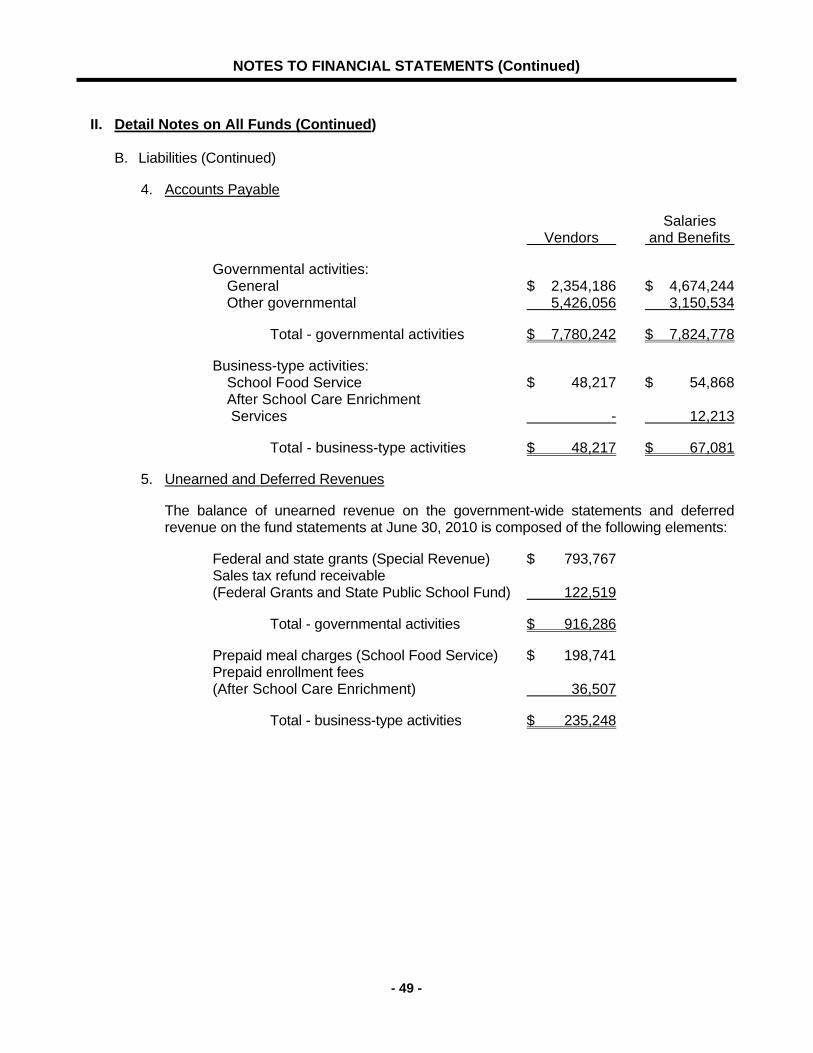
NOTES TO FINANCIAL STATEMENTS (Continued)
- 49 -
II. Detail Notes on All Funds (Continued) B. Liabilities (Continued)
4. Accounts Payable
Salaries Vendors and Benefits
Governmental activities: General $ 2,354,186 $ 4,674,244 Other governmental 5,426,056 3,150,534
Total - governmental activities $ 7,780,242 $ 7,824,778
Business-type activities: School Food Service $ 48,217 $ 54,868 After School Care Enrichment Services - 12,213
Total - business-type activities $ 48,217 $ 67,081
5. Unearned and Deferred Revenues
The balance of unearned revenue on the government-wide statements and deferred revenue on the fund statements at June 30, 2010 is composed of the following elements:
Federal and state grants (Special Revenue) $ 793,767 Sales tax refund receivable (Federal Grants and State Public School Fund) 122,519
Total - governmental activities $ 916,286
Prepaid meal charges (School Food Service) $ 198,741 Prepaid enrollment fees (After School Care Enrichment) 36,507
Total - business-type activities $ 235,248
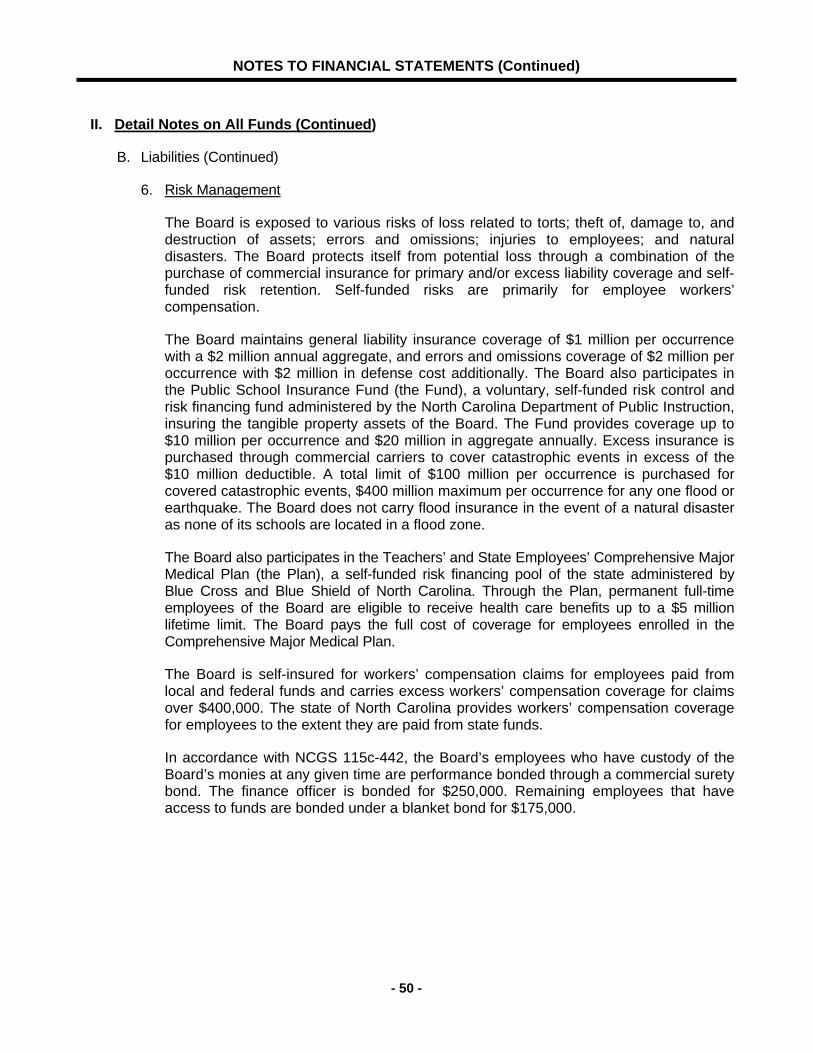
NOTES TO FINANCIAL STATEMENTS (Continued)
- 50 -
II. Detail Notes on All Funds (Continued)
B. Liabilities (Continued)
6. Risk Management
The Board is exposed to various risks of loss related to torts; theft of, damage to, and destruction of assets; errors and omissions; injuries to employees; and natural disasters. The Board protects itself from potential loss through a combination of the purchase of commercial insurance for primary and/or excess liability coverage and self-funded risk retention. Self-funded risks are primarily for employee workers’ compensation.
The Board maintains general liability insurance coverage of $1 million per occurrence with a $2 million annual aggregate, and errors and omissions coverage of $2 million per occurrence with $2 million in defense cost additionally. The Board also participates in the Public School Insurance Fund (the Fund), a voluntary, self-funded risk control and risk financing fund administered by the North Carolina Department of Public Instruction, insuring the tangible property assets of the Board. The Fund provides coverage up to $10 million per occurrence and $20 million in aggregate annually. Excess insurance is purchased through commercial carriers to cover catastrophic events in excess of the $10 million deductible. A total limit of $100 million per occurrence is purchased for covered catastrophic events, $400 million maximum per occurrence for any one flood or earthquake. The Board does not carry flood insurance in the event of a natural disaster as none of its schools are located in a flood zone.
The Board also participates in the Teachers’ and State Employees’ Comprehensive Major Medical Plan (the Plan), a self-funded risk financing pool of the state administered by Blue Cross and Blue Shield of North Carolina. Through the Plan, permanent full-time employees of the Board are eligible to receive health care benefits up to a $5 million lifetime limit. The Board pays the full cost of coverage for employees enrolled in the Comprehensive Major Medical Plan.
The Board is self-insured for workers’ compensation claims for employees paid from local and federal funds and carries excess workers’ compensation coverage for claims over $400,000. The state of North Carolina provides workers’ compensation coverage for employees to the extent they are paid from state funds.
In accordance with NCGS 115c-442, the Board’s employees who have custody of the Board’s monies at any given time are performance bonded through a commercial surety bond. The finance officer is bonded for $250,000. Remaining employees that have access to funds are bonded under a blanket bond for $175,000.
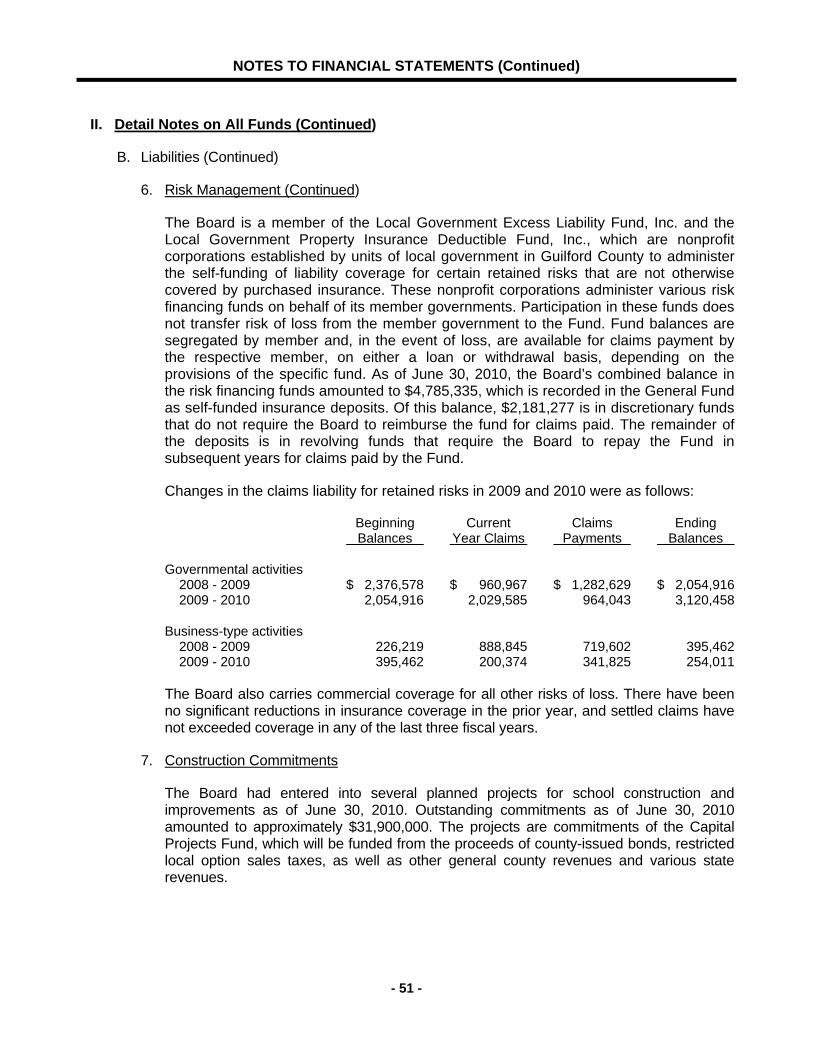
NOTES TO FINANCIAL STATEMENTS (Continued)
- 51 -
II. Detail Notes on All Funds (Continued)
B. Liabilities (Continued)
6. Risk Management (Continued)
The Board is a member of the Local Government Excess Liability Fund, Inc. and the Local Government Property Insurance Deductible Fund, Inc., which are nonprofit corporations established by units of local government in Guilford County to administer the self-funding of liability coverage for certain retained risks that are not otherwise covered by purchased insurance. These nonprofit corporations administer various risk financing funds on behalf of its member governments. Participation in these funds does not transfer risk of loss from the member government to the Fund. Fund balances are segregated by member and, in the event of loss, are available for claims payment by the respective member, on either a loan or withdrawal basis, depending on the provisions of the specific fund. As of June 30, 2010, the Board’s combined balance in the risk financing funds amounted to $4,785,335, which is recorded in the General Fund as self-funded insurance deposits. Of this balance, $2,181,277 is in discretionary funds that do not require the Board to reimburse the fund for claims paid. The remainder of the deposits is in revolving funds that require the Board to repay the Fund in subsequent years for claims paid by the Fund.
Changes in the claims liability for retained risks in 2009 and 2010 were as follows:
Beginning Current Claims Ending Balances Year Claims Payments Balances
Governmental activities 2008 - 2009 $ 2,376,578 $ 960,967 $ 1,282,629 $ 2,054,916 2009 - 2010 2,054,916 2,029,585 964,043 3,120,458
Business-type activities 2008 - 2009 226,219 888,845 719,602 395,462 2009 - 2010 395,462 200,374 341,825 254,011
The Board also carries commercial coverage for all other risks of loss. There have been no significant reductions in insurance coverage in the prior year, and settled claims have not exceeded coverage in any of the last three fiscal years.
7. Construction Commitments
The Board had entered into several planned projects for school construction and improvements as of June 30, 2010. Outstanding commitments as of June 30, 2010 amounted to approximately $31,900,000. The projects are commitments of the Capital Projects Fund, which will be funded from the proceeds of county-issued bonds, restricted local option sales taxes, as well as other general county revenues and various state revenues.
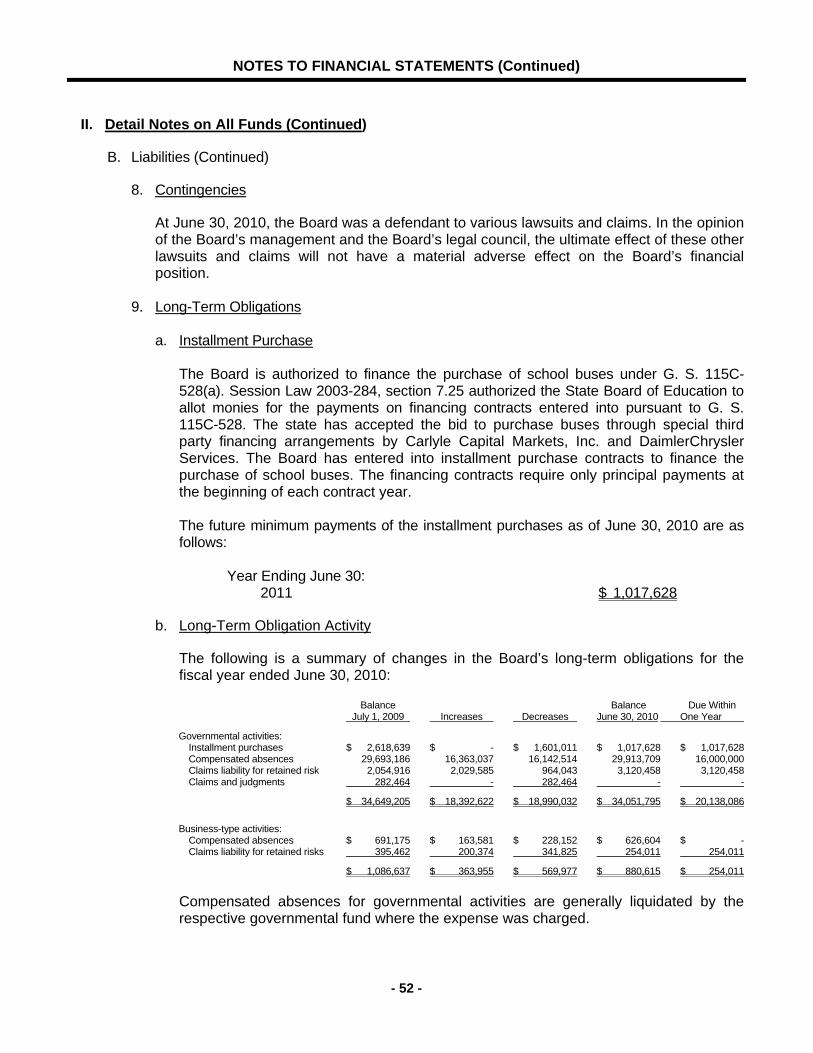
NOTES TO FINANCIAL STATEMENTS (Continued)
- 52 -
II. Detail Notes on All Funds (Continued)
B. Liabilities (Continued)
8. Contingencies
At June 30, 2010, the Board was a defendant to various lawsuits and claims. In the opinion of the Board’s management and the Board’s legal council, the ultimate effect of these other lawsuits and claims will not have a material adverse effect on the Board’s financial position.
9. Long-Term Obligations a. Installment Purchase The Board is authorized to finance the purchase of school buses under G. S. 115C-
528(a). Session Law 2003-284, section 7.25 authorized the State Board of Education to allot monies for the payments on financing contracts entered into pursuant to G. S. 115C-528. The state has accepted the bid to purchase buses through special third party financing arrangements by Carlyle Capital Markets, Inc. and DaimlerChrysler Services. The Board has entered into installment purchase contracts to finance the purchase of school buses. The financing contracts require only principal payments at the beginning of each contract year.
The future minimum payments of the installment purchases as of June 30, 2010 are as
follows: Year Ending June 30: 2011 $ 1,017,628
b. Long-Term Obligation Activity
The following is a summary of changes in the Board’s long-term obligations for the fiscal year ended June 30, 2010:
Balance Balance Due Within July 1, 2009 Increases Decreases June 30, 2010 One Year
Governmental activities: Installment purchases $ 2,618,639 $ - $ 1,601,011 $ 1,017,628 $ 1,017,628 Compensated absences 29,693,186 16,363,037 16,142,514 29,913,709 16,000,000 Claims liability for retained risk 2,054,916 2,029,585 964,043 3,120,458 3,120,458 Claims and judgments 282,464 - 282,464 - -
$ 34,649,205 $ 18,392,622 $ 18,990,032 $ 34,051,795 $ 20,138,086
Business-type activities: Compensated absences $ 691,175 $ 163,581 $ 228,152 $ 626,604 $ - Claims liability for retained risks 395,462 200,374 341,825 254,011 254,011
$ 1,086,637 $ 363,955 $ 569,977 $ 880,615 $ 254,011
Compensated absences for governmental activities are generally liquidated by the respective governmental fund where the expense was charged.
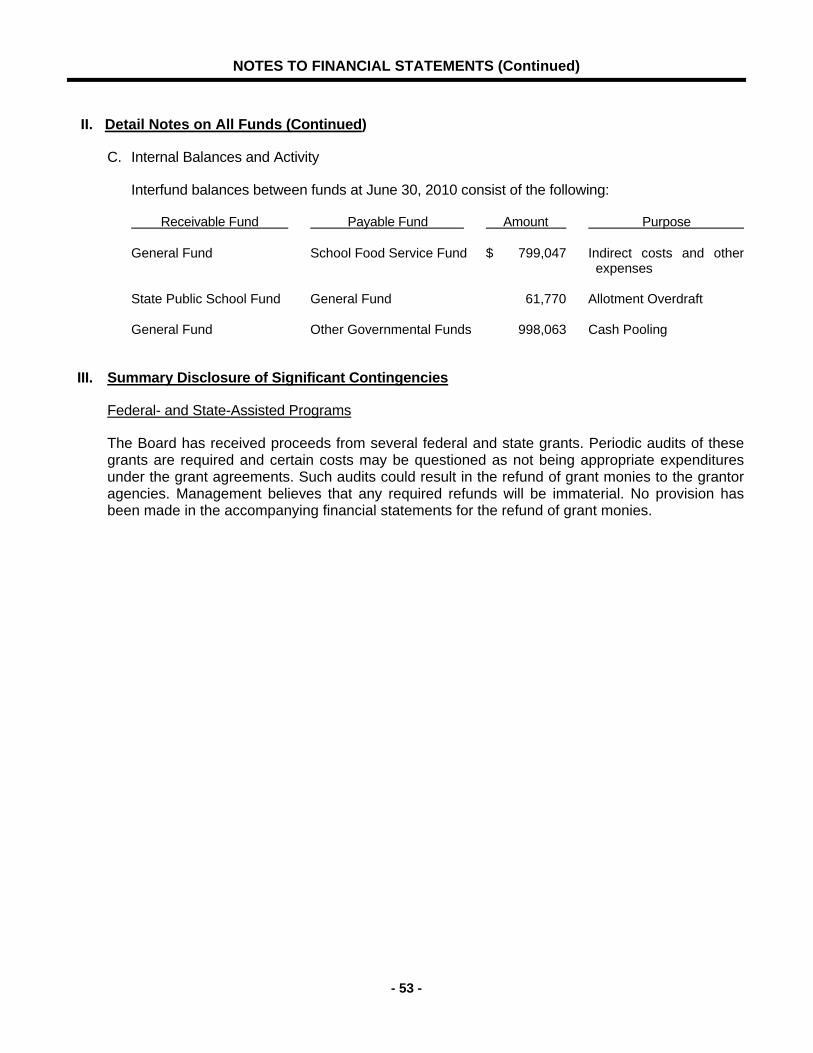
NOTES TO FINANCIAL STATEMENTS (Continued)
- 53 -
II. Detail Notes on All Funds (Continued)
C. Internal Balances and Activity
Interfund balances between funds at June 30, 2010 consist of the following:
Receivable Fund Payable Fund Amount Purpose
General Fund School Food Service Fund $ 799,047 Indirect costs and other expenses
State Public School Fund General Fund 61,770 Allotment Overdraft General Fund Other Governmental Funds 998,063 Cash Pooling
III. Summary Disclosure of Significant Contingencies
Federal- and State-Assisted Programs
The Board has received proceeds from several federal and state grants. Periodic audits of these grants are required and certain costs may be questioned as not being appropriate expenditures under the grant agreements. Such audits could result in the refund of grant monies to the grantor agencies. Management believes that any required refunds will be immaterial. No provision has been made in the accompanying financial statements for the refund of grant monies.

- 54 -
THIS PAGE LEFT INTENTIONALLY BLANK.
- 55 -
COMBINING AND INDIVIDUAL FUND STATEMENTS AND SCHEDULES

- 56 -
THIS PAGE LEFT INTENTIONALLY BLANK.

- 57 -
The General Fund
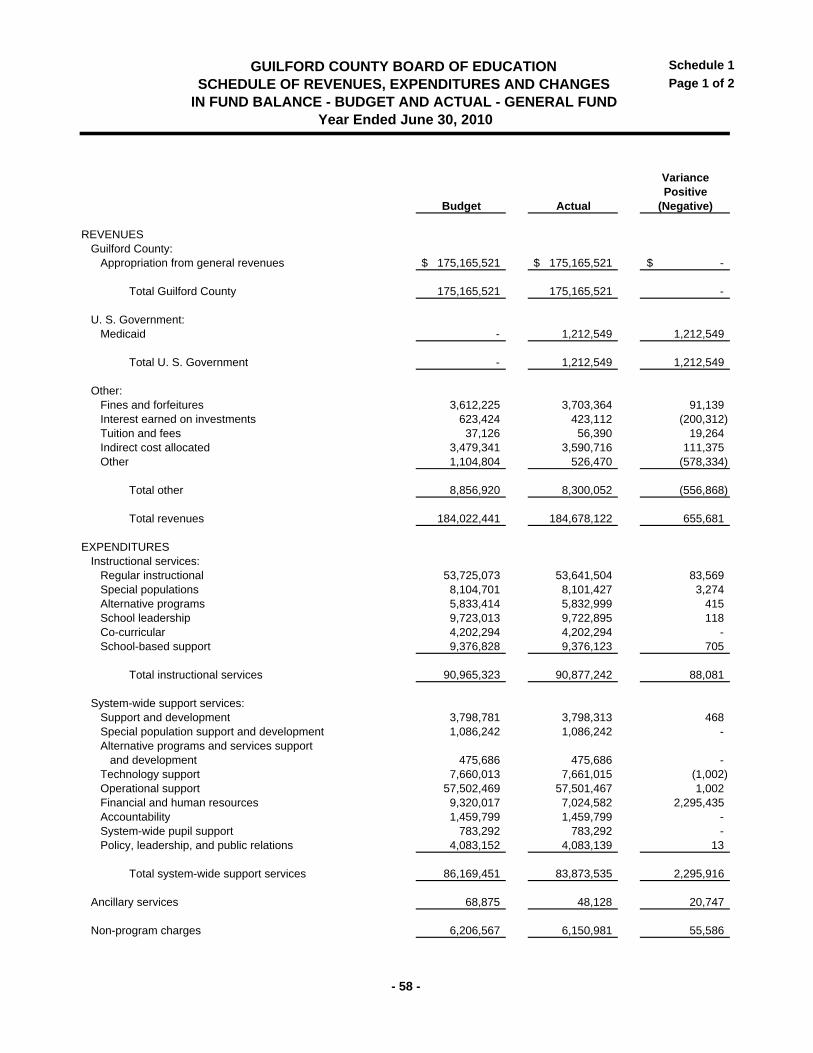
Schedule 1
Page 1 of 2
VariancePositive
Budget Actual (Negative)
REVENUESGuilford County:
Appropriation from general revenues 175,165,521$ 175,165,521$ -$
Total Guilford County 175,165,521 175,165,521 -
U. S. Government:Medicaid - 1,212,549 1,212,549
Total U. S. Government - 1,212,549 1,212,549
Other:Fines and forfeitures 3,612,225 3,703,364 91,139 Interest earned on investments 623,424 423,112 (200,312) Tuition and fees 37,126 56,390 19,264 Indirect cost allocated 3,479,341 3,590,716 111,375 Other 1,104,804 526,470 (578,334)
Total other 8,856,920 8,300,052 (556,868)
Total revenues 184,022,441 184,678,122 655,681
EXPENDITURESInstructional services:
Regular instructional 53,725,073 53,641,504 83,569 Special populations 8,104,701 8,101,427 3,274 Alternative programs 5,833,414 5,832,999 415 School leadership 9,723,013 9,722,895 118 Co-curricular 4,202,294 4,202,294 - School-based support 9,376,828 9,376,123 705
Total instructional services 90,965,323 90,877,242 88,081
System-wide support services:Support and development 3,798,781 3,798,313 468 Special population support and development 1,086,242 1,086,242 - Alternative programs and services support
and development 475,686 475,686 - Technology support 7,660,013 7,661,015 (1,002) Operational support 57,502,469 57,501,467 1,002 Financial and human resources 9,320,017 7,024,582 2,295,435 Accountability 1,459,799 1,459,799 - System-wide pupil support 783,292 783,292 - Policy, leadership, and public relations 4,083,152 4,083,139 13
Total system-wide support services 86,169,451 83,873,535 2,295,916
Ancillary services 68,875 48,128 20,747
Non-program charges 6,206,567 6,150,981 55,586
GUILFORD COUNTY BOARD OF EDUCATION SCHEDULE OF REVENUES, EXPENDITURES AND CHANGES
IN FUND BALANCE - BUDGET AND ACTUAL - GENERAL FUND Year Ended June 30, 2010
- 58 -
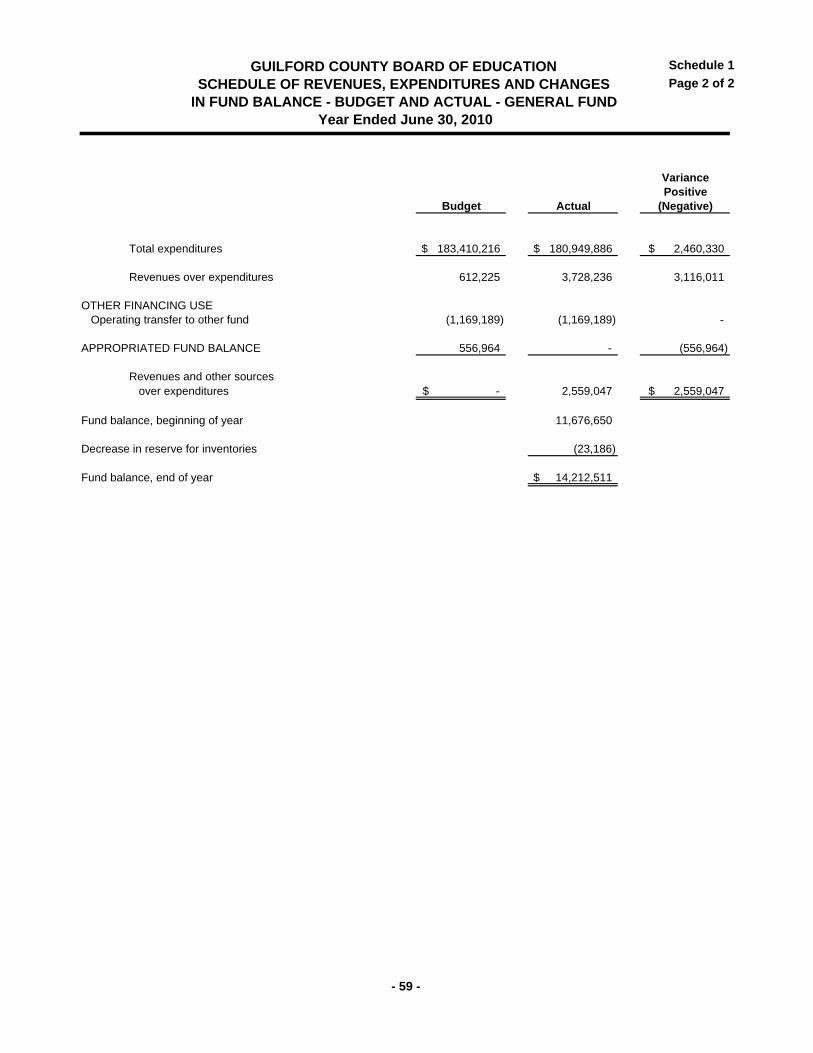
Schedule 1
Page 2 of 2
VariancePositive
Budget Actual (Negative)
GUILFORD COUNTY BOARD OF EDUCATION SCHEDULE OF REVENUES, EXPENDITURES AND CHANGES
IN FUND BALANCE - BUDGET AND ACTUAL - GENERAL FUND Year Ended June 30, 2010
Total expenditures 183,410,216$ 180,949,886$ 2,460,330$
Revenues over expenditures 612,225 3,728,236 3,116,011
OTHER FINANCING USEOperating transfer to other fund (1,169,189) (1,169,189) -
APPROPRIATED FUND BALANCE 556,964 - (556,964)
Revenues and other sources over expenditures -$ 2,559,047 2,559,047$
Fund balance, beginning of year 11,676,650
Decrease in reserve for inventories (23,186)
Fund balance, end of year 14,212,511$
- 59 -

- 60 -
THIS PAGE LEFT INTENTIONALLY BLANK.

- 61 -
The Capital Outlay Fund
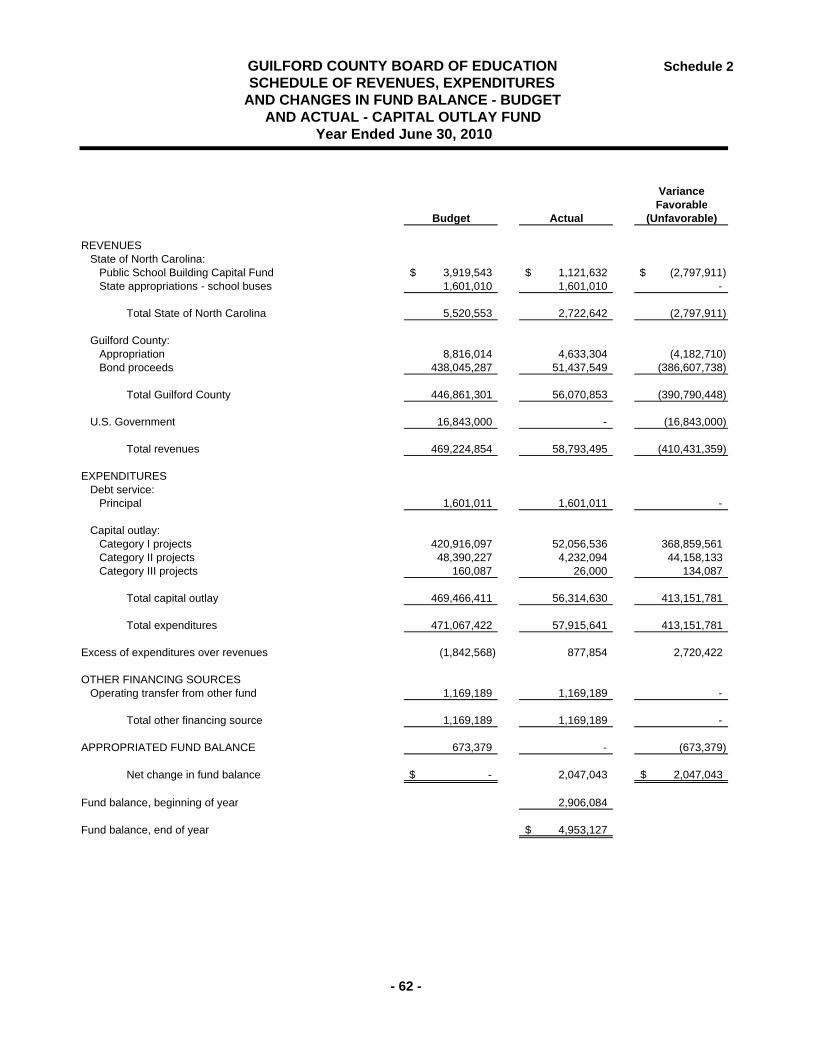
Schedule 2
VarianceFavorable
Budget Actual (Unfavorable)
REVENUESState of North Carolina:
Public School Building Capital Fund 3,919,543$ 1,121,632$ (2,797,911)$ State appropriations - school buses 1,601,010 1,601,010 -
Total State of North Carolina 5,520,553 2,722,642 (2,797,911)
Guilford County:Appropriation 8,816,014 4,633,304 (4,182,710) Bond proceeds 438,045,287 51,437,549 (386,607,738)
Total Guilford County 446,861,301 56,070,853 (390,790,448)
U.S. Government 16,843,000 - (16,843,000)
Total revenues 469,224,854 58,793,495 (410,431,359)
EXPENDITURESDebt service:
Principal 1,601,011 1,601,011 -
Capital outlay:Category I projects 420,916,097 52,056,536 368,859,561 Category II projects 48,390,227 4,232,094 44,158,133 Category III projects 160,087 26,000 134,087
Total capital outlay 469,466,411 56,314,630 413,151,781
Total expenditures 471,067,422 57,915,641 413,151,781
Excess of expenditures over revenues (1,842,568) 877,854 2,720,422
OTHER FINANCING SOURCESOperating transfer from other fund 1,169,189 1,169,189 -
Total other financing source 1,169,189 1,169,189 -
APPROPRIATED FUND BALANCE 673,379 - (673,379)
Net change in fund balance -$ 2,047,043 2,047,043$
Fund balance, beginning of year 2,906,084
Fund balance, end of year 4,953,127$
Year Ended June 30, 2010
GUILFORD COUNTY BOARD OF EDUCATION SCHEDULE OF REVENUES, EXPENDITURES
AND CHANGES IN FUND BALANCE - BUDGET AND ACTUAL - CAPITAL OUTLAY FUND
- 62 -

- 63 -
The Federal Grants Fund

- 64 -
THIS PAGE LEFT INTENTIONALLY BLANK.
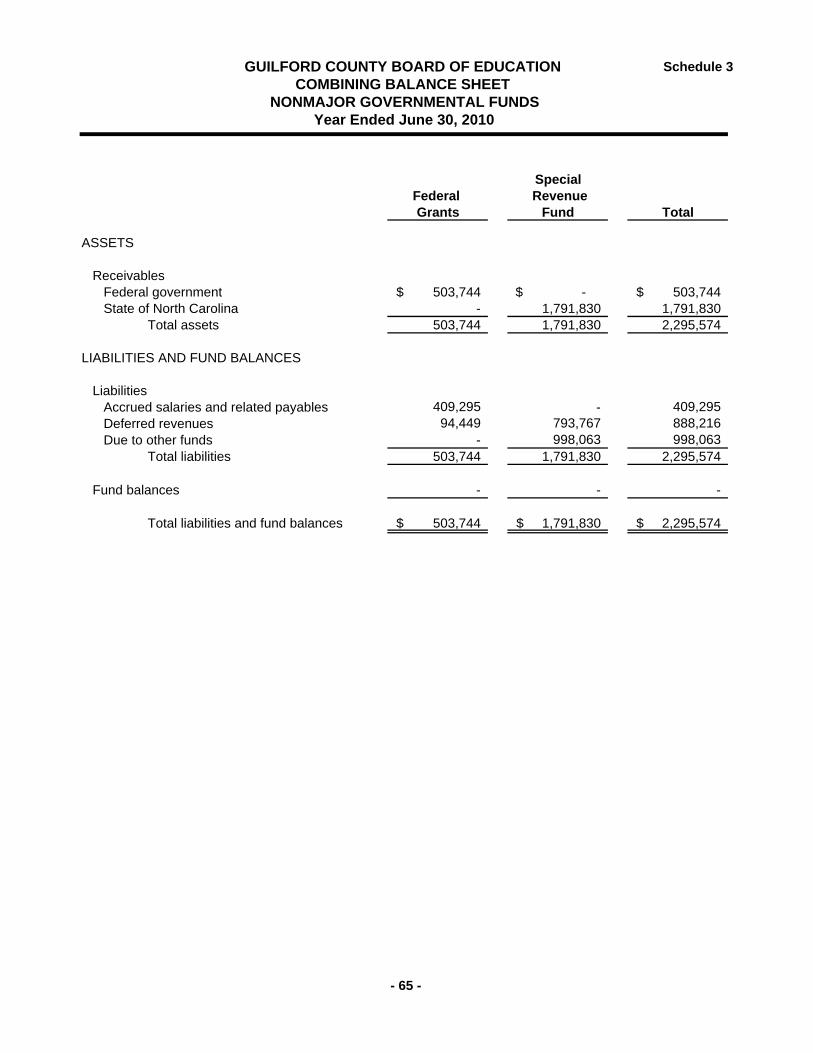
Schedule 3
SpecialFederal RevenueGrants Fund Total
ASSETS
ReceivablesFederal government 503,744$ -$ 503,744$ State of North Carolina - 1,791,830 1,791,830
Total assets 503,744 1,791,830 2,295,574
LIABILITIES AND FUND BALANCES
LiabilitiesAccrued salaries and related payables 409,295 - 409,295 Deferred revenues 94,449 793,767 888,216 Due to other funds - 998,063 998,063
Total liabilities 503,744 1,791,830 2,295,574
Fund balances - - -
Total liabilities and fund balances 503,744$ 1,791,830$ 2,295,574$
GUILFORD COUNTY BOARD OF EDUCATION COMBINING BALANCE SHEET
NONMAJOR GOVERNMENTAL FUNDS Year Ended June 30, 2010
- 65 -
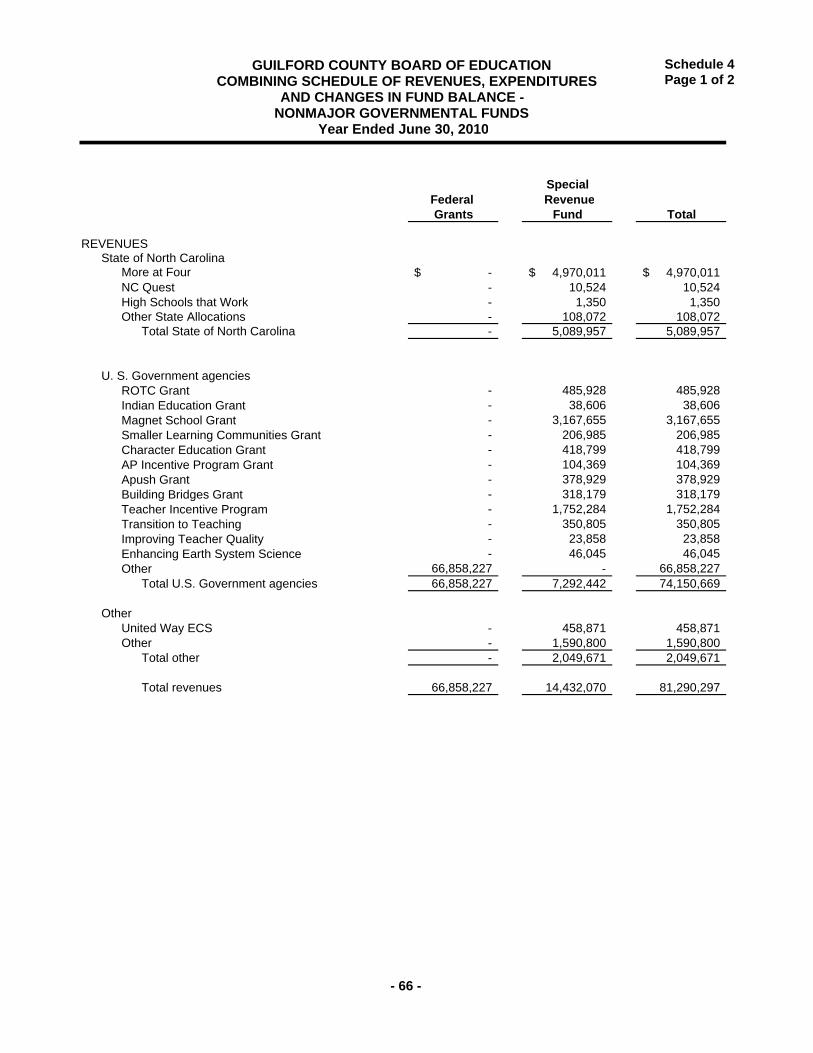
Schedule 4Page 1 of 2
SpecialFederal RevenueGrants Fund Total
REVENUESState of North Carolina
More at Four -$ 4,970,011$ 4,970,011$ NC Quest - 10,524 10,524 High Schools that Work - 1,350 1,350 Other State Allocations - 108,072 108,072
Total State of North Carolina - 5,089,957 5,089,957
U. S. Government agenciesROTC Grant - 485,928 485,928 Indian Education Grant - 38,606 38,606 Magnet School Grant - 3,167,655 3,167,655 Smaller Learning Communities Grant - 206,985 206,985 Character Education Grant - 418,799 418,799 AP Incentive Program Grant - 104,369 104,369 Apush Grant - 378,929 378,929 Building Bridges Grant - 318,179 318,179 Teacher Incentive Program - 1,752,284 1,752,284 Transition to Teaching - 350,805 350,805 Improving Teacher Quality - 23,858 23,858 Enhancing Earth System Science - 46,045 46,045 Other 66,858,227 - 66,858,227
Total U.S. Government agencies 66,858,227 7,292,442 74,150,669
OtherUnited Way ECS - 458,871 458,871 Other - 1,590,800 1,590,800
Total other - 2,049,671 2,049,671
Total revenues 66,858,227 14,432,070 81,290,297
GUILFORD COUNTY BOARD OF EDUCATION COMBINING SCHEDULE OF REVENUES, EXPENDITURES
AND CHANGES IN FUND BALANCE - NONMAJOR GOVERNMENTAL FUNDS
Year Ended June 30, 2010
- 66 -
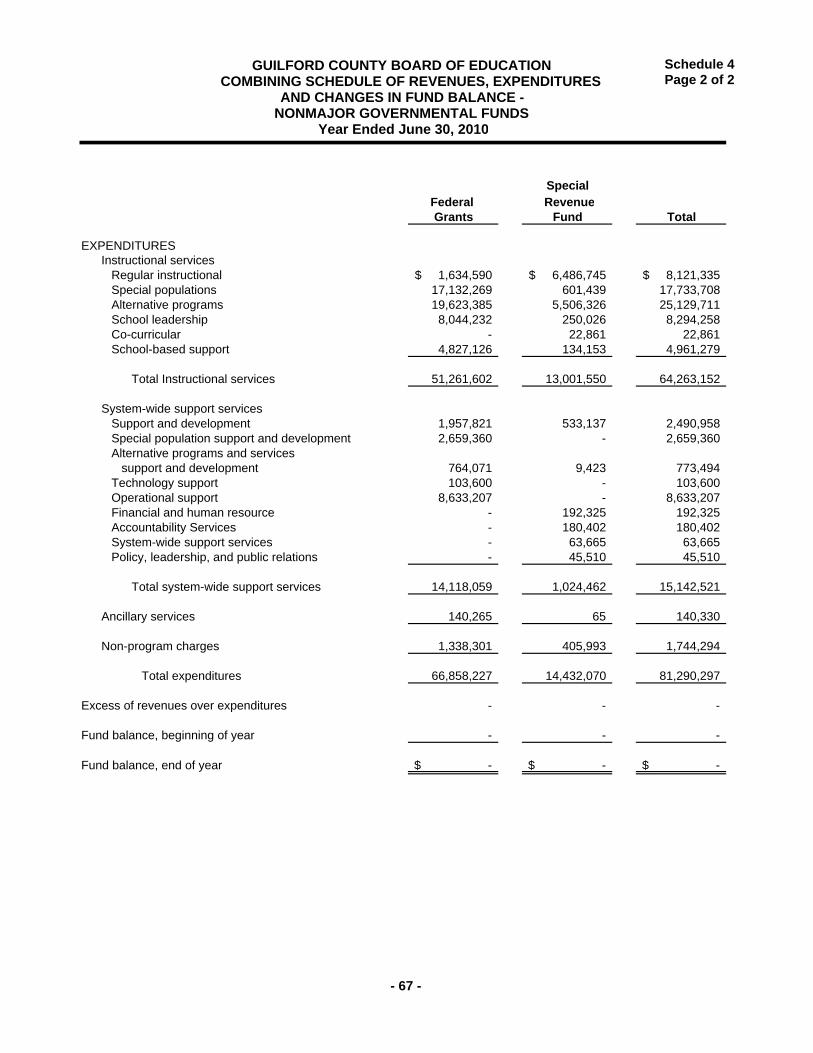
Schedule 4Page 2 of 2
SpecialFederal RevenueGrants Fund Total
EXPENDITURESInstructional services
Regular instructional 1,634,590$ 6,486,745$ 8,121,335$ Special populations 17,132,269 601,439 17,733,708 Alternative programs 19,623,385 5,506,326 25,129,711 School leadership 8,044,232 250,026 8,294,258 Co-curricular - 22,861 22,861 School-based support 4,827,126 134,153 4,961,279
Total Instructional services 51,261,602 13,001,550 64,263,152
System-wide support servicesSupport and development 1,957,821 533,137 2,490,958 Special population support and development 2,659,360 - 2,659,360 Alternative programs and services
support and development 764,071 9,423 773,494 Technology support 103,600 - 103,600 Operational support 8,633,207 - 8,633,207 Financial and human resource - 192,325 192,325 Accountability Services - 180,402 180,402 System-wide support services - 63,665 63,665 Policy, leadership, and public relations - 45,510 45,510
Total system-wide support services 14,118,059 1,024,462 15,142,521
Ancillary services 140,265 65 140,330
Non-program charges 1,338,301 405,993 1,744,294
Total expenditures 66,858,227 14,432,070 81,290,297
Excess of revenues over expenditures - - -
Fund balance, beginning of year - - -
Fund balance, end of year -$ -$ -$
GUILFORD COUNTY BOARD OF EDUCATION COMBINING SCHEDULE OF REVENUES, EXPENDITURES
AND CHANGES IN FUND BALANCE - NONMAJOR GOVERNMENTAL FUNDS
Year Ended June 30, 2010
- 67 -
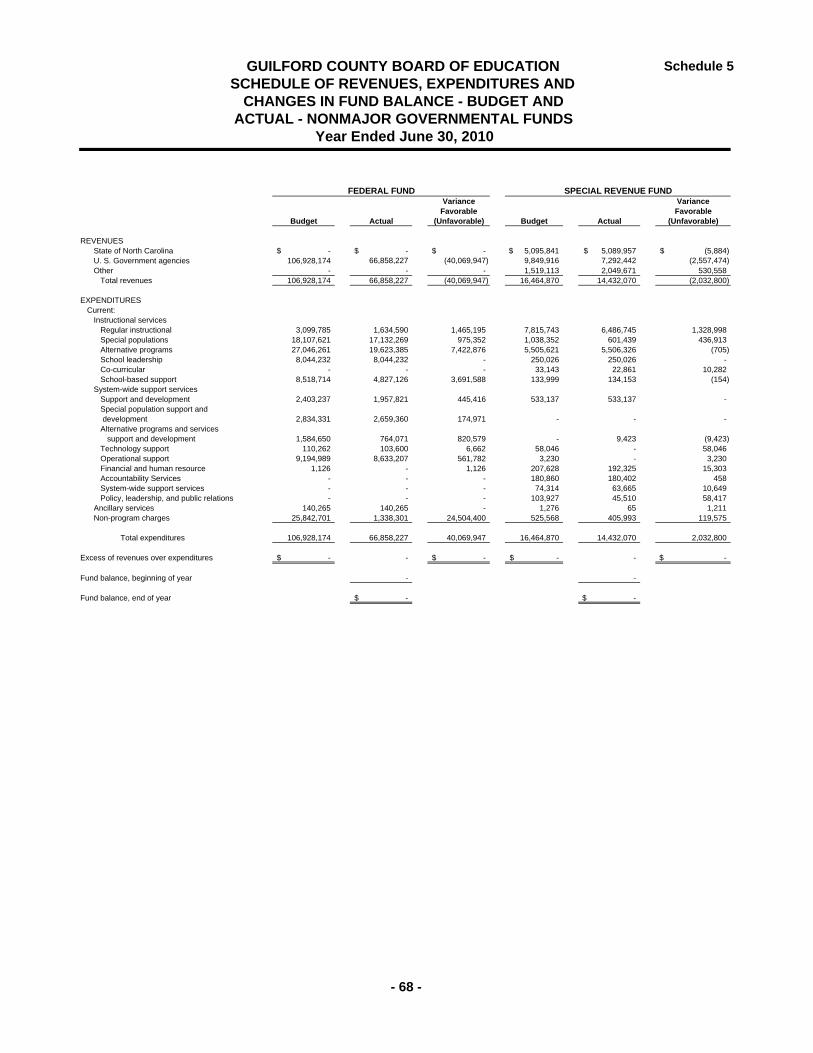
Schedule 5
Variance VarianceFavorable Favorable
Budget Actual (Unfavorable) Budget Actual (Unfavorable)
REVENUESState of North Carolina -$ -$ -$ 5,095,841$ 5,089,957$ (5,884)$ U. S. Government agencies 106,928,174 66,858,227 (40,069,947) 9,849,916 7,292,442 (2,557,474) Other - - - 1,519,113 2,049,671 530,558
Total revenues 106,928,174 66,858,227 (40,069,947) 16,464,870 14,432,070 (2,032,800)
EXPENDITURESCurrent:
Instructional servicesRegular instructional 3,099,785 1,634,590 1,465,195 7,815,743 6,486,745 1,328,998 Special populations 18,107,621 17,132,269 975,352 1,038,352 601,439 436,913 Alternative programs 27,046,261 19,623,385 7,422,876 5,505,621 5,506,326 (705) School leadership 8,044,232 8,044,232 - 250,026 250,026 - Co-curricular - - - 33,143 22,861 10,282 School-based support 8,518,714 4,827,126 3,691,588 133,999 134,153 (154)
System-wide support servicesSupport and development 2,403,237 1,957,821 445,416 533,137 533,137 - Special population support and development 2,834,331 2,659,360 174,971 - - - Alternative programs and services
support and development 1,584,650 764,071 820,579 - 9,423 (9,423) Technology support 110,262 103,600 6,662 58,046 - 58,046 Operational support 9,194,989 8,633,207 561,782 3,230 - 3,230 Financial and human resource 1,126 - 1,126 207,628 192,325 15,303 Accountability Services - - - 180,860 180,402 458 System-wide support services - - - 74,314 63,665 10,649 Policy, leadership, and public relations - - - 103,927 45,510 58,417
Ancillary services 140,265 140,265 - 1,276 65 1,211 Non-program charges 25,842,701 1,338,301 24,504,400 525,568 405,993 119,575
Total expenditures 106,928,174 66,858,227 40,069,947 16,464,870 14,432,070 2,032,800
Excess of revenues over expenditures -$ - -$ -$ - -$
Fund balance, beginning of year - -
Fund balance, end of year -$ -$
ACTUAL - NONMAJOR GOVERNMENTAL FUNDS Year Ended June 30, 2010
SPECIAL REVENUE FUNDFEDERAL FUND
GUILFORD COUNTY BOARD OF EDUCATION SCHEDULE OF REVENUES, EXPENDITURES AND
CHANGES IN FUND BALANCE - BUDGET AND
- 68 -

- 69 -
The School Activity Funds
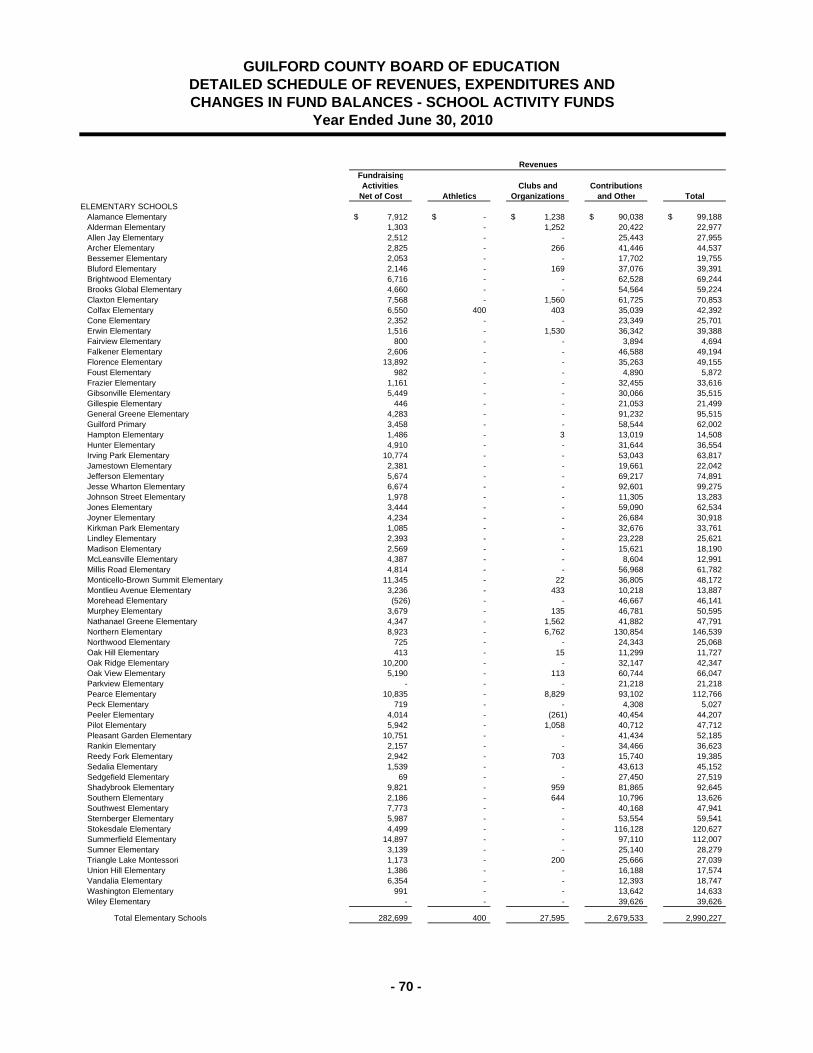
FundraisingActivities, Clubs and Contributions
Net of Cost Athletics Organizations and Other TotalELEMENTARY SCHOOLS
Alamance Elementary 7,912$ -$ 1,238$ 90,038$ 99,188$ Alderman Elementary 1,303 - 1,252 20,422 22,977 Allen Jay Elementary 2,512 - - 25,443 27,955 Archer Elementary 2,825 - 266 41,446 44,537 Bessemer Elementary 2,053 - - 17,702 19,755 Bluford Elementary 2,146 - 169 37,076 39,391 Brightwood Elementary 6,716 - - 62,528 69,244 Brooks Global Elementary 4,660 - - 54,564 59,224 Claxton Elementary 7,568 - 1,560 61,725 70,853 Colfax Elementary 6,550 400 403 35,039 42,392 Cone Elementary 2,352 - - 23,349 25,701 Erwin Elementary 1,516 - 1,530 36,342 39,388 Fairview Elementary 800 - - 3,894 4,694 Falkener Elementary 2,606 - - 46,588 49,194 Florence Elementary 13,892 - - 35,263 49,155 Foust Elementary 982 - - 4,890 5,872 Frazier Elementary 1,161 - - 32,455 33,616 Gibsonville Elementary 5,449 - - 30,066 35,515 Gillespie Elementary 446 - - 21,053 21,499 General Greene Elementary 4,283 - - 91,232 95,515 Guilford Primary 3,458 - - 58,544 62,002 Hampton Elementary 1,486 - 3 13,019 14,508 Hunter Elementary 4,910 - - 31,644 36,554 Irving Park Elementary 10,774 - - 53,043 63,817 Jamestown Elementary 2,381 - - 19,661 22,042 Jefferson Elementary 5,674 - - 69,217 74,891 Jesse Wharton Elementary 6,674 - - 92,601 99,275 Johnson Street Elementary 1,978 - - 11,305 13,283 Jones Elementary 3,444 - - 59,090 62,534 Joyner Elementary 4,234 - - 26,684 30,918 Kirkman Park Elementary 1,085 - - 32,676 33,761 Lindley Elementary 2,393 - - 23,228 25,621 Madison Elementary 2,569 - - 15,621 18,190 McLeansville Elementary 4,387 - - 8,604 12,991 Millis Road Elementary 4,814 - - 56,968 61,782 Monticello-Brown Summit Elementary 11,345 - 22 36,805 48,172 Montlieu Avenue Elementary 3,236 - 433 10,218 13,887 Morehead Elementary (526) - - 46,667 46,141 Murphey Elementary 3,679 - 135 46,781 50,595 Nathanael Greene Elementary 4,347 - 1,562 41,882 47,791 Northern Elementary 8,923 - 6,762 130,854 146,539 Northwood Elementary 725 - - 24,343 25,068 Oak Hill Elementary 413 - 15 11,299 11,727 Oak Ridge Elementary 10,200 - - 32,147 42,347 Oak View Elementary 5,190 - 113 60,744 66,047 Parkview Elementary - - - 21,218 21,218 Pearce Elementary 10,835 - 8,829 93,102 112,766 Peck Elementary 719 - - 4,308 5,027 Peeler Elementary 4,014 - (261) 40,454 44,207 Pilot Elementary 5,942 - 1,058 40,712 47,712 Pleasant Garden Elementary 10,751 - - 41,434 52,185 Rankin Elementary 2,157 - - 34,466 36,623 Reedy Fork Elementary 2,942 - 703 15,740 19,385 Sedalia Elementary 1,539 - - 43,613 45,152 Sedgefield Elementary 69 - - 27,450 27,519 Shadybrook Elementary 9,821 - 959 81,865 92,645 Southern Elementary 2,186 - 644 10,796 13,626 Southwest Elementary 7,773 - - 40,168 47,941 Sternberger Elementary 5,987 - - 53,554 59,541 Stokesdale Elementary 4,499 - - 116,128 120,627 Summerfield Elementary 14,897 - - 97,110 112,007 Sumner Elementary 3,139 - - 25,140 28,279 Triangle Lake Montessori 1,173 - 200 25,666 27,039 Union Hill Elementary 1,386 - - 16,188 17,574 Vandalia Elementary 6,354 - - 12,393 18,747 Washington Elementary 991 - - 13,642 14,633 Wiley Elementary - - - 39,626 39,626
Total Elementary Schools 282,699 400 27,595 2,679,533 2,990,227
Year Ended June 30, 2010
GUILFORD COUNTY BOARD OF EDUCATION DETAILED SCHEDULE OF REVENUES, EXPENDITURES AND CHANGES IN FUND BALANCES - SCHOOL ACTIVITY FUNDS
Revenues
- 70 -
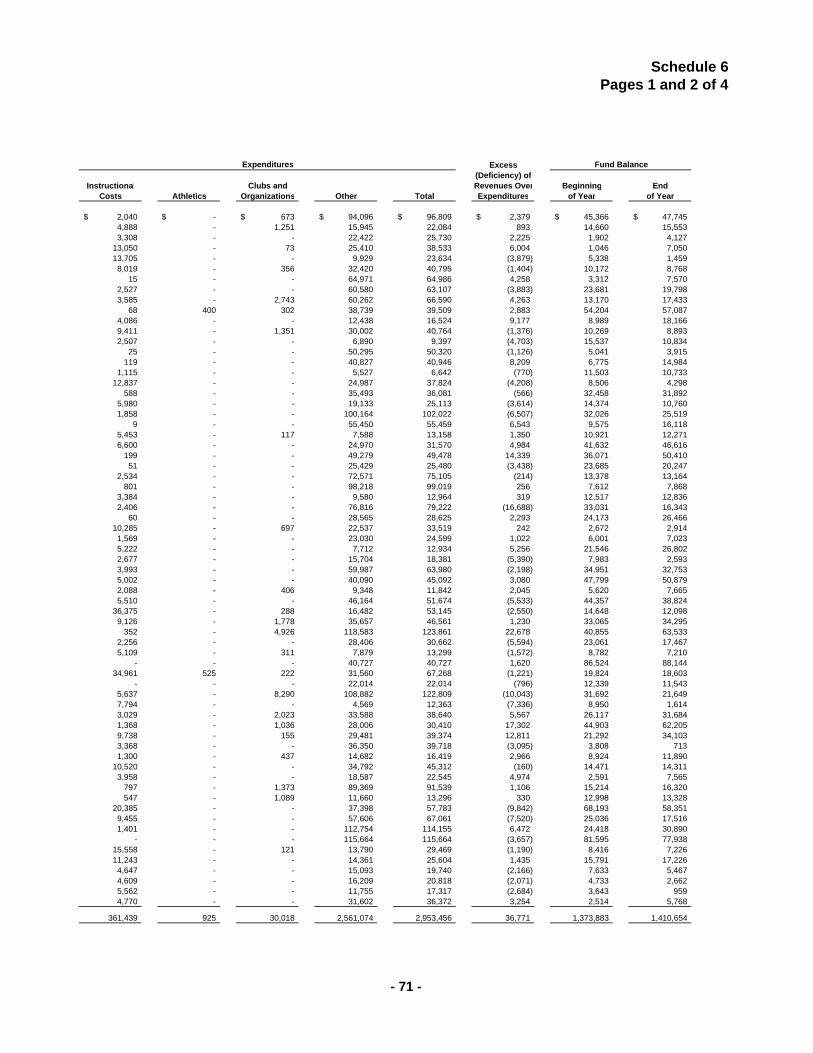
Schedule 6Pages 1 and 2 of 4
Excess(Deficiency) of
Instructional Clubs and Revenues Over Beginning EndCosts Athletics Organizations Other Total Expenditures of Year of Year
2,040$ -$ 673$ 94,096$ 96,809$ 2,379$ 45,366$ 47,745$ 4,888 - 1,251 15,945 22,084 893 14,660 15,553 3,308 - - 22,422 25,730 2,225 1,902 4,127
13,050 - 73 25,410 38,533 6,004 1,046 7,050 13,705 - - 9,929 23,634 (3,879) 5,338 1,459 8,019 - 356 32,420 40,795 (1,404) 10,172 8,768
15 - - 64,971 64,986 4,258 3,312 7,570 2,527 - - 60,580 63,107 (3,883) 23,681 19,798 3,585 - 2,743 60,262 66,590 4,263 13,170 17,433
68 400 302 38,739 39,509 2,883 54,204 57,087 4,086 - - 12,438 16,524 9,177 8,989 18,166 9,411 - 1,351 30,002 40,764 (1,376) 10,269 8,893 2,507 - - 6,890 9,397 (4,703) 15,537 10,834
25 - - 50,295 50,320 (1,126) 5,041 3,915 119 - - 40,827 40,946 8,209 6,775 14,984
1,115 - - 5,527 6,642 (770) 11,503 10,733 12,837 - - 24,987 37,824 (4,208) 8,506 4,298
588 - - 35,493 36,081 (566) 32,458 31,892 5,980 - - 19,133 25,113 (3,614) 14,374 10,760 1,858 - - 100,164 102,022 (6,507) 32,026 25,519
9 - - 55,450 55,459 6,543 9,575 16,118 5,453 - 117 7,588 13,158 1,350 10,921 12,271 6,600 - - 24,970 31,570 4,984 41,632 46,616
199 - - 49,279 49,478 14,339 36,071 50,410 51 - - 25,429 25,480 (3,438) 23,685 20,247
2,534 - - 72,571 75,105 (214) 13,378 13,164 801 - - 98,218 99,019 256 7,612 7,868
3,384 - - 9,580 12,964 319 12,517 12,836 2,406 - - 76,816 79,222 (16,688) 33,031 16,343
60 - - 28,565 28,625 2,293 24,173 26,466 10,285 - 697 22,537 33,519 242 2,672 2,914 1,569 - - 23,030 24,599 1,022 6,001 7,023 5,222 - - 7,712 12,934 5,256 21,546 26,802 2,677 - - 15,704 18,381 (5,390) 7,983 2,593 3,993 - - 59,987 63,980 (2,198) 34,951 32,753 5,002 - - 40,090 45,092 3,080 47,799 50,879 2,088 - 406 9,348 11,842 2,045 5,620 7,665 5,510 - - 46,164 51,674 (5,533) 44,357 38,824
36,375 - 288 16,482 53,145 (2,550) 14,648 12,098 9,126 - 1,778 35,657 46,561 1,230 33,065 34,295
352 - 4,926 118,583 123,861 22,678 40,855 63,533 2,256 - - 28,406 30,662 (5,594) 23,061 17,467 5,109 - 311 7,879 13,299 (1,572) 8,782 7,210
- - - 40,727 40,727 1,620 86,524 88,144 34,961 525 222 31,560 67,268 (1,221) 19,824 18,603
- - - 22,014 22,014 (796) 12,339 11,543 5,637 - 8,290 108,882 122,809 (10,043) 31,692 21,649 7,794 - - 4,569 12,363 (7,336) 8,950 1,614 3,029 - 2,023 33,588 38,640 5,567 26,117 31,684 1,368 - 1,036 28,006 30,410 17,302 44,903 62,205 9,738 - 155 29,481 39,374 12,811 21,292 34,103 3,368 - - 36,350 39,718 (3,095) 3,808 713 1,300 - 437 14,682 16,419 2,966 8,924 11,890
10,520 - - 34,792 45,312 (160) 14,471 14,311 3,958 - - 18,587 22,545 4,974 2,591 7,565
797 - 1,373 89,369 91,539 1,106 15,214 16,320 547 - 1,089 11,660 13,296 330 12,998 13,328
20,385 - - 37,398 57,783 (9,842) 68,193 58,351 9,455 - - 57,606 67,061 (7,520) 25,036 17,516 1,401 - - 112,754 114,155 6,472 24,418 30,890
- - - 115,664 115,664 (3,657) 81,595 77,938 15,558 - 121 13,790 29,469 (1,190) 8,416 7,226 11,243 - - 14,361 25,604 1,435 15,791 17,226 4,647 - - 15,093 19,740 (2,166) 7,633 5,467 4,609 - - 16,209 20,818 (2,071) 4,733 2,662 5,562 - - 11,755 17,317 (2,684) 3,643 959 4,770 - - 31,602 36,372 3,254 2,514 5,768
361,439 925 30,018 2,561,074 2,953,456 36,771 1,373,883 1,410,654
Fund BalanceExpenditures
- 71 -
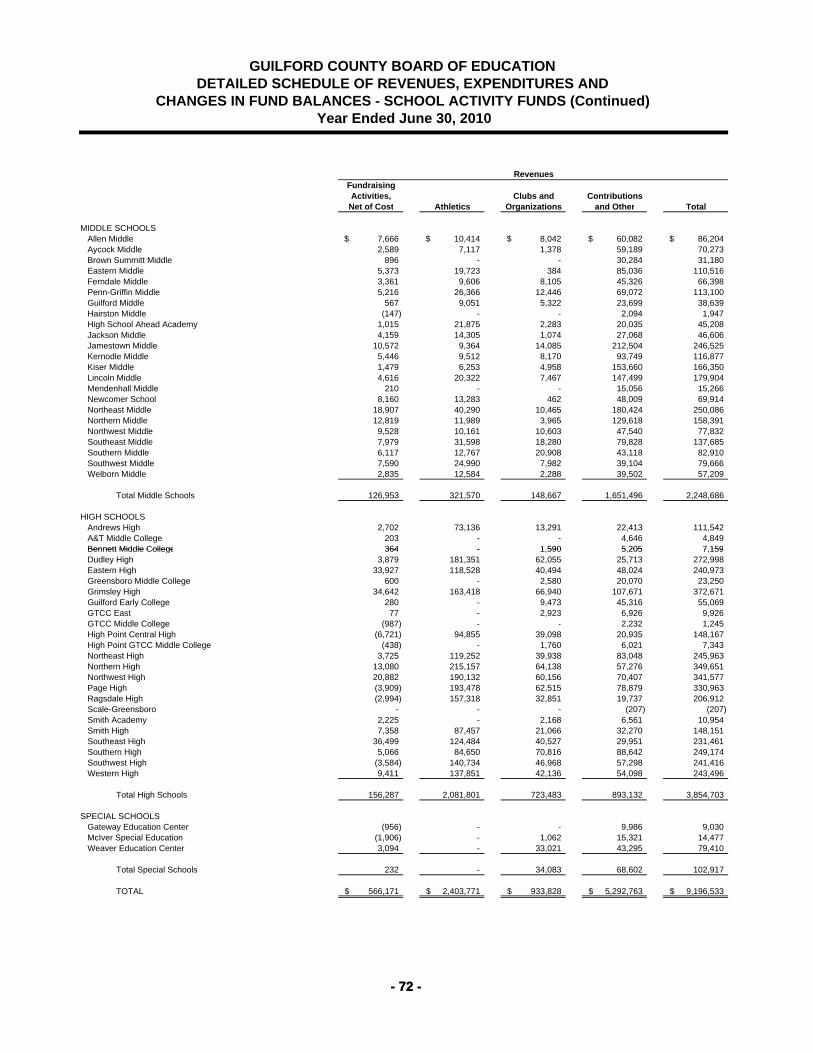
FundraisingActivities, Clubs and Contributions
Net of Cost Athletics Organizations and Other Total
MIDDLE SCHOOLSAllen Middle 7,666$ 10,414$ 8,042$ 60,082$ 86,204$ Aycock Middle 2,589 7,117 1,378 59,189 70,273 Brown Summitt Middle 896 - - 30,284 31,180 Eastern Middle 5,373 19,723 384 85,036 110,516 Ferndale Middle 3,361 9,606 8,105 45,326 66,398 Penn-Griffin Middle 5,216 26,366 12,446 69,072 113,100 Guilford Middle 567 9,051 5,322 23,699 38,639 Hairston Middle (147) - - 2,094 1,947 High School Ahead Academy 1,015 21,875 2,283 20,035 45,208 Jackson Middle 4,159 14,305 1,074 27,068 46,606 Jamestown Middle 10,572 9,364 14,085 212,504 246,525 Kernodle Middle 5,446 9,512 8,170 93,749 116,877 Kiser Middle 1,479 6,253 4,958 153,660 166,350 Lincoln Middle 4,616 20,322 7,467 147,499 179,904 Mendenhall Middle 210 - - 15,056 15,266 Newcomer School 8,160 13,283 462 48,009 69,914 Northeast Middle 18,907 40,290 10,465 180,424 250,086 Northern Middle 12,819 11,989 3,965 129,618 158,391 Northwest Middle 9,528 10,161 10,603 47,540 77,832 Southeast Middle 7,979 31,598 18,280 79,828 137,685 Southern Middle 6,117 12,767 20,908 43,118 82,910 Southwest Middle 7,590 24,990 7,982 39,104 79,666 Welborn Middle 2,835 12,584 2,288 39,502 57,209
Total Middle Schools 126,953 321,570 148,667 1,651,496 2,248,686
HIGH SCHOOLSAndrews High 2,702 73,136 13,291 22,413 111,542 A&T Middle College 203 - - 4,646 4,849 Bennett Middle College 364 - 1 590 5 205 7 159
Year Ended June 30, 2010
GUILFORD COUNTY BOARD OF EDUCATION DETAILED SCHEDULE OF REVENUES, EXPENDITURES AND
CHANGES IN FUND BALANCES - SCHOOL ACTIVITY FUNDS (Continued)
Revenues
- 72 -
Bennett Middle College 364 - 1,590 5,205 7,159 Dudley High 3,879 181,351 62,055 25,713 272,998 Eastern High 33,927 118,528 40,494 48,024 240,973 Greensboro Middle College 600 - 2,580 20,070 23,250 Grimsley High 34,642 163,418 66,940 107,671 372,671 Guilford Early College 280 - 9,473 45,316 55,069 GTCC East 77 - 2,923 6,926 9,926 GTCC Middle College (987) - - 2,232 1,245 High Point Central High (6,721) 94,855 39,098 20,935 148,167 High Point GTCC Middle College (438) - 1,760 6,021 7,343 Northeast High 3,725 119,252 39,938 83,048 245,963 Northern High 13,080 215,157 64,138 57,276 349,651 Northwest High 20,882 190,132 60,156 70,407 341,577 Page High (3,909) 193,478 62,515 78,879 330,963 Ragsdale High (2,994) 157,318 32,851 19,737 206,912 Scale-Greensboro - - - (207) (207) Smith Academy 2,225 - 2,168 6,561 10,954 Smith High 7,358 87,457 21,066 32,270 148,151 Southeast High 36,499 124,484 40,527 29,951 231,461 Southern High 5,066 84,650 70,816 88,642 249,174 Southwest High (3,584) 140,734 46,968 57,298 241,416 Western High 9,411 137,851 42,136 54,098 243,496
Total High Schools 156,287 2,081,801 723,483 893,132 3,854,703
SPECIAL SCHOOLSGateway Education Center (956) - - 9,986 9,030 McIver Special Education (1,906) - 1,062 15,321 14,477 Weaver Education Center 3,094 - 33,021 43,295 79,410
Total Special Schools 232 - 34,083 68,602 102,917
TOTAL 566,171$ 2,403,771$ 933,828$ 5,292,763$ 9,196,533$
- 72 -
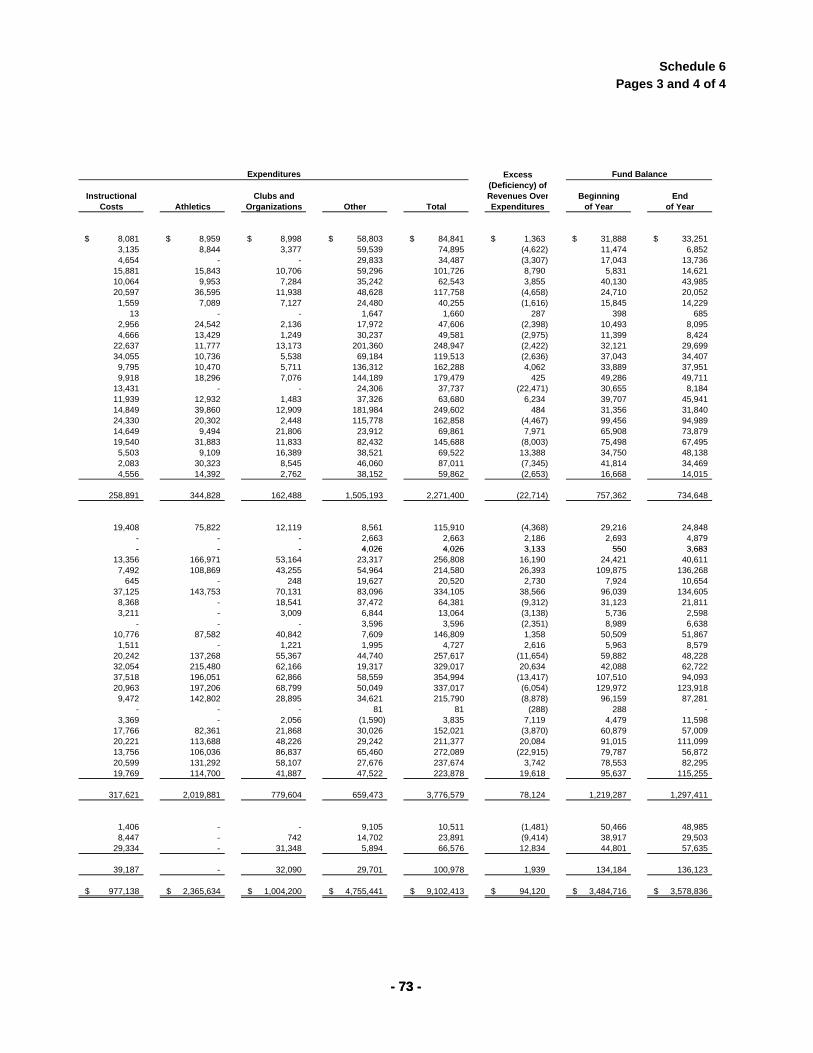
Schedule 6Pages 3 and 4 of 4
Excess(Deficiency) of
Instructional Clubs and Revenues Over Beginning EndCosts Athletics Organizations Other Total Expenditures of Year of Year
8,081$ 8,959$ 8,998$ 58,803$ 84,841$ 1,363$ 31,888$ 33,251$ 3,135 8,844 3,377 59,539 74,895 (4,622) 11,474 6,852 4,654 - - 29,833 34,487 (3,307) 17,043 13,736
15,881 15,843 10,706 59,296 101,726 8,790 5,831 14,621 10,064 9,953 7,284 35,242 62,543 3,855 40,130 43,985 20,597 36,595 11,938 48,628 117,758 (4,658) 24,710 20,052 1,559 7,089 7,127 24,480 40,255 (1,616) 15,845 14,229
13 - - 1,647 1,660 287 398 685 2,956 24,542 2,136 17,972 47,606 (2,398) 10,493 8,095 4,666 13,429 1,249 30,237 49,581 (2,975) 11,399 8,424
22,637 11,777 13,173 201,360 248,947 (2,422) 32,121 29,699 34,055 10,736 5,538 69,184 119,513 (2,636) 37,043 34,407 9,795 10,470 5,711 136,312 162,288 4,062 33,889 37,951 9,918 18,296 7,076 144,189 179,479 425 49,286 49,711
13,431 - - 24,306 37,737 (22,471) 30,655 8,184 11,939 12,932 1,483 37,326 63,680 6,234 39,707 45,941 14,849 39,860 12,909 181,984 249,602 484 31,356 31,840 24,330 20,302 2,448 115,778 162,858 (4,467) 99,456 94,989 14,649 9,494 21,806 23,912 69,861 7,971 65,908 73,879 19,540 31,883 11,833 82,432 145,688 (8,003) 75,498 67,495 5,503 9,109 16,389 38,521 69,522 13,388 34,750 48,138 2,083 30,323 8,545 46,060 87,011 (7,345) 41,814 34,469 4,556 14,392 2,762 38,152 59,862 (2,653) 16,668 14,015
258,891 344,828 162,488 1,505,193 2,271,400 (22,714) 757,362 734,648
19,408 75,822 12,119 8,561 115,910 (4,368) 29,216 24,848 - - - 2,663 2,663 2,186 2,693 4,879 - - - 4 026 4 026 3 133 550 3 683
Fund BalanceExpenditures
- 73 -
- - - 4,026 4,026 3,133 550 3,683 13,356 166,971 53,164 23,317 256,808 16,190 24,421 40,611 7,492 108,869 43,255 54,964 214,580 26,393 109,875 136,268
645 - 248 19,627 20,520 2,730 7,924 10,654 37,125 143,753 70,131 83,096 334,105 38,566 96,039 134,605 8,368 - 18,541 37,472 64,381 (9,312) 31,123 21,811 3,211 - 3,009 6,844 13,064 (3,138) 5,736 2,598
- - - 3,596 3,596 (2,351) 8,989 6,638 10,776 87,582 40,842 7,609 146,809 1,358 50,509 51,867 1,511 - 1,221 1,995 4,727 2,616 5,963 8,579
20,242 137,268 55,367 44,740 257,617 (11,654) 59,882 48,228 32,054 215,480 62,166 19,317 329,017 20,634 42,088 62,722 37,518 196,051 62,866 58,559 354,994 (13,417) 107,510 94,093 20,963 197,206 68,799 50,049 337,017 (6,054) 129,972 123,918 9,472 142,802 28,895 34,621 215,790 (8,878) 96,159 87,281
- - - 81 81 (288) 288 - 3,369 - 2,056 (1,590) 3,835 7,119 4,479 11,598
17,766 82,361 21,868 30,026 152,021 (3,870) 60,879 57,009 20,221 113,688 48,226 29,242 211,377 20,084 91,015 111,099 13,756 106,036 86,837 65,460 272,089 (22,915) 79,787 56,872 20,599 131,292 58,107 27,676 237,674 3,742 78,553 82,295 19,769 114,700 41,887 47,522 223,878 19,618 95,637 115,255
317,621 2,019,881 779,604 659,473 3,776,579 78,124 1,219,287 1,297,411
1,406 - - 9,105 10,511 (1,481) 50,466 48,985 8,447 - 742 14,702 23,891 (9,414) 38,917 29,503
29,334 - 31,348 5,894 66,576 12,834 44,801 57,635
39,187 - 32,090 29,701 100,978 1,939 134,184 136,123
977,138$ 2,365,634$ 1,004,200$ 4,755,441$ 9,102,413$ 94,120$ 3,484,716$ 3,578,836$
- 73 -

- 74 -
THIS PAGE LEFT INTENTIONALLY BLANK.
- 75 -
The Enterprise Funds The Guilford County School System has two Enterprise Funds - the School Food Service Fund and the After School Care Enrichment Services Fund. The School Food Service Fund is used to account for the Board’s food service operations. The After School Care Enrichment Services Fund is used to account for the after school program available at sixty-four of the district’s elementary schools. INDIVIDUAL FUND DESCRIPTIONS
School Food Service Fund - During 2009-2010, meals were prepared by the School Nutrition Services staff at each of the cafeterias in the Guilford County Schools system. School lunches cost $2.30 at elementary schools, $2.40 at middle schools and $2.50 at high schools. The number of student lunches served decreased 1.8% to 7,763,569. The dollar volume of a la carte sales decreased 4.0%. Total food sales increased to $9,930,699. Student breakfasts cost $.90 at elementary schools and $1.00 at middle and high schools. The number of breakfasts served increased by 8% to 3,143,440. The meals subsidy of $20,679,495 and the donated commodities of $1,644,123 received from the United States Department of Agriculture are classified as non-operating revenues in accordance with Governmental Accounting Standards Board policies. After School Care Enrichment Services Fund - Services were provided to an average enrollment of 3,500 elementary school students at sixty-four school sites during 2009-2010. The charge for one week of after school care is $45. All ACES programs were licensed by the North Carolina Division of Child Development (NCDCD) and each was eligible to accept Department of Social Services child care vouchers.
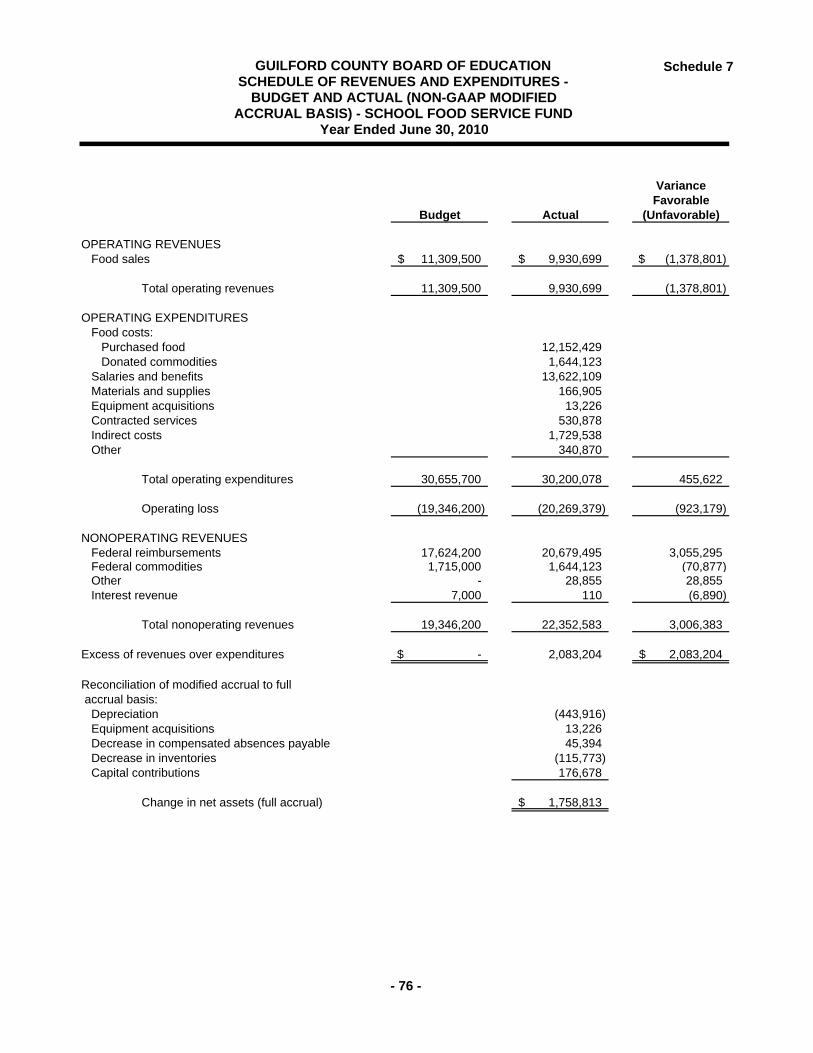
Schedule 7
Variance Favorable
Budget Actual (Unfavorable)
OPERATING REVENUESFood sales 11,309,500$ 9,930,699$ (1,378,801)$
Total operating revenues 11,309,500 9,930,699 (1,378,801)
OPERATING EXPENDITURESFood costs:
Purchased food 12,152,429 Donated commodities 1,644,123
Salaries and benefits 13,622,109 Materials and supplies 166,905 Equipment acquisitions 13,226 Contracted services 530,878 Indirect costs 1,729,538 Other 340,870
Total operating expenditures 30,655,700 30,200,078 455,622
Operating loss (19,346,200) (20,269,379) (923,179)
NONOPERATING REVENUES Federal reimbursements 17,624,200 20,679,495 3,055,295 Federal commodities 1,715,000 1,644,123 (70,877) Other - 28,855 28,855 Interest revenue 7,000 110 (6,890)
Total nonoperating revenues 19,346,200 22,352,583 3,006,383
Excess of revenues over expenditures -$ 2,083,204 2,083,204$
Reconciliation of modified accrual to full accrual basis:
Depreciation (443,916) Equipment acquisitions 13,226 Decrease in compensated absences payable 45,394 Decrease in inventories (115,773) Capital contributions 176,678
Change in net assets (full accrual) 1,758,813$
Year Ended June 30, 2010
GUILFORD COUNTY BOARD OF EDUCATION SCHEDULE OF REVENUES AND EXPENDITURES -
BUDGET AND ACTUAL (NON-GAAP MODIFIED ACCRUAL BASIS) - SCHOOL FOOD SERVICE FUND
- 76 -
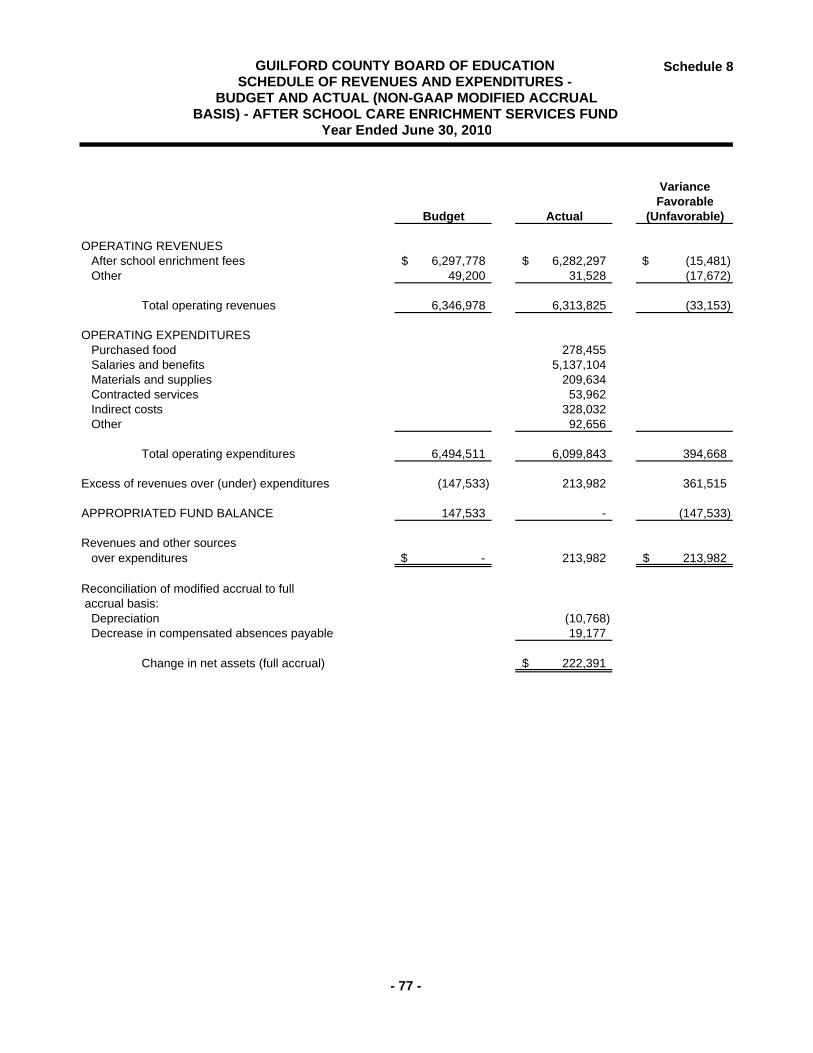
Schedule 8
Variance Favorable
Budget Actual (Unfavorable)
OPERATING REVENUESAfter school enrichment fees 6,297,778$ 6,282,297$ (15,481)$ Other 49,200 31,528 (17,672)
Total operating revenues 6,346,978 6,313,825 (33,153)
OPERATING EXPENDITURESPurchased food 278,455 Salaries and benefits 5,137,104 Materials and supplies 209,634 Contracted services 53,962 Indirect costs 328,032 Other 92,656
Total operating expenditures 6,494,511 6,099,843 394,668
Excess of revenues over (under) expenditures (147,533) 213,982 361,515
APPROPRIATED FUND BALANCE 147,533 - (147,533)
Revenues and other sourcesover expenditures -$ 213,982 213,982$
Reconciliation of modified accrual to full accrual basis:
Depreciation (10,768) Decrease in compensated absences payable 19,177
Change in net assets (full accrual) 222,391$
Year Ended June 30, 2010
GUILFORD COUNTY BOARD OF EDUCATION SCHEDULE OF REVENUES AND EXPENDITURES -
BUDGET AND ACTUAL (NON-GAAP MODIFIED ACCRUALBASIS) - AFTER SCHOOL CARE ENRICHMENT SERVICES FUND
- 77 -

- 78 -
THIS PAGE LEFT INTENTIONALLY BLANK.

- 79 -
The Fiduciary Funds
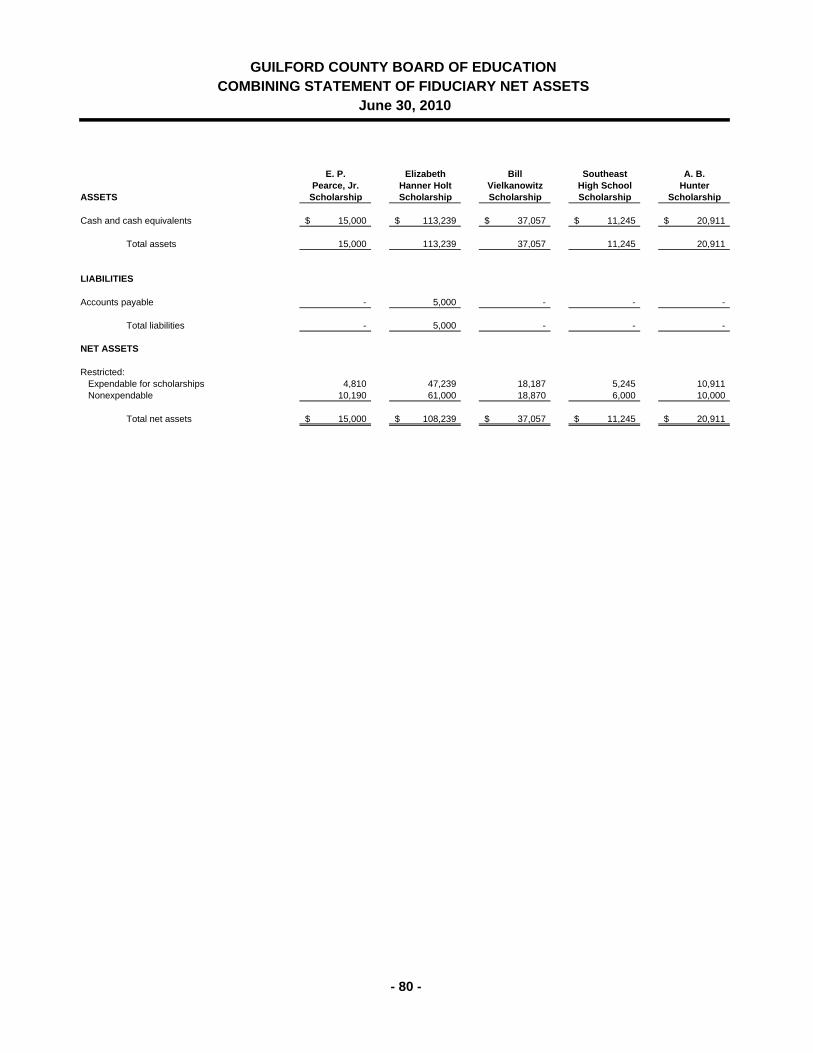
E. P. Elizabeth Bill Southeast A. B.Pearce, Jr. Hanner Holt Vielkanowitz High School Hunter
ASSETS Scholarship Scholarship Scholarship Scholarship Scholarship
Cash and cash equivalents 15,000$ 113,239$ 37,057$ 11,245$ 20,911$
Total assets 15,000 113,239 37,057 11,245 20,911
LIABILITIES
Accounts payable - 5,000 - - -
Total liabilities - 5,000 - - -
NET ASSETS
Restricted:Expendable for scholarships 4,810 47,239 18,187 5,245 10,911 Nonexpendable 10,190 61,000 18,870 6,000 10,000
Total net assets 15,000$ 108,239$ 37,057$ 11,245$ 20,911$
GUILFORD COUNTY BOARD OF EDUCATION COMBINING STATEMENT OF FIDUCIARY NET ASSETS
June 30, 2010
- 80 -
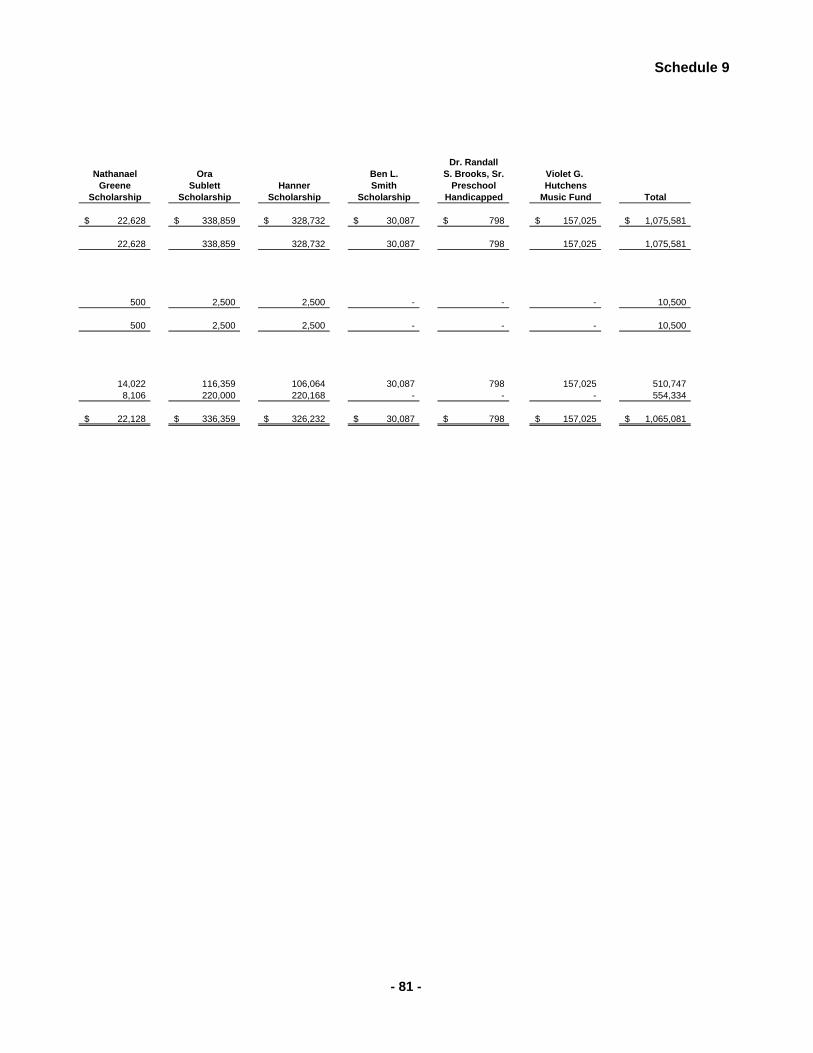
Schedule 9
Dr. RandallNathanael Ora Ben L. S. Brooks, Sr. Violet G.
Greene Sublett Hanner Smith Preschool HutchensScholarship Scholarship Scholarship Scholarship Handicapped Music Fund Total
22,628$ 338,859$ 328,732$ 30,087$ 798$ 157,025$ 1,075,581$
22,628 338,859 328,732 30,087 798 157,025 1,075,581
500 2,500 2,500 - - - 10,500
500 2,500 2,500 - - - 10,500
14,022 116,359 106,064 30,087 798 157,025 510,747 8,106 220,000 220,168 - - - 554,334
22,128$ 336,359$ 326,232$ 30,087$ 798$ 157,025$ 1,065,081$
- 81 -
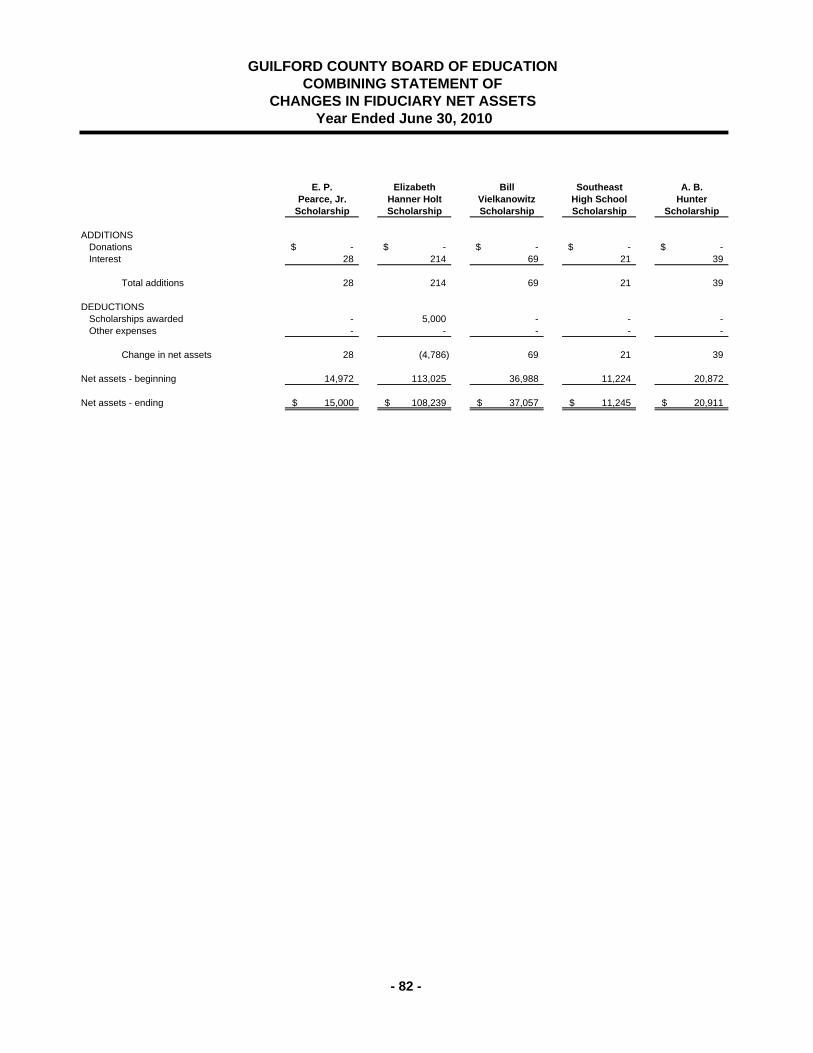
E. P. Elizabeth Bill Southeast A. B.Pearce, Jr. Hanner Holt Vielkanowitz High School Hunter
Scholarship Scholarship Scholarship Scholarship Scholarship
ADDITIONSDonations -$ -$ -$ -$ -$ Interest 28 214 69 21 39
Total additions 28 214 69 21 39
DEDUCTIONSScholarships awarded - 5,000 - - - Other expenses - - - - -
Change in net assets 28 (4,786) 69 21 39
Net assets - beginning 14,972 113,025 36,988 11,224 20,872
Net assets - ending 15,000$ 108,239$ 37,057$ 11,245$ 20,911$
GUILFORD COUNTY BOARD OF EDUCATION COMBINING STATEMENT OF
CHANGES IN FIDUCIARY NET ASSETS Year Ended June 30, 2010
- 82 -
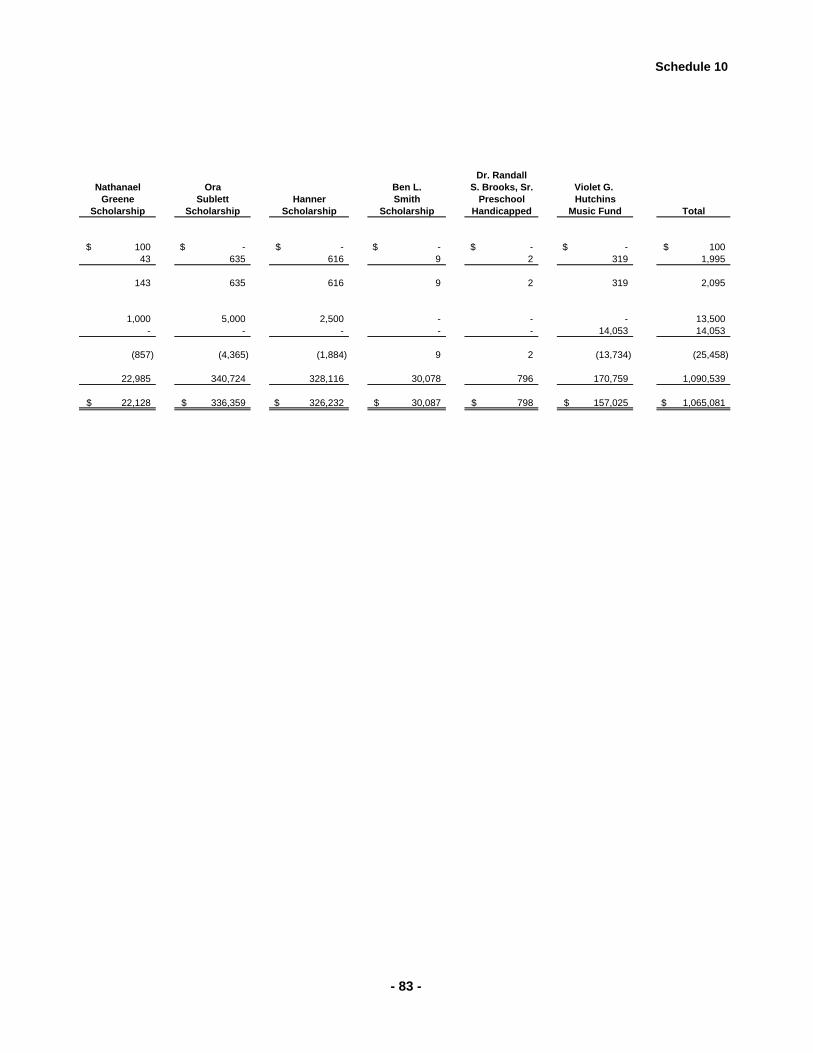
Schedule 10
Dr. RandallNathanael Ora Ben L. S. Brooks, Sr. Violet G.
Greene Sublett Hanner Smith Preschool HutchinsScholarship Scholarship Scholarship Scholarship Handicapped Music Fund Total
100$ -$ -$ -$ -$ -$ 100$ 43 635 616 9 2 319 1,995
143 635 616 9 2 319 2,095
1,000 5,000 2,500 - - - 13,500 - - - - - 14,053 14,053
(857) (4,365) (1,884) 9 2 (13,734) (25,458)
22,985 340,724 328,116 30,078 796 170,759 1,090,539
22,128$ 336,359$ 326,232$ 30,087$ 798$ 157,025$ 1,065,081$
- 83 -

- 84 -
THIS PAGE LEFT INTENTIONALLY BLANK.
- 85 -
STATISTICAL SECTION
The statistical Section of the District’s Comprehensive Annual Financial Report (CAFR) presents detailed information as a context for understanding what the information in the financial statements, note disclosures, and required supplementary information say about the District’s over all financial outlook. Financial Trends
These schedules contain trend information to help the reader understand how the District’s financial performance and operations have changed over time. Government-wide data are presented for the past five fiscal years. Governmental Fund revenue sources and expenditures by function are presented over a 10-year period.
Net Assets by Component Changes in Net Assets Governmental Funds Fund Balance Governmental Funds Changes in Fund Balances Governmental Fund Revenues by Source Governmental Fund Expenditures by Function
Debt Capacity
Since the District has no tax-levying or debt-issuing authority, the County of Guilford provides significant funding to the school system. Selected fiscal data from the County of Guilford have been included to help the reader better understand the school system and its financial operations.
Property Tax Levies and Collections Assessed and Estimated Actual Value of Taxable Property Property Tax Rates-Direct and Overlapping Governments Ratio of Outstanding Debt by Type Direct and Overlapping Governmental Activities Debt
Demographic and Economic Information
These schedules offer demographic and economic indicators to help the reader understand the environment within which the District’s financial activities take place. County information is included.
Principal Taxpayers Legal Debt Margin Information Demographic Statistics Principal Employers
- 86 -
STATISTICAL SECTION (Continued) Operating Information
These schedules contain service data to help the reader understand how the information in the District’s financial report relates to the services the District provides and the activities it performs.
Full-Time Equivalent Employees by Function Comparative Average Daily Membership - School and Special Programs Operating Statistics Instructional Personnel School Building Data
Sources of Information
Unless otherwise noted, the information for the school system is derived from the comprehensive annual financial reports for the relevant years. The District implemented GASB Statement 34 with the fiscal year ending June 30, 2002; therefore, schedules presenting government-wide information include information beginning with the fiscal year 2001-02.
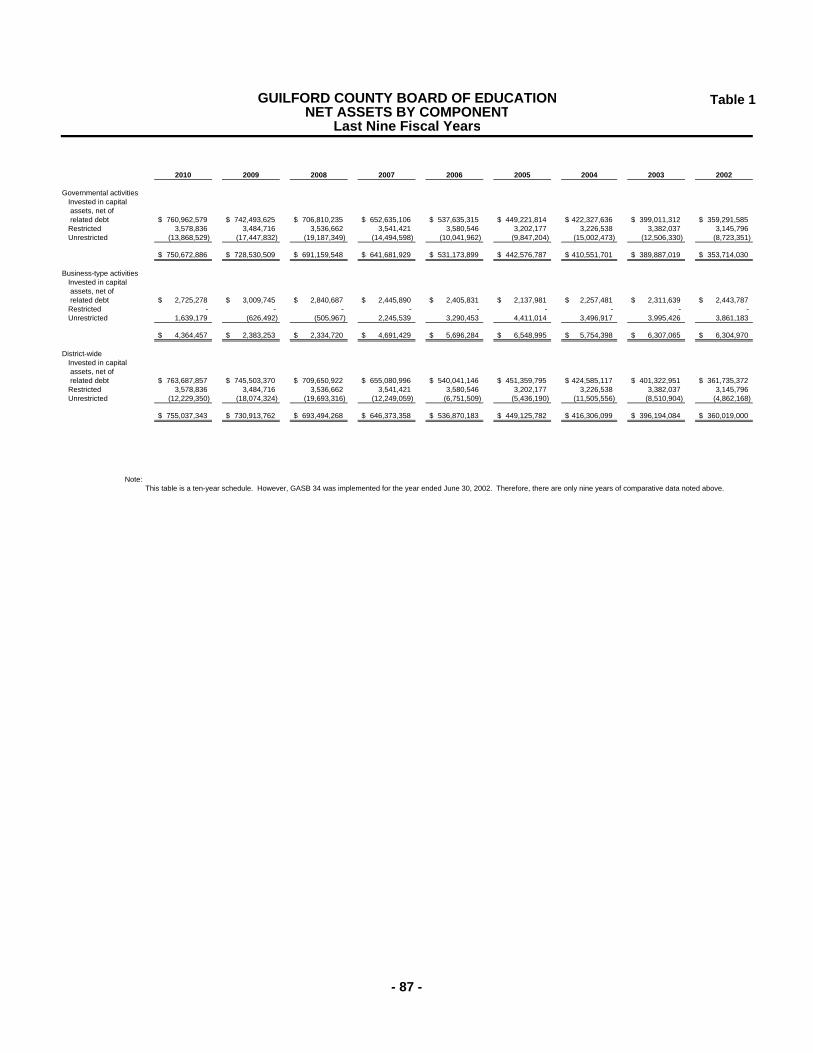
Table 1
2010 2009 2008 2007 2006 2005 2004 2003 2002
Governmental activitiesInvested in capital assets, net of related debt 760,962,579$ 742,493,625$ 706,810,235$ 652,635,106$ 537,635,315$ 449,221,814$ 422,327,636$ 399,011,312$ 359,291,585$ Restricted 3,578,836 3,484,716 3,536,662 3,541,421 3,580,546 3,202,177 3,226,538 3,382,037 3,145,796 Unrestricted (13,868,529) (17,447,832) (19,187,349) (14,494,598) (10,041,962) (9,847,204) (15,002,473) (12,506,330) (8,723,351)
750,672,886$ 728,530,509$ 691,159,548$ 641,681,929$ 531,173,899$ 442,576,787$ 410,551,701$ 389,887,019$ 353,714,030$
Business-type activitiesInvested in capital assets, net of related debt 2,725,278$ 3,009,745$ 2,840,687$ 2,445,890$ 2,405,831$ 2,137,981$ 2,257,481$ 2,311,639$ 2,443,787$ Restricted - - - - - - - - - Unrestricted 1,639,179 (626,492) (505,967) 2,245,539 3,290,453 4,411,014 3,496,917 3,995,426 3,861,183
4,364,457$ 2,383,253$ 2,334,720$ 4,691,429$ 5,696,284$ 6,548,995$ 5,754,398$ 6,307,065$ 6,304,970$
District-wideInvested in capital assets, net of related debt 763,687,857$ 745,503,370$ 709,650,922$ 655,080,996$ 540,041,146$ 451,359,795$ 424,585,117$ 401,322,951$ 361,735,372$ Restricted 3,578,836 3,484,716 3,536,662 3,541,421 3,580,546 3,202,177 3,226,538 3,382,037 3,145,796 Unrestricted (12,229,350) (18,074,324) (19,693,316) (12,249,059) (6,751,509) (5,436,190) (11,505,556) (8,510,904) (4,862,168)
755,037,343$ 730,913,762$ 693,494,268$ 646,373,358$ 536,870,183$ 449,125,782$ 416,306,099$ 396,194,084$ 360,019,000$
Note:This table is a ten-year schedule. However, GASB 34 was implemented for the year ended June 30, 2002. Therefore, there are only nine years of comparative data noted above.
GUILFORD COUNTY BOARD OF EDUCATIONNET ASSETS BY COMPONENT
Last Nine Fiscal Years
- 87 -
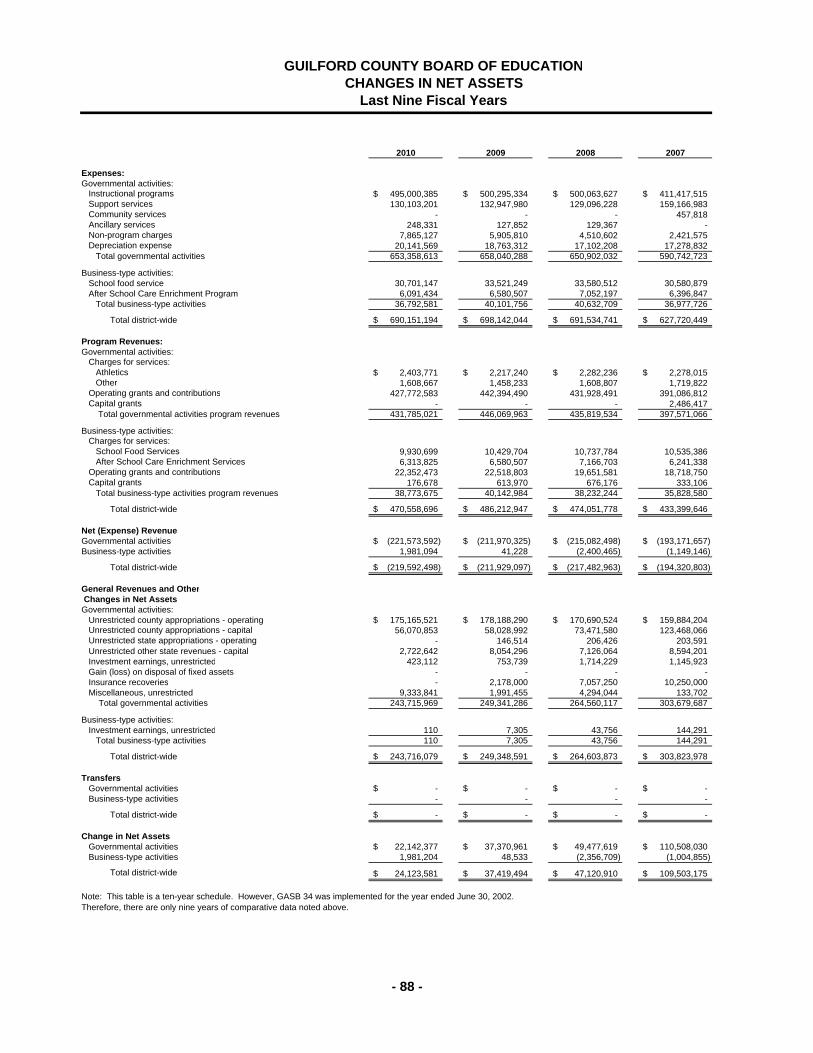
2010 2009 2008 2007
Expenses:Governmental activities:
Instructional programs 495,000,385$ 500,295,334$ 500,063,627$ 411,417,515$ Support services 130,103,201 132,947,980 129,096,228 159,166,983 Community services - - - 457,818 Ancillary services 248,331 127,852 129,367 - Non-program charges 7,865,127 5,905,810 4,510,602 2,421,575 Depreciation expense 20,141,569 18,763,312 17,102,208 17,278,832
Total governmental activities 653,358,613 658,040,288 650,902,032 590,742,723
Business-type activities:School food service 30,701,147 33,521,249 33,580,512 30,580,879 After School Care Enrichment Program 6,091,434 6,580,507 7,052,197 6,396,847
Total business-type activities 36,792,581 40,101,756 40,632,709 36,977,726
Total district-wide 690,151,194$ 698,142,044$ 691,534,741$ 627,720,449$
Program Revenues:Governmental activities:
Charges for services:Athletics 2,403,771$ 2,217,240$ 2,282,236$ 2,278,015$ Other 1,608,667 1,458,233 1,608,807 1,719,822
Operating grants and contributions 427,772,583 442,394,490 431,928,491 391,086,812 Capital grants - - - 2,486,417
Total governmental activities program revenues 431,785,021 446,069,963 435,819,534 397,571,066
Business-type activities:Charges for services:
School Food Services 9,930,699 10,429,704 10,737,784 10,535,386 After School Care Enrichment Services 6,313,825 6,580,507 7,166,703 6,241,338
Operating grants and contributions 22,352,473 22,518,803 19,651,581 18,718,750 Capital grants 176,678 613,970 676,176 333,106
Total business-type activities program revenues 38,773,675 40,142,984 38,232,244 35,828,580
Total district-wide 470,558,696$ 486,212,947$ 474,051,778$ 433,399,646$
Net (Expense) RevenueGovernmental activities (221,573,592)$ (211,970,325)$ (215,082,498)$ (193,171,657)$ Business-type activities 1,981,094 41,228 (2,400,465) (1,149,146)
Total district-wide (219,592,498)$ (211,929,097)$ (217,482,963)$ (194,320,803)$
General Revenues and Other Changes in Net AssetsGovernmental activities:
Unrestricted county appropriations - operating 175,165,521$ 178,188,290$ 170,690,524$ 159,884,204$ Unrestricted county appropriations - capital 56,070,853 58,028,992 73,471,580 123,468,066 Unrestricted state appropriations - operating - 146,514 206,426 203,591 Unrestricted other state revenues - capital 2,722,642 8,054,296 7,126,064 8,594,201 Investment earnings, unrestricted 423,112 753,739 1,714,229 1,145,923 Gain (loss) on disposal of fixed assets - - - - Insurance recoveries - 2,178,000 7,057,250 10,250,000 Miscellaneous, unrestricted 9,333,841 1,991,455 4,294,044 133,702
Total governmental activities 243,715,969 249,341,286 264,560,117 303,679,687
Business-type activities:Investment earnings, unrestricted 110 7,305 43,756 144,291
Total business-type activities 110 7,305 43,756 144,291
Total district-wide 243,716,079$ 249,348,591$ 264,603,873$ 303,823,978$
Transfers Governmental activities -$ -$ -$ -$ Business-type activities - - - -
Total district-wide -$ -$ -$ -$
Change in Net AssetsGovernmental activities 22,142,377$ 37,370,961$ 49,477,619$ 110,508,030$ Business-type activities 1,981,204 48,533 (2,356,709) (1,004,855)
Total district-wide 24,123,581$ 37,419,494$ 47,120,910$ 109,503,175$
Note: This table is a ten-year schedule. However, GASB 34 was implemented for the year ended June 30, 2002. Therefore, there are only nine years of comparative data noted above.
GUILFORD COUNTY BOARD OF EDUCATIONCHANGES IN NET ASSETS
Last Nine Fiscal Years
- 88 -
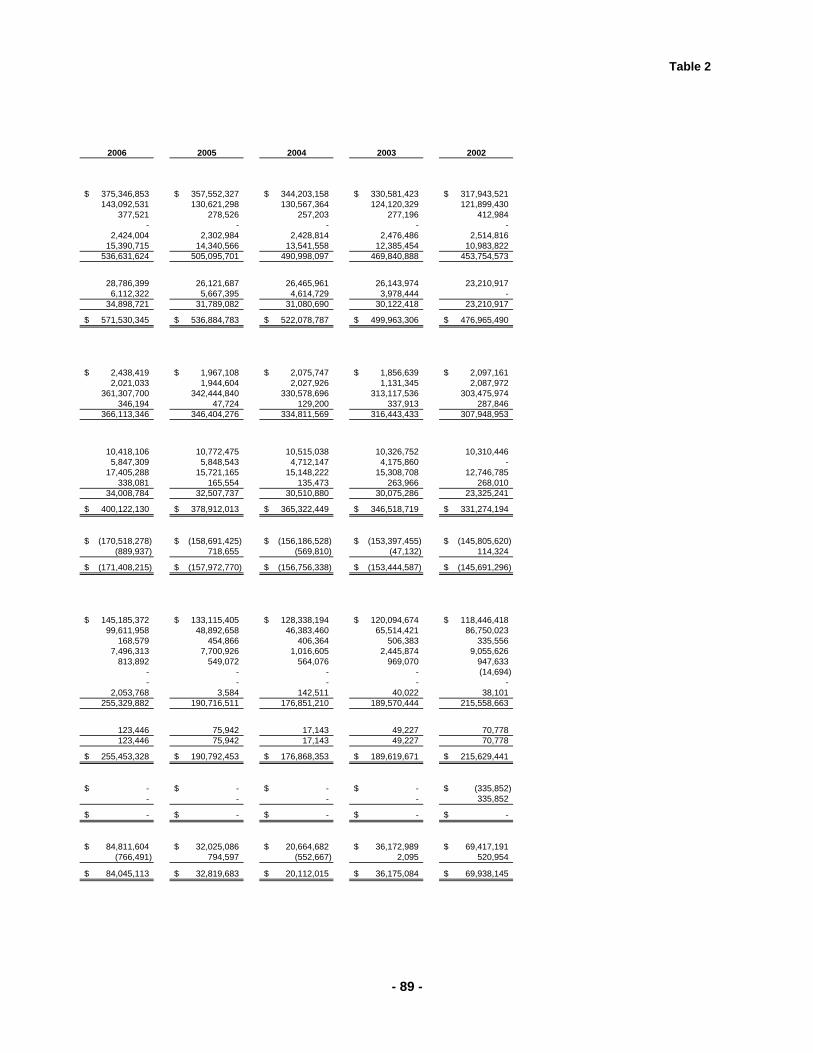
Table 2
2006 2005 2004 2003 2002
375,346,853$ 357,552,327$ 344,203,158$ 330,581,423$ 317,943,521$ 143,092,531 130,621,298 130,567,364 124,120,329 121,899,430
377,521 278,526 257,203 277,196 412,984 - - - - -
2,424,004 2,302,984 2,428,814 2,476,486 2,514,816 15,390,715 14,340,566 13,541,558 12,385,454 10,983,822
536,631,624 505,095,701 490,998,097 469,840,888 453,754,573
28,786,399 26,121,687 26,465,961 26,143,974 23,210,917 6,112,322 5,667,395 4,614,729 3,978,444 -
34,898,721 31,789,082 31,080,690 30,122,418 23,210,917
571,530,345$ 536,884,783$ 522,078,787$ 499,963,306$ 476,965,490$
2,438,419$ 1,967,108$ 2,075,747$ 1,856,639$ 2,097,161$ 2,021,033 1,944,604 2,027,926 1,131,345 2,087,972
361,307,700 342,444,840 330,578,696 313,117,536 303,475,974 346,194 47,724 129,200 337,913 287,846
366,113,346 346,404,276 334,811,569 316,443,433 307,948,953
10,418,106 10,772,475 10,515,038 10,326,752 10,310,446 5,847,309 5,848,543 4,712,147 4,175,860 -
17,405,288 15,721,165 15,148,222 15,308,708 12,746,785 338,081 165,554 135,473 263,966 268,010
34,008,784 32,507,737 30,510,880 30,075,286 23,325,241
400,122,130$ 378,912,013$ 365,322,449$ 346,518,719$ 331,274,194$
(170,518,278)$ (158,691,425)$ (156,186,528)$ (153,397,455)$ (145,805,620)$ (889,937) 718,655 (569,810) (47,132) 114,324
(171,408,215)$ (157,972,770)$ (156,756,338)$ (153,444,587)$ (145,691,296)$
145,185,372$ 133,115,405$ 128,338,194$ 120,094,674$ 118,446,418$ 99,611,958 48,892,658 46,383,460 65,514,421 86,750,023
168,579 454,866 406,364 506,383 335,556 7,496,313 7,700,926 1,016,605 2,445,874 9,055,626
813,892 549,072 564,076 969,070 947,633 - - - - (14,694) - - - - -
2,053,768 3,584 142,511 40,022 38,101 255,329,882 190,716,511 176,851,210 189,570,444 215,558,663
123,446 75,942 17,143 49,227 70,778 123,446 75,942 17,143 49,227 70,778
255,453,328$ 190,792,453$ 176,868,353$ 189,619,671$ 215,629,441$
-$ -$ -$ -$ (335,852)$ - - - - 335,852
-$ -$ -$ -$ -$
84,811,604$ 32,025,086$ 20,664,682$ 36,172,989$ 69,417,191$ (766,491) 794,597 (552,667) 2,095 520,954
84,045,113$ 32,819,683$ 20,112,015$ 36,175,084$ 69,938,145$
- 89 -
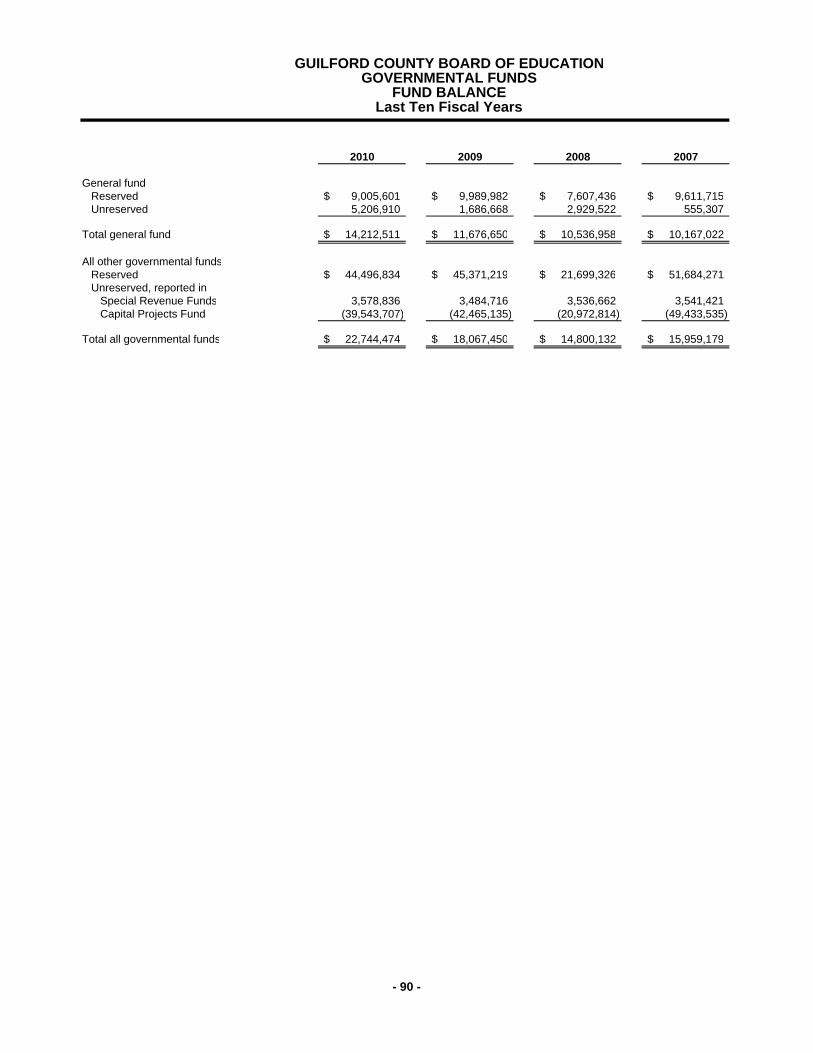
2010 2009 2008 2007
General fundReserved 9,005,601$ 9,989,982$ 7,607,436$ 9,611,715$ Unreserved 5,206,910 1,686,668 2,929,522 555,307
Total general fund 14,212,511$ 11,676,650$ 10,536,958$ 10,167,022$
All other governmental fundsReserved 44,496,834$ 45,371,219$ 21,699,326$ 51,684,271$ Unreserved, reported in
Special Revenue Funds 3,578,836 3,484,716 3,536,662 3,541,421 Capital Projects Fund (39,543,707) (42,465,135) (20,972,814) (49,433,535)
Total all governmental funds 22,744,474$ 18,067,450$ 14,800,132$ 15,959,179$
GUILFORD COUNTY BOARD OF EDUCATIONGOVERNMENTAL FUNDS
FUND BALANCELast Ten Fiscal Years
- 90 -
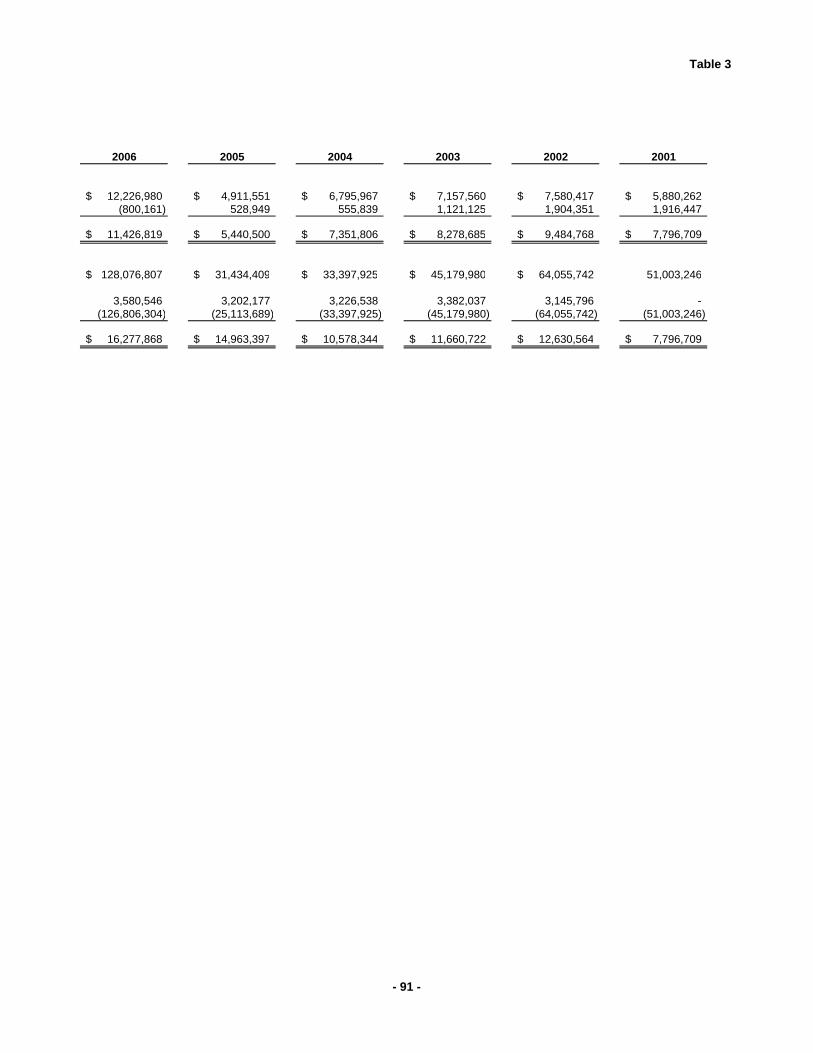
Table 3
2006 2005 2004 2003 2002 2001
12,226,980$ 4,911,551$ 6,795,967$ 7,157,560$ 7,580,417$ 5,880,262$ (800,161) 528,949 555,839 1,121,125 1,904,351 1,916,447
11,426,819$ 5,440,500$ 7,351,806$ 8,278,685$ 9,484,768$ 7,796,709$
128,076,807$ 31,434,409$ 33,397,925$ 45,179,980$ 64,055,742$ 51,003,246
3,580,546 3,202,177 3,226,538 3,382,037 3,145,796 - (126,806,304) (25,113,689) (33,397,925) (45,179,980) (64,055,742) (51,003,246)
16,277,868$ 14,963,397$ 10,578,344$ 11,660,722$ 12,630,564$ 7,796,709$
- 91 -
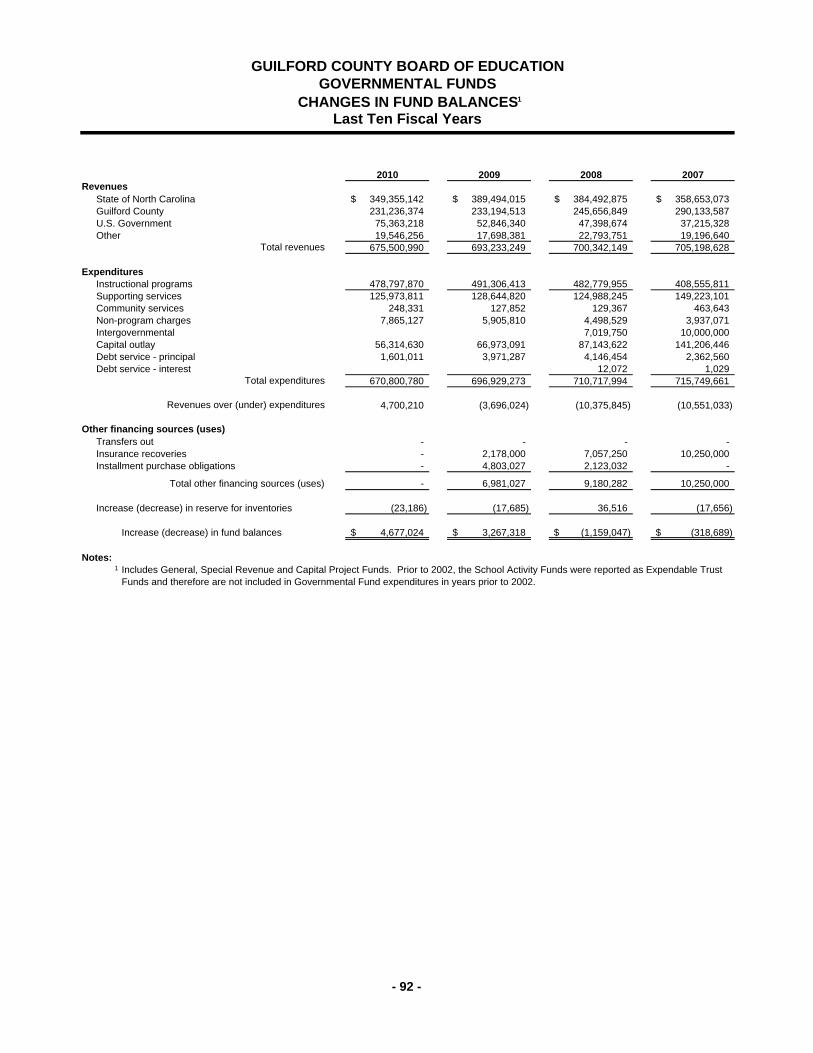
2010 2009 2008 2007
State of North Carolina 349,355,142$ 389,494,015$ 384,492,875$ 358,653,073$ Guilford County 231,236,374 233,194,513 245,656,849 290,133,587 U.S. Government 75,363,218 52,846,340 47,398,674 37,215,328 Other 19,546,256 17,698,381 22,793,751 19,196,640
675,500,990 693,233,249 700,342,149 705,198,628
ExpendituresInstructional programs 478,797,870 491,306,413 482,779,955 408,555,811 Supporting services 125,973,811 128,644,820 124,988,245 149,223,101 Community services 248,331 127,852 129,367 463,643 Non-program charges 7,865,127 5,905,810 4,498,529 3,937,071 Intergovernmental 7,019,750 10,000,000 Capital outlay 56,314,630 66,973,091 87,143,622 141,206,446 Debt service - principal 1,601,011 3,971,287 4,146,454 2,362,560 Debt service - interest 12,072 1,029
670,800,780 696,929,273 710,717,994 715,749,661
4,700,210 (3,696,024) (10,375,845) (10,551,033)
Transfers out - - - - Insurance recoveries - 2,178,000 7,057,250 10,250,000 Installment purchase obligations - 4,803,027 2,123,032 -
- 6,981,027 9,180,282 10,250,000
Increase (decrease) in reserve for inventories (23,186) (17,685) 36,516 (17,656)
Increase (decrease) in fund balances 4,677,024$ 3,267,318$ (1,159,047)$ (318,689)$
Notes:1 Includes General, Special Revenue and Capital Project Funds. Prior to 2002, the School Activity Funds were reported as Expendable Trust
Funds and therefore are not included in Governmental Fund expenditures in years prior to 2002.
Total other financing sources (uses)
Revenues over (under) expenditures
Total revenues
Total expenditures
Other financing sources (uses)
GUILFORD COUNTY BOARD OF EDUCATIONGOVERNMENTAL FUNDS
CHANGES IN FUND BALANCES1
Last Ten Fiscal Years
Revenues
- 92 -
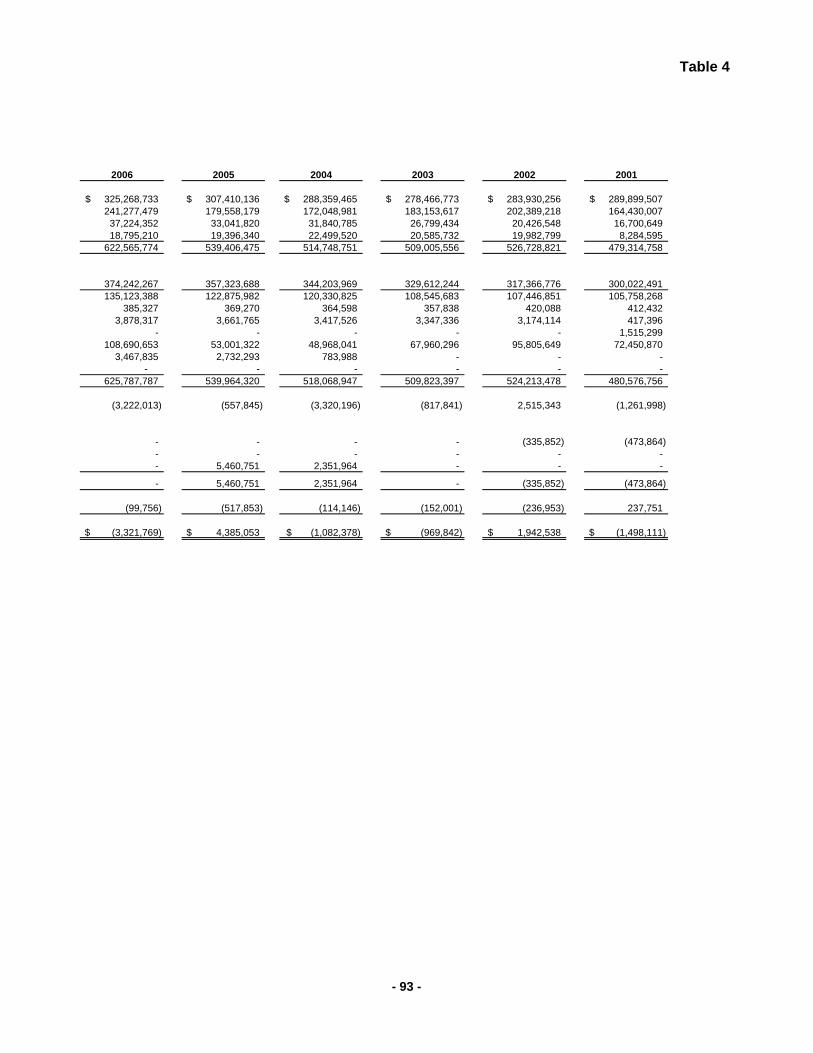
Table 4
2006 2005 2004 2003 2002 2001
325,268,733$ 307,410,136$ 288,359,465$ 278,466,773$ 283,930,256$ 289,899,507$ 241,277,479 179,558,179 172,048,981 183,153,617 202,389,218 164,430,007
37,224,352 33,041,820 31,840,785 26,799,434 20,426,548 16,700,649 18,795,210 19,396,340 22,499,520 20,585,732 19,982,799 8,284,595
622,565,774 539,406,475 514,748,751 509,005,556 526,728,821 479,314,758
374,242,267 357,323,688 344,203,969 329,612,244 317,366,776 300,022,491 135,123,388 122,875,982 120,330,825 108,545,683 107,446,851 105,758,268
385,327 369,270 364,598 357,838 420,088 412,432 3,878,317 3,661,765 3,417,526 3,347,336 3,174,114 417,396
- - - - - 1,515,299 108,690,653 53,001,322 48,968,041 67,960,296 95,805,649 72,450,870
3,467,835 2,732,293 783,988 - - - - - - - - -
625,787,787 539,964,320 518,068,947 509,823,397 524,213,478 480,576,756
(3,222,013) (557,845) (3,320,196) (817,841) 2,515,343 (1,261,998)
- - - - (335,852) (473,864) - - - - - - - 5,460,751 2,351,964 - - -
- 5,460,751 2,351,964 - (335,852) (473,864)
(99,756) (517,853) (114,146) (152,001) (236,953) 237,751
(3,321,769)$ 4,385,053$ (1,082,378)$ (969,842)$ 1,942,538$ (1,498,111)$
- 93 -
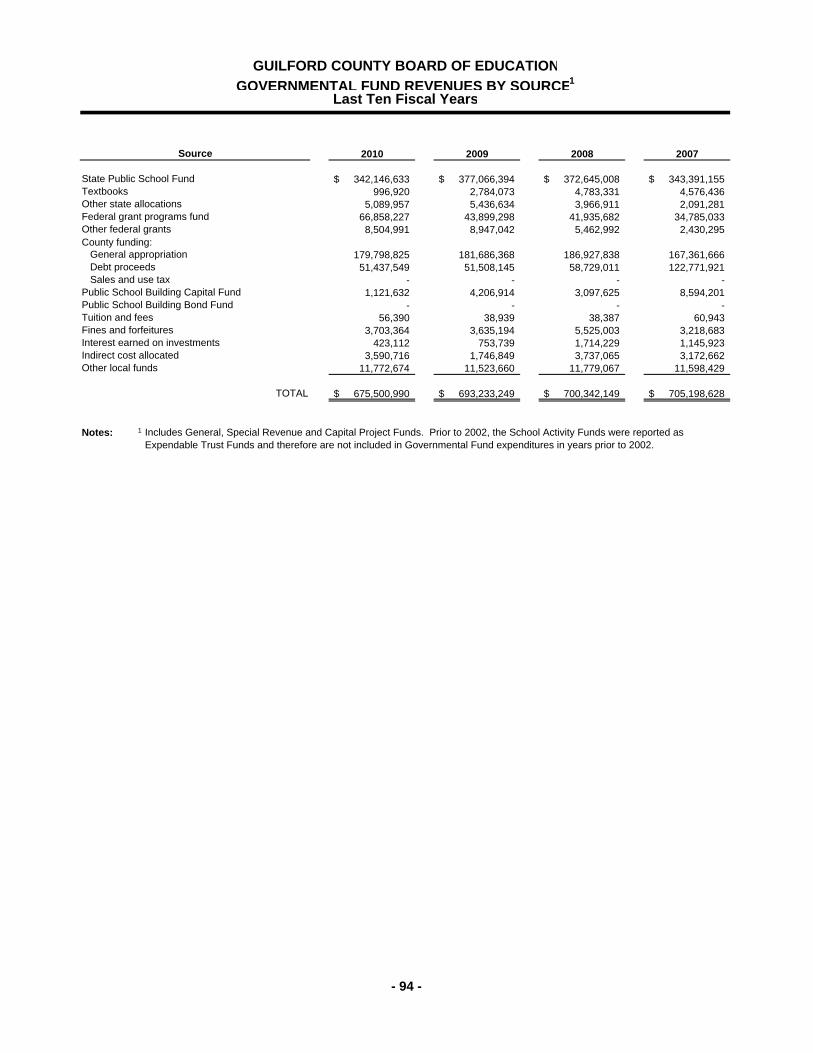
2010 2009 2008 2007
342,146,633$ 377,066,394$ 372,645,008$ 343,391,155$ 996,920 2,784,073 4,783,331 4,576,436
5,089,957 5,436,634 3,966,911 2,091,281 66,858,227 43,899,298 41,935,682 34,785,033 8,504,991 8,947,042 5,462,992 2,430,295
County funding:179,798,825 181,686,368 186,927,838 167,361,666 51,437,549 51,508,145 58,729,011 122,771,921
- - - - 1,121,632 4,206,914 3,097,625 8,594,201
- - - - 56,390 38,939 38,387 60,943
3,703,364 3,635,194 5,525,003 3,218,683 423,112 753,739 1,714,229 1,145,923
3,590,716 1,746,849 3,737,065 3,172,662 11,772,674 11,523,660 11,779,067 11,598,429
675,500,990$ 693,233,249$ 700,342,149$ 705,198,628$
Notes: 1 Includes General, Special Revenue and Capital Project Funds. Prior to 2002, the School Activity Funds were reported as Expendable Trust Funds and therefore are not included in Governmental Fund expenditures in years prior to 2002.
Public School Building Bond FundTuition and fees
Indirect cost allocatedOther local funds
TOTAL
Fines and forfeituresInterest earned on investments
State Public School Fund
Source
Last Ten Fiscal Years
General appropriation Debt proceeds Sales and use taxPublic School Building Capital Fund
TextbooksOther state allocationsFederal grant programs fundOther federal grants
GUILFORD COUNTY BOARD OF EDUCATION
GOVERNMENTAL FUND REVENUES BY SOURCE1
- 94 -
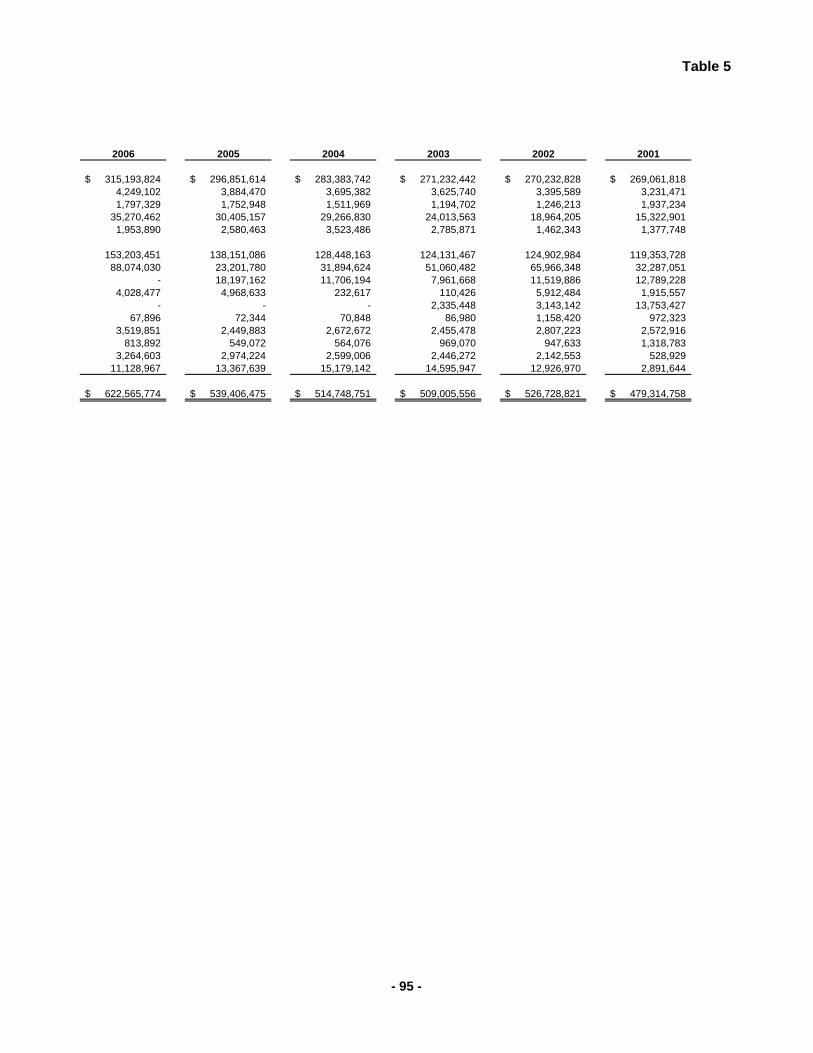
Table 5
2006 2005 2004 2003 2002 2001
315,193,824$ 296,851,614$ 283,383,742$ 271,232,442$ 270,232,828$ 269,061,818$ 4,249,102 3,884,470 3,695,382 3,625,740 3,395,589 3,231,471 1,797,329 1,752,948 1,511,969 1,194,702 1,246,213 1,937,234
35,270,462 30,405,157 29,266,830 24,013,563 18,964,205 15,322,901 1,953,890 2,580,463 3,523,486 2,785,871 1,462,343 1,377,748
153,203,451 138,151,086 128,448,163 124,131,467 124,902,984 119,353,728 88,074,030 23,201,780 31,894,624 51,060,482 65,966,348 32,287,051
- 18,197,162 11,706,194 7,961,668 11,519,886 12,789,228 4,028,477 4,968,633 232,617 110,426 5,912,484 1,915,557
- - - 2,335,448 3,143,142 13,753,427 67,896 72,344 70,848 86,980 1,158,420 972,323
3,519,851 2,449,883 2,672,672 2,455,478 2,807,223 2,572,916 813,892 549,072 564,076 969,070 947,633 1,318,783
3,264,603 2,974,224 2,599,006 2,446,272 2,142,553 528,929 11,128,967 13,367,639 15,179,142 14,595,947 12,926,970 2,891,644
622,565,774$ 539,406,475$ 514,748,751$ 509,005,556$ 526,728,821$ 479,314,758$
- 95 -
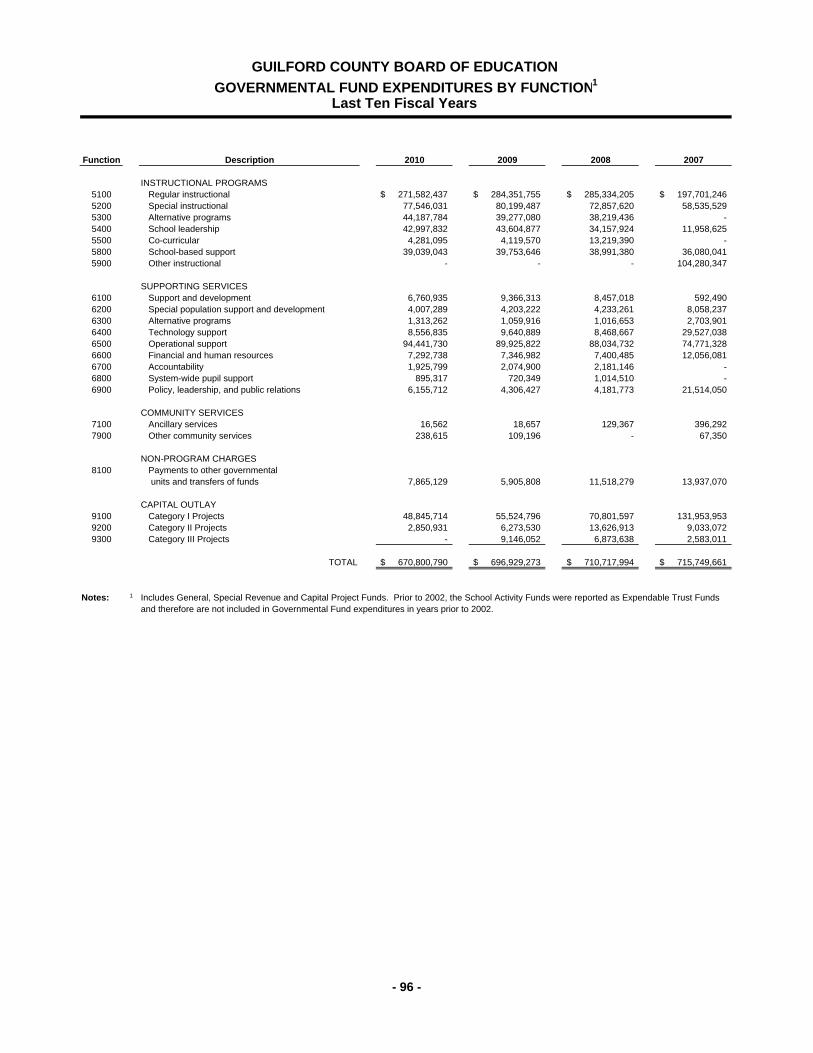
Function Description 2010 2009 2008 2007
INSTRUCTIONAL PROGRAMS5100 Regular instructional 271,582,437$ 284,351,755$ 285,334,205$ 197,701,246$ 5200 Special instructional 77,546,031 80,199,487 72,857,620 58,535,529 5300 Alternative programs 44,187,784 39,277,080 38,219,436 - 5400 School leadership 42,997,832 43,604,877 34,157,924 11,958,625 5500 Co-curricular 4,281,095 4,119,570 13,219,390 - 5800 School-based support 39,039,043 39,753,646 38,991,380 36,080,041 5900 Other instructional - - - 104,280,347
SUPPORTING SERVICES6100 Support and development 6,760,935 9,366,313 8,457,018 592,490 6200 Special population support and development 4,007,289 4,203,222 4,233,261 8,058,237 6300 Alternative programs 1,313,262 1,059,916 1,016,653 2,703,901 6400 Technology support 8,556,835 9,640,889 8,468,667 29,527,038 6500 Operational support 94,441,730 89,925,822 88,034,732 74,771,328 6600 Financial and human resources 7,292,738 7,346,982 7,400,485 12,056,081 6700 Accountability 1,925,799 2,074,900 2,181,146 - 6800 System-wide pupil support 895,317 720,349 1,014,510 - 6900 Policy, leadership, and public relations 6,155,712 4,306,427 4,181,773 21,514,050
COMMUNITY SERVICES7100 Ancillary services 16,562 18,657 129,367 396,292 7900 Other community services 238,615 109,196 - 67,350
NON-PROGRAM CHARGES8100 Payments to other governmental
units and transfers of funds 7,865,129 5,905,808 11,518,279 13,937,070
CAPITAL OUTLAY9100 Category I Projects 48,845,714 55,524,796 70,801,597 131,953,953 9200 Category II Projects 2,850,931 6,273,530 13,626,913 9,033,072 9300 Category III Projects - 9,146,052 6,873,638 2,583,011
TOTAL 670,800,790$ 696,929,273$ 710,717,994$ 715,749,661$
Notes: 1
GUILFORD COUNTY BOARD OF EDUCATION
GOVERNMENTAL FUND EXPENDITURES BY FUNCTION1
Last Ten Fiscal Years
Includes General, Special Revenue and Capital Project Funds. Prior to 2002, the School Activity Funds were reported as Expendable Trust Funds and therefore are not included in Governmental Fund expenditures in years prior to 2002.
- 96 -
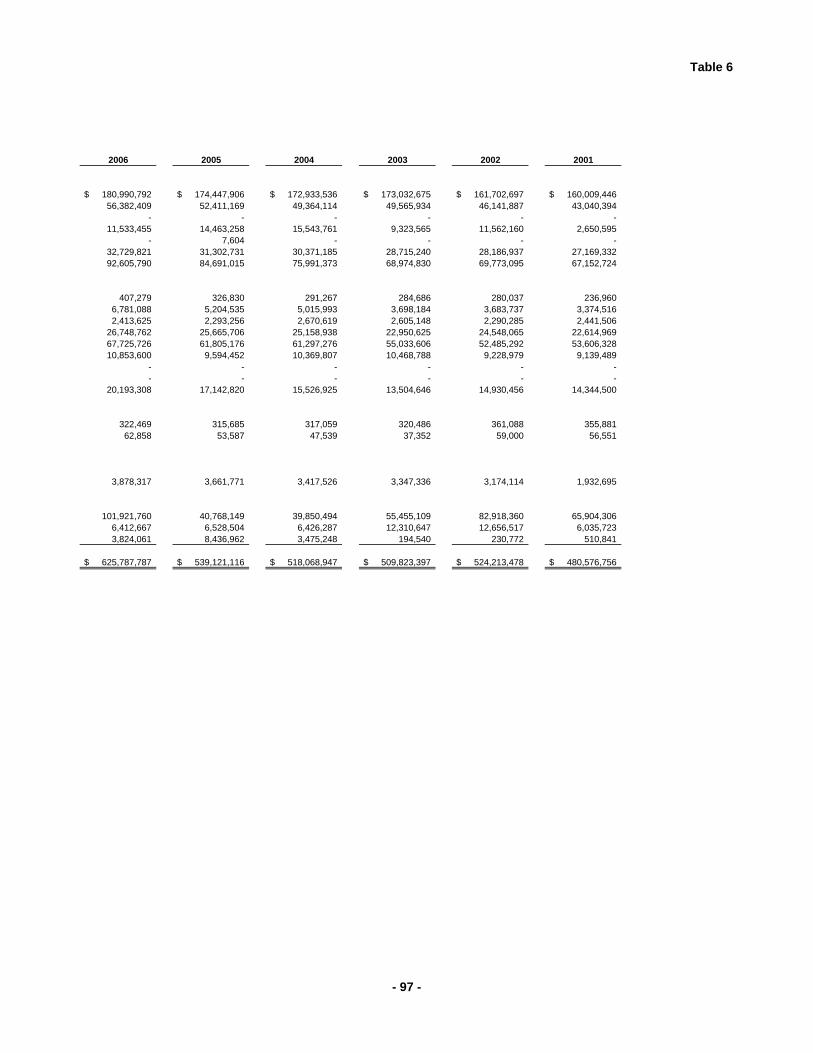
Table 6
2006 2005 2004 2003 2002 2001
180,990,792$ 174,447,906$ 172,933,536$ 173,032,675$ 161,702,697$ 160,009,446$ 56,382,409 52,411,169 49,364,114 49,565,934 46,141,887 43,040,394
- - - - - - 11,533,455 14,463,258 15,543,761 9,323,565 11,562,160 2,650,595
- 7,604 - - - - 32,729,821 31,302,731 30,371,185 28,715,240 28,186,937 27,169,332 92,605,790 84,691,015 75,991,373 68,974,830 69,773,095 67,152,724
407,279 326,830 291,267 284,686 280,037 236,960 6,781,088 5,204,535 5,015,993 3,698,184 3,683,737 3,374,516 2,413,625 2,293,256 2,670,619 2,605,148 2,290,285 2,441,506
26,748,762 25,665,706 25,158,938 22,950,625 24,548,065 22,614,969 67,725,726 61,805,176 61,297,276 55,033,606 52,485,292 53,606,328 10,853,600 9,594,452 10,369,807 10,468,788 9,228,979 9,139,489
- - - - - - - - - - - -
20,193,308 17,142,820 15,526,925 13,504,646 14,930,456 14,344,500
322,469 315,685 317,059 320,486 361,088 355,881 62,858 53,587 47,539 37,352 59,000 56,551
3,878,317 3,661,771 3,417,526 3,347,336 3,174,114 1,932,695
101,921,760 40,768,149 39,850,494 55,455,109 82,918,360 65,904,306 6,412,667 6,528,504 6,426,287 12,310,647 12,656,517 6,035,723 3,824,061 8,436,962 3,475,248 194,540 230,772 510,841
625,787,787$ 539,121,116$ 518,068,947$ 509,823,397$ 524,213,478$ 480,576,756$
- 97 -
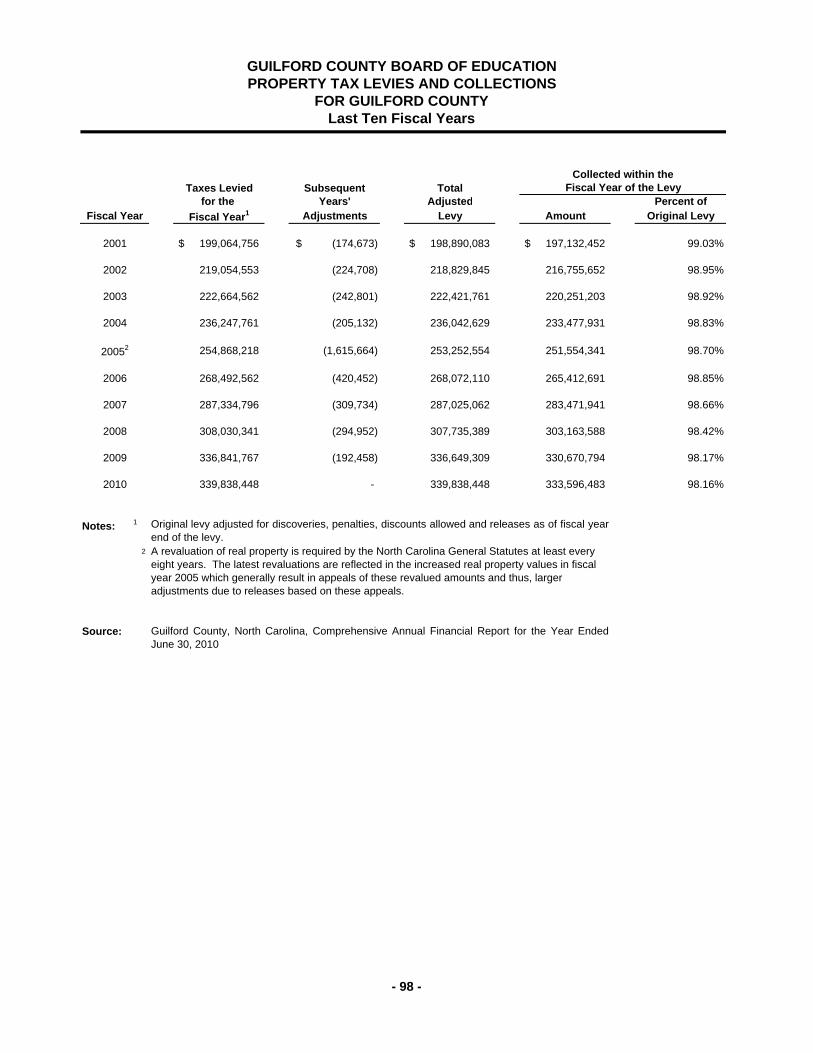
Taxes Levied Subsequent Totalfor the Years' Adjusted Percent of
Fiscal Year Fiscal Year1 Adjustments Levy Amount Original Levy
2001 199,064,756$ (174,673)$ 198,890,083$ 197,132,452$ 99.03%
2002 219,054,553 (224,708) 218,829,845 216,755,652 98.95%
2003 222,664,562 (242,801) 222,421,761 220,251,203 98.92%
2004 236,247,761 (205,132) 236,042,629 233,477,931 98.83%
20052 254,868,218 (1,615,664) 253,252,554 251,554,341 98.70%
2006 268,492,562 (420,452) 268,072,110 265,412,691 98.85%
2007 287,334,796 (309,734) 287,025,062 283,471,941 98.66%
2008 308,030,341 (294,952) 307,735,389 303,163,588 98.42%
2009 336,841,767 (192,458) 336,649,309 330,670,794 98.17%
2010 339,838,448 - 339,838,448 333,596,483 98.16%
Notes: 1
2
Source: Guilford County, North Carolina, Comprehensive Annual Financial Report for the Year EndedJune 30, 2010
GUILFORD COUNTY BOARD OF EDUCATION
Original levy adjusted for discoveries, penalties, discounts allowed and releases as of fiscal yearend of the levy.A revaluation of real property is required by the North Carolina General Statutes at least every eight years. The latest revaluations are reflected in the increased real property values in fiscal year 2005 which generally result in appeals of these revalued amounts and thus, larger adjustments due to releases based on these appeals.
Collected within theFiscal Year of the Levy
PROPERTY TAX LEVIES AND COLLECTIONS FOR GUILFORD COUNTY
Last Ten Fiscal Years
- 98 -
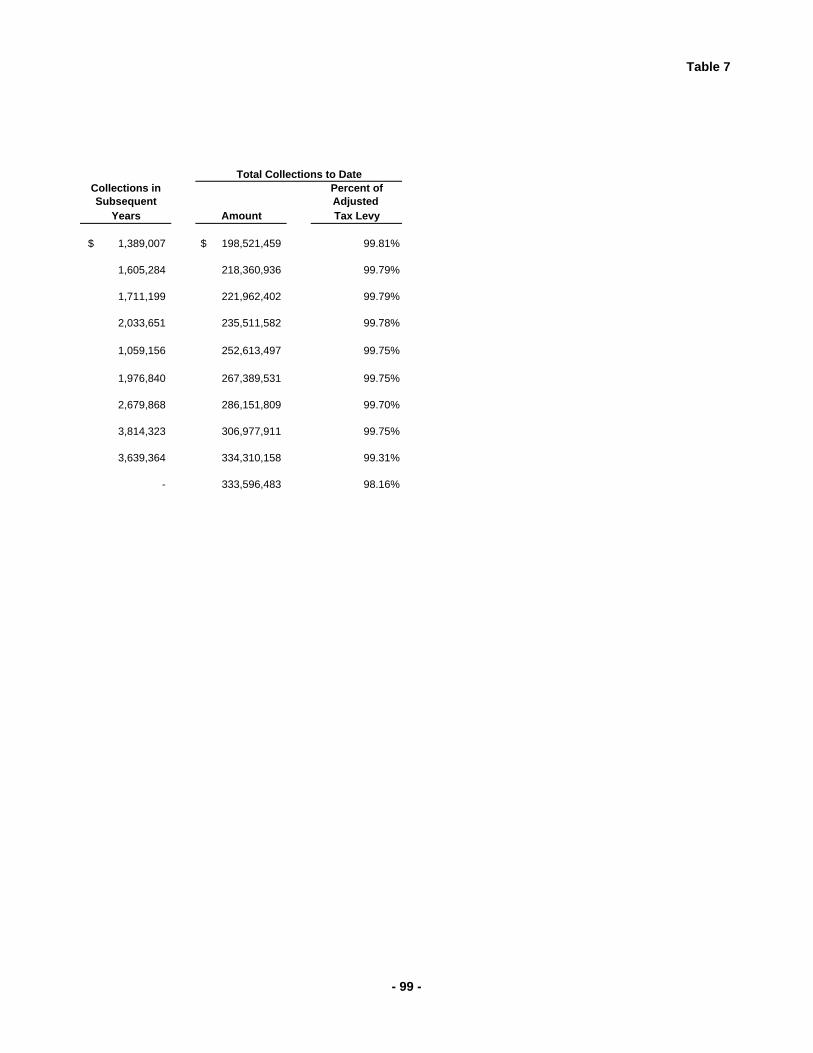
Table 7
Collections in Percent ofSubsequent Adjusted
Years Amount Tax Levy
1,389,007$ 198,521,459$ 99.81%
1,605,284 218,360,936 99.79%
1,711,199 221,962,402 99.79%
2,033,651 235,511,582 99.78%
1,059,156 252,613,497 99.75%
1,976,840 267,389,531 99.75%
2,679,868 286,151,809 99.70%
3,814,323 306,977,911 99.75%
3,639,364 334,310,158 99.31%
- 333,596,483 98.16%
Total Collections to Date
- 99 -
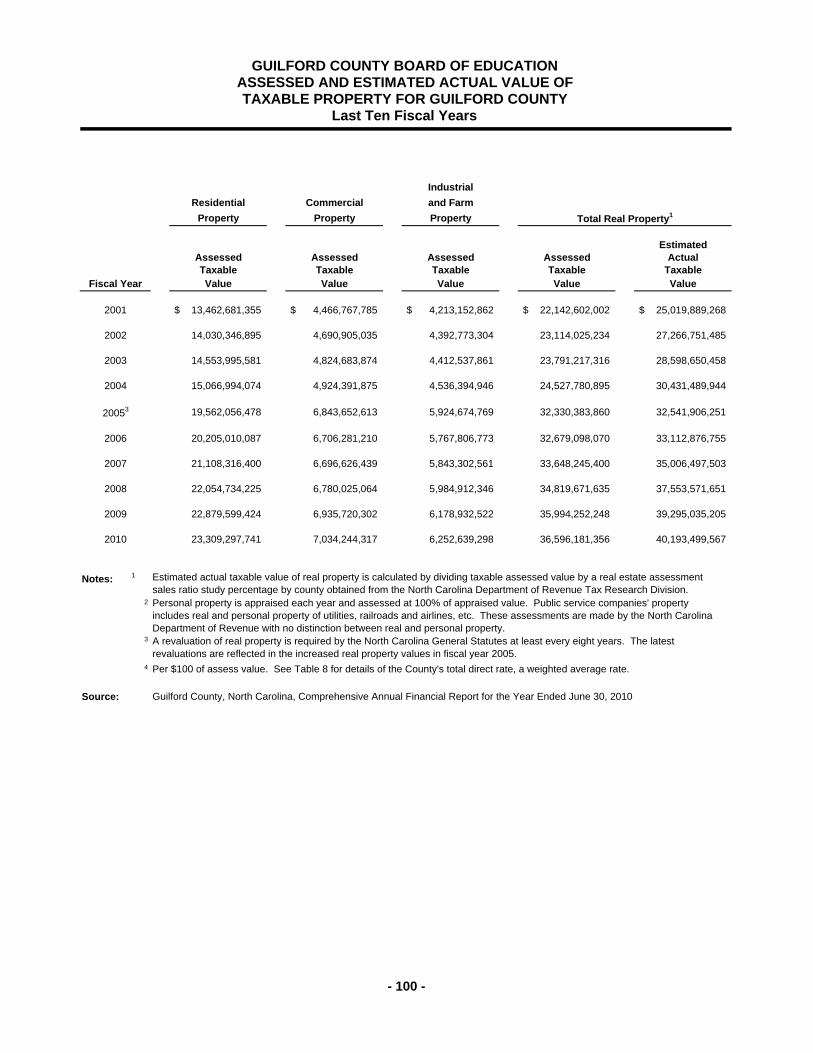
Industrial
Residential Commercial and Farm
Property Property Property
EstimatedAssessed Assessed Assessed Assessed ActualTaxable Taxable Taxable Taxable Taxable
Fiscal Year Value Value Value Value Value
2001 13,462,681,355$ 4,466,767,785$ 4,213,152,862$ 22,142,602,002$ 25,019,889,268$
2002 14,030,346,895 4,690,905,035 4,392,773,304 23,114,025,234 27,266,751,485
2003 14,553,995,581 4,824,683,874 4,412,537,861 23,791,217,316 28,598,650,458
2004 15,066,994,074 4,924,391,875 4,536,394,946 24,527,780,895 30,431,489,944
20053 19,562,056,478 6,843,652,613 5,924,674,769 32,330,383,860 32,541,906,251
2006 20,205,010,087 6,706,281,210 5,767,806,773 32,679,098,070 33,112,876,755
2007 21,108,316,400 6,696,626,439 5,843,302,561 33,648,245,400 35,006,497,503
2008 22,054,734,225 6,780,025,064 5,984,912,346 34,819,671,635 37,553,571,651
2009 22,879,599,424 6,935,720,302 6,178,932,522 35,994,252,248 39,295,035,205
2010 23,309,297,741 7,034,244,317 6,252,639,298 36,596,181,356 40,193,499,567
Notes: 1
2
3
4
Source:
Total Real Property1
GUILFORD COUNTY BOARD OF EDUCATION ASSESSED AND ESTIMATED ACTUAL VALUE OF TAXABLE PROPERTY FOR GUILFORD COUNTY
Last Ten Fiscal Years
Guilford County, North Carolina, Comprehensive Annual Financial Report for the Year Ended June 30, 2010
Estimated actual taxable value of real property is calculated by dividing taxable assessed value by a real estate assessment sales ratio study percentage by county obtained from the North Carolina Department of Revenue Tax Research Division.Personal property is appraised each year and assessed at 100% of appraised value. Public service companies' property includes real and personal property of utilities, railroads and airlines, etc. These assessments are made by the North Carolina Department of Revenue with no distinction between real and personal property.A revaluation of real property is required by the North Carolina General Statutes at least every eight years. The latest revaluations are reflected in the increased real property values in fiscal year 2005.
Per $100 of assess value. See Table 8 for details of the County's total direct rate, a weighted average rate.
- 100 -
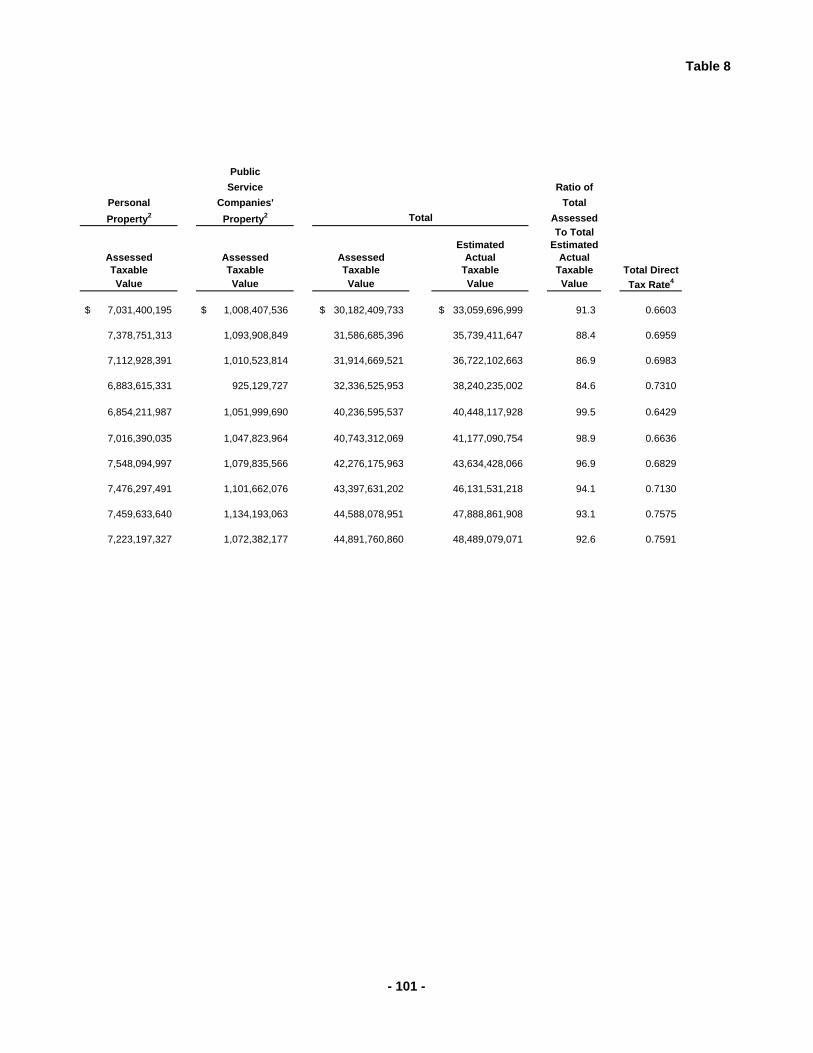
Table 8
Public
Service Ratio of
Personal Companies' Total
Property2 Property2 Assessed
To TotalEstimated Estimated
Assessed Assessed Assessed Actual ActualTaxable Taxable Taxable Taxable Taxable Total DirectValue Value Value Value Value Tax Rate4
7,031,400,195$ 1,008,407,536$ 30,182,409,733$ 33,059,696,999$ 91.3 0.6603
7,378,751,313 1,093,908,849 31,586,685,396 35,739,411,647 88.4 0.6959
7,112,928,391 1,010,523,814 31,914,669,521 36,722,102,663 86.9 0.6983
6,883,615,331 925,129,727 32,336,525,953 38,240,235,002 84.6 0.7310
6,854,211,987 1,051,999,690 40,236,595,537 40,448,117,928 99.5 0.6429
7,016,390,035 1,047,823,964 40,743,312,069 41,177,090,754 98.9 0.6636
7,548,094,997 1,079,835,566 42,276,175,963 43,634,428,066 96.9 0.6829
7,476,297,491 1,101,662,076 43,397,631,202 46,131,531,218 94.1 0.7130
7,459,633,640 1,134,193,063 44,588,078,951 47,888,861,908 93.1 0.7575
7,223,197,327 1,072,382,177 44,891,760,860 48,489,079,071 92.6 0.7591
Total
- 101 -
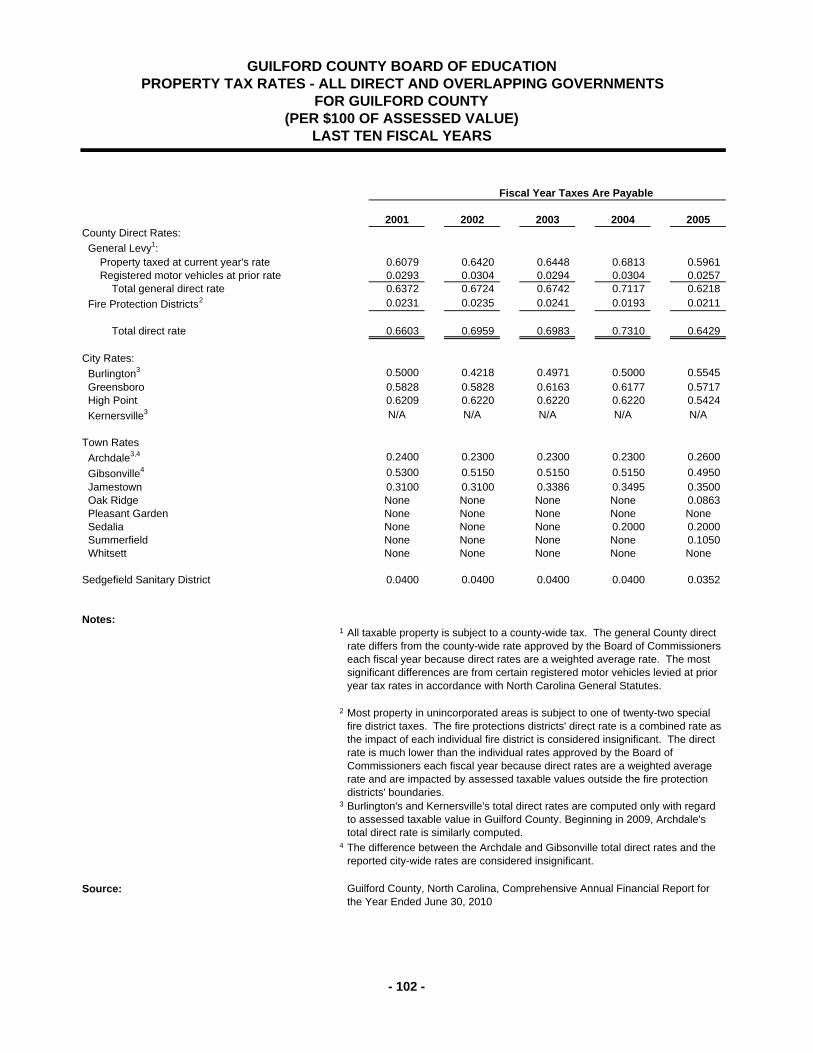
2001 2002 2003 2004 2005County Direct Rates:
General Levy1: Property taxed at current year's rate 0.6079 0.6420 0.6448 0.6813 0.5961 Registered motor vehicles at prior rate 0.0293 0.0304 0.0294 0.0304 0.0257 Total general direct rate 0.6372 0.6724 0.6742 0.7117 0.6218
Fire Protection Districts2 0.0231 0.0235 0.0241 0.0193 0.0211
Total direct rate 0.6603 0.6959 0.6983 0.7310 0.6429
City Rates:
Burlington3 0.5000 0.4218 0.4971 0.5000 0.5545 Greensboro 0.5828 0.5828 0.6163 0.6177 0.5717 High Point 0.6209 0.6220 0.6220 0.6220 0.5424
Kernersville3 N/A N/A N/A N/A N/A
Town Rates
Archdale3,4 0.2400 0.2300 0.2300 0.2300 0.2600
Gibsonville4 0.5300 0.5150 0.5150 0.5150 0.4950 Jamestown 0.3100 0.3100 0.3386 0.3495 0.3500 Oak Ridge None None None None 0.0863 Pleasant Garden None None None None None Sedalia None None None 0.2000 0.2000 Summerfield None None None None 0.1050 Whitsett None None None None None
Sedgefield Sanitary District 0.0400 0.0400 0.0400 0.0400 0.0352
Notes:1
2
3
4
Source:
All taxable property is subject to a county-wide tax. The general County direct rate differs from the county-wide rate approved by the Board of Commissioners each fiscal year because direct rates are a weighted average rate. The most significant differences are from certain registered motor vehicles levied at prior year tax rates in accordance with North Carolina General Statutes.
Fiscal Year Taxes Are Payable
GUILFORD COUNTY BOARD OF EDUCATION PROPERTY TAX RATES - ALL DIRECT AND OVERLAPPING GOVERNMENTS
FOR GUILFORD COUNTY (PER $100 OF ASSESSED VALUE)
LAST TEN FISCAL YEARS
Most property in unincorporated areas is subject to one of twenty-two special fire district taxes. The fire protections districts' direct rate is a combined rate as the impact of each individual fire district is considered insignificant. The direct rate is much lower than the individual rates approved by the Board of Commissioners each fiscal year because direct rates are a weighted average rate and are impacted by assessed taxable values outside the fire protection districts' boundaries.Burlington's and Kernersville's total direct rates are computed only with regard to assessed taxable value in Guilford County. Beginning in 2009, Archdale's total direct rate is similarly computed.
The difference between the Archdale and Gibsonville total direct rates and the reported city-wide rates are considered insignificant.
Guilford County, North Carolina, Comprehensive Annual Financial Report for the Year Ended June 30, 2010
- 102 -
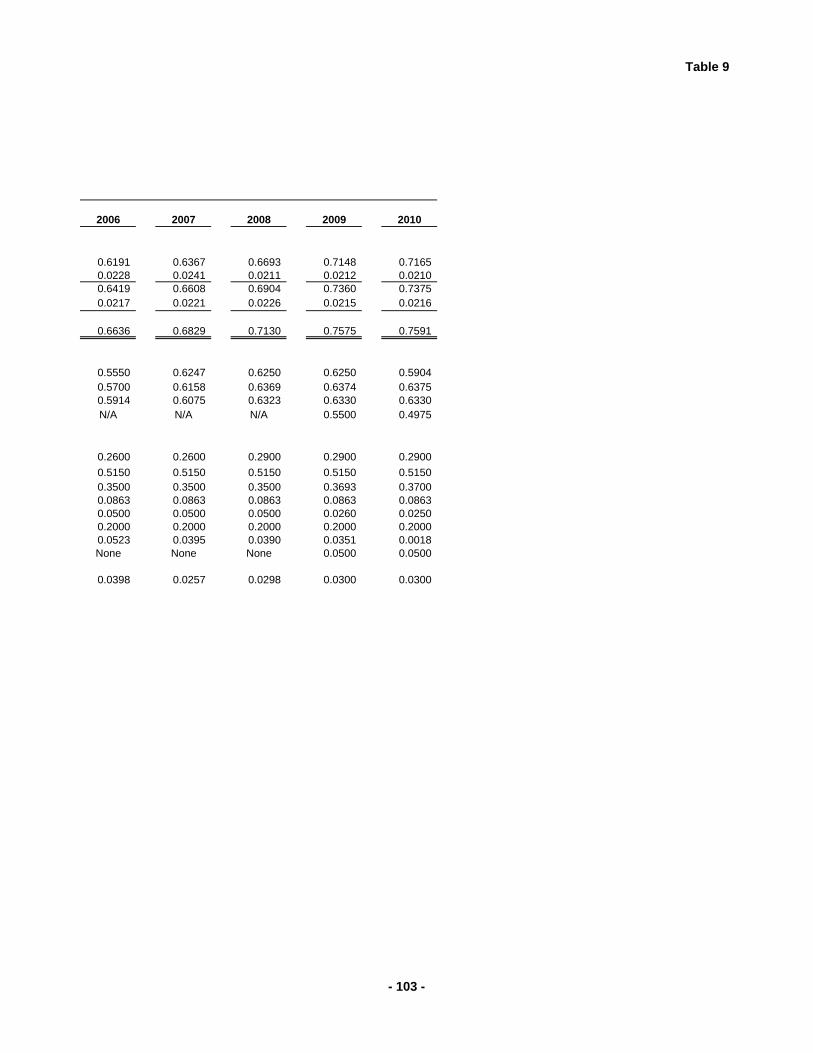
Table 9
2006 2007 2008 2009 2010
0.6191 0.6367 0.6693 0.7148 0.7165 0.0228 0.0241 0.0211 0.0212 0.0210 0.6419 0.6608 0.6904 0.7360 0.7375 0.0217 0.0221 0.0226 0.0215 0.0216
0.6636 0.6829 0.7130 0.7575 0.7591
0.5550 0.6247 0.6250 0.6250 0.5904 0.5700 0.6158 0.6369 0.6374 0.6375 0.5914 0.6075 0.6323 0.6330 0.6330 N/A N/A N/A 0.5500 0.4975
0.2600 0.2600 0.2900 0.2900 0.2900
0.5150 0.5150 0.5150 0.5150 0.5150 0.3500 0.3500 0.3500 0.3693 0.3700 0.0863 0.0863 0.0863 0.0863 0.0863 0.0500 0.0500 0.0500 0.0260 0.0250 0.2000 0.2000 0.2000 0.2000 0.2000 0.0523 0.0395 0.0390 0.0351 0.0018 None None None 0.0500 0.0500
0.0398 0.0257 0.0298 0.0300 0.0300
- 103 -
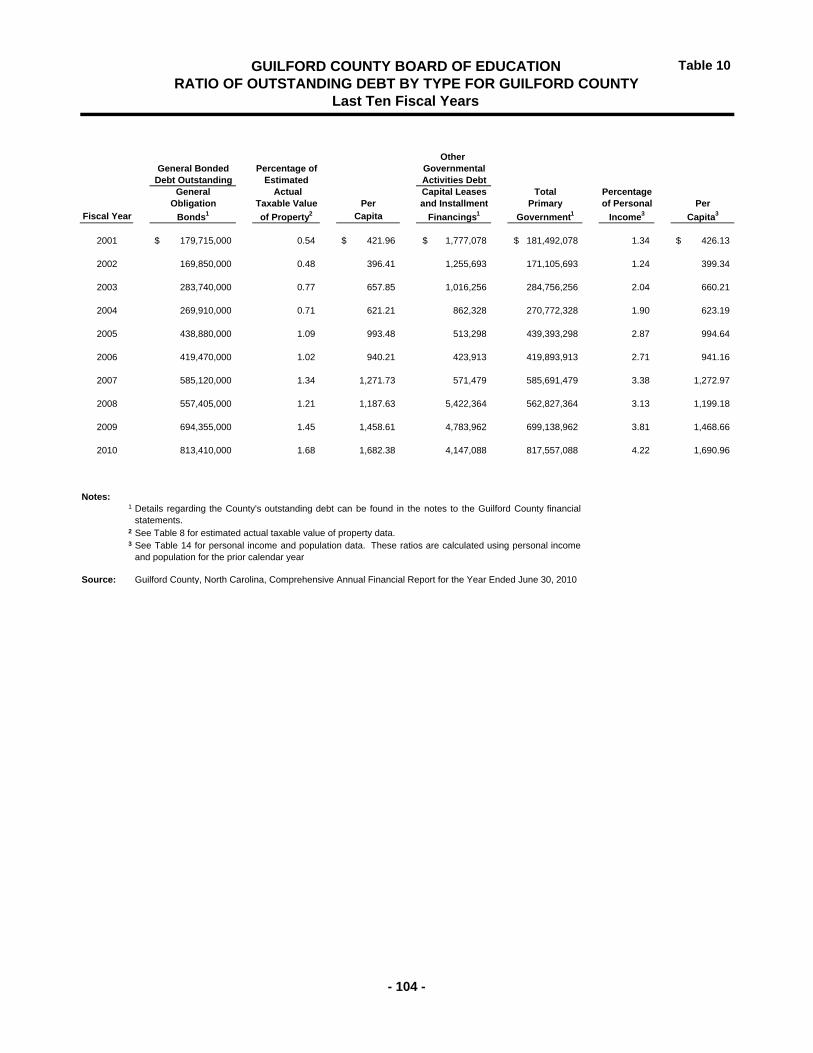
Table 10 .
Other General Bonded Percentage of Governmental
Debt Outstanding Estimated Activities DebtGeneral Actual Capital Leases Total Percentage
Obligation Taxable Value Per and Installment Primary of Personal PerFiscal Year Bonds1 of Property2 Capita Financings1 Government1 Income3 Capita3
2001 179,715,000$ 0.54 421.96$ 1,777,078$ 181,492,078$ 1.34 426.13$
2002 169,850,000 0.48 396.41 1,255,693 171,105,693 1.24 399.34
2003 283,740,000 0.77 657.85 1,016,256 284,756,256 2.04 660.21
2004 269,910,000 0.71 621.21 862,328 270,772,328 1.90 623.19
2005 438,880,000 1.09 993.48 513,298 439,393,298 2.87 994.64
2006 419,470,000 1.02 940.21 423,913 419,893,913 2.71 941.16
2007 585,120,000 1.34 1,271.73 571,479 585,691,479 3.38 1,272.97
2008 557,405,000 1.21 1,187.63 5,422,364 562,827,364 3.13 1,199.18
2009 694,355,000 1.45 1,458.61 4,783,962 699,138,962 3.81 1,468.66
2010 813,410,000 1.68 1,682.38 4,147,088 817,557,088 4.22 1,690.96
Notes: 1
2
3
Source:
GUILFORD COUNTY BOARD OF EDUCATION RATIO OF OUTSTANDING DEBT BY TYPE FOR GUILFORD COUNTY
Last Ten Fiscal Years
Guilford County, North Carolina, Comprehensive Annual Financial Report for the Year Ended June 30, 2010
Details regarding the County's outstanding debt can be found in the notes to the Guilford County financialstatements.See Table 8 for estimated actual taxable value of property data.See Table 14 for personal income and population data. These ratios are calculated using personal incomeand population for the prior calendar year.
- 104 -
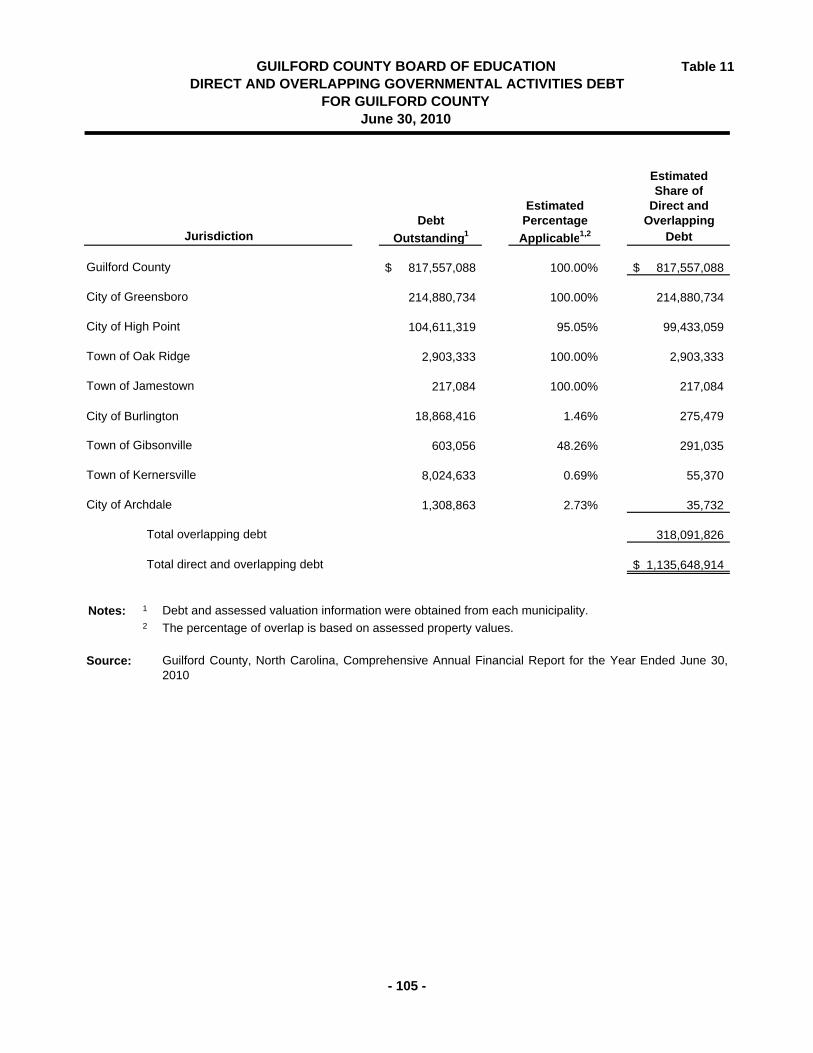
Table 11
EstimatedShare of
Estimated Direct andDebt Percentage Overlapping
Outstanding1 Applicable1,2 Debt
817,557,088$ 100.00% 817,557,088$
214,880,734 100.00% 214,880,734
104,611,319 95.05% 99,433,059
2,903,333 100.00% 2,903,333
217,084 100.00% 217,084
City of Burlington 18,868,416 1.46% 275,479
603,056 48.26% 291,035
8,024,633 0.69% 55,370
1,308,863 2.73% 35,732
318,091,826
1,135,648,914$
Notes: 1
2
Source:
Total direct and overlapping debt
City of High Point
Town of Jamestown
City of Archdale
Town of Gibsonville
Town of Oak Ridge
Town of Kernersville
Guilford County, North Carolina, Comprehensive Annual Financial Report for the Year Ended June 30,2010
Total overlapping debt
The percentage of overlap is based on assessed property values.
Debt and assessed valuation information were obtained from each municipality.
GUILFORD COUNTY BOARD OF EDUCATION DIRECT AND OVERLAPPING GOVERNMENTAL ACTIVITIES DEBT
FOR GUILFORD COUNTY June 30, 2010
City of Greensboro
Jurisdiction
Guilford County
- 105 -

- 106 -
THIS PAGE LEFT INTENTIONALLY BLANK.
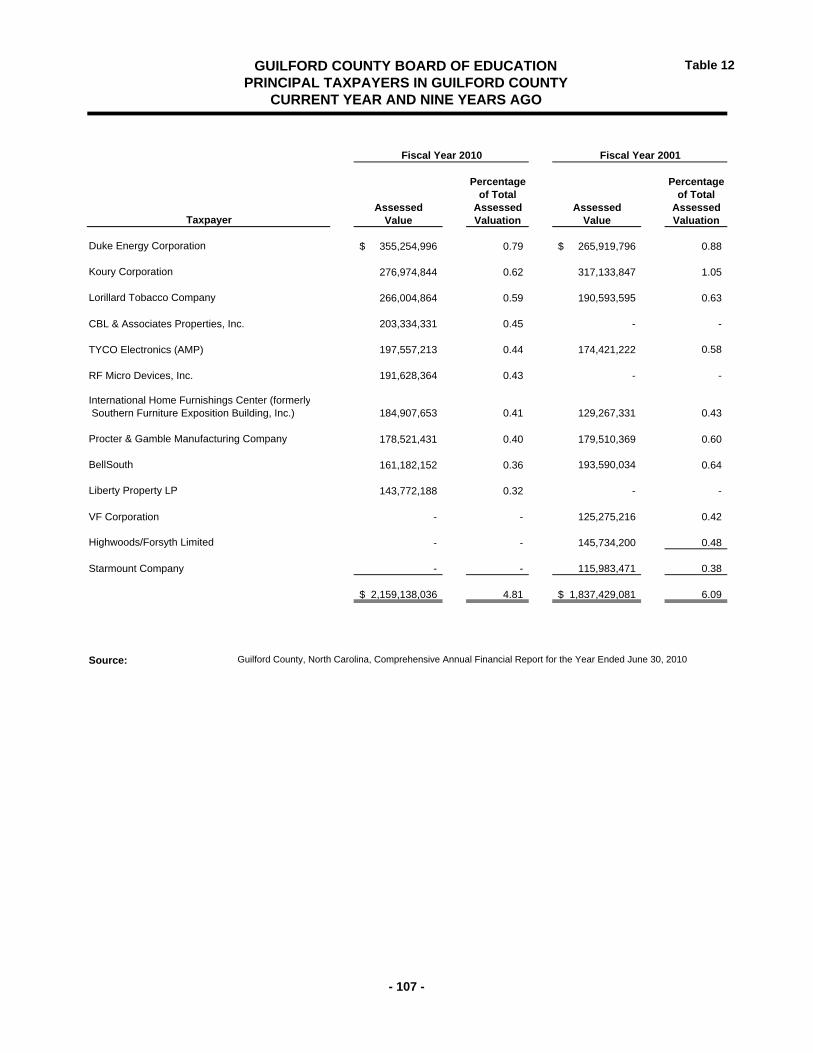
Table 12 .
Percentage Percentageof Total of Total
Assessed Assessed Assessed AssessedValue Valuation Value Valuation
355,254,996$ 0.79 265,919,796$ 0.88
276,974,844 0.62 317,133,847 1.05
266,004,864 0.59 190,593,595 0.63
CBL & Associates Properties, Inc. 203,334,331 0.45 - -
TYCO Electronics (AMP) 197,557,213 0.44 174,421,222 0.58
RF Micro Devices, Inc. 191,628,364 0.43 - -
184,907,653 0.41 129,267,331 0.43
178,521,431 0.40 179,510,369 0.60
161,182,152 0.36 193,590,034 0.64
143,772,188 0.32 - -
VF Corporation - - 125,275,216 0.42
- - 145,734,200 0.48
Starmount Company - - 115,983,471 0.38
2,159,138,036$ 4.81 1,837,429,081$ 6.09
Source:
GUILFORD COUNTY BOARD OF EDUCATION PRINCIPAL TAXPAYERS IN GUILFORD COUNTY
CURRENT YEAR AND NINE YEARS AGO
Fiscal Year 2010 Fiscal Year 2001
Guilford County, North Carolina, Comprehensive Annual Financial Report for the Year Ended June 30, 2010
Highwoods/Forsyth Limited
Liberty Property LP
International Home Furnishings Center (formerly Southern Furniture Exposition Building, Inc.)
Procter & Gamble Manufacturing Company
Taxpayer
BellSouth
Duke Energy Corporation
Koury Corporation
Lorillard Tobacco Company
- 107 -
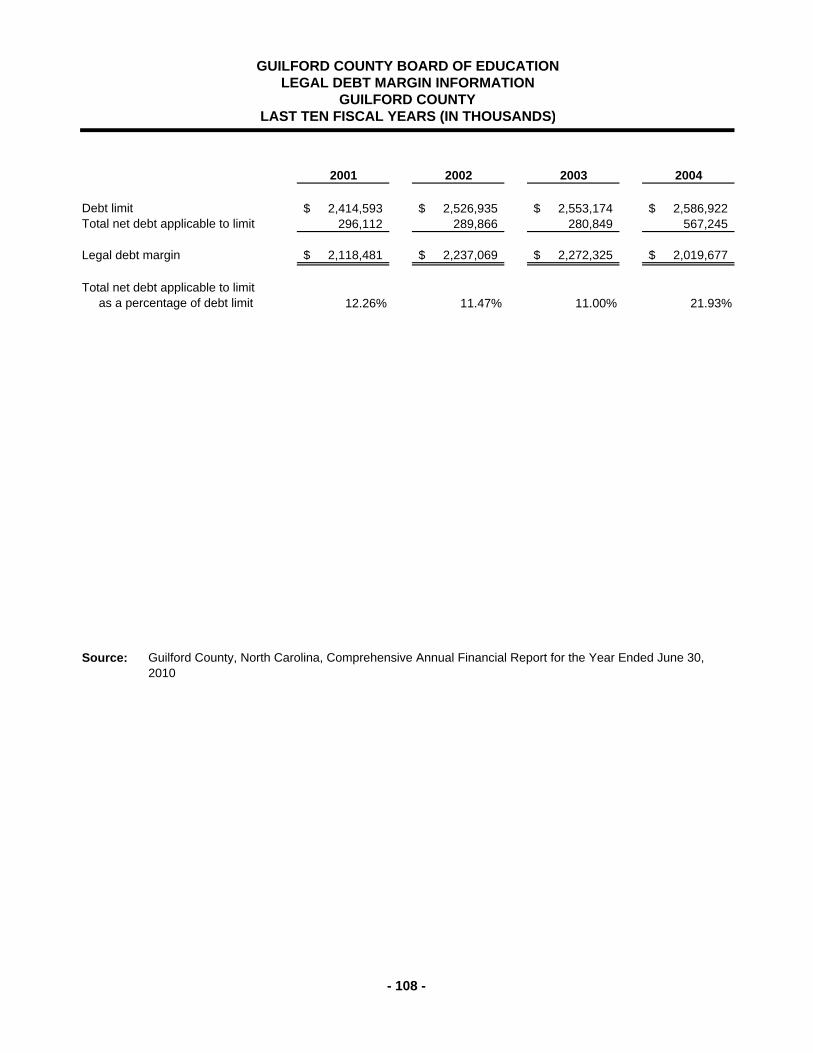
2001 2002 2003 2004
2,414,593$ 2,526,935$ 2,553,174$ 2,586,922$ 296,112 289,866 280,849 567,245
2,118,481$ 2,237,069$ 2,272,325$ 2,019,677$
12.26% 11.47% 11.00% 21.93%
Source: Guilford County, North Carolina, Comprehensive Annual Financial Report for the Year Ended June 30, 2010
Debt limitTotal net debt applicable to limit
Legal debt margin
GUILFORD COUNTY BOARD OF EDUCATIONLEGAL DEBT MARGIN INFORMATION
GUILFORD COUNTYLAST TEN FISCAL YEARS (IN THOUSANDS)
Total net debt applicable to limit as a percentage of debt limit
- 108 -
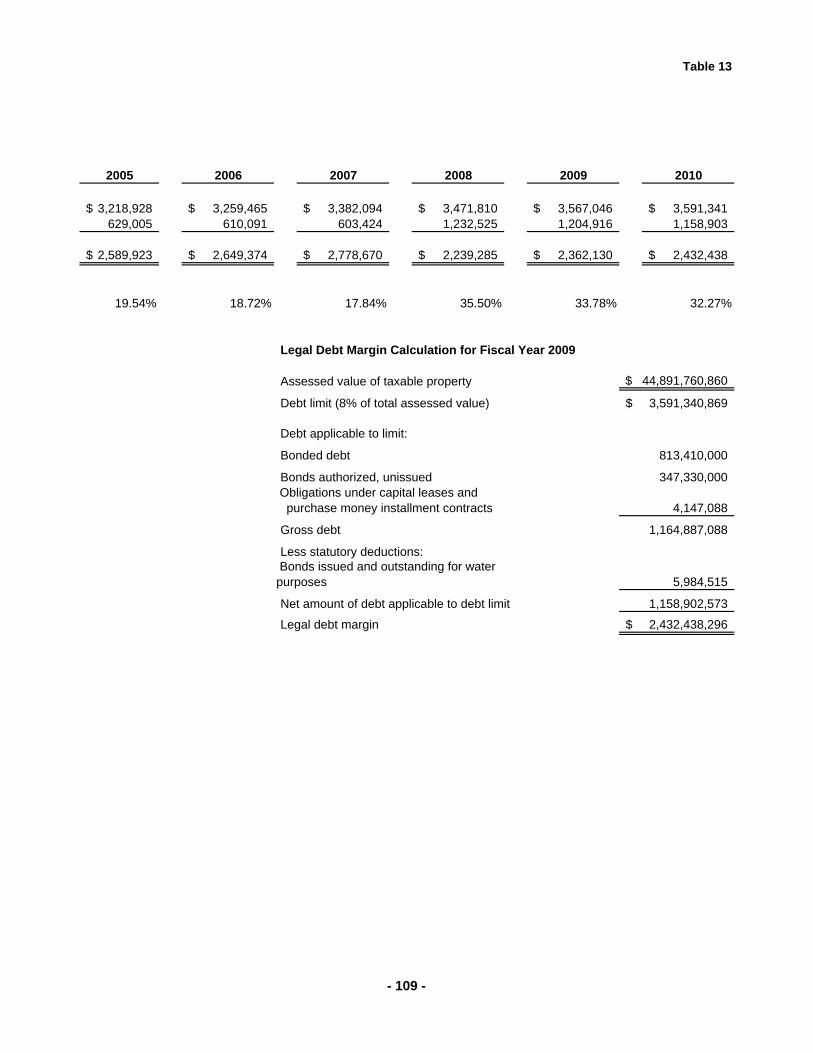
Table 13
2005 2006 2007 2008 2009 2010
3,218,928$ 3,259,465$ 3,382,094$ 3,471,810$ 3,567,046$ 3,591,341$ 629,005 610,091 603,424 1,232,525 1,204,916 1,158,903
2,589,923$ 2,649,374$ 2,778,670$ 2,239,285$ 2,362,130$ 2,432,438$
19.54% 18.72% 17.84% 35.50% 33.78% 32.27%
Legal Debt Margin Calculation for Fiscal Year 2009
Assessed value of taxable property
Debt limit (8% of total assessed value)
Debt applicable to limit:
Bonded debt
Bonds authorized, unissued
Gross debt
Less statutory deductions:
Net amount of debt applicable to debt limit
Legal debt margin
Bonds issued and outstanding for waterpurposes 5,984,515
813,410,000
347,330,000
4,147,088
2,432,438,296$
1,158,902,573
3,591,340,869$
Obligations under capital leases and purchase money installment contracts
1,164,887,088
44,891,760,860$
- 109 -
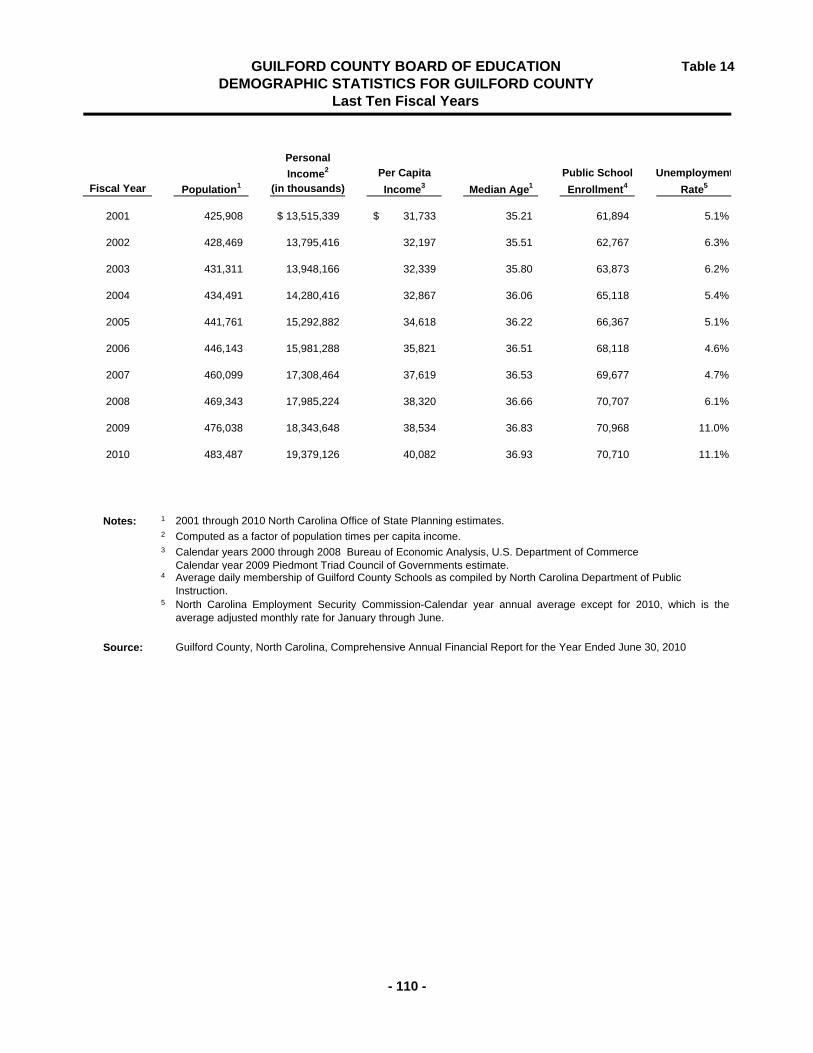
Table 14
Personal
Income2 Per Capita Public School Unemployment
Fiscal Year Population1 (in thousands) Income3 Median Age1 Enrollment4 Rate5
2001 425,908 13,515,339$ 31,733$ 35.21 61,894 5.1%
2002 428,469 13,795,416 32,197 35.51 62,767 6.3%
2003 431,311 13,948,166 32,339 35.80 63,873 6.2%
2004 434,491 14,280,416 32,867 36.06 65,118 5.4%
2005 441,761 15,292,882 34,618 36.22 66,367 5.1%
2006 446,143 15,981,288 35,821 36.51 68,118 4.6%
2007 460,099 17,308,464 37,619 36.53 69,677 4.7%
2008 469,343 17,985,224 38,320 36.66 70,707 6.1%
2009 476,038 18,343,648 38,534 36.83 70,968 11.0%
2010 483,487 19,379,126 40,082 36.93 70,710 11.1%
Notes: 1
2
3
4
5
Source: Guilford County, North Carolina, Comprehensive Annual Financial Report for the Year Ended June 30, 2010
Average daily membership of Guilford County Schools as compiled by North Carolina Department of PublicInstruction.
GUILFORD COUNTY BOARD OF EDUCATION DEMOGRAPHIC STATISTICS FOR GUILFORD COUNTY
Last Ten Fiscal Years
2001 through 2010 North Carolina Office of State Planning estimates.
Computed as a factor of population times per capita income.
Calendar years 2000 through 2008 Bureau of Economic Analysis, U.S. Department of CommerceCalendar year 2009 Piedmont Triad Council of Governments estimate.
North Carolina Employment Security Commission-Calendar year annual average except for 2010, which is theaverage adjusted monthly rate for January through June.
- 110 -
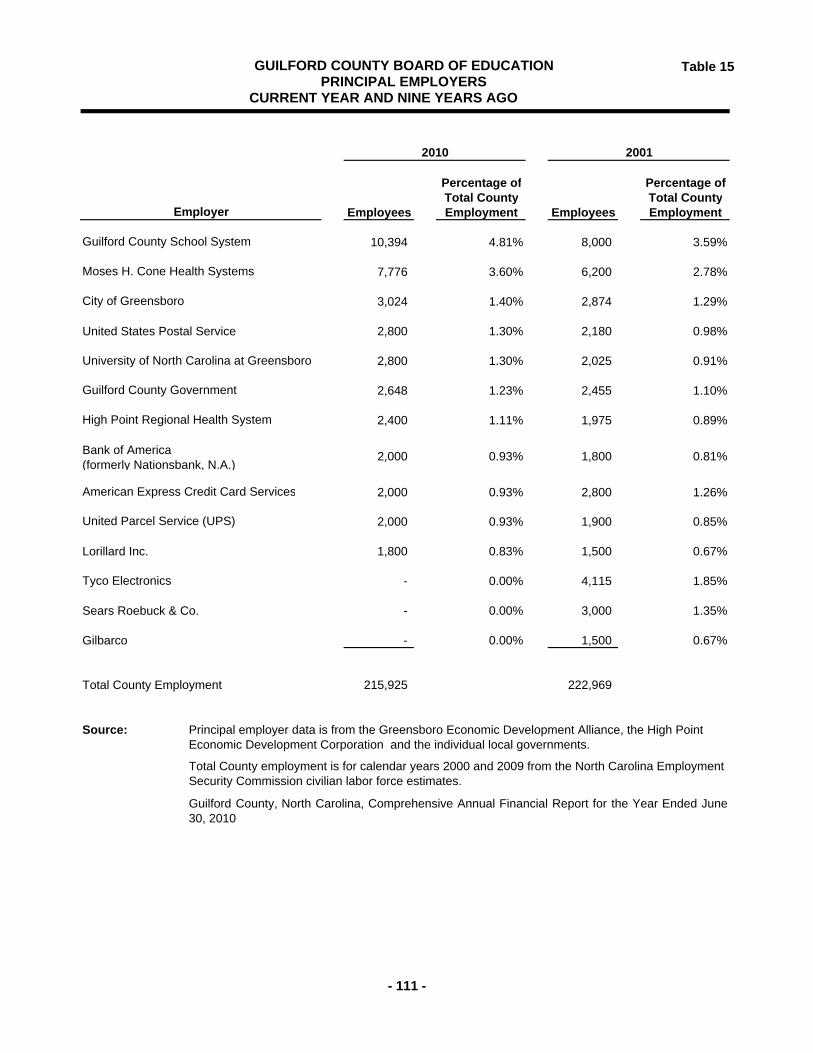
Table 15
Percentage of Percentage ofTotal County Total County
Employees Employment Employees Employment
10,394 4.81% 8,000 3.59%
7,776 3.60% 6,200 2.78%
3,024 1.40% 2,874 1.29%
United States Postal Service 2,800 1.30% 2,180 0.98%
University of North Carolina at Greensboro 2,800 1.30% 2,025 0.91%
2,648 1.23% 2,455 1.10%
2,400 1.11% 1,975 0.89%
2,000 0.93% 1,800 0.81%
2,000 0.93% 2,800 1.26%
2,000 0.93% 1,900 0.85%
1,800 0.83% 1,500 0.67%
Tyco Electronics - 0.00% 4,115 1.85%
Sears Roebuck & Co. - 0.00% 3,000 1.35%
Gilbarco - 0.00% 1,500 0.67%
Total County Employment 215,925 222,969
Source:
Guilford County, North Carolina, Comprehensive Annual Financial Report for the Year Ended June30, 2010
Principal employer data is from the Greensboro Economic Development Alliance, the High Point Economic Development Corporation and the individual local governments.
City of Greensboro
Guilford County Government
High Point Regional Health System
Moses H. Cone Health Systems
Lorillard Inc.
Total County employment is for calendar years 2000 and 2009 from the North Carolina Employment Security Commission civilian labor force estimates.
Employer
Guilford County School System
American Express Credit Card Services
Bank of America(formerly Nationsbank, N.A.)
United Parcel Service (UPS)
GUILFORD COUNTY BOARD OF EDUCATION PRINCIPAL EMPLOYERS
CURRENT YEAR AND NINE YEARS AGO
2010 2001
- 111 -
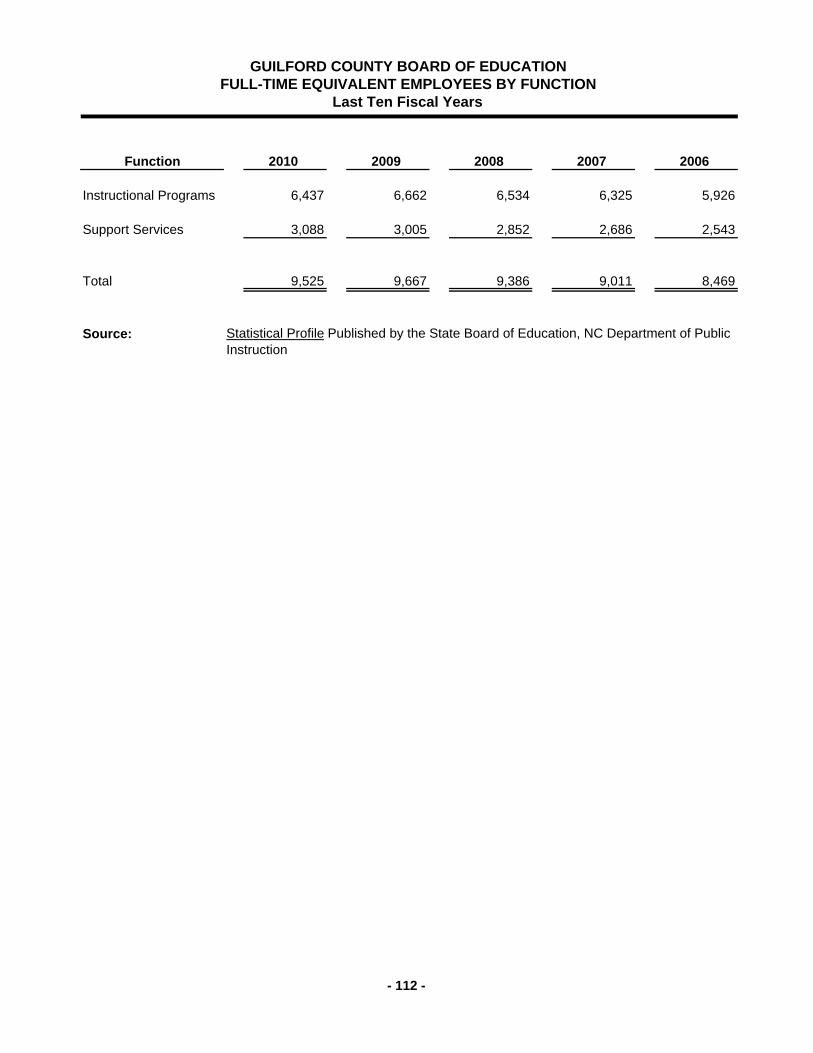
Function 2010 2009 2008 2007 2006
Instructional Programs 6,437 6,662 6,534 6,325 5,926
Support Services 3,088 3,005 2,852 2,686 2,543
Total 9,525 9,667 9,386 9,011 8,469
Source:
GUILFORD COUNTY BOARD OF EDUCATION FULL-TIME EQUIVALENT EMPLOYEES BY FUNCTION
Last Ten Fiscal Years
Statistical Profile Published by the State Board of Education, NC Department of Public Instruction
- 112 -
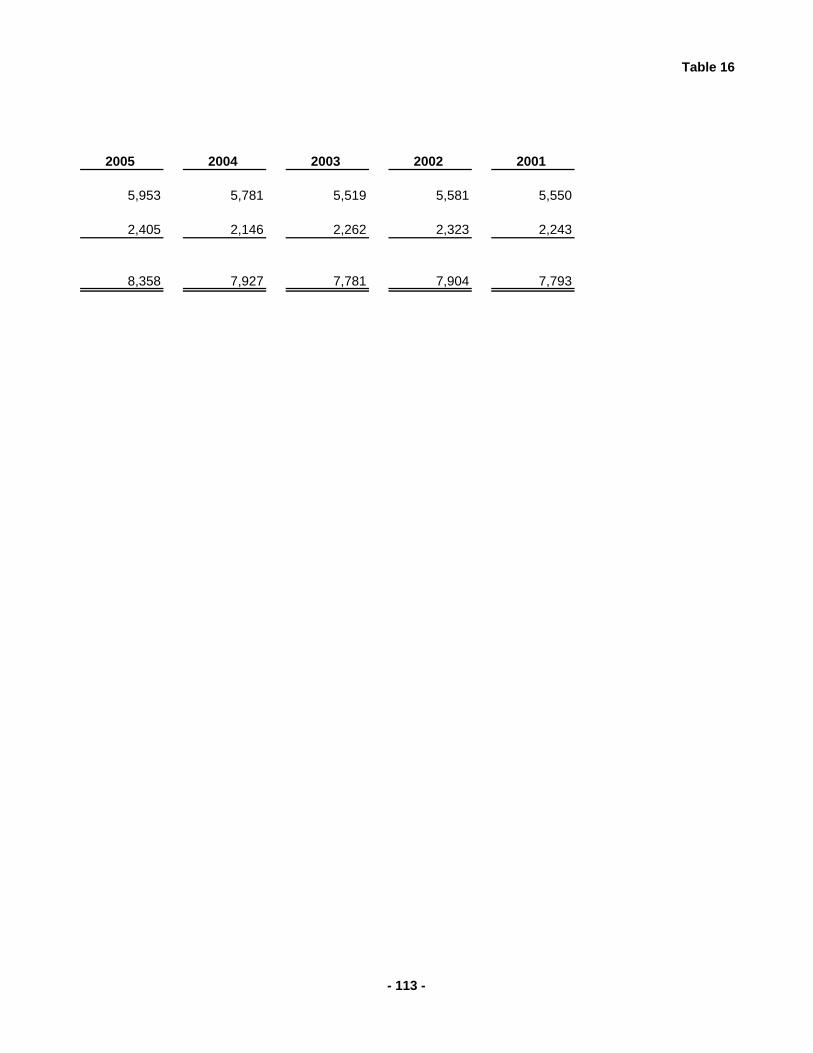
Table 16
2005 2004 2003 2002 2001
5,953 5,781 5,519 5,581 5,550
2,405 2,146 2,262 2,323 2,243
8,358 7,927 7,781 7,904 7,793
- 113 -
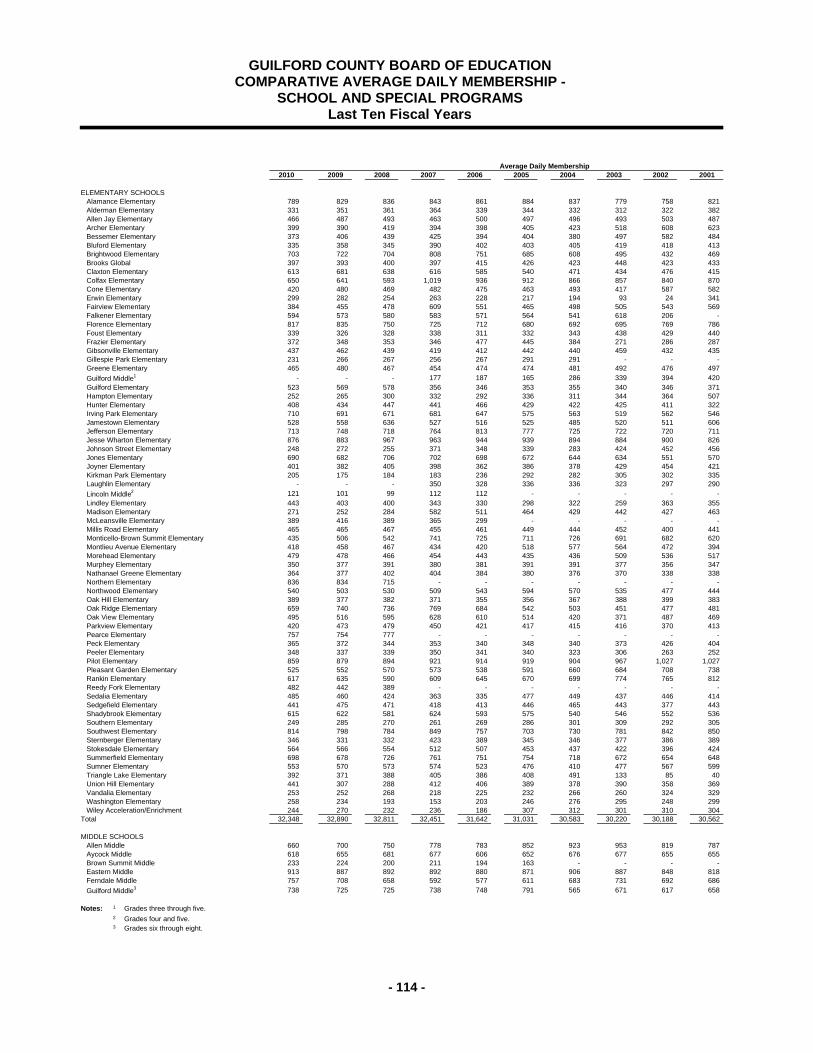
Average Daily Membership2010 2009 2008 2007 2006 2005 2004 2003 2002 2001
ELEMENTARY SCHOOLSAlamance Elementary 789 829 836 843 861 884 837 779 758 821 Alderman Elementary 331 351 361 364 339 344 332 312 322 382 Allen Jay Elementary 466 487 493 463 500 497 496 493 503 487 Archer Elementary 399 390 419 394 398 405 423 518 608 623 Bessemer Elementary 373 406 439 425 394 404 380 497 582 484 Bluford Elementary 335 358 345 390 402 403 405 419 418 413 Brightwood Elementary 703 722 704 808 751 685 608 495 432 469 Brooks Global 397 393 400 397 415 426 423 448 423 433 Claxton Elementary 613 681 638 616 585 540 471 434 476 415 Colfax Elementary 650 641 593 1,019 936 912 866 857 840 870 Cone Elementary 420 480 469 482 475 463 493 417 587 582 Erwin Elementary 299 282 254 263 228 217 194 93 24 341 Fairview Elementary 384 455 478 609 551 465 498 505 543 569 Falkener Elementary 594 573 580 583 571 564 541 618 206 - Florence Elementary 817 835 750 725 712 680 692 695 769 786 Foust Elementary 339 326 328 338 311 332 343 438 429 440 Frazier Elementary 372 348 353 346 477 445 384 271 286 287 Gibsonville Elementary 437 462 439 419 412 442 440 459 432 435 Gillespie Park Elementary 231 266 267 256 267 291 291 - - - Greene Elementary 465 480 467 454 474 474 481 492 476 497
Guilford Middle1 - - - 177 187 165 286 339 394 420 Guilford Elementary 523 569 578 356 346 353 355 340 346 371 Hampton Elementary 252 265 300 332 292 336 311 344 364 507 Hunter Elementary 408 434 447 441 466 429 422 425 411 322 Irving Park Elementary 710 691 671 681 647 575 563 519 562 546 Jamestown Elementary 528 558 636 527 516 525 485 520 511 606 Jefferson Elementary 713 748 718 764 813 777 725 722 720 711 Jesse Wharton Elementary 876 883 967 963 944 939 894 884 900 826 Johnson Street Elementary 248 272 255 371 348 339 283 424 452 456 Jones Elementary 690 682 706 702 698 672 644 634 551 570 Joyner Elementary 401 382 405 398 362 386 378 429 454 421 Kirkman Park Elementary 205 175 184 183 236 292 282 305 302 335 Laughlin Elementary - - - 350 328 336 336 323 297 290
Lincoln Middle2 121 101 99 112 112 - - - - - Lindley Elementary 443 403 400 343 330 298 322 259 363 355 Madison Elementary 271 252 284 582 511 464 429 442 427 463 McLeansville Elementary 389 416 389 365 299 - - - - - Millis Road Elementary 465 465 467 455 461 449 444 452 400 441 Monticello-Brown Summit Elementary 435 506 542 741 725 711 726 691 682 620 Montlieu Avenue Elementary 418 458 467 434 420 518 577 564 472 394 Morehead Elementary 479 478 466 454 443 435 436 509 536 517 Murphey Elementary 350 377 391 380 381 391 391 377 356 347 Nathanael Greene Elementary 364 377 402 404 384 380 376 370 338 338 Northern Elementary 836 834 715 - - - - - - - Northwood Elementary 540 503 530 509 543 594 570 535 477 444 Oak Hill Elementary 389 377 382 371 355 356 367 388 399 383 Oak Ridge Elementary 659 740 736 769 684 542 503 451 477 481 Oak View Elementary 495 516 595 628 610 514 420 371 487 469 Parkview Elementary 420 473 479 450 421 417 415 416 370 413 Pearce Elementary 757 754 777 - - - - - - - Peck Elementary 365 372 344 353 340 348 340 373 426 404 Peeler Elementary 348 337 339 350 341 340 323 306 263 252 Pilot Elementary 859 879 894 921 914 919 904 967 1,027 1,027 Pleasant Garden Elementary 525 552 570 573 538 591 660 684 708 738 Rankin Elementary 617 635 590 609 645 670 699 774 765 812 Reedy Fork Elementary 482 442 389 - - - - - - - Sedalia Elementary 485 460 424 363 335 477 449 437 446 414 Sedgefield Elementary 441 475 471 418 413 446 465 443 377 443 Shadybrook Elementary 615 622 581 624 593 575 540 546 552 536 Southern Elementary 249 285 270 261 269 286 301 309 292 305 Southwest Elementary 814 798 784 849 757 703 730 781 842 850 Sternberger Elementary 346 331 332 423 389 345 346 377 386 389 Stokesdale Elementary 564 566 554 512 507 453 437 422 396 424 Summerfield Elementary 698 678 726 761 751 754 718 672 654 648 Sumner Elementary 553 570 573 574 523 476 410 477 567 599 Triangle Lake Elementary 392 371 388 405 386 408 491 133 85 40 Union Hill Elementary 441 307 288 412 406 389 378 390 358 369 Vandalia Elementary 253 252 268 218 225 232 266 260 324 329 Washington Elementary 258 234 193 153 203 246 276 295 248 299 Wiley Acceleration/Enrichment 244 270 232 236 186 307 312 301 310 304
Total 32,348 32,890 32,811 32,451 31,642 31,031 30,583 30,220 30,188 30,562
MIDDLE SCHOOLSAllen Middle 660 700 750 778 783 852 923 953 819 787 Aycock Middle 618 655 681 677 606 652 676 677 655 655 Brown Summit Middle 233 224 200 211 194 163 - - - - Eastern Middle 913 887 892 892 880 871 906 887 848 818 Ferndale Middle 757 708 658 592 577 611 683 731 692 686
Guilford Middle3 738 725 725 738 748 791 565 671 617 658
Notes: 1 Grades three through five.2 Grades four and five.3 Grades six through eight.
Last Ten Fiscal Years SCHOOL AND SPECIAL PROGRAMS
COMPARATIVE AVERAGE DAILY MEMBERSHIP - GUILFORD COUNTY BOARD OF EDUCATION
- 114 -
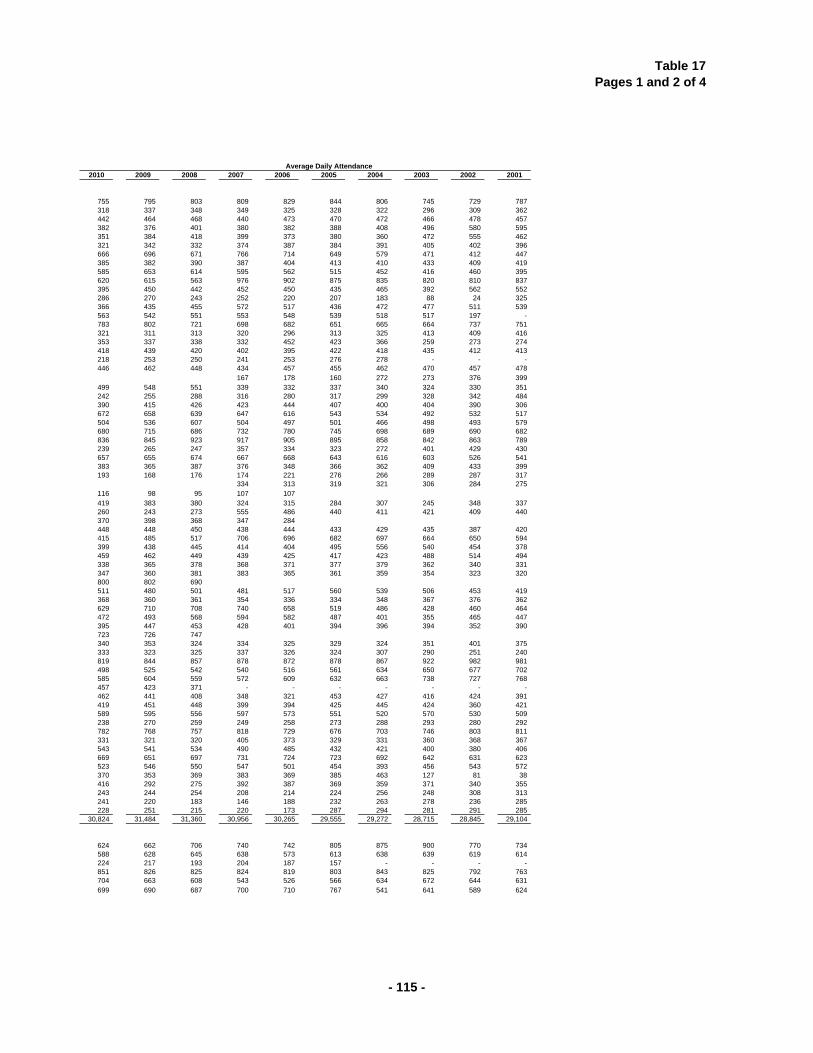
Table 17Pages 1 and 2 of 4
Average Daily Attendance2010 2009 2008 2007 2006 2005 2004 2003 2002 2001
755 795 803 809 829 844 806 745 729 787 318 337 348 349 325 328 322 296 309 362 442 464 468 440 473 470 472 466 478 457 382 376 401 380 382 388 408 496 580 595 351 384 418 399 373 380 360 472 555 462 321 342 332 374 387 384 391 405 402 396 666 696 671 766 714 649 579 471 412 447 385 382 390 387 404 413 410 433 409 419 585 653 614 595 562 515 452 416 460 395 620 615 563 976 902 875 835 820 810 837 395 450 442 452 450 435 465 392 562 552 286 270 243 252 220 207 183 88 24 325 366 435 455 572 517 436 472 477 511 539 563 542 551 553 548 539 518 517 197 - 783 802 721 698 682 651 665 664 737 751 321 311 313 320 296 313 325 413 409 416 353 337 338 332 452 423 366 259 273 274 418 439 420 402 395 422 418 435 412 413 218 253 250 241 253 276 278 - - - 446 462 448 434 457 455 462 470 457 478
167 178 160 272 273 376 399 499 548 551 339 332 337 340 324 330 351 242 255 288 316 280 317 299 328 342 484 390 415 426 423 444 407 400 404 390 306 672 658 639 647 616 543 534 492 532 517 504 536 607 504 497 501 466 498 493 579 680 715 686 732 780 745 698 689 690 682 836 845 923 917 905 895 858 842 863 789 239 265 247 357 334 323 272 401 429 430 657 655 674 667 668 643 616 603 526 541 383 365 387 376 348 366 362 409 433 399 193 168 176 174 221 276 266 289 287 317
334 313 319 321 306 284 275 116 98 95 107 107 419 383 380 324 315 284 307 245 348 337 260 243 273 555 486 440 411 421 409 440 370 398 368 347 284 448 448 450 438 444 433 429 435 387 420 415 485 517 706 696 682 697 664 650 594 399 438 445 414 404 495 556 540 454 378 459 462 449 439 425 417 423 488 514 494 338 365 378 368 371 377 379 362 340 331 347 360 381 383 365 361 359 354 323 320 800 802 690 511 480 501 481 517 560 539 506 453 419 368 360 361 354 336 334 348 367 376 362 629 710 708 740 658 519 486 428 460 464 472 493 568 594 582 487 401 355 465 447 395 447 453 428 401 394 396 394 352 390 723 726 747 340 353 324 334 325 329 324 351 401 375 333 323 325 337 326 324 307 290 251 240 819 844 857 878 872 878 867 922 982 981 498 525 542 540 516 561 634 650 677 702 585 604 559 572 609 632 663 738 727 768 457 423 371 - - - - - - - 462 441 408 348 321 453 427 416 424 391 419 451 448 399 394 425 445 424 360 421 589 595 556 597 573 551 520 570 530 509 238 270 259 249 258 273 288 293 280 292 782 768 757 818 729 676 703 746 803 811 331 321 320 405 373 329 331 360 368 367 543 541 534 490 485 432 421 400 380 406 669 651 697 731 724 723 692 642 631 623 523 546 550 547 501 454 393 456 543 572 370 353 369 383 369 385 463 127 81 38 416 292 275 392 387 369 359 371 340 355 243 244 254 208 214 224 256 248 308 313 241 220 183 146 188 232 263 278 236 285 228 251 215 220 173 287 294 281 291 285
30,824 31,484 31,360 30,956 30,265 29,555 29,272 28,715 28,845 29,104
624 662 706 740 742 805 875 900 770 734 588 628 645 638 573 613 638 639 619 614 224 217 193 204 187 157 - - - - 851 826 825 824 819 803 843 825 792 763 704 663 608 543 526 566 634 672 644 631 699 690 687 700 710 767 541 641 589 624
- 115 -
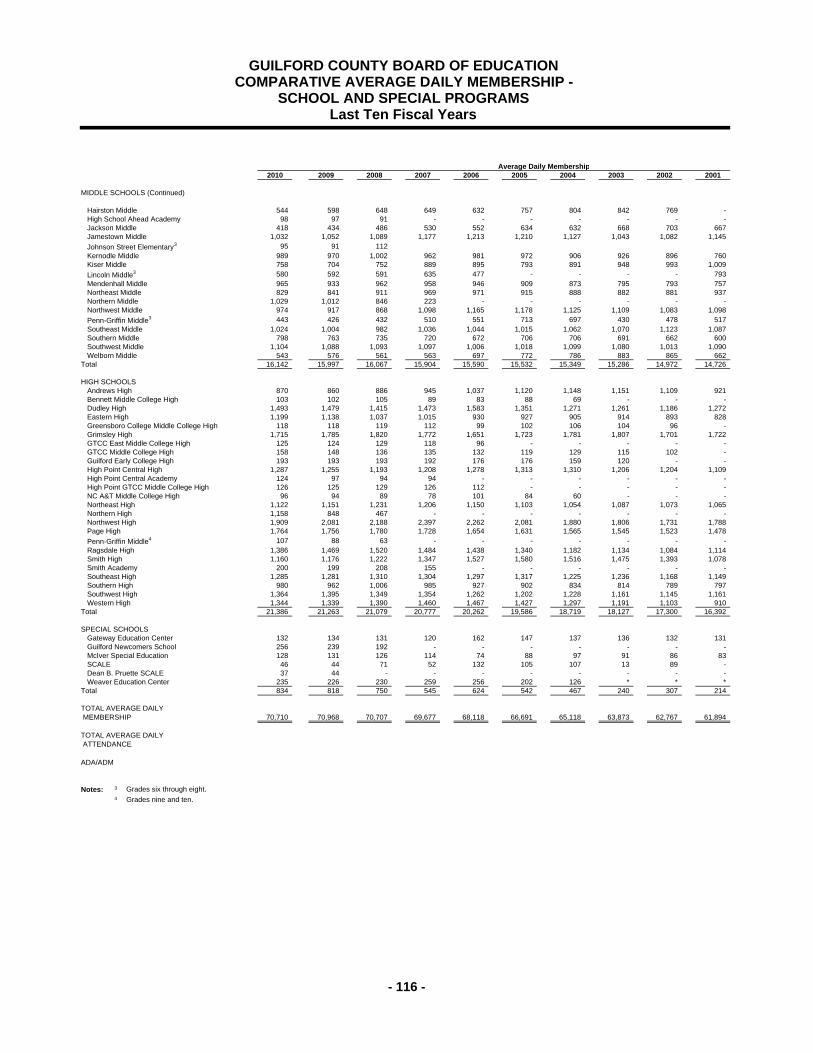
Average Daily Membership2010 2009 2008 2007 2006 2005 2004 2003 2002 2001
MIDDLE SCHOOLS (Continued)
Hairston Middle 544 598 648 649 632 757 804 842 769 - High School Ahead Academy 98 97 91 - - - - - - - Jackson Middle 418 434 486 530 552 634 632 668 703 667 Jamestown Middle 1,032 1,052 1,089 1,177 1,213 1,210 1,127 1,043 1,082 1,145
Johnson Street Elementary3 95 91 112 Kernodle Middle 989 970 1,002 962 981 972 906 926 896 760 Kiser Middle 758 704 752 889 895 793 891 948 993 1,009
Lincoln Middle3 580 592 591 635 477 - - - - 793 Mendenhall Middle 965 933 962 958 946 909 873 795 793 757 Northeast Middle 829 841 911 969 971 915 888 882 881 937 Northern Middle 1,029 1,012 846 223 - - - - - - Northwest Middle 974 917 868 1,098 1,165 1,178 1,125 1,109 1,083 1,098
Penn-Griffin Middle3 443 426 432 510 551 713 697 430 478 517 Southeast Middle 1,024 1,004 982 1,036 1,044 1,015 1,062 1,070 1,123 1,087 Southern Middle 798 763 735 720 672 706 706 691 662 600 Southwest Middle 1,104 1,088 1,093 1,097 1,006 1,018 1,099 1,080 1,013 1,090 Welborn Middle 543 576 561 563 697 772 786 883 865 662
Total 16,142 15,997 16,067 15,904 15,590 15,532 15,349 15,286 14,972 14,726
HIGH SCHOOLSAndrews High 870 860 886 945 1,037 1,120 1,148 1,151 1,109 921 Bennett Middle College High 103 102 105 89 83 88 69 - - - Dudley High 1,493 1,479 1,415 1,473 1,583 1,351 1,271 1,261 1,186 1,272 Eastern High 1,199 1,138 1,037 1,015 930 927 905 914 893 828 Greensboro College Middle College High 118 118 119 112 99 102 106 104 96 - Grimsley High 1,715 1,785 1,820 1,772 1,651 1,723 1,781 1,807 1,701 1,722 GTCC East Middle College High 125 124 129 118 96 - - - - - GTCC Middle College High 158 148 136 135 132 119 129 115 102 - Guilford Early College High 193 193 193 192 176 176 159 120 - - High Point Central High 1,287 1,255 1,193 1,208 1,278 1,313 1,310 1,206 1,204 1,109 High Point Central Academy 124 97 94 94 - - - - - - High Point GTCC Middle College High 126 125 129 126 112 - - - - - NC A&T Middle College High 96 94 89 78 101 84 60 - - - Northeast High 1,122 1,151 1,231 1,206 1,150 1,103 1,054 1,087 1,073 1,065 Northern High 1,158 848 467 - - - - - - - Northwest High 1,909 2,081 2,188 2,397 2,262 2,081 1,880 1,806 1,731 1,788 Page High 1,764 1,756 1,780 1,728 1,654 1,631 1,565 1,545 1,523 1,478
Penn-Griffin Middle4 107 88 63 - - - - - - - Ragsdale High 1,386 1,469 1,520 1,484 1,438 1,340 1,182 1,134 1,084 1,114 Smith High 1,160 1,176 1,222 1,347 1,527 1,580 1,516 1,475 1,393 1,078 Smith Academy 200 199 208 155 - - - - - - Southeast High 1,285 1,281 1,310 1,304 1,297 1,317 1,225 1,236 1,168 1,149 Southern High 980 962 1,006 985 927 902 834 814 789 797 Southwest High 1,364 1,395 1,349 1,354 1,262 1,202 1,228 1,161 1,145 1,161 Western High 1,344 1,339 1,390 1,460 1,467 1,427 1,297 1,191 1,103 910
Total 21,386 21,263 21,079 20,777 20,262 19,586 18,719 18,127 17,300 16,392
SPECIAL SCHOOLSGateway Education Center 132 134 131 120 162 147 137 136 132 131 Guilford Newcomers School 256 239 192 - - - - - - - McIver Special Education 128 131 126 114 74 88 97 91 86 83 SCALE 46 44 71 52 132 105 107 13 89 - Dean B. Pruette SCALE 37 44 - - - - - - - - Weaver Education Center 235 226 230 259 256 202 126 * * *
Total 834 818 750 545 624 542 467 240 307 214
TOTAL AVERAGE DAILY MEMBERSHIP 70,710 70,968 70,707 69,677 68,118 66,691 65,118 63,873 62,767 61,894
TOTAL AVERAGE DAILY ATTENDANCE
ADA/ADM
Notes: 3 Grades six through eight.4 Grades nine and ten.
Last Ten Fiscal Years SCHOOL AND SPECIAL PROGRAMS
COMPARATIVE AVERAGE DAILY MEMBERSHIP - GUILFORD COUNTY BOARD OF EDUCATION
- 116 -
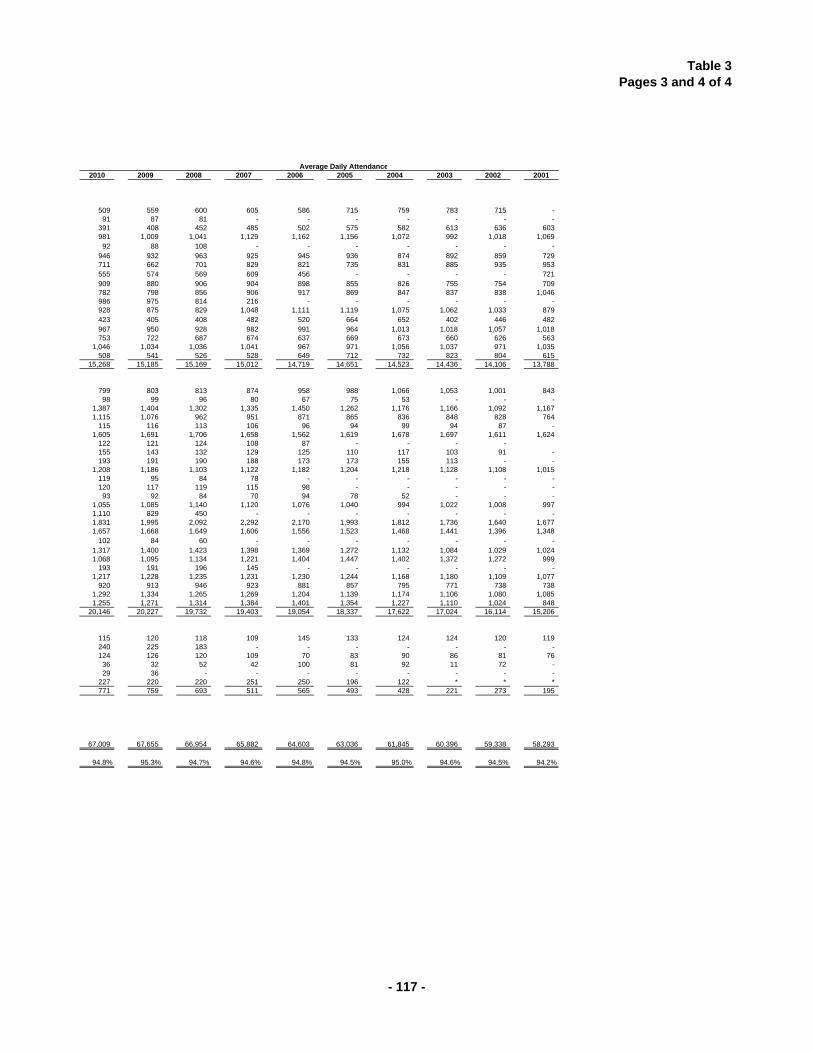
Table 3Pages 3 and 4 of 4
Average Daily Attendance2010 2009 2008 2007 2006 2005 2004 2003 2002 2001
509 559 600 605 586 715 759 783 715 - 91 87 81 - - - - - - -
391 408 452 485 502 575 582 613 636 603 981 1,009 1,041 1,129 1,162 1,156 1,072 992 1,018 1,069 92 88 108 - - - - - - -
946 932 963 925 945 936 874 892 859 729 711 662 701 829 821 735 831 885 935 953 555 574 569 609 456 - - - - 721 909 880 906 904 898 855 826 755 754 709 782 798 856 906 917 869 847 837 838 1,046 986 975 814 216 - - - - - - 928 875 829 1,048 1,111 1,119 1,075 1,062 1,033 879 423 405 408 482 520 664 652 402 446 482 967 950 928 982 991 964 1,013 1,018 1,057 1,018 753 722 687 674 637 669 673 660 626 563
1,046 1,034 1,036 1,041 967 971 1,056 1,037 971 1,035 508 541 526 528 649 712 732 823 804 615
15,268 15,185 15,169 15,012 14,719 14,651 14,523 14,436 14,106 13,788
799 803 813 874 958 988 1,066 1,053 1,001 843 98 99 96 80 67 75 53 - - -
1,387 1,404 1,302 1,335 1,450 1,262 1,176 1,166 1,092 1,167 1,115 1,076 962 951 871 865 836 848 828 764
115 116 113 106 96 94 99 94 87 - 1,605 1,691 1,706 1,658 1,562 1,619 1,678 1,697 1,611 1,624
122 121 124 108 87 - - - - 155 143 132 129 125 110 117 103 91 - 193 191 190 188 173 173 155 113 - -
1,208 1,186 1,103 1,122 1,182 1,204 1,218 1,128 1,108 1,015 119 95 84 78 - - - - - - 120 117 119 115 98 - - - - - 93 92 84 70 94 78 52 - - -
1,055 1,085 1,140 1,120 1,076 1,040 994 1,022 1,008 997 1,110 829 450 - - - - - - - 1,831 1,995 2,092 2,292 2,170 1,993 1,812 1,736 1,640 1,677 1,657 1,668 1,649 1,606 1,556 1,523 1,468 1,441 1,396 1,348
102 84 60 - - - - - - - 1,317 1,400 1,423 1,398 1,369 1,272 1,132 1,084 1,029 1,024 1,068 1,095 1,134 1,221 1,404 1,447 1,402 1,372 1,272 999
193 191 196 145 - - - - - - 1,217 1,228 1,235 1,231 1,230 1,244 1,168 1,180 1,109 1,077
920 913 946 923 881 857 795 771 738 738 1,292 1,334 1,265 1,269 1,204 1,139 1,174 1,106 1,080 1,085 1,255 1,271 1,314 1,384 1,401 1,354 1,227 1,110 1,024 848
20,146 20,227 19,732 19,403 19,054 18,337 17,622 17,024 16,114 15,206
115 120 118 109 145 133 124 124 120 119 240 225 183 - - - - - - - 124 126 120 109 70 83 90 86 81 76 36 32 52 42 100 81 92 11 72 - 29 36 - - - - - - - -
227 220 220 251 250 196 122 * * *771 759 693 511 565 493 428 221 273 195
67,009 67,655 66,954 65,882 64,603 63,036 61,845 60,396 59,338 58,293
94.8% 95.3% 94.7% 94.6% 94.8% 94.5% 95.0% 94.6% 94.5% 94.2%
- 117 -
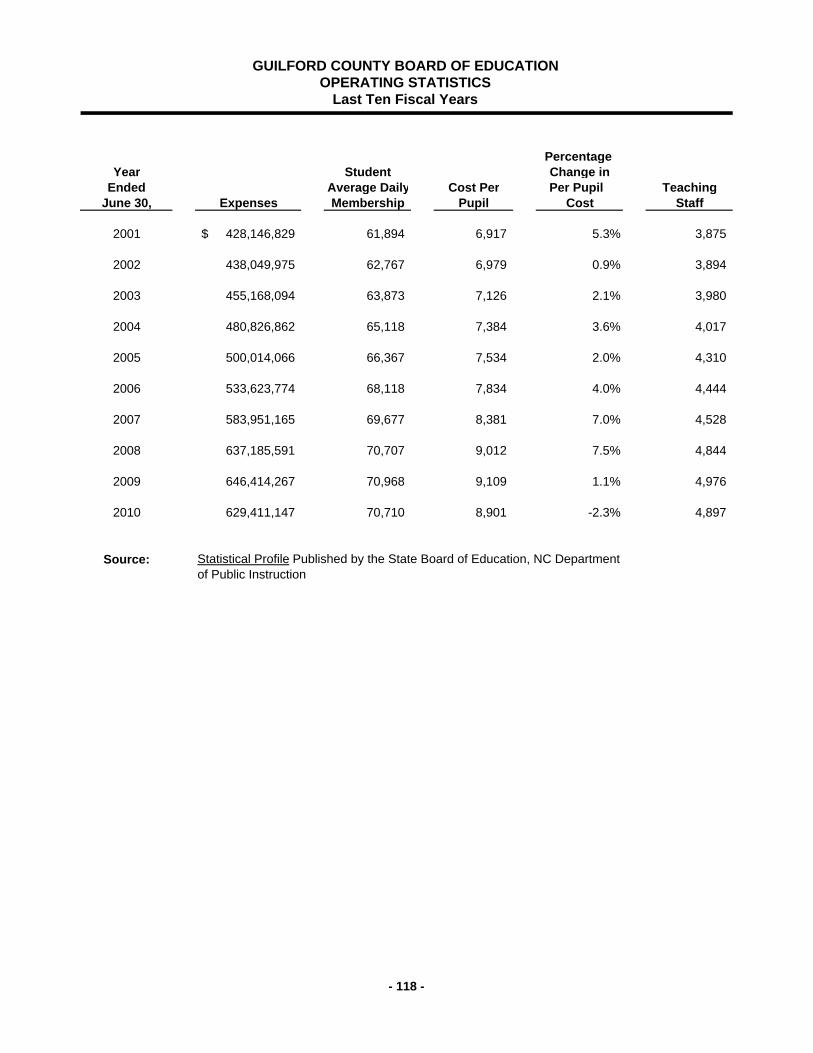
Percentage Year Student Change in
Ended Average Daily Cost Per Per Pupil TeachingJune 30, Expenses Membership Pupil Cost Staff
2001 428,146,829$ 61,894 6,917 5.3% 3,875
2002 438,049,975 62,767 6,979 0.9% 3,894
2003 455,168,094 63,873 7,126 2.1% 3,980
2004 480,826,862 65,118 7,384 3.6% 4,017
2005 500,014,066 66,367 7,534 2.0% 4,310
2006 533,623,774 68,118 7,834 4.0% 4,444
2007 583,951,165 69,677 8,381 7.0% 4,528
2008 637,185,591 70,707 9,012 7.5% 4,844
2009 646,414,267 70,968 9,109 1.1% 4,976
2010 629,411,147 70,710 8,901 -2.3% 4,897
Source: Statistical Profile Published by the State Board of Education, NC Department of Public Instruction
GUILFORD COUNTY BOARD OF EDUCATION OPERATING STATISTICS
Last Ten Fiscal Years
- 118 -
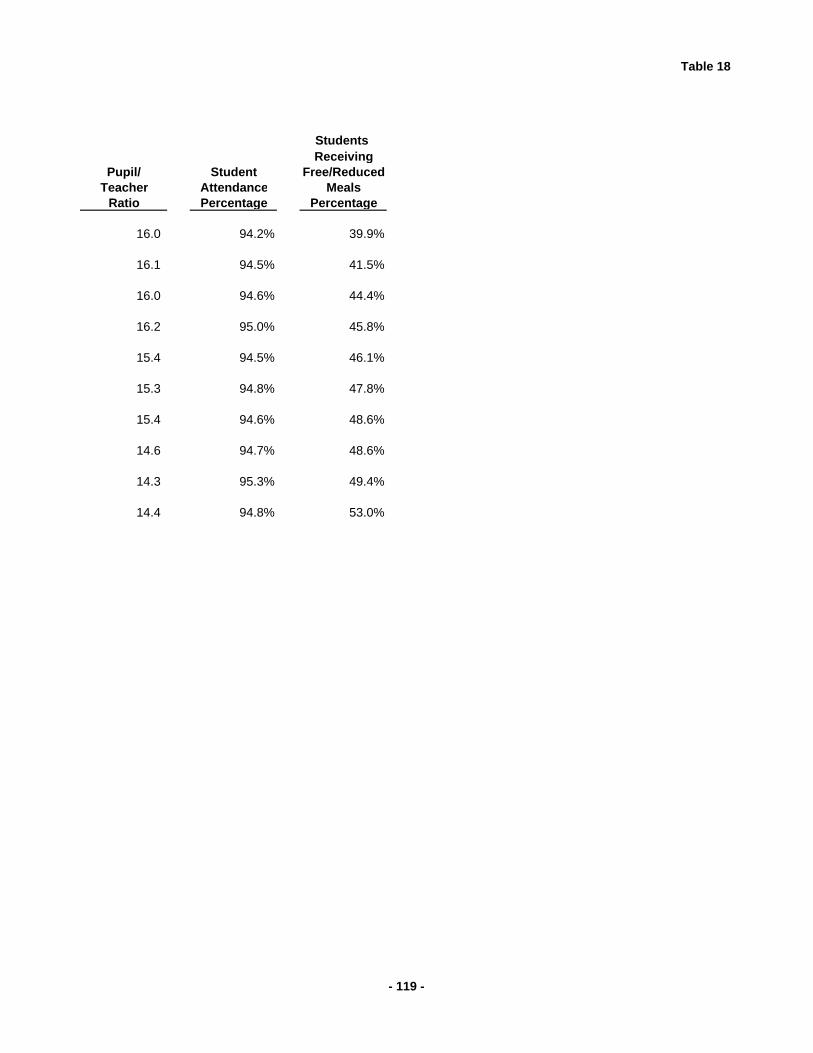
Table 18
Students Receiving
Pupil/ Student Free/ReducedTeacher Attendance Meals
Ratio Percentage Percentage
16.0 94.2% 39.9%
16.1 94.5% 41.5%
16.0 94.6% 44.4%
16.2 95.0% 45.8%
15.4 94.5% 46.1%
15.3 94.8% 47.8%
15.4 94.6% 48.6%
14.6 94.7% 48.6%
14.3 95.3% 49.4%
14.4 94.8% 53.0%
- 119 -
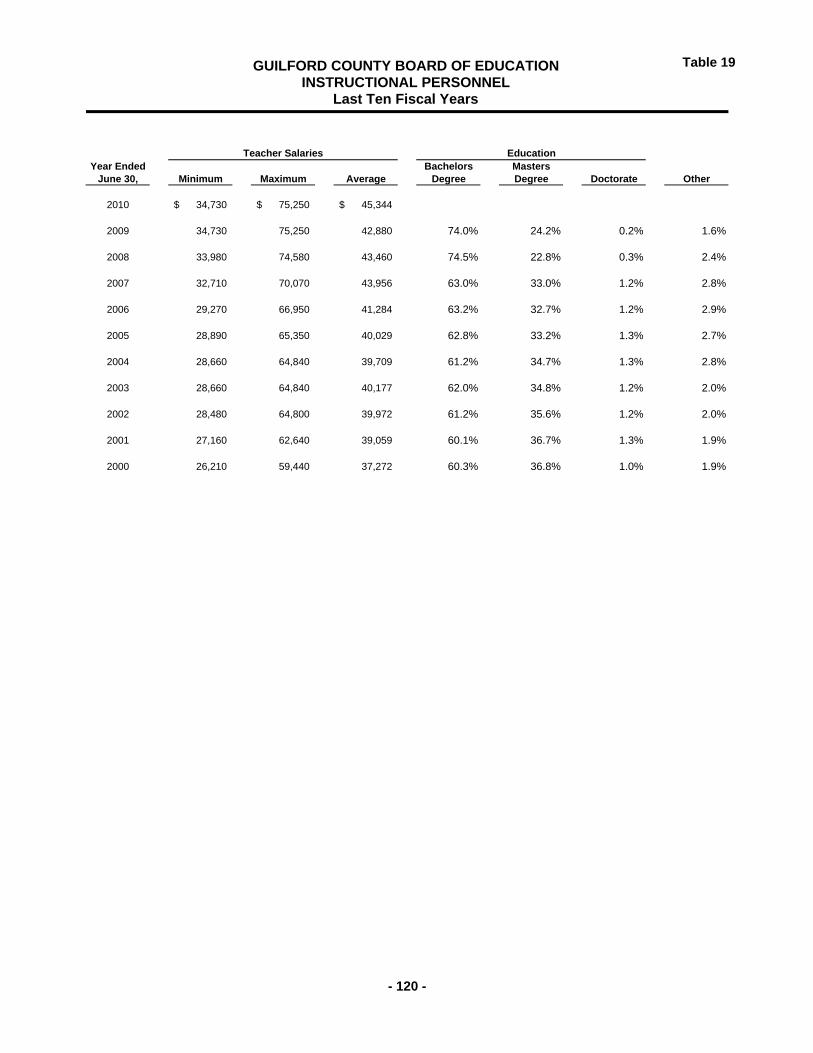
Table 19
Year Ended Bachelors MastersJune 30, Minimum Maximum Average Degree Degree Doctorate Other
2010 34,730$ 75,250$ 45,344$
2009 34,730 75,250 42,880 74.0% 24.2% 0.2% 1.6%
2008 33,980 74,580 43,460 74.5% 22.8% 0.3% 2.4%
2007 32,710 70,070 43,956 63.0% 33.0% 1.2% 2.8%
2006 29,270 66,950 41,284 63.2% 32.7% 1.2% 2.9%
2005 28,890 65,350 40,029 62.8% 33.2% 1.3% 2.7%
2004 28,660 64,840 39,709 61.2% 34.7% 1.3% 2.8%
2003 28,660 64,840 40,177 62.0% 34.8% 1.2% 2.0%
2002 28,480 64,800 39,972 61.2% 35.6% 1.2% 2.0%
2001 27,160 62,640 39,059 60.1% 36.7% 1.3% 1.9%
2000 26,210 59,440 37,272 60.3% 36.8% 1.0% 1.9%
Teacher Salaries Education
GUILFORD COUNTY BOARD OF EDUCATION INSTRUCTIONAL PERSONNEL
Last Ten Fiscal Years
- 120 -
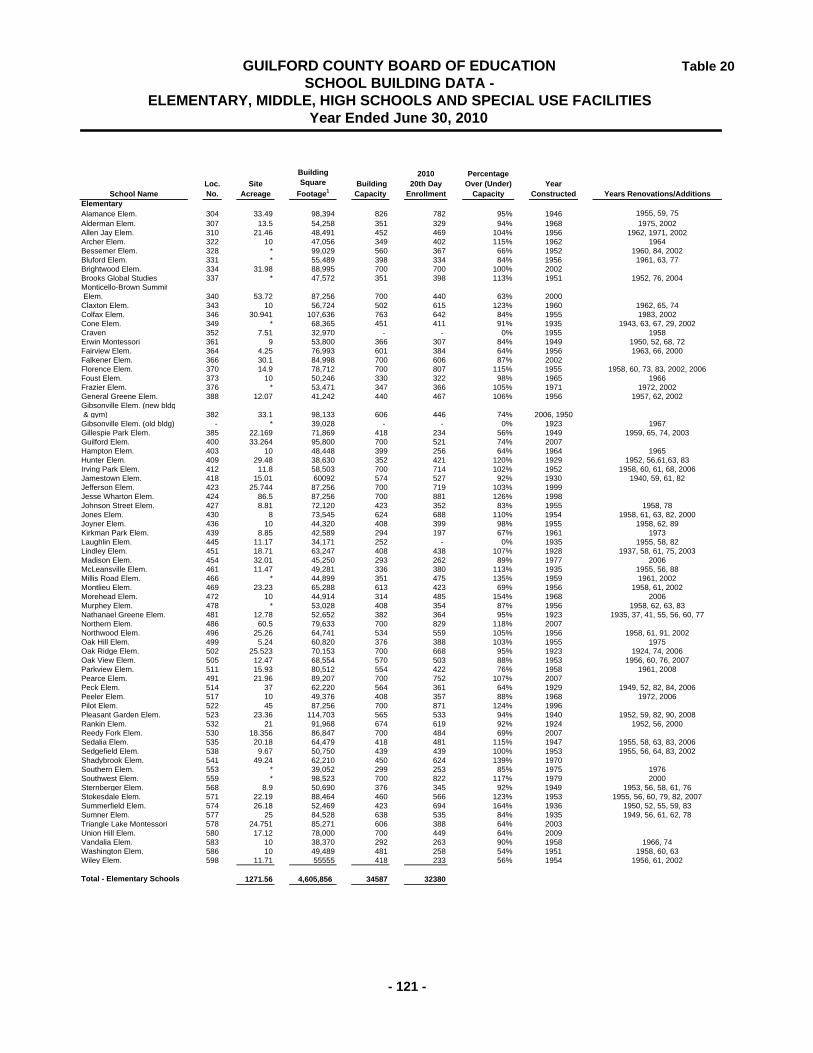
Table 20
School NameLoc. No.
Site Acreage
Building Square
Footage1 Building Capacity
2010 20th Day
Enrollment
Percentage Over (Under)
CapacityYear
Constructed Years Renovations/AdditionsElementaryAlamance Elem. 304 33.49 98,394 826 782 95% 1946 1955, 59, 75Alderman Elem. 307 13.5 54,258 351 329 94% 1968 1975, 2002Allen Jay Elem. 310 21.46 48,491 452 469 104% 1956 1962, 1971, 2002Archer Elem. 322 10 47,056 349 402 115% 1962 1964Bessemer Elem. 328 * 99,029 560 367 66% 1952 1960, 84, 2002Bluford Elem. 331 * 55,489 398 334 84% 1956 1961, 63, 77Brightwood Elem. 334 31.98 88,995 700 700 100% 2002Brooks Global Studies 337 * 47,572 351 398 113% 1951 1952, 76, 2004Monticello-Brown Summit Elem. 340 53.72 87,256 700 440 63% 2000Claxton Elem. 343 10 56,724 502 615 123% 1960 1962, 65, 74Colfax Elem. 346 30.941 107,636 763 642 84% 1955 1983, 2002Cone Elem. 349 * 68,365 451 411 91% 1935 1943, 63, 67, 29, 2002Craven 352 7.51 32,970 - - 0% 1955 1958Erwin Montessori 361 9 53,800 366 307 84% 1949 1950, 52, 68, 72Fairview Elem. 364 4.25 76,993 601 384 64% 1956 1963, 66, 2000Falkener Elem. 366 30.1 84,998 700 606 87% 2002Florence Elem. 370 14.9 78,712 700 807 115% 1955 1958, 60, 73, 83, 2002, 2006Foust Elem. 373 10 50,246 330 322 98% 1965 1966Frazier Elem. 376 * 53,471 347 366 105% 1971 1972, 2002General Greene Elem. 388 12.07 41,242 440 467 106% 1956 1957, 62, 2002Gibsonville Elem. (new bldg & gym) 382 33.1 98,133 606 446 74% 2006, 1950Gibsonville Elem. (old bldg) - * 39,028 - - 0% 1923 1967Gillespie Park Elem. 385 22.169 71,869 418 234 56% 1949 1959, 65, 74, 2003Guilford Elem. 400 33.264 95,800 700 521 74% 2007Hampton Elem. 403 10 48,448 399 256 64% 1964 1965Hunter Elem. 409 29.48 38,630 352 421 120% 1929 1952, 56,61,63, 83Irving Park Elem. 412 11.8 58,503 700 714 102% 1952 1958, 60, 61, 68, 2006Jamestown Elem. 418 15.01 60092 574 527 92% 1930 1940, 59, 61, 82Jefferson Elem. 423 25.744 87,256 700 719 103% 1999Jesse Wharton Elem. 424 86.5 87,256 700 881 126% 1998Johnson Street Elem. 427 8.81 72,120 423 352 83% 1955 1958, 78Jones Elem. 430 8 73,545 624 688 110% 1954 1958, 61, 63, 82, 2000Joyner Elem. 436 10 44,320 408 399 98% 1955 1958, 62, 89Kirkman Park Elem. 439 8.85 42,589 294 197 67% 1961 1973Laughlin Elem. 445 11.17 34,171 252 - 0% 1935 1955, 58, 82Lindley Elem. 451 18.71 63,247 408 438 107% 1928 1937, 58, 61, 75, 2003Madison Elem. 454 32.01 45,250 293 262 89% 1977 2006McLeansville Elem. 461 11.47 49,281 336 380 113% 1935 1955, 56, 88Millis Road Elem. 466 * 44,899 351 475 135% 1959 1961, 2002Montlieu Elem. 469 23.23 65,288 613 423 69% 1956 1958, 61, 2002Morehead Elem. 472 10 44,914 314 485 154% 1968 2006Murphey Elem. 478 * 53,028 408 354 87% 1956 1958, 62, 63, 83Nathanael Greene Elem. 481 12.78 52,652 382 364 95% 1923 1935, 37, 41, 55, 56, 60, 77Northern Elem. 486 60.5 79,633 700 829 118% 2007Northwood Elem. 496 25.26 64,741 534 559 105% 1956 1958, 61, 91, 2002Oak Hill Elem. 499 5.24 60,820 376 388 103% 1955 1975Oak Ridge Elem. 502 25.523 70,153 700 668 95% 1923 1924, 74, 2006Oak View Elem. 505 12.47 68,554 570 503 88% 1953 1956, 60, 76, 2007Parkview Elem. 511 15.93 80,512 554 422 76% 1958 1961, 2008Pearce Elem. 491 21.96 89,207 700 752 107% 2007Peck Elem. 514 37 62,220 564 361 64% 1929 1949, 52, 82, 84, 2006Peeler Elem. 517 10 49,376 408 357 88% 1968 1972, 2006Pilot Elem. 522 45 87,256 700 871 124% 1996Pleasant Garden Elem. 523 23.36 114,703 565 533 94% 1940 1952, 59, 82, 90, 2008Rankin Elem. 532 21 91,968 674 619 92% 1924 1952, 56, 2000Reedy Fork Elem. 530 18.356 86,847 700 484 69% 2007Sedalia Elem. 535 20.18 64,479 418 481 115% 1947 1955, 58, 63, 83, 2006Sedgefield Elem. 538 9.67 50,750 439 439 100% 1953 1955, 56, 64, 83, 2002Shadybrook Elem. 541 49.24 62,210 450 624 139% 1970Southern Elem. 553 * 39,052 299 253 85% 1975 1976Southwest Elem. 559 * 98,523 700 822 117% 1979 2000Sternberger Elem. 568 8.9 50,690 376 345 92% 1949 1953, 56, 58, 61, 76Stokesdale Elem. 571 22.19 88,464 460 566 123% 1953 1955, 56, 60, 79, 82, 2007Summerfield Elem. 574 26.18 52,469 423 694 164% 1936 1950, 52, 55, 59, 83 Sumner Elem. 577 25 84,528 638 535 84% 1935 1949, 56, 61, 62, 78Triangle Lake Montessori 578 24.751 85,271 606 388 64% 2003Union Hill Elem. 580 17.12 78,000 700 449 64% 2009Vandalia Elem. 583 10 38,370 292 263 90% 1958 1966, 74Washington Elem. 586 10 49,489 481 258 54% 1951 1958, 60, 63Wiley Elem. 598 11.71 55555 418 233 56% 1954 1956, 61, 2002
Total - Elementary Schools 1271.56 4,605,856 34587 32380
GUILFORD COUNTY BOARD OF EDUCATION SCHOOL BUILDING DATA -
ELEMENTARY, MIDDLE, HIGH SCHOOLS AND SPECIAL USE FACILITIES Year Ended June 30, 2010
- 121 -
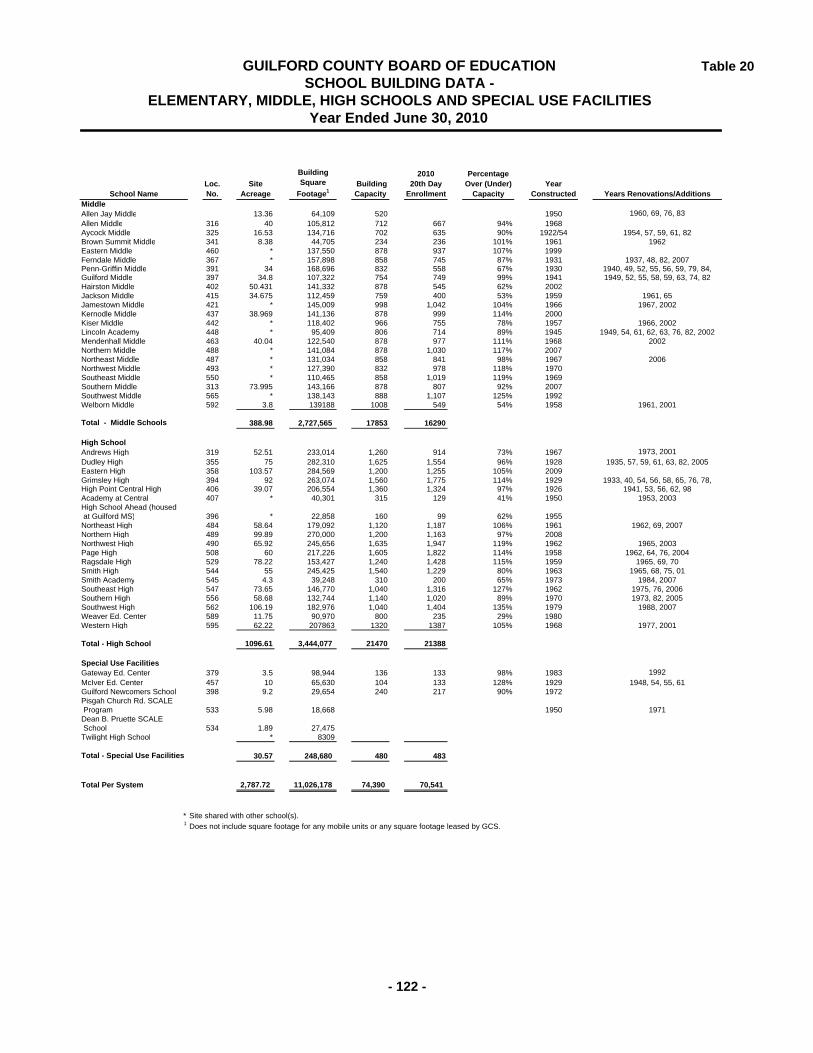
Table 20
School NameLoc. No.
Site Acreage
Building Square
Footage1 Building Capacity
2010 20th Day
Enrollment
Percentage Over (Under)
CapacityYear
Constructed Years Renovations/Additions
GUILFORD COUNTY BOARD OF EDUCATION SCHOOL BUILDING DATA -
ELEMENTARY, MIDDLE, HIGH SCHOOLS AND SPECIAL USE FACILITIES Year Ended June 30, 2010
MiddleAllen Jay Middle 13.36 64,109 520 1950 1960, 69, 76, 83Allen Middle 316 40 105,812 712 667 94% 1968Aycock Middle 325 16.53 134,716 702 635 90% 1922/54 1954, 57, 59, 61, 82Brown Summit Middle 341 8.38 44,705 234 236 101% 1961 1962Eastern Middle 460 * 137,550 878 937 107% 1999Ferndale Middle 367 * 157,898 858 745 87% 1931 1937, 48, 82, 2007Penn-Griffin Middle 391 34 168,696 832 558 67% 1930 1940, 49, 52, 55, 56, 59, 79, 84, Guilford Middle 397 34.8 107,322 754 749 99% 1941 1949, 52, 55, 58, 59, 63, 74, 82Hairston Middle 402 50.431 141,332 878 545 62% 2002Jackson Middle 415 34.675 112,459 759 400 53% 1959 1961, 65Jamestown Middle 421 * 145,009 998 1,042 104% 1966 1967, 2002Kernodle Middle 437 38.969 141,136 878 999 114% 2000Kiser Middle 442 * 118,402 966 755 78% 1957 1966, 2002Lincoln Academy 448 * 95,409 806 714 89% 1945 1949, 54, 61, 62, 63, 76, 82, 2002 Mendenhall Middle 463 40.04 122,540 878 977 111% 1968 2002Northern Middle 488 * 141,084 878 1,030 117% 2007Northeast Middle 487 * 131,034 858 841 98% 1967 2006Northwest Middle 493 * 127,390 832 978 118% 1970Southeast Middle 550 * 110,465 858 1,019 119% 1969Southern Middle 313 73.995 143,166 878 807 92% 2007Southwest Middle 565 * 138,143 888 1,107 125% 1992Welborn Middle 592 3.8 139188 1008 549 54% 1958 1961, 2001
Total - Middle Schools 388.98 2,727,565 17853 16290
High SchoolAndrews High 319 52.51 233,014 1,260 914 73% 1967 1973, 2001Dudley High 355 75 282,310 1,625 1,554 96% 1928 1935, 57, 59, 61, 63, 82, 2005Eastern High 358 103.57 284,569 1,200 1,255 105% 2009Grimsley High 394 92 263,074 1,560 1,775 114% 1929 1933, 40, 54, 56, 58, 65, 76, 78, High Point Central High 406 39.07 206,554 1,360 1,324 97% 1926 1941, 53, 56, 62, 98Academy at Central 407 * 40,301 315 129 41% 1950 1953, 2003High School Ahead (housed at Guilford MS) 396 * 22,858 160 99 62% 1955Northeast High 484 58.64 179,092 1,120 1,187 106% 1961 1962, 69, 2007Northern High 489 99.89 270,000 1,200 1,163 97% 2008Northwest High 490 65.92 245,656 1,635 1,947 119% 1962 1965, 2003Page High 508 60 217,226 1,605 1,822 114% 1958 1962, 64, 76, 2004Ragsdale High 529 78.22 153,427 1,240 1,428 115% 1959 1965, 69, 70Smith High 544 55 245,425 1,540 1,229 80% 1963 1965, 68, 75, 01Smith Academy 545 4.3 39,248 310 200 65% 1973 1984, 2007Southeast High 547 73.65 146,770 1,040 1,316 127% 1962 1975, 76, 2006Southern High 556 58.68 132,744 1,140 1,020 89% 1970 1973, 82, 2005Southwest High 562 106.19 182,976 1,040 1,404 135% 1979 1988, 2007Weaver Ed. Center 589 11.75 90,970 800 235 29% 1980Western High 595 62.22 207863 1320 1387 105% 1968 1977, 2001
Total - High School 1096.61 3,444,077 21470 21388
Special Use FacilitiesGateway Ed. Center 379 3.5 98,944 136 133 98% 1983 1992McIver Ed. Center 457 10 65,630 104 133 128% 1929 1948, 54, 55, 61Guilford Newcomers School 398 9.2 29,654 240 217 90% 1972Pisgah Church Rd. SCALE Program 533 5.98 18,668 1950 1971Dean B. Pruette SCALE School 534 1.89 27,475Twilight High School * 8309
Total - Special Use Facilities 30.57 248,680 480 483
Total Per System 2,787.72 11,026,178 74,390 70,541
* Site shared with other school(s).1 Does not include square footage for any mobile units or any square footage leased by GCS.
- 122 -
- 123 -
COMPLIANCE SECTION

- 124 -
THIS PAGE LEFT INTENTIONALLY BLANK.
- 125 -
REPORT ON INTERNAL CONTROL OVER FINANCIAL REPORTING AND ON COMPLIANCE AND OTHER MATTERS BASED ON AN AUDIT OF FINANCIAL STATEMENTS PERFORMED IN ACCORDANCE WITH GOVERNMENT AUDITING STANDARDS Guilford County Board of Education Greensboro, North Carolina We have audited the accompanying financial statements of the governmental activities, the business-type activities, each major fund and the aggregate remaining fund information of Guilford County Board of Education, as of and for the year ended June 30, 2010, and have issued our report thereon dated December 18, 2010. We conducted our audit in accordance with auditing standards generally accepted in the United States of America and the standards applicable to financial audits contained in Government Auditing Standards, issued by the Comptroller General of the United States. Internal Control Over Financial Reporting In planning and performing our audit, we considered the Guilford County Board of Education’s internal control over financial reporting as a basis for designing our auditing procedures for the purpose of expressing our opinions on the financial statements, but not for the purpose of expressing an opinion on the effectiveness of the Guilford County Board of Education’s internal control over financial reporting. Accordingly, we do not express an opinion on the effectiveness of the Guilford County Board of Education’s internal control over financial reporting. A deficiency in internal control exists when the design or operation of a control does not allow management or employees, in the normal course of performing their assigned functions, to prevent, or detect and correct misstatements on a timely basis. A material weakness is a deficiency, or combination of deficiencies, in internal control, such that there is a reasonable possibility that a material misstatement of the entity’s financial statements will not be prevented, or detected and corrected on a timely basis. Our consideration of the internal control over financial reporting was for limited purpose described in the first paragraph of this section and would not necessarily identify all deficiencies in internal control over financial reporting that might be deficiencies, significant deficiencies or material weaknesses. We did not identify any deficiencies in internal control over financial reporting that we consider to be material weaknesses, as defined above.
- 126 -
Compliance and Other Matters As part of obtaining reasonable assurance about whether the Guilford County Board of Education’s financial statements are free of material misstatement, we performed tests of its compliance with certain provisions of laws, regulations, contracts and grant agreements, noncompliance with which could have a direct and material effect on the determination of financial statement amounts. However, providing an opinion on compliance with those provisions was not an objective of our audit, and accordingly, we do not express such an opinion. The results of our tests disclosed no instances of noncompliance or other matters that are required to be reported under Government Auditing Standards. This report is intended solely for the information and use of management, others within the organization, members of the Board of Education, and federal and State awarding agencies and pass-through entities and is not intended to be and should not be used by anyone other than these specified parties.
December 18, 2010
- 127 -
REPORT ON COMPLIANCE WITH REQUIREMENTS THAT COULD HAVE A DIRECT AND MATERIAL EFFECT ON EACH MAJOR FEDERAL PROGRAM AND INTERNAL CONTROL OVER COMPLIANCE IN ACCORDANCE WITH OMB CIRCULAR A-133 AND THE STATE SINGLE AUDIT IMPLEMENTATION ACT Guilford County Board of Education Greensboro, North Carolina Compliance We have audited the compliance of the Guilford County Board of Education with the types of compliance requirements described in the OMB Circular A-133 Compliance Supplement and the Audit Manual for Governmental Auditors in North Carolina, issued by the Local Government Commission, that could have a direct and material effect on each of its major federal programs for the year ended June 30, 2010. The Guilford County Board of Education’s major federal programs are identified in the summary of auditor’s results section of the accompanying schedule of findings and questioned costs. Compliance with the requirements of laws, regulations, contracts and grants applicable to each of its major federal programs is the responsibility of the Guilford County Board of Education's management. Our responsibility is to express an opinion on the Guilford County Board of Education’s compliance based on our audit. We conducted our audit of compliance in accordance with auditing standards generally accepted in the United States of America; the standards applicable to financial audits contained in Government Auditing Standards, issued by the Comptroller General of the United States; and OMB Circular A-133, Audits of States, Local Governments and Non-Profit Organizations, and the State Single Audit Implementation Act. Those standards, OMB Circular A-133 and the State Single Audit Implementation Act require that we plan and perform the audit to obtain reasonable assurance about whether noncompliance with the types of compliance requirements referred to above that could have a direct and material effect on a major federal program occurred. An audit includes examining, on a test basis, evidence about the Guilford County Board of Education's compliance with those requirements and performing such other procedures as we considered necessary in the circumstances. We believe that our audit provides a reasonable basis for our opinion. Our audit does not provide a legal determination on the Guilford County Board of Education’s compliance with those requirements.
- 128 -
In our opinion, the Guilford County Board of Education complied, in all material respects, with the requirements referred to above that are applicable to each of its major federal programs for the year ended June 30, 2010. Internal Control Over Compliance Management of the Guilford County Board of Education is responsible for establishing and maintaining effective internal control over compliance with requirements of laws, regulations, contracts and grants applicable to federal programs. In planning and performing our audit, we considered the Guilford County Board of Education’s internal control over compliance with requirements that could have a direct and material effect on a major federal program in order to determine our auditing procedures for the purpose of expressing our opinion on compliance not for the purpose of expressing an opinion on the effectiveness of internal control over compliance. Accordingly, we do not express an opinion on the effectiveness of the Board’s internal control over compliance. A deficiency in internal control over compliance exists when the design or operation of a control over compliance does not allow management or employees, in the normal course of performing their assigned functions, to prevent, or detect and correct, noncompliance with a type of compliance requirement of a federal program on a timely basis. A material weakness in internal control over compliance is a deficiency, or combination of deficiencies, in internal control over compliance, such that there is a reasonable possibility that material noncompliance with a type of compliance requirement of a federal program will not be prevented, or detected and corrected, on a timely basis. Our consideration of internal control over compliance was for the limited purpose described in the first paragraph of this section and was not designed to identify all deficiencies in internal control over compliance that might be deficiencies, significant deficiencies, or material weaknesses. We did not identify any deficiencies in internal control over compliance that we consider to be material weaknesses, as defined above. This report is intended solely for the information and use of management, others within the organization, members of the Board of Education, and federal and state awarding agencies and pass-through entities, and is not intended to be, and should not be, used by anyone other than these specified parties.
December 18, 2010
- 129 -
REPORT ON COMPLIANCE WITH REQUIREMENTS THAT COULD HAVE A DIRECT AND MATERIAL EFFECT ON EACH MAJOR STATE PROGRAM AND INTERNAL CONTROL OVER COMPLIANCE IN ACCORDANCE WITH APPLICABLE SECTIONS OF OMB CIRCULAR A-133 AND THE STATE SINGLE AUDIT IMPLEMENTATION ACT Guilford County Board of Education Greensboro, North Carolina Compliance We have audited the compliance of the Guilford County Board of Education with the types of compliance requirements described in the Audit Manual for Governmental Auditors in North Carolina, issued by the Local Government Commission; that could have a direct and material effect on each of its major state programs for the year ended June 30, 2010. The Guilford County Board of Education’s major state programs are identified in the summary of auditor’s results section of the accompanying schedule of findings and questioned costs. Compliance with the requirements of laws, regulations, contracts and grants applicable to each of its major state programs is the responsibility of the Guilford County Board of Education's management. Our responsibility is to express an opinion on the Guilford County Board of Education’s compliance based on our audit. We conducted our audit of compliance in accordance with auditing standards generally accepted in the United States of America; the standards applicable to financial audits contained in Government Auditing Standards, issued by the Comptroller General of the United States; applicable sections of the OMB Circular A-133 as described in the Audit Manual for Government Auditors in North Carolina and the State Single Audit Implementation Act. Those standards, applicable sections of OMB Circular A-133 and the State Single Audit Implementation Act require that we plan and perform the audit to obtain reasonable assurance about whether noncompliance with the types of compliance requirements referred to above that could have a direct and material effect on a major state program occurred. An audit includes examining, on a test basis, evidence about the Guilford County Board of Education's compliance with those requirements and performing such other procedures as we considered necessary in the circumstances. We believe that our audit provides a reasonable basis for our opinion. Our audit does not provide a legal determination on the Guilford County Board of Education’s compliance with those requirements. In our opinion, the Guilford County Board of Education complied, in all material respects, with the requirements referred to above that are applicable to each of its major state programs for the year ended June 30, 2010. However, the results of our auditing procedures disclosed an instance of noncompliance with those requirements that is required to be reported in accordance with applicable sections of OMB Circular A-133 and the State Single Audit Implementation Act and which is described in the accompanying schedule of findings and questioned costs as item 10-01.
- 130 -
Internal Control Over Compliance The management of the Guilford County Board of Education is responsible for establishing and maintaining effective internal control over compliance with requirements of laws, regulations, contracts and grants applicable to state programs. In planning and performing our audit, we considered the Guilford County Board of Education’s internal control over compliance with requirements that could have a direct and material effect on a major state program in order to determine our auditing procedures for the purpose of expressing our opinion on compliance but not for the purpose of expressing an opinion on the effectiveness of internal control over compliance. Accordingly, we do not express an opinion on the effectiveness of the Board’s internal control over compliance. A deficiency in internal control over compliance exists when the design or operation of a control over compliance does not allow management or employees, in the normal course of performing their assigned functions, to prevent, or detect and correct, noncompliance with a type of compliance requirement of a state program on a timely basis. A material weakness in internal control over compliance is a deficiency, or combination of deficiencies, in internal control over compliance, such that there is a reasonable possibility that material noncompliance with a type of compliance requirement of a state program will not be prevented, or detected and corrected, on a timely basis. Our consideration of internal control over compliance was for the limited purpose described in the first paragraph of this section and was not designed to identify all deficiencies in internal control over compliance that might be deficiencies, significant deficiencies, or material weaknesses. We did not identify any deficiencies in internal control over compliance that we consider to be material weaknesses, as defined above. However, we identified a certain deficiency in internal control over compliance that we consider to be a significant deficiency as described in the accompanying schedule of findings and questioned costs as item 10-01. A significant deficiency in internal control over compliance is a deficiency, or a combination of deficiencies, in internal control over compliance with a type of compliance requirement of a state program that is less severe than a material weakness in internal control over compliance, yet important enough to merit attention by those charged with governance. The Guilford County Board of Education's response to the finding identified in our audit is described in the accompanying schedule of findings and questioned costs. We did not audit the Board's response and, accordingly, we express no opinion on the response. This report is intended solely for the information and use of management, others within the organization, members of the Board of Education, and federal and state awarding agencies and pass-through entities, and is not intended to be, and should not be, used by anyone other than these specified parties.
December 18, 2010
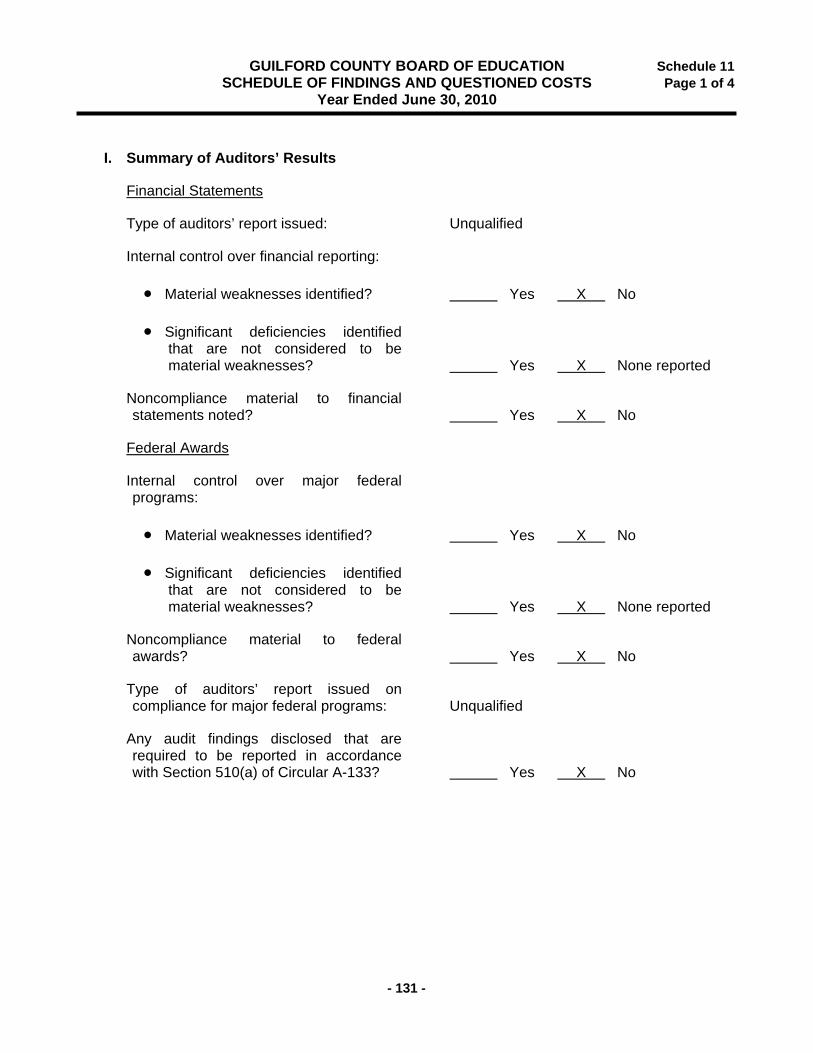
- 131 -
GUILFORD COUNTY BOARD OF EDUCATION Schedule 11 SCHEDULE OF FINDINGS AND QUESTIONED COSTS Page 1 of 4 Year Ended June 30, 2010
I. Summary of Auditors’ Results
Financial Statements
Type of auditors’ report issued: Unqualified
Internal control over financial reporting:
Material weaknesses identified? Yes X No
Significant deficiencies identified that are not considered to be material weaknesses? Yes X None reported
Noncompliance material to financial statements noted? Yes X No
Federal Awards
Internal control over major federal programs:
Material weaknesses identified? Yes X No
Significant deficiencies identified that are not considered to be material weaknesses? Yes X None reported
Noncompliance material to federal awards? Yes X No
Type of auditors’ report issued on compliance for major federal programs: Unqualified
Any audit findings disclosed that are required to be reported in accordance with Section 510(a) of Circular A-133? Yes X No
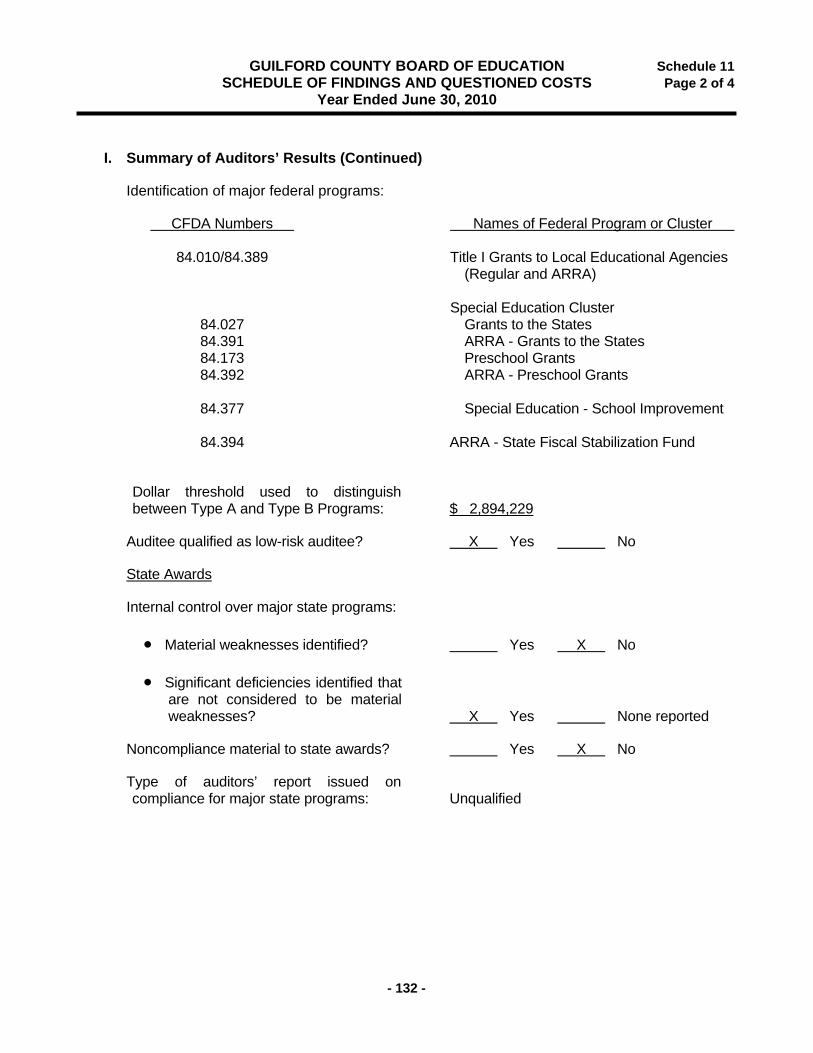
- 132 -
GUILFORD COUNTY BOARD OF EDUCATION Schedule 11 SCHEDULE OF FINDINGS AND QUESTIONED COSTS Page 2 of 4 Year Ended June 30, 2010
I. Summary of Auditors’ Results (Continued)
Identification of major federal programs:
CFDA Numbers Names of Federal Program or Cluster 84.010/84.389 Title I Grants to Local Educational Agencies (Regular and ARRA) Special Education Cluster 84.027 Grants to the States
84.391 ARRA - Grants to the States 84.173 Preschool Grants
84.392 ARRA - Preschool Grants 84.377 Special Education - School Improvement 84.394 ARRA - State Fiscal Stabilization Fund
Dollar threshold used to distinguish between Type A and Type B Programs: $ 2,894,229
Auditee qualified as low-risk auditee? X Yes No
State Awards
Internal control over major state programs:
Material weaknesses identified? Yes X No
Significant deficiencies identified that are not considered to be material weaknesses? X Yes None reported
Noncompliance material to state awards? Yes X No
Type of auditors’ report issued on compliance for major state programs: Unqualified
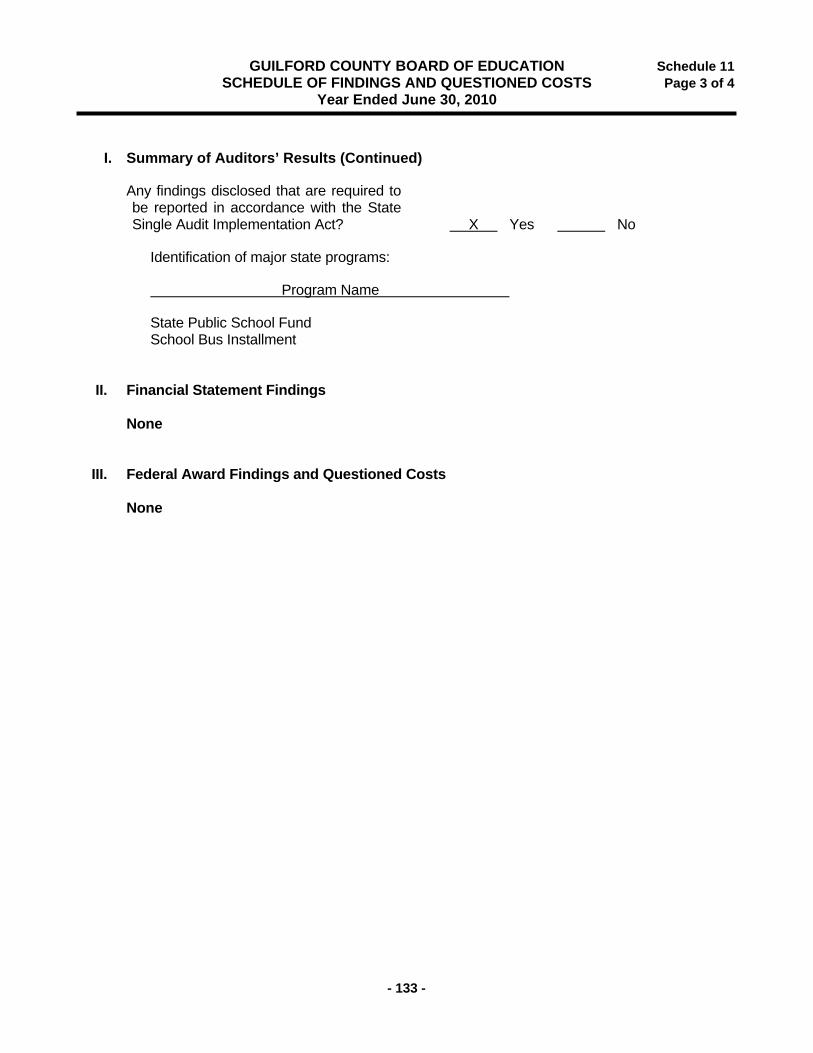
- 133 -
GUILFORD COUNTY BOARD OF EDUCATION Schedule 11 SCHEDULE OF FINDINGS AND QUESTIONED COSTS Page 3 of 4 Year Ended June 30, 2010
I. Summary of Auditors’ Results (Continued)
Any findings disclosed that are required to be reported in accordance with the State Single Audit Implementation Act? X Yes No
Identification of major state programs:
Program Name
State Public School Fund School Bus Installment II. Financial Statement Findings None III. Federal Award Findings and Questioned Costs None
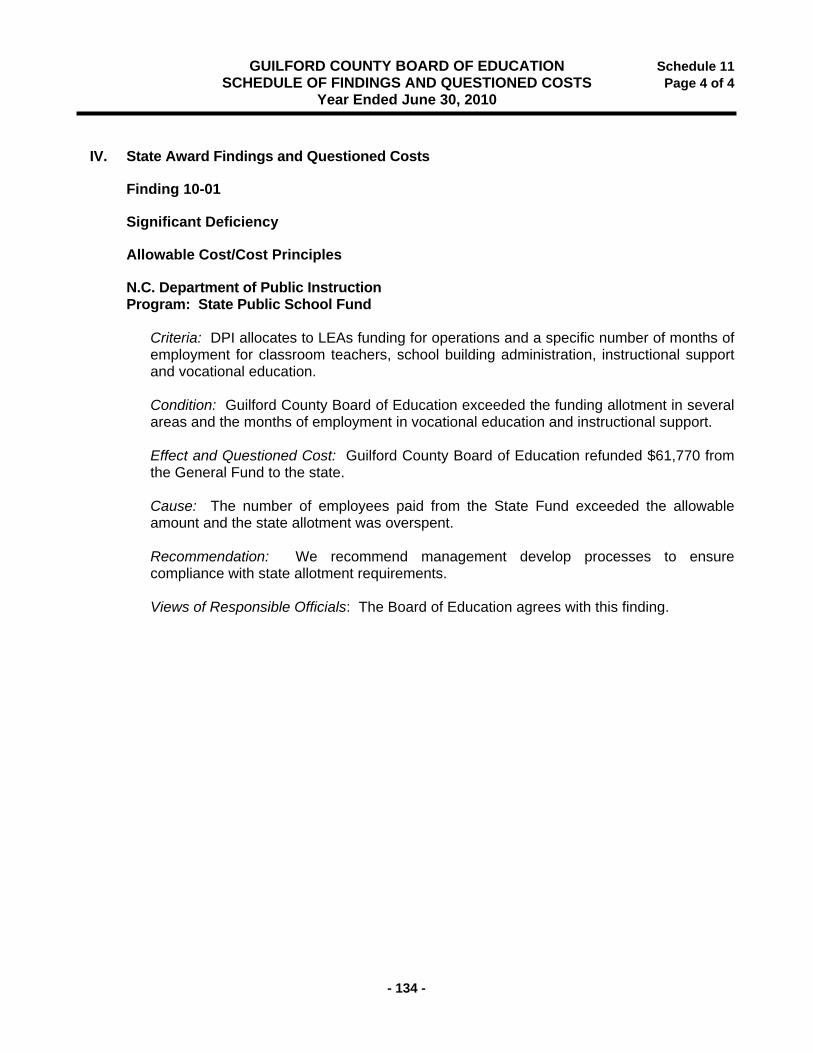
- 134 -
GUILFORD COUNTY BOARD OF EDUCATION Schedule 11 SCHEDULE OF FINDINGS AND QUESTIONED COSTS Page 4 of 4 Year Ended June 30, 2010
IV. State Award Findings and Questioned Costs
Finding 10-01
Significant Deficiency
Allowable Cost/Cost Principles
N.C. Department of Public Instruction Program: State Public School Fund Criteria: DPI allocates to LEAs funding for operations and a specific number of months of
employment for classroom teachers, school building administration, instructional support and vocational education.
Condition: Guilford County Board of Education exceeded the funding allotment in several
areas and the months of employment in vocational education and instructional support. Effect and Questioned Cost: Guilford County Board of Education refunded $61,770 from
the General Fund to the state. Cause: The number of employees paid from the State Fund exceeded the allowable
amount and the state allotment was overspent. Recommendation: We recommend management develop processes to ensure
compliance with state allotment requirements. Views of Responsible Officials: The Board of Education agrees with this finding.
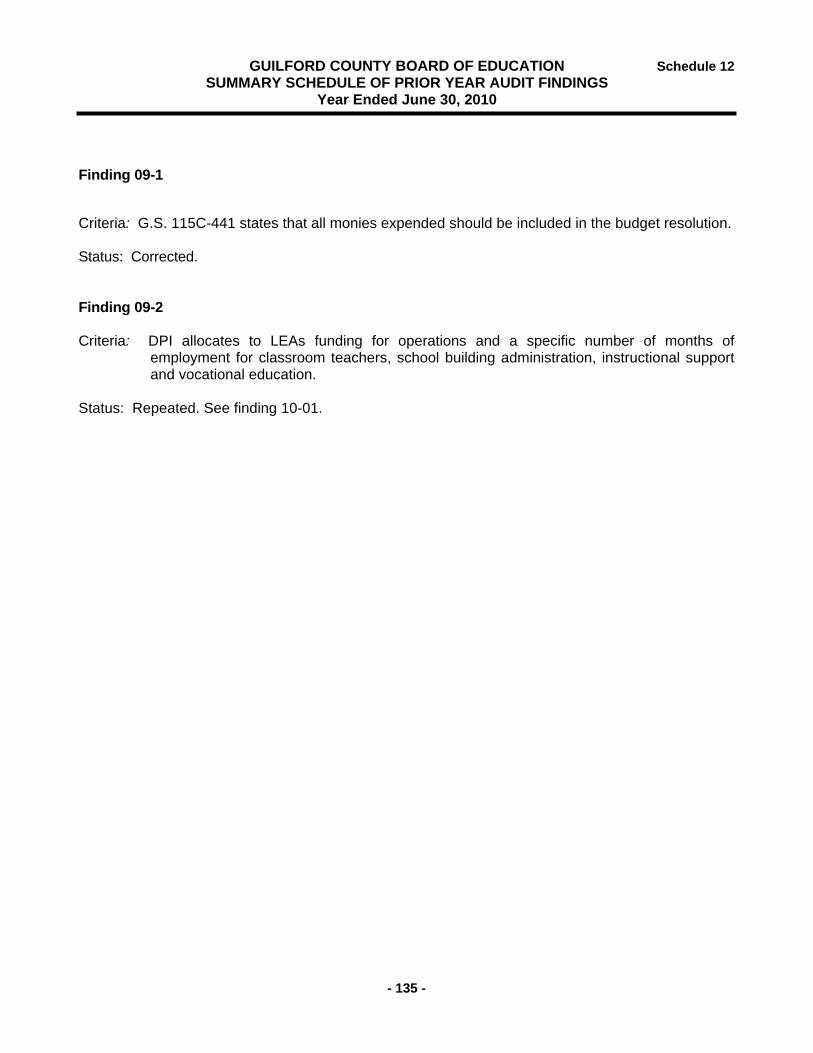
- 135 -
GUILFORD COUNTY BOARD OF EDUCATION Schedule 12 SUMMARY SCHEDULE OF PRIOR YEAR AUDIT FINDINGS Year Ended June 30, 2010
Finding 09-1
Criteria: G.S. 115C-441 states that all monies expended should be included in the budget resolution. Status: Corrected. Finding 09-2 Criteria: DPI allocates to LEAs funding for operations and a specific number of months of
employment for classroom teachers, school building administration, instructional support and vocational education.
Status: Repeated. See finding 10-01.
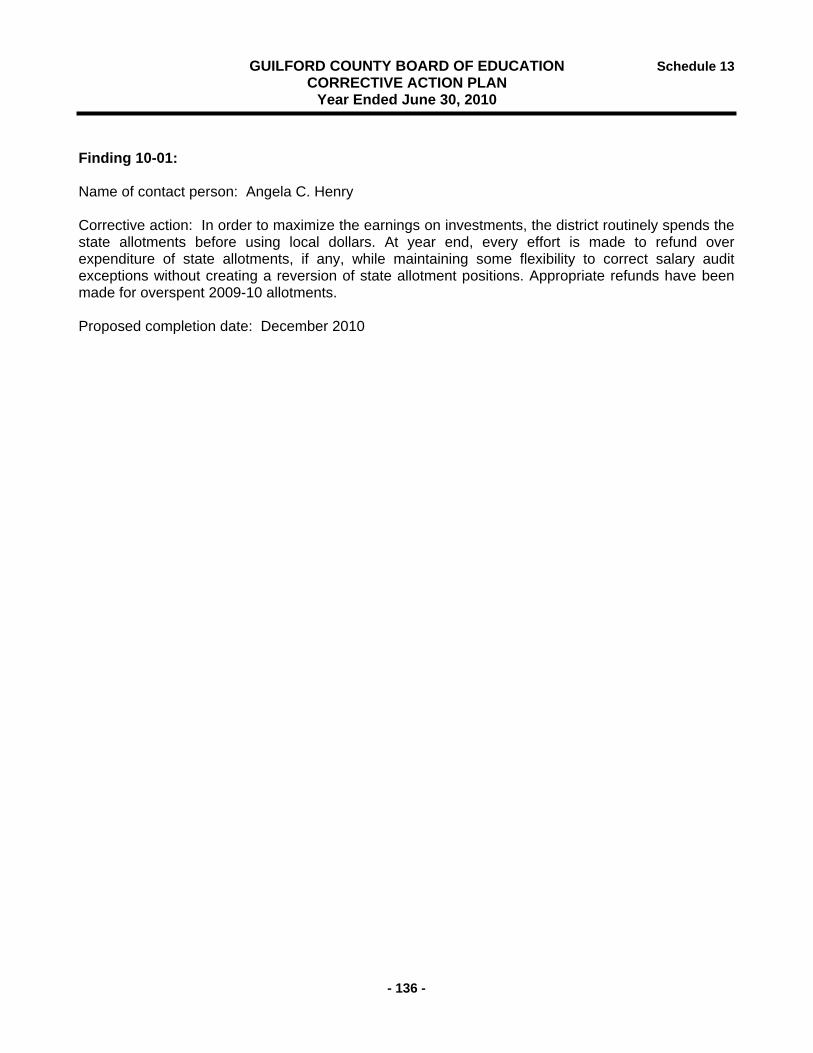
- 136 -
GUILFORD COUNTY BOARD OF EDUCATION Schedule 13 CORRECTIVE ACTION PLAN Year Ended June 30, 2010
Finding 10-01: Name of contact person: Angela C. Henry Corrective action: In order to maximize the earnings on investments, the district routinely spends the state allotments before using local dollars. At year end, every effort is made to refund over expenditure of state allotments, if any, while maintaining some flexibility to correct salary audit exceptions without creating a reversion of state allotment positions. Appropriate refunds have been made for overspent 2009-10 allotments. Proposed completion date: December 2010
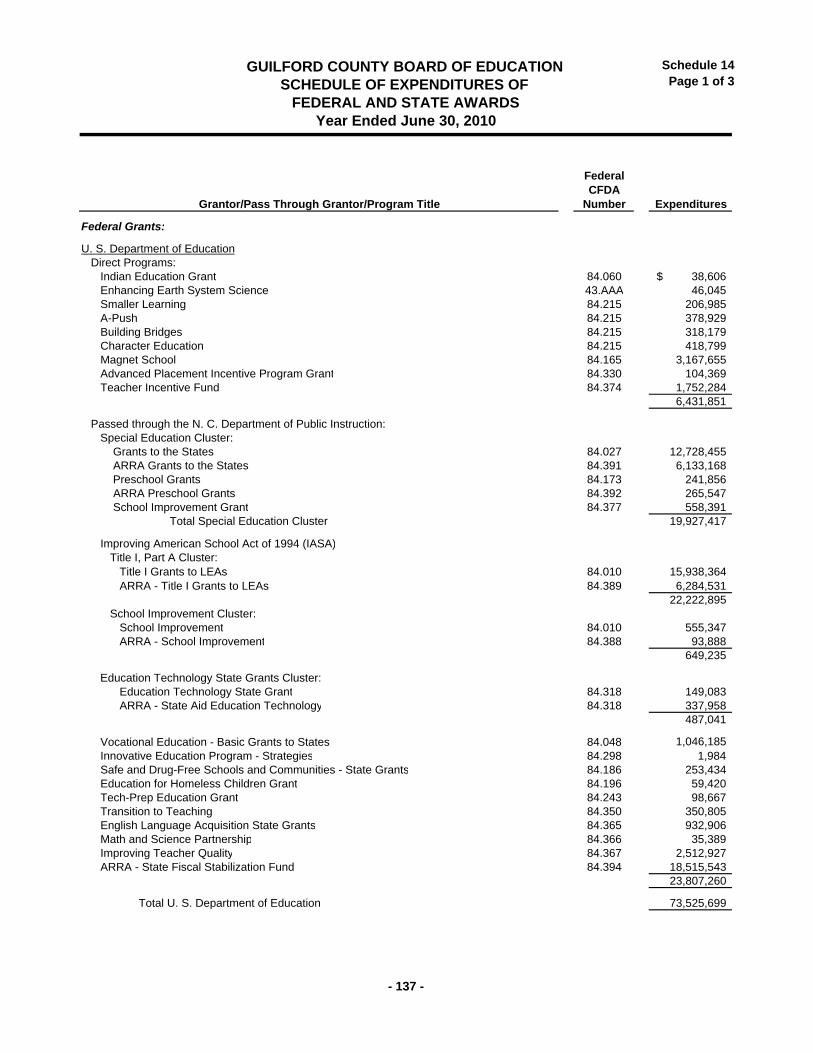
Schedule 14Page 1 of 3
FederalCFDA
Grantor/Pass Through Grantor/Program Title Number Expenditures
Federal Grants:
U. S. Department of EducationDirect Programs:
Indian Education Grant 84.060 38,606$ Enhancing Earth System Science 43.AAA 46,045Smaller Learning 84.215 206,985A-Push 84.215 378,929Building Bridges 84.215 318,179Character Education 84.215 418,799Magnet School 84.165 3,167,655Advanced Placement Incentive Program Grant 84.330 104,369Teacher Incentive Fund 84.374 1,752,284
6,431,851
Passed through the N. C. Department of Public Instruction: Special Education Cluster:
Grants to the States 84.027 12,728,455 ARRA Grants to the States 84.391 6,133,168
Preschool Grants 84.173 241,856 ARRA Preschool Grants 84.392 265,547 School Improvement Grant 84.377 558,391
Total Special Education Cluster 19,927,417
Improving American School Act of 1994 (IASA)Title I, Part A Cluster:
Title I Grants to LEAs 84.010 15,938,364ARRA - Title I Grants to LEAs 84.389 6,284,531
22,222,895School Improvement Cluster:
School Improvement 84.010 555,347ARRA - School Improvement 84.388 93,888
649,235
Education Technology State Grants Cluster:Education Technology State Grant 84.318 149,083ARRA - State Aid Education Technology 84.318 337,958
487,041
Vocational Education - Basic Grants to States 84.048 1,046,185Innovative Education Program - Strategies 84.298 1,984Safe and Drug-Free Schools and Communities - State Grants 84.186 253,434Education for Homeless Children Grant 84.196 59,420Tech-Prep Education Grant 84.243 98,667Transition to Teaching 84.350 350,805English Language Acquisition State Grants 84.365 932,906Math and Science Partnership 84.366 35,389Improving Teacher Quality 84.367 2,512,927ARRA - State Fiscal Stabilization Fund 84.394 18,515,543
23,807,260
Total U. S. Department of Education 73,525,699
Year Ended June 30, 2010
GUILFORD COUNTY BOARD OF EDUCATION SCHEDULE OF EXPENDITURES OF
FEDERAL AND STATE AWARDS
- 137 -
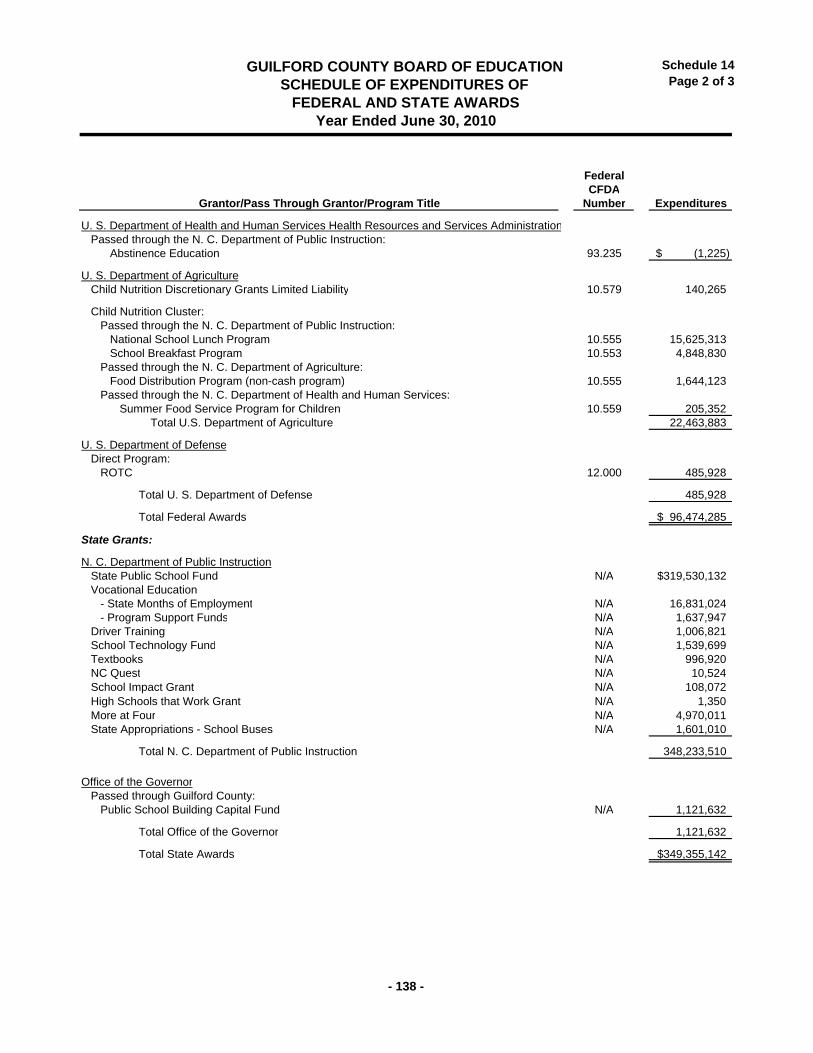
Schedule 14Page 2 of 3
Year Ended June 30, 2010
GUILFORD COUNTY BOARD OF EDUCATION SCHEDULE OF EXPENDITURES OF
FEDERAL AND STATE AWARDS
FederalCFDA
Grantor/Pass Through Grantor/Program Title Number Expenditures
U. S. Department of Health and Human Services Health Resources and Services AdministrationPassed through the N. C. Department of Public Instruction:
Abstinence Education 93.235 (1,225)$
U. S. Department of AgricultureChild Nutrition Discretionary Grants Limited Liability 10.579 140,265
Child Nutrition Cluster:Passed through the N. C. Department of Public Instruction:
National School Lunch Program 10.555 15,625,313School Breakfast Program 10.553 4,848,830
Passed through the N. C. Department of Agriculture:Food Distribution Program (non-cash program) 10.555 1,644,123
Passed through the N. C. Department of Health and Human Services:Summer Food Service Program for Children 10.559 205,352
Total U.S. Department of Agriculture 22,463,883
U. S. Department of DefenseDirect Program:
ROTC 12.000 485,928
Total U. S. Department of Defense 485,928
Total Federal Awards 96,474,285$
State Grants:
N. C. Department of Public InstructionState Public School Fund N/A 319,530,132$Vocational Education
- State Months of Employment N/A 16,831,024- Program Support Funds N/A 1,637,947
Driver Training N/A 1,006,821School Technology Fund N/A 1,539,699Textbooks N/A 996,920NC Quest N/A 10,524School Impact Grant N/A 108,072High Schools that Work Grant N/A 1,350More at Four N/A 4,970,011State Appropriations - School Buses N/A 1,601,010
Total N. C. Department of Public Instruction 348,233,510
Office of the GovernorPassed through Guilford County:
Public School Building Capital Fund N/A 1,121,632
Total Office of the Governor 1,121,632
Total State Awards 349,355,142$
- 138 -
Schedule 14Page 3 of 3
Year Ended June 30, 2010
GUILFORD COUNTY BOARD OF EDUCATION SCHEDULE OF EXPENDITURES OF
FEDERAL AND STATE AWARDS
NOTES TO SCHEDULE OF EXPENDITURES OF FEDERAL AND STATE AWARDS
The accompanying schedule of expenditures of federal and state awards includes the federal andstate grant activity of Guilford County Board of Education and is presented on the modified accrualbasis of accounting. The information in this schedule is presented in accordance with therequirements of OMB Circular A-133, Audits of States, Local Governments, and Non-ProfitOrganizations and the State Single Audit Implementation Act. Therefore, some amounts presentedin this schedule may differ from amounts presented in, or used in the preparation of, the basicfinancial statements.
- 139 -