Embed Size (px)
Citation preview

Guidelines on Statistical Analysis and Reporting of DNA Microarray Studies of
Clinical Outcome
Richard Simon, D.Sc.
Chief, Biometric Research Branch
National Cancer Institute
Bethesda Maryland USA


BRB Websitehttp://linus.nci.nih.gov/brb
• Powerpoint presentations and audio files
• Reprints & Technical Reports
• BRB-ArrayTools software
• BRB-ArrayTools Data Archive
• Sample Size Planning for Targeted Clinical Trials

Publications Reviewed
• Searched Medline• Hand screening of abstracts & papers• Original study on human cancer patients• Published in English before December 31,
2004• Analyzed gene expression of more than
1000 probes• Related gene expression to clinical
outcome

Types of Clinical Outcome
• Survival or disease-free survival
• Response to therapy

• 90 publications identified that met criteria– Abstracted information for all 90
• Performed detailed review of statistical analysis for the 42 papers published in 2004

Good Microarray Studies Have Clear Objectives
• Class Comparison (Gene Finding)– Find genes whose expression differs among predetermined
classes, e.g. tissue or experimental condition
• Class Prediction– Prediction of predetermined class (e.g. treatment outcome)
using information from gene expression profile– Survival risk-group prediction
• Class Discovery– Discover clusters of specimens having similar expression
profiles

Class Comparison and Class Prediction
• Not clustering problems
• Supervised methods

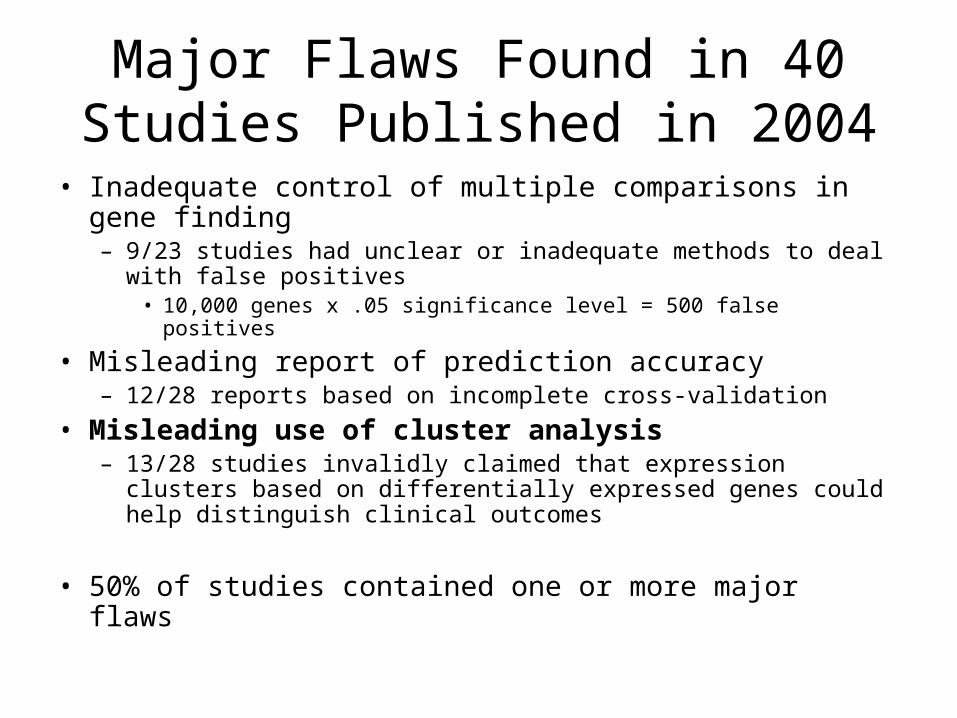
Major Flaws Found in 40 Studies Published in 2004
• Inadequate control of multiple comparisons in gene finding– 9/23 studies had unclear or inadequate methods to deal with
false positives• 10,000 genes x .05 significance level = 500 false positives
• Misleading report of prediction accuracy– 12/28 reports based on incomplete cross-validation
• Misleading use of cluster analysis – 13/28 studies invalidly claimed that expression clusters based on
differentially expressed genes could help distinguish clinical outcomes
• 50% of studies contained one or more major flaws

Do’s & Don’tsGeneral
• Do define and state the objective of the study
• Do state the criteria for selecting the patients
• Do make the raw dataset publicly available

Do’s & Don’tsGeneral
• Do describe all the statistical methods used
• Don’t transform time to event data into binary outcome data

Gene Finding
• Don’t use only fold-changes between groups to select genes
• Don’t use a .05 significance threshold to select the differentially expressed genes
• Do use a method to control the number of false positive differentially expressed genes

Analysis Strategies for Gene Finding
• Compare classes on a gene by gene basis using statistical tests– Control for the large number of tests
performed by using a stringent significance threshold
• eg use .001 for 1 false positive per 1000 genes tested
• Control the false discovery rate to a specified level e.g. 10%

Methods for Controlling the False Discovery Rate
• Benjamini-Hochberg
• SAM (Tocher et al.)
• Multivariate permutation test (Korn et al.)

Supervised Prediction
• Do frame a therapeutically relevant question and select a homogeneous set of patients
• Don’t violate the fundamental principle of classifier validation, i.e. no preliminary use of the test samples
• Don’t violate the fundamental principle of classifier validation, i.e. no preliminary use of the test samples

Components of Class Prediction
• Feature (gene) selection– Which genes will be included in the model
• Select model type – E.g. Diagonal linear discriminant analysis,
Nearest-Neighbor, …
• Fitting parameters for model– Selecting value of tuning parameters

Myth
• Complex classification algorithms such as neural networks perform better than simpler methods for class prediction.

• Artificial intelligence sells to journal reviewers and peers who cannot distinguish hype from substance when it comes to microarray data analysis.
• Comparative studies have shown that simpler methods work as well or better for microarray problems because the number of candidate predictors exceeds the number of samples by orders of magnitude.

Simple Gene Selection
• Use genes which are univariately correlated with outcome – For class comparison false discovery rate is important– For class prediction, predictive accuracy is important

Complex Gene Selection
• Small subset of genes which together give most accurate predictions– Genetic algorithms
• Little evidence that complex feature selection is useful in microarray problems– Failure to compare to simpler methods– Some published complex methods for
selecting combinations of features do not appear to have been properly evaluated

Linear Classifiers for Two Classes
• Diagonal linear discriminant analysis (DLDA)• Compound covariate predictor (Radmacher et
al ) • Weighted voting (Golub et al.)• Support vector machines with inner product
kernel

Other Simple Methods
• Nearest neighbor classification
• Nearest k-neighbors
• Nearest centroid classification
• Shrunken centroid classification

Evaluating a Classifier
• Fit of a model to the same data used to develop it is no evidence of prediction accuracy for independent data– Goodness of fit vs prediction accuracy
• Demonstrating statistical significance of prognostic factors is not the same as demonstrating predictive accuracy

Class Prediction
• A set of genes is not a classifier• Testing whether analysis of independent data results in
selection of the same set of genes is not an appropriate test of predictive accuracy of a classifier


Split-Sample Evaluation
• Training-set– Used to select features, select model type, determine
parameters and cut-off thresholds
• Test-set– Withheld until a single model is fully specified using
the training-set.– Fully specified model is applied to the expression
profiles in the test-set to predict class labels. – Number of errors is counted

Do’s & Don’tsSeparate Test Set
• Don’t use any information from the test set in developing the classifier
• Do access the test set once and only for testing the fully specified classifier developed with the training data

Cross Validation
• Cross-validation simulates the process of separately developing a model on one set of data and predicting for a test set of data not used in developing the model
• The cross-validated estimate of misclassification error is an estimate of the prediction error for model fit using specified algorithm to full dataset
Leave-one-out Cross Validation
• Omit sample 1– Develop multivariate classifier from scratch on
training set with sample 1 omitted– Predict class for sample 1 and record whether
prediction is correct
Leave-one-out Cross Validation
• Repeat analysis for training sets with each single sample omitted one at a time
• e = number of misclassifications determined by cross-validation
• Subdivide e for estimation of sensitivity and specificity

• Cross validation is only valid if the test set is not used in any way in the development of the model. Using the complete set of samples to select genes violates this assumption and invalidates cross-validation.
• With proper cross-validation, the model must be developed from scratch for each leave-one-out training set. This means that feature selection must be repeated for each leave-one-out training set.

Do’s & Don’tsCross Validation
• Don’t use the same set of features for all iterations
• Do report error estimates for all classification methods tried, not just the one with the smallest error estimate
• Don’t consider that retaining a small separate test set adds value to a correctly cross-validated estimate of accuracy
• Do report the fully specified classifier with its parameters

Do’s & Don’tsCross Validation
• Do report the permutation statistical significance of the cross-validation estimate of prediction error

Permutation Distribution of Cross-validated Misclassification Rate of a
Multivariate Classifier• Randomly permute class labels and repeat
the entire cross-validation• Re-do for all (or 1000) random
permutations of class labels• Permutation p value is fraction of random
permutations that gave as few misclassifications as e in the real data

Myth
• Split sample validation is superior to LOOCV for estimating prediction error


Cluster Analysis of Samples
• For discovering unanticipated structure and subsets of tissues

Cluster Analysis is Subjective
• Cluster algorithms always produce clusters
• Different distance metrics and clustering algorithms may find different structure using the same data.
Major Flaws Found in 40 Studies Published in 2004
• Inadequate control of multiple comparisons in gene finding– 9/23 studies had unclear or inadequate methods to deal with
false positives• 10,000 genes x .05 significance level = 500 false positives
• Misleading report of prediction accuracy– 12/28 reports based on incomplete cross-validation
• Misleading use of cluster analysis – 13/28 studies invalidly claimed that expression clusters based on
differentially expressed genes could help distinguish clinical outcomes
• 50% of studies contained one or more major flaws


Conclusion
• Do Use BRB-ArrayTools or a statistical collaborator
• Do Use BRB-ArrayTools if you are a statistical collaborator