Embed Size (px)
Citation preview
CRC for Contamination Assessment and Remediation of the Environment
National Remediation Framework
Guideline on performing cost-benefit and sustainability analysis of remediation options
Version 0.1: August 2018
CRC CARE National Remediation Framework Guideline on performing cost-benefit and sustainability analysis of remediation options
Information correct at time of publication i Version 0.1: August 2018
National Remediation Framework
The following guideline is one component of the National Remediation Framework (NRF). The NRF was developed by the Cooperative Research Centre for Contamination Assessment and Remediation of the Environment (CRC CARE) to enable a nationally consistent approach to the remediation and management of contaminated sites. The NRF is compatible with the National Environment Protection (Assessment of Site Contamination) Measure (ASC NEPM).
The NRF has been designed to assist the contaminated land practitioner undertaking a remediation project, and assumes the reader has a basic understanding of site contamination assessment and remediation principles. The NRF provides the underlying context, philosophy and principles for the remediation and management of contaminated sites in Australia. Importantly it provides general guidance based on best practice, as well as links to further information to assist with remediation planning, implementation, review, and long-term management.
This guidance is intended to be utilised by stakeholders within the contaminated sites industry, including site owners, proponents of works, contaminated land professionals, local councils, regulators, and the community.
The NRF is intended to be consistent with local jurisdictional requirements, including State, Territory and Commonwealth legislation and existing guidance. To this end, the NRF is not prescriptive. It is important that practitioners are familiar with local legislation and regulations and note that the NRF does not supersede regulatory requirements.
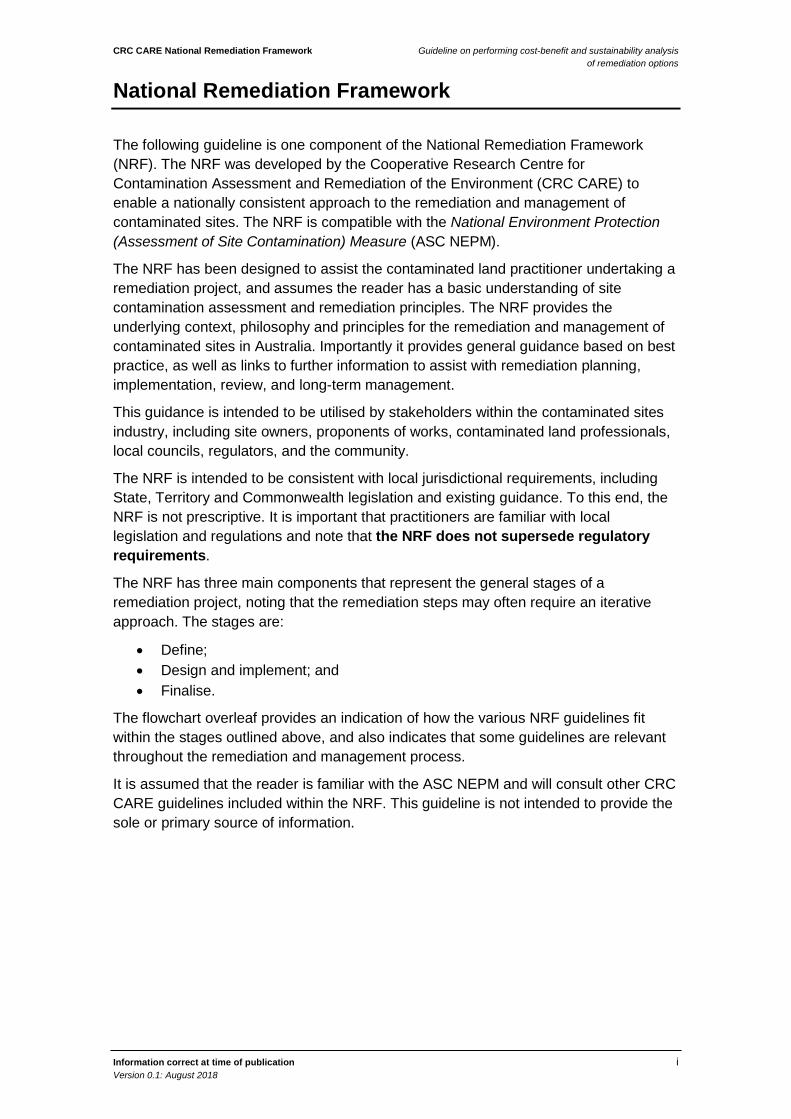
The NRF has three main components that represent the general stages of a remediation project, noting that the remediation steps may often require an iterative approach. The stages are:
• Define; • Design and implement; and • Finalise.
The flowchart overleaf provides an indication of how the various NRF guidelines fit within the stages outlined above, and also indicates that some guidelines are relevant throughout the remediation and management process.
It is assumed that the reader is familiar with the ASC NEPM and will consult other CRC CARE guidelines included within the NRF. This guideline is not intended to provide the sole or primary source of information.
CRC CARE National Remediation Framework Guideline on performing cost-benefit and sustainability analysis of remediation options
Information correct at time of publication ii Version 0.1: August 2018
CRC CARE National Remediation Framework Guideline on performing cost-benefit and sustainability analysis of remediation options
Information correct at time of publication iii Version 0.1: August 2018
Executive summary
Cost-benefit and sustainability analysis (CB&SA) is an analytical tool that enables the assessment and comparison of the short and long-term economic, environmental and social impacts associated with implementing a project or undertaking an investment.
CB&SA enables the identification of the optimal economical and sustainable option, from a range of available options. In the context of the remediation of contaminated sites, CB&SA enables practitioners to weigh the economic and sustainability impacts of each of a range of remediation options, to guide decision-makers in identifying and selecting the option that best addresses the remedial objectives.
CB&SA achieves this by enabling the decision-maker to quantify and qualify the potential economic, environmental and social impacts associated with the remediation of a site, and then consider and evaluate those impacts in an objective, transparent and meaningful manner. Within this guideline, the various elements that require consideration to evaluate the impacts are labelled indicators. For example, carbon dioxide emissions may be an ‘indicator’ of sustainability.
The CB&SA is a scalable and flexible process that can be used for small or large, simple or complex, short-term or long-term projects or programs. CB&SA can also be used in a tiered or staged decision-making process. While CB&SA analysis is scalable and flexible, the time and cost of collecting and processing relevant data means that for simple, straightforward projects, CB&SA is unlikely to be warranted. Nonetheless, the approaches used in this guideline may well be widely applicable.
CB&SA involves the integration of results of a cost-benefit analysis with the results of a multi-criteria analysis to produce a combined cost-benefit and sustainability analysis. This enables a robust consideration of the relevant economic and sustainability impacts of the various options.
Ideally, a CBA should be commenced at the same time as the land use options or remedial options are being developed to help guide decision-makers on whether to proceed, and if so, which alternative to select. A CBA should not be used to justify a decision that has already been made or a project that is under development. Broadly, there are a range of instances when the use of CBA is particularly relevant:
• Analysing the costs and benefits of remediating an existing contaminated site to decide if the site should be remediated;
• Assessing the costs and benefits of remediating to alternative land uses and choosing between future land uses;
• Analysing proposed capital and operating investment for a new or replacement remedial option to decide whether that investment should be undertaken;
• Choosing between alternative remedial options; and
• Post evaluation of a remedial project or program to compare the known costs and benefits from an activity with what would have happened in the absence of the project to provide transparency and accountability in reporting on how well funds have been spent.
CRC CARE National Remediation Framework Guideline on performing cost-benefit and sustainability analysis of remediation options
Information correct at time of publication iv Version 0.1: August 2018
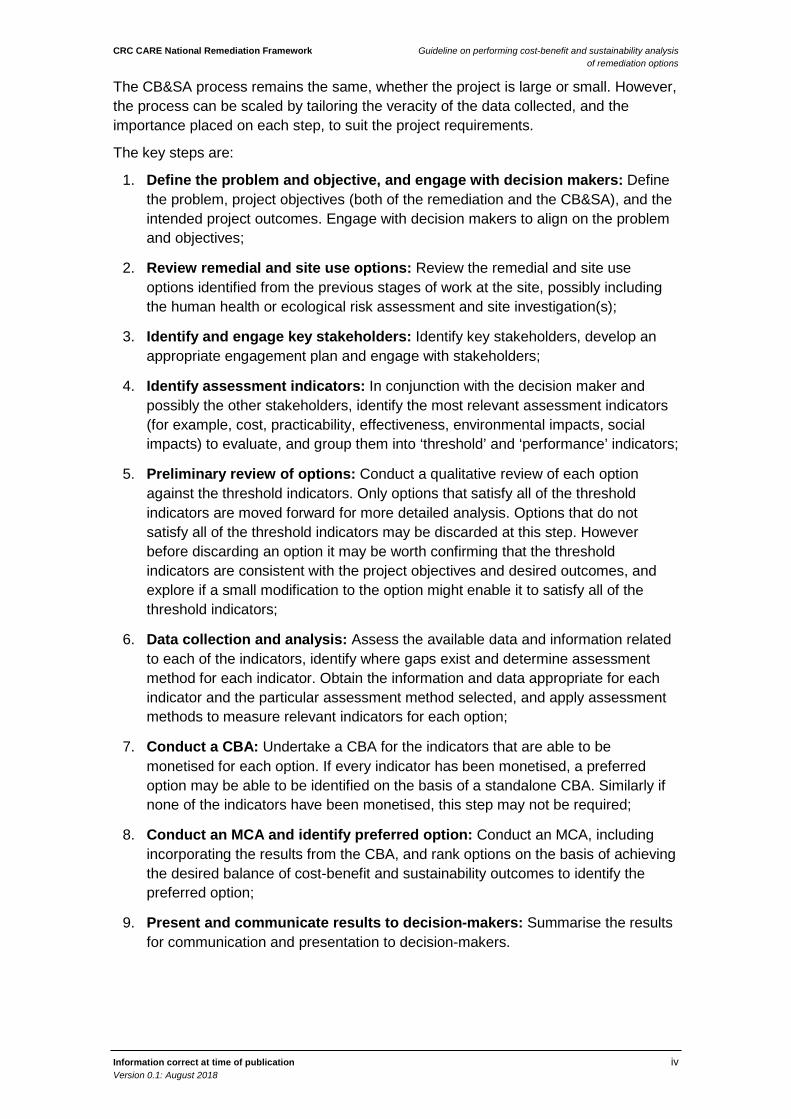
The CB&SA process remains the same, whether the project is large or small. However, the process can be scaled by tailoring the veracity of the data collected, and the importance placed on each step, to suit the project requirements.
The key steps are:
1. Define the problem and objective, and engage with decision makers: Define the problem, project objectives (both of the remediation and the CB&SA), and the intended project outcomes. Engage with decision makers to align on the problem and objectives;
2. Review remedial and site use options: Review the remedial and site use options identified from the previous stages of work at the site, possibly including the human health or ecological risk assessment and site investigation(s);
3. Identify and engage key stakeholders: Identify key stakeholders, develop an appropriate engagement plan and engage with stakeholders;
4. Identify assessment indicators: In conjunction with the decision maker and possibly the other stakeholders, identify the most relevant assessment indicators (for example, cost, practicability, effectiveness, environmental impacts, social impacts) to evaluate, and group them into ‘threshold’ and ‘performance’ indicators;
5. Preliminary review of options: Conduct a qualitative review of each option against the threshold indicators. Only options that satisfy all of the threshold indicators are moved forward for more detailed analysis. Options that do not satisfy all of the threshold indicators may be discarded at this step. However before discarding an option it may be worth confirming that the threshold indicators are consistent with the project objectives and desired outcomes, and explore if a small modification to the option might enable it to satisfy all of the threshold indicators;
6. Data collection and analysis: Assess the available data and information related to each of the indicators, identify where gaps exist and determine assessment method for each indicator. Obtain the information and data appropriate for each indicator and the particular assessment method selected, and apply assessment methods to measure relevant indicators for each option;
7. Conduct a CBA: Undertake a CBA for the indicators that are able to be monetised for each option. If every indicator has been monetised, a preferred option may be able to be identified on the basis of a standalone CBA. Similarly if none of the indicators have been monetised, this step may not be required;
8. Conduct an MCA and identify preferred option: Conduct an MCA, including incorporating the results from the CBA, and rank options on the basis of achieving the desired balance of cost-benefit and sustainability outcomes to identify the preferred option;
9. Present and communicate results to decision-makers: Summarise the results for communication and presentation to decision-makers.
CRC CARE National Remediation Framework Guideline on performing cost-benefit and sustainability analysis of remediation options
Information correct at time of publication v Version 0.1: August 2018
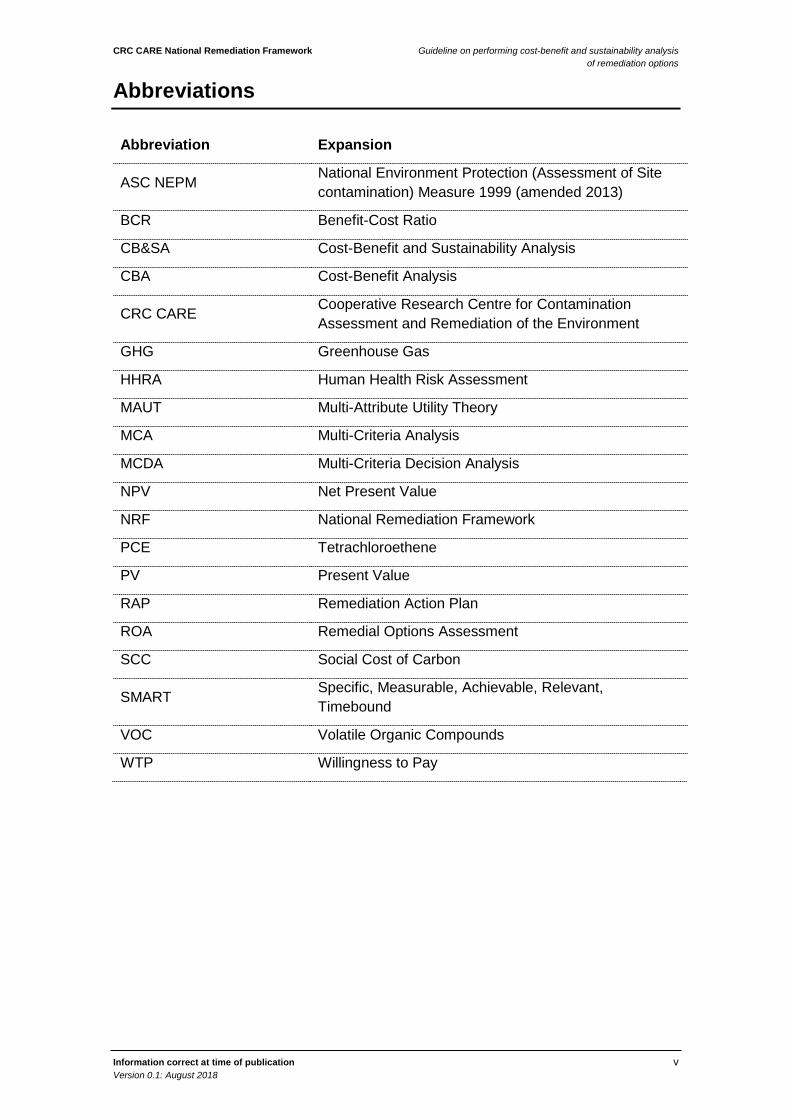
Abbreviations
Abbreviation Expansion
ASC NEPM National Environment Protection (Assessment of Site contamination) Measure 1999 (amended 2013)
BCR Benefit-Cost Ratio
CB&SA Cost-Benefit and Sustainability Analysis
CBA Cost-Benefit Analysis
CRC CARE Cooperative Research Centre for Contamination Assessment and Remediation of the Environment
GHG Greenhouse Gas
HHRA Human Health Risk Assessment
MAUT Multi-Attribute Utility Theory
MCA Multi-Criteria Analysis
MCDA Multi-Criteria Decision Analysis
NPV Net Present Value
NRF National Remediation Framework
PCE Tetrachloroethene
PV Present Value
RAP Remediation Action Plan
ROA Remedial Options Assessment
SCC Social Cost of Carbon
SMART Specific, Measurable, Achievable, Relevant, Timebound
VOC Volatile Organic Compounds
WTP Willingness to Pay
CRC CARE National Remediation Framework Guideline on performing cost-benefit and sustainability analysis of remediation options
Information correct at time of publication vi Version 0.1: August 2018
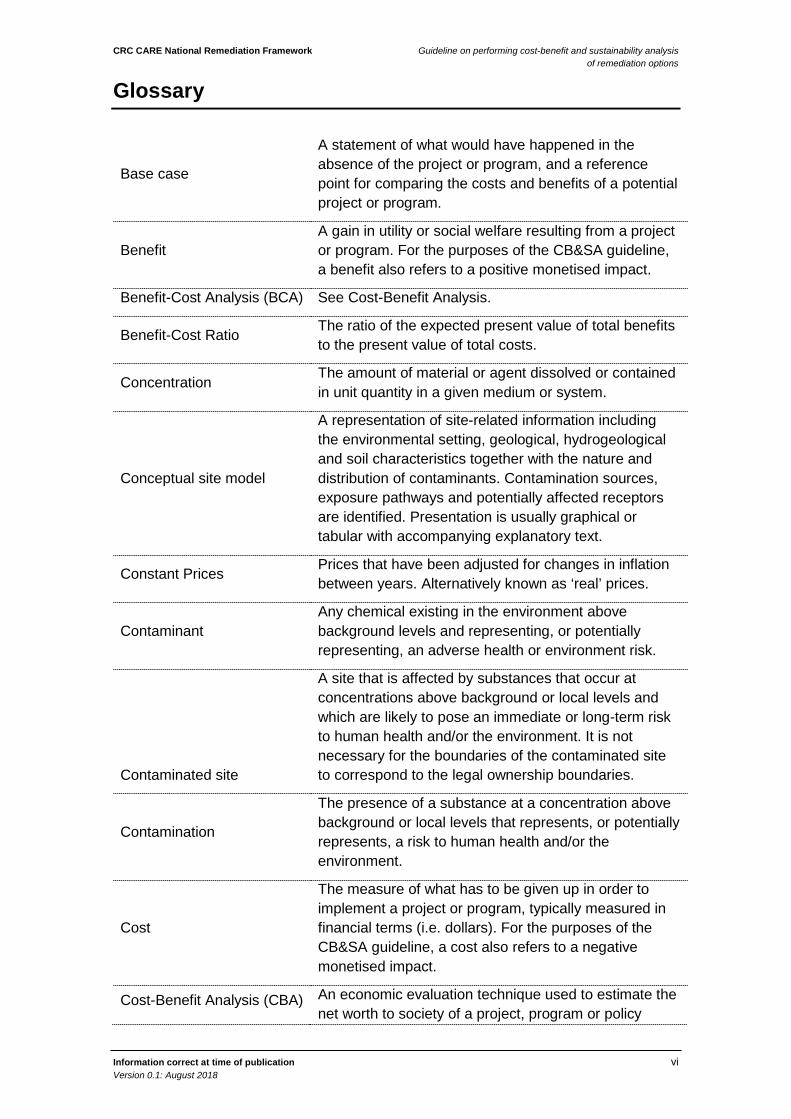
Glossary
Base case
A statement of what would have happened in the absence of the project or program, and a reference point for comparing the costs and benefits of a potential project or program.
Benefit A gain in utility or social welfare resulting from a project or program. For the purposes of the CB&SA guideline, a benefit also refers to a positive monetised impact.
Benefit-Cost Analysis (BCA) See Cost-Benefit Analysis.
Benefit-Cost Ratio The ratio of the expected present value of total benefits to the present value of total costs.
Concentration The amount of material or agent dissolved or contained in unit quantity in a given medium or system.
Conceptual site model
A representation of site-related information including the environmental setting, geological, hydrogeological and soil characteristics together with the nature and distribution of contaminants. Contamination sources, exposure pathways and potentially affected receptors are identified. Presentation is usually graphical or tabular with accompanying explanatory text.
Constant Prices Prices that have been adjusted for changes in inflation between years. Alternatively known as ‘real’ prices.
Contaminant Any chemical existing in the environment above background levels and representing, or potentially representing, an adverse health or environment risk.
Contaminated site
A site that is affected by substances that occur at concentrations above background or local levels and which are likely to pose an immediate or long-term risk to human health and/or the environment. It is not necessary for the boundaries of the contaminated site to correspond to the legal ownership boundaries.
Contamination
The presence of a substance at a concentration above background or local levels that represents, or potentially represents, a risk to human health and/or the environment.
Cost
The measure of what has to be given up in order to implement a project or program, typically measured in financial terms (i.e. dollars). For the purposes of the CB&SA guideline, a cost also refers to a negative monetised impact.
Cost-Benefit Analysis (CBA) An economic evaluation technique used to estimate the net worth to society of a project, program or policy
CRC CARE National Remediation Framework Guideline on performing cost-benefit and sustainability analysis of remediation options
Information correct at time of publication vii Version 0.1: August 2018
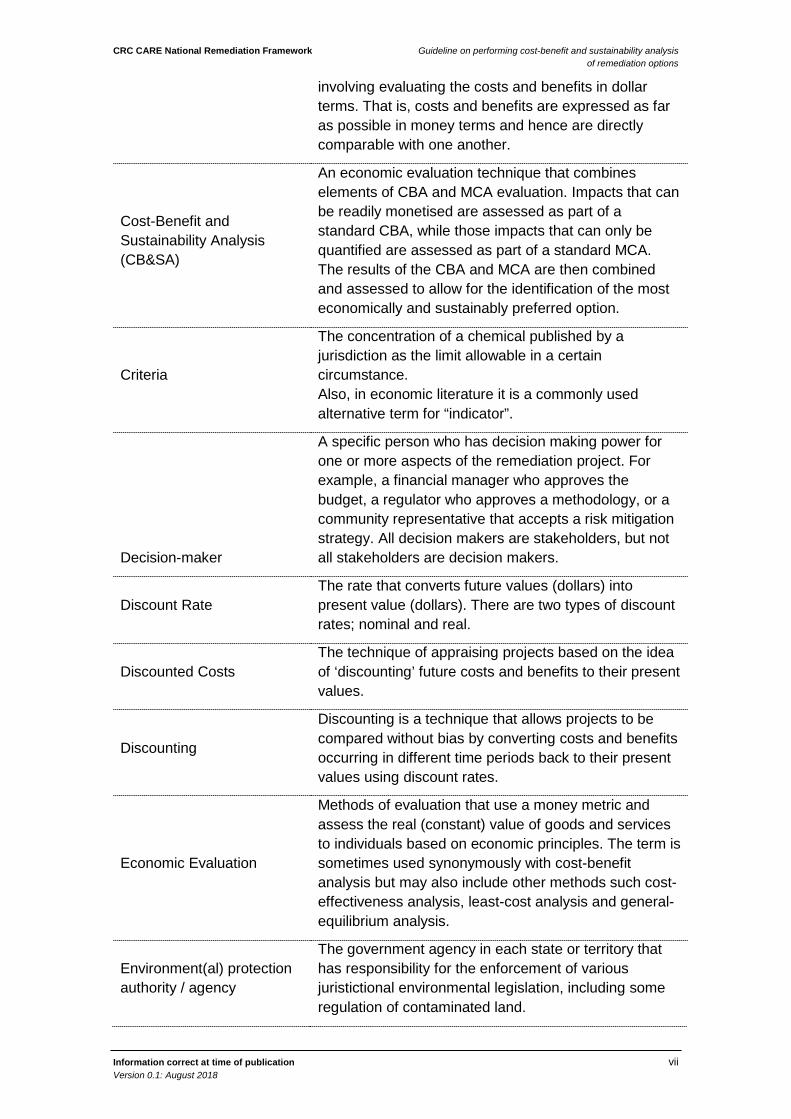
involving evaluating the costs and benefits in dollar terms. That is, costs and benefits are expressed as far as possible in money terms and hence are directly comparable with one another.
Cost-Benefit and Sustainability Analysis (CB&SA)
An economic evaluation technique that combines elements of CBA and MCA evaluation. Impacts that can be readily monetised are assessed as part of a standard CBA, while those impacts that can only be quantified are assessed as part of a standard MCA. The results of the CBA and MCA are then combined and assessed to allow for the identification of the most economically and sustainably preferred option.
Criteria
The concentration of a chemical published by a jurisdiction as the limit allowable in a certain circumstance. Also, in economic literature it is a commonly used alternative term for “indicator”.
Decision-maker
A specific person who has decision making power for one or more aspects of the remediation project. For example, a financial manager who approves the budget, a regulator who approves a methodology, or a community representative that accepts a risk mitigation strategy. All decision makers are stakeholders, but not all stakeholders are decision makers.
Discount Rate The rate that converts future values (dollars) into present value (dollars). There are two types of discount rates; nominal and real.
Discounted Costs The technique of appraising projects based on the idea of ‘discounting’ future costs and benefits to their present values.
Discounting
Discounting is a technique that allows projects to be compared without bias by converting costs and benefits occurring in different time periods back to their present values using discount rates.
Economic Evaluation
Methods of evaluation that use a money metric and assess the real (constant) value of goods and services to individuals based on economic principles. The term is sometimes used synonymously with cost-benefit analysis but may also include other methods such cost-effectiveness analysis, least-cost analysis and general-equilibrium analysis.
Environment(al) protection authority / agency
The government agency in each state or territory that has responsibility for the enforcement of various juristictional environmental legislation, including some regulation of contaminated land.
CRC CARE National Remediation Framework Guideline on performing cost-benefit and sustainability analysis of remediation options
Information correct at time of publication viii Version 0.1: August 2018
Evaluation
A considered assessment of a program, project or activity. Whereas an ‘appraisal’ is invariably ‘before the fact’, an evaluation may take place ‘after the fact’, or while an activity is in progress.
Indicator The attribute to be assessed, measured or valued for each of the identified remediation options. Other economic literature may refer to indicators as "criteria".
Inflation
A sustained rise in the general price level; the proportionate rate of increase in the general price level per unit of time. Inflation is typically measured by the Consumer Price Index (CPI) in Australia.
Monetisation The practice of placing money values on costs, benefits and externalities.
Multi-Criteria Analysis (MCA)
A decision-making technique that involves assigning weights to criteria, and then scoring options in terms of how well they perform against those weighted criteria. Weighted scores are then summed and can then be used to rank project or program options.
Net Benefits Benefits less costs.
Net Present Value The discounted value of the expected benefits of a project, less the discounted value of the expected costs.
Nominal Prices The prices prevailing in each specific year.
Option A discrete solution to the problem and objectives. Options are ranked during a CB&SA.
Performance Indicator An indicator that enables an assessment of the consequences and ability of an option to achieve the desired objectives.
Practitioner Those in the private sector professionally engaged in the assessment, remediation or management of site contamination.
Present Value The discounted value of expected benefits or costs.
Proponent A person who is legally authorised to make decisions about a site. The proponent may be a site owner or occupier or their representative.
Remediation
An action designed to deliberately break the source-pathway-receptor linkage in order to reduce the risk to human health and/or the environment to an acceptable level.
Remediation
An action designed to deliberately break the source-pathway-receptor linkage in order to reduce the risk to human health and/or the environment to an acceptable level.
CRC CARE National Remediation Framework Guideline on performing cost-benefit and sustainability analysis of remediation options
Information correct at time of publication ix Version 0.1: August 2018
Risk
The probability that in a certain timeframe an adverse outcome will occur in a person, a group of people, plants, animals and/or the ecology of a specified area that is exposed to a particular dose or concentration of a specified substance, i.e. it depends on both the level of toxicity of the substance and the level of exposure. ‘Risk’ differs from ‘hazard’ primarily because risk considers probability.
Scenario Analysis The process of looking at the consequences of various possible states of the world or future scenarios.
Sensitivity Analysis A technique involving changes to the parameters of a project and/or program evaluation to see how they affect the outcome.
Site
A parcel of land (including ground and surface water) being assessed for contamination, as identified on a map by parameters including Lot and Plan number(s) and street address. It is not necessary for the site boundary to correspond to the Lot and Plan boundary, however it commonly does.
Site
A parcel of land (including ground and surface water) being assessed for contamination, as identified on a map by parameters including Lot and Plan number(s) and street address. It is not necessary for the site boundary to correspond to the Lot and Plan boundary, however it commonly does.
Stakeholder
An individual, group, organisation or other entity that may be interested in, or affected by, the remediation and management of a contaminated site. Depending on specific site circumstances, stakeholders may include residents, site owners, public health officials, government regulatory authorities, media, businesses working on site, and environmental or other action/interest groups, as well as site owners and people working on the project. Stakeholders may or may not be directly involved in the project but do include all those who may have knowledge of or views about the project. Not all stakeholders are necessarily decision makers.
CRC CARE National Remediation Framework Guideline on performing cost-benefit and sustainability analysis of remediation options
Information correct at time of publication x Version 0.1: August 2018
Stakeholder Engagement
The process of engaging and communicating with people (individuals and groups) who have an interest, or ‘stake’ in the remediation and management of a contaminated site, to achieve accepted outcomes.
Sustainability
Generally, refers to achieving a balance between meeting the needs of the present without compromising the ability of future generations to meet their own needs. In specific reference to the remediation of site contamination, sustainability refers to achieving an acceptable balance between the impacts of undertaking remediation activities and the benefits those activities will deliver in terms of the environmental, economic and social indicators relevant to the site.
Sustainability Analysis
An integrated examination of the environmental, economic, and social impacts of a given activity to meet the needs of the present without compromising the ability of future generations to meet their own needs.
Swing Weight The swing in value that occurs as an indicator is varied from one end of its performance scale to the other.
Threshold Indicator An indicator that addresses minimum requirements that need to be met in order for a remedial or site option to be considered for selection.
Uncertainty
The state of knowledge of a current issue, and how well known the issue is, both in the present and in the future. It can be thought of as “how precise and accurate is the data we are relying on”
Valuation See Monetisation.
CRC CARE National Remediation Framework Guideline on performing cost-benefit and sustainability analysis of remediation options
Information correct at time of publication xi Version 0.1: August 2018
Table of contents
National remediation framework i
Executive summary iii
Abbreviations v
Glossary vi
1. Introduction 1
When to use CB&SA 1
Regulatory framework 2
CB&SA Tool 2
2. CB&SA overview 4
Cost-benefit analysis explained 5
When is a CBA used? 6
Sustainability and sustainability analysis explained 7
What is sustainability analysis? 8
Multi-criteria analysis (MCA) 8
CB&SA – integrating cost benefit and sustainability analysis 9
Steps in undertaking a CB&SA 10
Limitations to CB&SA, and how this guidance address them 11
False accuracy 11
Optimism bias 12
Impacts that are difficult or costly to monetise 12
Distributional and equity impacts 12
Risk and uncertainty 12
Application within the contaminated sites sector 13
3. Steps 1-6: CB&SA initial setup 15
Step 1 - Define the objectives and problem, and engage with decision makers 17
Step 2 – Identify remedial and site use options 21
Step 3 - Identify and engage key stakeholders 23
Stakeholder identification process 24
Stakeholder engagement plan 25
Step 4 - Identifying assessment indicators 27
Types of indicators 28
Threshold indicators 29
CRC CARE National Remediation Framework Guideline on performing cost-benefit and sustainability analysis of remediation options
Information correct at time of publication xii Version 0.1: August 2018
Performance indicators 30
Step 5 - Preliminary review of options 32
Step 6 - Data collection and analysis 35
Identify availability and obtain data 35
Determine data gaps 36
Determine the assessment category 37
4. Step 7: Conducting a CBA 40
Selecting the appropriate discount rate 41
Nominal or real discount rates 41
Default discount rates 41
Using the discount rate to consider sustainability and future generations 42
Discounting to present value 42
Ranking options 45
Net present value 45
Benefit-cost ratio 46
Assessing risk and uncertainty within a CBA 47
Sensitivity analysis 47
Scenario analysis 49
5. Step 8: Conducting an MCA 52
Developing a consequence table 53
Incorporating CBA results into the MCA 54
Assigning weights 54
Process steps for developing swing weights 58
Direct rating 60
Calculate total MCA score 61
Normalise consequence scores to value scales 61
Sum the product of value scores and weights for each indicator 63
Assessing risk and uncertainty within an MCA 64
Uncertainty in indicator values 67
6. Step 9: Interpreting and reporting results 68
Preliminary review of options 68
Standalone CBA 69
Interpreting risk and uncertainty analysis in CBA 72
Integrated CB&SA 73
CRC CARE National Remediation Framework Guideline on performing cost-benefit and sustainability analysis of remediation options
Information correct at time of publication xiii Version 0.1: August 2018
Interpreting the risk and uncertainty analysis in MCA 74
Reporting the findings 77
Appendix A – Checklist of steps and key outcomes 79
Appendix B – Community engagement spectrum 81
Appendix C – Contaminated sites suggested indicators 82
Threshold indicators: 83
Performance indicators: 84
Appendix D – Assessment methods – Further details 93
Quantification 93
Monetizing Techniques 95
Qualitative 98
Appendix E – Case studies 101
Case Study 1 101
Case Study 2 118
Appendix F – References 132
CRC CARE National Remediation Framework Guideline on performing cost-benefit and sustainability analysis of remediation options
Information correct at time of publication 1 Version 0.1: August 2018
1. Introduction
The objective of this guideline is to provide national guidance on applying cost-benefit and sustainability analysis (CB&SA) methods to assist remediation professionals with identifying the preferred option for remediation/management of a contaminated site.
Specifically, this guideline aims to:
• Develop an understanding of the principles and process of CB&SA within the context of contaminated site remediation;
• Establish requirements for the economic and sustainability evaluation of contaminated site remediation options;
• Encourage consideration of every reasonable option as early as possible in the evaluation process;
• Provide guidance on identifying and assessing the full range of costs and benefits associated with these contaminated site remediation options; and
• Assist in identifying and choosing the preferred site remediation option.
It is anticipated that this guideline will be used by a variety of people including contaminated sites practitioners, regulators, site owners and councils to aid the choice of remedial technique, or to aid the review or interpretation of the work of others. Throughout the remainder of the guideline, the person or team conducting the CB&SA is referred to as the ‘practitioner”.
It is assumed that the reader is familiar with the ASC NEPM and will refer to other CRC CARE guidelines included within the NRF. This guideline and the methods presented within are not intended to provide the sole or primary source of information regarding cost-benefit and sustainability analysis. This document does not supersede regulatory requirements, and familiarity with local legislation and regulations is necessary before proceeding with environmental investigations or remediation/management.
This guideline does not intend that readers will become experts in economic analysis or undertake complex economic analysis. Rather, they will understand the information they can reasonably expect from CB&SA assessment, the data inputs that they will be asked to provide to support the analysis, and the likely scope of the effort. CB&SA is often undertaken by professional economists, and judgement should be made as to whether the environmental practitioners can undertake the CB&SA, or whether professional assistance is required for some or all the scope (much as a human health risk assessment may be performed by a generalist or a specialist depending on the situation). The need for professional assistance should be determined based on the size and complexity of the remedial project, the proponents’ needs and the needs of other stakeholders. This guidance provides advice on situations where professional assistance may be warranted.
When to use CB&SA This guidance is designed to be scalable and iterative and can therefore be used at every stage of site investigation and remediation. However, it is likely to be most useful when implemented in the land use decision or the remedial options assessment (ROA)
CRC CARE National Remediation Framework Guideline on performing cost-benefit and sustainability analysis of remediation options
Information correct at time of publication 2 Version 0.1: August 2018
phases. It is assumed that the reader has a sound understanding of the site, the contamination issues, the remedial goals, the relevant stakeholders, and the applicable national and state legislations prior to undertaking this CB&SA process.
Often the future land use of a site will be pre-determined, through factors such as stakeholder preference or dictated by regulations such as the zoning of the land. However, if the land use is flexible (i.e. the site could be redeveloped for future commercial or residential use) then the CB&SA framework presented within this guideline can be performed at a ‘screening level’ to help inform the decision on which land use will provide the most benefit.
Currently, it is common practice to include a simple qualitative cost-benefit analysis within an ROA. This often takes the form of a table, showing the remedial options against a range of indicators such as cost, time to completion or regulator acceptance. Each of the options is then given a qualitative score (i.e: high, medium low), and the option with the highest qualitative score is determined to be the best alternative.
By using the CB&SA framework outlined within this guidance, this concept can then be expanded to provide a more robust and repeatable options comparison. The level of effort included within the CB&SA can be scaled depending on site and stakeholder factors including the timeline, budget, site constraints, stakeholder requirements and available information. While CB&SA analysis is scalable and flexible, the time and cost of collecting and processing relevant data means that for simple, straightforward projects, CB&SA is unlikely to be warranted. Nonetheless, the approaches used in this guideline may well be widely applicable.
While this guideline aims to provide the concepts, tools and techniques to perform CB&SA, it is noted that this analysis is just one tool that can be employed to aid the decision-making process. It is also noted that in some circumstances, the remedial options are limited and therefore employing this process may not be of measurable benefit.
Regulatory framework At the time of writing, no state or territory had published guidance specifically relating to the cost-benefit or sustainability assessment of contaminated site remedial options. However, many states do have guidance regarding the nature or extent of remediation, or the process that must be followed when undertaking remediation. While these guidance documents may be more relevant to “choosing remedial options” they can and should be considered when conducting a CB&SA. In general, it is recommended to have proactive and timely engagement with the relevant regulatory authorities throughout the CB&SA process. This is particularly relevant when considering options that may fall outside of regulatory frameworks or obligations.
CB&SA Tool This guideline is accompanied by the CB&SA Tool. The CB&SA Tool is a spreadsheet-based workbook with pre-programmed tables, formulas and calculations as described within this guideline. The aim of the CB&SA Tool is to complement the guideline and make the calculations easy. This then allows the practitioner to move their mental focus from the “mechanics” of the mathematical calculations to the “reasons and implications” of the results to the decision-making.

CRC CARE National Remediation Framework Guideline on performing cost-benefit and sustainability analysis of remediation options
Information correct at time of publication 3 Version 0.1: August 2018
Use of the CB&SA Tool is reasonably intuitive and follows the same format as the guideline text. Specific instructions are provided both within the CB&SA Tool and in a separate instruction file, and practitioners should refer to those for detailed information on the mechanics of using the CB&SA Tool. In addition, to demonstrate the CB&SA Tool outputs, some of the worked examples provided within the text, along with the case studies, have been generated using the CB&SA Tool.
The CB&SA Tool and instruction manual can be downloaded from the CRC CARE website at: https://www.crccare.com/
CRC CARE National Remediation Framework Guideline on performing cost-benefit and sustainability analysis of remediation options
Information correct at time of publication 4 Version 0.1: August 2018
2. CB&SA overview
CB&SA is an analytical tool that enables the assessment and comparison of the short and long-term economic, environmental and social impacts associated with implementing a project or undertaking an investment.
CB&SA enables the identification of the optimal economical and sustainable option, from a range of available options. In the context of the remediation of contaminated sites, CB&SA enables practitioners to weigh the economic and sustainability impacts of each of a range of remediation options, to guide decision-makers in identifying and selecting the option that best addresses the remedial objectives.
CB&SA achieves this by enabling the decision-maker to quantify and qualify the potential economic, environmental and social impacts associated with the remediation of a site, and then consider and evaluate those impacts in an objective, transparent and meaningful manner. Within this guideline, the various elements that require consideration to evaluate the impacts are labelled indicators. For example, carbon dioxide emissions may be an ‘indicator’ of sustainability. This concept is explored in more detail in the coming sections.
Practitioner Tip:
In most economic literature, these elements are referred to as “criteria”. However, in the contaminated sites context this could become confusing with human health or ecological criteria, and therefore the term “indicator” has instead been adopted within
this guidance. Practitioners accessing other economic literature should be aware that these terms can be used interchangeably.
The CB&SA is a scalable and flexible process that can be used for small or large, simple or complex, short-term or long-term projects or programs. CB&SA can also be used in a tiered or staged decision-making process. For example, it can first be used to help determine the overarching land-use objectives of a contaminated site (i.e. is it best to remediate the site for residential, commercial or industrial use?), and then also be used to short-list potential site remediation options, and subsequently identify a preferred option as part of a detailed options assessment. Critically, the CB&SA framework is fundamentally iterative, that is the level of analysis can continually be reviewed and refined throughout the decision-making process, and results of the CB&SA can be revisited as additional information and data becomes available.
While project costs are normally easily measured in dollars (i.e. monetised), it is common that the elements that require consideration as part of a sustainability analysis are also those that are not readily monetised. For example, the environmental and social impacts of remediating a former industrial site and returning it to the community in the form of a public park may not be readily expressed in monetary terms. To achieve consideration of both monetary (i.e. economic) and sustainability impacts, this CB&SA guideline advocates conducting a cost-benefit analysis (CBA) for those identified indicators that can be monetised, and a multi-criteria analysis (MCA) for the
CRC CARE National Remediation Framework Guideline on performing cost-benefit and sustainability analysis of remediation options
Information correct at time of publication 5 Version 0.1: August 2018
remaining indicators deemed important to the assessment but not readily monetised. As such, this guideline also includes how CBA results can be incorporated into the MCA for an integrated picture of the trade-offs represented by every identified relevant sustainability indicator. This approach is consistent with relevant literature in this field.
For each indicator the choice of method (CBA or MCA) will depend on data availability, the level of rigour required, the cost of obtaining data and estimating impacts, and the relative importance of that indicator to decision making. The decision rules for making this choice are presented in Section 3.6, and the general principles are:
• CBA: When practicable and appropriate, indicators should be monetised, that is expressed in dollar terms for inclusion in the CBA;
• MCA: If monetisation is not practicable and an indicator is likely to help distinguish between options, it should be assessed using MCA methods; and
• Report: If an indicator is of interest, but not likely to influence decision making, it can be reported for each option but not explicitly made part of the CBA or MCA. Reporting of indicators is not further discussed in this guideline.
It should be noted that neither CBA nor MCA is considered a “superior” technique or is preferred over the other. Both techniques have advantages and drawbacks that must be understood and addressed (discussed in more detail later), and the selection of technique is largely due to the nature of the set of indicators (the more readily the important indicators can be valued in dollars, the more CBA is applicable: and the converse is true for MCA). Many economics texts and guidance documents suggest using CBA as a preferred methodology, however for the practical applications of this guideline the CBA and MCA are considered equally applicable and can provide insight into decision making.
This section of the guideline provides background on the CBA and MCA components, and then explains how they are combined in later sections to provide CB&SA.
Cost-benefit analysis explained CBA is a set of procedures for defining and comparing the benefits and costs (economic, social and environmental) associated with decisions to implement a project or to undertake an investment. The benefits and costs are expressed in monetary (i.e. dollar value) terms and hence are directly comparable with one another.
Within this guideline, CBA is used to quantify in monetary terms the costs (i.e. negative economic, environment and social impacts) and benefits (i.e. positive economic, environmental and social impacts) of potential remediation activities.
Examples of costs include the project costs associated with implementing a remediation activity such as labour costs, machinery hire, and construction costs, or such things as detrimental impacts to groundwater resources or ecosystems because of the remediation works.
Examples of benefits include reduced human health risks and associated health care costs and foregone wages, improved social amenity of the site, or the revenue brought about by the development and sale of a previously unused and abandoned industrial brown-field site into a mixed commercial and residential development (for example). Benefits may also include avoided future costs relating to the ongoing management and monitoring of the site.
CRC CARE National Remediation Framework Guideline on performing cost-benefit and sustainability analysis of remediation options
Information correct at time of publication 6 Version 0.1: August 2018
Depending on the scale and complexity of the remediation activity, and the level of supporting information available and required, it is also possible to apply economic valuation methods to assess the monetary costs and benefits associated with indicators such as changes in greenhouse gas (GHG) emissions, environmental impacts (for example loss of habitat for wildlife), water quality impacts and social and community impacts, and include these as part a CBA.
The CBA method provides a framework for analysing data in a logical and consistent way. It involves the systematic identification and quantification of the economic, social and environmental benefits and costs of each option.
CBA helps decision-makers answer questions such as:
• Does the remediation of a contaminated site provide a net benefit to the community?
• What ultimate end-use of the site represents the best use of available resources? Should the site be remediated for residential end-use, or for future commercial and industrial use?
• Is remediation, or non-remediation, providing intergenerational equality?
• Which of the various alternative remedial options should be undertaken?
• Should the proposed remediation be undertaken?
• Should any remediation be undertaken?
When is a CBA used?
Ideally, a CBA should be commenced at the same time as the land use options or remedial options are being developed to help guide decision-makers on whether to proceed, and if so, which alternative to select. A CBA should not be used to justify a decision that has already been made or a project that is under development. Broadly, there are a range of instances when the use of CBA is particularly relevant:
• Analysing the costs and benefits of remediating an existing contaminated site to decide if the site should be remediated;
• Assessing the costs and benefits of remediating to alternative land uses and choosing between future land uses;
• Analysing proposed capital and operating investment for a new or replacement remedial option to decide whether that investment should be undertaken;
• Choosing between alternative remedial options; and
• Post evaluation of a remedial project or program to compare the known costs and benefits from an activity with what would have happened in the absence of the project to provide transparency and accountability in reporting on how well funds have been spent.
Consistent with CB&SA described in Section 2 above, CBA is an iterative process that can be used for projects that are small or large, simple or complex, short-term or long-term. CBA is a flexible and scalable process that can be used to inform and aid decisions at each stage of project development.
CRC CARE National Remediation Framework Guideline on performing cost-benefit and sustainability analysis of remediation options
Information correct at time of publication 7 Version 0.1: August 2018
The complexity and detail of the CBA will be dependent on the nature, size and scale of the project being considered. Other factors such as the availability of relevant information and the cost of data collection will also impact the complexity and detail of the CBA. For example, conducting a CBA on a small site with only two or three options and reasonably accessible costings estimates, may take in the order of 4-8 hours to complete.
Practitioner Tip:
The CBA process itself is quite simple, so it can be undertaken for both small and large projects. The ease of collecting data in monetary terms is likely to be the deciding factor in whether to
complete the CBA component of the CB&SA.
Sustainability and sustainability analysis explained Sustainability is often defined as development that meets the needs of the present without comprising the ability of future generations to meet their own needs. An alternative definition of sustainability is stated as the path to balance social, economic and environmental needs.
Consistent with the concept of sustainability, ecologically sustainable development can be defined as using, conserving and enhancing the community's resources so that ecological processes, on which life depends, are maintained, and the total quality of life, now and in the future, can be increased. Or more simply, ecologically sustainable development is development which meets the needs of today, while conserving ecosystems for the benefit of future generations.
Sustainability can mean different things in different circumstances and has been used to describe something that is one or more of: financially viable, environmentally friendly, culturally sensitive, takes a long-term view, or can be continued indefinitely. Sustainability can also be used to refer to local, state and national issues.
While the definition of sustainability has been reviewed and revised and is expressed in different ways, the concept of sustainability has three key components:
• Recognition of the interdependence of social, economic and environmental well-being;
• A focus on equity and fairness, and the need to take into account the effect of one’s actions on others in an interdependent world; and
• Recognition that meeting the needs of today must not be at the expense of future generations being able to meet their needs.
For the purposes of this guideline, and with specific reference to site remediation works, sustainability refers to the practice of demonstrating, in terms of environmental, economic and social indicators, that an acceptable balance exists between the impacts of undertaking remediation activities and the benefits that those activities will deliver.
CRC CARE National Remediation Framework Guideline on performing cost-benefit and sustainability analysis of remediation options
Information correct at time of publication 8 Version 0.1: August 2018
What is sustainability analysis?
Sustainability analysis is the investigation of the short-term and long-term economic, environmental and social impacts of the proposed remedial options. As such, sustainability analysis can incorporate impacts to environmental, cultural heritage, and historical resources as well as societal goals. It assists decision making and strategic planning throughout the project and program lifecycle.
Sustainability analysis has two main functions:
• A systematic assessment instrument for developing integrated policies which take full account of economic, environmental and social dimensions and which include cross-cutting, intangible and short-term and long-term considerations; and
• A process for assessing the likely economic, environmental and social impacts of projects, programs and policies before they have been implemented.
For the purposes of this guideline, sustainability analysis is an integrated assessment of the environmental, economic, and social impacts of remedial activities to assist in understanding the extent to which they meet the needs of the present without compromising the ability of future generations to meet their own needs.
With respect to site remediation work this includes:
• Allowing decision-making processes to effectively integrate both long- and short-term economic, environmental, community and inter- and intra-generational equity considerations;
• Planning for the future through long-term contaminated sites management strategies and policies;
• Recognising and considering the global dimension of environmental impacts of actions and policies;
• Acknowledging the need to develop a strong, growing and diversified economy which can enhance the capacity for environmental protection;
• Acknowledging the need to maintain and enhance international competitiveness in an environmentally sound manner; and
• Adopting cost-effective and flexible policy instruments such as improved valuation, pricing and incentive mechanisms ensuring that decisions and actions provide for broad community involvement on issues which affect them.
There are many approaches to sustainability analysis, and from these many approaches, this guideline advocates using an MCA framework as a tool for sustainability analysis. MCA enables a structured and robust approach to assessing the likely economic, environmental and social impacts of projects and is therefore well suited. This approach is consistent with those adopted by a range of professional associations, including Engineers Australia and the International Association for Impact Assessment. An introduction to MCA is outlined below.
Multi-criteria analysis (MCA)
MCA can be used to describe a structured approach to determine overall preferences among alternative options, where the options accomplish several objectives. It provides a robust, transparent and repeatable decision-making structure, making explicit the key
CRC CARE National Remediation Framework Guideline on performing cost-benefit and sustainability analysis of remediation options
Information correct at time of publication 9 Version 0.1: August 2018
considerations and the values attributed to them, and providing opportunities for stakeholder and community participation.
While a CBA enables the analysis and comparison of costs and benefits that can be quantified in monetary terms, in practice it is rarely realistic to value every cost and benefit of options in monetary terms. Relevant data may not be available or may be too expensive to collect. MCA enables a structured and transparent approach for capturing and assessing impacts that cannot be readily monetised. In many instances, those impacts that cannot be readily or reasonably expressed in monetary terms relate to sustainability impacts, and therefore the incorporation of MCA into this guidance provides a robust and repeatable framework for considering sustainability impacts of remediation.
Similar to CBA, MCA can be applied to every level of decision-making, from consideration of broad landuse objectives, to choosing between alternative remedial options. It can be applied equally to small or large, simple or complex, short-term or long-term projects.
MCA is most useful when there is a clear basis for scoring project options against indicators and where this evaluation framework is agreed upon and documented before the analysis has commenced. However, unlike CBA, MCA cannot guide the decision-maker on whether individual projects, programs or policies provide a positive community benefit. Rather, it provides a process for organising and evaluating the impacts that are not included in the CBA to support the decision-maker in making the necessary trade-offs between economic, environmental and social objectives to reach and defend a decision.
There are many techniques for conducting MCA that range in complexity and in their suitability for different types of problems, however the common steps are:
• Structuring the problem;
• Assessing how decisions will be made;
• Identifying the criteria;
• Selecting options; and
• Presenting the results in a transparent way that aids decision making and stakeholder acceptance.
There are a range of MCA methods available and these can vary in their complexity. For the purposes of this guideline, the MCA method adopted is multi-criteria decision analysis (MCDA) with or without swing weights.
This method provides a compromise between being rigorous and repeatable, but simple to implement and justify to stakeholders. If the stakeholders are seeking to undertake a highly specialised MCA then it is recommended that an experienced economist should be engaged.
CB&SA – integrating cost benefit and sustainability analysis CB&SA involves the integration of results of the CBA with the results of the MCA, to produce a combined cost-benefit and sustainability analysis. This enables a robust consideration of the relevant economic and sustainability impacts of the various options.
CRC CARE National Remediation Framework Guideline on performing cost-benefit and sustainability analysis of remediation options
Information correct at time of publication 10 Version 0.1: August 2018
While the CB&SA methodology will report both the CBA and MCA results for each option, this guideline advocates incorporating the results of the CBA into the MCA, to produce a single result for each option. The approach and methodology for incorporating the CBA results into the MCA, in addition to further information and guidance on conducting and interpreting the results of the CB&SA, are outlined in Section 5.
The key benefits and strengths of undertaking an integrated CB&SA include:
• Enables consideration of impacts or issues that a traditional CBA cannot sufficiently measure;
• Handles complex decision-making processes where major impacts and considerations cannot be readily or reliably monetised;
• Supports sustainability principles by determining the value of the proposal to the community, environment or the next generation;
• Applicable at every stage of the decision-making process;
• Provides a quantitative measure of the benefits of an investment, allowing direct comparisons between dissimilar projects;
• Presents results provided by the CBA or MCA in a transparent and repeatable fashion to facilitate meaningful, transparent and robust comparisons between competing options;
• Encourages clear thinking about the estimated worth of a proposal relative to what would happen in the absence of a proposal (i.e. no change to current site conditions);
• Helps to undertake legislative and regulatory requirements; and
• Enables an iterative assessment over the whole decision-making life cycle.
Steps in undertaking a CB&SA The CB&SA process remains the same, whether the project is large or small. However, the process can be scaled by tailoring the veracity of the data collected, and the importance placed on each step, to suit the project requirements.
The key steps can be summarised as follows:
10. Define the problem and objective, and engage with decision makers: Define the problem, project objectives (both of the remediation and the CB&SA), and the intended project outcomes. Engage with decision makers to align on the problem and objectives;
11. Review remedial and site use options: Review the remedial and site use options identified from the previous stages of work at the site, possibly including the human health or ecological risk assessment and site investigation(s);
12. Identify and engage key stakeholders: Identify key stakeholders, develop an appropriate engagement plan and engage with stakeholders;
13. Identify assessment indicators: In conjunction with the decision maker and possibly the other stakeholders, identify the most relevant assessment indicators
CRC CARE National Remediation Framework Guideline on performing cost-benefit and sustainability analysis of remediation options
Information correct at time of publication 11 Version 0.1: August 2018
(for example, cost, practicability, effectiveness, environmental impacts, social impacts) to evaluate, and group them into ‘threshold’ and ‘performance’ indicators;
14. Preliminary review of options: Conduct a qualitative review of each option against the threshold indicators. Only options that satisfy all of the threshold indicators are moved forward for more detailed analysis. Options that do not satisfy all of the threshold indicators may be discarded at this step. However before discarding an option it may be worth confirming that the threshold indicators are consistent with the project objectives and desired outcomes, and explore if a small modification to the option might enable it to satisfy all of the threshold indicators;
15. Data collection and analysis: Assess the available data and information related to each of the indicators, identify where gaps exist and determine assessment method for each indicator. Obtain the information and data appropriate for each indicator and the particular assessment method selected, and apply assessment methods to measure relevant indicators for each option;
16. Conduct a CBA: Undertake a CBA for the indicators that are able to be monetised for each option. If every indicator has been monetised, a preferred option may be able to be identified on the basis of a standalone CBA. Similarly if none of the indicators have been monetised, this step may not be required;
17. Conduct an MCA and identify preferred option: Conduct an MCA, including incorporating the results from the CBA, and rank options on the basis of achieving the desired balance of cost-benefit and sustainability outcomes to identify the preferred option;
18. Present and communicate results to decision-makers: Summarise the results for communication and presentation to decision-makers.
Each of the above steps are covered in greater detail within subsequent sections of this guideline.
Limitations to CB&SA, and how this guidance address them There are a range of identified limitations relating to economic and sustainability evaluations. The main limitations are described below, in addition to how the CB&SA addresses these limitations.
False accuracy
Expressing costs and benefits in dollar terms can sometimes give a false sense of accuracy to the measurement of these impacts. This is particularly relevant to this guideline, where practitioners may not be experienced in the nuances of economic rationale and communication.
To address this, the CB&SA methodology provides guidance on what indicators can and cannot be quantified and monetised reliably, within the resources and time available to the study. Further, indicators that cannot not be reasonably quantified or valued in dollars terms should then be listed and described if relevant and/or included in an MCA.
CRC CARE National Remediation Framework Guideline on performing cost-benefit and sustainability analysis of remediation options
Information correct at time of publication 12 Version 0.1: August 2018
While it is necessary to avoid imparting a false accuracy to the estimates, this guideline encourage indicators to be quantified as much as they reasonably can given budget and time constraints.
Optimism bias
CB&SA can be susceptible to the problem of bias (typically optimism bias) where small changes or omissions to underlying critical assumptions and values can lead to a proposal showing a significant positive community benefit when it otherwise would not.
To address this the CB&SA framework encourages the use of a variety of methods to “test” the underlying assumptions for each variable. These include:
• Sensitivity analysis, where each indicator can be varied to their pessimistic values to uncover over-optimism that may underpin the analysis;
• Use of ‘low’ and ‘high’ discount rates to test how sensitive the outcome of the analysis is to changes in such variations; and
• Clear statements of assumptions in the analysis, and the justification for those assumptions. Where relevant, independent and expert assessments should be obtained in order to develop and justify estimates.
Impacts that are difficult or costly to monetise
As recognised in Section 2 above, some impacts can be difficult or impossible to monetise, and therefore may not be included within a standard CBA (without consideration of sustainability).
To address this the CB&SA framework adopts three key elements:
• Identifying and quantifying the most significant impacts associated with each option, regardless of their capacity to be monetised;
• Giving equal consideration to costs and benefits that may have been identified as significant, but that are not readily quantified in monetary units;
• Using an integrated MCA to facilitate analysis of options with indicators that are monetised, quantified but not monetised, and/or qualitative.
Distributional and equity impacts
A standard CBA often lacks accounting for distributional and equity impacts, or the impacts on future generations.
Addressing these impacts is a key component of the sustainability analysis. This is addressed within this guideline by putting a focus on identifying these impacts, testing results with a low discount rate that places added emphasis on the needs of future generations, and then incorporating them within the analysis by integrating the CBA with MCA.
Risk and uncertainty
An extension of the false accuracy limitation discussed above is that there are limits to the extent that future costs and benefits can be predicted or monetised.
In the context of this guideline, risk and uncertainty relates to the impact of variability on cost estimates, parameters, forecasts, assumptions, and sustainability indicator scores. The variance of a parameter describes how the parameter estimate would vary
CRC CARE National Remediation Framework Guideline on performing cost-benefit and sustainability analysis of remediation options
Information correct at time of publication 13 Version 0.1: August 2018
across repeated sampling, that is, how uncertain that particular parameter is. If this variance is present but not understood or quantified in some way, this can present a risk to the CB&SA outcome, as it becomes a “hidden” influence.
It is therefore important to consider the potential variation surrounding indicator estimates. To address this issue, this guideline encourages the use of well-established economic techniques for assessing uncertainty and the subsequent risk, and in presenting these outcomes along with the CB&SA result.
Finally, “risk” can refer to the potential loss resulting from a hazard associated with implementation of one of the options. For example, risk could be considered in terms of the health and safety risks relating to the activities involved in the remedial option, risk to organisational reputation from poorly remediating a site, and environmental risk associated with a remedial option detrimentally impacting local groundwater or ecosystems. In these cases, risk would be assessed directly as a performance indicator as part of the CB&SA, rather than a part of uncertainty analysis.
Application within the contaminated sites sector As described in Section 1.2.1, it is currently common practice within the Australian contaminated sites industry to include a simple qualitative economic analysis within an ROA. This often takes the form of a table, showing the remedial options against a range of indicators such as cost, time to completion or regulator acceptance. Each of the options is then given a qualitative score (i.e. high, medium low), and the option with the highest qualitative score is determined to be the best alternative. This type of table is analogous to the consequence table described in Section 5.
This guideline provides the tools for contaminated sites practitioners to go beyond that subjective, qualitative analysis and undertake the more rigorous and transparent process of CB&SA. The guideline has been structured to be applicable at every stage of remediation, and is flexible and scalable, and therefore can be applied to sites with even a modest budget.
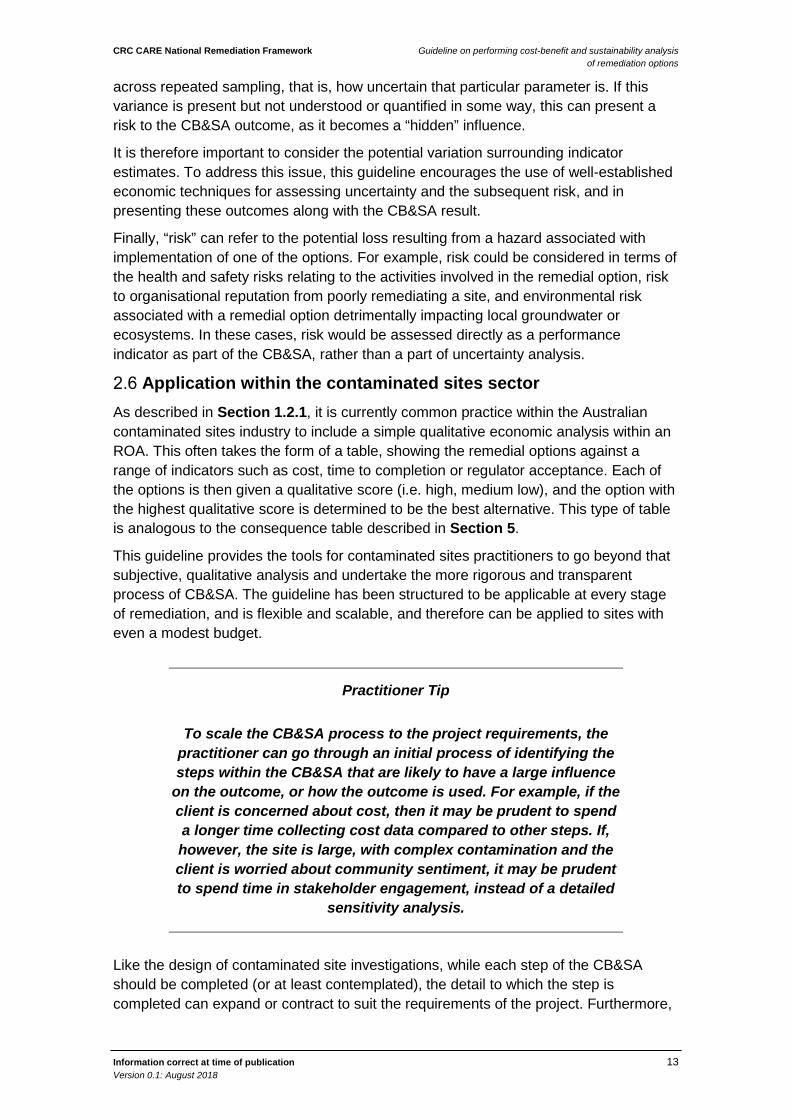
Practitioner Tip
To scale the CB&SA process to the project requirements, the practitioner can go through an initial process of identifying the steps within the CB&SA that are likely to have a large influence
on the outcome, or how the outcome is used. For example, if the client is concerned about cost, then it may be prudent to spend a longer time collecting cost data compared to other steps. If, however, the site is large, with complex contamination and the client is worried about community sentiment, it may be prudent to spend time in stakeholder engagement, instead of a detailed
sensitivity analysis.
Like the design of contaminated site investigations, while each step of the CB&SA should be completed (or at least contemplated), the detail to which the step is completed can expand or contract to suit the requirements of the project. Furthermore,

CRC CARE National Remediation Framework Guideline on performing cost-benefit and sustainability analysis of remediation options
Information correct at time of publication 14 Version 0.1: August 2018
the CB&SA can either be reported separately, or integrated into a remedial action plan or remedial options assessment as an appendix.
CRC CARE National Remediation Framework Guideline on performing cost-benefit and sustainability analysis of remediation options
Information correct at time of publication 15 Version 0.1: August 2018
3. Steps 1-6: CB&SA initial setup
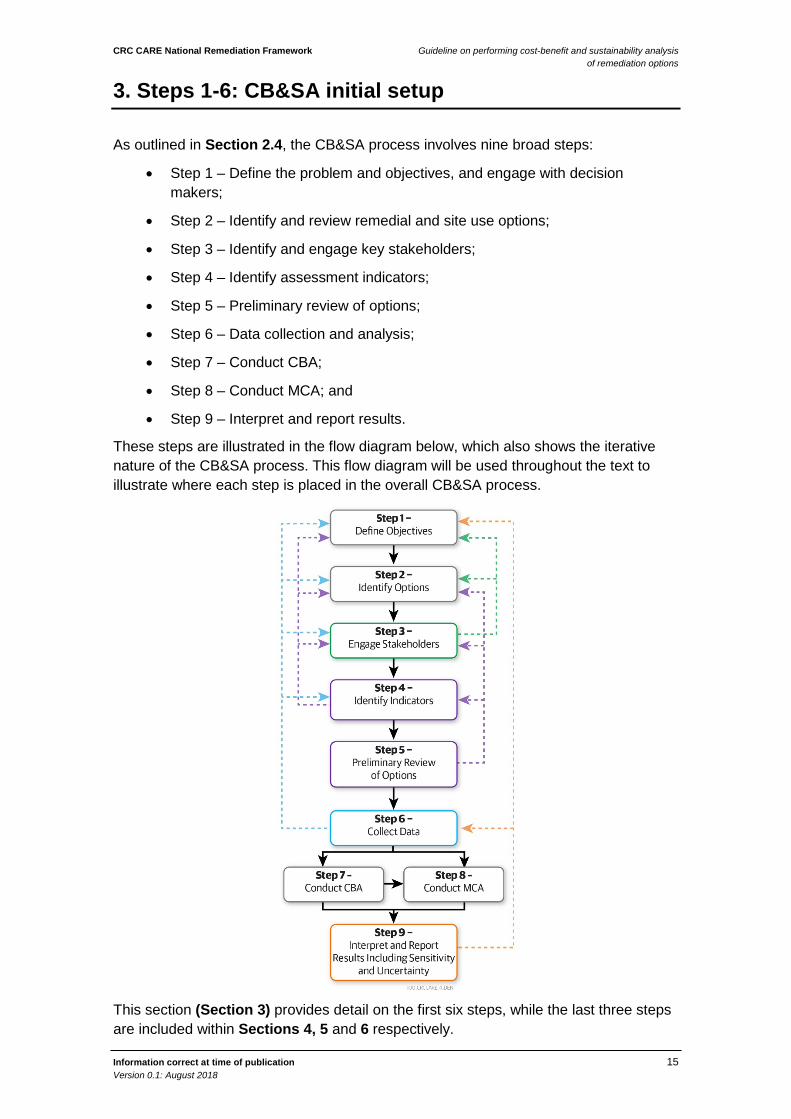
As outlined in Section 2.4, the CB&SA process involves nine broad steps:
• Step 1 – Define the problem and objectives, and engage with decision makers;
• Step 2 – Identify and review remedial and site use options;
• Step 3 – Identify and engage key stakeholders;
• Step 4 – Identify assessment indicators;
• Step 5 – Preliminary review of options;
• Step 6 – Data collection and analysis;
• Step 7 – Conduct CBA;
• Step 8 – Conduct MCA; and
• Step 9 – Interpret and report results.
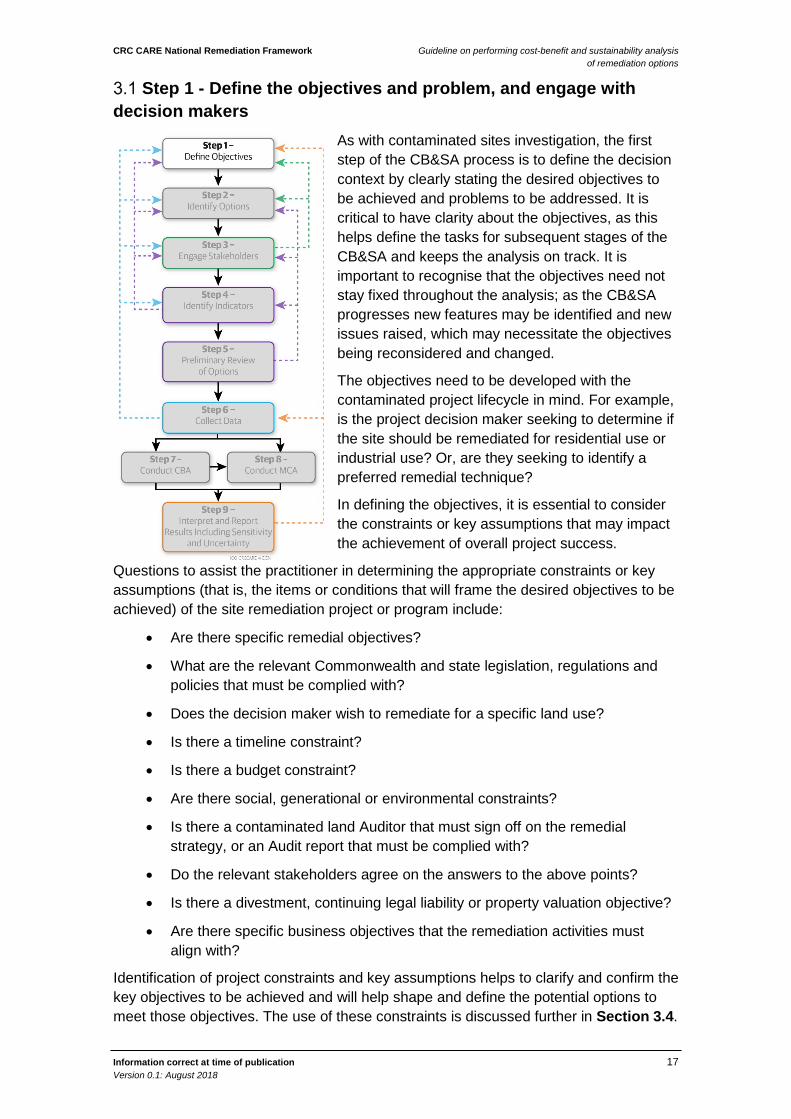
These steps are illustrated in the flow diagram below, which also shows the iterative nature of the CB&SA process. This flow diagram will be used throughout the text to illustrate where each step is placed in the overall CB&SA process.
This section (Section 3) provides detail on the first six steps, while the last three steps are included within Sections 4, 5 and 6 respectively.
CRC CARE National Remediation Framework Guideline on performing cost-benefit and sustainability analysis of remediation options
Information correct at time of publication 16 Version 0.1: August 2018
As outlined in Section 2, a CB&SA is a scalable and flexible process that can be used for small or large, simple or complex, short-term or long-term projects or programs. The CB&SA can be applied at various stages of the decision-making process and undertaken at varying levels of detail and rigour. The level of detail and rigour required will be determined by the practitioner based on the considerations of a range of factors, including:
• The size and complexity of the project,
• Available budget,
• Information requirements,
• Time constraints,
• The extent to which risk and uncertainty may affect the selection of a preferred option.
As described in Section 2.6, the CB&SA allows for different levels of effort and it will be at the practitioners’ discretion to determine the level of effort that is appropriate and proportionate within the broader decision context.
Within Section 3, 4 and 5, the practitioner will encounter example boxes and practitioner tips embedded within the text. These are designed to provide isolated examples for context and highlight important points. In addition, each step has a summary of the expected outcomes, so the practitioner can track their progress through the process. These expected outcomes are summarised in a checklist format within Appendix A.
CRC CARE National Remediation Framework Guideline on performing cost-benefit and sustainability analysis of remediation options
Information correct at time of publication 17 Version 0.1: August 2018
Step 1 - Define the objectives and problem, and engage with decision makers
As with contaminated sites investigation, the first step of the CB&SA process is to define the decision context by clearly stating the desired objectives to be achieved and problems to be addressed. It is critical to have clarity about the objectives, as this helps define the tasks for subsequent stages of the CB&SA and keeps the analysis on track. It is important to recognise that the objectives need not stay fixed throughout the analysis; as the CB&SA progresses new features may be identified and new issues raised, which may necessitate the objectives being reconsidered and changed.
The objectives need to be developed with the contaminated project lifecycle in mind. For example, is the project decision maker seeking to determine if the site should be remediated for residential use or industrial use? Or, are they seeking to identify a preferred remedial technique?
In defining the objectives, it is essential to consider the constraints or key assumptions that may impact the achievement of overall project success.
Questions to assist the practitioner in determining the appropriate constraints or key assumptions (that is, the items or conditions that will frame the desired objectives to be achieved) of the site remediation project or program include:
• Are there specific remedial objectives?
• What are the relevant Commonwealth and state legislation, regulations and policies that must be complied with?
• Does the decision maker wish to remediate for a specific land use?
• Is there a timeline constraint?
• Is there a budget constraint?
• Are there social, generational or environmental constraints?
• Is there a contaminated land Auditor that must sign off on the remedial strategy, or an Audit report that must be complied with?
• Do the relevant stakeholders agree on the answers to the above points?
• Is there a divestment, continuing legal liability or property valuation objective?
• Are there specific business objectives that the remediation activities must align with?
Identification of project constraints and key assumptions helps to clarify and confirm the key objectives to be achieved and will help shape and define the potential options to meet those objectives. The use of these constraints is discussed further in Section 3.4.
CRC CARE National Remediation Framework Guideline on performing cost-benefit and sustainability analysis of remediation options
Information correct at time of publication 18 Version 0.1: August 2018
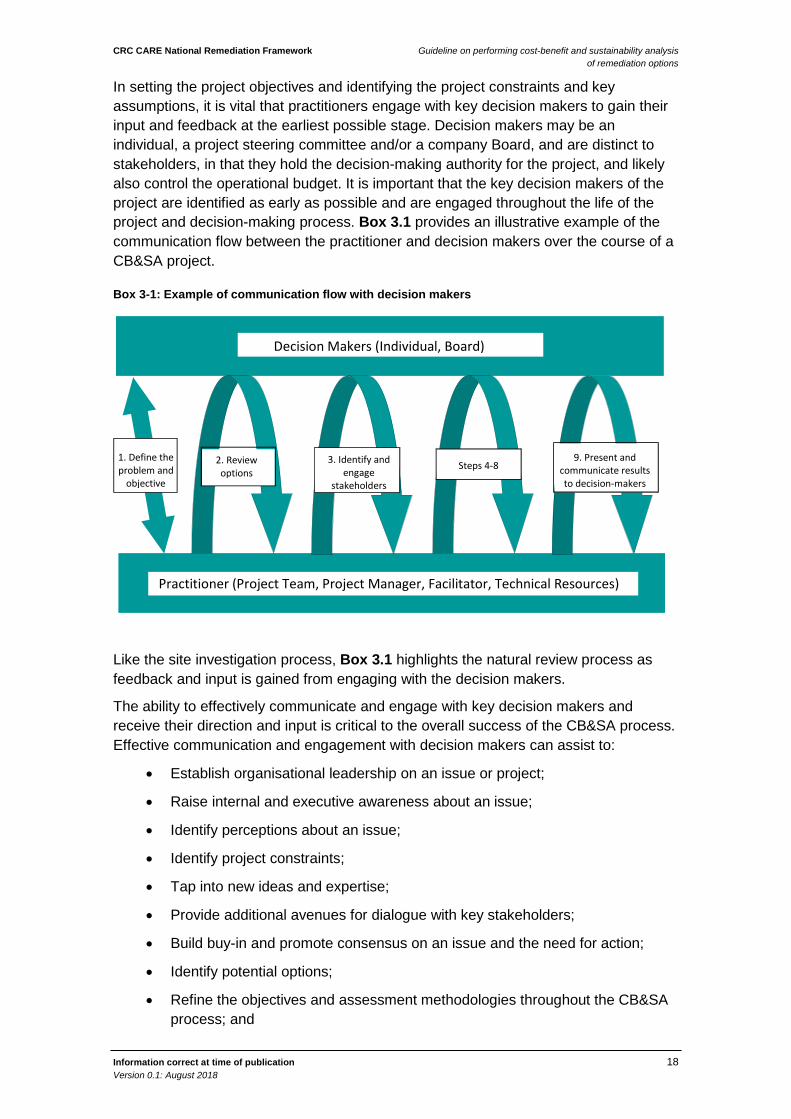
In setting the project objectives and identifying the project constraints and key assumptions, it is vital that practitioners engage with key decision makers to gain their input and feedback at the earliest possible stage. Decision makers may be an individual, a project steering committee and/or a company Board, and are distinct to stakeholders, in that they hold the decision-making authority for the project, and likely also control the operational budget. It is important that the key decision makers of the project are identified as early as possible and are engaged throughout the life of the project and decision-making process. Box 3.1 provides an illustrative example of the communication flow between the practitioner and decision makers over the course of a CB&SA project.
Like the site investigation process, Box 3.1 highlights the natural review process as feedback and input is gained from engaging with the decision makers.
The ability to effectively communicate and engage with key decision makers and receive their direction and input is critical to the overall success of the CB&SA process. Effective communication and engagement with decision makers can assist to:
• Establish organisational leadership on an issue or project;
• Raise internal and executive awareness about an issue;
• Identify perceptions about an issue;
• Identify project constraints;
• Tap into new ideas and expertise;
• Provide additional avenues for dialogue with key stakeholders;
• Build buy-in and promote consensus on an issue and the need for action;
• Identify potential options;
• Refine the objectives and assessment methodologies throughout the CB&SA process; and
Box 3-1: Example of communication flow with decision makers
1. Define the problem and
objective
Practitioner (Project Team, Project Manager, Facilitator, Technical Resources)
2. Review options
Decision Makers (Individual, Board)
3. Identify and engage
stakeholders Steps 4-8 9. Present and
communicate results to decision-makers

CRC CARE National Remediation Framework Guideline on performing cost-benefit and sustainability analysis of remediation options
Information correct at time of publication 19 Version 0.1: August 2018
• Provide feedback/evaluation throughout the CB&SA process.
Engaging with decision makers to develop a decision approach will likely involve the following considerations:
• Understanding the motivation for the proponent or organisation to be undertaking this remediation project now;
• Developing a project purpose statement (clarify project boundaries, end result, timing, audience for end product);
• Determining how success will be defined;
• Clarifying roles and responsibilities, including identifying who will ultimately make the decision and who are the stakeholders that will influence the decision;
• Developing a process for engaging with decision makers and stakeholders (how?, when?, where? In what format?) including determining when decision-maker sign-off is required during various steps of the CB&SA process;
• Documenting external influences, resources, or constraints that may impact the project’s success;
• Clarifying funding and resource availability; and
• Identifying time constraints, including deadlines for decisions, regulatory requirements, legislative deadlines, and stakeholder expectations.
After clarifying the issues above, the practitioner should engage decision makers over the course of the CB&SA to accomplish the following:
• Anticipate issues and potential for controversy;
• Create an environment where the stakeholders understand who has decision making authority, and where decision makers understand that involving stakeholders does not sign away this authority;
• Receive decision maker sign-off at agreed-upon steps of the CB&SA process; and
• Document the CB&SA process to the satisfaction of the stakeholders and decision makers, such that the outcome can aid the decision-making in a clear, robust, transparent and repeatable manner.
Sometimes decision makers will engage external advisors regarding inputs to the CB&SA (i.e. legal advisors, strategic property consultants, financiers). In those circumstances it can be useful for the practitioner to also engage with the advisors, to explain the process and promote information sharing. In this way each professional will make decisions and give advice based on the most recent and complete facts.
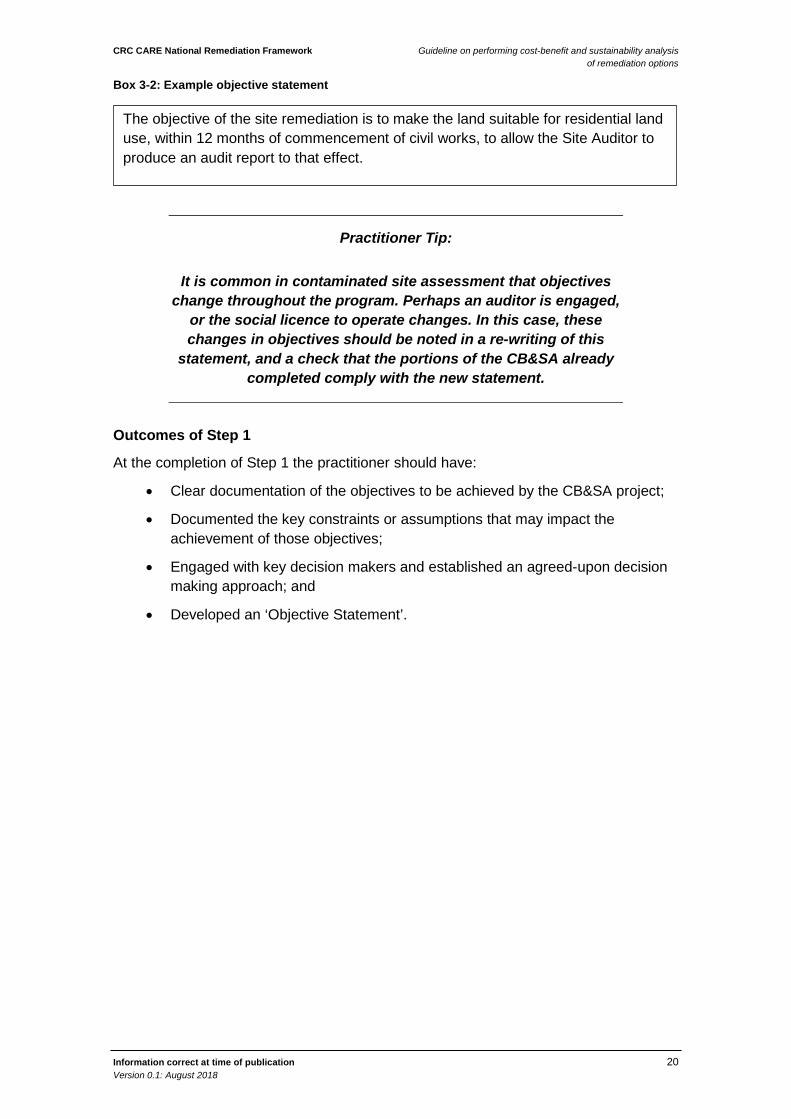
Following identification of project constraints and key assumptions, an “Objective Statement” should be formulated. This combines the answers to the constraints questions into a statement that each option can be “tested” against. Box 3.2 provides an example of an objective statement.
CRC CARE National Remediation Framework Guideline on performing cost-benefit and sustainability analysis of remediation options
Information correct at time of publication 20 Version 0.1: August 2018
Box 3-2: Example objective statement
Practitioner Tip:
It is common in contaminated site assessment that objectives change throughout the program. Perhaps an auditor is engaged,
or the social licence to operate changes. In this case, these changes in objectives should be noted in a re-writing of this
statement, and a check that the portions of the CB&SA already completed comply with the new statement.
Outcomes of Step 1
At the completion of Step 1 the practitioner should have:
• Clear documentation of the objectives to be achieved by the CB&SA project;
• Documented the key constraints or assumptions that may impact the achievement of those objectives;
• Engaged with key decision makers and established an agreed-upon decision making approach; and
• Developed an ‘Objective Statement’.
The objective of the site remediation is to make the land suitable for residential land use, within 12 months of commencement of civil works, to allow the Site Auditor to produce an audit report to that effect.
CRC CARE National Remediation Framework Guideline on performing cost-benefit and sustainability analysis of remediation options
Information correct at time of publication 21 Version 0.1: August 2018
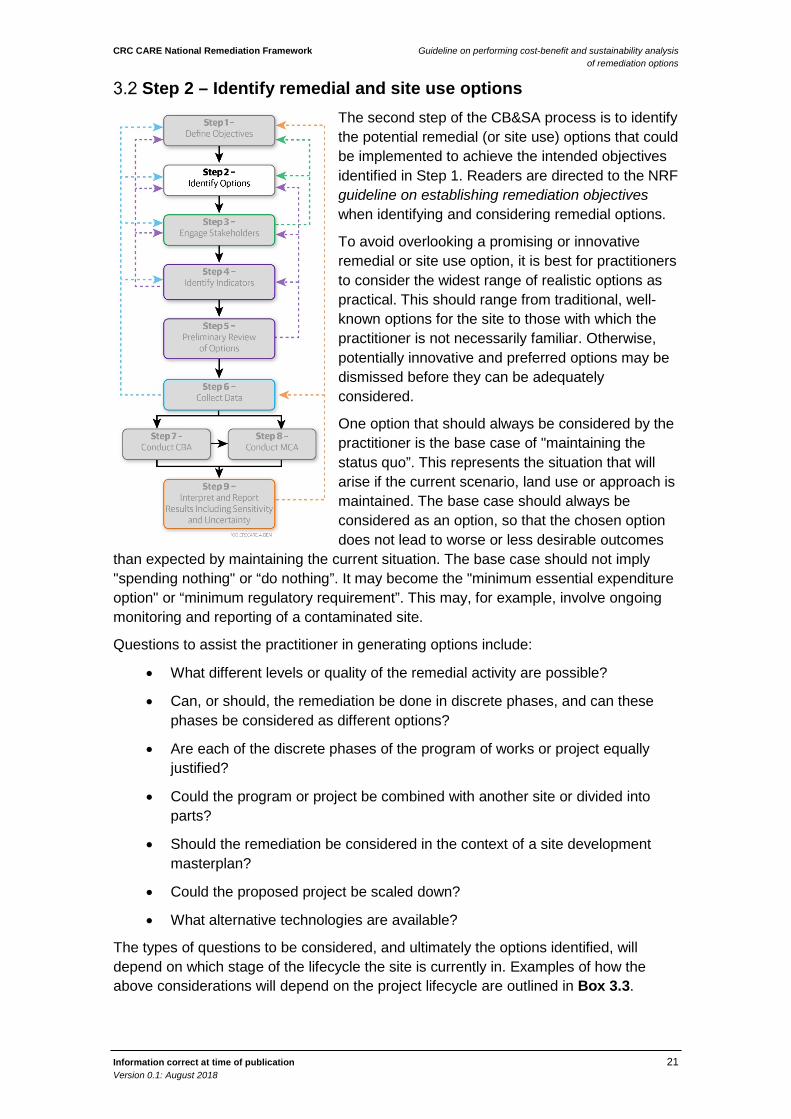
Step 2 – Identify remedial and site use options The second step of the CB&SA process is to identify the potential remedial (or site use) options that could be implemented to achieve the intended objectives identified in Step 1. Readers are directed to the NRF guideline on establishing remediation objectives when identifying and considering remedial options.
To avoid overlooking a promising or innovative remedial or site use option, it is best for practitioners to consider the widest range of realistic options as practical. This should range from traditional, well-known options for the site to those with which the practitioner is not necessarily familiar. Otherwise, potentially innovative and preferred options may be dismissed before they can be adequately considered.
One option that should always be considered by the practitioner is the base case of "maintaining the status quo”. This represents the situation that will arise if the current scenario, land use or approach is maintained. The base case should always be considered as an option, so that the chosen option does not lead to worse or less desirable outcomes
than expected by maintaining the current situation. The base case should not imply "spending nothing" or “do nothing”. It may become the "minimum essential expenditure option" or “minimum regulatory requirement”. This may, for example, involve ongoing monitoring and reporting of a contaminated site.
Questions to assist the practitioner in generating options include:
• What different levels or quality of the remedial activity are possible?
• Can, or should, the remediation be done in discrete phases, and can these phases be considered as different options?
• Are each of the discrete phases of the program of works or project equally justified?
• Could the program or project be combined with another site or divided into parts?
• Should the remediation be considered in the context of a site development masterplan?
• Could the proposed project be scaled down?
• What alternative technologies are available?
The types of questions to be considered, and ultimately the options identified, will depend on which stage of the lifecycle the site is currently in. Examples of how the above considerations will depend on the project lifecycle are outlined in Box 3.3.
CRC CARE National Remediation Framework Guideline on performing cost-benefit and sustainability analysis of remediation options
Information correct at time of publication 22 Version 0.1: August 2018
Box 3-3: Examples of how options will depend on the project lifecycle
In each case, the practitioner should be open to the possibility of modifying or adding to the options as the CB&SA progresses. As new information becomes available through the CB&SA process, options that were not previously thought of may present themselves. If new options are identified naturally through the CB&SA, practitioners should revisit previously completed steps to allow the new options to be assessed appropriately.
As outlined in Step 1 (Section 3.1), and illustrated in Box 3.1, the practitioner should engage with decision makers during the identification and review of project options. Their input and advice may lead to the identification of additional options, and the removal of others.
Overall, Step 2 may lead to many possible options being identified, more so than it is practical to submit to detailed CB&SA. The preliminary review and shortlisting of these options is addressed in Section 3.5.
Outcomes of Step 2
At the completion of Step 2 the practitioner should have:
• Successfully identified the possible options that may achieve the desired objectives identified in Step 1; and
• Discussed the list of options with the decision-makers and agreed upon a list to take forward.
If the objective of the CB&SA is to identify a preferred mix of residential and commercial land use while maximising the social and environmental amenity of the site, options to be considered will focus on the proportion of residential to commercial development, or the layout of a masterplan. Options may include 100% residential land use or 70% residential, 20% commercial and 10% open space, and other combinations. Options may also include consideration of a mix of low, medium and high-density developments.
However, if the land use has already been established and the objective of the CB&SA is to identify the most sustainable remedial option, then options will likely focus on discreet remedial techniques that would be appropriate for the site in question and will achieve the desired technical outcome.
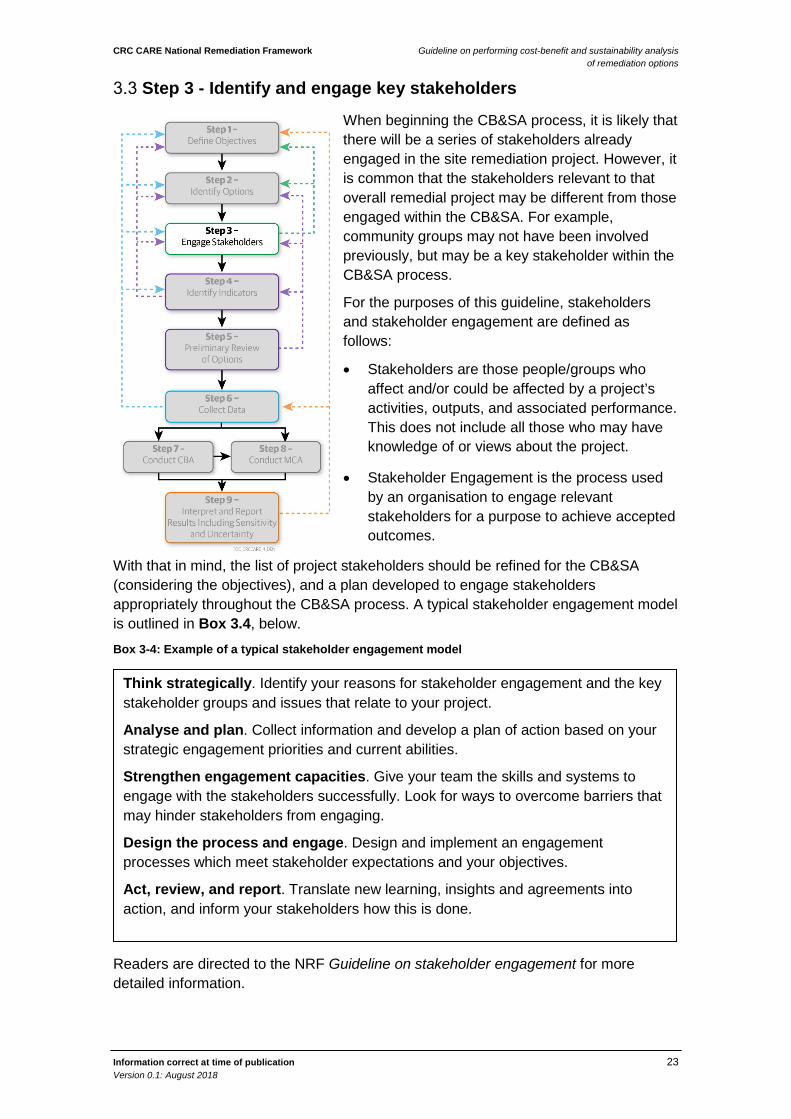
CRC CARE National Remediation Framework Guideline on performing cost-benefit and sustainability analysis of remediation options
Information correct at time of publication 23 Version 0.1: August 2018
Step 3 - Identify and engage key stakeholders
When beginning the CB&SA process, it is likely that there will be a series of stakeholders already engaged in the site remediation project. However, it is common that the stakeholders relevant to that overall remedial project may be different from those engaged within the CB&SA. For example, community groups may not have been involved previously, but may be a key stakeholder within the CB&SA process.
For the purposes of this guideline, stakeholders and stakeholder engagement are defined as follows:
• Stakeholders are those people/groups who affect and/or could be affected by a project’s activities, outputs, and associated performance. This does not include all those who may have knowledge of or views about the project.
• Stakeholder Engagement is the process used by an organisation to engage relevant stakeholders for a purpose to achieve accepted outcomes.
With that in mind, the list of project stakeholders should be refined for the CB&SA (considering the objectives), and a plan developed to engage stakeholders appropriately throughout the CB&SA process. A typical stakeholder engagement model is outlined in Box 3.4, below.
Box 3-4: Example of a typical stakeholder engagement model
Readers are directed to the NRF Guideline on stakeholder engagement for more detailed information.
Think strategically. Identify your reasons for stakeholder engagement and the key stakeholder groups and issues that relate to your project.
Analyse and plan. Collect information and develop a plan of action based on your strategic engagement priorities and current abilities.
Strengthen engagement capacities. Give your team the skills and systems to engage with the stakeholders successfully. Look for ways to overcome barriers that may hinder stakeholders from engaging.
Design the process and engage. Design and implement an engagement processes which meet stakeholder expectations and your objectives.
Act, review, and report. Translate new learning, insights and agreements into action, and inform your stakeholders how this is done.
CRC CARE National Remediation Framework Guideline on performing cost-benefit and sustainability analysis of remediation options
Information correct at time of publication 24 Version 0.1: August 2018
Practitioner Tip
Stakeholder engagement is not necessarily involved or complex. On small or simple sites, stakeholder engagement may take the form of a phone call or meeting with the client to ‘flesh out’ the
key drivers for the project. Or, for larger projects it could involve a short presentation on the contamination issues, followed by a
guided discussion with a number of parties, right up to externally-facilitated conferences (for large or complex sites).
Stakeholder identification process
The stakeholder identification process, specific to the CB&SA, should have the following components:
• Document the history and status of stakeholder engagement on the project. This need not be an exhaustive task, but should include interviewing key staff to obtain information related to the following:
- A policy, strategy, or statement by the company or agency leading the remediation project;
- A list of key stakeholders;
- The role of each stakeholder to date; and
- Documents that describe the stakeholder engagement process to date.
• Conduct a brainstorming exercise to identify and analyse key stakeholders specifically for the CB&SA process. This can be as simple as getting the project team members together to brainstorm the names of people and organisations that may influence or be influenced by site activities. The practitioner may also want to conduct interviews with representatives from organisations known to have a stake in the project; and
• Once identified, stakeholders should be analysed to assess the extent to which the project may impact them, or they may impact the outcomes of the project.
On more complex and/or contentious projects, more in-depth analysis may be required. This could include developing a greater understanding of the specific issues of importance, recent history, objectives, alliances, available resources, and cultural characteristics of each stakeholder. In addition, it may be appropriate to ask a simple set of questions related to the risks of engagement for each stakeholder, such as:
• What are the risks associated with engagement?
• What are the risks associated with not engaging?
• What are the risks associated with engaging poorly?
Following identification of the various stakeholders, they can be engaged using a stakeholder engagement plan.
CRC CARE National Remediation Framework Guideline on performing cost-benefit and sustainability analysis of remediation options
Information correct at time of publication 25 Version 0.1: August 2018
Stakeholder engagement plan
Implementing a sound stakeholder engagement plan during the CB&SA process has several benefits. These include; encouraging decisions to be made in a transparent manner, promoting trust in the process, and increasing the likelihood of the development of a mutually beneficial, cost effective and sustainable remedial solution.
While the Stakeholder Engagement Guideline (yet to be published) provides detail on the specifics of formulating a stakeholder engagement plan, the key components are:
• Objectives and scope;
• Communication plan;
• Schedule;
• Methods that will be used to engage with stakeholders; and
• Integrating the outcomes stakeholder engagement into the project technical scope
The outcomes of the stakeholder engagement could include such things as:
• Identification of additional project objectives or constraints;
• Identification of additional project options, or amendments to the identified options;
• Elimination of previously considered options;
• Land use priorities not previously considered;
• Inform the identification of indicators; or
• Inform the data collection and analysis.
Depending on the outcomes of the stakeholder engagement, the practitioner may need to revisit Step 1 and Step 2, and also consider the outcomes during Step 4, Step 5 and Step 6, so that the outcomes are adequately integrated into the CB&SA process.
One tool commonly used to facilitate development of an engagement plan is to map each stakeholder into a stakeholder engagement spectrum, an example of which is provided in Appendix B. This will help the practitioner identify communication methods appropriate for each stakeholder, based on the position they hold within the project.
It is recognised that the stakeholder engagement plan can take many forms and should be tailored to the scale and complexity of the project and the relative importance of stakeholder engagement for each project. The plan should be an active document (much like the overall project plan) that should be adjusted at times as conditions evolve throughout implementation of the CB&SA.
Outcomes of Step 3
At the completion of Step 3 the practitioner should have:
• Clearly identified the relevant stakeholders to be engaged as part of the CB&SA, and agreed these stakeholders with the decision makers;
• Mapped the stakeholders into the stakeholder engagement spectrum (or similar) to assess the extent to which the project may impact stakeholders, or

CRC CARE National Remediation Framework Guideline on performing cost-benefit and sustainability analysis of remediation options
Information correct at time of publication 26 Version 0.1: August 2018
the extent to which each stakeholder may impact the success of the project; and
• Developed and implemented a stakeholder engagement plan.
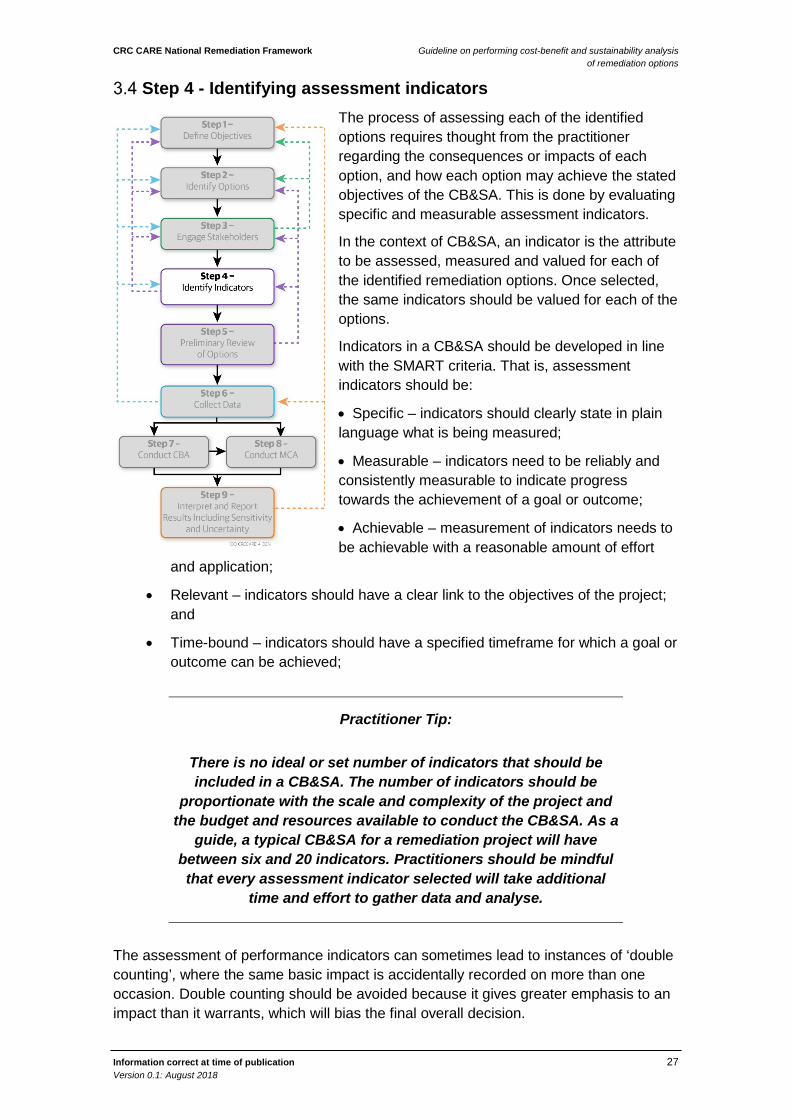
CRC CARE National Remediation Framework Guideline on performing cost-benefit and sustainability analysis of remediation options
Information correct at time of publication 27 Version 0.1: August 2018
Step 4 - Identifying assessment indicators The process of assessing each of the identified options requires thought from the practitioner regarding the consequences or impacts of each option, and how each option may achieve the stated objectives of the CB&SA. This is done by evaluating specific and measurable assessment indicators.
In the context of CB&SA, an indicator is the attribute to be assessed, measured and valued for each of the identified remediation options. Once selected, the same indicators should be valued for each of the options.
Indicators in a CB&SA should be developed in line with the SMART criteria. That is, assessment indicators should be:
• Specific – indicators should clearly state in plain language what is being measured;
• Measurable – indicators need to be reliably and consistently measurable to indicate progress towards the achievement of a goal or outcome;
• Achievable – measurement of indicators needs to be achievable with a reasonable amount of effort
and application;
• Relevant – indicators should have a clear link to the objectives of the project; and
• Time-bound – indicators should have a specified timeframe for which a goal or outcome can be achieved;
Practitioner Tip:
There is no ideal or set number of indicators that should be included in a CB&SA. The number of indicators should be
proportionate with the scale and complexity of the project and the budget and resources available to conduct the CB&SA. As a
guide, a typical CB&SA for a remediation project will have between six and 20 indicators. Practitioners should be mindful that every assessment indicator selected will take additional
time and effort to gather data and analyse.
The assessment of performance indicators can sometimes lead to instances of ‘double counting’, where the same basic impact is accidentally recorded on more than one occasion. Double counting should be avoided because it gives greater emphasis to an impact than it warrants, which will bias the final overall decision.
CRC CARE National Remediation Framework Guideline on performing cost-benefit and sustainability analysis of remediation options
Information correct at time of publication 28 Version 0.1: August 2018
In decision-making literature, a key concept is mutual independence of preferences. In the CB&SA process, the performance of an option on one indicator must be independent of its performance on another indicator.
A simple method for testing against double counting is to check the scores of the two indicators suspected of including double counting against each other. If they are measuring the same impact, then the movement and magnitude of scores will be similar within each option.
If this technique identifies double counting, then the practitioner should either:
• Combine the indicators, or
• Identify a different way to measure one or both indicators.
Box 3.5 provides an example of double counting and changing the indicator measurements accordingly.
Box 3-5: Example of double counting
Types of indicators
The assessment indicators for a CB&SA are one of two broad types:
• Threshold Indicators – these indicators address the minimum requirements that need to be met in order for the remedial or site option to be considered for selection; and
• Performance Indicators – these indicators enable an assessment of the consequences and ability of an option to achieve the desired objectives.
Practitioners should include a range of indicators from both categories to allow for an adequately robust evaluation.
An example of double counting when undertaking a standalone CBA is to include interest payment on capital expenditure. Interest payments are explicitly captured in the process of discounting (as explained in Section 4.3) and should be excluded from the CBA.
Another example of double counting may occur if a practitioner is trying to assess the indicators of ‘site safety’ and ‘local community disruption’.
The practitioner decides to measure site safety as: “the average number of construction workers on site per day over the life of the remediation works” and to measure local community disruption as: “total number of person hours spent on site over the life of the remediation works”.
However, an increase in the first indicator is highly likely to result in an increase in the latter indicator, and vice versa. This means that the indicators are not independent, and therefore that an option that scores well against the safety indicator is likely to score well against the disruption to local community indicator, and vice versa. As such, impacts are being double counted and the analysis will be biased.
In this case the double counting could be avoided by changing the measure of the disruption to the local community to “the total number of truck movements over the life of the remediation works.”
CRC CARE National Remediation Framework Guideline on performing cost-benefit and sustainability analysis of remediation options
Information correct at time of publication 29 Version 0.1: August 2018
Practitioner Tip:
In the site remediation context, and for the purposes of this guideline, threshold indicators are distinguished from
performance indicators. Threshold indicators represent the minimum requirements that must be met for an option to be considered. Options that meet the threshold indicators may
differ in performance but will still meet the fundamental human health or ecological risk objectives of the remediation.
The selection of appropriate indicators is a vital part of integrating sustainability into the selection of remedial options. The definition of sustainability presented in Section 2.2 includes consideration of environmental, economic and social factors. While there are no mandates or rules on how many or which type of indicators to include in a CB&SA assessment, in order for the analysis to adequately incorporate sustainability, at least one indicator from each of the environment, economic and social categories should be chosen. As such, the CB&SA Tool has specific space for indicators in each of these categories.
Appendix C provides examples of common contaminated site indicators with accompanying definitions (both threshold and performance), and the category they fall under. It should be noted that the list of indicators outlined in Appendix C is not exhaustive, and practitioners should consider their own site objectives, from many perspectives, when deciding on indicators.
Threshold indicators
Only options that satisfy the requirements of the identified threshold indicators are progressed to be assessed against performance indicators. For the purposes of a CB&SA, threshold indicators may include items such as:
• Acceptable risk to human health;
• Acceptable risk to ecological receptors;
• Regulatory compliance; or
• Technical effectiveness / feasibility.
Depending on the specific objectives of the project identified in Step 1, and feedback received from decision makers and stakeholders, the practitioner may elect to identify additional threshold indicators. For example, it may be identified that a budget limit has been set by the decision makers. In this instance, the ability to deliver options within a specified budget will be a threshold indicator.
Practitioner Tip:
Assessment of threshold indicators should be performed using binary, or “yes/no” methods, using the practitioners’
professional judgement. As such, further consideration of the assessment of indicators such as human health and ecological
CRC CARE National Remediation Framework Guideline on performing cost-benefit and sustainability analysis of remediation options
Information correct at time of publication 30 Version 0.1: August 2018
risk, and compliance with regulatory requirements, are not covered within this guideline. Should the practitioner require further information on these, they should refer to specific risk assessment documents, including (but not limited to) the ASC
NEPM.
Section 3.5 provides further guidance on assessing the options against the threshold indicators to potentially reduce the number of options carried forward.
Performance indicators
Performance indicators can be broken down further into the following sub-types, which aids both identifying and measuring the various indicators. While not every project will have an indicator from each sub-type, they should all be contemplated for completeness:
• Practicability, for instance:
- Time required for implementation; or
- Ability to secure permits.
• Direct human uses, for instance:
- Heritage value; or
- Site land value.
• Indirect impacts to humans, for instance:
- Drinking water supplies or treatment; or
- Impacts to agriculture
• Ecosystem impacts, for instance:
- Impacts to terrestrial habitat; or
- Impacts to aquatic habitat.
• Environmental burden of applying the option, for instance:
- Greenhouse gas emissions; or
- Landfill space.
• Commercial costs / benefits, for instance:
- Capital construction costs; or
- Long-term management of on-site containment.
• Social impacts, for instance:
- Effects on future generations;
- Immediate effect on the neighbourhood
Practitioner Tip:
CRC CARE National Remediation Framework Guideline on performing cost-benefit and sustainability analysis of remediation options
Information correct at time of publication 31 Version 0.1: August 2018
Decision makers and stakeholders can often provide insight into the indicators that should be included within the CB&SA. In
addition, consulting these groups not only encourages buy-in to the process, but encourages contemplation of the
consequences of the options from a range of perspectives.
Sometimes several options will be marked as “unknown” against the threshold indicators. This indicates that further information is required, and in that case a threshold indicator could be included as a performance indicator also. However, in general threshold indicators are not usually also performance indicators.
Outcomes of Step 4
At the completion of Step 4 the practitioner should have:
• Identified the threshold and performance indicators against which project options will be assessed against;
• Identified at least one indicator from each of the ‘environmental’, ‘social’ and ‘economic’ categories; and
• Considered engaging various stakeholders to assist in formulating the list of indicators.
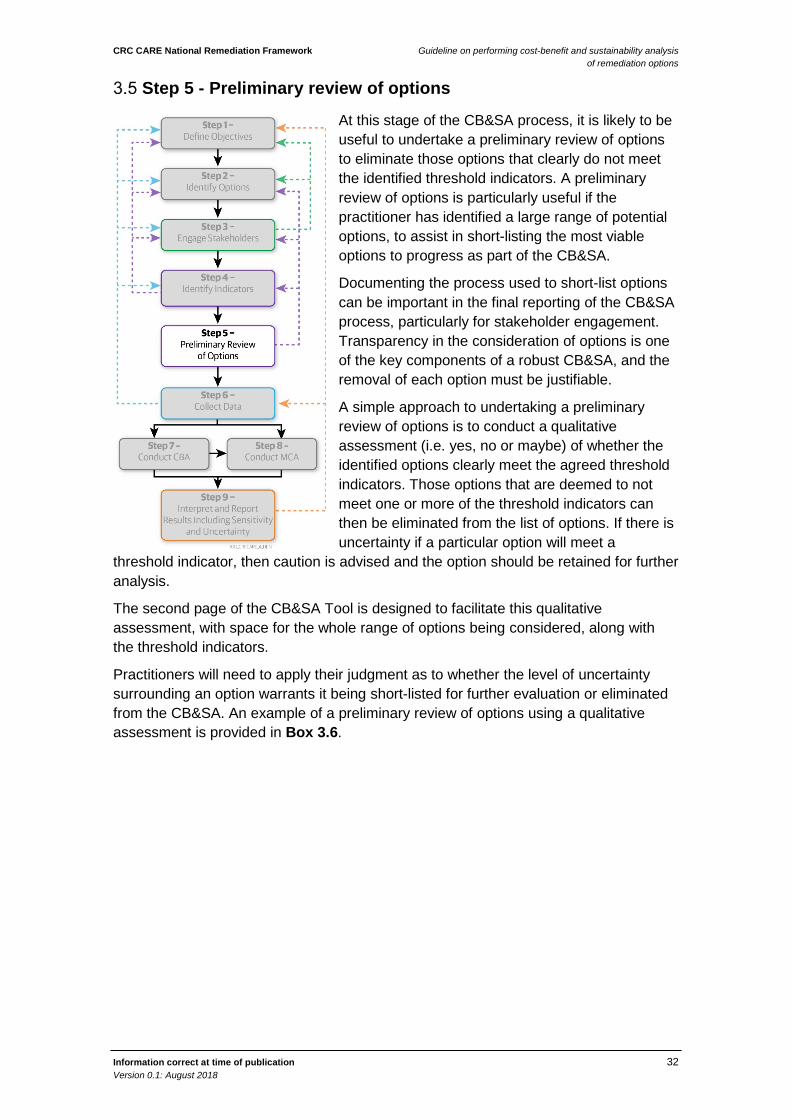
CRC CARE National Remediation Framework Guideline on performing cost-benefit and sustainability analysis of remediation options
Information correct at time of publication 32 Version 0.1: August 2018
Step 5 - Preliminary review of options
At this stage of the CB&SA process, it is likely to be useful to undertake a preliminary review of options to eliminate those options that clearly do not meet the identified threshold indicators. A preliminary review of options is particularly useful if the practitioner has identified a large range of potential options, to assist in short-listing the most viable options to progress as part of the CB&SA.
Documenting the process used to short-list options can be important in the final reporting of the CB&SA process, particularly for stakeholder engagement. Transparency in the consideration of options is one of the key components of a robust CB&SA, and the removal of each option must be justifiable.
A simple approach to undertaking a preliminary review of options is to conduct a qualitative assessment (i.e. yes, no or maybe) of whether the identified options clearly meet the agreed threshold indicators. Those options that are deemed to not meet one or more of the threshold indicators can then be eliminated from the list of options. If there is uncertainty if a particular option will meet a
threshold indicator, then caution is advised and the option should be retained for further analysis.
The second page of the CB&SA Tool is designed to facilitate this qualitative assessment, with space for the whole range of options being considered, along with the threshold indicators.
Practitioners will need to apply their judgment as to whether the level of uncertainty surrounding an option warrants it being short-listed for further evaluation or eliminated from the CB&SA. An example of a preliminary review of options using a qualitative assessment is provided in Box 3.6.
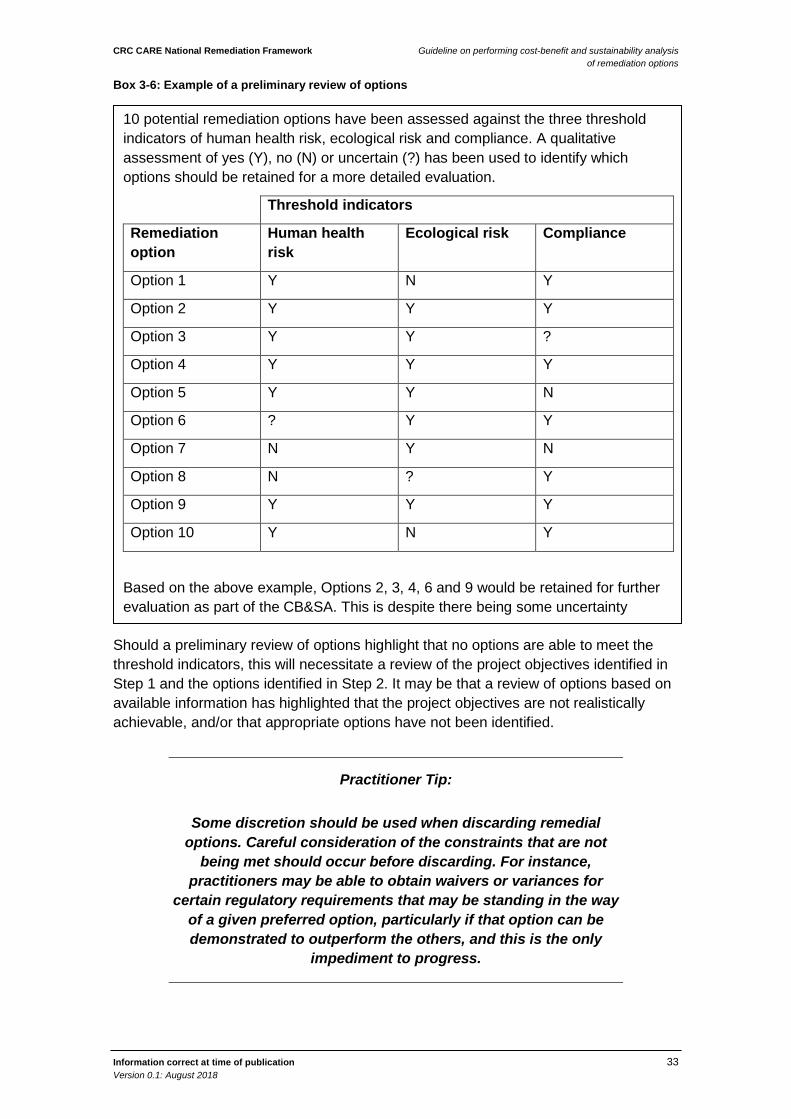
CRC CARE National Remediation Framework Guideline on performing cost-benefit and sustainability analysis of remediation options
Information correct at time of publication 33 Version 0.1: August 2018
Box 3-6: Example of a preliminary review of options
Should a preliminary review of options highlight that no options are able to meet the threshold indicators, this will necessitate a review of the project objectives identified in Step 1 and the options identified in Step 2. It may be that a review of options based on available information has highlighted that the project objectives are not realistically achievable, and/or that appropriate options have not been identified.
Practitioner Tip:
Some discretion should be used when discarding remedial options. Careful consideration of the constraints that are not
being met should occur before discarding. For instance, practitioners may be able to obtain waivers or variances for
certain regulatory requirements that may be standing in the way of a given preferred option, particularly if that option can be demonstrated to outperform the others, and this is the only
impediment to progress.
10 potential remediation options have been assessed against the three threshold indicators of human health risk, ecological risk and compliance. A qualitative assessment of yes (Y), no (N) or uncertain (?) has been used to identify which options should be retained for a more detailed evaluation.
Threshold indicators
Remediation option
Human health risk
Ecological risk Compliance
Option 1 Y N Y
Option 2 Y Y Y
Option 3 Y Y ?
Option 4 Y Y Y
Option 5 Y Y N
Option 6 ? Y Y
Option 7 N Y N
Option 8 N ? Y
Option 9 Y Y Y
Option 10 Y N Y
Based on the above example, Options 2, 3, 4, 6 and 9 would be retained for further evaluation as part of the CB&SA. This is despite there being some uncertainty
CRC CARE National Remediation Framework Guideline on performing cost-benefit and sustainability analysis of remediation options
Information correct at time of publication 34 Version 0.1: August 2018
Similarly, should a preliminary review of options highlight that only one option meets all the threshold indicators, it may not be necessary to continue with a more detailed assessment against the performance indicators. However, the decision to cease the analysis at this stage should be supported by adequate rationale and documentation, including consideration of uncertainties.
Practitioner Tip:
Ceasing the CB&SA process following the preliminary review of options can be a key method for scaling the CB&SA process to
suit the project requirements.
In the circumstances where one option is clearly superior to the others, and the rationale can be documented and agreed to, it is
reasonable to cease the process at this step.
Outcomes of Step 5
At the completion of Step 5 the practitioner should have:
• Compiled a matrix of the options against the threshold indicators;
• Conducted a preliminary review of options, including documenting the rationale for rejecting an option at this stage; and
• Identified a short-list of options that clearly meet the threshold indicators, to be taken forward into the remaining CB&SA steps.
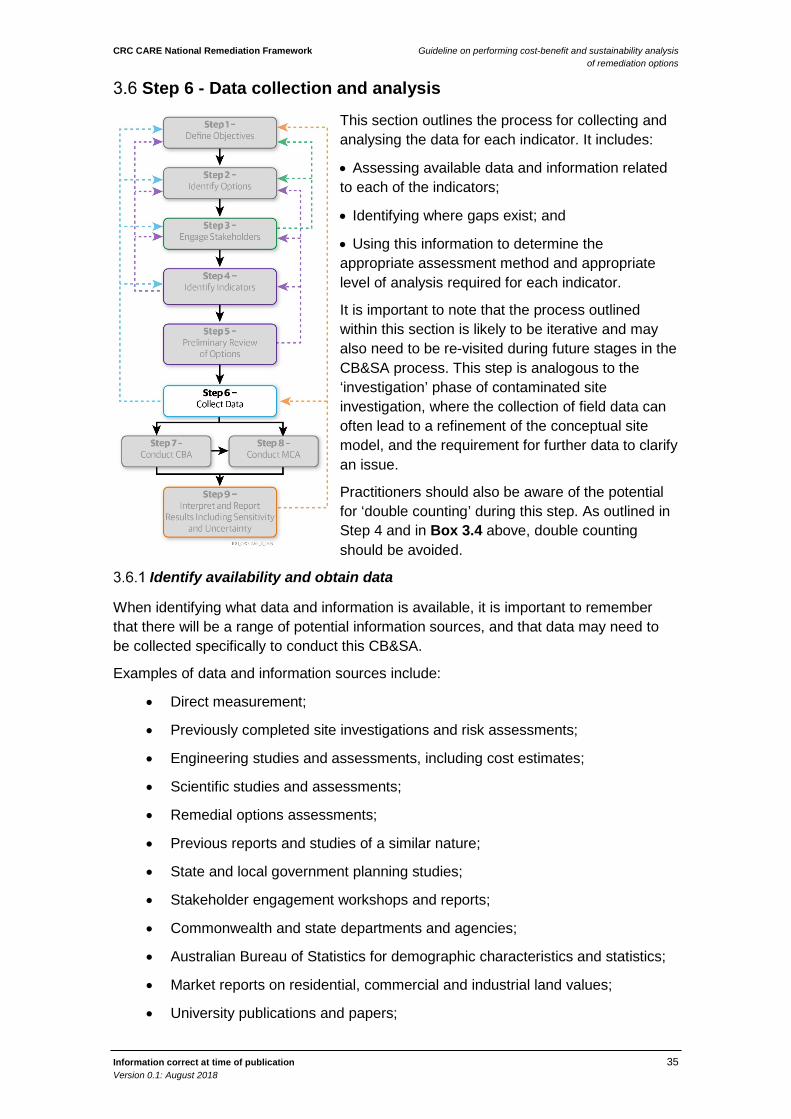
CRC CARE National Remediation Framework Guideline on performing cost-benefit and sustainability analysis of remediation options
Information correct at time of publication 35 Version 0.1: August 2018
Step 6 - Data collection and analysis
This section outlines the process for collecting and analysing the data for each indicator. It includes:
• Assessing available data and information related to each of the indicators;
• Identifying where gaps exist; and
• Using this information to determine the appropriate assessment method and appropriate level of analysis required for each indicator.
It is important to note that the process outlined within this section is likely to be iterative and may also need to be re-visited during future stages in the CB&SA process. This step is analogous to the ‘investigation’ phase of contaminated site investigation, where the collection of field data can often lead to a refinement of the conceptual site model, and the requirement for further data to clarify an issue.
Practitioners should also be aware of the potential for ‘double counting’ during this step. As outlined in Step 4 and in Box 3.4 above, double counting should be avoided.
Identify availability and obtain data
When identifying what data and information is available, it is important to remember that there will be a range of potential information sources, and that data may need to be collected specifically to conduct this CB&SA.
Examples of data and information sources include:
• Direct measurement;
• Previously completed site investigations and risk assessments;
• Engineering studies and assessments, including cost estimates;
• Scientific studies and assessments;
• Remedial options assessments;
• Previous reports and studies of a similar nature;
• State and local government planning studies;
• Stakeholder engagement workshops and reports;
• Commonwealth and state departments and agencies;
• Australian Bureau of Statistics for demographic characteristics and statistics;
• Market reports on residential, commercial and industrial land values;
• University publications and papers;
CRC CARE National Remediation Framework Guideline on performing cost-benefit and sustainability analysis of remediation options
Information correct at time of publication 36 Version 0.1: August 2018
• Non-government organisation studies, and
• Industry specific reports by government and industry peak bodies.
Identifying and locating appropriate sources of information for some indicators can be difficult and assistance from engineers, economists, scientists and other specialists may be required.
Appendix C provides guidance on potential data and information sources for the example indicators identified in Step 4. It should be noted that the list of suggested information sources should be used as a guide only. The data and information required for the CB&SA will be informed by the scale, nature and complexity of the remediation site, the identified indicators to be assessed, and the proposed end-use of the site.
As with contaminated land investigations, identifying the sources of information and collecting the data are carried out simultaneously within the CB&SA framework. In many cases the collection of data will be intuitive and straightforward.
However, some aspects of economic data collection can differ from those commonly encountered within contaminated site investigation. Therefore, the following points have been included as general considerations to aid the practitioner in gauging the level of effort required in obtaining information:
• Some information should be obtained by commissioning specialists or consultants to undertake specific studies or investigations (such as specialist ecological studies, or human health risk assessment);
• Published data may need to be purchased (such as property market reports);
• Some information sources (community surveys, traffic surveys) can take time to commission and deliver, or must be conducted over a set time period in order to be representative;
• Remote or unique sites may require detailed or specific information, or the assumptions associated with readily available information may not be applicable to that site; and
• Locating and sourcing relevant information to assess and measure some indicators can be difficult. Not only can it be difficult to determine what specific data is required, it can also be challenging to identify where this data or information can be located.
Determine data gaps
Data gaps are likely to occur as a natural extension of identifying information sources and collecting data. It is likely that the ideal data set will not be available or exist for one or all of the indicators, or that the different options will not have the same level of data detail available for a certain indicator.
The action to address an identified data gap will depend on the nature of the gap, the scale and complexity of the project, and the available time and budget to conduct the CB&SA. If the timing and budget of the CB&SA investigation permit, then there may be an opportunity to directly collect data to address the gap. This may involve conducting surveys or commissioning a subject matter expert, for example. In cases where there is a resource limitation on collecting the relevant data (i.e. it is too expensive or time consuming), then an informed compromise needs to be made regarding the level of detail that is appropriate, and this should be done in consultation with the decision
CRC CARE National Remediation Framework Guideline on performing cost-benefit and sustainability analysis of remediation options
Information correct at time of publication 37 Version 0.1: August 2018
makers. When data is proving difficult to obtain, the cost in time and resources of obtaining the data should be compared against the additional insight to decision making it might provide.
In particular, it is likely that the different options will not have the same level of detail available for a certain indicator. For example one option may have a very detailed subcontractor quote, but another option may only have a schedule of rates or perhaps no pricing at all. Despite the discrepancy in data detail between options, the practitioner should include the available detail for each option, and not exclude data on one option because another option does not have the same level of detail. At the same time, this data gap should be noted, and included as a source of uncertainty in the data interpretation. If the data discrepancy is large, the practitioner may opt to conduct a sensitivity analysis for this indicator (refer to Section 4.5.1 for further detail), to determine if the discrepancy is having a material effect on the outcome of the CB&SA, and perhaps to justify the expense of collecting further data to close the data gap.
In cases where the data does not exist or cannot be readily obtained, there are generally two options available. Either, an appropriate proxy for the actual data can be used to measure the indicator, or a suitable alternative indicator with available data can be selected in lieu of the original indicator. When seeking to identify an alternative indicator, it is important to revisit Steps 1 to 3 to identify an appropriate alternative indicator. Examples of how proxy measures or alternative performance indicators may be used are outlined in Box 3.7.
Box 3-7: Example of using proxy measures and alternative performance indicators
It is important to remember there will be likely be some risk, uncertainty and/or variability with the data used as part of the CB&SA. Sections 4 and 5 provide guidance on adequately addressing the data risk, uncertainty and variability as part of the CB&SA.
Determine the assessment category
After identifying the relevant project indicators and the associated available information, they should be placed into one of the following three categories for assessment:
An example of where practitioners may use a proxy to measure a performance indicator is ‘safety’. Safety is often context specific, and therefore how to measure and assess it depends on the nature of the project. To address this, practitioners may use a proxy for safety, such as the ‘number of construction worker days on site over the life of the remediation works’ or ‘number of truck trips to and from the site over the life of the remediation works’. As it could be reasonably assumed that the risks to safety will generally increase with the more people on site or the more truck trips made to from the site, such proxies can be effective measurements for a performance indicator.
In some instances, a lack of data availability will require practitioners to find a suitable alternative performance indicator. An example may be in attempting to assess the linear metres of river habitat for a local endangered species that will be generated by remediating the site. However, this may simply be beyond the budget of the project to estimate, particularly as it may be based on a number of different factors or involve subject matter experts to calculate. So, the practitioner decides to assess the anticipated improvement in water quality instead.
CRC CARE National Remediation Framework Guideline on performing cost-benefit and sustainability analysis of remediation options
Information correct at time of publication 38 Version 0.1: August 2018
quantify, monetise or qualify. Each of these categories has a fundamentally different assessment method:
• “Quantify” indicators are those that can be readily measured in physical or quantitative terms but which cannot be easily valued in money terms. Examples include: improved water quality, reduced soil contamination, habitat losses;
• “Monetise” indicators are those that can be readily expressed in monetary terms. Examples include: capital costs of a building, equipment costs, maintenance costs, revenue from the sale of land, cost savings, and CO2 equivalents; and
• “Qualify” indicators are those which cannot be easily quantified but can be assessed on a qualitative scale. Examples may include remedy effectiveness, positive (or negative) effect on low income populations, and consistency with neighbourhood expectations.
As a general rule, valuing indicators in monetary terms requires more robust data and a greater level of analysis than valuing indicators in physical or quantitative terms, which in turn requires more data and a higher level of analysis than reporting indicators on a qualitative basis.
It should be noted that there is no clear-cut rule for when indicators should be monetised, quantified or reported against. Rather, when deciding on whether to monetise, quantify or report on selected indicators, consideration should be given to:
• The quantity and quality of supporting data and information available;
• The size and importance of the proposed investment or remediation project;
• The nature, complexity and risk of the proposed remediation project;
• The available time and budget to undertake the CB&SA; and
• Relevant regulatory and planning requirements.
Appendix C provides guidance on which performance indicators can be quantified, monetised and/or qualified, although it should be noted these are suggestions only, and practitioners should consider the project requirements when choosing the indicator assessment method.
The magnitude of likely impacts on the local community and the environment, and the size of the overall project investment, should be considered when determining how much effort to apply in assessing indicators. For example, where a remediation project is likely to result in significant costs (and therefore would be warranted only if it generated substantial benefits) or impacts to the community, it is particularly important that the remediation project can rigorously demonstrate and quantify its benefits. Conversely, less effort should be required for remediation projects which have an established economic value or there are analogous precedents which have demonstrated a positive net value. In general, the effort required will increase for novel, complex and high cost projects.
Some guiding principles for choosing the level of assessment required are:
CRC CARE National Remediation Framework Guideline on performing cost-benefit and sustainability analysis of remediation options
Information correct at time of publication 39 Version 0.1: August 2018
• Include at least a qualitative characterisation of indicators that differ among the remedial options. This is for completeness and for transparency in the decision.
• For an indicator that can be important to a stakeholder group or could otherwise influence the ranking of the remedial options, at a minimum consider developing qualitative scales. This will allow for a more formalised and transparent decision process as well as sensitivity analysis.
• Wherever it is reasonable to quantify performance indicators, consider the value of the information in terms of influencing the decision and defending the decision to stakeholder groups. The quantitative indicators go a long way toward supporting consistent and sound decisions.
• Take care in interpreting the quantitative scales for performance indicators, as a higher quantity may indicate poorer performance (such as greenhouse gas emissions or project costs) or more desirable performance (such as improved heritage value and public land use).
• Monetise those costs and benefits that can be reasonably valued in economic terms. Monetising the financial costs of implementing the remedial option, including the construction costs, administrative and permitting costs and long-term site management costs is generally straightforward. However, monetising impacts such as direct human uses of natural resources, such as recreational uses of parks and waterways, will likely require additional data collection and analysis effort, and access to discreet expertise.
There are a broad range of accepted, formal quantification and monetisation assessment methodologies that can be used to assist practitioners in assessing and measuring performance indicators. Some of these techniques vary in their complexity. Appendix D provides an overview and introduction to the assessment methods that are considered the most useful within a site contamination context.
For the indicators able to be monetised, the CBA methodology outlined in Section 4 should be applied. For the indicators able to be quantified or qualified, the MCA methodology outlined in Section 5 should be applied. Section 5 also provides the method for integrating the results of the CBA into the overall CB&SA.
Outcomes of Step 6
At the completion of Step 6, the practitioner should have:
• Identified and collected data;
• Identified and then addressed gaps in the data; and
• Established the assessment method for each indicator.
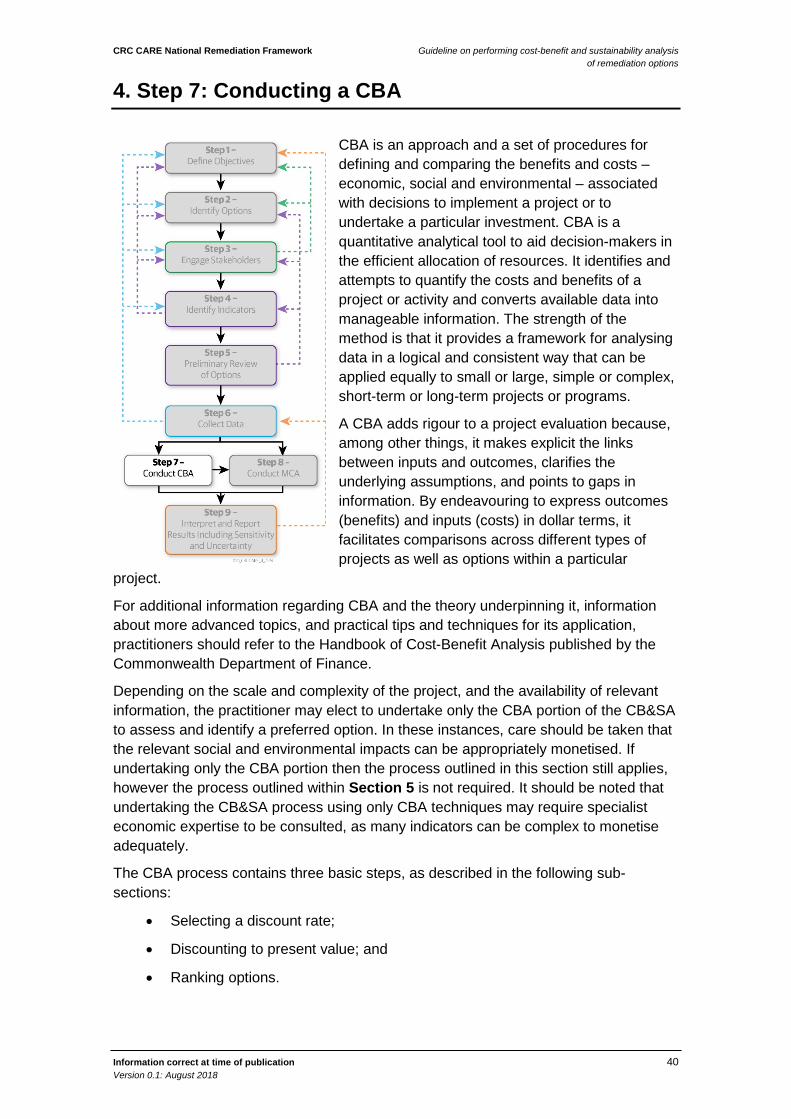
CRC CARE National Remediation Framework Guideline on performing cost-benefit and sustainability analysis of remediation options
Information correct at time of publication 40 Version 0.1: August 2018
4. Step 7: Conducting a CBA
CBA is an approach and a set of procedures for defining and comparing the benefits and costs – economic, social and environmental – associated with decisions to implement a project or to undertake a particular investment. CBA is a quantitative analytical tool to aid decision-makers in the efficient allocation of resources. It identifies and attempts to quantify the costs and benefits of a project or activity and converts available data into manageable information. The strength of the method is that it provides a framework for analysing data in a logical and consistent way that can be applied equally to small or large, simple or complex, short-term or long-term projects or programs.
A CBA adds rigour to a project evaluation because, among other things, it makes explicit the links between inputs and outcomes, clarifies the underlying assumptions, and points to gaps in information. By endeavouring to express outcomes (benefits) and inputs (costs) in dollar terms, it facilitates comparisons across different types of projects as well as options within a particular
project.
For additional information regarding CBA and the theory underpinning it, information about more advanced topics, and practical tips and techniques for its application, practitioners should refer to the Handbook of Cost-Benefit Analysis published by the Commonwealth Department of Finance.
Depending on the scale and complexity of the project, and the availability of relevant information, the practitioner may elect to undertake only the CBA portion of the CB&SA to assess and identify a preferred option. In these instances, care should be taken that the relevant social and environmental impacts can be appropriately monetised. If undertaking only the CBA portion then the process outlined in this section still applies, however the process outlined within Section 5 is not required. It should be noted that undertaking the CB&SA process using only CBA techniques may require specialist economic expertise to be consulted, as many indicators can be complex to monetise adequately.
The CBA process contains three basic steps, as described in the following sub-sections:
• Selecting a discount rate;
• Discounting to present value; and
• Ranking options.
CRC CARE National Remediation Framework Guideline on performing cost-benefit and sustainability analysis of remediation options
Information correct at time of publication 41 Version 0.1: August 2018
The following sections provide a step-by-step guide to performing a CBA for assessing land use and remedial options, using the output of the assessments conducted during previous sections (Steps 1-6).
Selecting the appropriate discount rate The standard approach to valuing costs and benefits that occur at different times is based on the principle that a dollar now is worth more than a dollar next year. This is because individuals typically prefer a dollar today to a dollar in the future, and can be demonstrated by the fact that if the recipient intends to save the money they could earn interest on the dollar saved; in which case in a year’s time its value will be more than one dollar. Discounting to today’s dollar value acknowledges the opportunity cost of investing in a particular project by asking what return that investment would have produced had it been employed in an alternative use.
The standard approach to discounting reduces a time stream of costs or benefits to an equivalent amount of today’s dollars. That single amount is known as the present value (PV), and is calculated using the method of compound interest. The rate that converts future values into present value is known as the discount rate, which is in effect an ‘exchange rate’ between value today and value in the future.
When selecting the appropriate discount rate, both the choice between a ‘nominal’ or ‘real’ discount rate, and the selection of an appropriate specific default rate, need to be considered.
Nominal or real discount rates
A nominal (current) discount rate will include the impact of inflation on price levels in addition to accounting for increases in the general price level. In contrast, a real (constant) discount rate is the general increase in price levels minus the inflation rate.
For example, if the annual interest rate for a bank term deposit is 6% (the nominal discount rate) and the annual inflation rate is 4% (inflation), then the real rate of interest is approximately 2% (the discount rate).
In practice, the use of real discount rates is considered to simplify the forecasting and calculation processes. Hence, this guideline advocates using costs and benefits valued in real terms (constant dollars expressed in the price level of a single year) and discounted by using a real discount rate. In addition, the base date for the calculations should be the same as that used for accompanying indicator estimations.
Default discount rates
There is currently no consensus within the Australian literature on the appropriate default discount rate for use in public sector project evaluations. Developing a project specific discount rate is likely to be time intensive, costly and require specialised expertise and is therefore not recommended for the purposes of conducting a CB&SA except cases of very large and complex projects.
As such, this guideline advocates applying a central real discount rate of 7% with sensitivity tests using the rates of both 4% and 10% (Sensitivity is described in more detail within Section 4.5.1). This approach is consistent with that advocated by New South Wales Treasury and is a generally accepted approach within Australia and overseas.
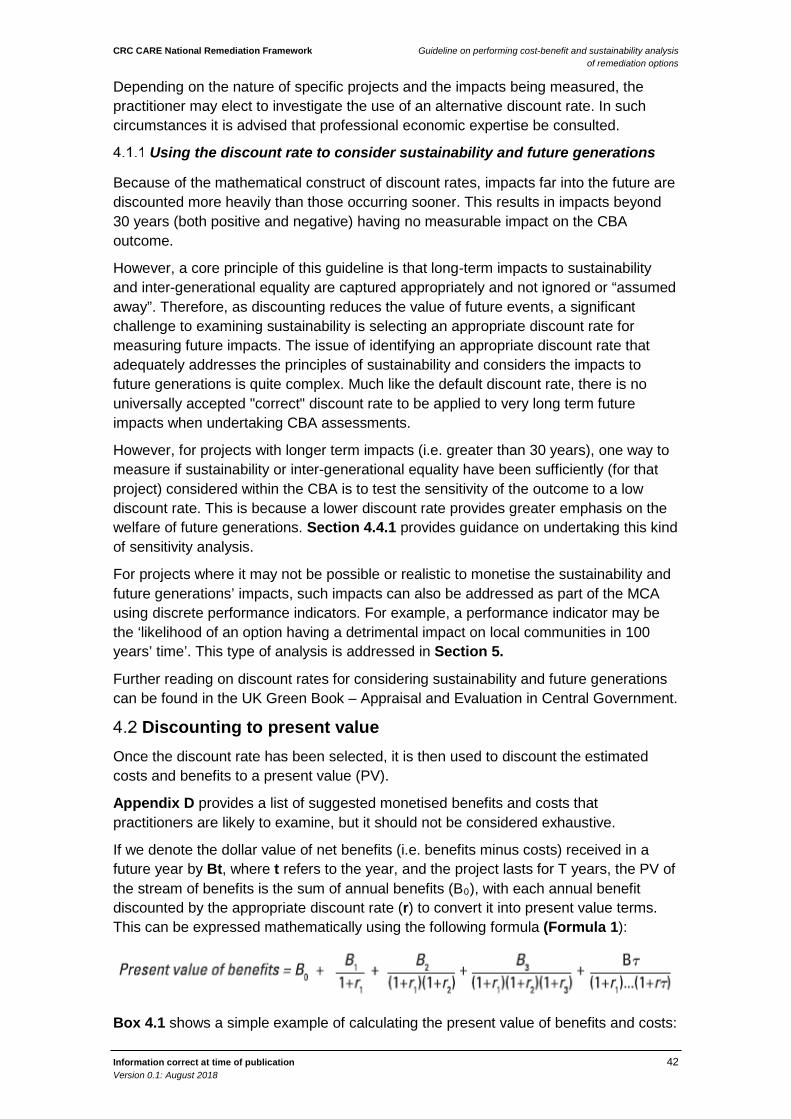
CRC CARE National Remediation Framework Guideline on performing cost-benefit and sustainability analysis of remediation options
Information correct at time of publication 42 Version 0.1: August 2018
Depending on the nature of specific projects and the impacts being measured, the practitioner may elect to investigate the use of an alternative discount rate. In such circumstances it is advised that professional economic expertise be consulted.
Using the discount rate to consider sustainability and future generations
Because of the mathematical construct of discount rates, impacts far into the future are discounted more heavily than those occurring sooner. This results in impacts beyond 30 years (both positive and negative) having no measurable impact on the CBA outcome.
However, a core principle of this guideline is that long-term impacts to sustainability and inter-generational equality are captured appropriately and not ignored or “assumed away”. Therefore, as discounting reduces the value of future events, a significant challenge to examining sustainability is selecting an appropriate discount rate for measuring future impacts. The issue of identifying an appropriate discount rate that adequately addresses the principles of sustainability and considers the impacts to future generations is quite complex. Much like the default discount rate, there is no universally accepted "correct" discount rate to be applied to very long term future impacts when undertaking CBA assessments.
However, for projects with longer term impacts (i.e. greater than 30 years), one way to measure if sustainability or inter-generational equality have been sufficiently (for that project) considered within the CBA is to test the sensitivity of the outcome to a low discount rate. This is because a lower discount rate provides greater emphasis on the welfare of future generations. Section 4.4.1 provides guidance on undertaking this kind of sensitivity analysis.
For projects where it may not be possible or realistic to monetise the sustainability and future generations’ impacts, such impacts can also be addressed as part of the MCA using discrete performance indicators. For example, a performance indicator may be the ‘likelihood of an option having a detrimental impact on local communities in 100 years’ time’. This type of analysis is addressed in Section 5.
Further reading on discount rates for considering sustainability and future generations can be found in the UK Green Book – Appraisal and Evaluation in Central Government.
Discounting to present value Once the discount rate has been selected, it is then used to discount the estimated costs and benefits to a present value (PV).
Appendix D provides a list of suggested monetised benefits and costs that practitioners are likely to examine, but it should not be considered exhaustive.
If we denote the dollar value of net benefits (i.e. benefits minus costs) received in a future year by Bt, where t refers to the year, and the project lasts for T years, the PV of the stream of benefits is the sum of annual benefits (B0), with each annual benefit discounted by the appropriate discount rate (r) to convert it into present value terms. This can be expressed mathematically using the following formula (Formula 1):
Box 4.1 shows a simple example of calculating the present value of benefits and costs:
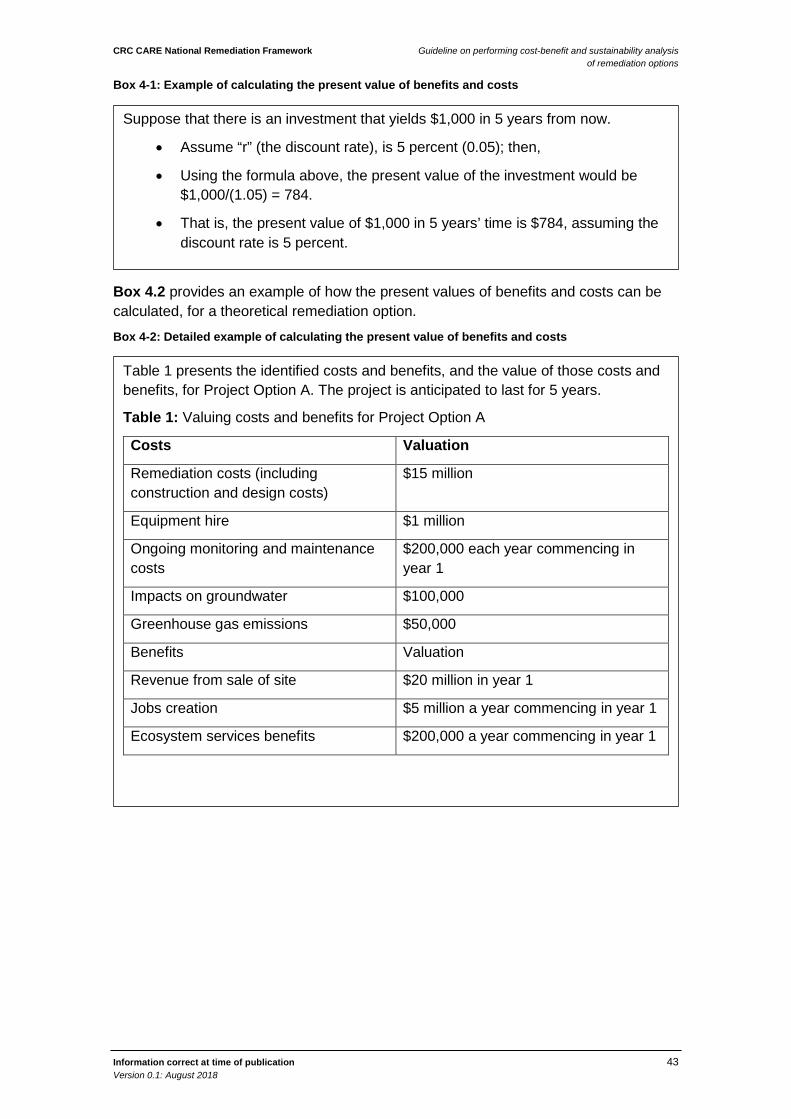
CRC CARE National Remediation Framework Guideline on performing cost-benefit and sustainability analysis of remediation options
Information correct at time of publication 43 Version 0.1: August 2018
Box 4-1: Example of calculating the present value of benefits and costs
Box 4.2 provides an example of how the present values of benefits and costs can be calculated, for a theoretical remediation option.
Box 4-2: Detailed example of calculating the present value of benefits and costs
Suppose that there is an investment that yields $1,000 in 5 years from now.
• Assume “r” (the discount rate), is 5 percent (0.05); then,
• Using the formula above, the present value of the investment would be $1,000/(1.05) = 784.
• That is, the present value of $1,000 in 5 years’ time is $784, assuming the discount rate is 5 percent.
Table 1 presents the identified costs and benefits, and the value of those costs and benefits, for Project Option A. The project is anticipated to last for 5 years.
Table 1: Valuing costs and benefits for Project Option A
Costs Valuation
Remediation costs (including construction and design costs)
$15 million
Equipment hire $1 million
Ongoing monitoring and maintenance costs
$200,000 each year commencing in year 1
Impacts on groundwater $100,000
Greenhouse gas emissions $50,000
Benefits Valuation
Revenue from sale of site $20 million in year 1
Jobs creation $5 million a year commencing in year 1
Ecosystem services benefits $200,000 a year commencing in year 1
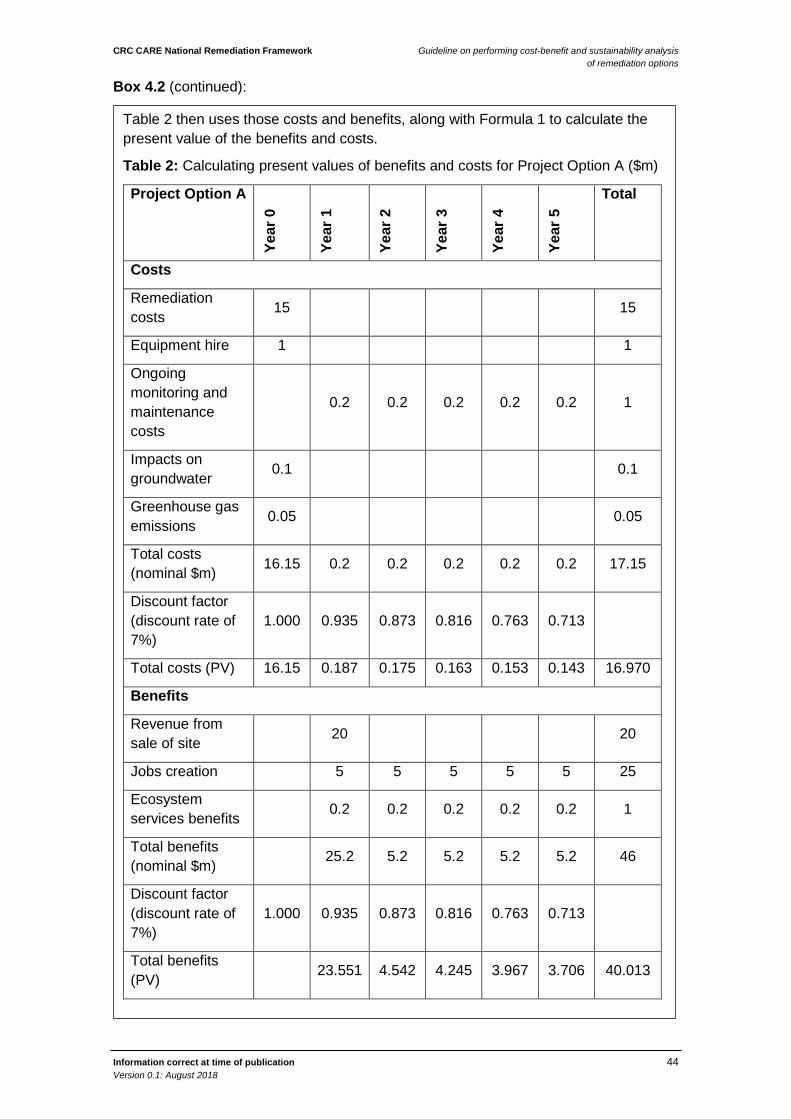
CRC CARE National Remediation Framework Guideline on performing cost-benefit and sustainability analysis of remediation options
Information correct at time of publication 44 Version 0.1: August 2018
Box 4.2 (continued):
Table 2 then uses those costs and benefits, along with Formula 1 to calculate the present value of the benefits and costs.
Table 2: Calculating present values of benefits and costs for Project Option A ($m)
Project Option A
Year
0
Year
1
Year
2
Year
3
Year
4
Year
5
Total
Costs
Remediation costs 15 15
Equipment hire 1 1
Ongoing monitoring and maintenance costs
0.2 0.2 0.2 0.2 0.2 1
Impacts on groundwater 0.1 0.1
Greenhouse gas emissions 0.05 0.05
Total costs (nominal $m) 16.15 0.2 0.2 0.2 0.2 0.2 17.15
Discount factor (discount rate of 7%)
1.000 0.935 0.873 0.816 0.763 0.713
Total costs (PV) 16.15 0.187 0.175 0.163 0.153 0.143 16.970
Benefits
Revenue from sale of site 20 20
Jobs creation 5 5 5 5 5 25
Ecosystem services benefits 0.2 0.2 0.2 0.2 0.2 1
Total benefits (nominal $m) 25.2 5.2 5.2 5.2 5.2 46
Discount factor (discount rate of 7%)
1.000 0.935 0.873 0.816 0.763 0.713
Total benefits (PV) 23.551 4.542 4.245 3.967 3.706 40.013
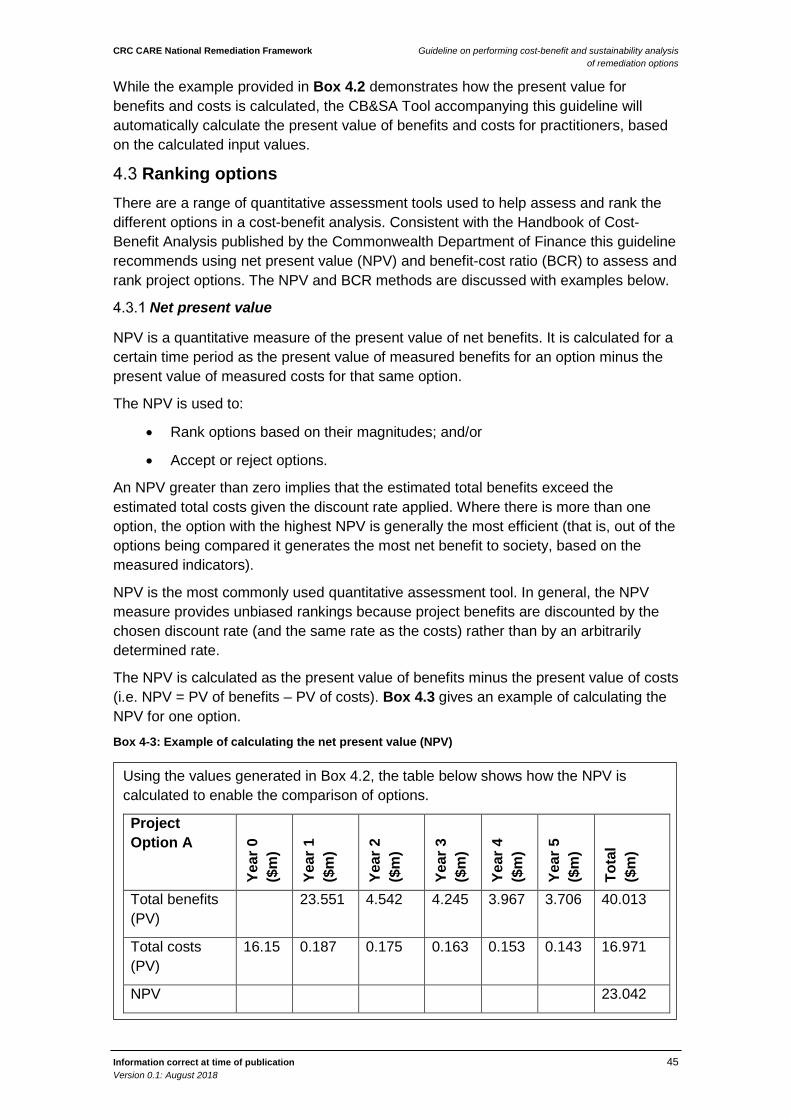
CRC CARE National Remediation Framework Guideline on performing cost-benefit and sustainability analysis of remediation options
Information correct at time of publication 45 Version 0.1: August 2018
While the example provided in Box 4.2 demonstrates how the present value for benefits and costs is calculated, the CB&SA Tool accompanying this guideline will automatically calculate the present value of benefits and costs for practitioners, based on the calculated input values.
Ranking options There are a range of quantitative assessment tools used to help assess and rank the different options in a cost-benefit analysis. Consistent with the Handbook of Cost-Benefit Analysis published by the Commonwealth Department of Finance this guideline recommends using net present value (NPV) and benefit-cost ratio (BCR) to assess and rank project options. The NPV and BCR methods are discussed with examples below.
Net present value
NPV is a quantitative measure of the present value of net benefits. It is calculated for a certain time period as the present value of measured benefits for an option minus the present value of measured costs for that same option.
The NPV is used to:
• Rank options based on their magnitudes; and/or
• Accept or reject options.
An NPV greater than zero implies that the estimated total benefits exceed the estimated total costs given the discount rate applied. Where there is more than one option, the option with the highest NPV is generally the most efficient (that is, out of the options being compared it generates the most net benefit to society, based on the measured indicators).
NPV is the most commonly used quantitative assessment tool. In general, the NPV measure provides unbiased rankings because project benefits are discounted by the chosen discount rate (and the same rate as the costs) rather than by an arbitrarily determined rate.
The NPV is calculated as the present value of benefits minus the present value of costs (i.e. NPV = PV of benefits – PV of costs). Box 4.3 gives an example of calculating the NPV for one option.
Box 4-3: Example of calculating the net present value (NPV)
Using the values generated in Box 4.2, the table below shows how the NPV is calculated to enable the comparison of options.
Project Option A
Year
0
($m
)
Year
1
($m
)
Year
2
($m
)
Year
3
($m
)
Year
4
($m
)
Year
5
($m
)
Tota
l ($
m)
Total benefits (PV)
23.551 4.542 4.245 3.967 3.706 40.013
Total costs (PV)
16.15 0.187 0.175 0.163 0.153 0.143 16.971
NPV 23.042
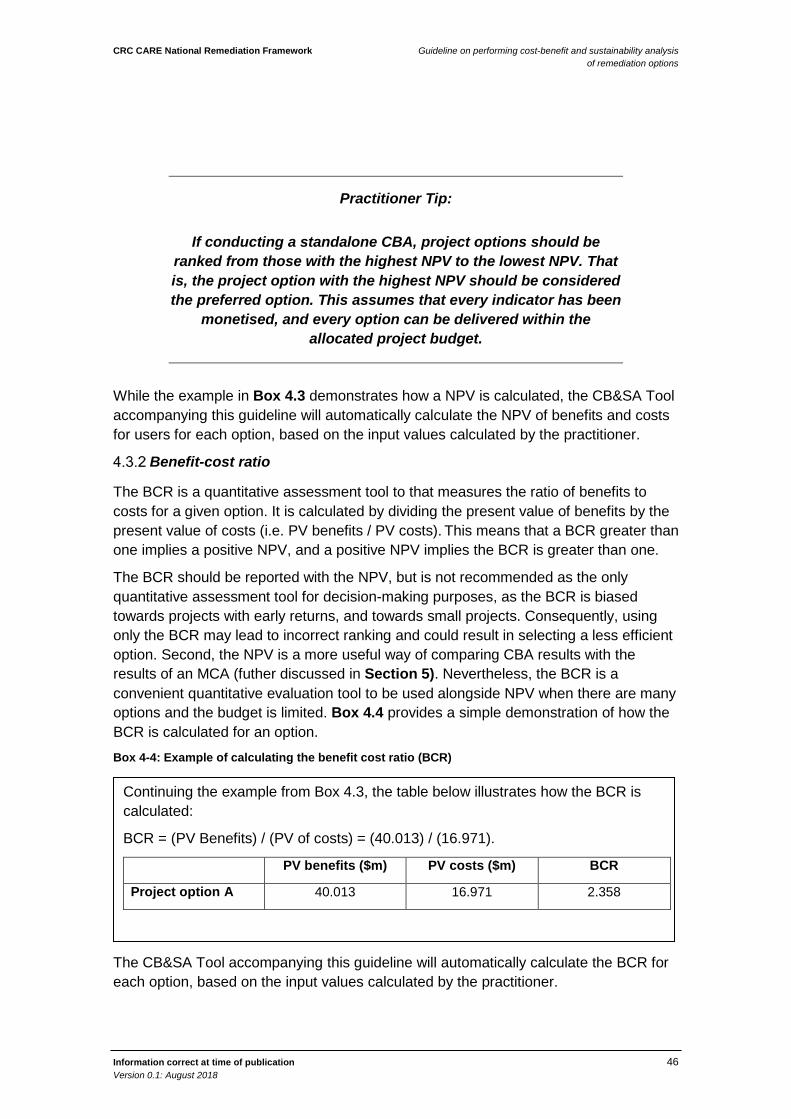
CRC CARE National Remediation Framework Guideline on performing cost-benefit and sustainability analysis of remediation options
Information correct at time of publication 46 Version 0.1: August 2018
Practitioner Tip:
If conducting a standalone CBA, project options should be ranked from those with the highest NPV to the lowest NPV. That is, the project option with the highest NPV should be considered the preferred option. This assumes that every indicator has been
monetised, and every option can be delivered within the allocated project budget.
While the example in Box 4.3 demonstrates how a NPV is calculated, the CB&SA Tool accompanying this guideline will automatically calculate the NPV of benefits and costs for users for each option, based on the input values calculated by the practitioner.
Benefit-cost ratio
The BCR is a quantitative assessment tool to that measures the ratio of benefits to costs for a given option. It is calculated by dividing the present value of benefits by the present value of costs (i.e. PV benefits / PV costs). This means that a BCR greater than one implies a positive NPV, and a positive NPV implies the BCR is greater than one.
The BCR should be reported with the NPV, but is not recommended as the only quantitative assessment tool for decision-making purposes, as the BCR is biased towards projects with early returns, and towards small projects. Consequently, using only the BCR may lead to incorrect ranking and could result in selecting a less efficient option. Second, the NPV is a more useful way of comparing CBA results with the results of an MCA (futher discussed in Section 5). Nevertheless, the BCR is a convenient quantitative evaluation tool to be used alongside NPV when there are many options and the budget is limited. Box 4.4 provides a simple demonstration of how the BCR is calculated for an option.
Box 4-4: Example of calculating the benefit cost ratio (BCR)
The CB&SA Tool accompanying this guideline will automatically calculate the BCR for each option, based on the input values calculated by the practitioner.
Continuing the example from Box 4.3, the table below illustrates how the BCR is calculated:
BCR = (PV Benefits) / (PV of costs) = (40.013) / (16.971).
PV benefits ($m) PV costs ($m) BCR
Project option A 40.013 16.971 2.358
CRC CARE National Remediation Framework Guideline on performing cost-benefit and sustainability analysis of remediation options
Information correct at time of publication 47 Version 0.1: August 2018
Assessing risk and uncertainty within a CBA Up to this point, it has generally been assumed that future costs and benefits are known with a high degree of certainty. Yet the values of the future costs and benefits the practitioner has included within the CBA are, by their very nature, estimates and therefore uncertain. As such, it is important to understand the effect that uncertainty in the data has on the outcome of the analysis, that is: would analysis lead to the same decision if the data uncertainty was removed? Addressing this uncertainty within the CBA portion of the CB&SA process is discussed in this section.
When discussing risk and uncertainty in the context of CBA, this guideline is referring to risk and uncertainty in a mathematical sense, in regard to the collected data.
In this context, uncertainty refers to the state of knowledge of a current issue, and how well known the issue is, both in the present and in the future. It can be thought of as “how precise and accurate is the data we are relying on”.
On the other hand, risk refers to the consequences (both positive and negative) associated with an outcome, and the probability of this outcome being realised in the future given a decision made in the present. It can be thought of as “what are the consequences if the data is not precise or accurate, and what is the likelihood of that consequence occurring”.
It should be noted that in this context, the term ‘risk’ is not referring to the risk or uncertainty associated with applying the options. Examples of this type of risk includes the risk if an option fails to work, or the risk of a work-related injury during implementation. This type of risk can be addressed by including it as a performance indicator in the CB&SA.
Within a CBA, there are a range of established methods for addressing risk and uncertainty. The most common of these are sensitivity analysis and scenario analysis, which are introduced and discussed below.
Sensitivity analysis
Sensitivity analysis is used to assess the possible impact of uncertainty in the data. In principle, the values included in a cost-benefit analysis are the average, or mean, estimates. A sensitivity analysis takes advantage of that by providing information about the effect of variability in those estimates on the outcome of the CBA.
The first step in a sensitivity analysis is to simultaneously substitute plausible pessimistic estimates for each important indicator, and to calculate a pessimistic NPV for each option. If the pessimistic NPV is still positive, it can be said that even with pessimistic assumptions the option is likely to yield net benefits, and therefore the central NPV calculation (i.e. that NPV based on the central discount rate of 7%) was unlikely to be unduly influenced by variations in the data. In this case no further sensitivity analysis is needed.
The second step is to assess risk by assessing which indicators significantly affect the central NPV for each option. One way to do this is to move each indicator to its most pessimistic value, but to do this one indicator one at a time, holding all other variables to their average value. However, in some cases the indicators are correlated, and in that case the best approximation would be to move these indicators together. This process, while more complex, will help to determine the indicators that are having the most impact on the results of the NPV. Box 4.5 provides an example of this.
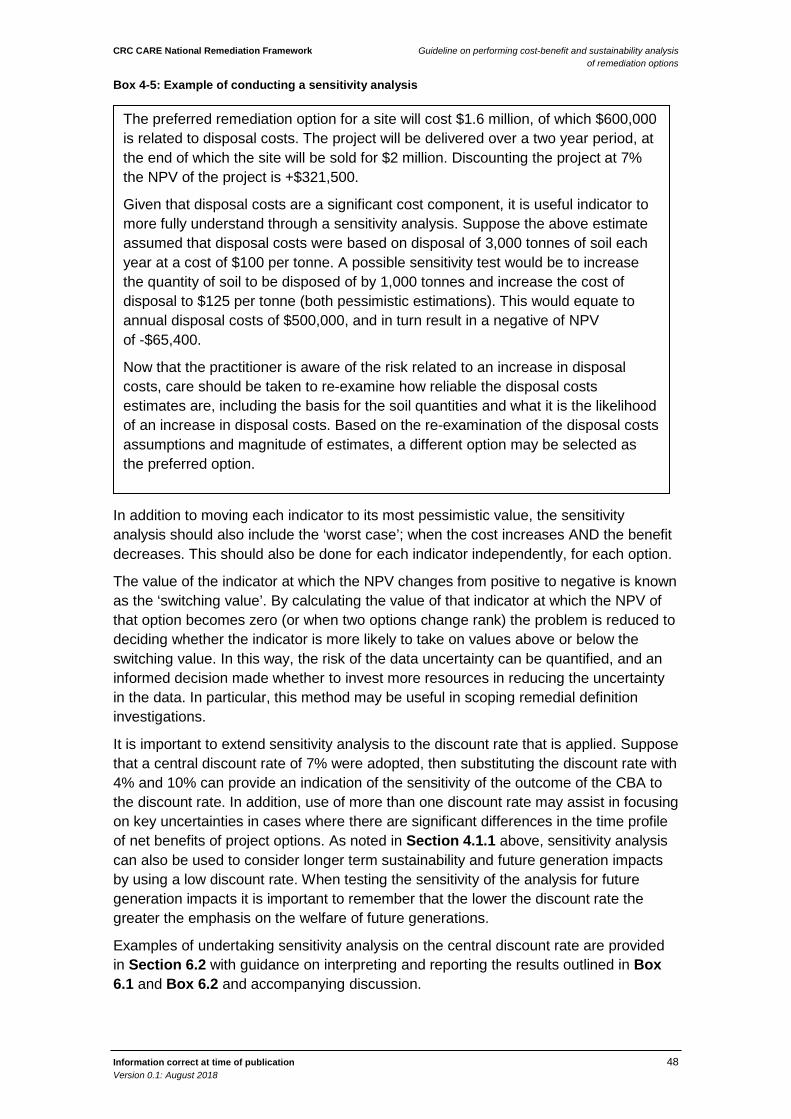
CRC CARE National Remediation Framework Guideline on performing cost-benefit and sustainability analysis of remediation options
Information correct at time of publication 48 Version 0.1: August 2018
Box 4-5: Example of conducting a sensitivity analysis
In addition to moving each indicator to its most pessimistic value, the sensitivity analysis should also include the ‘worst case’; when the cost increases AND the benefit decreases. This should also be done for each indicator independently, for each option.
The value of the indicator at which the NPV changes from positive to negative is known as the ‘switching value’. By calculating the value of that indicator at which the NPV of that option becomes zero (or when two options change rank) the problem is reduced to deciding whether the indicator is more likely to take on values above or below the switching value. In this way, the risk of the data uncertainty can be quantified, and an informed decision made whether to invest more resources in reducing the uncertainty in the data. In particular, this method may be useful in scoping remedial definition investigations.
It is important to extend sensitivity analysis to the discount rate that is applied. Suppose that a central discount rate of 7% were adopted, then substituting the discount rate with 4% and 10% can provide an indication of the sensitivity of the outcome of the CBA to the discount rate. In addition, use of more than one discount rate may assist in focusing on key uncertainties in cases where there are significant differences in the time profile of net benefits of project options. As noted in Section 4.1.1 above, sensitivity analysis can also be used to consider longer term sustainability and future generation impacts by using a low discount rate. When testing the sensitivity of the analysis for future generation impacts it is important to remember that the lower the discount rate the greater the emphasis on the welfare of future generations.
Examples of undertaking sensitivity analysis on the central discount rate are provided in Section 6.2 with guidance on interpreting and reporting the results outlined in Box 6.1 and Box 6.2 and accompanying discussion.
The preferred remediation option for a site will cost $1.6 million, of which $600,000 is related to disposal costs. The project will be delivered over a two year period, at the end of which the site will be sold for $2 million. Discounting the project at 7% the NPV of the project is +$321,500.
Given that disposal costs are a significant cost component, it is useful indicator to more fully understand through a sensitivity analysis. Suppose the above estimate assumed that disposal costs were based on disposal of 3,000 tonnes of soil each year at a cost of $100 per tonne. A possible sensitivity test would be to increase the quantity of soil to be disposed of by 1,000 tonnes and increase the cost of disposal to $125 per tonne (both pessimistic estimations). This would equate to annual disposal costs of $500,000, and in turn result in a negative of NPV of -$65,400.
Now that the practitioner is aware of the risk related to an increase in disposal costs, care should be taken to re-examine how reliable the disposal costs estimates are, including the basis for the soil quantities and what it is the likelihood of an increase in disposal costs. Based on the re-examination of the disposal costs assumptions and magnitude of estimates, a different option may be selected as the preferred option.
CRC CARE National Remediation Framework Guideline on performing cost-benefit and sustainability analysis of remediation options
Information correct at time of publication 49 Version 0.1: August 2018
The CB&SA tool has a built-in sensitivity analysis component. The results of the CBA using the alternative discount rates of 4% and 10% (or other values of the practitioner’s choosing) are automatically calculated and presented in the graphical output.
Scenario analysis
Sensitivity analysis only considers what would happen if one of the assumptions proved to be incorrect.
In contrast, scenario analysis is the process of looking at the consequences of various possible states of the world or future scenarios. Scenarios have been used in practice to not only analyse large individual investment projects but also entire corporate strategies.
To be fully effective, scenarios should be developed so that they are mutually exclusive. Scenario construction should avoid the temptation to average two scenarios, or to choose the central or the most likely one of a number of scenarios.
Scenarios usually consist of descriptions of the future socioeconomic environment which, while being logical and internally consistent, differ in crucial respects. The idea is to set up two or possibly three scenarios so as to draw the attention of decision makers to the technical, economic, political, or other uncertainties upon which the success of one particular option depends. Scenarios are not forecasts (i.e. predictions of what is likely), rather they are an aid to understanding the mechanisms at work (i.e. an indication of what is possible).
In constructing scenarios, the following practical issues may be encountered:
• Persuading decision makers accustomed to short-term horizons to take long-term scenarios seriously.
• Specifying the scenarios consistently. This means that scenarios should be internally and mutually consistent.
Scenario analysis can be a particularly effective means of encapsulating the inherent uncertainty facing decision makers and ensuring the importance of flexibility in planning is addressed. It is important to note that when undertaking scenario analysis that practitioners should consider elements that are beyond their direct control that may affect the success of the identified option.
Box 4.6 provides further guidance on undertaking scenario analysis to support the CB&SA.
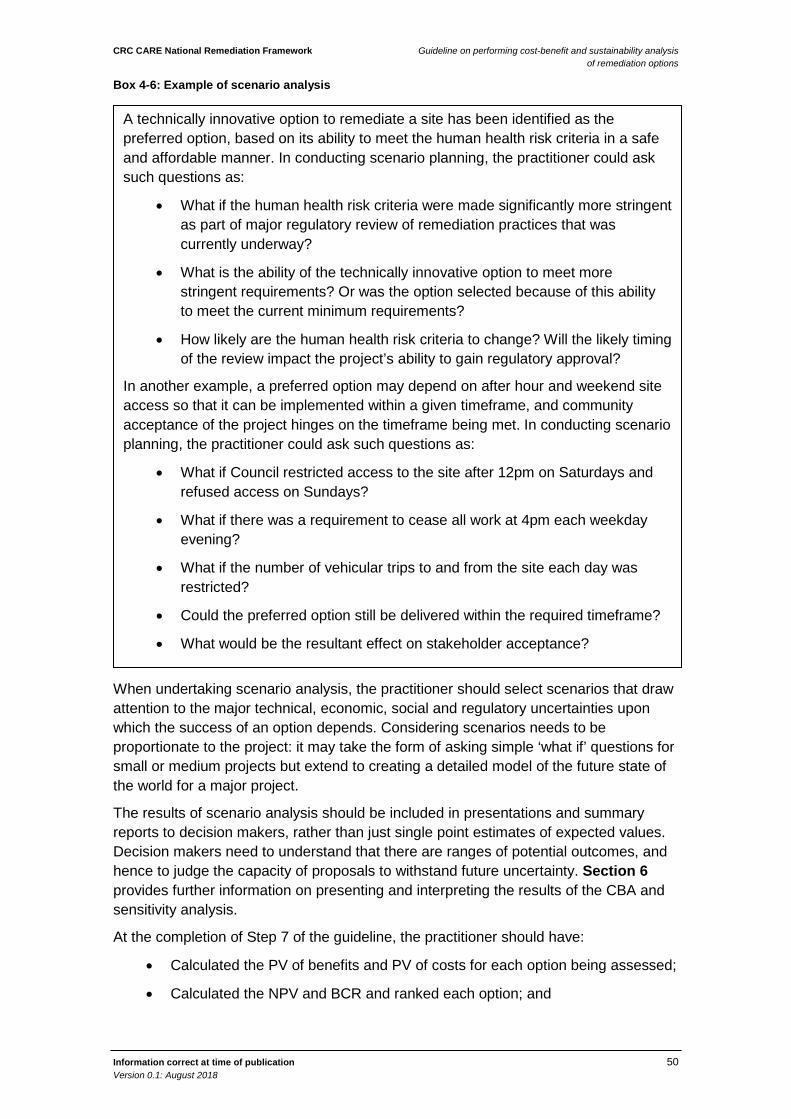
CRC CARE National Remediation Framework Guideline on performing cost-benefit and sustainability analysis of remediation options
Information correct at time of publication 50 Version 0.1: August 2018
Box 4-6: Example of scenario analysis
When undertaking scenario analysis, the practitioner should select scenarios that draw attention to the major technical, economic, social and regulatory uncertainties upon which the success of an option depends. Considering scenarios needs to be proportionate to the project: it may take the form of asking simple ‘what if’ questions for small or medium projects but extend to creating a detailed model of the future state of the world for a major project.
The results of scenario analysis should be included in presentations and summary reports to decision makers, rather than just single point estimates of expected values. Decision makers need to understand that there are ranges of potential outcomes, and hence to judge the capacity of proposals to withstand future uncertainty. Section 6 provides further information on presenting and interpreting the results of the CBA and sensitivity analysis.
At the completion of Step 7 of the guideline, the practitioner should have:
• Calculated the PV of benefits and PV of costs for each option being assessed;
• Calculated the NPV and BCR and ranked each option; and
A technically innovative option to remediate a site has been identified as the preferred option, based on its ability to meet the human health risk criteria in a safe and affordable manner. In conducting scenario planning, the practitioner could ask such questions as:
• What if the human health risk criteria were made significantly more stringent as part of major regulatory review of remediation practices that was currently underway?
• What is the ability of the technically innovative option to meet more stringent requirements? Or was the option selected because of this ability to meet the current minimum requirements?
• How likely are the human health risk criteria to change? Will the likely timing of the review impact the project’s ability to gain regulatory approval?
In another example, a preferred option may depend on after hour and weekend site access so that it can be implemented within a given timeframe, and community acceptance of the project hinges on the timeframe being met. In conducting scenario planning, the practitioner could ask such questions as:
• What if Council restricted access to the site after 12pm on Saturdays and refused access on Sundays?
• What if there was a requirement to cease all work at 4pm each weekday evening?
• What if the number of vehicular trips to and from the site each day was restricted?
• Could the preferred option still be delivered within the required timeframe?
• What would be the resultant effect on stakeholder acceptance?

CRC CARE National Remediation Framework Guideline on performing cost-benefit and sustainability analysis of remediation options
Information correct at time of publication 51 Version 0.1: August 2018
• Undertaken some form of sensitivity analysis, or provided justification to the decision makers on why it is not appropriate;
If the practitioner is undertaking the CBA component only, the NPV and BCR rankings will help to identify a preferred option. Presentation and interpretation of the results is discussed further in Section 6.
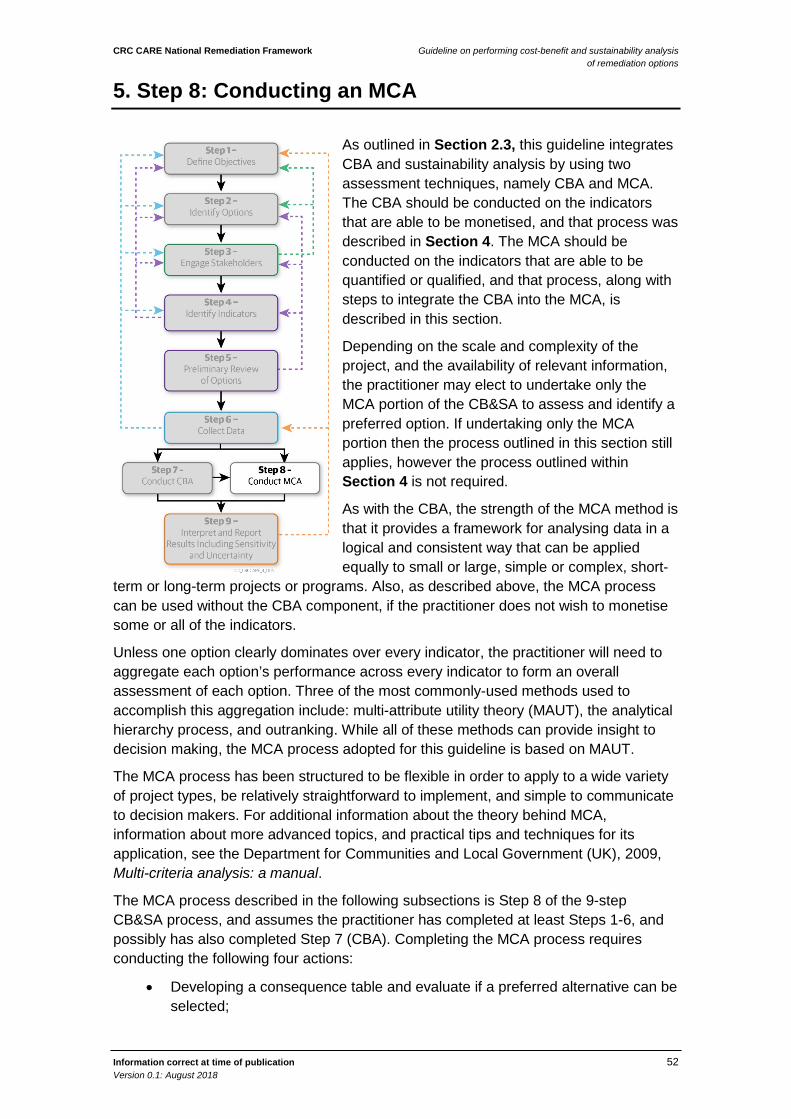
CRC CARE National Remediation Framework Guideline on performing cost-benefit and sustainability analysis of remediation options
Information correct at time of publication 52 Version 0.1: August 2018
5. Step 8: Conducting an MCA
As outlined in Section 2.3, this guideline integrates CBA and sustainability analysis by using two assessment techniques, namely CBA and MCA. The CBA should be conducted on the indicators that are able to be monetised, and that process was described in Section 4. The MCA should be conducted on the indicators that are able to be quantified or qualified, and that process, along with steps to integrate the CBA into the MCA, is described in this section.
Depending on the scale and complexity of the project, and the availability of relevant information, the practitioner may elect to undertake only the MCA portion of the CB&SA to assess and identify a preferred option. If undertaking only the MCA portion then the process outlined in this section still applies, however the process outlined within Section 4 is not required.
As with the CBA, the strength of the MCA method is that it provides a framework for analysing data in a logical and consistent way that can be applied equally to small or large, simple or complex, short-
term or long-term projects or programs. Also, as described above, the MCA process can be used without the CBA component, if the practitioner does not wish to monetise some or all of the indicators.
Unless one option clearly dominates over every indicator, the practitioner will need to aggregate each option’s performance across every indicator to form an overall assessment of each option. Three of the most commonly-used methods used to accomplish this aggregation include: multi-attribute utility theory (MAUT), the analytical hierarchy process, and outranking. While all of these methods can provide insight to decision making, the MCA process adopted for this guideline is based on MAUT.
The MCA process has been structured to be flexible in order to apply to a wide variety of project types, be relatively straightforward to implement, and simple to communicate to decision makers. For additional information about the theory behind MCA, information about more advanced topics, and practical tips and techniques for its application, see the Department for Communities and Local Government (UK), 2009, Multi-criteria analysis: a manual.
The MCA process described in the following subsections is Step 8 of the 9-step CB&SA process, and assumes the practitioner has completed at least Steps 1-6, and possibly has also completed Step 7 (CBA). Completing the MCA process requires conducting the following four actions:
• Developing a consequence table and evaluate if a preferred alternative can be selected;
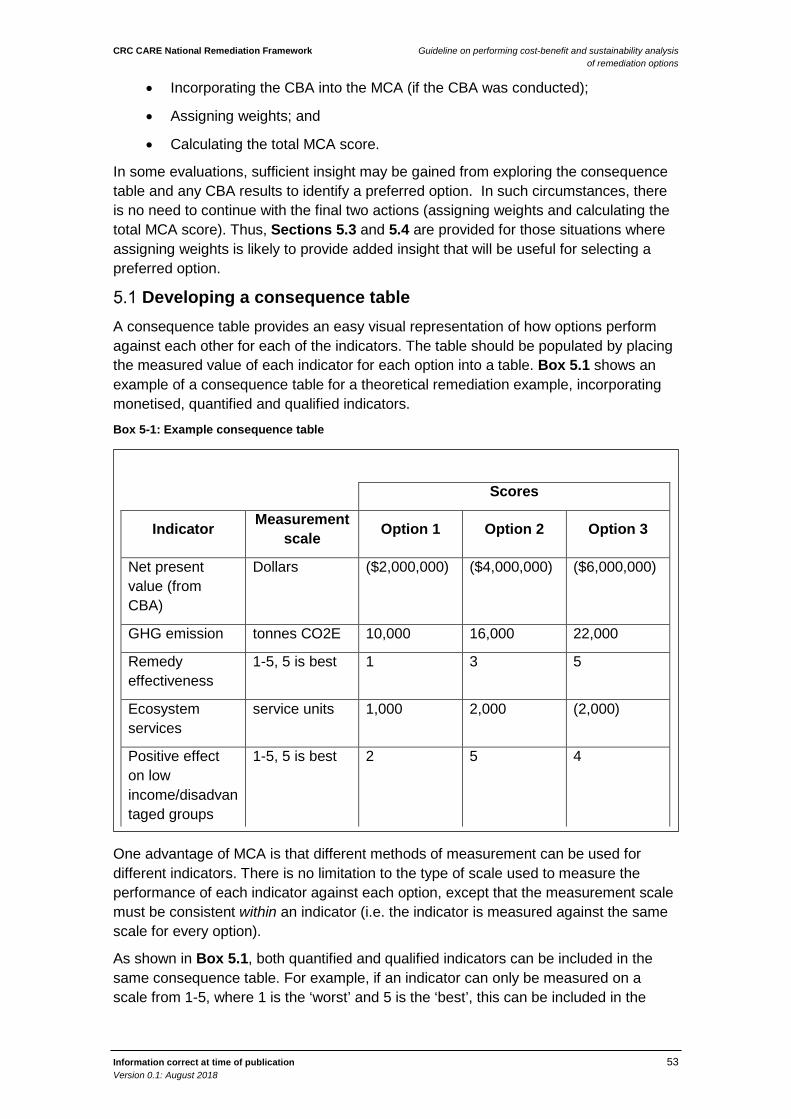
CRC CARE National Remediation Framework Guideline on performing cost-benefit and sustainability analysis of remediation options
Information correct at time of publication 53 Version 0.1: August 2018
• Incorporating the CBA into the MCA (if the CBA was conducted);
• Assigning weights; and
• Calculating the total MCA score.
In some evaluations, sufficient insight may be gained from exploring the consequence table and any CBA results to identify a preferred option. In such circumstances, there is no need to continue with the final two actions (assigning weights and calculating the total MCA score). Thus, Sections 5.3 and 5.4 are provided for those situations where assigning weights is likely to provide added insight that will be useful for selecting a preferred option.
Developing a consequence table A consequence table provides an easy visual representation of how options perform against each other for each of the indicators. The table should be populated by placing the measured value of each indicator for each option into a table. Box 5.1 shows an example of a consequence table for a theoretical remediation example, incorporating monetised, quantified and qualified indicators.
Box 5-1: Example consequence table
One advantage of MCA is that different methods of measurement can be used for different indicators. There is no limitation to the type of scale used to measure the performance of each indicator against each option, except that the measurement scale must be consistent within an indicator (i.e. the indicator is measured against the same scale for every option).
As shown in Box 5.1, both quantified and qualified indicators can be included in the same consequence table. For example, if an indicator can only be measured on a scale from 1-5, where 1 is the ‘worst’ and 5 is the ‘best’, this can be included in the
Scores
Indicator Measurement scale Option 1 Option 2 Option 3
Net present value (from CBA)
Dollars ($2,000,000) ($4,000,000) ($6,000,000)
GHG emission tonnes CO2E 10,000 16,000 22,000
Remedy effectiveness
1-5, 5 is best 1 3 5
Ecosystem services
service units 1,000 2,000 (2,000)
Positive effect on low income/disadvantaged groups
1-5, 5 is best 2 5 4
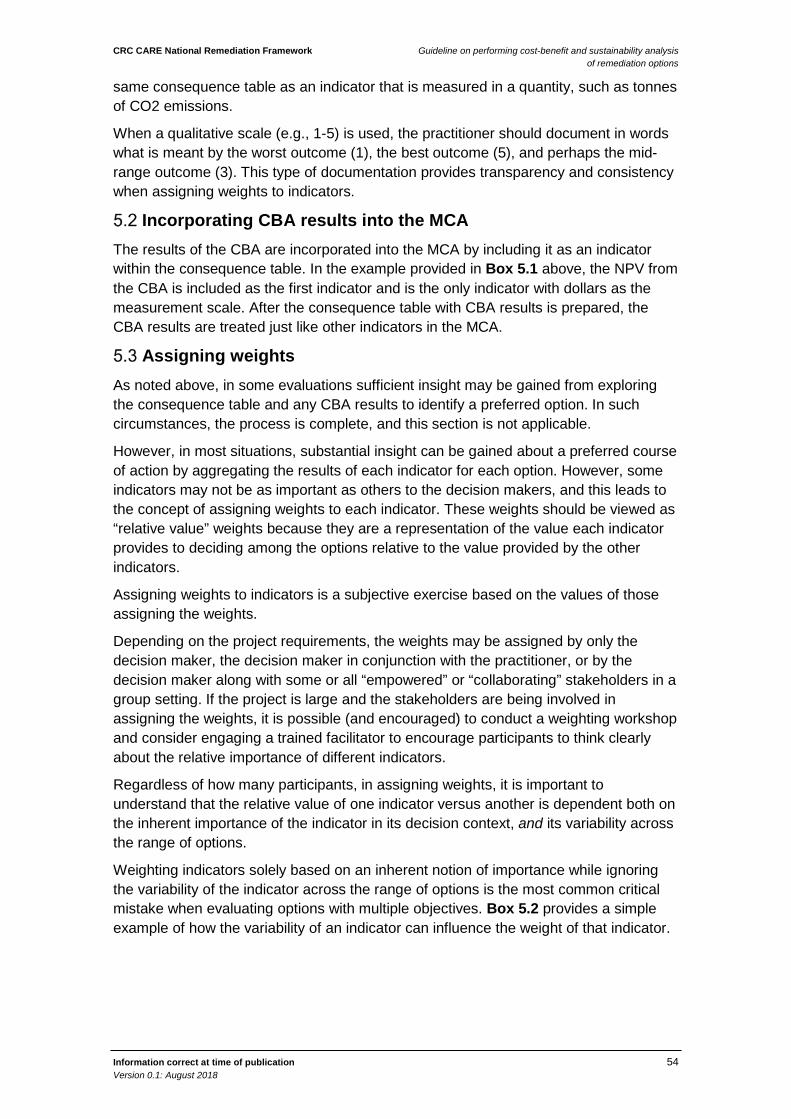
CRC CARE National Remediation Framework Guideline on performing cost-benefit and sustainability analysis of remediation options
Information correct at time of publication 54 Version 0.1: August 2018
same consequence table as an indicator that is measured in a quantity, such as tonnes of CO2 emissions.
When a qualitative scale (e.g., 1-5) is used, the practitioner should document in words what is meant by the worst outcome (1), the best outcome (5), and perhaps the mid-range outcome (3). This type of documentation provides transparency and consistency when assigning weights to indicators.
Incorporating CBA results into the MCA The results of the CBA are incorporated into the MCA by including it as an indicator within the consequence table. In the example provided in Box 5.1 above, the NPV from the CBA is included as the first indicator and is the only indicator with dollars as the measurement scale. After the consequence table with CBA results is prepared, the CBA results are treated just like other indicators in the MCA.
Assigning weights As noted above, in some evaluations sufficient insight may be gained from exploring the consequence table and any CBA results to identify a preferred option. In such circumstances, the process is complete, and this section is not applicable.
However, in most situations, substantial insight can be gained about a preferred course of action by aggregating the results of each indicator for each option. However, some indicators may not be as important as others to the decision makers, and this leads to the concept of assigning weights to each indicator. These weights should be viewed as “relative value” weights because they are a representation of the value each indicator provides to deciding among the options relative to the value provided by the other indicators.
Assigning weights to indicators is a subjective exercise based on the values of those assigning the weights.
Depending on the project requirements, the weights may be assigned by only the decision maker, the decision maker in conjunction with the practitioner, or by the decision maker along with some or all “empowered” or “collaborating” stakeholders in a group setting. If the project is large and the stakeholders are being involved in assigning the weights, it is possible (and encouraged) to conduct a weighting workshop and consider engaging a trained facilitator to encourage participants to think clearly about the relative importance of different indicators.
Regardless of how many participants, in assigning weights, it is important to understand that the relative value of one indicator versus another is dependent both on the inherent importance of the indicator in its decision context, and its variability across the range of options.
Weighting indicators solely based on an inherent notion of importance while ignoring the variability of the indicator across the range of options is the most common critical mistake when evaluating options with multiple objectives. Box 5.2 provides a simple example of how the variability of an indicator can influence the weight of that indicator.
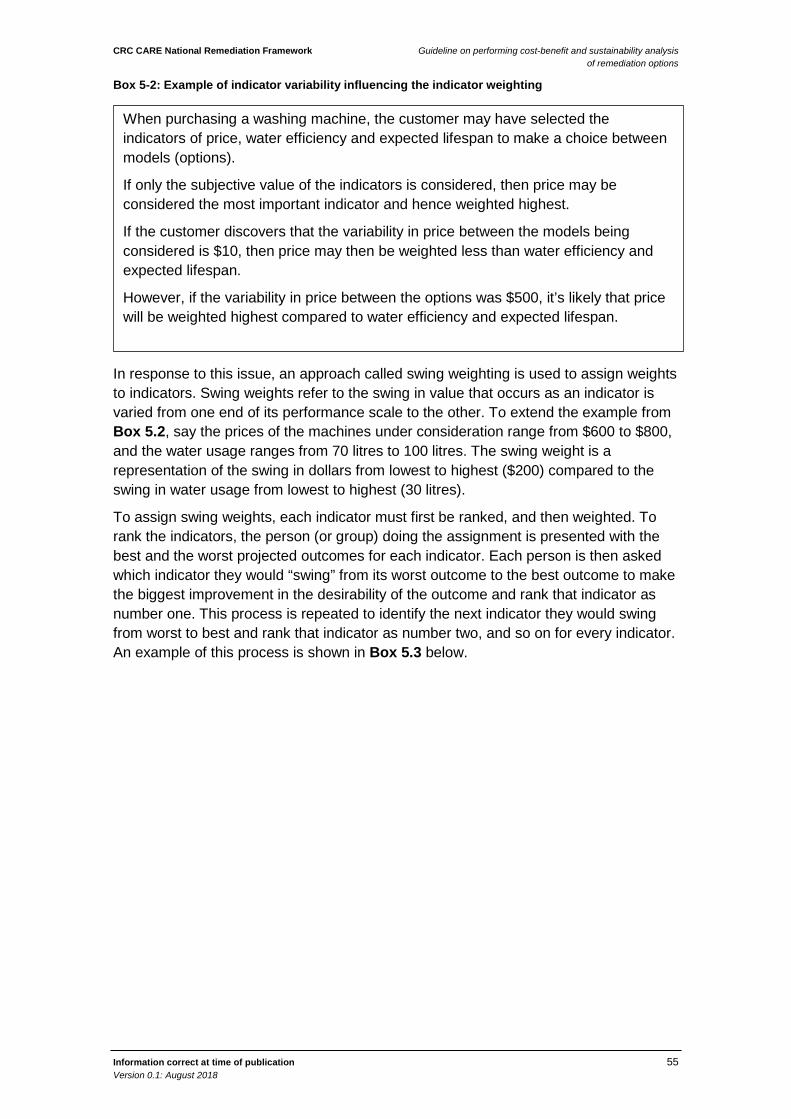
CRC CARE National Remediation Framework Guideline on performing cost-benefit and sustainability analysis of remediation options
Information correct at time of publication 55 Version 0.1: August 2018
Box 5-2: Example of indicator variability influencing the indicator weighting
In response to this issue, an approach called swing weighting is used to assign weights to indicators. Swing weights refer to the swing in value that occurs as an indicator is varied from one end of its performance scale to the other. To extend the example from Box 5.2, say the prices of the machines under consideration range from $600 to $800, and the water usage ranges from 70 litres to 100 litres. The swing weight is a representation of the swing in dollars from lowest to highest ($200) compared to the swing in water usage from lowest to highest (30 litres).
To assign swing weights, each indicator must first be ranked, and then weighted. To rank the indicators, the person (or group) doing the assignment is presented with the best and the worst projected outcomes for each indicator. Each person is then asked which indicator they would “swing” from its worst outcome to the best outcome to make the biggest improvement in the desirability of the outcome and rank that indicator as number one. This process is repeated to identify the next indicator they would swing from worst to best and rank that indicator as number two, and so on for every indicator. An example of this process is shown in Box 5.3 below.
When purchasing a washing machine, the customer may have selected the indicators of price, water efficiency and expected lifespan to make a choice between models (options).
If only the subjective value of the indicators is considered, then price may be considered the most important indicator and hence weighted highest.
If the customer discovers that the variability in price between the models being considered is $10, then price may then be weighted less than water efficiency and expected lifespan.
However, if the variability in price between the options was $500, it’s likely that price will be weighted highest compared to water efficiency and expected lifespan.
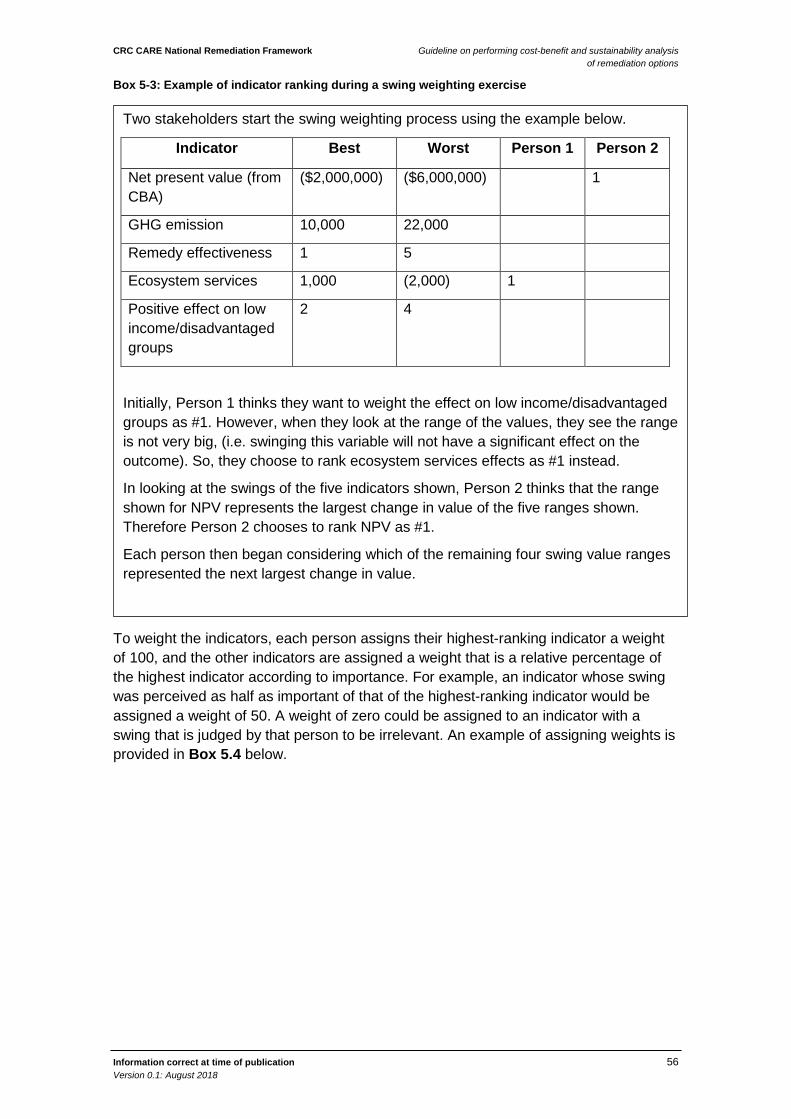
CRC CARE National Remediation Framework Guideline on performing cost-benefit and sustainability analysis of remediation options
Information correct at time of publication 56 Version 0.1: August 2018
Box 5-3: Example of indicator ranking during a swing weighting exercise
To weight the indicators, each person assigns their highest-ranking indicator a weight of 100, and the other indicators are assigned a weight that is a relative percentage of the highest indicator according to importance. For example, an indicator whose swing was perceived as half as important of that of the highest-ranking indicator would be assigned a weight of 50. A weight of zero could be assigned to an indicator with a swing that is judged by that person to be irrelevant. An example of assigning weights is provided in Box 5.4 below.
Two stakeholders start the swing weighting process using the example below.
Indicator Best Worst Person 1 Person 2
Net present value (from CBA)
($2,000,000) ($6,000,000) 1
GHG emission 10,000 22,000
Remedy effectiveness 1 5
Ecosystem services 1,000 (2,000) 1
Positive effect on low income/disadvantaged groups
2 4
Initially, Person 1 thinks they want to weight the effect on low income/disadvantaged groups as #1. However, when they look at the range of the values, they see the range is not very big, (i.e. swinging this variable will not have a significant effect on the outcome). So, they choose to rank ecosystem services effects as #1 instead.
In looking at the swings of the five indicators shown, Person 2 thinks that the range shown for NPV represents the largest change in value of the five ranges shown. Therefore Person 2 chooses to rank NPV as #1.
Each person then began considering which of the remaining four swing value ranges represented the next largest change in value.
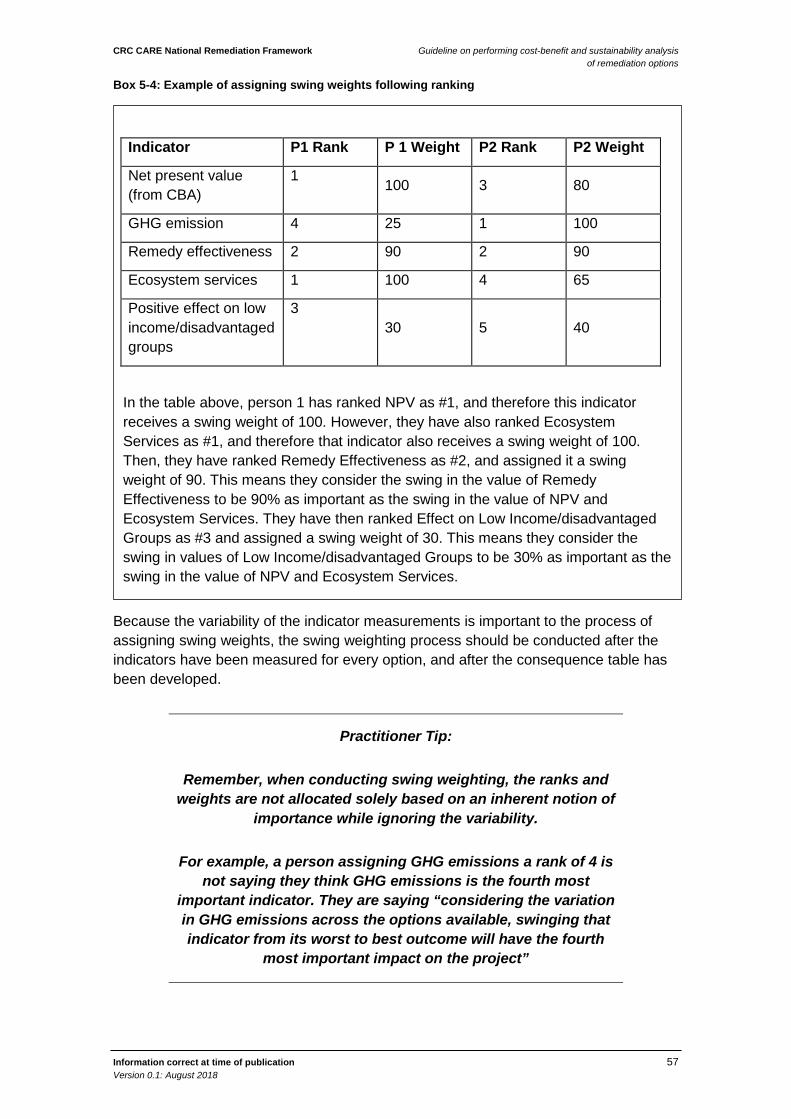
CRC CARE National Remediation Framework Guideline on performing cost-benefit and sustainability analysis of remediation options
Information correct at time of publication 57 Version 0.1: August 2018
Box 5-4: Example of assigning swing weights following ranking
Because the variability of the indicator measurements is important to the process of assigning swing weights, the swing weighting process should be conducted after the indicators have been measured for every option, and after the consequence table has been developed.
Practitioner Tip:
Remember, when conducting swing weighting, the ranks and weights are not allocated solely based on an inherent notion of
importance while ignoring the variability.
For example, a person assigning GHG emissions a rank of 4 is not saying they think GHG emissions is the fourth most
important indicator. They are saying “considering the variation in GHG emissions across the options available, swinging that indicator from its worst to best outcome will have the fourth
most important impact on the project”
Indicator P1 Rank P 1 Weight P2 Rank P2 Weight
Net present value (from CBA)
1 100 3 80
GHG emission 4 25 1 100
Remedy effectiveness 2 90 2 90
Ecosystem services 1 100 4 65
Positive effect on low income/disadvantaged groups
3 30 5 40
In the table above, person 1 has ranked NPV as #1, and therefore this indicator receives a swing weight of 100. However, they have also ranked Ecosystem Services as #1, and therefore that indicator also receives a swing weight of 100. Then, they have ranked Remedy Effectiveness as #2, and assigned it a swing weight of 90. This means they consider the swing in the value of Remedy Effectiveness to be 90% as important as the swing in the value of NPV and Ecosystem Services. They have then ranked Effect on Low Income/disadvantaged Groups as #3 and assigned a swing weight of 30. This means they consider the swing in values of Low Income/disadvantaged Groups to be 30% as important as the swing in the value of NPV and Ecosystem Services.
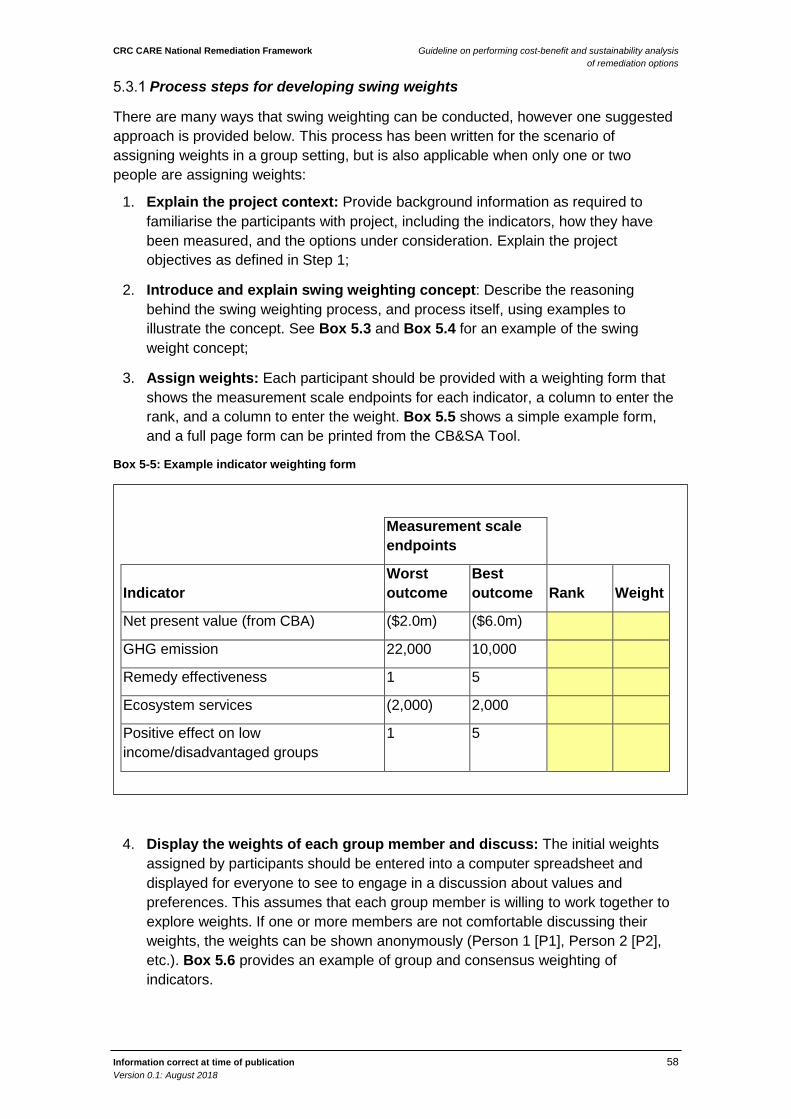
CRC CARE National Remediation Framework Guideline on performing cost-benefit and sustainability analysis of remediation options
Information correct at time of publication 58 Version 0.1: August 2018
Process steps for developing swing weights
There are many ways that swing weighting can be conducted, however one suggested approach is provided below. This process has been written for the scenario of assigning weights in a group setting, but is also applicable when only one or two people are assigning weights:
1. Explain the project context: Provide background information as required to familiarise the participants with project, including the indicators, how they have been measured, and the options under consideration. Explain the project objectives as defined in Step 1;
2. Introduce and explain swing weighting concept: Describe the reasoning behind the swing weighting process, and process itself, using examples to illustrate the concept. See Box 5.3 and Box 5.4 for an example of the swing weight concept;
3. Assign weights: Each participant should be provided with a weighting form that shows the measurement scale endpoints for each indicator, a column to enter the rank, and a column to enter the weight. Box 5.5 shows a simple example form, and a full page form can be printed from the CB&SA Tool.
Box 5-5: Example indicator weighting form
4. Display the weights of each group member and discuss: The initial weights assigned by participants should be entered into a computer spreadsheet and displayed for everyone to see to engage in a discussion about values and preferences. This assumes that each group member is willing to work together to explore weights. If one or more members are not comfortable discussing their weights, the weights can be shown anonymously (Person 1 [P1], Person 2 [P2], etc.). Box 5.6 provides an example of group and consensus weighting of indicators.
Measurement scale endpoints
Indicator Worst outcome
Best outcome Rank Weight
Net present value (from CBA) ($2.0m) ($6.0m)
GHG emission 22,000 10,000
Remedy effectiveness 1 5
Ecosystem services (2,000) 2,000
Positive effect on low income/disadvantaged groups
1 5
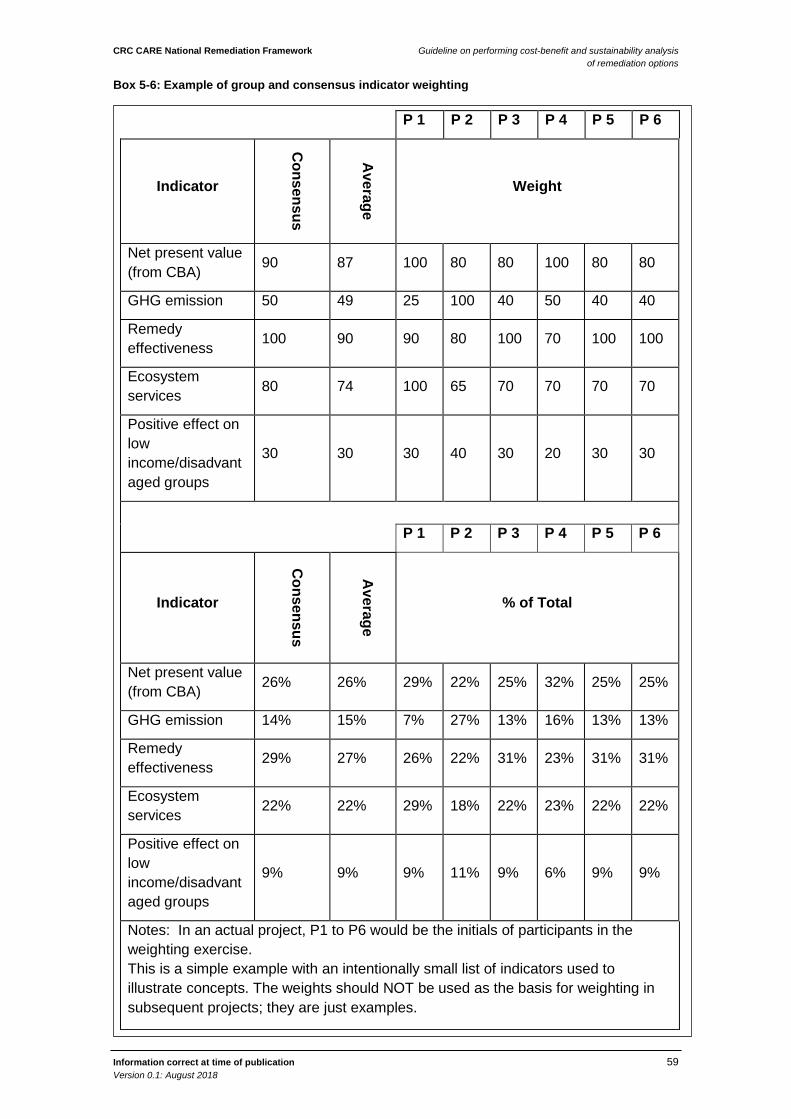
CRC CARE National Remediation Framework Guideline on performing cost-benefit and sustainability analysis of remediation options
Information correct at time of publication 59 Version 0.1: August 2018
Box 5-6: Example of group and consensus indicator weighting
P 1 P 2 P 3 P 4 P 5 P 6
Indicator
Consensus
Average
Weight
Net present value (from CBA) 90 87 100 80 80 100 80 80
GHG emission 50 49 25 100 40 50 40 40
Remedy effectiveness 100 90 90 80 100 70 100 100
Ecosystem services 80 74 100 65 70 70 70 70
Positive effect on low income/disadvantaged groups
30 30 30 40 30 20 30 30
P 1 P 2 P 3 P 4 P 5 P 6
Indicator
Consensus
Average
% of Total
Net present value (from CBA) 26% 26% 29% 22% 25% 32% 25% 25%
GHG emission 14% 15% 7% 27% 13% 16% 13% 13%
Remedy effectiveness 29% 27% 26% 22% 31% 23% 31% 31%
Ecosystem services 22% 22% 29% 18% 22% 23% 22% 22%
Positive effect on low income/disadvantaged groups
9% 9% 9% 11% 9% 6% 9% 9%
Notes: In an actual project, P1 to P6 would be the initials of participants in the weighting exercise. This is a simple example with an intentionally small list of indicators used to illustrate concepts. The weights should NOT be used as the basis for weighting in subsequent projects; they are just examples.
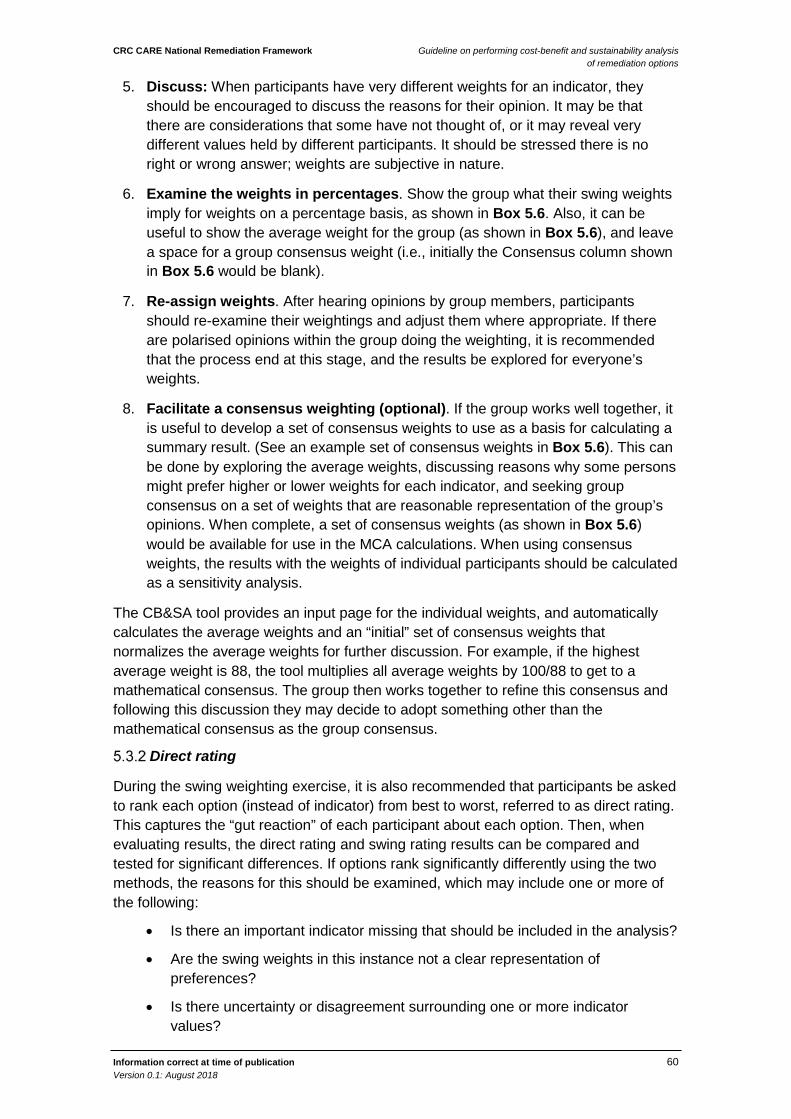
CRC CARE National Remediation Framework Guideline on performing cost-benefit and sustainability analysis of remediation options
Information correct at time of publication 60 Version 0.1: August 2018
5. Discuss: When participants have very different weights for an indicator, they should be encouraged to discuss the reasons for their opinion. It may be that there are considerations that some have not thought of, or it may reveal very different values held by different participants. It should be stressed there is no right or wrong answer; weights are subjective in nature.
6. Examine the weights in percentages. Show the group what their swing weights imply for weights on a percentage basis, as shown in Box 5.6. Also, it can be useful to show the average weight for the group (as shown in Box 5.6), and leave a space for a group consensus weight (i.e., initially the Consensus column shown in Box 5.6 would be blank).
7. Re-assign weights. After hearing opinions by group members, participants should re-examine their weightings and adjust them where appropriate. If there are polarised opinions within the group doing the weighting, it is recommended that the process end at this stage, and the results be explored for everyone’s weights.
8. Facilitate a consensus weighting (optional). If the group works well together, it is useful to develop a set of consensus weights to use as a basis for calculating a summary result. (See an example set of consensus weights in Box 5.6). This can be done by exploring the average weights, discussing reasons why some persons might prefer higher or lower weights for each indicator, and seeking group consensus on a set of weights that are reasonable representation of the group’s opinions. When complete, a set of consensus weights (as shown in Box 5.6) would be available for use in the MCA calculations. When using consensus weights, the results with the weights of individual participants should be calculated as a sensitivity analysis.
The CB&SA tool provides an input page for the individual weights, and automatically calculates the average weights and an “initial” set of consensus weights that normalizes the average weights for further discussion. For example, if the highest average weight is 88, the tool multiplies all average weights by 100/88 to get to a mathematical consensus. The group then works together to refine this consensus and following this discussion they may decide to adopt something other than the mathematical consensus as the group consensus.
Direct rating
During the swing weighting exercise, it is also recommended that participants be asked to rank each option (instead of indicator) from best to worst, referred to as direct rating. This captures the “gut reaction” of each participant about each option. Then, when evaluating results, the direct rating and swing rating results can be compared and tested for significant differences. If options rank significantly differently using the two methods, the reasons for this should be examined, which may include one or more of the following:
• Is there an important indicator missing that should be included in the analysis?
• Are the swing weights in this instance not a clear representation of preferences?
• Is there uncertainty or disagreement surrounding one or more indicator values?
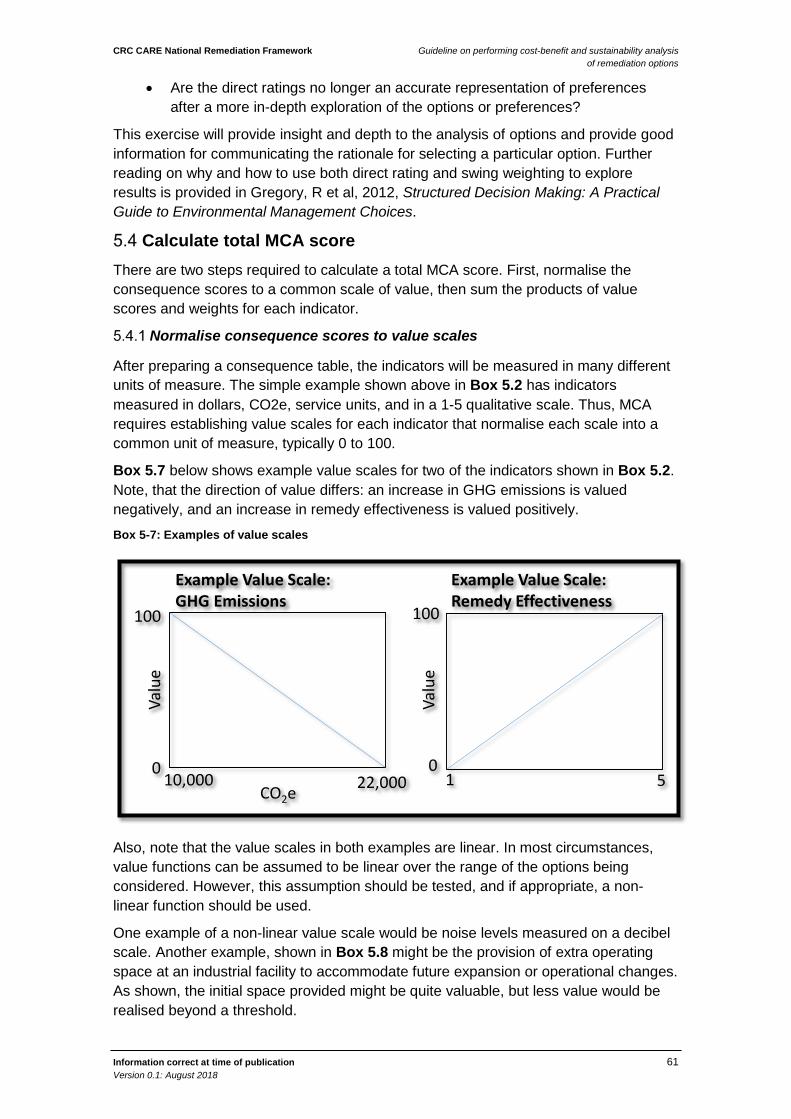
CRC CARE National Remediation Framework Guideline on performing cost-benefit and sustainability analysis of remediation options
Information correct at time of publication 61 Version 0.1: August 2018
• Are the direct ratings no longer an accurate representation of preferences after a more in-depth exploration of the options or preferences?
This exercise will provide insight and depth to the analysis of options and provide good information for communicating the rationale for selecting a particular option. Further reading on why and how to use both direct rating and swing weighting to explore results is provided in Gregory, R et al, 2012, Structured Decision Making: A Practical Guide to Environmental Management Choices.
Calculate total MCA score There are two steps required to calculate a total MCA score. First, normalise the consequence scores to a common scale of value, then sum the products of value scores and weights for each indicator.
Normalise consequence scores to value scales
After preparing a consequence table, the indicators will be measured in many different units of measure. The simple example shown above in Box 5.2 has indicators measured in dollars, CO2e, service units, and in a 1-5 qualitative scale. Thus, MCA requires establishing value scales for each indicator that normalise each scale into a common unit of measure, typically 0 to 100.
Box 5.7 below shows example value scales for two of the indicators shown in Box 5.2. Note, that the direction of value differs: an increase in GHG emissions is valued negatively, and an increase in remedy effectiveness is valued positively.
Box 5-7: Examples of value scales
Also, note that the value scales in both examples are linear. In most circumstances, value functions can be assumed to be linear over the range of the options being considered. However, this assumption should be tested, and if appropriate, a non-linear function should be used.
One example of a non-linear value scale would be noise levels measured on a decibel scale. Another example, shown in Box 5.8 might be the provision of extra operating space at an industrial facility to accommodate future expansion or operational changes. As shown, the initial space provided might be quite valuable, but less value would be realised beyond a threshold.
0 0
100 100
10,000 22,000 1 5
Example Value Scale:GHG Emissions
Example Value Scale:Remedy Effectiveness
Valu
e
Valu
e
CO2e
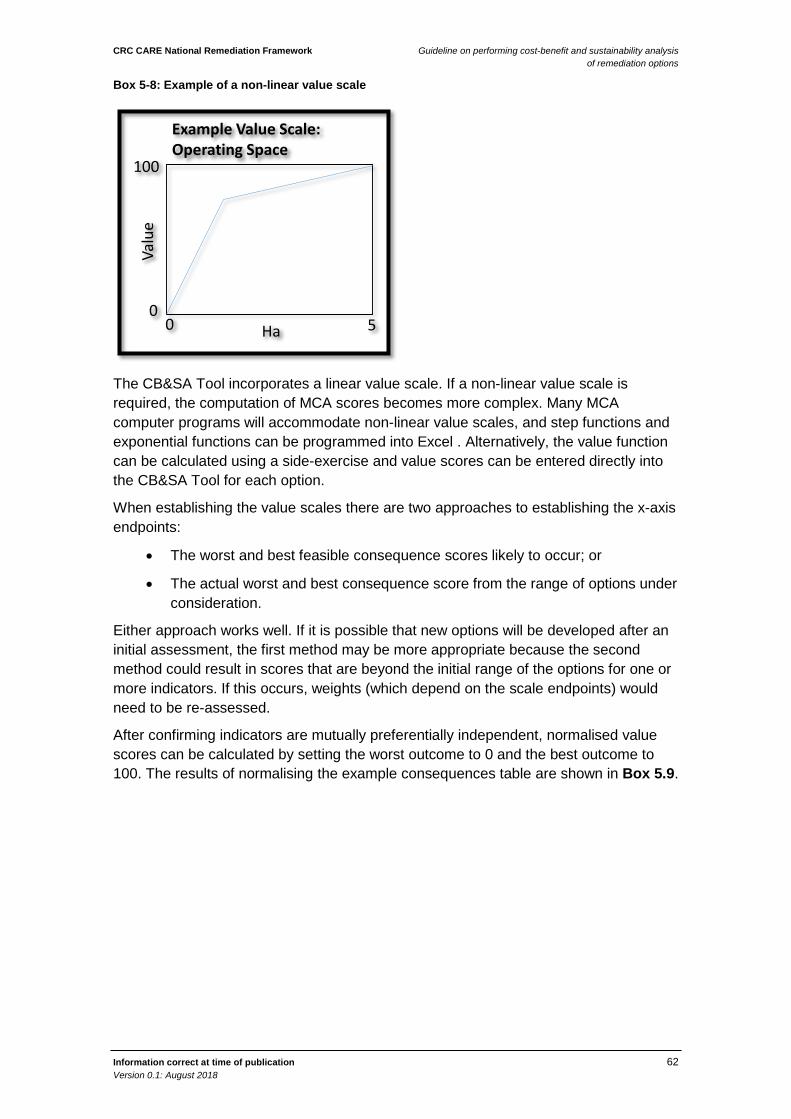
CRC CARE National Remediation Framework Guideline on performing cost-benefit and sustainability analysis of remediation options
Information correct at time of publication 62 Version 0.1: August 2018
Box 5-8: Example of a non-linear value scale
The CB&SA Tool incorporates a linear value scale. If a non-linear value scale is required, the computation of MCA scores becomes more complex. Many MCA computer programs will accommodate non-linear value scales, and step functions and exponential functions can be programmed into Excel . Alternatively, the value function can be calculated using a side-exercise and value scores can be entered directly into the CB&SA Tool for each option.
When establishing the value scales there are two approaches to establishing the x-axis endpoints:
• The worst and best feasible consequence scores likely to occur; or
• The actual worst and best consequence score from the range of options under consideration.
Either approach works well. If it is possible that new options will be developed after an initial assessment, the first method may be more appropriate because the second method could result in scores that are beyond the initial range of the options for one or more indicators. If this occurs, weights (which depend on the scale endpoints) would need to be re-assessed.
After confirming indicators are mutually preferentially independent, normalised value scores can be calculated by setting the worst outcome to 0 and the best outcome to 100. The results of normalising the example consequences table are shown in Box 5.9.
00 5
Example Value Scale:Operating Space
100Va
lue
Ha
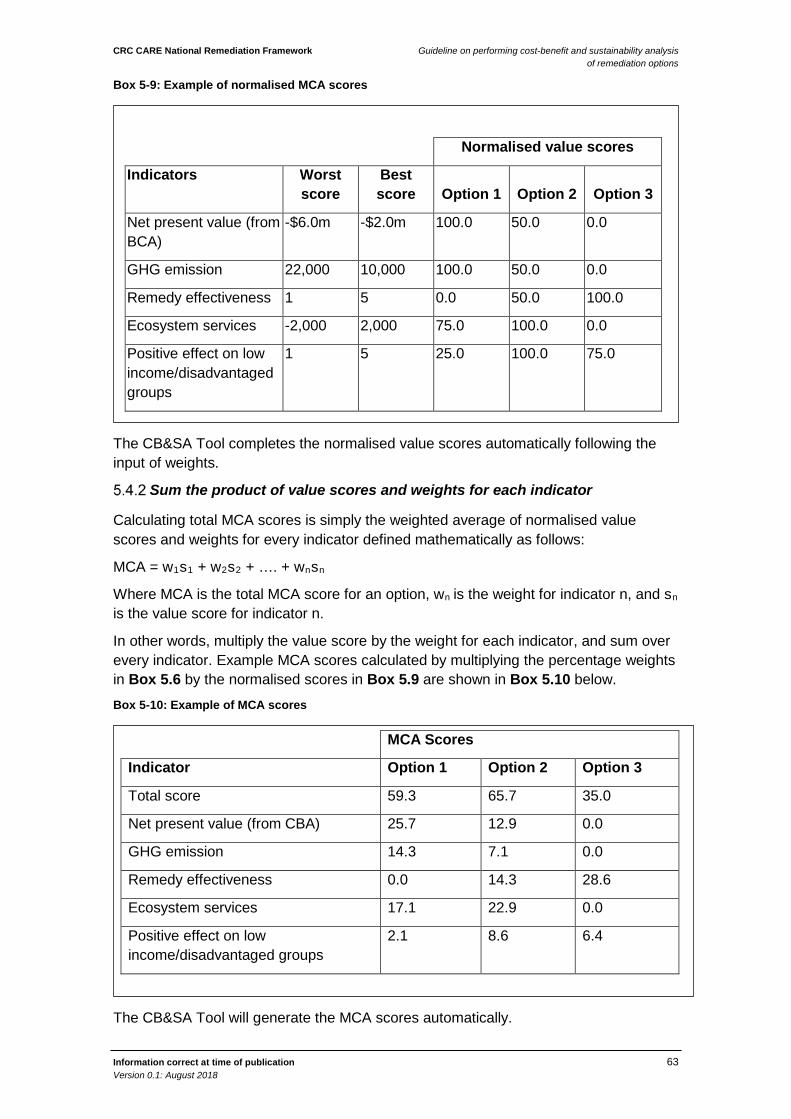
CRC CARE National Remediation Framework Guideline on performing cost-benefit and sustainability analysis of remediation options
Information correct at time of publication 63 Version 0.1: August 2018
Box 5-9: Example of normalised MCA scores
The CB&SA Tool completes the normalised value scores automatically following the input of weights.
Sum the product of value scores and weights for each indicator
Calculating total MCA scores is simply the weighted average of normalised value scores and weights for every indicator defined mathematically as follows:
MCA = w1s1 + w2s2 + …. + wnsn
Where MCA is the total MCA score for an option, wn is the weight for indicator n, and sn is the value score for indicator n.
In other words, multiply the value score by the weight for each indicator, and sum over every indicator. Example MCA scores calculated by multiplying the percentage weights in Box 5.6 by the normalised scores in Box 5.9 are shown in Box 5.10 below.
Box 5-10: Example of MCA scores
The CB&SA Tool will generate the MCA scores automatically.
Normalised value scores
Indicators Worst score
Best score Option 1 Option 2 Option 3
Net present value (from BCA)
-$6.0m -$2.0m 100.0 50.0 0.0
GHG emission 22,000 10,000 100.0 50.0 0.0
Remedy effectiveness 1 5 0.0 50.0 100.0
Ecosystem services -2,000 2,000 75.0 100.0 0.0
Positive effect on low income/disadvantaged groups
1 5 25.0 100.0 75.0
MCA Scores
Indicator Option 1 Option 2 Option 3
Total score 59.3 65.7 35.0
Net present value (from CBA) 25.7 12.9 0.0
GHG emission 14.3 7.1 0.0
Remedy effectiveness 0.0 14.3 28.6
Ecosystem services 17.1 22.9 0.0
Positive effect on low income/disadvantaged groups
2.1 8.6 6.4
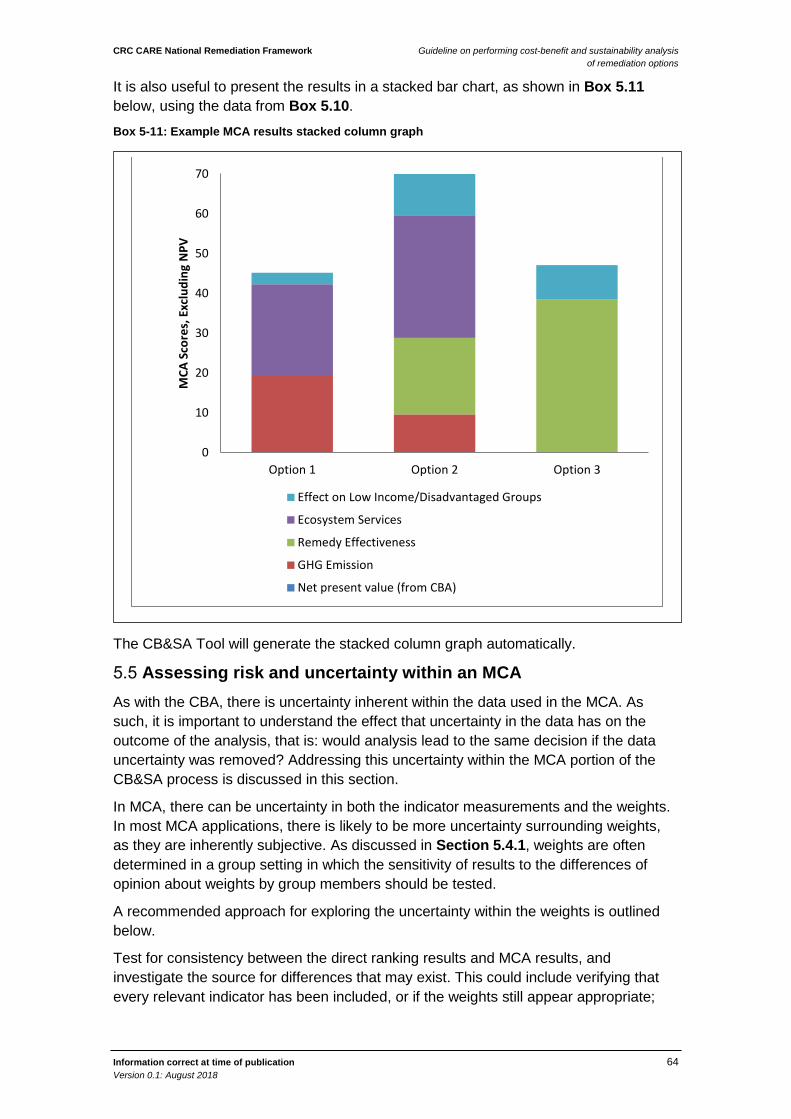
CRC CARE National Remediation Framework Guideline on performing cost-benefit and sustainability analysis of remediation options
Information correct at time of publication 64 Version 0.1: August 2018
It is also useful to present the results in a stacked bar chart, as shown in Box 5.11 below, using the data from Box 5.10.
Box 5-11: Example MCA results stacked column graph
The CB&SA Tool will generate the stacked column graph automatically.
Assessing risk and uncertainty within an MCA As with the CBA, there is uncertainty inherent within the data used in the MCA. As such, it is important to understand the effect that uncertainty in the data has on the outcome of the analysis, that is: would analysis lead to the same decision if the data uncertainty was removed? Addressing this uncertainty within the MCA portion of the CB&SA process is discussed in this section.
In MCA, there can be uncertainty in both the indicator measurements and the weights. In most MCA applications, there is likely to be more uncertainty surrounding weights, as they are inherently subjective. As discussed in Section 5.4.1, weights are often determined in a group setting in which the sensitivity of results to the differences of opinion about weights by group members should be tested.
A recommended approach for exploring the uncertainty within the weights is outlined below.
Test for consistency between the direct ranking results and MCA results, and investigate the source for differences that may exist. This could include verifying that every relevant indicator has been included, or if the weights still appear appropriate;
0
10
20
30
40
50
60
70
Option 1 Option 2 Option 3
MCA
Sco
res,
Exc
ludi
ng N
PV
Effect on Low Income/Disadvantaged Groups
Ecosystem Services
Remedy Effectiveness
GHG Emission
Net present value (from CBA)
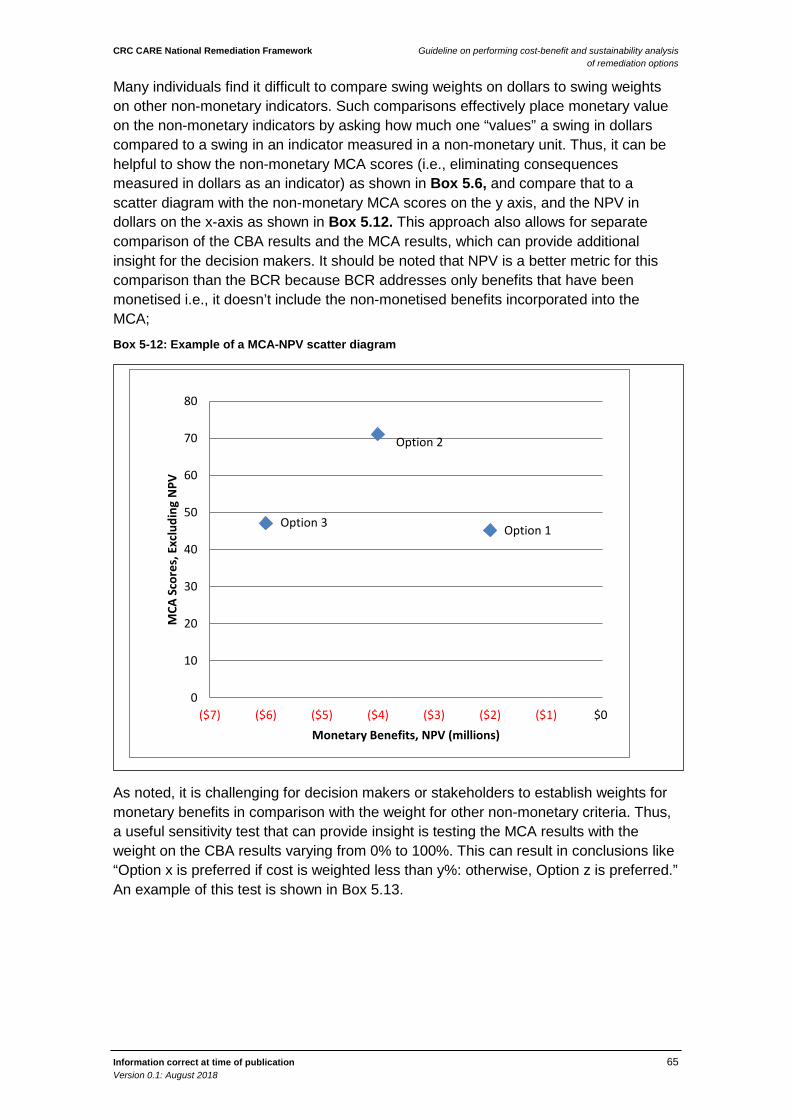
CRC CARE National Remediation Framework Guideline on performing cost-benefit and sustainability analysis of remediation options
Information correct at time of publication 65 Version 0.1: August 2018
Many individuals find it difficult to compare swing weights on dollars to swing weights on other non-monetary indicators. Such comparisons effectively place monetary value on the non-monetary indicators by asking how much one “values” a swing in dollars compared to a swing in an indicator measured in a non-monetary unit. Thus, it can be helpful to show the non-monetary MCA scores (i.e., eliminating consequences measured in dollars as an indicator) as shown in Box 5.6, and compare that to a scatter diagram with the non-monetary MCA scores on the y axis, and the NPV in dollars on the x-axis as shown in Box 5.12. This approach also allows for separate comparison of the CBA results and the MCA results, which can provide additional insight for the decision makers. It should be noted that NPV is a better metric for this comparison than the BCR because BCR addresses only benefits that have been monetised i.e., it doesn’t include the non-monetised benefits incorporated into the MCA;
Box 5-12: Example of a MCA-NPV scatter diagram
As noted, it is challenging for decision makers or stakeholders to establish weights for monetary benefits in comparison with the weight for other non-monetary criteria. Thus, a useful sensitivity test that can provide insight is testing the MCA results with the weight on the CBA results varying from 0% to 100%. This can result in conclusions like “Option x is preferred if cost is weighted less than y%: otherwise, Option z is preferred.” An example of this test is shown in Box 5.13.
Option 1
Option 2
Option 3
0
10
20
30
40
50
60
70
80
($7) ($6) ($5) ($4) ($3) ($2) ($1) $0
MCA
Sco
res,
Exc
ludi
ng N
PV
Monetary Benefits, NPV (millions)
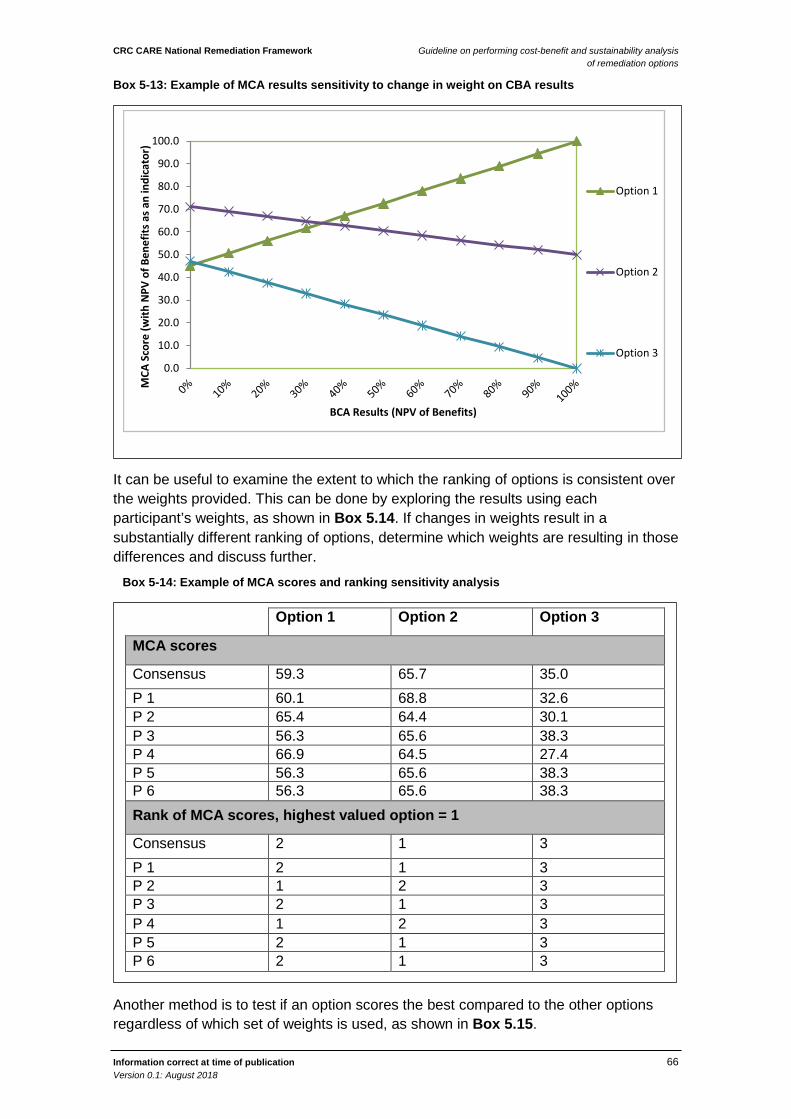
CRC CARE National Remediation Framework Guideline on performing cost-benefit and sustainability analysis of remediation options
Information correct at time of publication 66 Version 0.1: August 2018
Box 5-13: Example of MCA results sensitivity to change in weight on CBA results
It can be useful to examine the extent to which the ranking of options is consistent over the weights provided. This can be done by exploring the results using each participant’s weights, as shown in Box 5.14. If changes in weights result in a substantially different ranking of options, determine which weights are resulting in those differences and discuss further.
Box 5-14: Example of MCA scores and ranking sensitivity analysis
Another method is to test if an option scores the best compared to the other options regardless of which set of weights is used, as shown in Box 5.15.
0.0
10.0
20.0
30.0
40.0
50.0
60.0
70.0
80.0
90.0
100.0M
CA S
core
(with
NPV
of B
enef
its a
s an
indi
cato
r)
BCA Results (NPV of Benefits)
Option 1
Option 2
Option 3
Option 1 Option 2 Option 3
MCA scores
Consensus 59.3 65.7 35.0 P 1 60.1 68.8 32.6 P 2 65.4 64.4 30.1 P 3 56.3 65.6 38.3 P 4 66.9 64.5 27.4 P 5 56.3 65.6 38.3 P 6 56.3 65.6 38.3 Rank of MCA scores, highest valued option = 1
Consensus 2 1 3 P 1 2 1 3 P 2 1 2 3 P 3 2 1 3 P 4 1 2 3 P 5 2 1 3 P 6 2 1 3
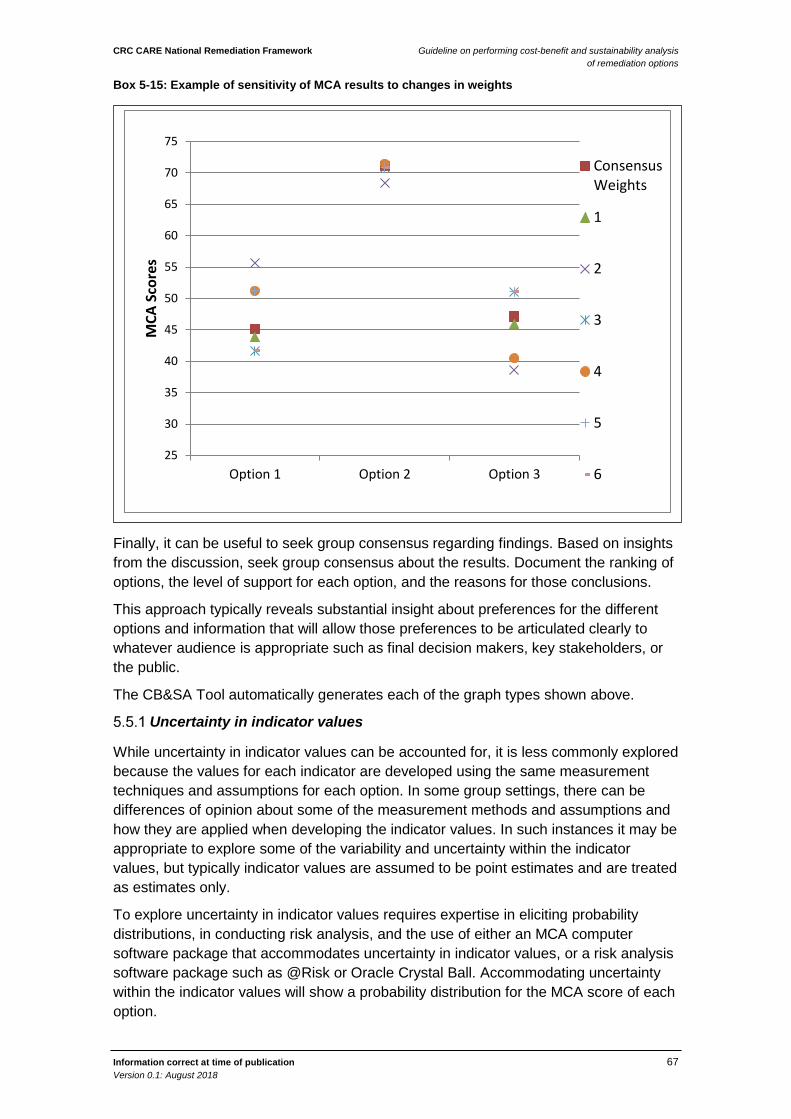
CRC CARE National Remediation Framework Guideline on performing cost-benefit and sustainability analysis of remediation options
Information correct at time of publication 67 Version 0.1: August 2018
Box 5-15: Example of sensitivity of MCA results to changes in weights
Finally, it can be useful to seek group consensus regarding findings. Based on insights from the discussion, seek group consensus about the results. Document the ranking of options, the level of support for each option, and the reasons for those conclusions.
This approach typically reveals substantial insight about preferences for the different options and information that will allow those preferences to be articulated clearly to whatever audience is appropriate such as final decision makers, key stakeholders, or the public.
The CB&SA Tool automatically generates each of the graph types shown above.
Uncertainty in indicator values
While uncertainty in indicator values can be accounted for, it is less commonly explored because the values for each indicator are developed using the same measurement techniques and assumptions for each option. In some group settings, there can be differences of opinion about some of the measurement methods and assumptions and how they are applied when developing the indicator values. In such instances it may be appropriate to explore some of the variability and uncertainty within the indicator values, but typically indicator values are assumed to be point estimates and are treated as estimates only.
To explore uncertainty in indicator values requires expertise in eliciting probability distributions, in conducting risk analysis, and the use of either an MCA computer software package that accommodates uncertainty in indicator values, or a risk analysis software package such as @Risk or Oracle Crystal Ball. Accommodating uncertainty within the indicator values will show a probability distribution for the MCA score of each option.
25
30
35
40
45
50
55
60
65
70
75
Option 1 Option 2 Option 3
MCA
Sco
res
ConsensusWeights
1
2
3
4
5
6
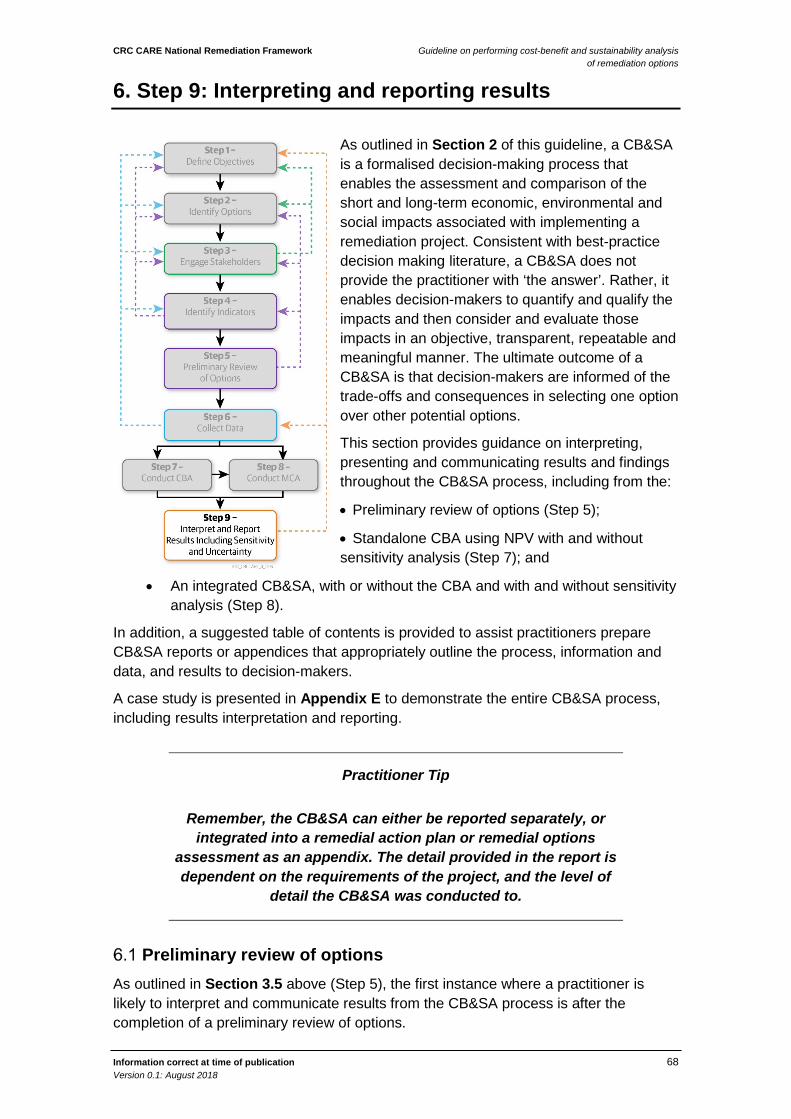
CRC CARE National Remediation Framework Guideline on performing cost-benefit and sustainability analysis of remediation options
Information correct at time of publication 68 Version 0.1: August 2018
6. Step 9: Interpreting and reporting results
As outlined in Section 2 of this guideline, a CB&SA is a formalised decision-making process that enables the assessment and comparison of the short and long-term economic, environmental and social impacts associated with implementing a remediation project. Consistent with best-practice decision making literature, a CB&SA does not provide the practitioner with ‘the answer’. Rather, it enables decision-makers to quantify and qualify the impacts and then consider and evaluate those impacts in an objective, transparent, repeatable and meaningful manner. The ultimate outcome of a CB&SA is that decision-makers are informed of the trade-offs and consequences in selecting one option over other potential options.
This section provides guidance on interpreting, presenting and communicating results and findings throughout the CB&SA process, including from the:
• Preliminary review of options (Step 5);
• Standalone CBA using NPV with and without sensitivity analysis (Step 7); and
• An integrated CB&SA, with or without the CBA and with and without sensitivity analysis (Step 8).
In addition, a suggested table of contents is provided to assist practitioners prepare CB&SA reports or appendices that appropriately outline the process, information and data, and results to decision-makers.
A case study is presented in Appendix E to demonstrate the entire CB&SA process, including results interpretation and reporting.
Practitioner Tip
Remember, the CB&SA can either be reported separately, or integrated into a remedial action plan or remedial options
assessment as an appendix. The detail provided in the report is dependent on the requirements of the project, and the level of
detail the CB&SA was conducted to.
Preliminary review of options As outlined in Section 3.5 above (Step 5), the first instance where a practitioner is likely to interpret and communicate results from the CB&SA process is after the completion of a preliminary review of options.
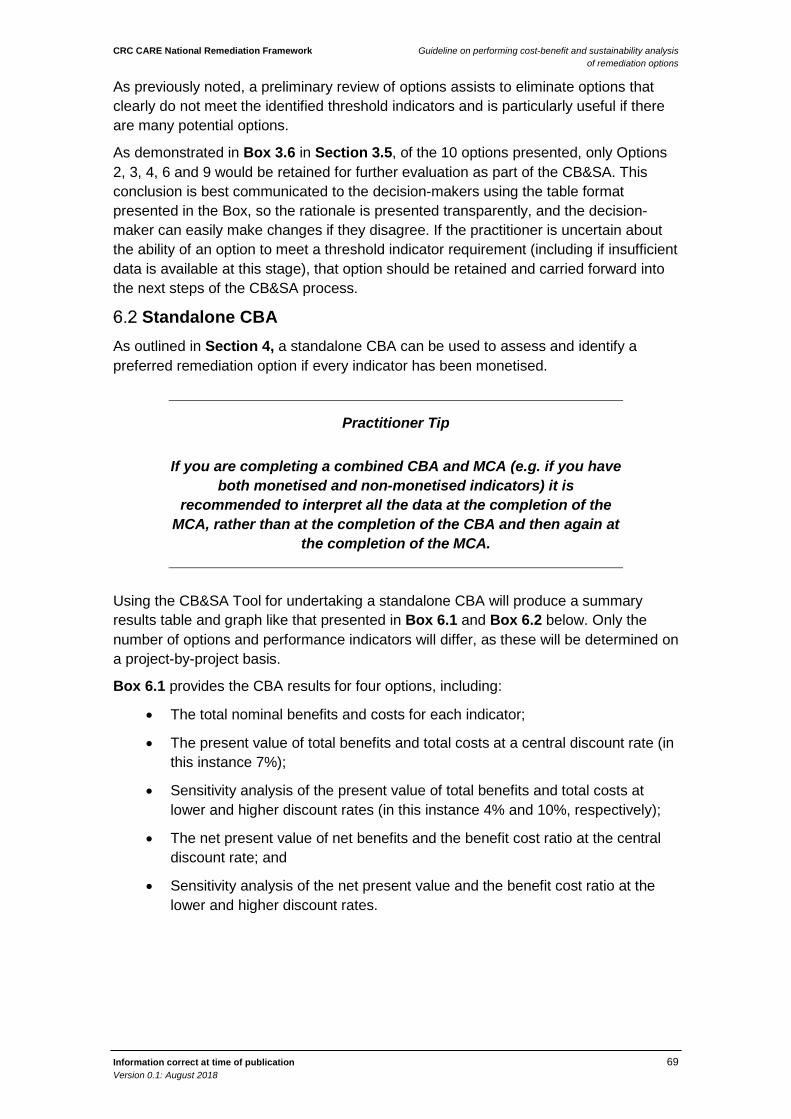
CRC CARE National Remediation Framework Guideline on performing cost-benefit and sustainability analysis of remediation options
Information correct at time of publication 69 Version 0.1: August 2018
As previously noted, a preliminary review of options assists to eliminate options that clearly do not meet the identified threshold indicators and is particularly useful if there are many potential options.
As demonstrated in Box 3.6 in Section 3.5, of the 10 options presented, only Options 2, 3, 4, 6 and 9 would be retained for further evaluation as part of the CB&SA. This conclusion is best communicated to the decision-makers using the table format presented in the Box, so the rationale is presented transparently, and the decision-maker can easily make changes if they disagree. If the practitioner is uncertain about the ability of an option to meet a threshold indicator requirement (including if insufficient data is available at this stage), that option should be retained and carried forward into the next steps of the CB&SA process.
Standalone CBA As outlined in Section 4, a standalone CBA can be used to assess and identify a preferred remediation option if every indicator has been monetised.
Practitioner Tip
If you are completing a combined CBA and MCA (e.g. if you have both monetised and non-monetised indicators) it is
recommended to interpret all the data at the completion of the MCA, rather than at the completion of the CBA and then again at
the completion of the MCA.
Using the CB&SA Tool for undertaking a standalone CBA will produce a summary results table and graph like that presented in Box 6.1 and Box 6.2 below. Only the number of options and performance indicators will differ, as these will be determined on a project-by-project basis.
Box 6.1 provides the CBA results for four options, including:
• The total nominal benefits and costs for each indicator;
• The present value of total benefits and total costs at a central discount rate (in this instance 7%);
• Sensitivity analysis of the present value of total benefits and total costs at lower and higher discount rates (in this instance 4% and 10%, respectively);
• The net present value of net benefits and the benefit cost ratio at the central discount rate; and
• Sensitivity analysis of the net present value and the benefit cost ratio at the lower and higher discount rates.
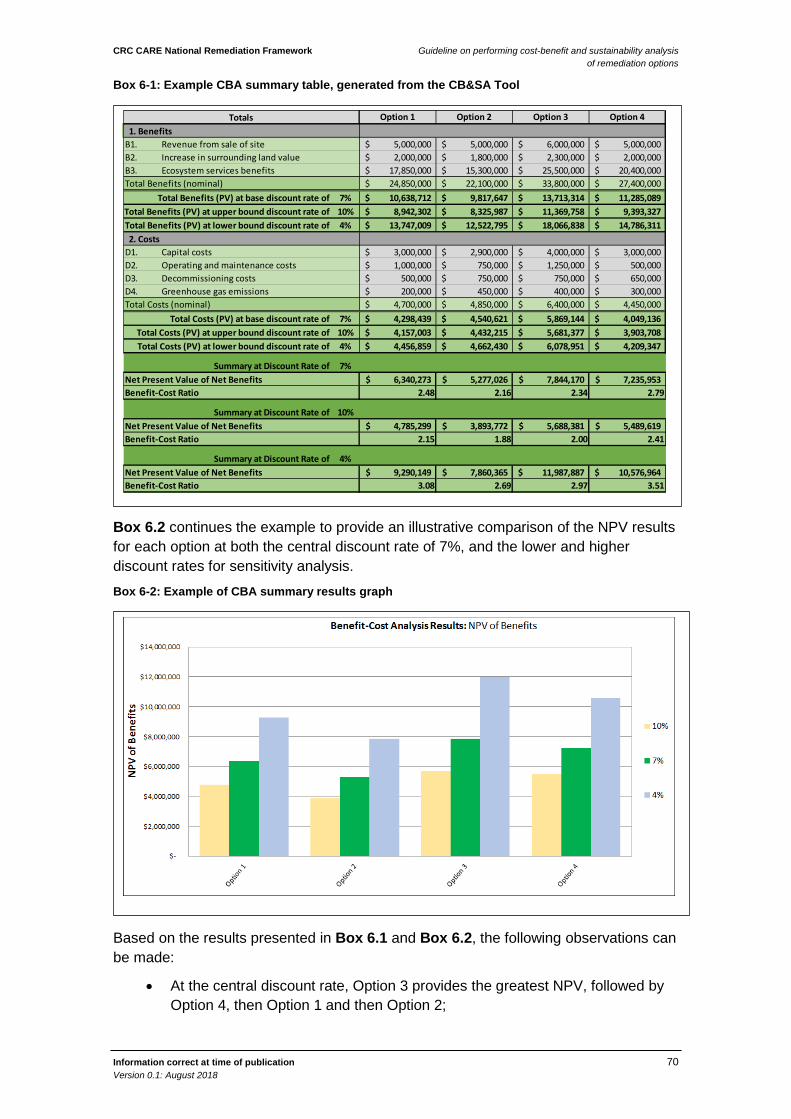
CRC CARE National Remediation Framework Guideline on performing cost-benefit and sustainability analysis of remediation options
Information correct at time of publication 70 Version 0.1: August 2018
Box 6-1: Example CBA summary table, generated from the CB&SA Tool
Box 6.2 continues the example to provide an illustrative comparison of the NPV results for each option at both the central discount rate of 7%, and the lower and higher discount rates for sensitivity analysis.
Box 6-2: Example of CBA summary results graph
Based on the results presented in Box 6.1 and Box 6.2, the following observations can be made:
• At the central discount rate, Option 3 provides the greatest NPV, followed by Option 4, then Option 1 and then Option 2;
Option 1 Option 2 Option 3 Option 4Totals 1. BenefitsB1. Revenue from sale of site 5,000,000$ 5,000,000$ 6,000,000$ 5,000,000$ B2. Increase in surrounding land value 2,000,000$ 1,800,000$ 2,300,000$ 2,000,000$ B3. Ecosystem services benefits 17,850,000$ 15,300,000$ 25,500,000$ 20,400,000$
24,850,000$ 22,100,000$ 33,800,000$ 27,400,000$ 7% 10,638,712$ 9,817,647$ 13,713,314$ 11,285,089$ 10% 8,942,302$ 8,325,987$ 11,369,758$ 9,393,327$ 4% 13,747,009$ 12,522,795$ 18,066,838$ 14,786,311$
2. CostsD1. Capital costs 3,000,000$ 2,900,000$ 4,000,000$ 3,000,000$ D2. Operating and maintenance costs 1,000,000$ 750,000$ 1,250,000$ 500,000$ D3. Decommissioning costs 500,000$ 750,000$ 750,000$ 650,000$ D4. Greenhouse gas emissions 200,000$ 450,000$ 400,000$ 300,000$
4,700,000$ 4,850,000$ 6,400,000$ 4,450,000$ 7% 4,298,439$ 4,540,621$ 5,869,144$ 4,049,136$ 10% 4,157,003$ 4,432,215$ 5,681,377$ 3,903,708$ 4% 4,456,859$ 4,662,430$ 6,078,951$ 4,209,347$
7%Net Present Value of Net Benefits 6,340,273$ 5,277,026$ 7,844,170$ 7,235,953$ Benefit-Cost Ratio 2.48 2.16 2.34 2.79
10%Net Present Value of Net Benefits 4,785,299$ 3,893,772$ 5,688,381$ 5,489,619$ Benefit-Cost Ratio 2.15 1.88 2.00 2.41
4%Net Present Value of Net Benefits 9,290,149$ 7,860,365$ 11,987,887$ 10,576,964$ Benefit-Cost Ratio 3.08 2.69 2.97 3.51
Summary at Discount Rate of
Total Costs (PV) at base discount rate ofTotal Costs (PV) at upper bound discount rate ofTotal Costs (PV) at lower bound discount rate of
Summary at Discount Rate of
Summary at Discount Rate of
Total Benefits (nominal)
Total Benefits (PV) at upper bound discount rate ofTotal Benefits (PV) at lower bound discount rate of
Total Costs (nominal)
Total Benefits (PV) at base discount rate of

CRC CARE National Remediation Framework Guideline on performing cost-benefit and sustainability analysis of remediation options
Information correct at time of publication 71 Version 0.1: August 2018
• At the lower and the higher discount rate, Option 3 also provides the highest NPV, indicating that the result at the central discount rate is not sensitive to a change in discount rate; and
• Based on the NPV, Option 3 would be considered the preferred option.
However, Option 4 has a higher BCR than Option 3, reflective of it providing a marginally lower NPV than Option 3 but at a significantly reduced cost ($1.95 million less).
This discrepancy between the NPV and BCR results is a prompt for the practitioner to re-examine the project objectives and the ability of each option to meet them. If, following reflection, it is considered that each option equally meets the desired objectives, then the practitioner may deem that the additional $1.95 million to implement Option 3 is not warranted, despite it resulting in a superior NPV. In such an instance, Option 4 may be deemed the preferred option. Alternatively, the practitioner may consider that the additional benefits that will result from Option 3 justify the additional expenditure, and Option 3 is retained as the preferred option.
Practitioner Tip
This example reinforces the concept that the CB&SA process does not replace sound judgement on the part of the practitioner
and decision maker and will not provide ‘the answer’.
Rather the CB&SA process enables an objective, transparent, repeatable and meaningful evaluation to help guide and inform
the decision-making process.
Further exploring the above example, the selection of Option 3 as the preferred option may change if the decision-maker suddenly decided they had a stated project budget. For example, if the project budget for implementing a remedial option is $5 million then Option 3 is no longer the preferred option, as the total nominal cost of implementing Option 3 is above the project budget. The other three options have total nominal costs below the project budget.
Practitioner Tip
This example reinforces the flexible and iterative nature of the CB&SA process. If the budget constraint had been present at the beginning of the process, it could have been included as a
threshold or performance indicator. However, in this case it was added at the end of the process, and so the new information was
simply slotted into the process
In this scenario, excluding Option 3, the following observations can be made:
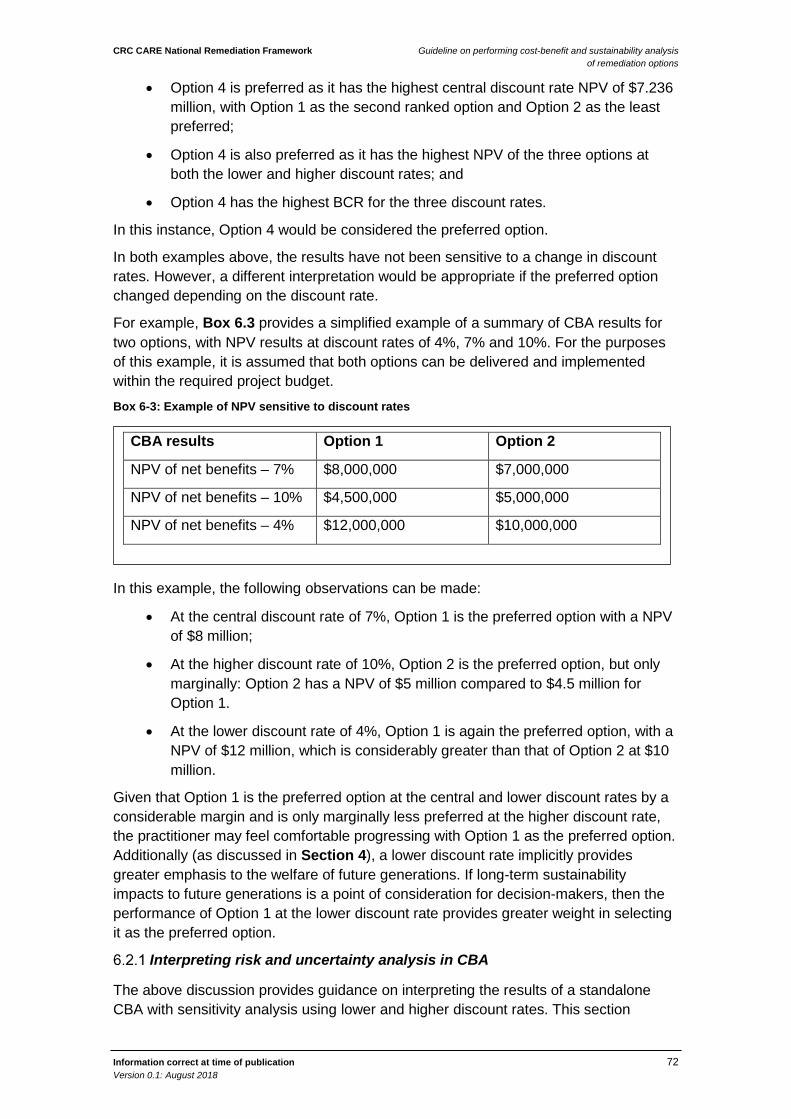
CRC CARE National Remediation Framework Guideline on performing cost-benefit and sustainability analysis of remediation options
Information correct at time of publication 72 Version 0.1: August 2018
• Option 4 is preferred as it has the highest central discount rate NPV of $7.236 million, with Option 1 as the second ranked option and Option 2 as the least preferred;
• Option 4 is also preferred as it has the highest NPV of the three options at both the lower and higher discount rates; and
• Option 4 has the highest BCR for the three discount rates.
In this instance, Option 4 would be considered the preferred option.
In both examples above, the results have not been sensitive to a change in discount rates. However, a different interpretation would be appropriate if the preferred option changed depending on the discount rate.
For example, Box 6.3 provides a simplified example of a summary of CBA results for two options, with NPV results at discount rates of 4%, 7% and 10%. For the purposes of this example, it is assumed that both options can be delivered and implemented within the required project budget.
Box 6-3: Example of NPV sensitive to discount rates
In this example, the following observations can be made:
• At the central discount rate of 7%, Option 1 is the preferred option with a NPV of $8 million;
• At the higher discount rate of 10%, Option 2 is the preferred option, but only marginally: Option 2 has a NPV of $5 million compared to $4.5 million for Option 1.
• At the lower discount rate of 4%, Option 1 is again the preferred option, with a NPV of $12 million, which is considerably greater than that of Option 2 at $10 million.
Given that Option 1 is the preferred option at the central and lower discount rates by a considerable margin and is only marginally less preferred at the higher discount rate, the practitioner may feel comfortable progressing with Option 1 as the preferred option. Additionally (as discussed in Section 4), a lower discount rate implicitly provides greater emphasis to the welfare of future generations. If long-term sustainability impacts to future generations is a point of consideration for decision-makers, then the performance of Option 1 at the lower discount rate provides greater weight in selecting it as the preferred option.
Interpreting risk and uncertainty analysis in CBA
The above discussion provides guidance on interpreting the results of a standalone CBA with sensitivity analysis using lower and higher discount rates. This section
CBA results Option 1 Option 2
NPV of net benefits – 7% $8,000,000 $7,000,000
NPV of net benefits – 10% $4,500,000 $5,000,000
NPV of net benefits – 4% $12,000,000 $10,000,000
CRC CARE National Remediation Framework Guideline on performing cost-benefit and sustainability analysis of remediation options
Information correct at time of publication 73 Version 0.1: August 2018
provides a discussion on capturing further sensitivity analysis or scenario analysis in the option selection decision.
As outlined in Section 4.5.1, sensitivity analysis can be used to assess risk by assessing which indicators significantly affect the central NPV. One approach, as outlined in Box 4.5, is to move an individual indicator to a pessimistic value, while holding the other variables constant, to determine how important that indicator is to the overall result. In this example from Box 4.5, the sensitivity analysis shows that there is a risk that a material change in disposal costs and/or quantity of soil to be disposed of may result in an alternative option being preferred. This result is a prompt for the practitioner to re-examine the reliability and magnitude of the estimates of disposal costs and quantities of soil requiring disposal. If the estimates are updated, these new estimates should be used to re-run the CB&SA results table, and the results re-analysed to see if a different option is now preferred. Regardless of the outcome, the results of the sensitivity analysis and the subsequent updated indicator estimates should be included in the summary report along with the appropriate recommendation(s), so that the risks and likelihood are adequately communicated to the decision maker.
As outlined in Section 4.4.2, scenario analysis is a process of looking at the consequences of various possible states of the world or future scenarios and the potential impacts on the viability and selection of a preferred option. As demonstrated in the examples presented in Box 4.6, the practitioner should assess if there are major technical, economic, social or regulatory uncertainties upon which the success of one particular option depends, and whether these may be influenced by elements beyond their control. One way to capture and report on these scenarios is to run “thought experiments” and assume that each such scenario has come to pass. The practitioner could then choose to document the anticipated impact that scenario would have on the implementation of each option, or perhaps rank how each option may perform in that scenario using a qualitative scale. In this way, the uncertainty that such scenarios present are clearly documented and articulated to the decision maker.
Practitioner Tip
If the preferred option has been identified as particularly sensitive to a certain scenario, then the practitioner could consider working
mitigation measures into the implementation of the option. Examples of this include negotiating with the remediation contractor for fixed rates per tonne to mitigate the scenario where treatment costs rise
unexpectedly or arranging for additional time and budget to engage in community consultation and relationship building to mitigate the
scenario where the social licence to operate is lost.
Integrated CB&SA As outlined in Section 5, the MCA is used to integrate monetised and non-monetised indicators. If a practitioner is using the CB&SA Tool to incorporate the results from a CBA into an MCA, they will be presented with a summary results table and graph like Box 5.10 and Box 5.11 in Section 5.
CRC CARE National Remediation Framework Guideline on performing cost-benefit and sustainability analysis of remediation options
Information correct at time of publication 74 Version 0.1: August 2018
Based on the example data and assumed weightings, the following observations can be made:
• Box 5.10 demonstrates that Option 2 is the preferred option with a total weighted score of 65.8, followed by Option 1 and then Option 3;
• Box 5.11 provides an illustrative breakdown of how each option scored against each indicator, providing the practitioner with additional insights into the results. For example, Option 2 scored well on the ecosystem services indicator, and moderately well against net present value and remedy effectiveness indicators.
If no further analysis or investigation was undertaken, Option 2 would be the preferred option.
As noted in Section 5, industry experience has shown that many people and stakeholder groups find it difficult to establish relative, comparative weights for monetised results (e.g. the NPV indicator) against other indicators measured using scales other than dollars. To address this, the practitioner can weigh the non-monetary indicators only, and prepare a chart like the example shown in Box 5.12.
In this example, the following observations can be made:
• Option 1 has the best NPV benefit result (i.e., the least negative); but
• Option 2 has higher non-monetary value but $2 million lower NPV benefits.
Thus, in this example the decision maker is presented with a question: “Is it worth more than $2 million to achieve the added non-monetary benefits of Option 2?” . The results shown in Box 5.10 and Box 5.11 provide additional information to the decision maker to clarify how much extra non-monetary value could be achieved by Option 2.
Practitioner Tip:
Much like the CBA in Section 6.2, this example reinforces the concept that the CB&SA process does not replace sound
judgement on the part of the practitioner and decision maker and will not provide ‘the answer’. Rather the CB&SA process enables an objective, transparent, repeatable and meaningful
evaluation to help guide and inform the decision-making process.
Interpreting the risk and uncertainty analysis in MCA
As outlined in Section 5, there are a series of sensitivity tests that are recommended to gain insight into the effect of risk and uncertainty on the CB&SA outcome. Tests and analyses that should be considered after calculating an initial CB&SA outcome include the following:
• Test MCA results with CBA sensitivity test results;
• Consider sensitivity to uncertainty in MCA scores;
• Compare direct rating results to MCA results; and
CRC CARE National Remediation Framework Guideline on performing cost-benefit and sustainability analysis of remediation options
Information correct at time of publication 75 Version 0.1: August 2018
• Explore sensitivity of results to changes in weights.
The following table provides a description of some of the tests that can be carried out.
Test Description
Test MCA results with CBA sensitivity test results
As discussed in Section 6.2.1, there are several techniques available to address risk and uncertainty in CBA results. After those tests, the effect of uncertainty on the CBA results can be tested in the MCA model by allowing the NPV value to vary from its highest to lowest value predicted by incorporating the uncertainty
Consider sensitivity to uncertainty in MCA scores
It should be noted that the clear majority of MCA analyses do not conduct tests regarding uncertainty in MCA scores. As noted in Section 5.6.1, this may be because the values for each indicator are developed using the same measurement techniques and assumptions for each option. It is much more common to explore the effect of uncertainty in MCA weights (discussed below).
Like the CBA, there is typically uncertainty in the MCA scores presented in a consequence table. Similar methods to those suggested in Section 6.2.1 (testing pessimistic values, scenario analysis) can be applied to the MCA scores and the MCA calculations conducted on different sets of MCA scores to explore the extent to which results might differ once uncertainty in MCA scores is considered.
Compare direct rating results to MCA results
Section 5.4.2 describes direct rating of options. This is a simple ranking of options from best to worst which captures the “gut reaction” of each stakeholder or decision maker about each option. After conducting an MCA evaluation, the results should be compared to the results of a direct rating exercise to ascertain if the results align. If so, the MCA results align with high-level expectations of how much each option is preferred. If not and the options rank significantly differently using the two methods, the reasons for this should be examined, which may include one or more of the following:
• Is there an important indicator missing that should be included in the analysis?
• Are the swing weights in this instance not a clear representation of preferences?
• Is there uncertainty or disagreement surrounding one or more indicator values?
• Are the direct ratings no longer an accurate representation of preferences after a more in-depth exploration of the options or preferences?
It’s possible that the answers to these questions may require reformulating the MCA analysis. At a minimum, the results will
CRC CARE National Remediation Framework Guideline on performing cost-benefit and sustainability analysis of remediation options
Information correct at time of publication 76 Version 0.1: August 2018
provide insight and depth to the analysis of options and provide good information for communicating the rationale for selecting an option.
Explore sensitivity of results to changes in weights
As discussed in Section 5.6, there will be uncertainty in weights because they are inherently subjective. Thus, it is useful to test the extent to which the ranking of options is affected by differences in weights. This can be done by varying weights selectively, or by exploring the results using the weights of each person that provided weights as part of the MCA analysis (i.e., a group of analysts, stakeholders, or decision makers). Two ways of showing these comparisons are shown in Box 5.14 and Box 5.15.
As an example of how to interpret weighting sensitivity results, see the example results shown in the Box 5.14. From this table, Option 2 may be inferred to be preferred, both from the consensus weights and by 4 of the 6 individuals in the group: two of the group preferred Option 1, but just barely over Option 2.
Box 5.15 shows these sensitivity results in another way. These two graphs can help gain consensus for a recommendation from a group: persons whose ranking of options may differ from others can explain the basis for their opinions. Perhaps there is something that can be done during implementation to address those opinions or concerns. The discussion can also lead to suggestions for hybrid options that may result in an outcome that is preferable to the initial options developed. After assessing those results, if changes in weights result in a substantially different ranking of options, determine which weights are resulting in those differences and discuss further.
Another useful test is to assess the extent to which the weight placed on the CBA results versus the non-monetary indicators affects the results. This can be done by testing the MCA results with the weight on the CBA results varying from 0% to 100%, as shown in Figure 5. In that example, Option 2 is preferred up to a weight on CBA results of about 35%. For weights on the CBA greater than that threshold Option 1 is preferred. In this instance the practitioner can investigate the weighting of the CBA further, to determine if it is plausible that the weighting of the CBA may vary across the threshold. If it does, careful consideration should be given to the weight eventually applied to the CBA.
CRC CARE National Remediation Framework Guideline on performing cost-benefit and sustainability analysis of remediation options
Information correct at time of publication 77 Version 0.1: August 2018
Practitioner Tip
If this sensitivity analysis indicates the CBA indicator is significantly influential in the outcome of the MCA, then further
investigation of the risk and uncertainty in the CBA data (as outlined in Section 5.2.1 above) can be undertaken at this stage.
Reporting the findings The final stage in the CB&SA process is to write up the analysis and prepare recommendations. The reasons for a recommendation should be clearly set out. It is important to highlight the data, information sources, and key assumptions used in estimating the monetised costs and benefits and scoring the non-monetised performance indicators. Ideally, the critical constraints and assumptions that have impacted the CB&SA should be clearly stated in the report. The detailed analysis of each option including the full list of assumptions may be included in an appendix or supplementary report depending on their scale and complexity. The report is designed to document and increase the transparency of the process. It is important that sufficient detail be provided to allow the results to be replicated by an interested reader.
The ultimate objective of the CB&SA report should be for practitioners to provide a recommendation to decision-makers, supported by evidence, robust analysis and clear assumptions to enable an objective and transparent decision.
A suggested table of contents is:
• Executive summary outlining:
- Background to the CB&SA – why was it undertaken;
- Objectives, of both the remediation project and the CB&SA process;
- Project description;
- Critical assumptions; and
- Key results and recommendation(s).
• Project overview including description, details and overview of site;
• Objectives of the CB&SA and remediation project;
• Overview of remediation options considered;
• Key stakeholders and role and input in CB&SA;
• Key constraints including relevant threshold indicators;
• Preliminary review of options, including rationale for discarding options;
• Performance indicators assessed;
• Information and data collected;
• Assessment methods used;
• CB&SA results outlining:
- Summary of results in a table;
CRC CARE National Remediation Framework Guideline on performing cost-benefit and sustainability analysis of remediation options
Information correct at time of publication 78 Version 0.1: August 2018
- The discount rate used;
- NPV calculations;
- Consequence table;
- Weightings (if used, and rationale if not used);
- MCA results (tabular and stacked bar chart)
- Sensitivity analysis; and
- Key assumptions underpinning the analysis.
• Analysis and comparison of options and confirmation of preferred option, likely in a discussion-style format;
• Other important information relevant to the CB&SA; and
• Conclusion and recommendations, including:
- Summary of the findings
- Key assumptions used in reaching conclusions
- Outline of uncertainty in results and limitations in analysis;
- Clear recommendation and identification of preferred option; and
- Recommendation for further analysis (if applicable).

CRC CARE National Remediation Framework Guideline on performing cost-benefit and sustainability analysis of remediation options
Information correct at time of publication 79 Version 0.1: August 2018
Appendix A – Checklist of steps and key outcomes
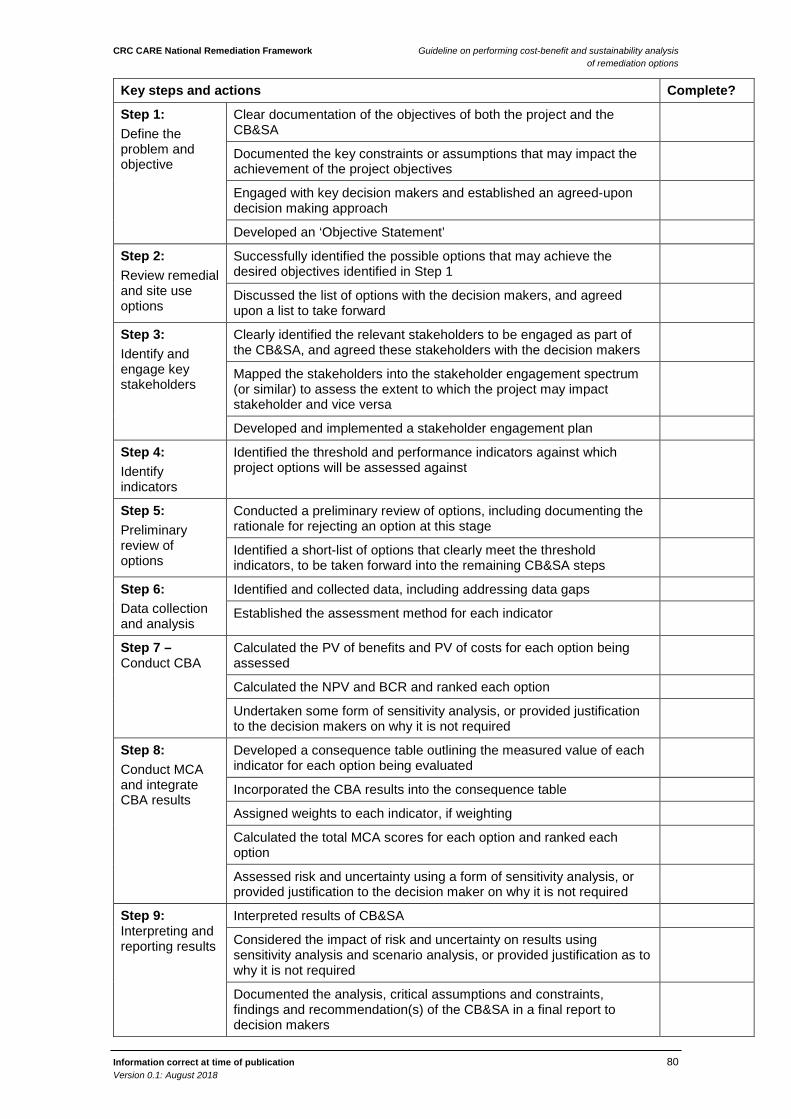
CRC CARE National Remediation Framework Guideline on performing cost-benefit and sustainability analysis of remediation options
Information correct at time of publication 80 Version 0.1: August 2018
Key steps and actions Complete?
Step 1: Define the problem and objective
Clear documentation of the objectives of both the project and the CB&SA
Documented the key constraints or assumptions that may impact the achievement of the project objectives
Engaged with key decision makers and established an agreed-upon decision making approach
Developed an ‘Objective Statement’
Step 2: Review remedial and site use options
Successfully identified the possible options that may achieve the desired objectives identified in Step 1
Discussed the list of options with the decision makers, and agreed upon a list to take forward
Step 3: Identify and engage key stakeholders
Clearly identified the relevant stakeholders to be engaged as part of the CB&SA, and agreed these stakeholders with the decision makers
Mapped the stakeholders into the stakeholder engagement spectrum (or similar) to assess the extent to which the project may impact stakeholder and vice versa
Developed and implemented a stakeholder engagement plan
Step 4: Identify indicators
Identified the threshold and performance indicators against which project options will be assessed against
Step 5: Preliminary review of options
Conducted a preliminary review of options, including documenting the rationale for rejecting an option at this stage
Identified a short-list of options that clearly meet the threshold indicators, to be taken forward into the remaining CB&SA steps
Step 6: Data collection and analysis
Identified and collected data, including addressing data gaps
Established the assessment method for each indicator
Step 7 – Conduct CBA
Calculated the PV of benefits and PV of costs for each option being assessed
Calculated the NPV and BCR and ranked each option
Undertaken some form of sensitivity analysis, or provided justification to the decision makers on why it is not required
Step 8: Conduct MCA and integrate CBA results
Developed a consequence table outlining the measured value of each indicator for each option being evaluated
Incorporated the CBA results into the consequence table
Assigned weights to each indicator, if weighting
Calculated the total MCA scores for each option and ranked each option
Assessed risk and uncertainty using a form of sensitivity analysis, or provided justification to the decision maker on why it is not required
Step 9: Interpreting and reporting results
Interpreted results of CB&SA
Considered the impact of risk and uncertainty on results using sensitivity analysis and scenario analysis, or provided justification as to why it is not required
Documented the analysis, critical assumptions and constraints, findings and recommendation(s) of the CB&SA in a final report to decision makers
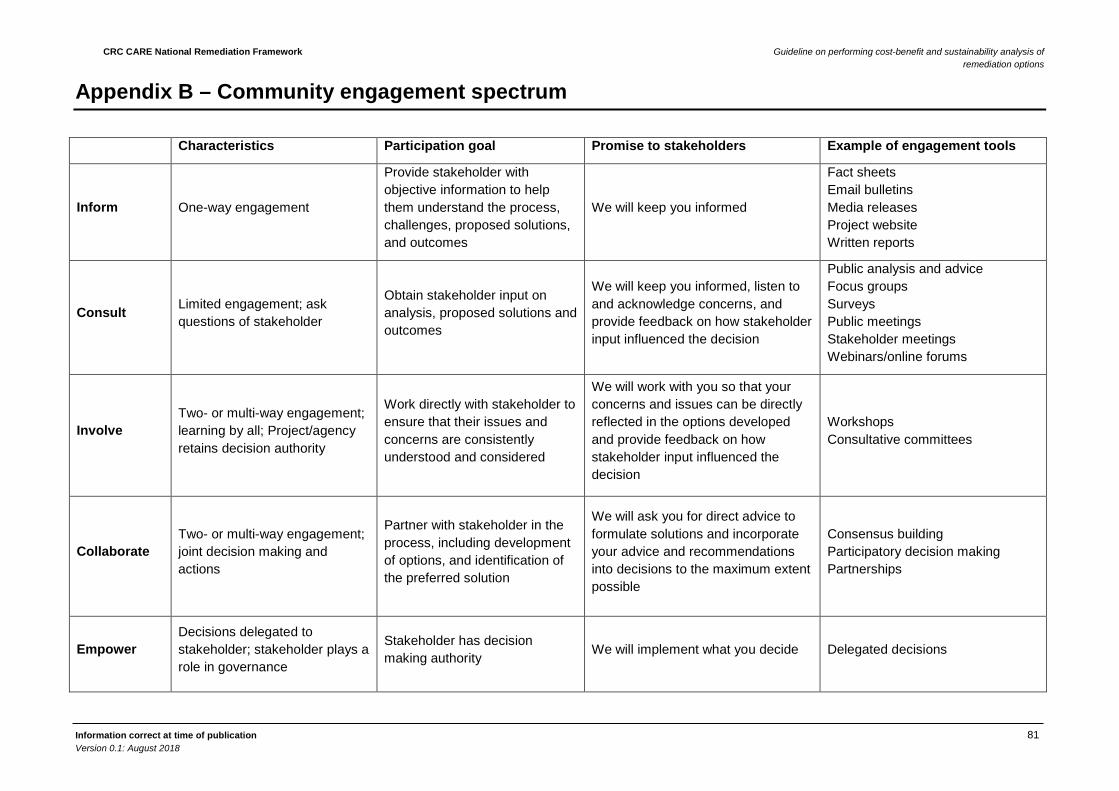
CRC CARE National Remediation Framework Guideline on performing cost-benefit and sustainability analysis of remediation options
Information correct at time of publication 81 Version 0.1: August 2018
Appendix B – Community engagement spectrum
Characteristics Participation goal Promise to stakeholders Example of engagement tools
Inform One-way engagement
Provide stakeholder with objective information to help them understand the process, challenges, proposed solutions, and outcomes
We will keep you informed
Fact sheets Email bulletins Media releases Project website Written reports
Consult Limited engagement; ask questions of stakeholder
Obtain stakeholder input on analysis, proposed solutions and outcomes
We will keep you informed, listen to and acknowledge concerns, and provide feedback on how stakeholder input influenced the decision
Public analysis and advice Focus groups Surveys Public meetings Stakeholder meetings Webinars/online forums
Involve Two- or multi-way engagement; learning by all; Project/agency retains decision authority
Work directly with stakeholder to ensure that their issues and concerns are consistently understood and considered
We will work with you so that your concerns and issues can be directly reflected in the options developed and provide feedback on how stakeholder input influenced the decision
Workshops Consultative committees
Collaborate Two- or multi-way engagement; joint decision making and actions
Partner with stakeholder in the process, including development of options, and identification of the preferred solution
We will ask you for direct advice to formulate solutions and incorporate your advice and recommendations into decisions to the maximum extent possible
Consensus building Participatory decision making Partnerships
Empower Decisions delegated to stakeholder; stakeholder plays a role in governance
Stakeholder has decision making authority We will implement what you decide Delegated decisions
CRC CARE National Remediation Framework Guideline on performing cost-benefit and sustainability analysis of remediation options
Information correct at time of publication 82 Version 0.1: August 2018
Appendix C – Contaminated sites suggested indicators
This appendix identifies the most common threshold and performance indicators likely to be relevant in the site remediation context for a CB&SA, with accompanying descriptions and possible information sources for each indicator. To assist practitioners, indicators are categorised into two types: threshold indicators and performance indicators. Threshold indicators represent the minimum requirements to be met for a remedial or site option, while performance indicators enable an assessment of the consequences and ability of an option to achieve the desired objectives. Performance indicators are further separated into sub-categories to assist the practitioner in sufficiently considering sustainability, while also identifying the potential impacts to be measured that may be relevant to the project. Each indicator can be assessed within three distinct categories: 'quantified', 'monetised' or 'qualified'. Depending on data and information availability all indicators can be quantified or qualified, however not all indicators will be able to be monetised. This appendix outlines the assessment categories applicable to each indicator. As a general rule, valuing indicators in monetary terms requires more robust data and a greater level of analysis. There are a wide range of assessment methods and tools available that can assist with estimating and quantifying a wide range of non-market impacts. There are also a range of tools and assessment methods available that can in turn monetise (i.e. express in dollar values) many of those quantified impacts, if sufficient effort and time is invested in the analysis, and the supporting data and information is available.
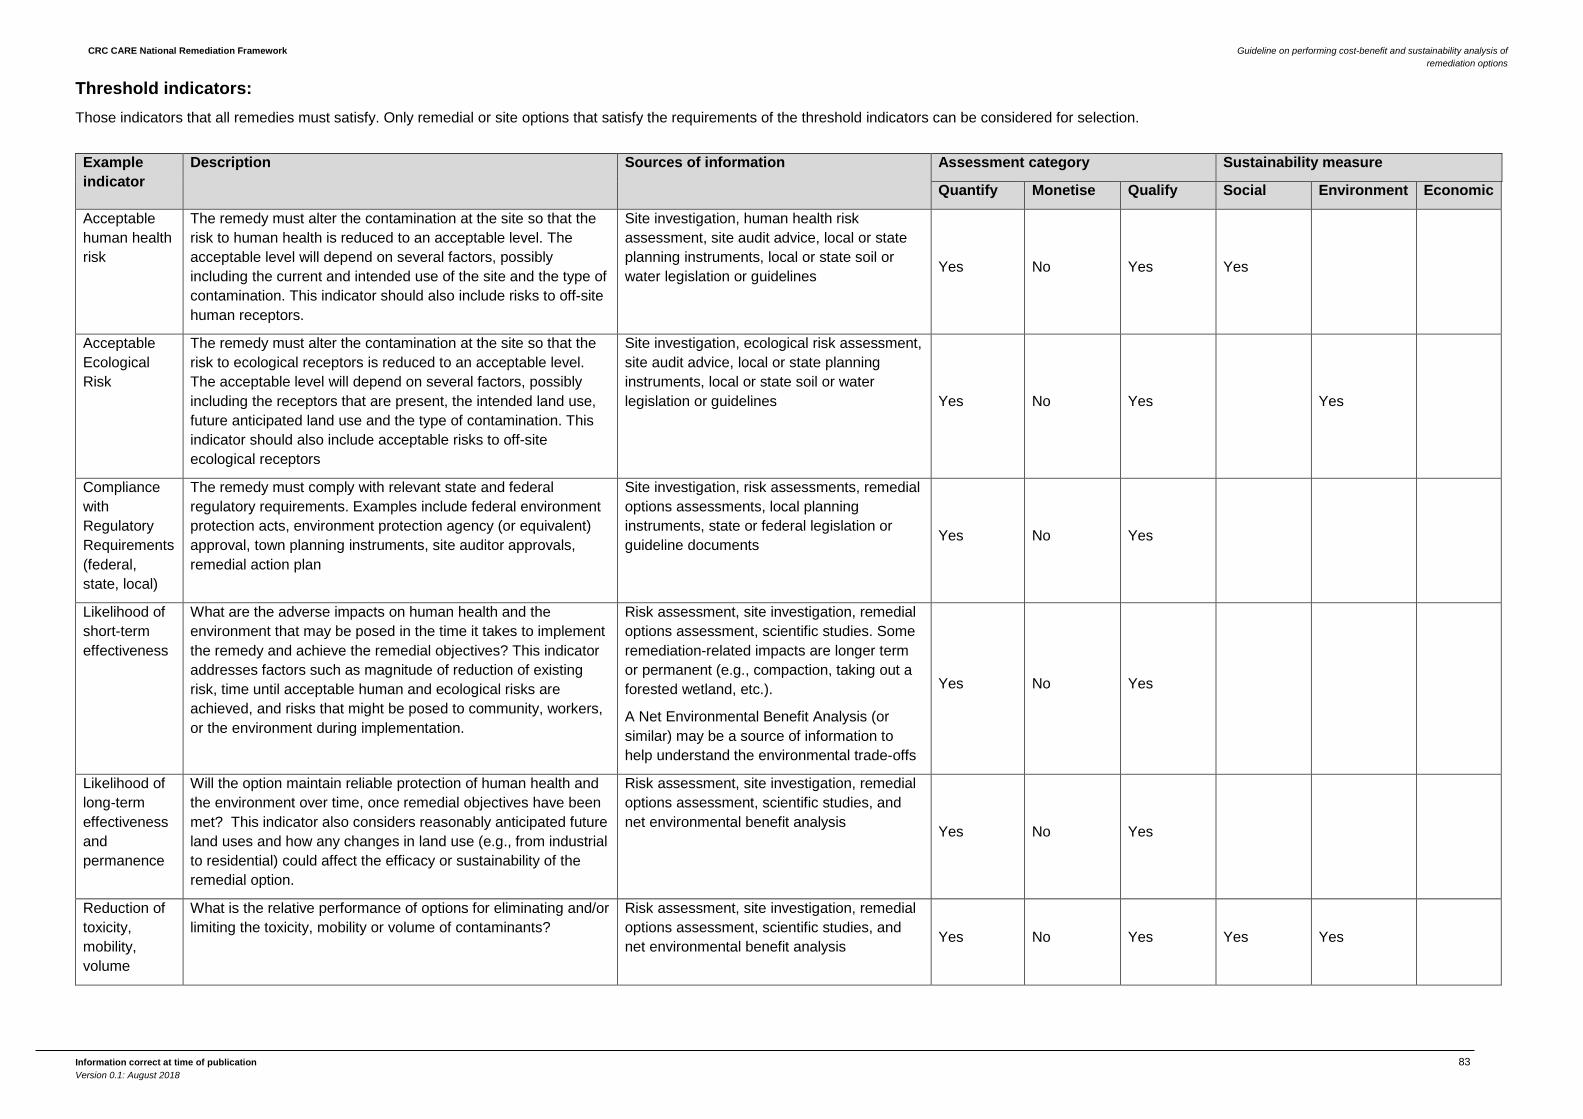
CRC CARE National Remediation Framework Guideline on performing cost-benefit and sustainability analysis of remediation options
Information correct at time of publication 83 Version 0.1: August 2018
Threshold indicators: Those indicators that all remedies must satisfy. Only remedial or site options that satisfy the requirements of the threshold indicators can be considered for selection.
Example indicator
Description Sources of information Assessment category Sustainability measure
Quantify Monetise Qualify Social Environment Economic
Acceptable human health risk
The remedy must alter the contamination at the site so that the risk to human health is reduced to an acceptable level. The acceptable level will depend on several factors, possibly including the current and intended use of the site and the type of contamination. This indicator should also include risks to off-site human receptors.
Site investigation, human health risk assessment, site audit advice, local or state planning instruments, local or state soil or water legislation or guidelines Yes No Yes Yes
Acceptable Ecological Risk
The remedy must alter the contamination at the site so that the risk to ecological receptors is reduced to an acceptable level. The acceptable level will depend on several factors, possibly including the receptors that are present, the intended land use, future anticipated land use and the type of contamination. This indicator should also include acceptable risks to off-site ecological receptors
Site investigation, ecological risk assessment, site audit advice, local or state planning instruments, local or state soil or water legislation or guidelines Yes No Yes Yes
Compliance with Regulatory Requirements (federal, state, local)
The remedy must comply with relevant state and federal regulatory requirements. Examples include federal environment protection acts, environment protection agency (or equivalent) approval, town planning instruments, site auditor approvals, remedial action plan
Site investigation, risk assessments, remedial options assessments, local planning instruments, state or federal legislation or guideline documents Yes No Yes
Likelihood of short-term effectiveness
What are the adverse impacts on human health and the environment that may be posed in the time it takes to implement the remedy and achieve the remedial objectives? This indicator addresses factors such as magnitude of reduction of existing risk, time until acceptable human and ecological risks are achieved, and risks that might be posed to community, workers, or the environment during implementation.
Risk assessment, site investigation, remedial options assessment, scientific studies. Some remediation-related impacts are longer term or permanent (e.g., compaction, taking out a forested wetland, etc.).
A Net Environmental Benefit Analysis (or similar) may be a source of information to help understand the environmental trade-offs
Yes No Yes
Likelihood of long-term effectiveness and permanence
Will the option maintain reliable protection of human health and the environment over time, once remedial objectives have been met? This indicator also considers reasonably anticipated future land uses and how any changes in land use (e.g., from industrial to residential) could affect the efficacy or sustainability of the remedial option.
Risk assessment, site investigation, remedial options assessment, scientific studies, and net environmental benefit analysis Yes No Yes
Reduction of toxicity, mobility, volume
What is the relative performance of options for eliminating and/or limiting the toxicity, mobility or volume of contaminants?
Risk assessment, site investigation, remedial options assessment, scientific studies, and net environmental benefit analysis Yes No Yes Yes Yes
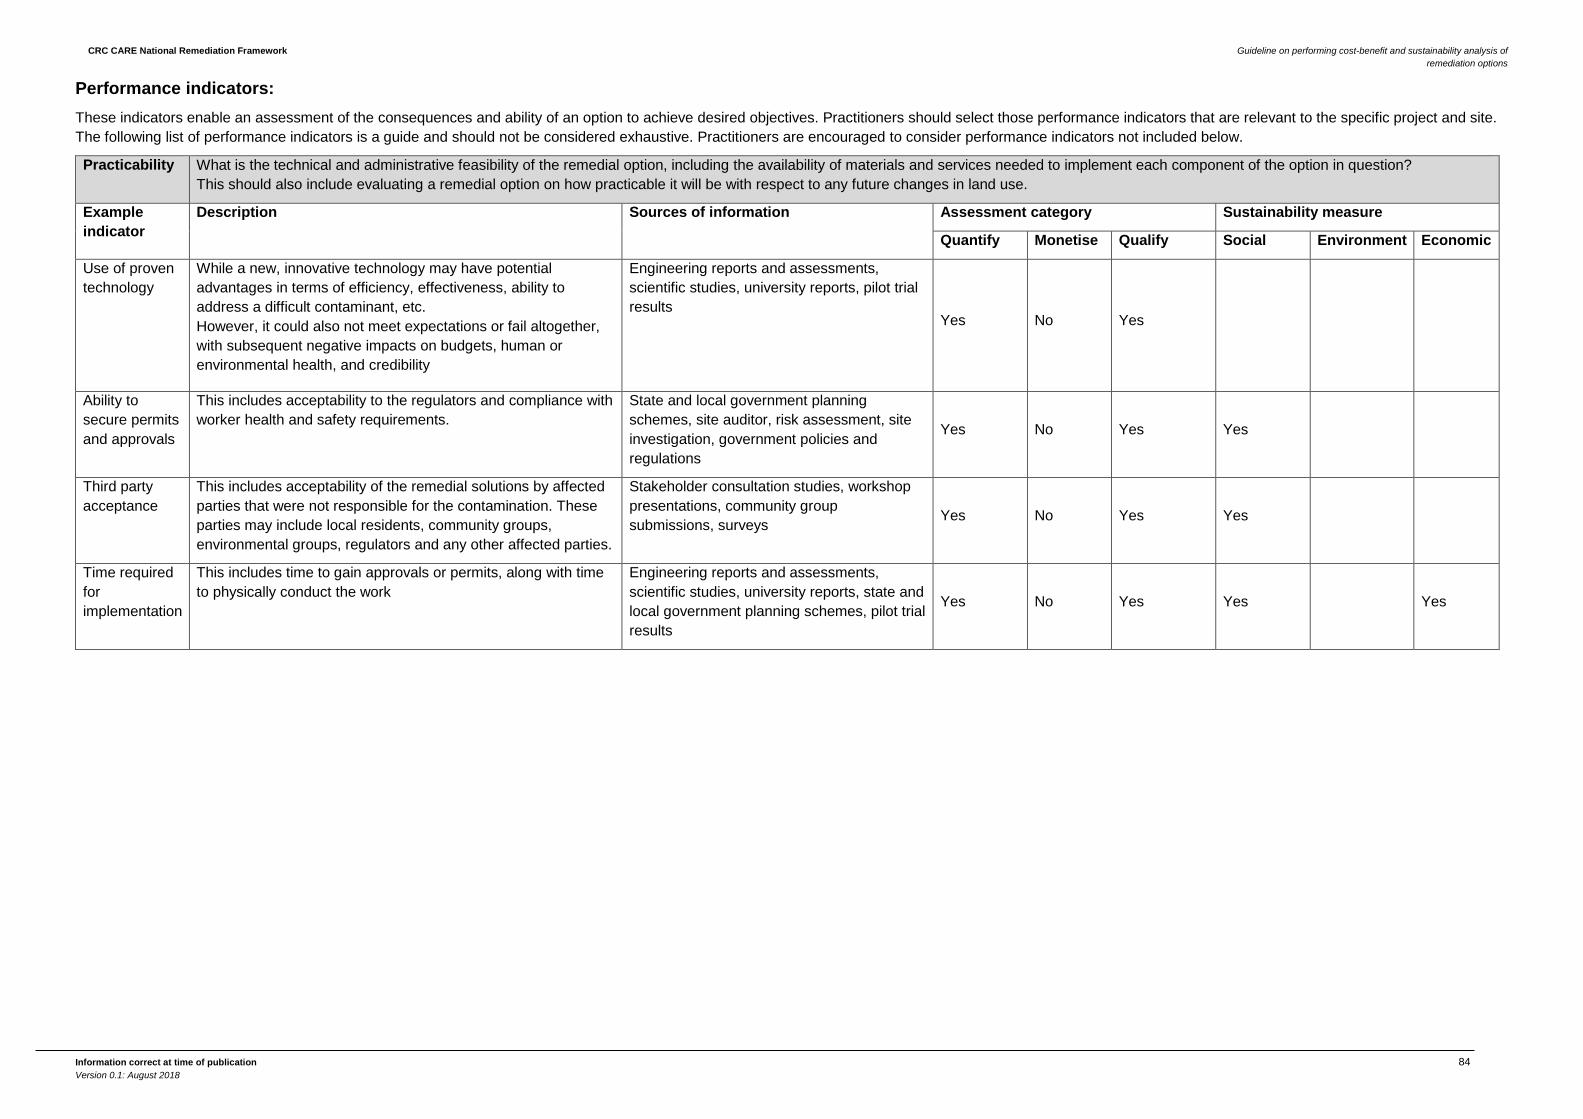
CRC CARE National Remediation Framework Guideline on performing cost-benefit and sustainability analysis of remediation options
Information correct at time of publication 84 Version 0.1: August 2018
Performance indicators: These indicators enable an assessment of the consequences and ability of an option to achieve desired objectives. Practitioners should select those performance indicators that are relevant to the specific project and site. The following list of performance indicators is a guide and should not be considered exhaustive. Practitioners are encouraged to consider performance indicators not included below.
Practicability What is the technical and administrative feasibility of the remedial option, including the availability of materials and services needed to implement each component of the option in question? This should also include evaluating a remedial option on how practicable it will be with respect to any future changes in land use.
Example indicator
Description Sources of information Assessment category Sustainability measure
Quantify Monetise Qualify Social Environment Economic
Use of proven technology
While a new, innovative technology may have potential advantages in terms of efficiency, effectiveness, ability to address a difficult contaminant, etc. However, it could also not meet expectations or fail altogether, with subsequent negative impacts on budgets, human or environmental health, and credibility
Engineering reports and assessments, scientific studies, university reports, pilot trial results
Yes No Yes
Ability to secure permits and approvals
This includes acceptability to the regulators and compliance with worker health and safety requirements.
State and local government planning schemes, site auditor, risk assessment, site investigation, government policies and regulations
Yes No Yes Yes
Third party acceptance
This includes acceptability of the remedial solutions by affected parties that were not responsible for the contamination. These parties may include local residents, community groups, environmental groups, regulators and any other affected parties.
Stakeholder consultation studies, workshop presentations, community group submissions, surveys Yes No Yes Yes
Time required for implementation
This includes time to gain approvals or permits, along with time to physically conduct the work
Engineering reports and assessments, scientific studies, university reports, state and local government planning schemes, pilot trial results
Yes No Yes Yes Yes
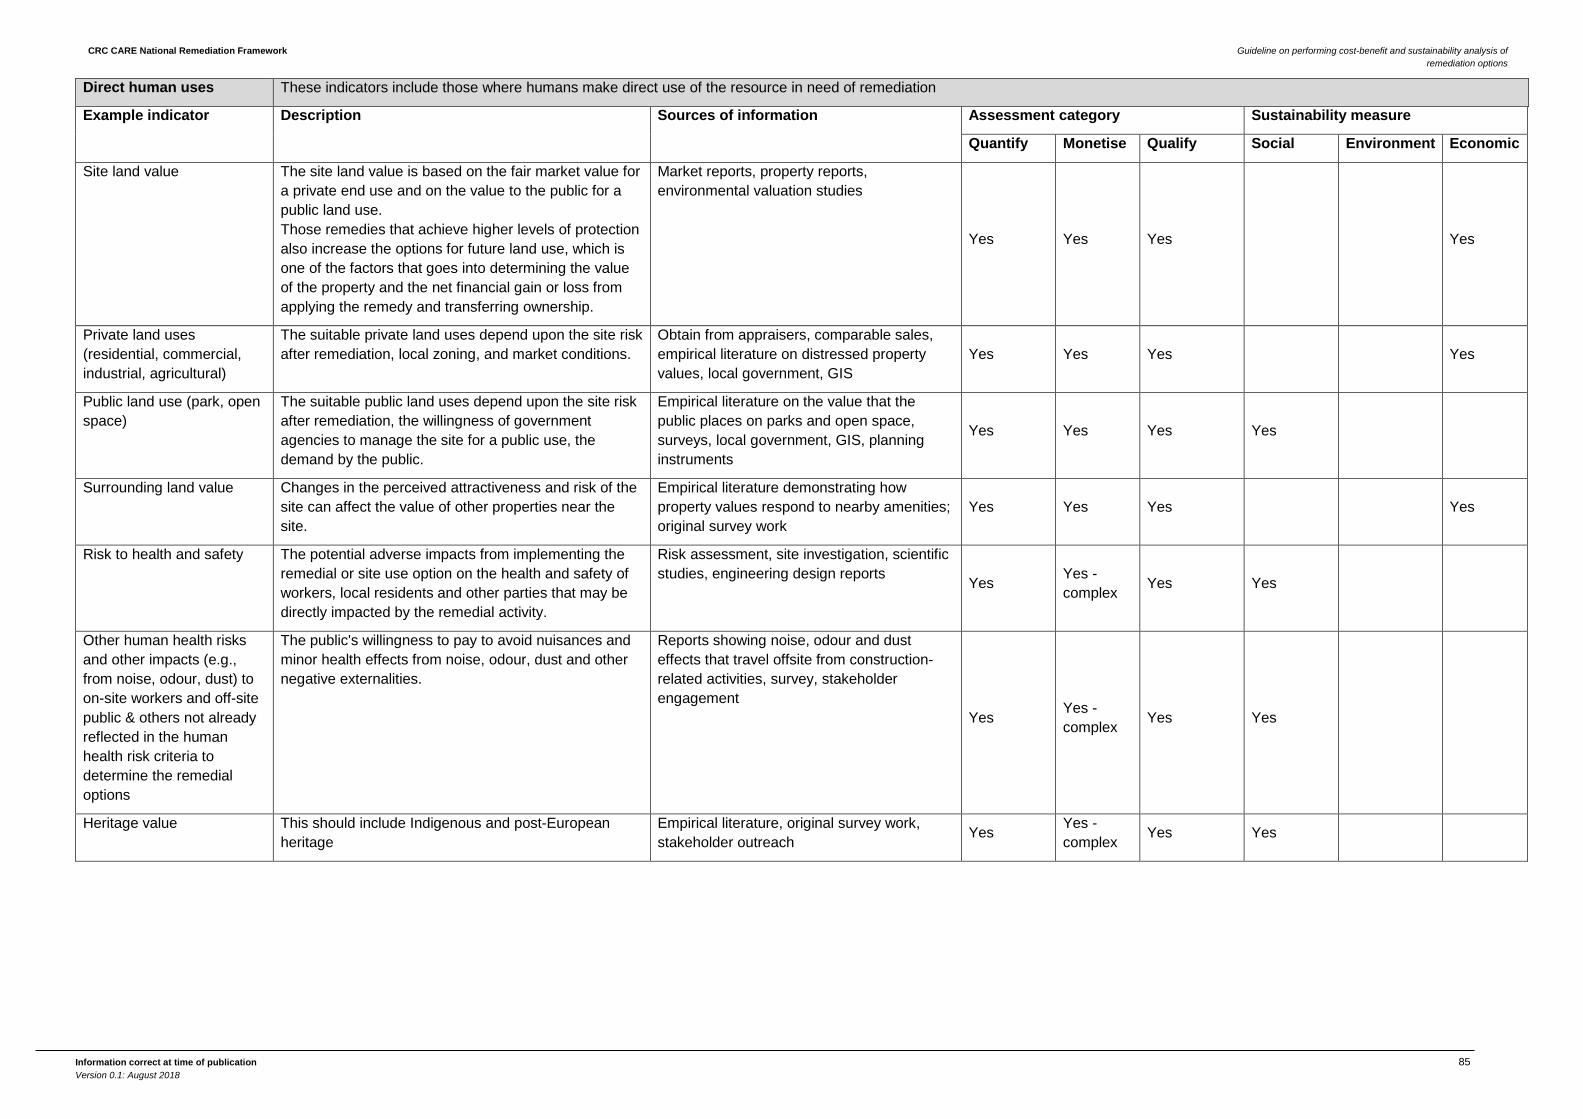
CRC CARE National Remediation Framework Guideline on performing cost-benefit and sustainability analysis of remediation options
Information correct at time of publication 85 Version 0.1: August 2018
Direct human uses These indicators include those where humans make direct use of the resource in need of remediation
Example indicator Description Sources of information Assessment category Sustainability measure
Quantify Monetise Qualify Social Environment Economic
Site land value The site land value is based on the fair market value for a private end use and on the value to the public for a public land use. Those remedies that achieve higher levels of protection also increase the options for future land use, which is one of the factors that goes into determining the value of the property and the net financial gain or loss from applying the remedy and transferring ownership.
Market reports, property reports, environmental valuation studies
Yes Yes Yes Yes
Private land uses (residential, commercial, industrial, agricultural)
The suitable private land uses depend upon the site risk after remediation, local zoning, and market conditions.
Obtain from appraisers, comparable sales, empirical literature on distressed property values, local government, GIS
Yes Yes Yes Yes
Public land use (park, open space)
The suitable public land uses depend upon the site risk after remediation, the willingness of government agencies to manage the site for a public use, the demand by the public.
Empirical literature on the value that the public places on parks and open space, surveys, local government, GIS, planning instruments
Yes Yes Yes Yes
Surrounding land value Changes in the perceived attractiveness and risk of the site can affect the value of other properties near the site.
Empirical literature demonstrating how property values respond to nearby amenities; original survey work
Yes Yes Yes Yes
Risk to health and safety The potential adverse impacts from implementing the remedial or site use option on the health and safety of workers, local residents and other parties that may be directly impacted by the remedial activity.
Risk assessment, site investigation, scientific studies, engineering design reports Yes Yes -
complex Yes Yes
Other human health risks and other impacts (e.g., from noise, odour, dust) to on-site workers and off-site public & others not already reflected in the human health risk criteria to determine the remedial options
The public's willingness to pay to avoid nuisances and minor health effects from noise, odour, dust and other negative externalities.
Reports showing noise, odour and dust effects that travel offsite from construction-related activities, survey, stakeholder engagement
Yes Yes - complex Yes Yes
Heritage value This should include Indigenous and post-European heritage
Empirical literature, original survey work, stakeholder outreach Yes Yes -
complex Yes Yes
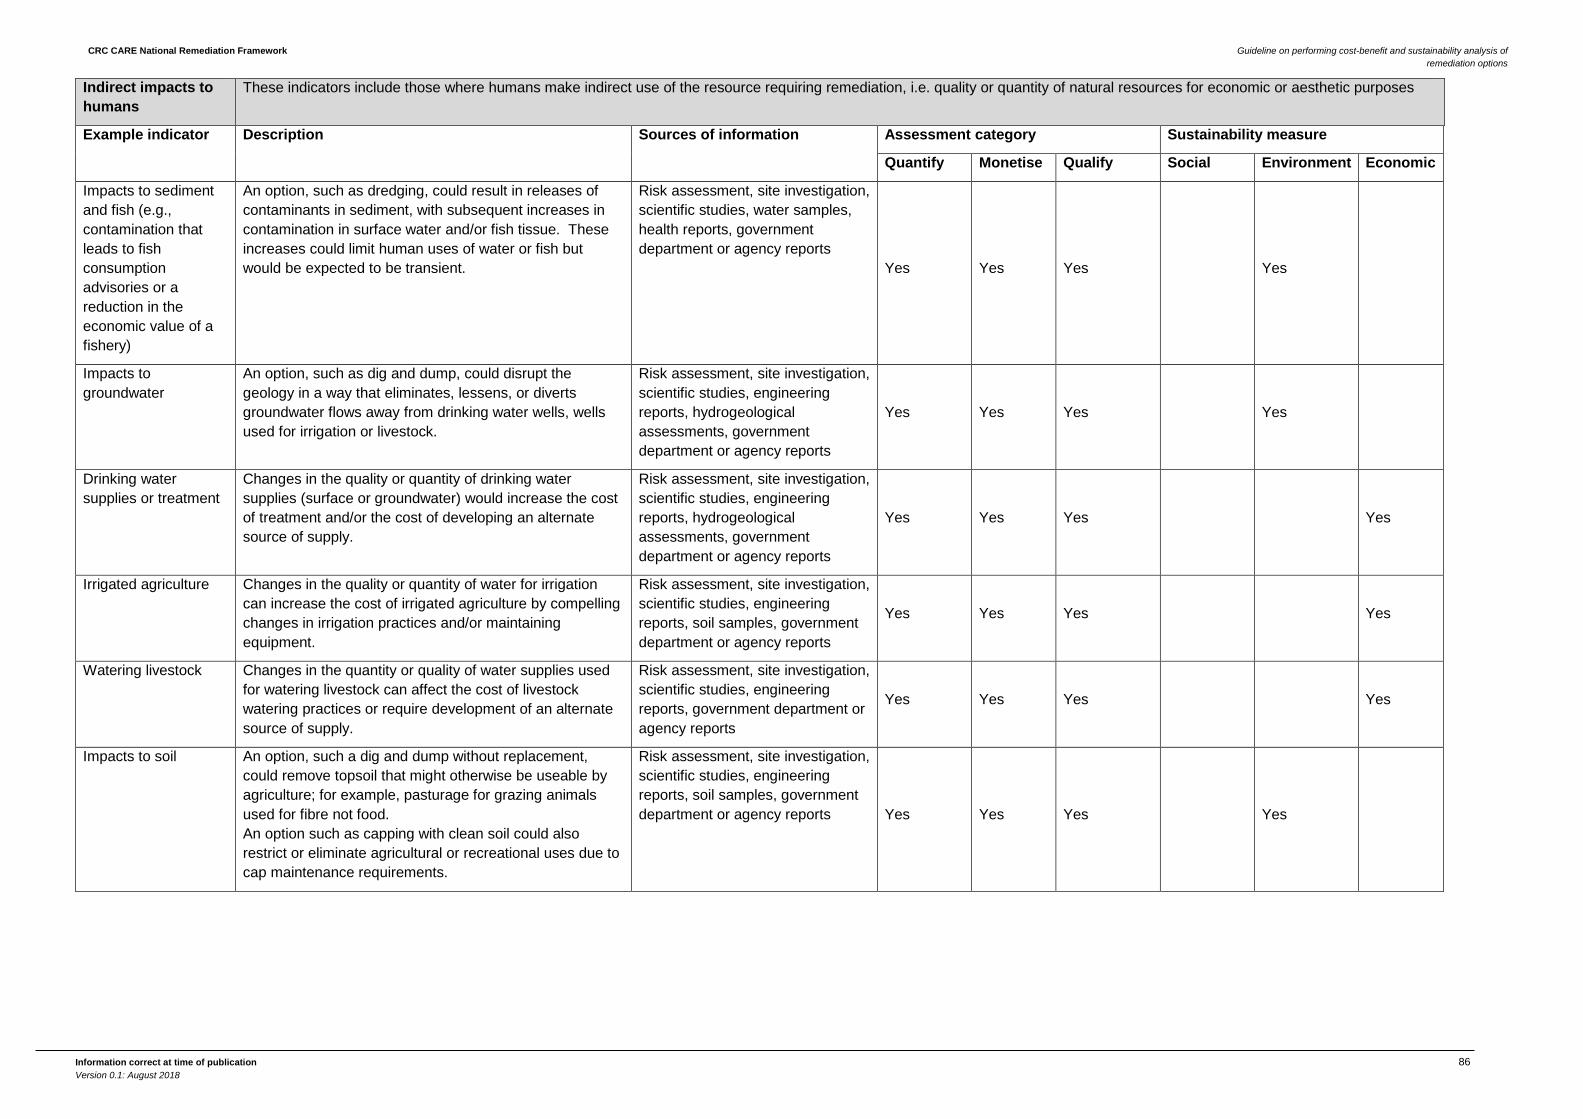
CRC CARE National Remediation Framework Guideline on performing cost-benefit and sustainability analysis of remediation options
Information correct at time of publication 86 Version 0.1: August 2018
Indirect impacts to humans
These indicators include those where humans make indirect use of the resource requiring remediation, i.e. quality or quantity of natural resources for economic or aesthetic purposes
Example indicator Description Sources of information Assessment category Sustainability measure
Quantify Monetise Qualify Social Environment Economic
Impacts to sediment and fish (e.g., contamination that leads to fish consumption advisories or a reduction in the economic value of a fishery)
An option, such as dredging, could result in releases of contaminants in sediment, with subsequent increases in contamination in surface water and/or fish tissue. These increases could limit human uses of water or fish but would be expected to be transient.
Risk assessment, site investigation, scientific studies, water samples, health reports, government department or agency reports
Yes Yes Yes Yes
Impacts to groundwater
An option, such as dig and dump, could disrupt the geology in a way that eliminates, lessens, or diverts groundwater flows away from drinking water wells, wells used for irrigation or livestock.
Risk assessment, site investigation, scientific studies, engineering reports, hydrogeological assessments, government department or agency reports
Yes Yes Yes Yes
Drinking water supplies or treatment
Changes in the quality or quantity of drinking water supplies (surface or groundwater) would increase the cost of treatment and/or the cost of developing an alternate source of supply.
Risk assessment, site investigation, scientific studies, engineering reports, hydrogeological assessments, government department or agency reports
Yes Yes Yes Yes
Irrigated agriculture Changes in the quality or quantity of water for irrigation can increase the cost of irrigated agriculture by compelling changes in irrigation practices and/or maintaining equipment.
Risk assessment, site investigation, scientific studies, engineering reports, soil samples, government department or agency reports
Yes Yes Yes Yes
Watering livestock Changes in the quantity or quality of water supplies used for watering livestock can affect the cost of livestock watering practices or require development of an alternate source of supply.
Risk assessment, site investigation, scientific studies, engineering reports, government department or agency reports
Yes Yes Yes Yes
Impacts to soil An option, such a dig and dump without replacement, could remove topsoil that might otherwise be useable by agriculture; for example, pasturage for grazing animals used for fibre not food. An option such as capping with clean soil could also restrict or eliminate agricultural or recreational uses due to cap maintenance requirements.
Risk assessment, site investigation, scientific studies, engineering reports, soil samples, government department or agency reports Yes Yes Yes Yes
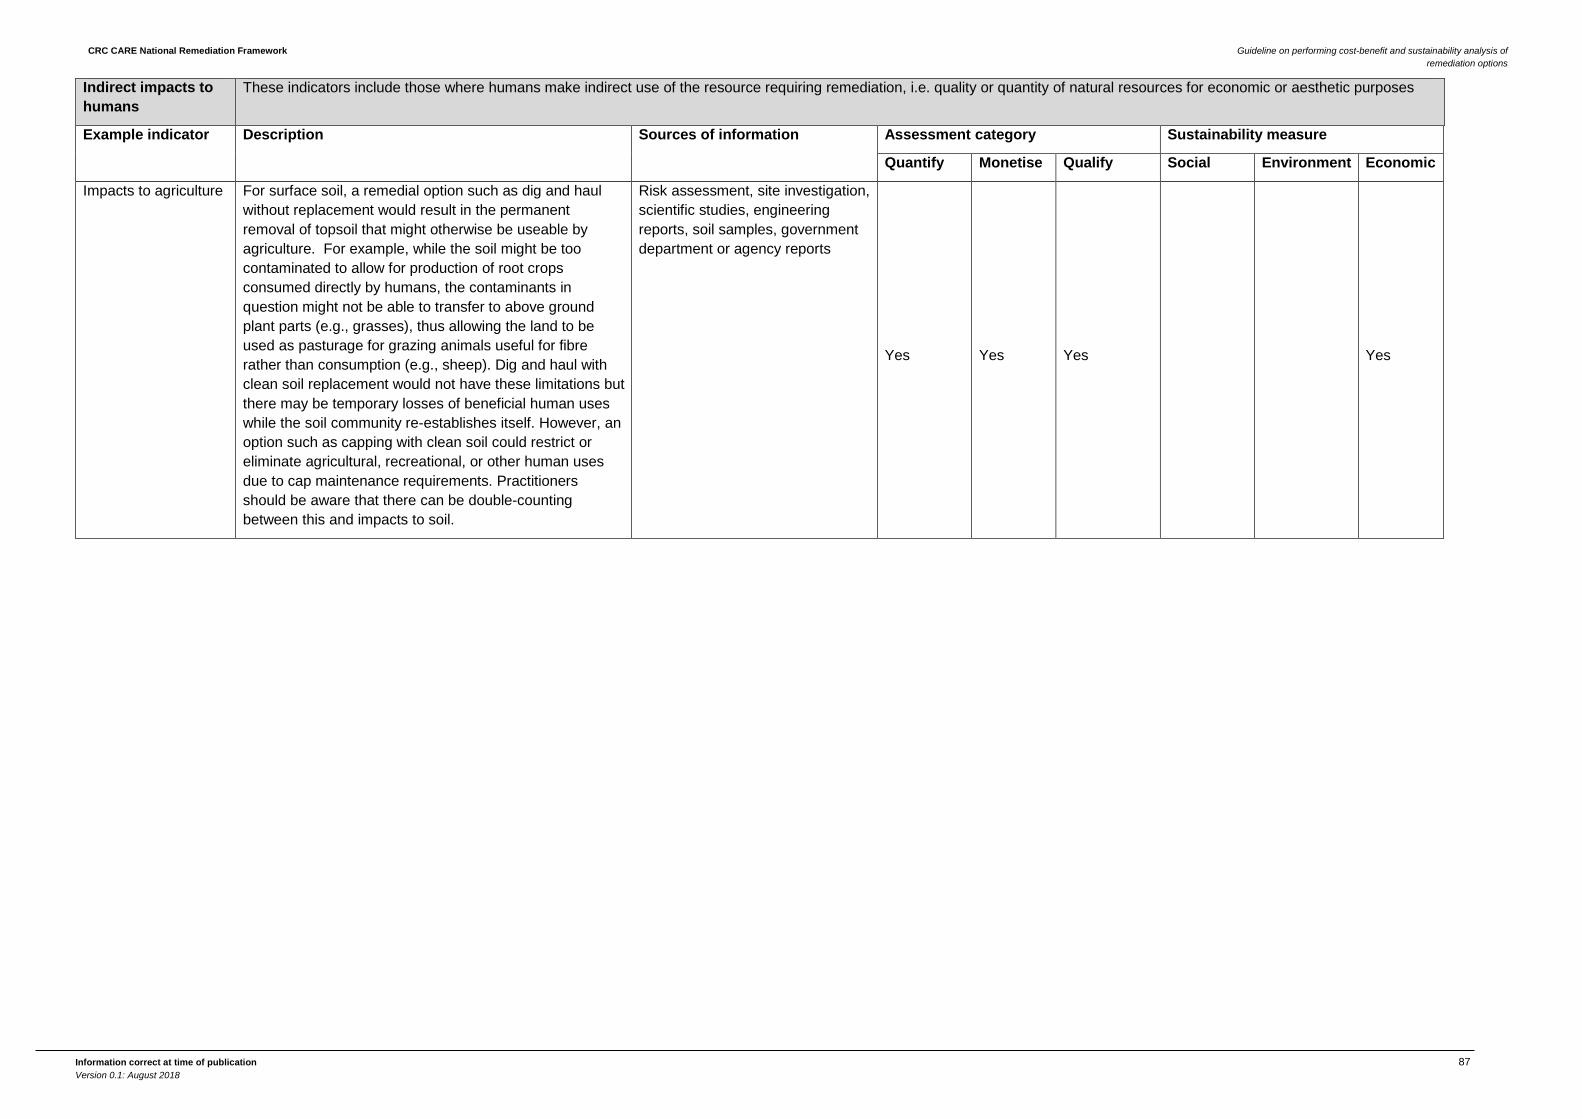
CRC CARE National Remediation Framework Guideline on performing cost-benefit and sustainability analysis of remediation options
Information correct at time of publication 87 Version 0.1: August 2018
Indirect impacts to humans
These indicators include those where humans make indirect use of the resource requiring remediation, i.e. quality or quantity of natural resources for economic or aesthetic purposes
Example indicator Description Sources of information Assessment category Sustainability measure
Quantify Monetise Qualify Social Environment Economic
Impacts to agriculture For surface soil, a remedial option such as dig and haul without replacement would result in the permanent removal of topsoil that might otherwise be useable by agriculture. For example, while the soil might be too contaminated to allow for production of root crops consumed directly by humans, the contaminants in question might not be able to transfer to above ground plant parts (e.g., grasses), thus allowing the land to be used as pasturage for grazing animals useful for fibre rather than consumption (e.g., sheep). Dig and haul with clean soil replacement would not have these limitations but there may be temporary losses of beneficial human uses while the soil community re-establishes itself. However, an option such as capping with clean soil could restrict or eliminate agricultural, recreational, or other human uses due to cap maintenance requirements. Practitioners should be aware that there can be double-counting between this and impacts to soil.
Risk assessment, site investigation, scientific studies, engineering reports, soil samples, government department or agency reports
Yes Yes Yes Yes
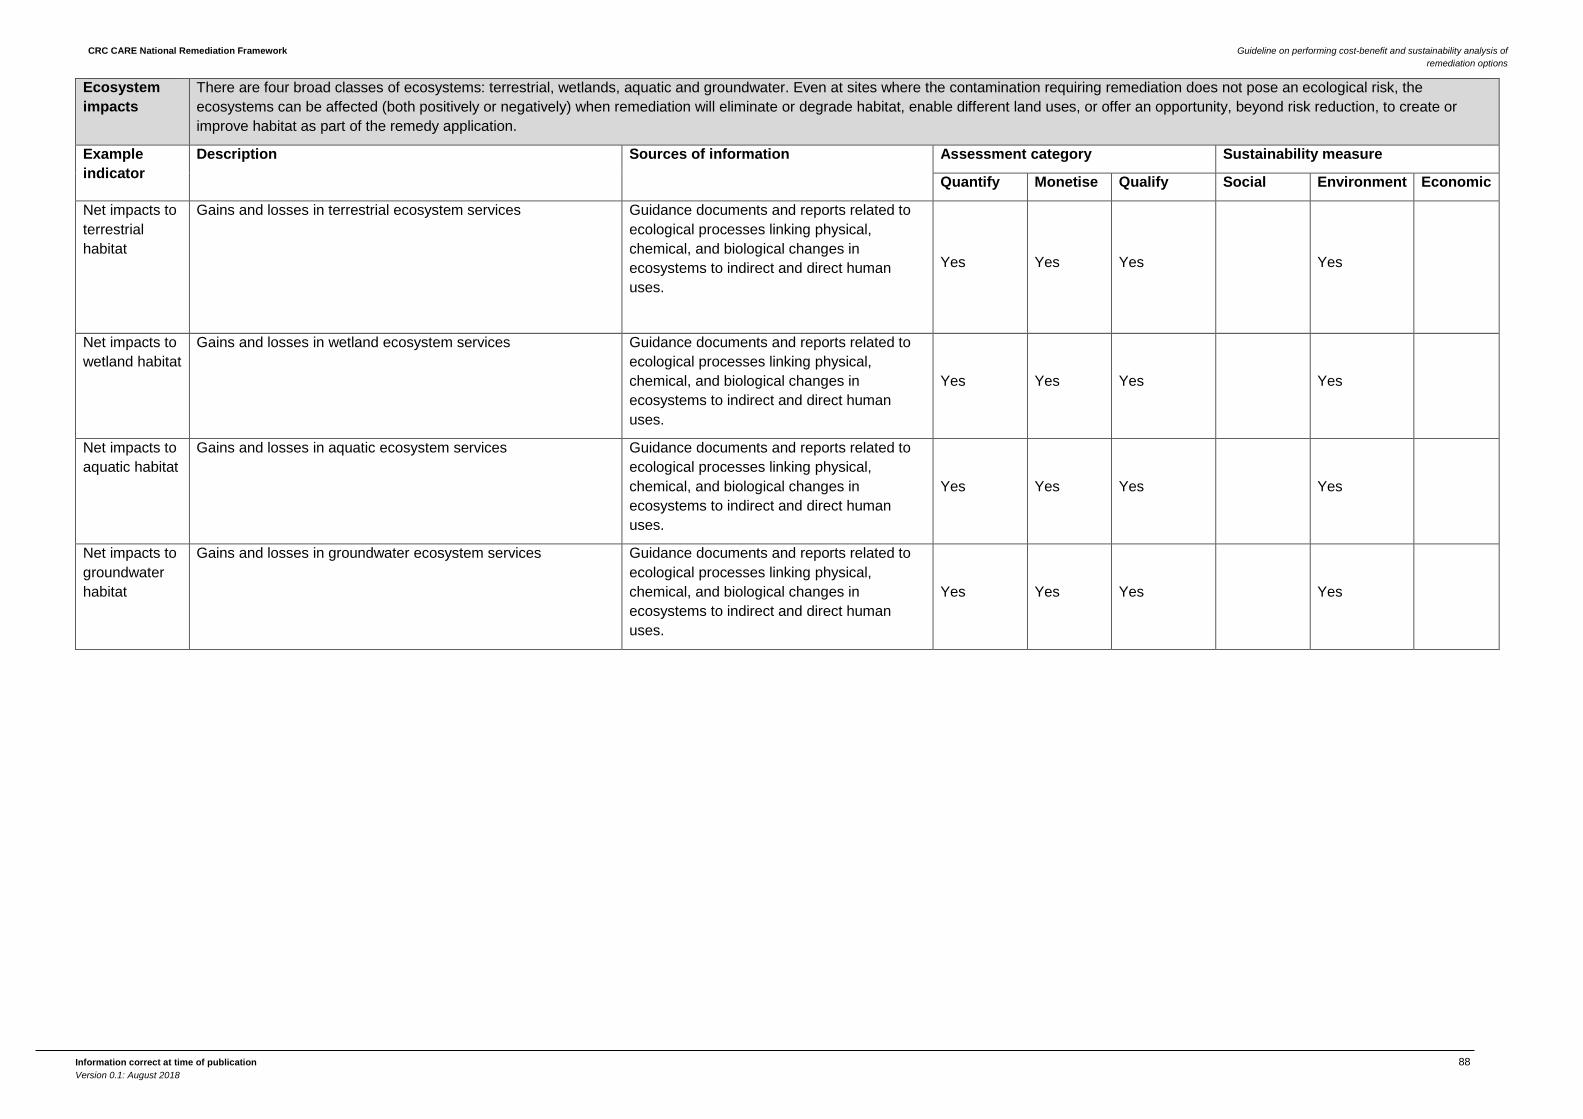
CRC CARE National Remediation Framework Guideline on performing cost-benefit and sustainability analysis of remediation options
Information correct at time of publication 88 Version 0.1: August 2018
Ecosystem impacts
There are four broad classes of ecosystems: terrestrial, wetlands, aquatic and groundwater. Even at sites where the contamination requiring remediation does not pose an ecological risk, the ecosystems can be affected (both positively or negatively) when remediation will eliminate or degrade habitat, enable different land uses, or offer an opportunity, beyond risk reduction, to create or improve habitat as part of the remedy application.
Example indicator
Description Sources of information Assessment category Sustainability measure
Quantify Monetise Qualify Social Environment Economic
Net impacts to terrestrial habitat
Gains and losses in terrestrial ecosystem services Guidance documents and reports related to ecological processes linking physical, chemical, and biological changes in ecosystems to indirect and direct human uses.
Yes Yes Yes Yes
Net impacts to wetland habitat
Gains and losses in wetland ecosystem services Guidance documents and reports related to ecological processes linking physical, chemical, and biological changes in ecosystems to indirect and direct human uses.
Yes Yes Yes Yes
Net impacts to aquatic habitat
Gains and losses in aquatic ecosystem services Guidance documents and reports related to ecological processes linking physical, chemical, and biological changes in ecosystems to indirect and direct human uses.
Yes Yes Yes Yes
Net impacts to groundwater habitat
Gains and losses in groundwater ecosystem services Guidance documents and reports related to ecological processes linking physical, chemical, and biological changes in ecosystems to indirect and direct human uses.
Yes Yes Yes Yes
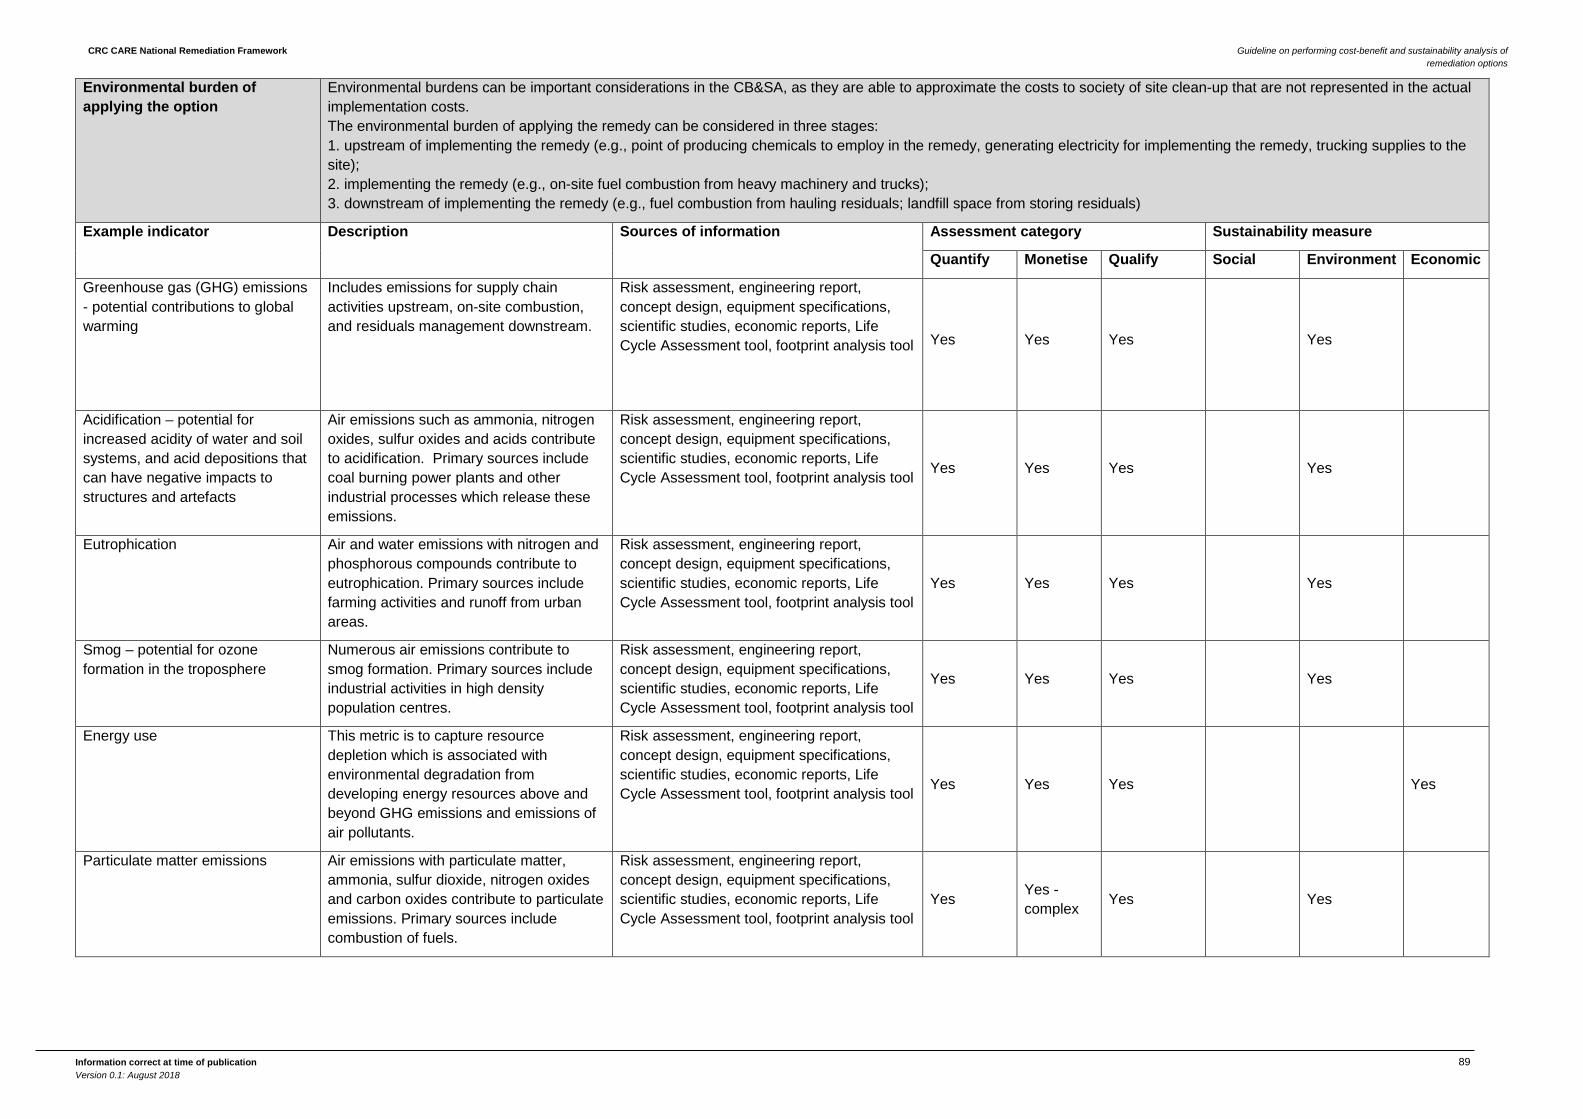
CRC CARE National Remediation Framework Guideline on performing cost-benefit and sustainability analysis of remediation options
Information correct at time of publication 89 Version 0.1: August 2018
Environmental burden of applying the option
Environmental burdens can be important considerations in the CB&SA, as they are able to approximate the costs to society of site clean-up that are not represented in the actual implementation costs. The environmental burden of applying the remedy can be considered in three stages: 1. upstream of implementing the remedy (e.g., point of producing chemicals to employ in the remedy, generating electricity for implementing the remedy, trucking supplies to the site); 2. implementing the remedy (e.g., on-site fuel combustion from heavy machinery and trucks); 3. downstream of implementing the remedy (e.g., fuel combustion from hauling residuals; landfill space from storing residuals)
Example indicator Description Sources of information Assessment category Sustainability measure
Quantify Monetise Qualify Social Environment Economic
Greenhouse gas (GHG) emissions - potential contributions to global warming
Includes emissions for supply chain activities upstream, on-site combustion, and residuals management downstream.
Risk assessment, engineering report, concept design, equipment specifications, scientific studies, economic reports, Life Cycle Assessment tool, footprint analysis tool Yes Yes Yes Yes
Acidification – potential for increased acidity of water and soil systems, and acid depositions that can have negative impacts to structures and artefacts
Air emissions such as ammonia, nitrogen oxides, sulfur oxides and acids contribute to acidification. Primary sources include coal burning power plants and other industrial processes which release these emissions.
Risk assessment, engineering report, concept design, equipment specifications, scientific studies, economic reports, Life Cycle Assessment tool, footprint analysis tool Yes Yes Yes Yes
Eutrophication Air and water emissions with nitrogen and phosphorous compounds contribute to eutrophication. Primary sources include farming activities and runoff from urban areas.
Risk assessment, engineering report, concept design, equipment specifications, scientific studies, economic reports, Life Cycle Assessment tool, footprint analysis tool
Yes Yes Yes Yes
Smog – potential for ozone formation in the troposphere
Numerous air emissions contribute to smog formation. Primary sources include industrial activities in high density population centres.
Risk assessment, engineering report, concept design, equipment specifications, scientific studies, economic reports, Life Cycle Assessment tool, footprint analysis tool
Yes Yes Yes Yes
Energy use This metric is to capture resource depletion which is associated with environmental degradation from developing energy resources above and beyond GHG emissions and emissions of air pollutants.
Risk assessment, engineering report, concept design, equipment specifications, scientific studies, economic reports, Life Cycle Assessment tool, footprint analysis tool Yes Yes Yes Yes
Particulate matter emissions Air emissions with particulate matter, ammonia, sulfur dioxide, nitrogen oxides and carbon oxides contribute to particulate emissions. Primary sources include combustion of fuels.
Risk assessment, engineering report, concept design, equipment specifications, scientific studies, economic reports, Life Cycle Assessment tool, footprint analysis tool
Yes Yes - complex Yes Yes
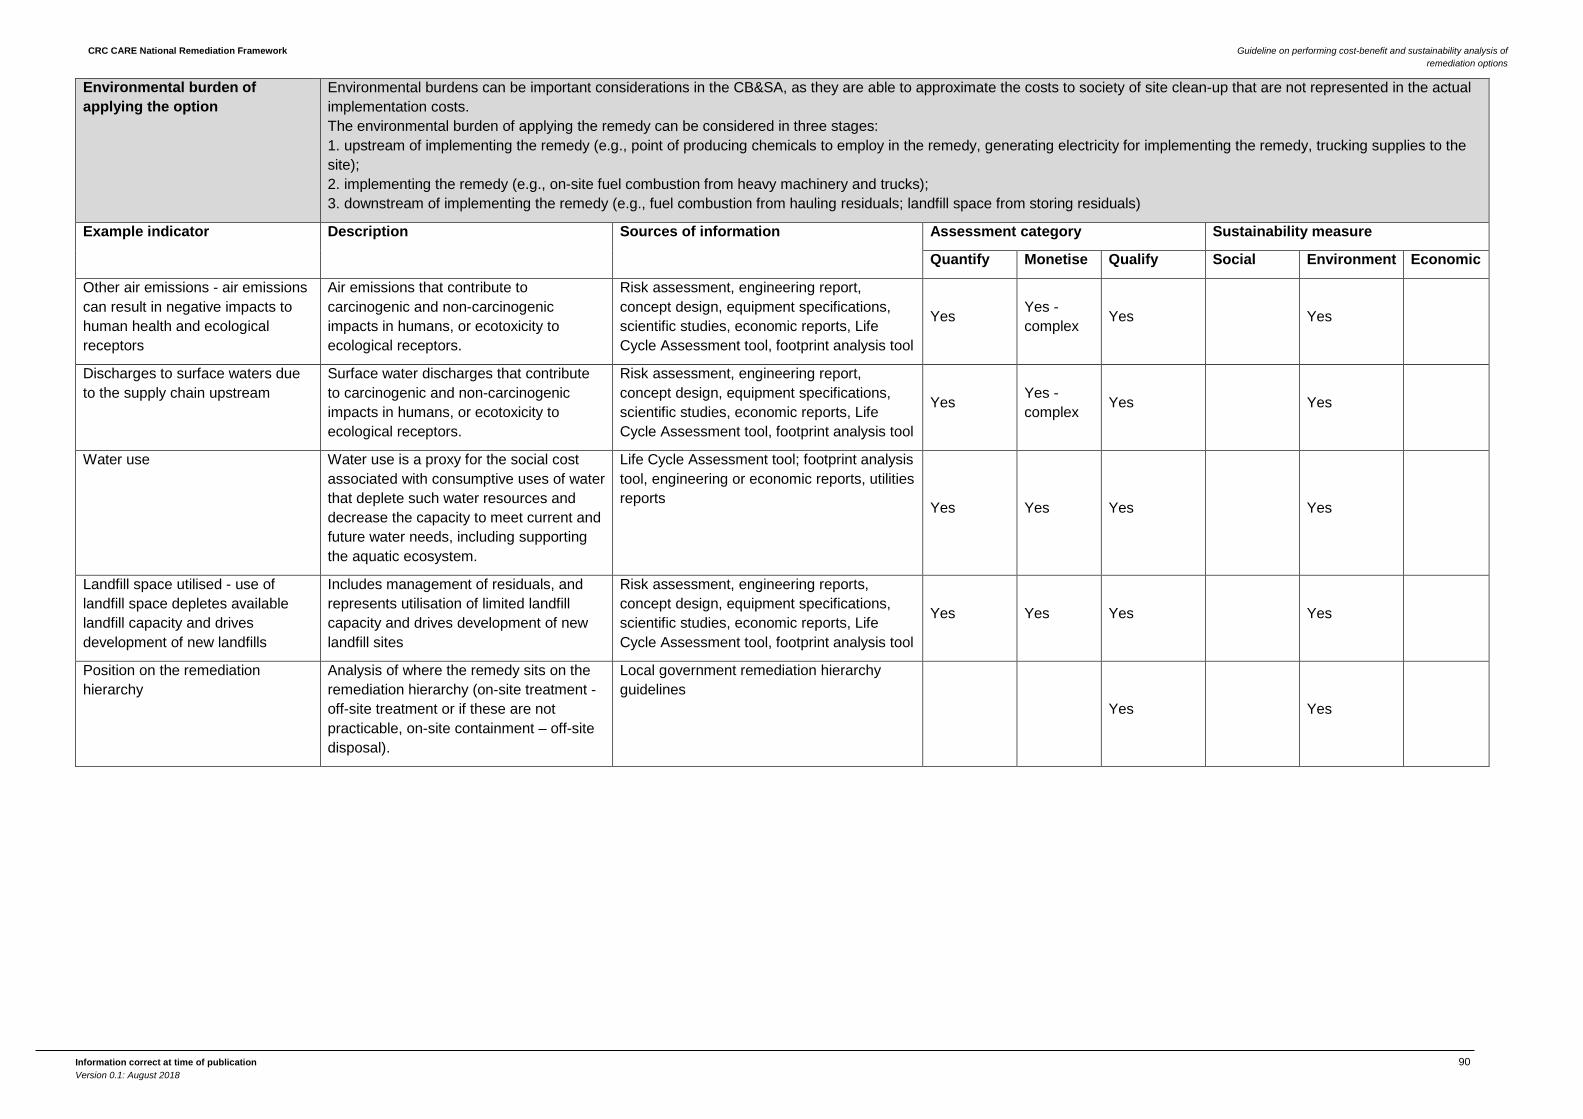
CRC CARE National Remediation Framework Guideline on performing cost-benefit and sustainability analysis of remediation options
Information correct at time of publication 90 Version 0.1: August 2018
Environmental burden of applying the option
Environmental burdens can be important considerations in the CB&SA, as they are able to approximate the costs to society of site clean-up that are not represented in the actual implementation costs. The environmental burden of applying the remedy can be considered in three stages: 1. upstream of implementing the remedy (e.g., point of producing chemicals to employ in the remedy, generating electricity for implementing the remedy, trucking supplies to the site); 2. implementing the remedy (e.g., on-site fuel combustion from heavy machinery and trucks); 3. downstream of implementing the remedy (e.g., fuel combustion from hauling residuals; landfill space from storing residuals)
Example indicator Description Sources of information Assessment category Sustainability measure
Quantify Monetise Qualify Social Environment Economic
Other air emissions - air emissions can result in negative impacts to human health and ecological receptors
Air emissions that contribute to carcinogenic and non-carcinogenic impacts in humans, or ecotoxicity to ecological receptors.
Risk assessment, engineering report, concept design, equipment specifications, scientific studies, economic reports, Life Cycle Assessment tool, footprint analysis tool
Yes Yes - complex Yes Yes
Discharges to surface waters due to the supply chain upstream
Surface water discharges that contribute to carcinogenic and non-carcinogenic impacts in humans, or ecotoxicity to ecological receptors.
Risk assessment, engineering report, concept design, equipment specifications, scientific studies, economic reports, Life Cycle Assessment tool, footprint analysis tool
Yes Yes - complex Yes Yes
Water use Water use is a proxy for the social cost associated with consumptive uses of water that deplete such water resources and decrease the capacity to meet current and future water needs, including supporting the aquatic ecosystem.
Life Cycle Assessment tool; footprint analysis tool, engineering or economic reports, utilities reports Yes Yes Yes Yes
Landfill space utilised - use of landfill space depletes available landfill capacity and drives development of new landfills
Includes management of residuals, and represents utilisation of limited landfill capacity and drives development of new landfill sites
Risk assessment, engineering reports, concept design, equipment specifications, scientific studies, economic reports, Life Cycle Assessment tool, footprint analysis tool
Yes Yes Yes Yes
Position on the remediation hierarchy
Analysis of where the remedy sits on the remediation hierarchy (on-site treatment - off-site treatment or if these are not practicable, on-site containment – off-site disposal).
Local government remediation hierarchy guidelines
Yes Yes
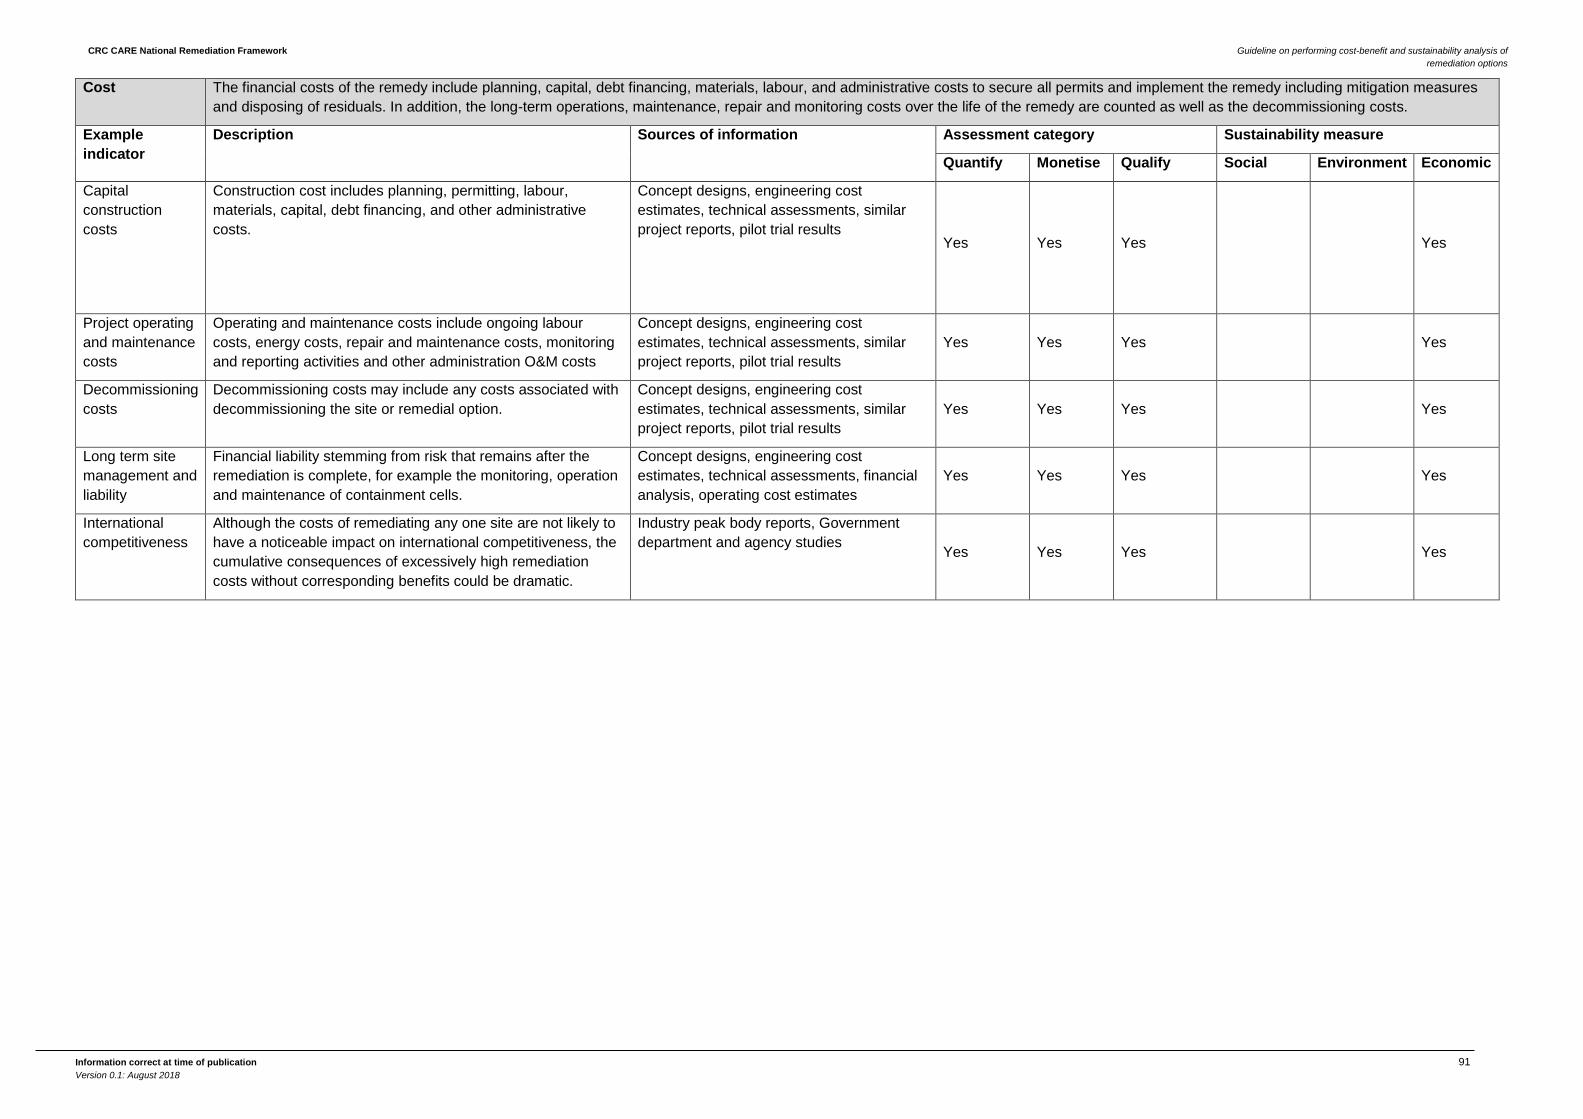
CRC CARE National Remediation Framework Guideline on performing cost-benefit and sustainability analysis of remediation options
Information correct at time of publication 91 Version 0.1: August 2018
Cost The financial costs of the remedy include planning, capital, debt financing, materials, labour, and administrative costs to secure all permits and implement the remedy including mitigation measures and disposing of residuals. In addition, the long-term operations, maintenance, repair and monitoring costs over the life of the remedy are counted as well as the decommissioning costs.
Example indicator
Description Sources of information Assessment category Sustainability measure
Quantify Monetise Qualify Social Environment Economic
Capital construction costs
Construction cost includes planning, permitting, labour, materials, capital, debt financing, and other administrative costs.
Concept designs, engineering cost estimates, technical assessments, similar project reports, pilot trial results
Yes Yes Yes Yes
Project operating and maintenance costs
Operating and maintenance costs include ongoing labour costs, energy costs, repair and maintenance costs, monitoring and reporting activities and other administration O&M costs
Concept designs, engineering cost estimates, technical assessments, similar project reports, pilot trial results
Yes Yes Yes Yes
Decommissioning costs
Decommissioning costs may include any costs associated with decommissioning the site or remedial option.
Concept designs, engineering cost estimates, technical assessments, similar project reports, pilot trial results
Yes Yes Yes Yes
Long term site management and liability
Financial liability stemming from risk that remains after the remediation is complete, for example the monitoring, operation and maintenance of containment cells.
Concept designs, engineering cost estimates, technical assessments, financial analysis, operating cost estimates
Yes Yes Yes Yes
International competitiveness
Although the costs of remediating any one site are not likely to have a noticeable impact on international competitiveness, the cumulative consequences of excessively high remediation costs without corresponding benefits could be dramatic.
Industry peak body reports, Government department and agency studies Yes Yes Yes Yes
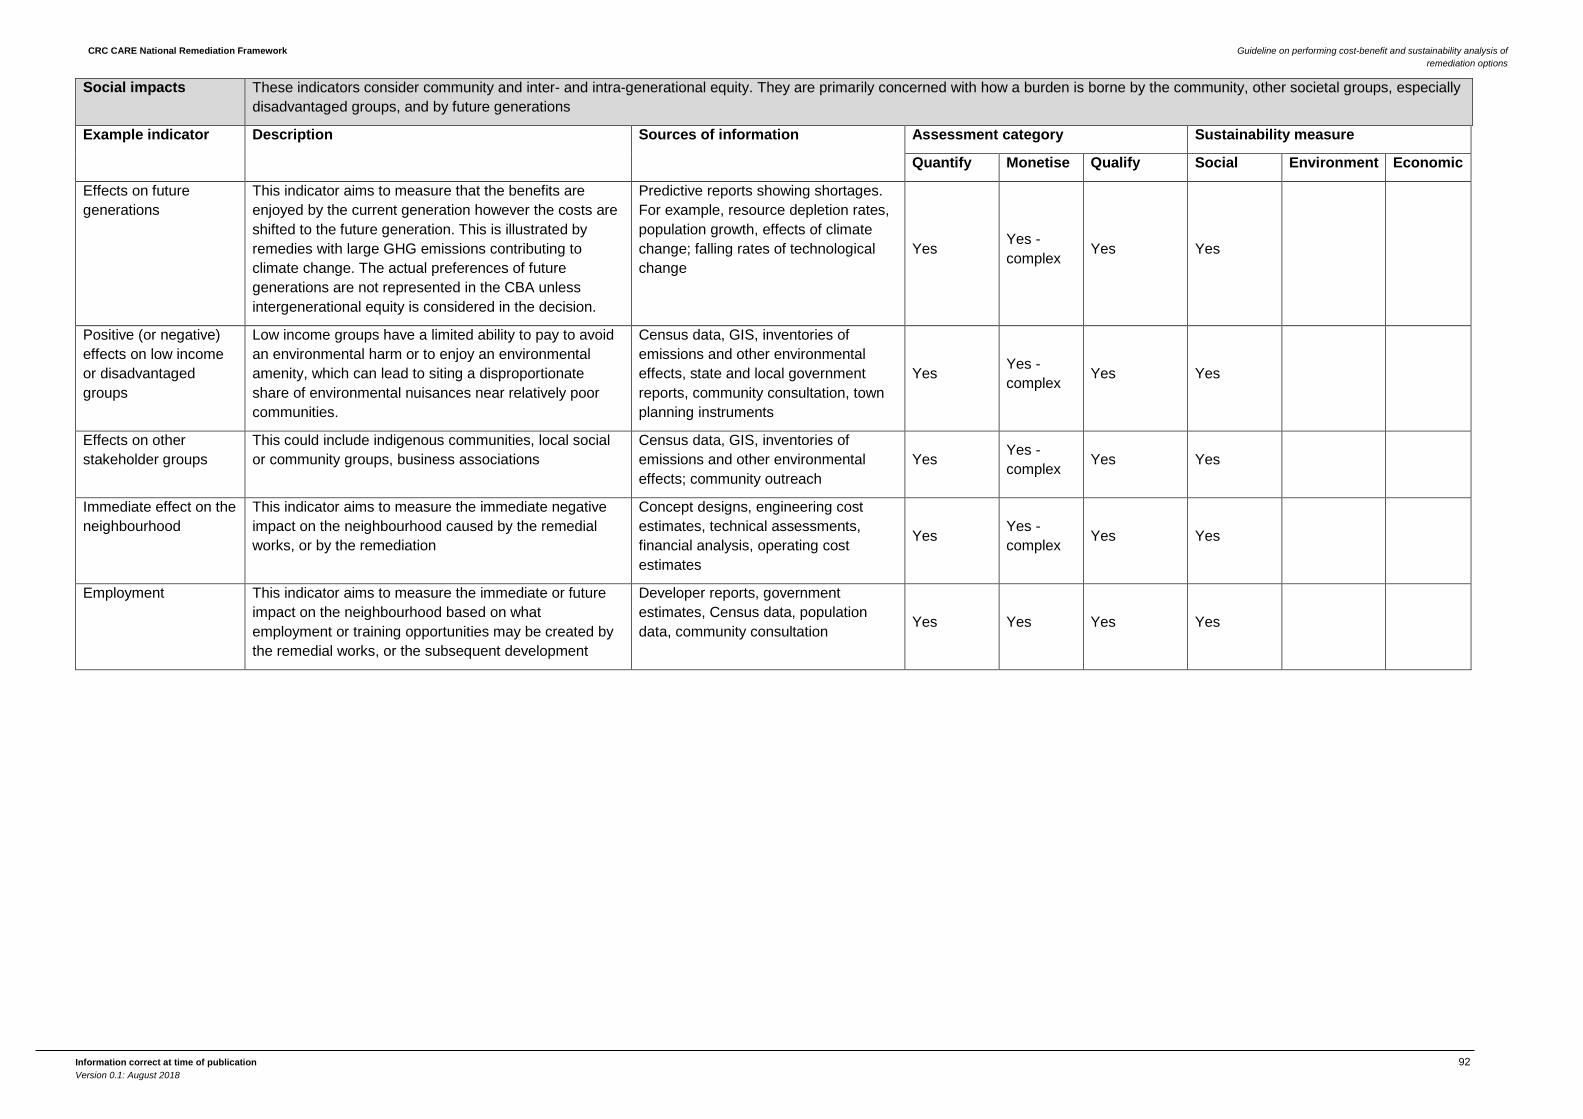
CRC CARE National Remediation Framework Guideline on performing cost-benefit and sustainability analysis of remediation options
Information correct at time of publication 92 Version 0.1: August 2018
Social impacts These indicators consider community and inter- and intra-generational equity. They are primarily concerned with how a burden is borne by the community, other societal groups, especially disadvantaged groups, and by future generations
Example indicator Description Sources of information Assessment category Sustainability measure
Quantify Monetise Qualify Social Environment Economic
Effects on future generations
This indicator aims to measure that the benefits are enjoyed by the current generation however the costs are shifted to the future generation. This is illustrated by remedies with large GHG emissions contributing to climate change. The actual preferences of future generations are not represented in the CBA unless intergenerational equity is considered in the decision.
Predictive reports showing shortages. For example, resource depletion rates, population growth, effects of climate change; falling rates of technological change
Yes Yes - complex Yes Yes
Positive (or negative) effects on low income or disadvantaged groups
Low income groups have a limited ability to pay to avoid an environmental harm or to enjoy an environmental amenity, which can lead to siting a disproportionate share of environmental nuisances near relatively poor communities.
Census data, GIS, inventories of emissions and other environmental effects, state and local government reports, community consultation, town planning instruments
Yes Yes - complex Yes Yes
Effects on other stakeholder groups
This could include indigenous communities, local social or community groups, business associations
Census data, GIS, inventories of emissions and other environmental effects; community outreach
Yes Yes - complex Yes Yes
Immediate effect on the neighbourhood
This indicator aims to measure the immediate negative impact on the neighbourhood caused by the remedial works, or by the remediation
Concept designs, engineering cost estimates, technical assessments, financial analysis, operating cost estimates
Yes Yes - complex Yes Yes
Employment This indicator aims to measure the immediate or future impact on the neighbourhood based on what employment or training opportunities may be created by the remedial works, or the subsequent development
Developer reports, government estimates, Census data, population data, community consultation Yes Yes Yes Yes
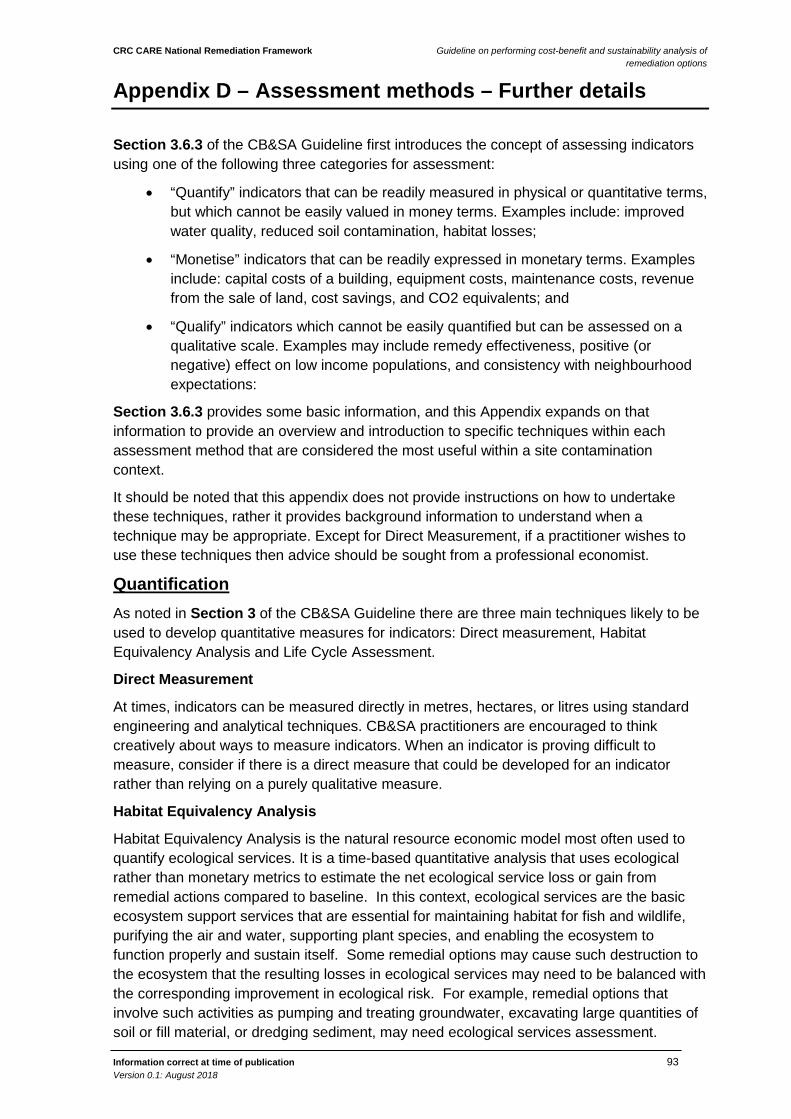
CRC CARE National Remediation Framework Guideline on performing cost-benefit and sustainability analysis of remediation options
Information correct at time of publication 93 Version 0.1: August 2018
Appendix D – Assessment methods – Further details
Section 3.6.3 of the CB&SA Guideline first introduces the concept of assessing indicators using one of the following three categories for assessment:
• “Quantify” indicators that can be readily measured in physical or quantitative terms, but which cannot be easily valued in money terms. Examples include: improved water quality, reduced soil contamination, habitat losses;
• “Monetise” indicators that can be readily expressed in monetary terms. Examples include: capital costs of a building, equipment costs, maintenance costs, revenue from the sale of land, cost savings, and CO2 equivalents; and
• “Qualify” indicators which cannot be easily quantified but can be assessed on a qualitative scale. Examples may include remedy effectiveness, positive (or negative) effect on low income populations, and consistency with neighbourhood expectations:
Section 3.6.3 provides some basic information, and this Appendix expands on that information to provide an overview and introduction to specific techniques within each assessment method that are considered the most useful within a site contamination context.
It should be noted that this appendix does not provide instructions on how to undertake these techniques, rather it provides background information to understand when a technique may be appropriate. Except for Direct Measurement, if a practitioner wishes to use these techniques then advice should be sought from a professional economist.
Quantification As noted in Section 3 of the CB&SA Guideline there are three main techniques likely to be used to develop quantitative measures for indicators: Direct measurement, Habitat Equivalency Analysis and Life Cycle Assessment.
Direct Measurement
At times, indicators can be measured directly in metres, hectares, or litres using standard engineering and analytical techniques. CB&SA practitioners are encouraged to think creatively about ways to measure indicators. When an indicator is proving difficult to measure, consider if there is a direct measure that could be developed for an indicator rather than relying on a purely qualitative measure.
Habitat Equivalency Analysis
Habitat Equivalency Analysis is the natural resource economic model most often used to quantify ecological services. It is a time-based quantitative analysis that uses ecological rather than monetary metrics to estimate the net ecological service loss or gain from remedial actions compared to baseline. In this context, ecological services are the basic ecosystem support services that are essential for maintaining habitat for fish and wildlife, purifying the air and water, supporting plant species, and enabling the ecosystem to function properly and sustain itself. Some remedial options may cause such destruction to the ecosystem that the resulting losses in ecological services may need to be balanced with the corresponding improvement in ecological risk. For example, remedial options that involve such activities as pumping and treating groundwater, excavating large quantities of soil or fill material, or dredging sediment, may need ecological services assessment.

CRC CARE National Remediation Framework Guideline on performing cost-benefit and sustainability analysis of remediation options
Information correct at time of publication 94 Version 0.1: August 2018
By quantifying the gains and losses in valued ecological services using environmental metrics, this gives a direct measure of the net environmental benefit, which is transparent to stakeholders. This provides a practical means for taking environmental effects into consideration without taking the step of converting those changes to their monetary values, which can involve a large level of effort and require specialised expertise.
The ecological metrics that are used for assessing the gains and losses can be developed at the level of rigor needed to support the decision and can range from a desk top exercise using readily available data to sophisticated modelling.
If a practitioner has engaged a professional to undertake a habitat equivalency analysis or similar, the results and outputs can be integrated into the CB&SA as performance indicator measurements.
Life Cycle Assessment
Life cycle assessment (LCA) is a process for looking beyond the effectiveness of the remedy on site to consider the impact that implementing the remedy has external to the site.
This includes considering the potential for creating externalities at each stage of implementing the option, from the point of producing the remedial technology, transporting components to the site, implementing the technology on site, and disposing of residuals.
Within LCA, a footprint analysis can streamline the assessment by assessing the changes in a single indicator (such as carbon dioxide equivalents) to facilitate expedient comparisons of unintended environmental burdens from selecting an option.
There are four tools that are typically used in the remediation industry to assess the environmental burden of a remediation project:
• SiteWise – developed by Battelle, the Naval Facilities Engineering Command, and the U.S. Army Corps of Engineers (USACE) in 2010 (V1) and 2012 (V2)
• Sustainable Remediation Tool (SRT™) – developed by the U.S. Air Force Center for Engineering and the Environment (AFCEE) in 2009 (V1) and 2011 (V2)
• Spreadsheets for Environmental Footprint Analysis (SEFA) – developed by EPA in 2012
• Commercial LCA tools (e.g., SimaPro® or GaBi®)
The first three tools are referred to as footprint tools. The fourth tool is a more comprehensive LCA tool.
In the context of site remediation, perhaps the single most significant environmental burden is related to energy use, which can occur during every phase of the remediation life-cycle. The processes of developing and using energy creates multiple environmental externalities depending upon the type of energy. Thus, accounting for energy used in manufacturing inputs, transporting inputs to the site, implementing the remedial technology on-site and disposing of residuals is a good place for practitioners to assess the relative environmental burdens of their options.
However, it should be noted that integrating the results and outputs of an LCA within the CB&SA can lead to double counting (refer to Section 3.4 for more information) if the elements from the LCA are also included within other indicators.
CRC CARE National Remediation Framework Guideline on performing cost-benefit and sustainability analysis of remediation options
Information correct at time of publication 95 Version 0.1: August 2018
Monetizing Techniques For indicators being included with the CBA portion of the CB&SA, it is necessary to monetise the estimates. Mathematically, it is logical that indicators need to be both quantified and monetised, that is the need to have both a quantity and a value. So, practitioners intending to monetise indicators may need to use a combination of the quantification tools above, along with the monetising techniques below, to estimate the indicator for each option.
It should be noted that the monetising techniques described in this appendix are not essential for carrying out a rigorous CB&SA, and are provided for background information only, to understand when a technique may be appropriate. If a practitioner wishes to use these techniques, then advice should be sought from a professional economist.
It should also be noted that undertaking the CB&SA process using only CBA techniques may require specialist economic expertise to be consulted, as many indicators can be complex to monetise adequately.
Willingness to Pay
The economic basis for quantifying effects of remedial options in monetary terms is that people can trade some of their money for goods and services and maintain the same level of well-being. The amount that they are willing to trade is called their willingness to pay (WTP). Society’s WTP is usually taken to be the sum of WTP across the individuals who constitute the public. Society will ultimately sacrifice other goods and services to achieve an increase in environmental amenities. If society’s WTP is greater than the opportunity cost of providing the environmental amenity, then economic efficiency is improved (that is, resources will be redirected away from lower-valued uses to higher-valued uses from the broader societal perspective).
For a measure of net benefits, the cost to the consumer (price) is subtracted from total WTP. This net willingness to pay is called the consumer surplus, or the benefit received over and above the cost to the consumer. Similarly, on the supply side of the market, the net benefit to the producer is the amount received in payment over and above the cost of production, or producer surplus. The total benefits of the option are given by the sum of the changes in consumer and producer surpluses in the affected markets plus any additional willingness to pay for the nonmarket goods or services that result from the action, all measured relative to the no-action alternative.
Defensive Expenditure or Averting Behaviour Models
Defensive expenditure and averting behavior models infer values from behavior individuals undertake to avoid harm or to mitigate the impacts of environmental damages. Usually this technique is applied to estimate the benefits of reduced human health risks, especially associated with such effects as drinking water contamination, cancer risks, or contamination from radon. An example of this is when individuals purchase bottled water or boil water before drinking it to avoid contamination. The technique can also be applied to behaviours to avoid disadvantages such as unpleasant tastes, odours, or noise.
This technique is often referred to as a revealed preference model. The data requirements for revealed preference models can be quite extensive. In addition, it can be difficult to isolate the cause or reason for the behaviours to separately value the environmental change of interest. For example, some people who purchase bottled water may perceive other health or convenience benefits besides avoiding contamination.

CRC CARE National Remediation Framework Guideline on performing cost-benefit and sustainability analysis of remediation options
Information correct at time of publication 96 Version 0.1: August 2018
Sometimes, defensive expenditures can be part of the remedy. For example, in the case of groundwater contamination, where the groundwater is a source of drinking water for a small number of people, it could be economically viable to truck potable water to the affected population until they can be connected to a public water supplier. In that case the costs of trucking the water and making the connection place a lower bound on the value of a clean potable groundwater supply.
Hedonic Pricing Models
Hedonic pricing models are sometimes used to estimate the WTP for environmental amenities such as improved water quality, cleaner air, unobstructed scenic views, clean-up of contaminated sites nearby, reduced flood damage, and improved fish and wildlife habitat.
These models rely on differentials in housing and property prices to determine how much extra people are willing to pay for environmental enhancements compared to similar properties without such enhancements. The applicability of hedonic pricing models depends on the extent to which the options are expected to result in measurable environmental improvements that would be reflected in property values. In addition, the extensive data requirements and significant empirical issues are generally important considerations in choosing this valuation technique.
Economic theory offers limited guidance in sorting through such issues as the choice of functional form and the definition of the extent of the market, and yet both decisions can have a significant effect on the benefit estimates. Also, this technique can only capture the benefits for property owners, so it must generally be combined with other techniques to capture all the benefits of the option. Finally, when attempting to combine hedonic pricing models with other techniques, care must be taken to avoid double counting benefits. In the case of site remediation, the value of the previously contaminated site and the surrounding parcels can be expected to increase with the reduction in the actual and perceived health risks and with the improvement in aesthetics.
Stated Preference Technique
Stated preference techniques attempt to measure WTP based on what people say rather than inferring it by observing their behavior. These techniques generally use surveys of a representative sample of the relevant population to elicit their preferences regarding WTP, or to infer WTP based on the choices survey respondents make when offered trade-offs.
Such surveys are different than public opinion polls because stated preference techniques attempt to elicit the respondents’ behavioural intentions or the actual choices they would make given the opportunity. These techniques can be used to value direct services such as health improvements and recreation opportunities, as well as the passive use values associated with protecting or restoring natural resources and ecosystem services.
The advantage of such surveys lies in estimating passive use values, as these values cannot be estimated using market or revealed preference techniques.
Stated preference techniques are ordinarily costly to implement and are controversial because of the difficulties associated with clearly defining what is being valued, and also with addressing if respondents are willing and able to articulate their WTP or express behavioural choices in a survey situation.
This technique would likely only be applied to very complex and costly site remediation situations that are expected to result in outcomes of great importance to the region, but where it may be necessary to commit government funds to the clean-up.
CRC CARE National Remediation Framework Guideline on performing cost-benefit and sustainability analysis of remediation options
Information correct at time of publication 97 Version 0.1: August 2018
Production Function Techniques
Production functions (or cost functions) can be estimated for either market or nonmarket goods. This technique is used predominantly to value the contribution of indirect services toward production of the primary good or service. For example, changes in air quality can affect agriculture and commercial timber industries, and water quality changes can affect water supply treatment costs or the production costs of industry processors, irrigation operations, and commercial fisheries.
It follows that options that differ in terms of their intended or unintended effects on communal resources (for example drinking water sources, air quality, soil quality) can alter the costs of producing final products including drinking water, agricultural crops, timber and fish.
Although data intensive, the production function technique results in benefit estimates that are relatively understandable to most stakeholders and are thus easier to defend than some of the benefits estimated from most of the other techniques.
Cost of Illness
As the name implies, the cost of illness technique for estimating the benefits of avoiding illness combines estimates of the direct and indirect costs associated with the illness.
Within the context of this guideline, and the contaminated sites industry, the cost of illness is linked to the remedial criteria.
By including human health validation criteria as a threshold indictor, the practitioner has implicitly included cost of illness within the CB&SA, and therefore it is not considered further in this appendix.
Recreation Demand Models
Outdoor recreation in a natural setting is often unpriced or underpriced, especially when it takes place on public property, such as in national, regional, or local parks and waterways. Improved recreation opportunities can be a significant source of benefits from establishing new parks, as well as making improvements to existing resources such as fish populations, wildlife habitat and populations, streamside aesthetics, and water quality improvements.
Recreation demand models can be used to estimate the recreation benefits generated by the changes in environmental conditions. In such models, the observed recreation patterns of users is related to the cost of travel, including travel time, and the quality characteristics of the recreation sites (for example, fish catch rates of desirable species) available to the relevant population of users. These models essentially estimate demand curves for recreation, where the cost of travel is assumed to correspond to price of admission to the site. Because recreation demand models rely on observed recreation patterns, the resultant benefit estimates are generally more credible to most stakeholders than the results from stated preference studies. However, the data requirements for conducting an original study can be substantial and the results can be sensitive to the model specification.
Benefit Transfer Techniques
The benefits transfer technique is a practical alternative to valuation techniques involving the collection of original data on preferences. This valuation technique relies on approaches toward transferring value estimates or WTP functions from existing studies to a different application. In other words. It relies upon results from one or more of the previous valuation techniques and best professional judgment about the applicability of those value estimates to the new context. The reliability and validity of such transferred values depend on the
CRC CARE National Remediation Framework Guideline on performing cost-benefit and sustainability analysis of remediation options
Information correct at time of publication 98 Version 0.1: August 2018
quality of the original studies as well as the degree of similarity between the original context in which the values were estimated and the new context.
The issues related to the reliability and validity of value estimates obtained from any other valuation technique are, therefore, present and exacerbated in the case of benefit transfer analysis.
The benefits transfer technique is a practical valuation alternative when direct survey data concerning an identified issue are unavailable, but at best it will produce order-of-magnitude estimates. As with each of the valuation tools, if the degree of accuracy is not sufficient for supporting a decision, further analysis may be required. Although benefit transfer techniques are less costly and time consuming than the other valuation techniques, they nonetheless require some effort to produce credible results. Subjective judgments and assumptions, their expected impact on final estimates, and expected ranges in uncertainty all require descriptions to interpret the results.
Social Cost of Carbon
The economic damages from carbon dioxide (CO2) emissions and the associated climate change include losses in agricultural crops, human health effects, materials damages, failed infrastructure, and loss of business. These social costs of carbon represent the benefits from reducing greenhouse gas emissions and are thus estimated for comparison with the cost of actions intended to reduce CO2 emissions.
The social cost of carbon can be an important parameter to consider in comparing remedial options that differ in their energy and/or transportation requirements as the power and transportation sectors are the largest emitters of greenhouse gas emissions.
The social cost of carbon (SCC) is estimated by the present value of the stream of future economic damages associated with an incremental increase (by convention, 1 tonne) in CO2 emissions in a year. This means that metric tons emitted in different years will have a different social cost. Ideally, this comprehensive measure includes most of the economically significant losses resulting from changes in agricultural productivity, human health risks, property damages and loss of business from increased flood and storm frequencies, and the loss of ecosystem services. Simplifying assumptions have been made to develop estimates using the current state of knowledge, but the climate economics literature is evolving at a relatively rapid rate.
Therefore, if the practitioner wishes to incorporate a social cost of carbon into the CB&SA, local and current estimates should be sought. In addition, the discount rate applied to the cost of carbon should be considered carefully, possibly including a sensitivity analysis.
Qualitative In many projects there will be indicators that are important to decision making that cannot be estimated quantitatively. In those circumstances it is important that the indicator be included in the analysis and can be estimated using a qualitative scale (referred to at times as a “constructed scale” or “subjective scale”).
For qualitative scales it is important to develop a verbal representation of various points of measure along the scale to give consistency in scoring among options, and to enhance transparency of the analysis for stakeholders.
An example showing how qualitative scales can be constructed is provided in the table below.
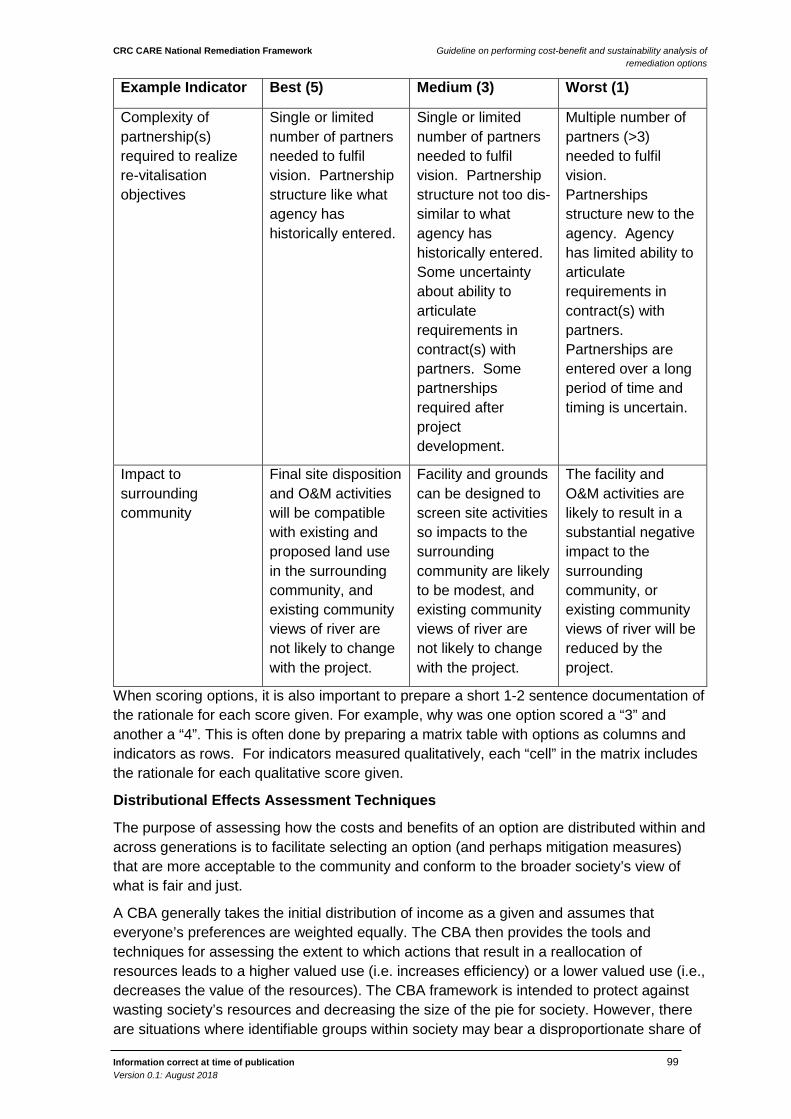
CRC CARE National Remediation Framework Guideline on performing cost-benefit and sustainability analysis of remediation options
Information correct at time of publication 99 Version 0.1: August 2018
Example Indicator Best (5) Medium (3) Worst (1)
Complexity of partnership(s) required to realize re-vitalisation objectives
Single or limited number of partners needed to fulfil vision. Partnership structure like what agency has historically entered.
Single or limited number of partners needed to fulfil vision. Partnership structure not too dis-similar to what agency has historically entered. Some uncertainty about ability to articulate requirements in contract(s) with partners. Some partnerships required after project development.
Multiple number of partners (>3) needed to fulfil vision. Partnerships structure new to the agency. Agency has limited ability to articulate requirements in contract(s) with partners. Partnerships are entered over a long period of time and timing is uncertain.
Impact to surrounding community
Final site disposition and O&M activities will be compatible with existing and proposed land use in the surrounding community, and existing community views of river are not likely to change with the project.
Facility and grounds can be designed to screen site activities so impacts to the surrounding community are likely to be modest, and existing community views of river are not likely to change with the project.
The facility and O&M activities are likely to result in a substantial negative impact to the surrounding community, or existing community views of river will be reduced by the project.
When scoring options, it is also important to prepare a short 1-2 sentence documentation of the rationale for each score given. For example, why was one option scored a “3” and another a “4”. This is often done by preparing a matrix table with options as columns and indicators as rows. For indicators measured qualitatively, each “cell” in the matrix includes the rationale for each qualitative score given.
Distributional Effects Assessment Techniques
The purpose of assessing how the costs and benefits of an option are distributed within and across generations is to facilitate selecting an option (and perhaps mitigation measures) that are more acceptable to the community and conform to the broader society’s view of what is fair and just.
A CBA generally takes the initial distribution of income as a given and assumes that everyone’s preferences are weighted equally. The CBA then provides the tools and techniques for assessing the extent to which actions that result in a reallocation of resources leads to a higher valued use (i.e. increases efficiency) or a lower valued use (i.e., decreases the value of the resources). The CBA framework is intended to protect against wasting society’s resources and decreasing the size of the pie for society. However, there are situations where identifiable groups within society may bear a disproportionate share of
CRC CARE National Remediation Framework Guideline on performing cost-benefit and sustainability analysis of remediation options
Information correct at time of publication 100 Version 0.1: August 2018
the costs of an environmental remedy. Thus, society may be willing to pay more for remedial options that avoid what society views as an adverse social impact.
A second attribute of CBA is that it assesses every cost and benefit using current year dollars through the discounting process. This is an attractive feature for evaluating options because the options can then be ranked according to their net present value. By choosing the plan with the highest net present value, one maximizes the size of the economic pie. However, the discounting process down-weights the costs and benefits that accrue to future generations. Furthermore, the actual preferences of future generations are not considered in the CBA. This raises the question of intergenerational equity, especially when the benefits are enjoyed by the current generation and the costs are shifted to the future generation. An example of this is options with large greenhouse gas emissions contributing to climate change.
According to the Australian Government, Office of Best Practice Guidance for conducting CBA, the role of CBA in facilitating efficiency should be kept separate from the equity considerations. In this way, society can make a clear and transparent decision about how much it is willing to pay for achieving a redistribution of resources that society views as fairer. This does not mean that the efficiency question is differently important than the equity concerns. Rather, the reason for keeping the evaluations separate is because that is a clear way to evaluate both efficiency and equity and make explicit trade-offs between them. This CB&SA guideline achieves this by allowing the NPV to be either included or separated from the MCA score.
The process of identifying distributional effects is relatively straightforward. The first step is to identify the societal groups that could bear disproportionate effects of an action. The second step is to compare the population demographics of the impact area to the demographics for the comparison geographies. In Australia, candidate impact and comparison areas can be selected from the ASGS areas used for the Census, available at:
http://www.abs.gov.au/ausstats/[email protected]/Lookup/2901.0Chapter23102011
The purpose of the comparison is to ascertain whether the impact areas contain a disproportionate share of a certain group, such as the population living below the poverty level and/or indigenous populations. If significant effects are identified, then one approach is to incorporate appropriate mitigation measures into the option. A second approach is to construct a qualitative scale to assess the relative positive or adverse distributional effects of each remedial option and to include this scale in the MCA. The qualitative scale approach is also a useful tool for taking intergenerational equity considerations into account as well as other concerns of stakeholder groups.
CRC CARE National Remediation Framework Guideline on performing cost-benefit and sustainability analysis of remediation options
Information correct at time of publication 101 Version 0.1: August 2018
Appendix E – Case studies
The case studies presented within this section have been designed to illustrate the core concepts and methodology presented in both the Tool and the Guideline. The specifics (sites, nature of the contamination, options and results) are based on real-world sites, however they have been altered to maximise the number of concepts able to be illustrated. As such, the details presented within the case studies should not be used for, or become the basis of, input into other CB&SA assessments.
Case Study 1 Previous environmental investigations at a site have identified volatile organic compounds (VOCs) beneath an on-site building. The investigations concluded that the VOC contamination is the result of a former dry-cleaning operation at the site, which reported a history of chlorinated solvent spills during its operation.
The VOC plume is comprised of tetrachloroethene (PCE) and has been vertically delineated to approximately 10 metres below ground level (mbgl) and laterally delineated to dimensions of approximately 20m x 30m. The site is currently zoned for commercial / industrial land use; however, it is located within a residential area. The site features clay soils to a depth of approximately 15m, with groundwater encountered at approximately 20m in fractured shale bedrock.
The current owner of the site wishes to sell the facility within 18 months with no trailing environmental liabilities, thereby enabling the site to be redeveloped for standard residential use.
As part of the environmental investigations, a human health risk assessment (HHRA) was completed, which concluded that given the current layout and use of the site, the VOC contamination in shallow soils presents a potential unacceptable risk to future residential site users, based on PCE vapour within buildings. The environmental investigation concluded that given the depth to groundwater, the current risk to groundwater is considered low, and the indoor vapour risks are the dominant driver for the remediation strategy. While the contamination was identified up to 10m bgl, the HHRA indicated that remediation of soils up to 6m bgl would be sufficient to mitigate the risk to site users under a residential land use scenario.
The site owner wishes to take a precautionary approach to the remediation, including understanding the costs and benefits of treating soil to a depth greater than the recommended 6m. The site owner also prefers innovative technology, within reasonable cost.
Following the HHRA, the contaminated land consultant was engaged to prepare a remedial action plan (RAP), with a CB&SA as part of the remedial options assessment.
Define the Objectives and Problem and Engage with Decision Maker
As part of preparing the cost estimate to undertake the RAP, the consultant confirmed that the ultimate decision maker with delegated authority to approve the project was the Site Owner’s nominated Project Director.
Also, as part of preparing the cost estimate to prepare the RAP, the consultant discussed and confirmed the project objectives with the Project Director, along with identifying the key
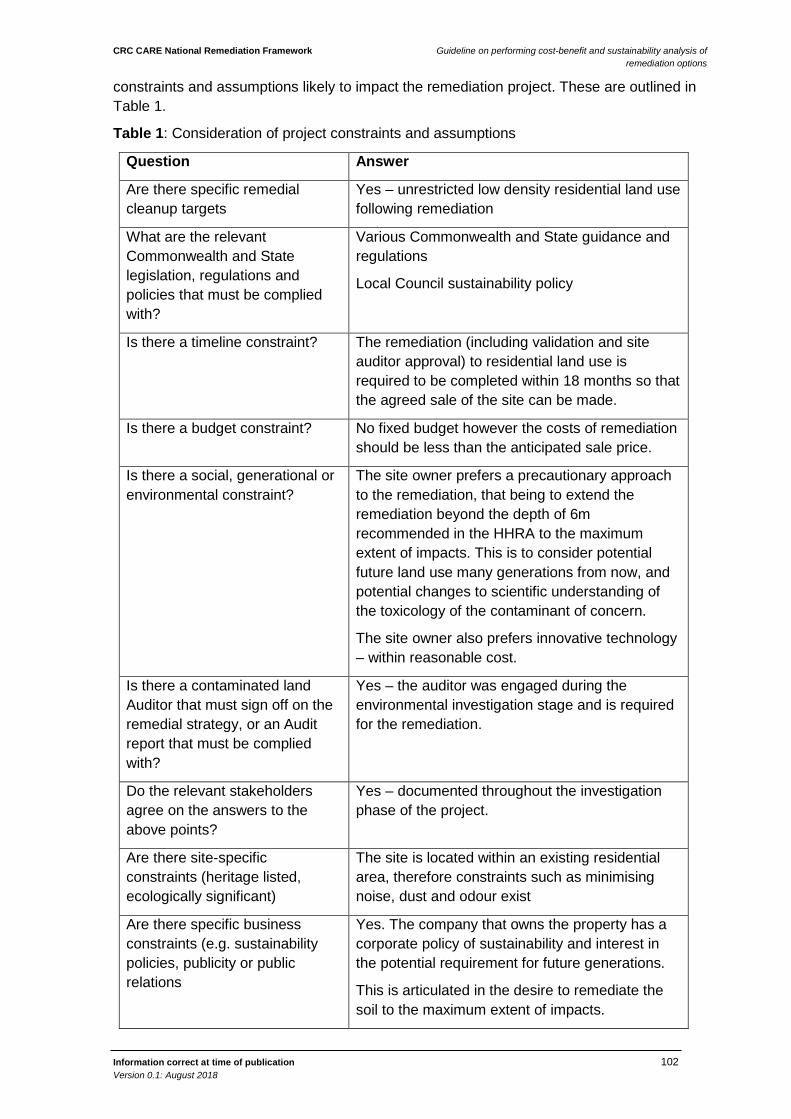
CRC CARE National Remediation Framework Guideline on performing cost-benefit and sustainability analysis of remediation options
Information correct at time of publication 102 Version 0.1: August 2018
constraints and assumptions likely to impact the remediation project. These are outlined in Table 1.
Table 1: Consideration of project constraints and assumptions
Question Answer
Are there specific remedial cleanup targets
Yes – unrestricted low density residential land use following remediation
What are the relevant Commonwealth and State legislation, regulations and policies that must be complied with?
Various Commonwealth and State guidance and regulations
Local Council sustainability policy
Is there a timeline constraint? The remediation (including validation and site auditor approval) to residential land use is required to be completed within 18 months so that the agreed sale of the site can be made.
Is there a budget constraint? No fixed budget however the costs of remediation should be less than the anticipated sale price.
Is there a social, generational or environmental constraint?
The site owner prefers a precautionary approach to the remediation, that being to extend the remediation beyond the depth of 6m recommended in the HHRA to the maximum extent of impacts. This is to consider potential future land use many generations from now, and potential changes to scientific understanding of the toxicology of the contaminant of concern.
The site owner also prefers innovative technology – within reasonable cost.
Is there a contaminated land Auditor that must sign off on the remedial strategy, or an Audit report that must be complied with?
Yes – the auditor was engaged during the environmental investigation stage and is required for the remediation.
Do the relevant stakeholders agree on the answers to the above points?
Yes – documented throughout the investigation phase of the project.
Are there site-specific constraints (heritage listed, ecologically significant)
The site is located within an existing residential area, therefore constraints such as minimising noise, dust and odour exist
Are there specific business constraints (e.g. sustainability policies, publicity or public relations
Yes. The company that owns the property has a corporate policy of sustainability and interest in the potential requirement for future generations.
This is articulated in the desire to remediate the soil to the maximum extent of impacts.
CRC CARE National Remediation Framework Guideline on performing cost-benefit and sustainability analysis of remediation options
Information correct at time of publication 103 Version 0.1: August 2018
Based on this information, the consultant developed the following Objective Statement in consultation with the Project Director:
The objectives of the remediation are to:
• Make the site suitable for residential land use within 18 months;
• Adopt a remedial technology that is the most sustainable solution, whilst being technically and practically possible, with appropriate consideration of cost, and complying with relevant state and national guidelines and legislation; and
• Consider the residents near the site.
Remedial and Site Use Options
As part of preparing the RAP, the consultant undertook a remedial options identification process to identify technically feasible remedial solutions.
This identified the following remedial technologies that were technically capable of remediating the soil contamination:
• Option 1: In-situ soil mixing with zero valent iron / slurry mix,
• Option 2: In-situ thermal,
• Option 3: Offsite disposal,
• Option 4: Excavation and vent pile construction,
• Option 5: Excavation followed by chemical oxidation treatment,
• Option 6: Excavation followed by quick lime soil mixing, and
• Option 7: Base-case – no remediation, with ongoing indoor vapour and groundwater monitoring.
Identify and Engage Key Stakeholders
During the investigation phase of the contamination assessment, the following stakeholders were identified:
• Site Owner – Project director,
• Local Council,
• EPA,
• Site Contamination Consultant,
• Auditor, and
• Adjacent Residents.
To engage the relevant stakeholders, the Project Director held a meeting with the stakeholders to facilitate brainstorming on remedial options, and to highlight any important points the stakeholders wanted considered. The following stakeholders were invited:
• Site Owner – Project Director (Decision Maker),
• Site Owner – Environmental Officer,
• Site Owner – Finance Officer,
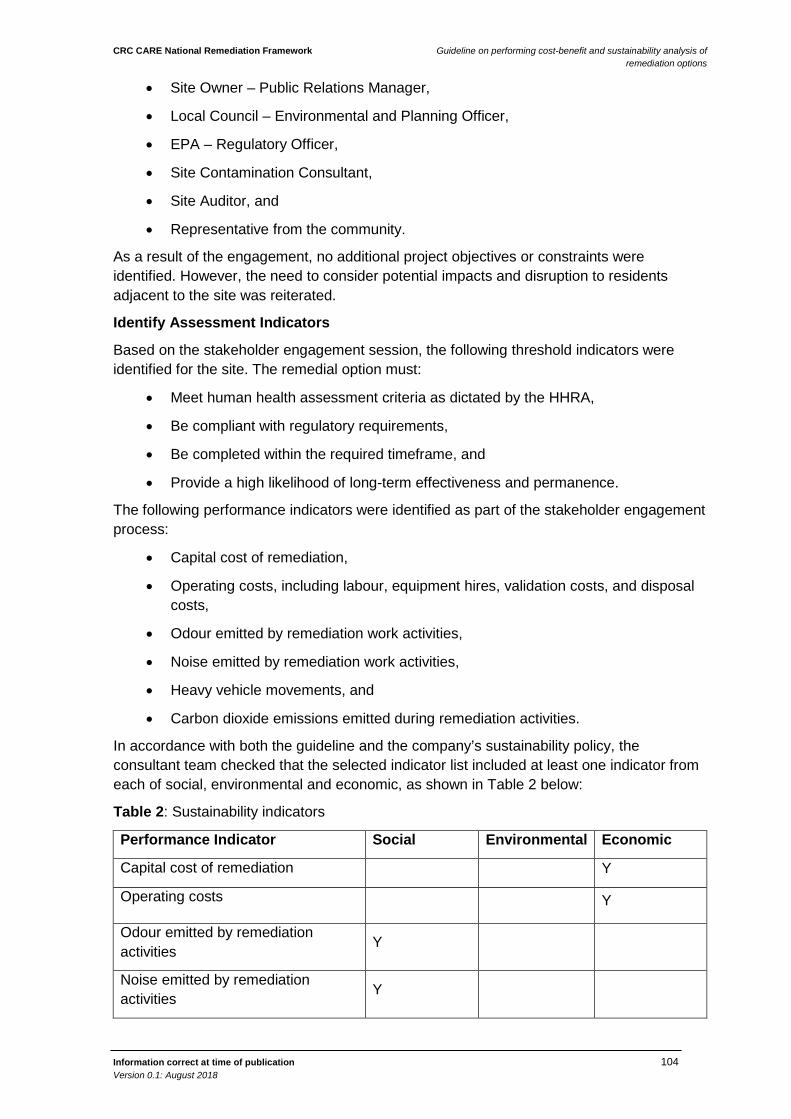
CRC CARE National Remediation Framework Guideline on performing cost-benefit and sustainability analysis of remediation options
Information correct at time of publication 104 Version 0.1: August 2018
• Site Owner – Public Relations Manager,
• Local Council – Environmental and Planning Officer,
• EPA – Regulatory Officer,
• Site Contamination Consultant,
• Site Auditor, and
• Representative from the community.
As a result of the engagement, no additional project objectives or constraints were identified. However, the need to consider potential impacts and disruption to residents adjacent to the site was reiterated.
Identify Assessment Indicators
Based on the stakeholder engagement session, the following threshold indicators were identified for the site. The remedial option must:
• Meet human health assessment criteria as dictated by the HHRA,
• Be compliant with regulatory requirements,
• Be completed within the required timeframe, and
• Provide a high likelihood of long-term effectiveness and permanence.
The following performance indicators were identified as part of the stakeholder engagement process:
• Capital cost of remediation,
• Operating costs, including labour, equipment hires, validation costs, and disposal costs,
• Odour emitted by remediation work activities,
• Noise emitted by remediation work activities,
• Heavy vehicle movements, and
• Carbon dioxide emissions emitted during remediation activities.
In accordance with both the guideline and the company’s sustainability policy, the consultant team checked that the selected indicator list included at least one indicator from each of social, environmental and economic, as shown in Table 2 below:
Table 2: Sustainability indicators
Performance Indicator Social Environmental Economic
Capital cost of remediation Y
Operating costs Y
Odour emitted by remediation activities Y
Noise emitted by remediation activities Y
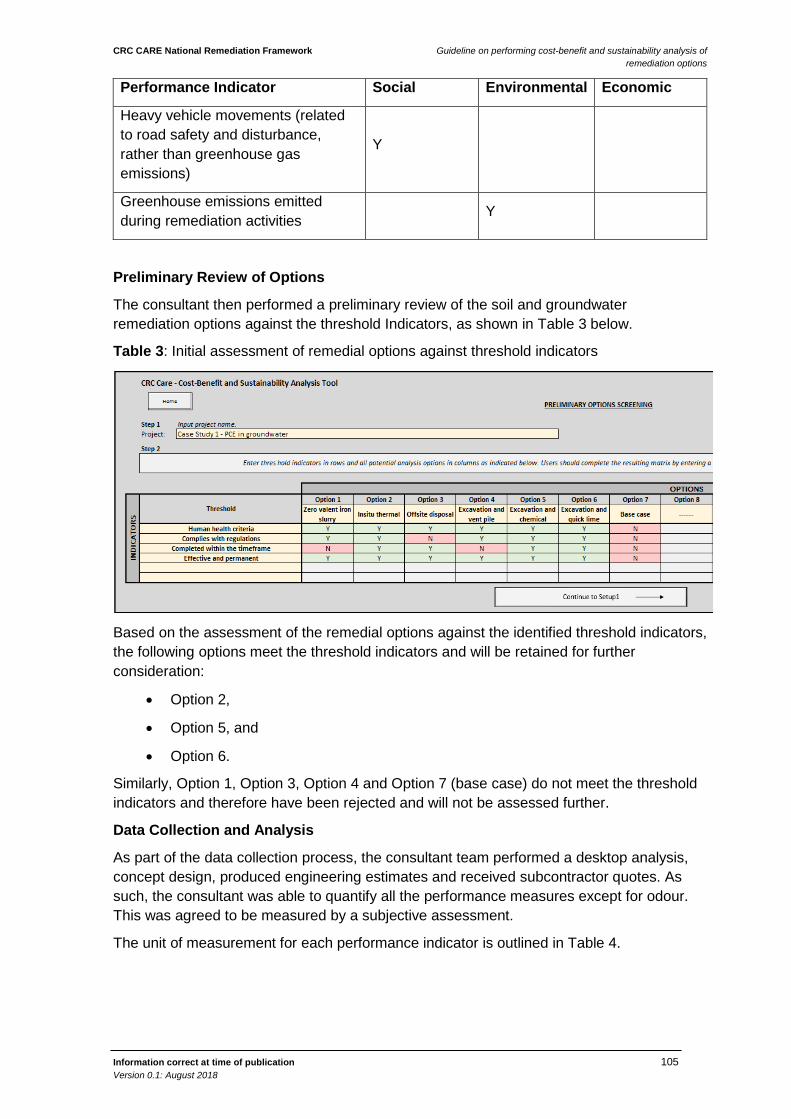
CRC CARE National Remediation Framework Guideline on performing cost-benefit and sustainability analysis of remediation options
Information correct at time of publication 105 Version 0.1: August 2018
Performance Indicator Social Environmental Economic
Heavy vehicle movements (related to road safety and disturbance, rather than greenhouse gas emissions)
Y
Greenhouse emissions emitted during remediation activities Y
Preliminary Review of Options
The consultant then performed a preliminary review of the soil and groundwater remediation options against the threshold Indicators, as shown in Table 3 below.
Table 3: Initial assessment of remedial options against threshold indicators
Based on the assessment of the remedial options against the identified threshold indicators, the following options meet the threshold indicators and will be retained for further consideration:
• Option 2,
• Option 5, and
• Option 6.
Similarly, Option 1, Option 3, Option 4 and Option 7 (base case) do not meet the threshold indicators and therefore have been rejected and will not be assessed further.
Data Collection and Analysis
As part of the data collection process, the consultant team performed a desktop analysis, concept design, produced engineering estimates and received subcontractor quotes. As such, the consultant was able to quantify all the performance measures except for odour. This was agreed to be measured by a subjective assessment.
The unit of measurement for each performance indicator is outlined in Table 4.
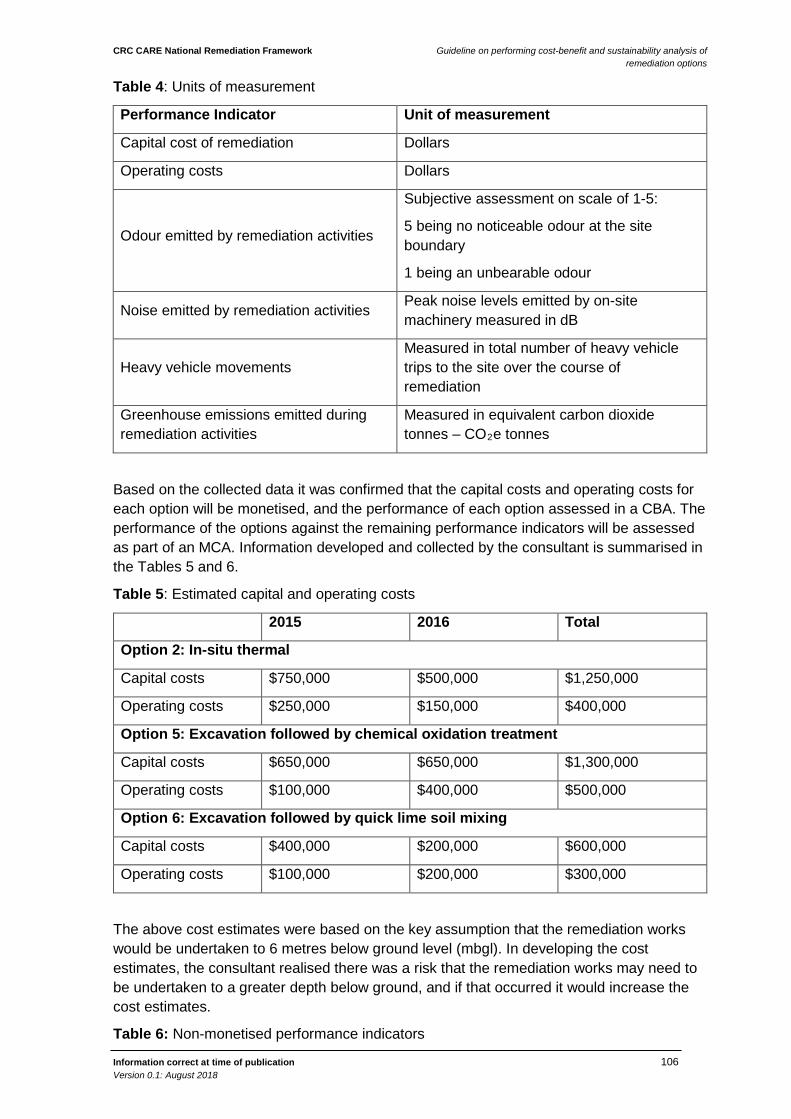
CRC CARE National Remediation Framework Guideline on performing cost-benefit and sustainability analysis of remediation options
Information correct at time of publication 106 Version 0.1: August 2018
Table 4: Units of measurement
Performance Indicator Unit of measurement
Capital cost of remediation Dollars
Operating costs Dollars
Odour emitted by remediation activities
Subjective assessment on scale of 1-5:
5 being no noticeable odour at the site boundary
1 being an unbearable odour
Noise emitted by remediation activities Peak noise levels emitted by on-site machinery measured in dB
Heavy vehicle movements Measured in total number of heavy vehicle trips to the site over the course of remediation
Greenhouse emissions emitted during remediation activities
Measured in equivalent carbon dioxide tonnes – CO2e tonnes
Based on the collected data it was confirmed that the capital costs and operating costs for each option will be monetised, and the performance of each option assessed in a CBA. The performance of the options against the remaining performance indicators will be assessed as part of an MCA. Information developed and collected by the consultant is summarised in the Tables 5 and 6.
Table 5: Estimated capital and operating costs
2015 2016 Total
Option 2: In-situ thermal
Capital costs $750,000 $500,000 $1,250,000
Operating costs $250,000 $150,000 $400,000
Option 5: Excavation followed by chemical oxidation treatment
Capital costs $650,000 $650,000 $1,300,000
Operating costs $100,000 $400,000 $500,000
Option 6: Excavation followed by quick lime soil mixing
Capital costs $400,000 $200,000 $600,000
Operating costs $100,000 $200,000 $300,000
The above cost estimates were based on the key assumption that the remediation works would be undertaken to 6 metres below ground level (mbgl). In developing the cost estimates, the consultant realised there was a risk that the remediation works may need to be undertaken to a greater depth below ground, and if that occurred it would increase the cost estimates.
Table 6: Non-monetised performance indicators
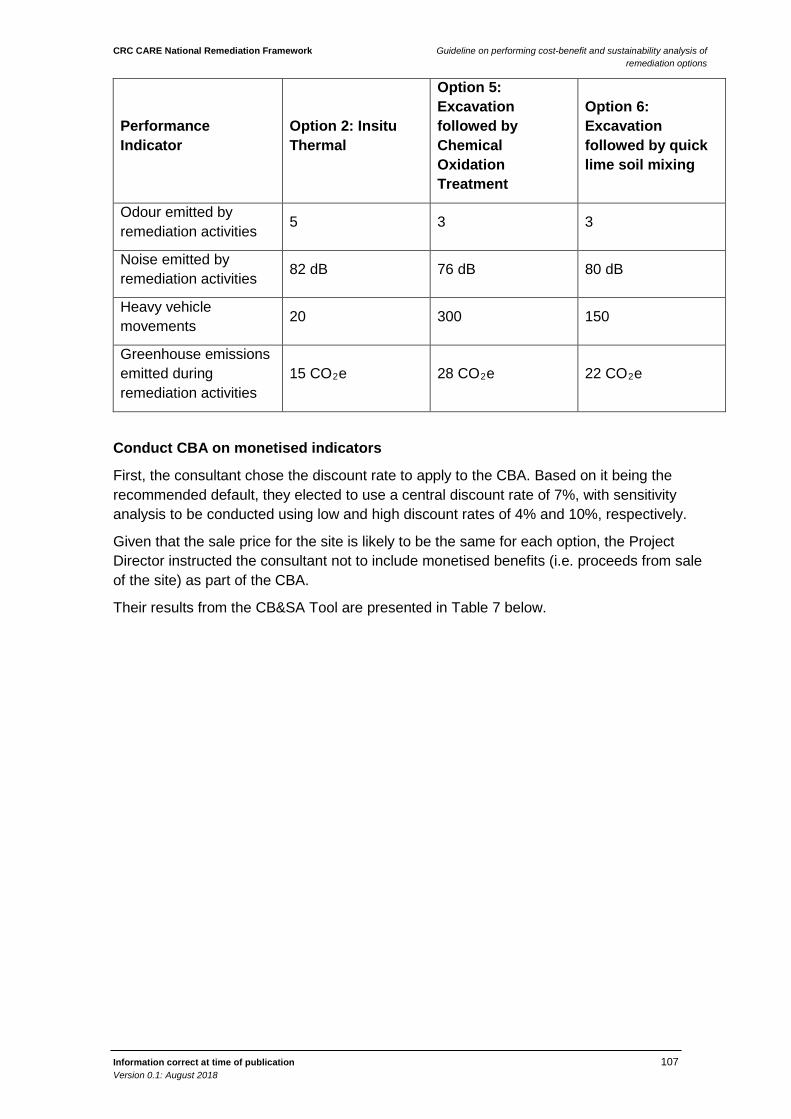
CRC CARE National Remediation Framework Guideline on performing cost-benefit and sustainability analysis of remediation options
Information correct at time of publication 107 Version 0.1: August 2018
Performance Indicator
Option 2: Insitu Thermal
Option 5: Excavation followed by Chemical Oxidation Treatment
Option 6: Excavation followed by quick lime soil mixing
Odour emitted by remediation activities 5 3 3
Noise emitted by remediation activities 82 dB 76 dB 80 dB
Heavy vehicle movements 20 300 150
Greenhouse emissions emitted during remediation activities
15 CO2e 28 CO2e 22 CO2e
Conduct CBA on monetised indicators
First, the consultant chose the discount rate to apply to the CBA. Based on it being the recommended default, they elected to use a central discount rate of 7%, with sensitivity analysis to be conducted using low and high discount rates of 4% and 10%, respectively.
Given that the sale price for the site is likely to be the same for each option, the Project Director instructed the consultant not to include monetised benefits (i.e. proceeds from sale of the site) as part of the CBA.
Their results from the CB&SA Tool are presented in Table 7 below.
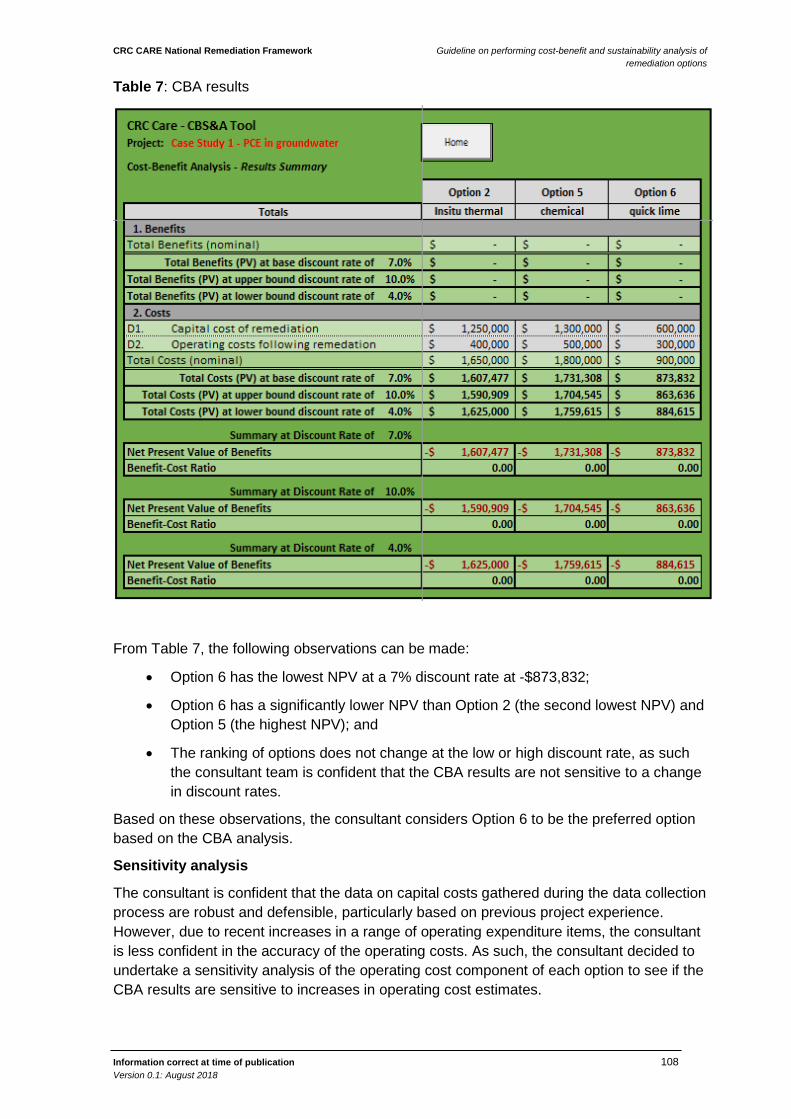
CRC CARE National Remediation Framework Guideline on performing cost-benefit and sustainability analysis of remediation options
Information correct at time of publication 108 Version 0.1: August 2018
Table 7: CBA results
From Table 7, the following observations can be made:
• Option 6 has the lowest NPV at a 7% discount rate at -$873,832;
• Option 6 has a significantly lower NPV than Option 2 (the second lowest NPV) and Option 5 (the highest NPV); and
• The ranking of options does not change at the low or high discount rate, as such the consultant team is confident that the CBA results are not sensitive to a change in discount rates.
Based on these observations, the consultant considers Option 6 to be the preferred option based on the CBA analysis.
Sensitivity analysis
The consultant is confident that the data on capital costs gathered during the data collection process are robust and defensible, particularly based on previous project experience. However, due to recent increases in a range of operating expenditure items, the consultant is less confident in the accuracy of the operating costs. As such, the consultant decided to undertake a sensitivity analysis of the operating cost component of each option to see if the CBA results are sensitive to increases in operating cost estimates.
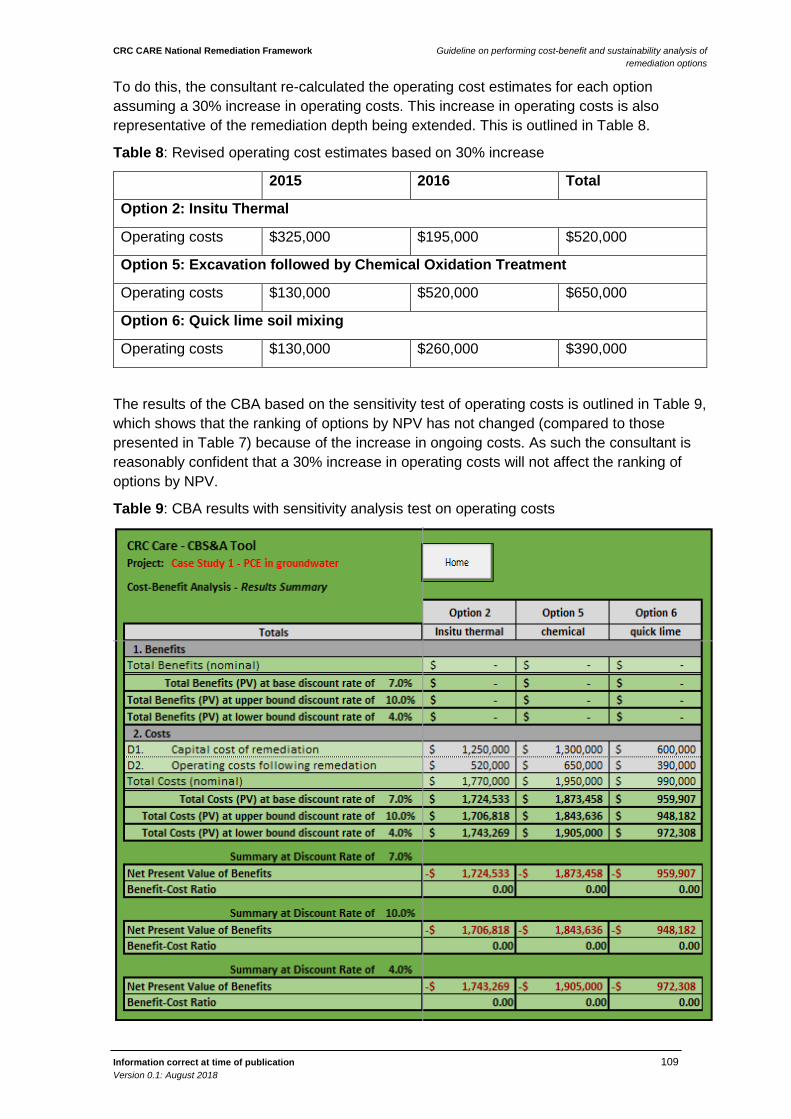
CRC CARE National Remediation Framework Guideline on performing cost-benefit and sustainability analysis of remediation options
Information correct at time of publication 109 Version 0.1: August 2018
To do this, the consultant re-calculated the operating cost estimates for each option assuming a 30% increase in operating costs. This increase in operating costs is also representative of the remediation depth being extended. This is outlined in Table 8.
Table 8: Revised operating cost estimates based on 30% increase
2015 2016 Total
Option 2: Insitu Thermal
Operating costs $325,000 $195,000 $520,000
Option 5: Excavation followed by Chemical Oxidation Treatment
Operating costs $130,000 $520,000 $650,000
Option 6: Quick lime soil mixing
Operating costs $130,000 $260,000 $390,000
The results of the CBA based on the sensitivity test of operating costs is outlined in Table 9, which shows that the ranking of options by NPV has not changed (compared to those presented in Table 7) because of the increase in ongoing costs. As such the consultant is reasonably confident that a 30% increase in operating costs will not affect the ranking of options by NPV.
Table 9: CBA results with sensitivity analysis test on operating costs
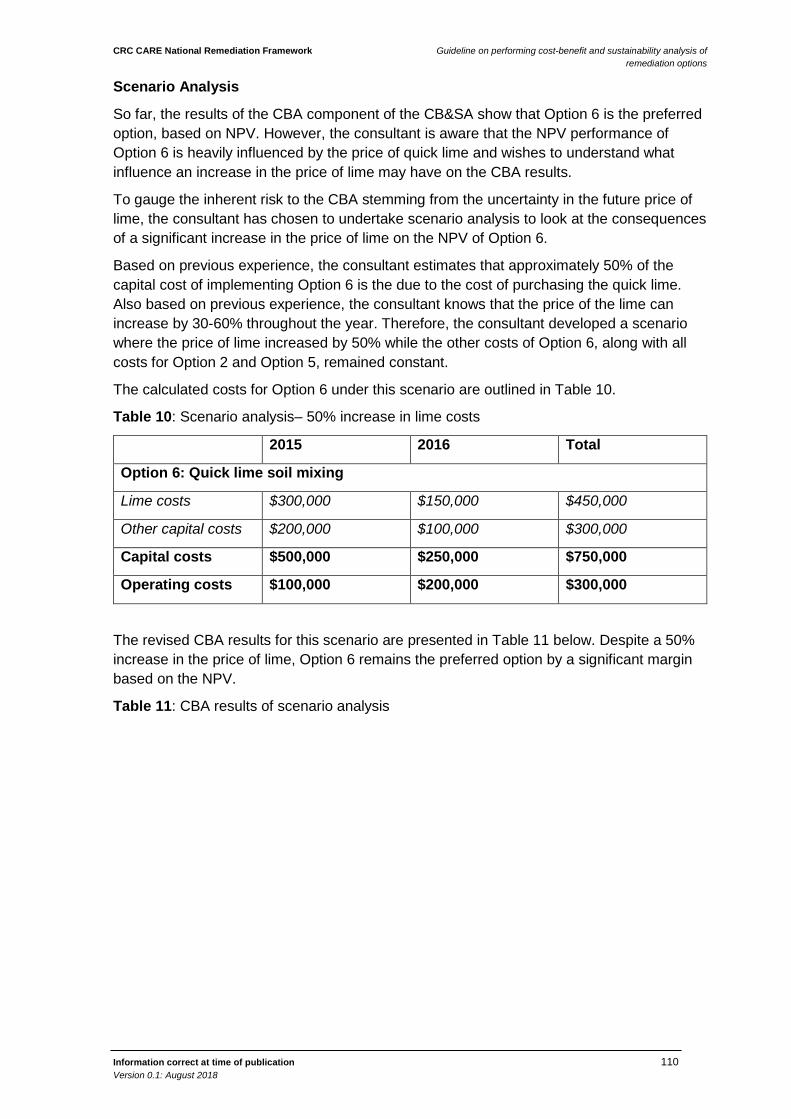
CRC CARE National Remediation Framework Guideline on performing cost-benefit and sustainability analysis of remediation options
Information correct at time of publication 110 Version 0.1: August 2018
Scenario Analysis
So far, the results of the CBA component of the CB&SA show that Option 6 is the preferred option, based on NPV. However, the consultant is aware that the NPV performance of Option 6 is heavily influenced by the price of quick lime and wishes to understand what influence an increase in the price of lime may have on the CBA results.
To gauge the inherent risk to the CBA stemming from the uncertainty in the future price of lime, the consultant has chosen to undertake scenario analysis to look at the consequences of a significant increase in the price of lime on the NPV of Option 6.
Based on previous experience, the consultant estimates that approximately 50% of the capital cost of implementing Option 6 is the due to the cost of purchasing the quick lime. Also based on previous experience, the consultant knows that the price of the lime can increase by 30-60% throughout the year. Therefore, the consultant developed a scenario where the price of lime increased by 50% while the other costs of Option 6, along with all costs for Option 2 and Option 5, remained constant.
The calculated costs for Option 6 under this scenario are outlined in Table 10.
Table 10: Scenario analysis– 50% increase in lime costs
2015 2016 Total
Option 6: Quick lime soil mixing
Lime costs $300,000 $150,000 $450,000
Other capital costs $200,000 $100,000 $300,000
Capital costs $500,000 $250,000 $750,000
Operating costs $100,000 $200,000 $300,000
The revised CBA results for this scenario are presented in Table 11 below. Despite a 50% increase in the price of lime, Option 6 remains the preferred option by a significant margin based on the NPV.
Table 11: CBA results of scenario analysis
CRC CARE National Remediation Framework Guideline on performing cost-benefit and sustainability analysis of remediation options
Information correct at time of publication 111 Version 0.1: August 2018
Conduct MCA and integrate CBA results
As outlined above, the performance of the options against the non-monetised performance indicators will be assessed as part of an MCA. In addition, the results of the CBA will be incorporated into the MCA.
The summary table from the CB&SA Tool, showing the data collected for each option against each non-monetised performance indicator is shown in Table 12.
Table 12: Summary of non-monetised performance indicators for each option
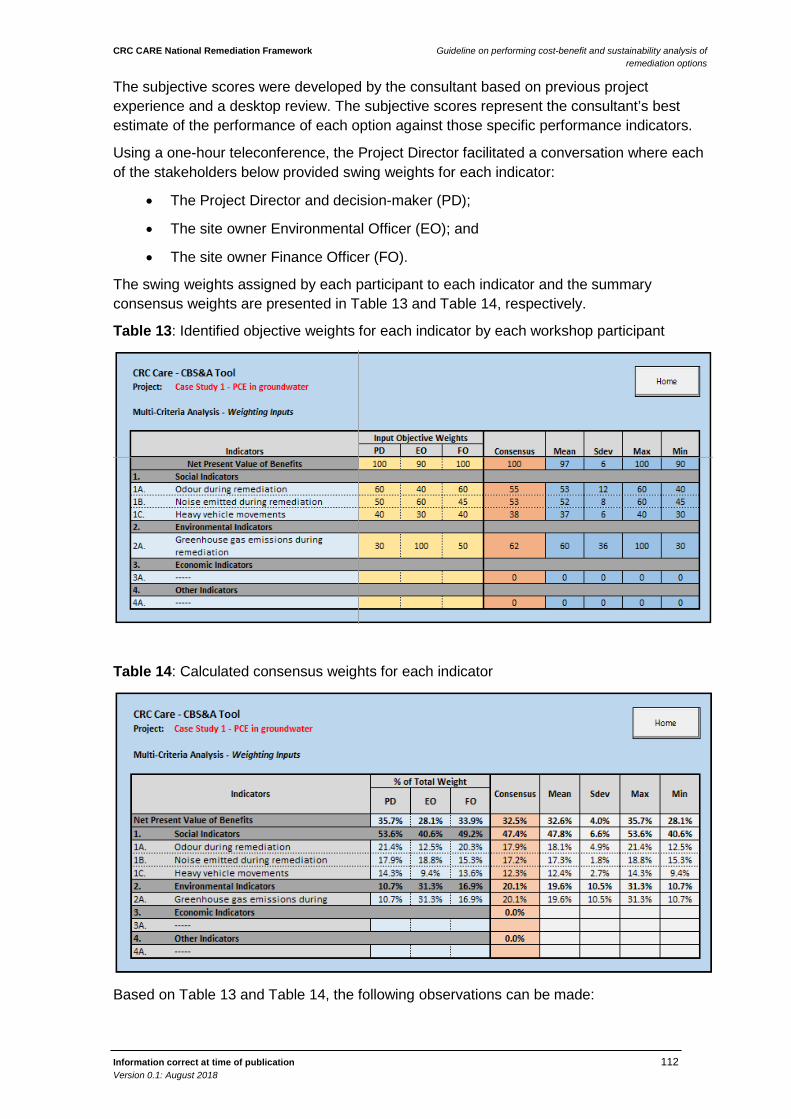
CRC CARE National Remediation Framework Guideline on performing cost-benefit and sustainability analysis of remediation options
Information correct at time of publication 112 Version 0.1: August 2018
The subjective scores were developed by the consultant based on previous project experience and a desktop review. The subjective scores represent the consultant’s best estimate of the performance of each option against those specific performance indicators.
Using a one-hour teleconference, the Project Director facilitated a conversation where each of the stakeholders below provided swing weights for each indicator:
• The Project Director and decision-maker (PD);
• The site owner Environmental Officer (EO); and
• The site owner Finance Officer (FO).
The swing weights assigned by each participant to each indicator and the summary consensus weights are presented in Table 13 and Table 14, respectively.
Table 13: Identified objective weights for each indicator by each workshop participant
Table 14: Calculated consensus weights for each indicator
Based on Table 13 and Table 14, the following observations can be made:
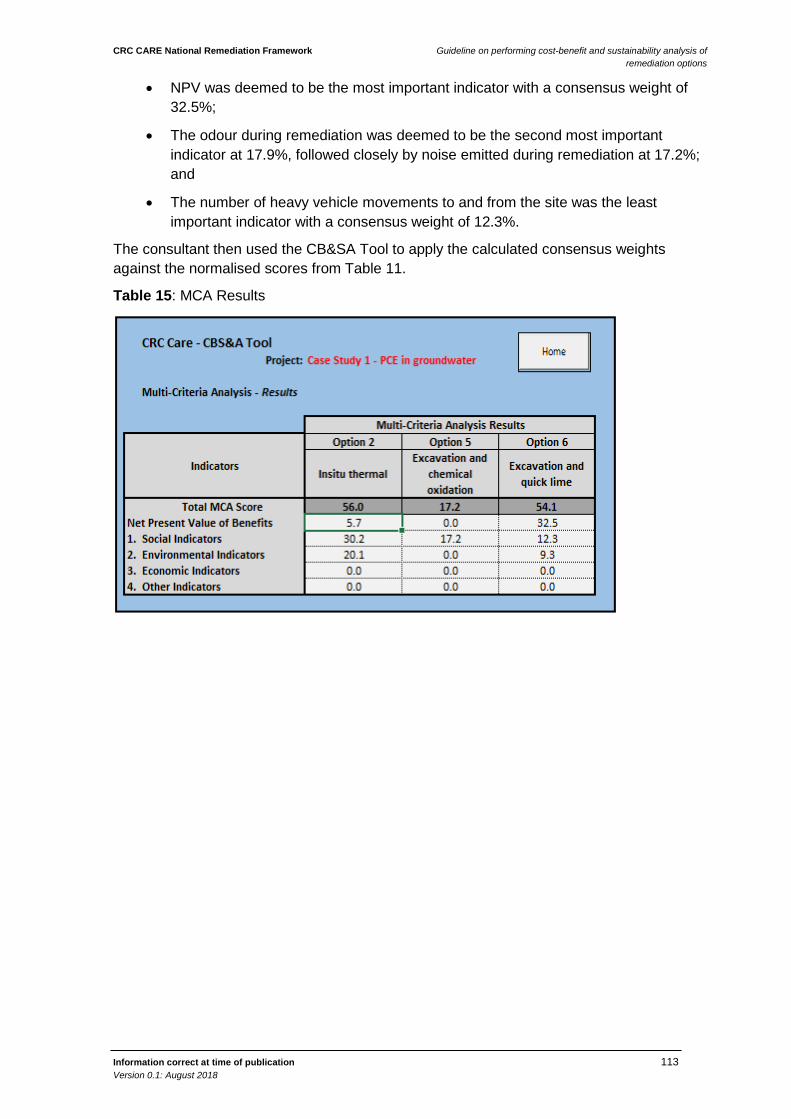
CRC CARE National Remediation Framework Guideline on performing cost-benefit and sustainability analysis of remediation options
Information correct at time of publication 113 Version 0.1: August 2018
• NPV was deemed to be the most important indicator with a consensus weight of 32.5%;
• The odour during remediation was deemed to be the second most important indicator at 17.9%, followed closely by noise emitted during remediation at 17.2%; and
• The number of heavy vehicle movements to and from the site was the least important indicator with a consensus weight of 12.3%.
The consultant then used the CB&SA Tool to apply the calculated consensus weights against the normalised scores from Table 11.
Table 15: MCA Results
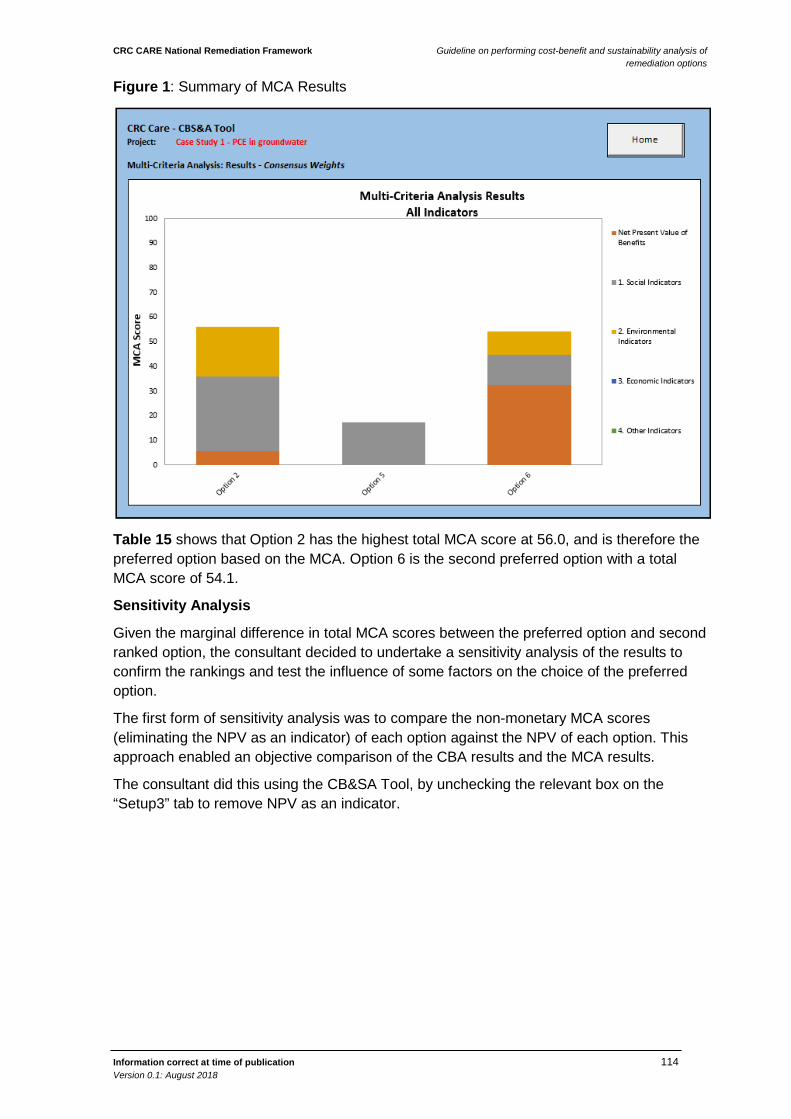
CRC CARE National Remediation Framework Guideline on performing cost-benefit and sustainability analysis of remediation options
Information correct at time of publication 114 Version 0.1: August 2018
Figure 1: Summary of MCA Results
Table 15 shows that Option 2 has the highest total MCA score at 56.0, and is therefore the preferred option based on the MCA. Option 6 is the second preferred option with a total MCA score of 54.1.
Sensitivity Analysis
Given the marginal difference in total MCA scores between the preferred option and second ranked option, the consultant decided to undertake a sensitivity analysis of the results to confirm the rankings and test the influence of some factors on the choice of the preferred option.
The first form of sensitivity analysis was to compare the non-monetary MCA scores (eliminating the NPV as an indicator) of each option against the NPV of each option. This approach enabled an objective comparison of the CBA results and the MCA results.
The consultant did this using the CB&SA Tool, by unchecking the relevant box on the “Setup3” tab to remove NPV as an indicator.
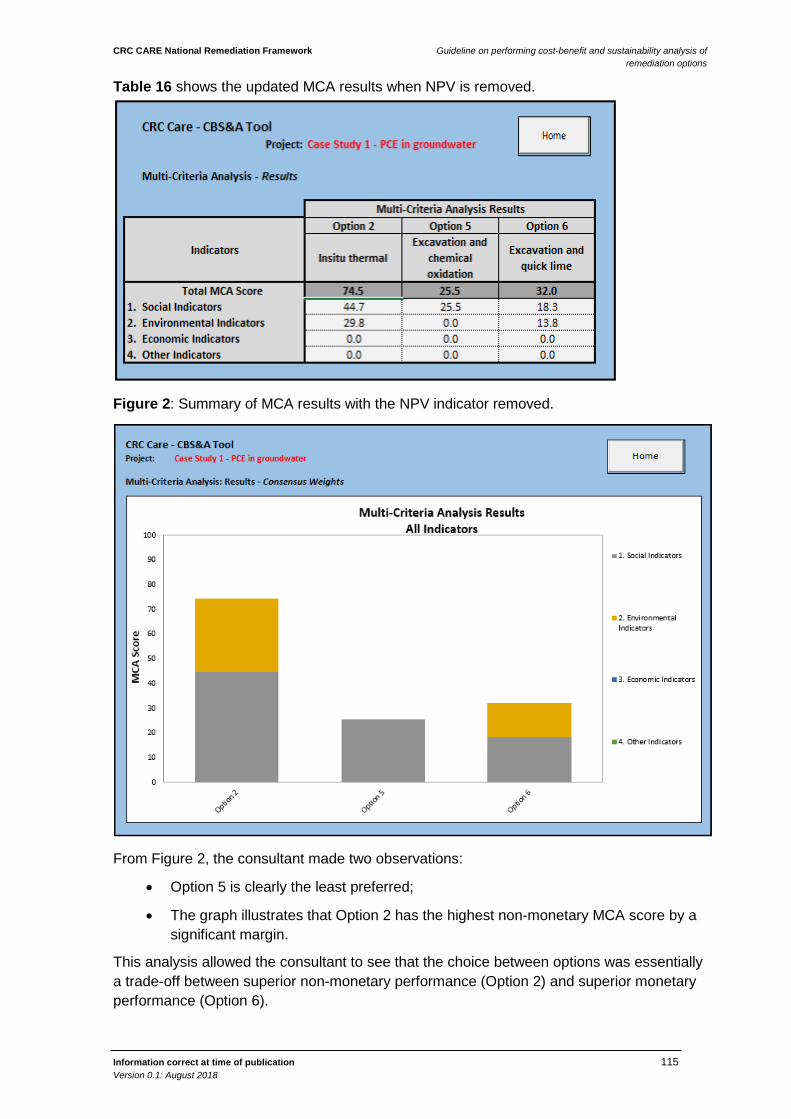
CRC CARE National Remediation Framework Guideline on performing cost-benefit and sustainability analysis of remediation options
Information correct at time of publication 115 Version 0.1: August 2018
Table 16 shows the updated MCA results when NPV is removed.
Figure 2: Summary of MCA results with the NPV indicator removed.
From Figure 2, the consultant made two observations:
• Option 5 is clearly the least preferred;
• The graph illustrates that Option 2 has the highest non-monetary MCA score by a significant margin.
This analysis allowed the consultant to see that the choice between options was essentially a trade-off between superior non-monetary performance (Option 2) and superior monetary performance (Option 6).
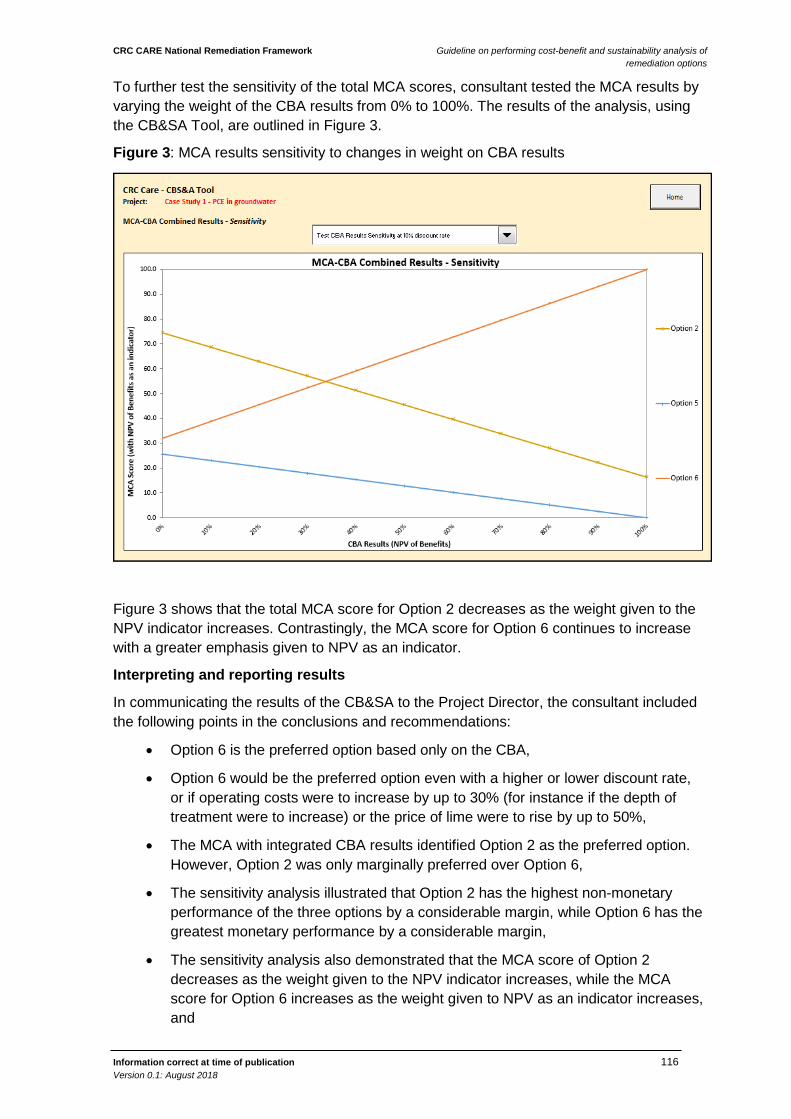
CRC CARE National Remediation Framework Guideline on performing cost-benefit and sustainability analysis of remediation options
Information correct at time of publication 116 Version 0.1: August 2018
To further test the sensitivity of the total MCA scores, consultant tested the MCA results by varying the weight of the CBA results from 0% to 100%. The results of the analysis, using the CB&SA Tool, are outlined in Figure 3.
Figure 3: MCA results sensitivity to changes in weight on CBA results
Figure 3 shows that the total MCA score for Option 2 decreases as the weight given to the NPV indicator increases. Contrastingly, the MCA score for Option 6 continues to increase with a greater emphasis given to NPV as an indicator.
Interpreting and reporting results
In communicating the results of the CB&SA to the Project Director, the consultant included the following points in the conclusions and recommendations:
• Option 6 is the preferred option based only on the CBA,
• Option 6 would be the preferred option even with a higher or lower discount rate, or if operating costs were to increase by up to 30% (for instance if the depth of treatment were to increase) or the price of lime were to rise by up to 50%,
• The MCA with integrated CBA results identified Option 2 as the preferred option. However, Option 2 was only marginally preferred over Option 6,
• The sensitivity analysis illustrated that Option 2 has the highest non-monetary performance of the three options by a considerable margin, while Option 6 has the greatest monetary performance by a considerable margin,
• The sensitivity analysis also demonstrated that the MCA score of Option 2 decreases as the weight given to the NPV indicator increases, while the MCA score for Option 6 increases as the weight given to NPV as an indicator increases, and

CRC CARE National Remediation Framework Guideline on performing cost-benefit and sustainability analysis of remediation options
Information correct at time of publication 117 Version 0.1: August 2018
• Based on a total MCA score (including NPV) Option 6 becomes the preferred option when the weight given to the NPV is approximately 35%, however the consensus weight for the NPV indicator in the MCA is 47.4%.
When presented with the results of the sensitivity analysis, the decision-maker confirmed that Option 6 was indeed the preferred option. Although it did not score as well on the MCA as Option 2, it was not the worst performing MCA option. In addition, it was considered that the cost difference of $750,000 did not provide value-for-money. As a compromise, a portion of the cost savings will be used to mitigate the disturbance to the community during implementation of Option 6.
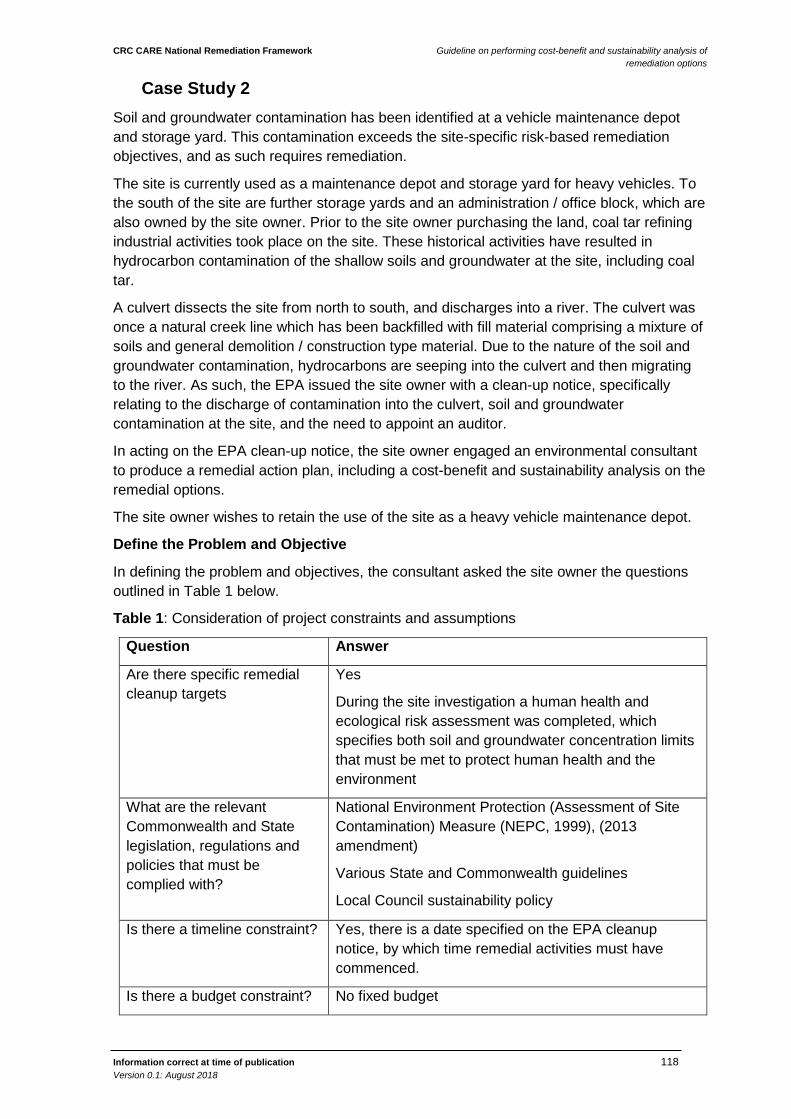
CRC CARE National Remediation Framework Guideline on performing cost-benefit and sustainability analysis of remediation options
Information correct at time of publication 118 Version 0.1: August 2018
Case Study 2 Soil and groundwater contamination has been identified at a vehicle maintenance depot and storage yard. This contamination exceeds the site-specific risk-based remediation objectives, and as such requires remediation.
The site is currently used as a maintenance depot and storage yard for heavy vehicles. To the south of the site are further storage yards and an administration / office block, which are also owned by the site owner. Prior to the site owner purchasing the land, coal tar refining industrial activities took place on the site. These historical activities have resulted in hydrocarbon contamination of the shallow soils and groundwater at the site, including coal tar.
A culvert dissects the site from north to south, and discharges into a river. The culvert was once a natural creek line which has been backfilled with fill material comprising a mixture of soils and general demolition / construction type material. Due to the nature of the soil and groundwater contamination, hydrocarbons are seeping into the culvert and then migrating to the river. As such, the EPA issued the site owner with a clean-up notice, specifically relating to the discharge of contamination into the culvert, soil and groundwater contamination at the site, and the need to appoint an auditor.
In acting on the EPA clean-up notice, the site owner engaged an environmental consultant to produce a remedial action plan, including a cost-benefit and sustainability analysis on the remedial options.
The site owner wishes to retain the use of the site as a heavy vehicle maintenance depot.
Define the Problem and Objective
In defining the problem and objectives, the consultant asked the site owner the questions outlined in Table 1 below.
Table 1: Consideration of project constraints and assumptions
Question Answer
Are there specific remedial cleanup targets
Yes
During the site investigation a human health and ecological risk assessment was completed, which specifies both soil and groundwater concentration limits that must be met to protect human health and the environment
What are the relevant Commonwealth and State legislation, regulations and policies that must be complied with?
National Environment Protection (Assessment of Site Contamination) Measure (NEPC, 1999), (2013 amendment)
Various State and Commonwealth guidelines
Local Council sustainability policy
Is there a timeline constraint? Yes, there is a date specified on the EPA cleanup notice, by which time remedial activities must have commenced.
Is there a budget constraint? No fixed budget
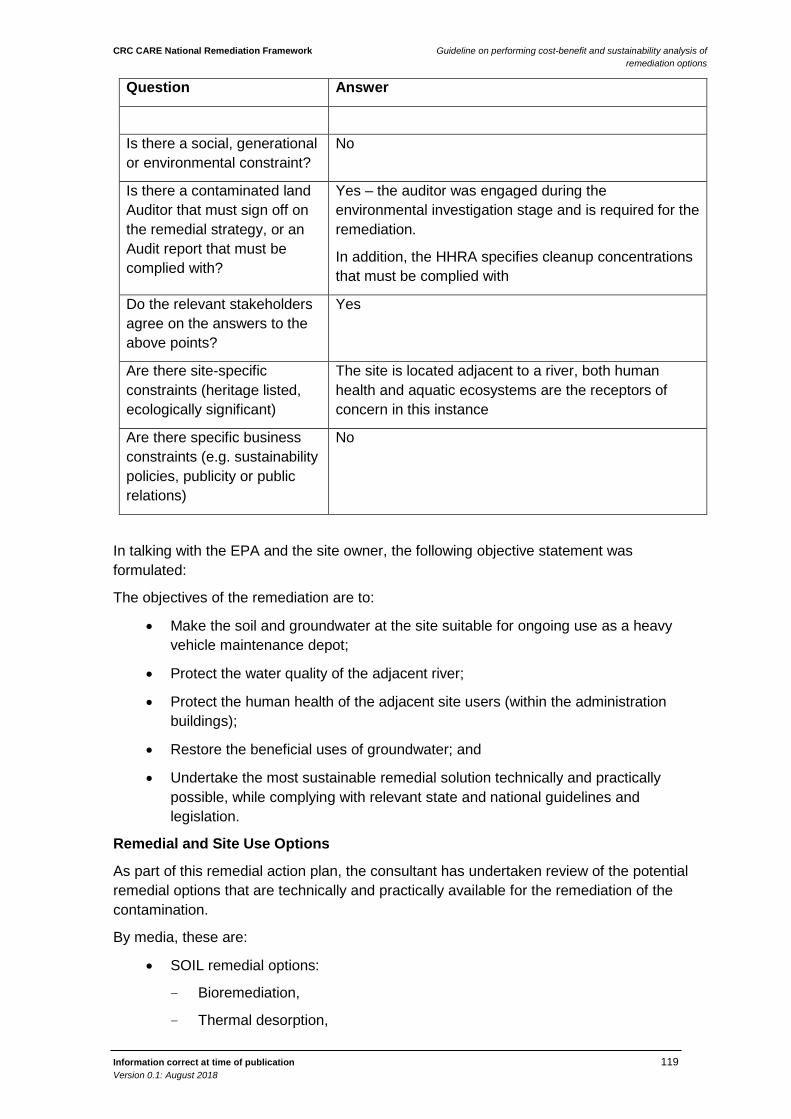
CRC CARE National Remediation Framework Guideline on performing cost-benefit and sustainability analysis of remediation options
Information correct at time of publication 119 Version 0.1: August 2018
Question Answer
Is there a social, generational or environmental constraint?
No
Is there a contaminated land Auditor that must sign off on the remedial strategy, or an Audit report that must be complied with?
Yes – the auditor was engaged during the environmental investigation stage and is required for the remediation.
In addition, the HHRA specifies cleanup concentrations that must be complied with
Do the relevant stakeholders agree on the answers to the above points?
Yes
Are there site-specific constraints (heritage listed, ecologically significant)
The site is located adjacent to a river, both human health and aquatic ecosystems are the receptors of concern in this instance
Are there specific business constraints (e.g. sustainability policies, publicity or public relations)
No
In talking with the EPA and the site owner, the following objective statement was formulated:
The objectives of the remediation are to:
• Make the soil and groundwater at the site suitable for ongoing use as a heavy vehicle maintenance depot;
• Protect the water quality of the adjacent river;
• Protect the human health of the adjacent site users (within the administration buildings);
• Restore the beneficial uses of groundwater; and
• Undertake the most sustainable remedial solution technically and practically possible, while complying with relevant state and national guidelines and legislation.
Remedial and Site Use Options
As part of this remedial action plan, the consultant has undertaken review of the potential remedial options that are technically and practically available for the remediation of the contamination.
By media, these are:
• SOIL remedial options:
- Bioremediation,
- Thermal desorption,
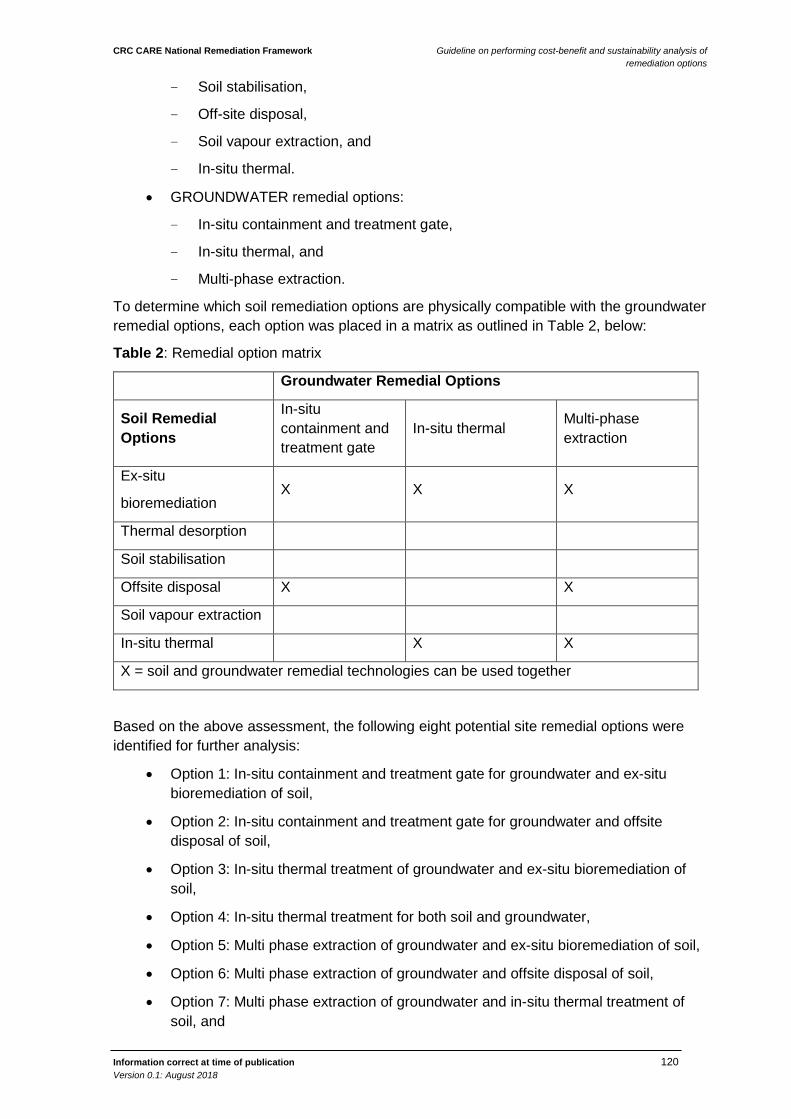
CRC CARE National Remediation Framework Guideline on performing cost-benefit and sustainability analysis of remediation options
Information correct at time of publication 120 Version 0.1: August 2018
- Soil stabilisation,
- Off-site disposal,
- Soil vapour extraction, and
- In-situ thermal.
• GROUNDWATER remedial options:
- In-situ containment and treatment gate,
- In-situ thermal, and
- Multi-phase extraction.
To determine which soil remediation options are physically compatible with the groundwater remedial options, each option was placed in a matrix as outlined in Table 2, below:
Table 2: Remedial option matrix
Groundwater Remedial Options
Soil Remedial Options
In-situ containment and treatment gate
In-situ thermal Multi-phase extraction
Ex-situ
bioremediation X X X
Thermal desorption
Soil stabilisation
Offsite disposal X X
Soil vapour extraction
In-situ thermal X X
X = soil and groundwater remedial technologies can be used together
Based on the above assessment, the following eight potential site remedial options were identified for further analysis:
• Option 1: In-situ containment and treatment gate for groundwater and ex-situ bioremediation of soil,
• Option 2: In-situ containment and treatment gate for groundwater and offsite disposal of soil,
• Option 3: In-situ thermal treatment of groundwater and ex-situ bioremediation of soil,
• Option 4: In-situ thermal treatment for both soil and groundwater,
• Option 5: Multi phase extraction of groundwater and ex-situ bioremediation of soil,
• Option 6: Multi phase extraction of groundwater and offsite disposal of soil,
• Option 7: Multi phase extraction of groundwater and in-situ thermal treatment of soil, and
CRC CARE National Remediation Framework Guideline on performing cost-benefit and sustainability analysis of remediation options
Information correct at time of publication 121 Version 0.1: August 2018
• Option 8: Base Case. The site continues with the current land use, with periodic monitoring of groundwater.
Identify and Engage Key Stakeholders
During the investigation phase of this contamination assessment, the following stakeholders were identified:
• Site Owner,
• Local Council,
• EPA,
• Site Contamination Auditor,
• Contaminated Land Consultant, and
• River Authority.
In addition, the site owner along with the site contamination consultant held a stakeholder brainstorming session. The following lists those stakeholders that need to be considered when reviewing remedial options:
• Site Owner – Environmental Officer (responsible for company compliance with regulations, also the person requesting the RAP be completed),
• Site Owner – Accountant (in charge of finances), and
• Site Owner – Facility Manager (running the site day to day).
The consultant ran an hour-long workshop with the Environment Officer, Accountant and Facility Manager from the owning company. During this workshop the key issues affecting each of the stakeholders were discussed, and the following outcomes were noted:
• The remediation option of “Surfactant enhanced product recovery and chemical oxidation” was added to the list of those being contemplated,
• The Facility Manager was very worried that shutting the site down for any amount of time would be detrimental to the business, even if a near-by facility could take the vehicles for a short time, and
• The Environmental Officer was concerned that some of the options being contemplated were not proven to work in the geology at the site.
Identify Assessment Indicators
Based on the objectives of the remediation and the stakeholder engagement outcomes, the following threshold indicators were identified.
• Meets the HHRA assessment criteria,
• Meets the ecological criteria,
• Is compliant with regulatory requirements, and
• Provides a high likelihood of long-term effectiveness and permanence.
Based on the objectives of the remediation and the stakeholder engagement outcomes, the following performance indicators were identified.
• Cost, including both capital cost of remediation and ongoing operating costs,
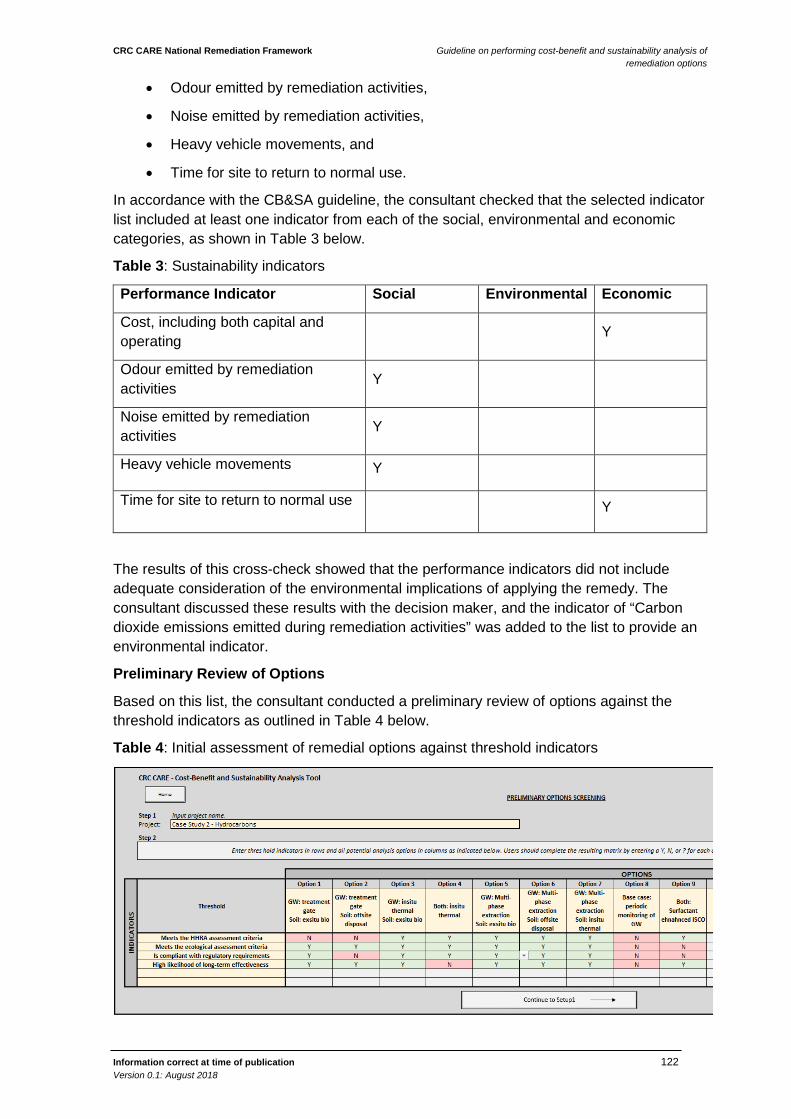
CRC CARE National Remediation Framework Guideline on performing cost-benefit and sustainability analysis of remediation options
Information correct at time of publication 122 Version 0.1: August 2018
• Odour emitted by remediation activities,
• Noise emitted by remediation activities,
• Heavy vehicle movements, and
• Time for site to return to normal use.
In accordance with the CB&SA guideline, the consultant checked that the selected indicator list included at least one indicator from each of the social, environmental and economic categories, as shown in Table 3 below.
Table 3: Sustainability indicators
Performance Indicator Social Environmental Economic
Cost, including both capital and operating Y
Odour emitted by remediation activities Y
Noise emitted by remediation activities Y
Heavy vehicle movements Y
Time for site to return to normal use Y
The results of this cross-check showed that the performance indicators did not include adequate consideration of the environmental implications of applying the remedy. The consultant discussed these results with the decision maker, and the indicator of “Carbon dioxide emissions emitted during remediation activities” was added to the list to provide an environmental indicator.
Preliminary Review of Options
Based on this list, the consultant conducted a preliminary review of options against the threshold indicators as outlined in Table 4 below.
Table 4: Initial assessment of remedial options against threshold indicators
CRC CARE National Remediation Framework Guideline on performing cost-benefit and sustainability analysis of remediation options
Information correct at time of publication 123 Version 0.1: August 2018
Based on the assessment of the remedial options against the identified threshold indicators, the following options were identified as being able to progress to assessment against the performance indicators:
• Option 3,
• Option 5,
• Option 6, and
• Option 7.
Similarly, based on their inability to meet all of the threshold indicators, Option 1, Option 2, Option 4, Option 8, and Option 9 have been rejected and will not be assessed further.
Data Collection and Analysis
During the CB&SA process, the consultant measured the indicators for each remedial option.
Using a combination of desktop analysis, concept design and previous environmental reports at a similar site, the project team was able to quantify all of the performance measures with the exception of odour, which was qualified. The units of measure are outlined Table 5.
Table 5: Units of measurement
Performance Indicator Unit of measurement
Cost Dollars
Odour Subjective assessment on scale of 1-5, 5 being no noticeable odour, 1 being an unbearable odour
Noise Measured in dB
Heavy vehicle movements Measured in number of heavy vehicle trips to the site over the course of remediation
Greenhouse emissions emitted during remediation activities
Measured in equivalent carbon dioxide tonnes – CO2e tonnes
Time for site to return to normal use Days
Using these units of measure, it is clear that the costs will be monetised, and assessed using a CBA. The remaining indicators will be assessed using an MCA, and the results combined into a CB&SA for communication to the client.
During the data collection, the following costs were estimated for implementing each option. These costs include both capital and ongoing costs, as outlined in Table 6.
Table 6: Estimated project costs
Costs Option 3 Option 5 Option 6 Option 7
Soil $4,265,150 $4,265,150 $9,752,650 $2,089,000
CRC CARE National Remediation Framework Guideline on performing cost-benefit and sustainability analysis of remediation options
Information correct at time of publication 124 Version 0.1: August 2018
Groundwater $4,105,000 $1,652,000 $1,652,000 $1,652,000
Combined total
$6,370,150 in the first year
$1,000,000 in the second year
$1,000,000 in the third year
$3,917,000 in the first year
$1,000,000 in the second year
$1,000,000 in the third year
$11,404,650 $3,741,000
During the data collection, the following quantitative and qualitative measurements of the non-monetized indicators were estimated. The non-monetised indicators are summarised in Table 7.
Table 7: Non-monetised performance indicators
Performance Indicator Option 3 Option 5 Option 6 Option 7
Odour 3 3 4 5
Noise 76 dB 76 dB 81 dB 82 dB
Heavy vehicle movements 150 150 300 20
Carbon dioxide emissions emitted during remediation activities
21 CO2e 22 CO2e 28 CO2e 15 CO2e
Time for site to return to normal use 1095 1095 90 180
Following collection of the data, the consultant returned to the site owners and conducted a weighting workshop with the three stakeholders.
Weighting forms were filled out by each of the stakeholders, following a discussion of the issues. These weights were input into the CB&SA tool, including the NPV as an indicator.
Conduct CBA on monetised indicators
First, the consultant chose the discount rate to apply to the CBA. Based on it being the recommended default, they elected to use a central discount rate of 7%, with sensitivity analysis to be conducted using low and high discount rates of 4% and 10%, respectively. Their results from the CB&SA Tool are presented in Table 8 below.
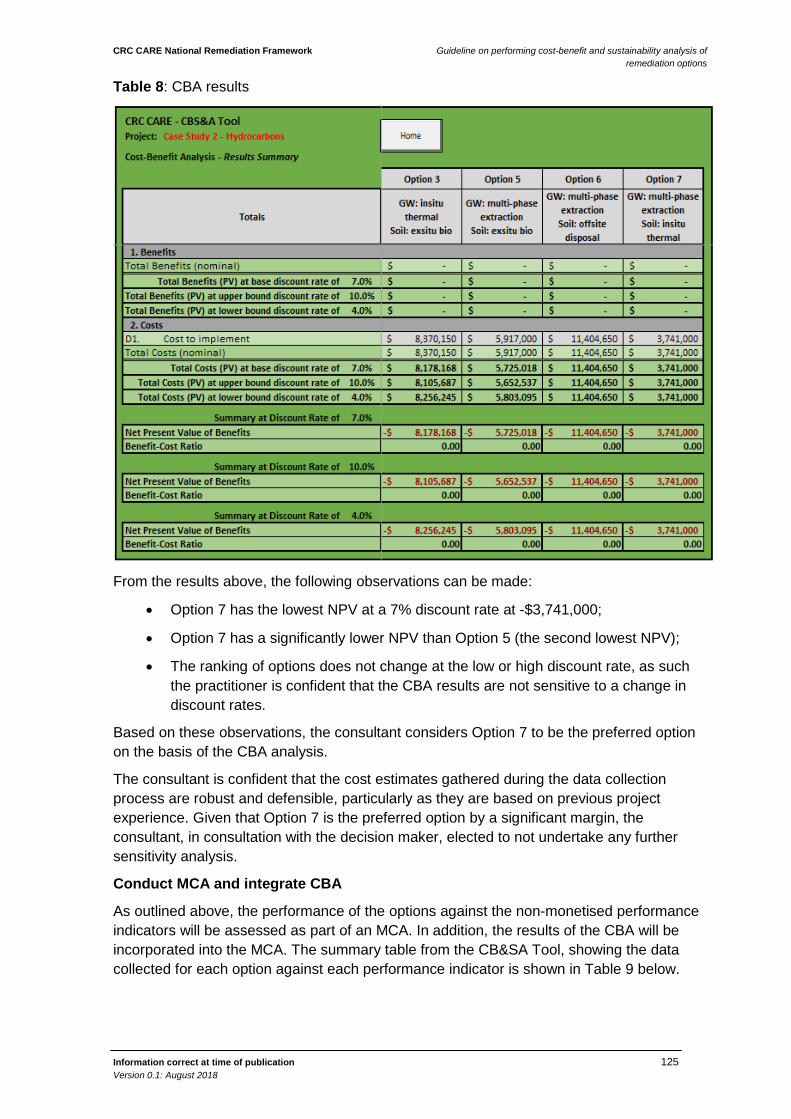
CRC CARE National Remediation Framework Guideline on performing cost-benefit and sustainability analysis of remediation options
Information correct at time of publication 125 Version 0.1: August 2018
Table 8: CBA results
From the results above, the following observations can be made:
• Option 7 has the lowest NPV at a 7% discount rate at -$3,741,000;
• Option 7 has a significantly lower NPV than Option 5 (the second lowest NPV);
• The ranking of options does not change at the low or high discount rate, as such the practitioner is confident that the CBA results are not sensitive to a change in discount rates.
Based on these observations, the consultant considers Option 7 to be the preferred option on the basis of the CBA analysis.
The consultant is confident that the cost estimates gathered during the data collection process are robust and defensible, particularly as they are based on previous project experience. Given that Option 7 is the preferred option by a significant margin, the consultant, in consultation with the decision maker, elected to not undertake any further sensitivity analysis.
Conduct MCA and integrate CBA
As outlined above, the performance of the options against the non-monetised performance indicators will be assessed as part of an MCA. In addition, the results of the CBA will be incorporated into the MCA. The summary table from the CB&SA Tool, showing the data collected for each option against each performance indicator is shown in Table 9 below.
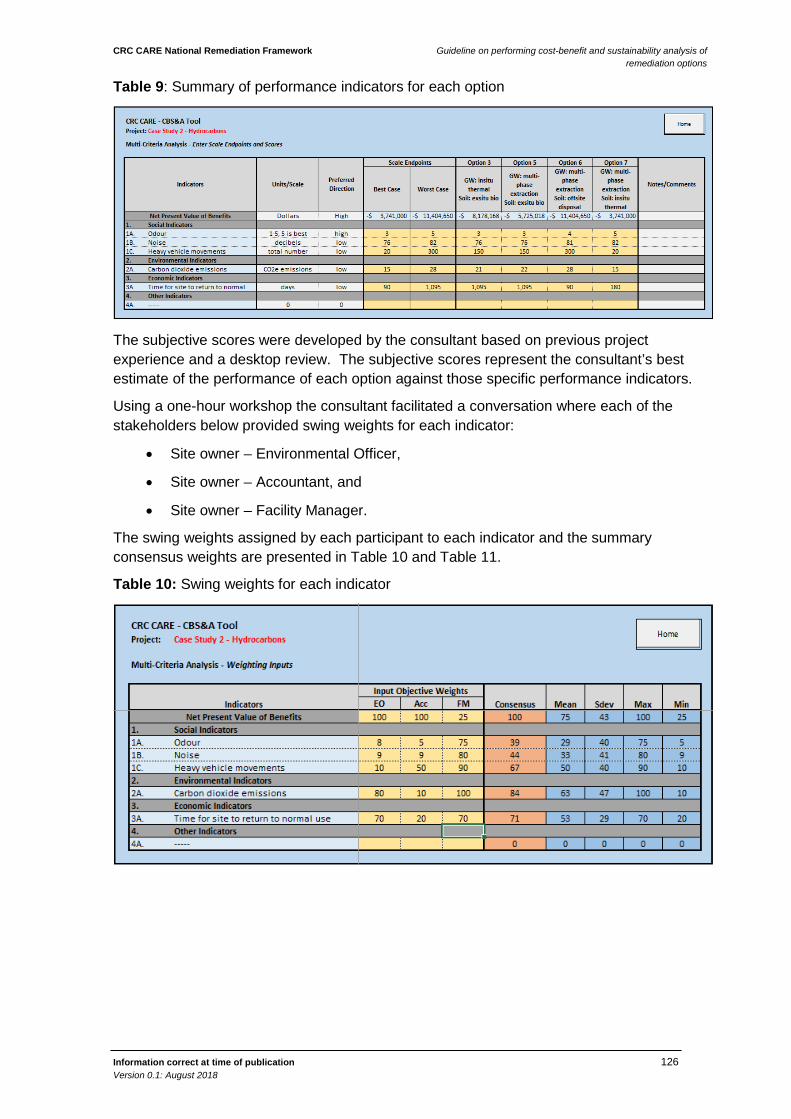
CRC CARE National Remediation Framework Guideline on performing cost-benefit and sustainability analysis of remediation options
Information correct at time of publication 126 Version 0.1: August 2018
Table 9: Summary of performance indicators for each option
The subjective scores were developed by the consultant based on previous project experience and a desktop review. The subjective scores represent the consultant’s best estimate of the performance of each option against those specific performance indicators.
Using a one-hour workshop the consultant facilitated a conversation where each of the stakeholders below provided swing weights for each indicator:
• Site owner – Environmental Officer,
• Site owner – Accountant, and
• Site owner – Facility Manager.
The swing weights assigned by each participant to each indicator and the summary consensus weights are presented in Table 10 and Table 11.
Table 10: Swing weights for each indicator
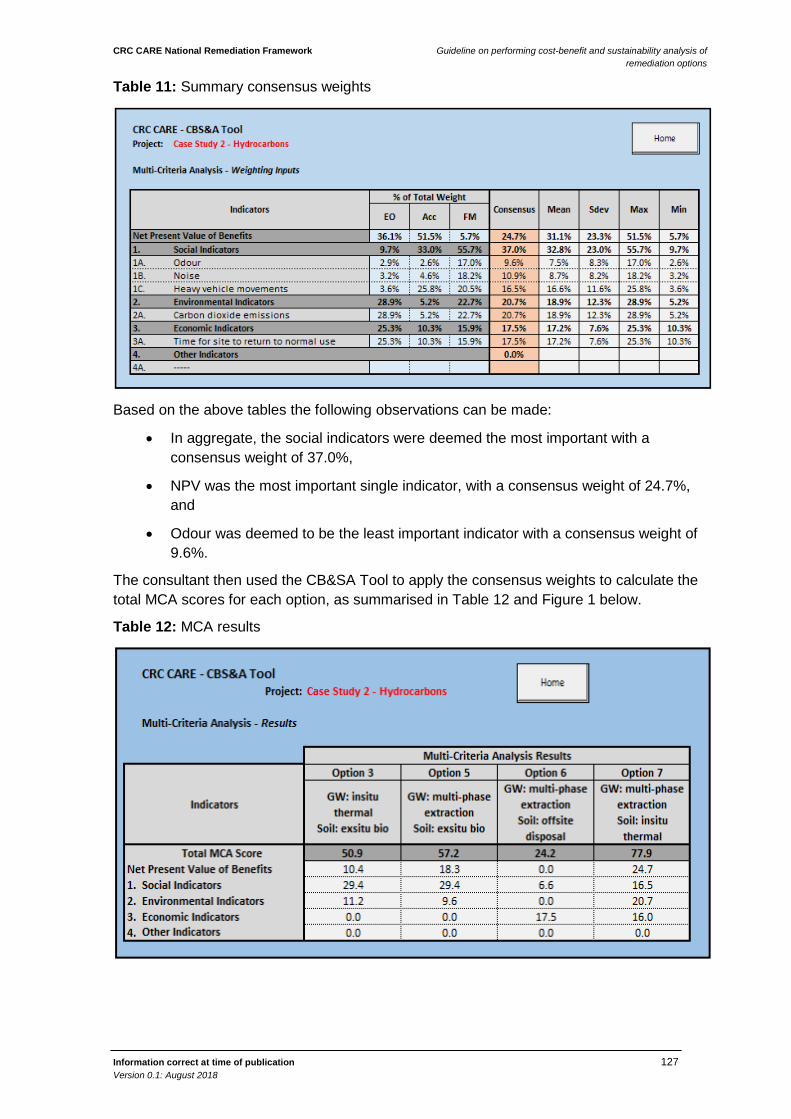
CRC CARE National Remediation Framework Guideline on performing cost-benefit and sustainability analysis of remediation options
Information correct at time of publication 127 Version 0.1: August 2018
Table 11: Summary consensus weights
Based on the above tables the following observations can be made:
• In aggregate, the social indicators were deemed the most important with a consensus weight of 37.0%,
• NPV was the most important single indicator, with a consensus weight of 24.7%, and
• Odour was deemed to be the least important indicator with a consensus weight of 9.6%.
The consultant then used the CB&SA Tool to apply the consensus weights to calculate the total MCA scores for each option, as summarised in Table 12 and Figure 1 below.
Table 12: MCA results
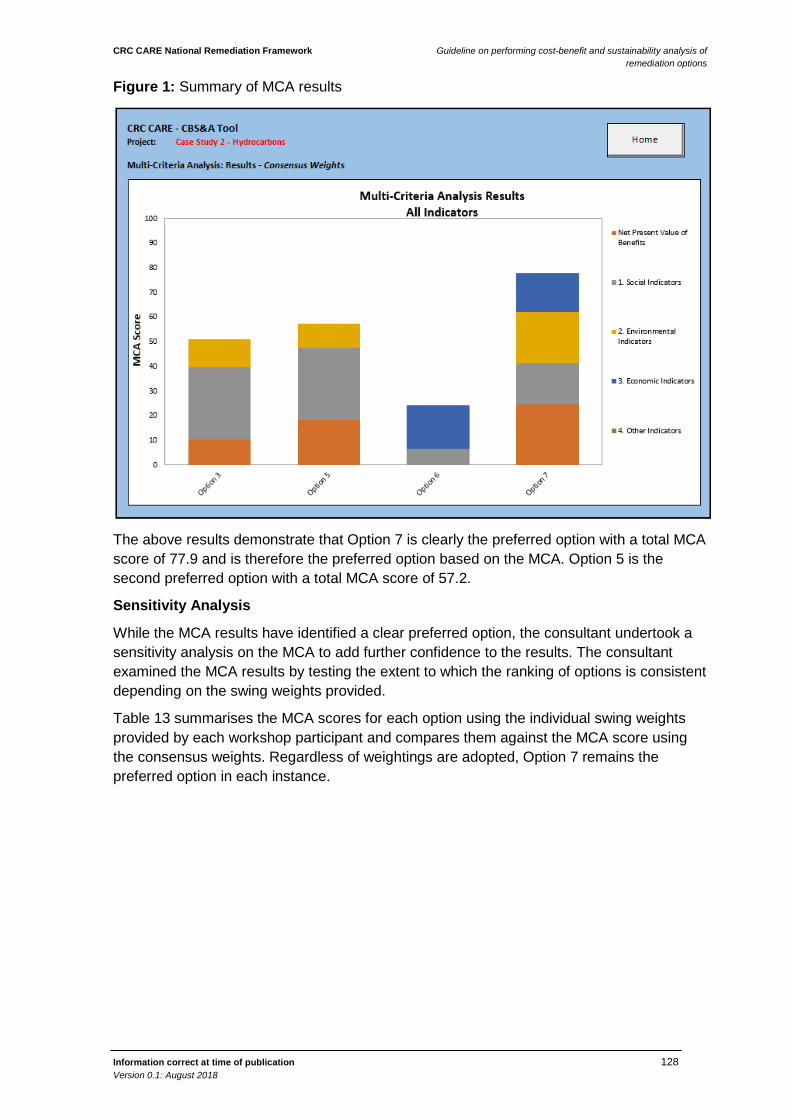
CRC CARE National Remediation Framework Guideline on performing cost-benefit and sustainability analysis of remediation options
Information correct at time of publication 128 Version 0.1: August 2018
Figure 1: Summary of MCA results
The above results demonstrate that Option 7 is clearly the preferred option with a total MCA score of 77.9 and is therefore the preferred option based on the MCA. Option 5 is the second preferred option with a total MCA score of 57.2.
Sensitivity Analysis
While the MCA results have identified a clear preferred option, the consultant undertook a sensitivity analysis on the MCA to add further confidence to the results. The consultant examined the MCA results by testing the extent to which the ranking of options is consistent depending on the swing weights provided.
Table 13 summarises the MCA scores for each option using the individual swing weights provided by each workshop participant and compares them against the MCA score using the consensus weights. Regardless of weightings are adopted, Option 7 remains the preferred option in each instance.
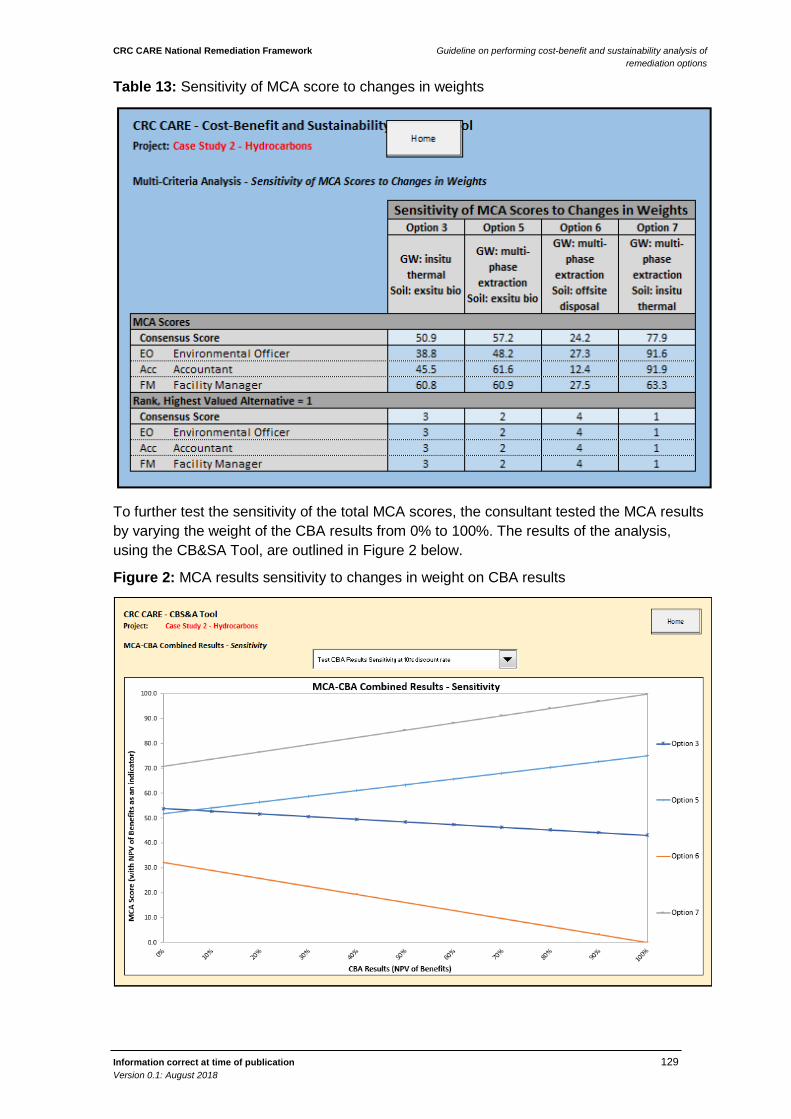
CRC CARE National Remediation Framework Guideline on performing cost-benefit and sustainability analysis of remediation options
Information correct at time of publication 129 Version 0.1: August 2018
Table 13: Sensitivity of MCA score to changes in weights
To further test the sensitivity of the total MCA scores, the consultant tested the MCA results by varying the weight of the CBA results from 0% to 100%. The results of the analysis, using the CB&SA Tool, are outlined in Figure 2 below.
Figure 2: MCA results sensitivity to changes in weight on CBA results
CRC CARE National Remediation Framework Guideline on performing cost-benefit and sustainability analysis of remediation options
Information correct at time of publication 130 Version 0.1: August 2018
The total MCA score for Option 7 increases as the weight given to the NPV indicator increases and remains the clearly preferred option regardless of the weight given to the NPV indicator.
Interpreting and reporting results
In communicating the results of the CB&SA to the Site Owner team the consultant included the following points in the conclusions and recommendations:
• Option 7 is the preferred option based only on the CBA;
• Option 7 is also the preferred option based on the MCA with integrated CBA results;
• The sensitivity analysis confirmed that Option 7 is the preferred option regardless of the performance indicator weightings adopted, and is the preferred option regardless of the change in weight given to the NPV indicator; and
• Recommend that Option 7 be selected as the preferred option based on the CB&SA analysis and subsequent sensitivity analysis.
When presented with the results of the sensitivity analysis, the Site Owner Team confirmed that Option 7 was indeed the preferred option.

CRC CARE National Remediation Framework Guideline on performing cost-benefit and sustainability analysis of remediation options
Information correct at time of publication 131 Version 0.1: August 2018
CRC CARE National Remediation Framework Guideline on performing cost-benefit and sustainability analysis of remediation options
Information correct at time of publication 132 Version 0.1: August 2018
Appendix F – References
ACCC AND AER, 2013, AER stakeholder engagement framework, Australian Competition and Consumer Commission and Australian Energy Regulator, Canberra.
ACCOUNTABILITY, 2008, AA1000 Stakeholder engagement standard 2011 - final exposure draft, AA1000SES (2011), AccountAbility, Washington, DC.
ANAO, 2012, Development and implementation of key performance indicators to support the outcomes and programs framework, Audit Report no5 2011-12, Performance audit, Prepared by the Auditor-General, Prepared for the Australian National Audit Office,
ANDERSON & CLEMEN, 2013, Toward an improved methodology to construct and reconcile decision analytic preference judgments, Journal of Decision Analysis, Vol. 10(2), pp 121-134.
ANZECC, 1999, Guidelines for the assessment of on-site containment of contaminated soil, Australian and New Zealand Environment and Conservation Council, Canberra.
ARGYROUS, 2013, SSC/ANZSOG Occassional paper: A review of government cost-benefit analysis guidelines, The Australia and New Zealand School of Government, University of New South Wales, Sydney.
ASC NEPM, 1999, National Environment Protection (Assessment of Site Contamination) Measure 1999, as varied, Schedule B (5a): Guideline on ecological risk assessment methodology, National Environment Protection Council, Australia.
ASC NEPM, 1999, National Environment Protection (Assessment of Site Contamination) Measure 1999, as varied, Schedule B (4): Guideline on site specific health risk assessment methodology, National Environment Protection Council, Australia.
ASIAN DEVELOPMENT BANK, 2013, Cost-benefit analysis for development: A practical guide, Asian Development Bank, Philippines.
ASTM, 2013, Standard guide for determining net environmental benefit of dispersant use, Standard no. F2532-13, American Society of Testing and Materials International, West Conshohocken, PA.
ASTM, 2013, Standard guide for greener cleanups, Standard no. E2893-13, American Society of Testing and Materials, West Conshohocken, PA.
ASTM, 2013, Standard guide for integrating sustainable objectives into cleanup, Standard no. E2876-13, American Society of Testing and Materials, West Conshohocken, PA.
BARDOS, 2009, Developments in sustainability assessment within contaminated land management, Presented at Green Remediation Conference, Copenhagen.
BARDOS, LAZAR & WILLENBROCK, 2009, A review of published sustainability indicator sets, Contaminated Land: Applications in Real Environments (CL:AIRE), London, UK.
BARFOD, SALLING & LELEUR, 2011, Composite decision support by combining cost-benefit and multi-criteria decision analysis, Journal of Decision Support Systems, Vol. 51(1), pp 167-175.
BRINKHOFF, 2011, Multi-criteria analysis for assessing sustainability of remedial actions: Applications in contaminated land development, Department of Civil and Environmental Engineering, Chalmers University of Technology, Goteborg, Sweden.
BUTLER, LARSON-HALLOCK, LEWIS, GLENN & ARMSTEAD, 2011, Metrics for integrating sustainability evaluations into remediation projects, Remediation Journal, Vol. 21(3), pp 81-87.
CRC CARE National Remediation Framework Guideline on performing cost-benefit and sustainability analysis of remediation options
Information correct at time of publication 133 Version 0.1: August 2018
CARLTON, CRITTO, RAMIERI & MARCOMINI, 2007, DESYRE: Decision support system for the rehabilitation of contaminated megasites, Integrated Environmental Assessment and Management, Vol. 3(2), pp 211-222.
COMMONWEALTH OF AUSTRALIA, 2006, Financial management reference material no. 5: Introduction to cost-benefit analysis and alternative evaluation methodologies, Australian Department of Finance and Administration, Financial Management Group, Canberra.
COMMONWEALTH OF AUSTRALIA, 2006, Financial management reference material no. 6: Handbook of cost-benefit analysis, Australian Department of Finance and Administration, Financial Management Group, Canberra.
COPELAND, 2011, Cost-benefit and other analysis requirement in the rulemaking process, United States Congressional Research Service, Washington, DC.
CRAWFORD-BROWN & CRAWFORD-BROWN, 2012, Cumulative risk assessment framework for waterborne contaminants, Journal of Environmental Protection, Vol. (3), pp 400-413.
DEACON, GODDARD & EURY, 2010, Assessing risks to ecosystems and using a net environmental benefit analysis framework to assist with environmental decision-making, In: FOX, H. R. & MOORE, H. M. (eds.) Restoration and recovery: Regenerating land and communities, Whittles Publishing, London.
DEPT OF IMMIGRATION AND CITIZENSHIP, 2008, Stakeholder engagement: Practitioner handbook, Australian Department of Immigration and Citizenship, Canberra.
DIAMOND, PAGE, CAMPBELL & MCKENNA, 1998, Life cycle framework for contaminated site remediation options, Prepared for Ontario Ministry of Environment and Energy, Ontario.
DIAMOND, PAGE, CAMPBELL, MCKENNA & LALL, 1999, Life-cycle framework for assessment of site remediation options: Method and generic survey, Journal of Environmental Toxicology and Chemistry, Vol. 18(4), pp 788-800.
EDWARDS & HUTTON, 2002, SMARTS and SMARTER: Improved simple methods for multiattribute utility measurement, Journal of Organizational Behaviour and Human Decision Processes, Vol. 60(3), pp 306-325.
EFROYMSON, NICOLETTE & SUTER, 2004, A framework for net environmental benefit analysis for remediation or restoration of contaminated sites, Environmental Management, Vol. 34(3), pp 315-331.
ESDSC, 1992, National strategy for ecologically sustainable development, Prepared by Ecologically Sustainable Development Steering Committee, endorsed by Council of Australian Governments, Canberra.
EUROPEAN COMMISSION, 2014, Guide to cost-benefit analysis of investment projects: Economic appraisal tool for Cohesion Policy 2014-2020, European Commission, Directorate-General for Regional and Urban policy,
FAVARA, KRIEGER, BROUGHTON, FISHER & BHARGAVA, 2011, Guidance for performing footprint analyses and life-cycle assessments for the remediation industry, Remediation Journal, Vol. 21(3), pp 39-79.
FIWGEJ, 2011, Community-based federal environmental justice resource guide, United States Federal Interagency Working Group on Environmental Justice,
GOV. OF CANADA, 2007, Canadian cost-benefit analysis guide: Regulatory proposals, Catalogue no BT58-5/2007, Canadian Treasury Board,
GREGORY, FAILING, HARSTONE, LONG, MCDANIELS & OHLSON, 2012, Structured decision making: A practical guide to environmental management choices, Wiley-Blackwell, West Sussex, UK.
CRC CARE National Remediation Framework Guideline on performing cost-benefit and sustainability analysis of remediation options
Information correct at time of publication 134 Version 0.1: August 2018
GUERRIERO, BIANCHI, CAIRNS & CORI, 2011, Policies to clean up toxic industrial contaminated sites of Gela and Priolo: A cost-benefit analysis, Journal of Environmental Health, Vol. 10(68), pp 1-11.
GUERRIERO & CAIRNS, 2009, The potential monetary benefits of reclaiming hazardous waste sites in the Campania region: an economic evaluation, Journal of Environmental Health, Vol. 8(28), pp.
GUHNEMANN, LAIRD & PEARMAN, 2012, Combining cost-benefit and multi-criteria analysis to prioritise a national road infrastructure programme, Journal of Transport Policy, Vol. 23(September), pp 15-24.
HAAN, 2002, Statistical methods in hydrology, Iowa State Press, Ames, IA.
HARCLERODE, LAL & MILLER, 2013, Estimating social impacts of a remediation project life cycle with environmental footprint evaluation tools, Remediation Journal, Vol. 24(1), pp 5-20.
HM TREASURY, 2008, Intergenerational wealth transfers and social discounting: Supplementary Green Book guidance, Her Majesty's Treasury, London.
HM TREASURY, 2011, The Green Book: Appraisal and evaluation in central government, Her Majesty's Treasury, London.
HOLLAND, LEWIS, TIPTON, KARNIS, DONA, PETROVSKIS, BULL, TAEGE & HOOK, 2011, Framework for integrating sustainability into remediation projects, Remediation Journal, Vol. 21(3), pp 7-38.
IPIECA, 2000, Choosing spill response options to minimize damage: Net environmental benefit analysis, IPIECA Report Series Vol.10, International Petroleum Industry Environmental Conservation Association, London.
ISO, 2006, Environmental management - Life cycle analysis - Requirements and guidelines, ISO 14044:2006, International Organization for Standardization, Geneva, Switzerland.
ISO, 2006, Environmental management - Life cycle assessment - Life cycle impact assessment, ISO 14040:2006, International Organization for Standardization, Geneva, Switzerland.
ITRC, 2004, Remediation process optimisation: Identifying opportunities for enhanced and more efficient site remediation, Report no. RPO-1, United States Interstate Technology and Regulatory Council, Remediation Process Optimisation Team, Washington, DC.
ITRC, 2006, Planning and promoting ecological land reuse of remediated sites, Report no. ECO-2, United States Interstate Technology and Regulatory Council, Ecological Land Reuse Team, Washington, DC.
ITRC, 2011, Green and sustainable remediation: A practical framework, Report no. GSR-2, United States Interstate Technology and Regulatory Council, Green and Sustainable Remediation Team, Washington, DC.
ITRC, 2011, Green and sustainable remediation: State of the science and practice, Report no. GSR-1, United States Interstate Technology and Regulatory Council, Green and Sustainable Remediation Team, Washington, DC.
JAFFE & STAVINS, 2007, On the value of formal assessment of uncertainty in regulatory analysis, Journal of Regulation and Governance, Vol. (1), pp 154-171.
KEENEY, 1992, Value-focused thinking - a path to creative decision making, Harvard University Press, Cambridge, MA.
KEENEY, 2002, Common mistakes in making value trade-offs, Journal of Operations Research, Vol. (December 2002), pp 935-945.
CRC CARE National Remediation Framework Guideline on performing cost-benefit and sustainability analysis of remediation options
Information correct at time of publication 135 Version 0.1: August 2018
KEENEY & RAIFFA, 1976, Decisions with multiple objectives: Preferences and value tradeoffs, Wiley, New York.
KIKER, BRIDGES, VARGHESE, SEAGER & LINKOV, 2005, Application of multicriteria decision analysis in environmental decision making, Journal of Integated Environmental Assessment and Management, Vol. 1(2), pp 95-108.
KIRKWOOD, 1996, Strategic decision making: Multiobjective decision analysis with spreadsheets, Duxbury Press, California.
KRICK, FORSTATER, MONAGHAN, SILLANPAA, VAN DER LUGT, PARTRIDGE, JACKSON & ZOHAR, 2005, The stakeholder engagement manual. Volume 2: The practitioner's handbook on stakeholder engagement, Produced by AccountAbility, Produced for the United Nations Environment Programme, Stakeholder Research Associates, Canada.
LESAGE, EKVALL, DESCHENES & SAMSON, 2006, Environmental assessment of brownfield rehabilitation using two different life cycle inventory models, The International Journal of Life Cycle Assessment, Vol. 12(497), pp.
LINKOV, VARGHESE, JAMIL, SEAGER, KIKER & BRIDGES, 2004, Multi-criteria decision analysis: A framework for structuring remedial decisions at contaminated sites, In: LINKOV, I. & RAMADAM, A. B. (eds.) Comparitive Risk Assessment and Environmental Decision Making, Kluwer Academic Publishers, The Netherlands.
MORFORD, CURTISS & RIVES, 2009, Steps toward net environmental benefit in agency decisions, Oregon Insider, Vol. (453), pp 1-7.
MUSTAJOKI & MARTTUNEN, 2013, Comparison of multi-criteria decision analysis software, Finnish Environment Institute, IMPERIA Project Finland.
NAVFAC, 2008, SiteWise tool for green and sustainable remediation, Prepared by Battelle, United States Navy and United States Army Corp of Engineers,
NICOLE, 2012, How to implement sustainable remediation in a contaminated land management project, Network for Industrially Contaminated Land in Europe, Sustainable Remediation Work Group, The Netherlands.
NICOLETTE, BURR & ROCKEL, 2013, A practical approach tfor demonstrating environmental sustainability and stewardship through a net ecosystem service analysis, Sustainability Journal, Vol. 5(1), pp 2152-2177.
NOAA, 1990, Excavation and rock washing treatment technology: Net environmental benefits analysis, National Oceanic and Atmospheric Administration, Hazardous Materials Branch, Seattle, WA.
NOAA, 1995, Habitat equivalency analysis: Damage assessment and restoration program (revised 2000), United States Department of Commerce, National Oceanic and Atmospheric Administration, Seattle, WA.
NSW DOPE, 2015, Guidelines for the economic assessment of mining and coal seam gas proposals, New South Wales Department of Planning and Environment, Sydney.
NSW TREASURY, 2007, NSW Government guidelines for economic appraisal, Report no. TPP07-5, New South Wales Treasury, Office of Financial Management, Sydney.
NZ TREASURY, 2015, Guide to social cost benefit analysis, New Zealand Department of Treasury, Auckland, NZ.
OECD, 2010, Guidance on sustainability impact assessment, Organisation for Economic Co-operation and Development, Paris.
OSAT-2, 2011, Summary report for fate and effects of remnant oil in the beach environment, Prepared by Operational Science Advisory Team, Gulf Coast Incident Management Team. Prepared for US Coast Guard Federal On-Scene Coordinator Deepwater Horizon MC252, United States.
CRC CARE National Remediation Framework Guideline on performing cost-benefit and sustainability analysis of remediation options
Information correct at time of publication 136 Version 0.1: August 2018
OSWER, 2011, Handbook on the benefits, costs and impacts of land cleanup and reuse, United States Environmental Protection Agency, Office of Policy, Office of Solid Waste and Emergency Response, Washinton, DC.
POVEDA & LIPSETT, 2011, A review of sustainability assessment and sustainability / environmental rating systems and credit weighting tools, Journal of Sustainable Development, Vol. 4(6), pp 36-55.
RODERICKS & LEVY, 2013, Science and decisions: Advancing toxicology to advance risk assessment, Toxicological Science, Vol. 131(1), pp 1-8.
SALLING, JENSEN & LELEUR, 2005, COSIMA-DSS evaluation system: A new decision support system for large-scale transport infrastructure projects, Presented at 10th EURO Working Group on Transportation (EWGT) & 16th Mini-EURO Conference, Poznan, Poland.
SANSCARTIER, MARGNI, REIMER & ZEEB, 2010, Comparison of the secondary environmental impacts of three remediation alternatives for a diesel-contaminated site in northern Canada, Soil and Sediment Contamination: An International Journal, Vol. 19(3), pp 338-355.
SCHIMMOLLER & KEALY, 2013, Fit for purpose water: The cost of overtreating reclaimed water [Online]: Prepared by CH2M HILL, Prepared for WateReuse Research Foundation. Available: https://watereuse.org/wp-content/uploads/2015/12/2013_Watereuse_Webcast_Schimmoller_Kealy-Rev1.pdf [Accessed].
SCHUTTE & BRITS, 2012, Prioritising transport infrastructure projects: towards a multi-criterion analysis, Southern African Business Review, Vol. 16(3), pp.
SIJTSMA, HEIDE & HINSBERG, 2011, Biodiversity and decision support: Integrating CBA and MCA, In: HULL, A., ALEXANDER, E., KHAKEE, A. & WOLTJER, J. (eds.) Evaluation for participation and sustainability in planning, Routledge, London.
SINGH, JAIN & TYAGI, 2007, Risk and reliability analysis: A handbook for civil and environmental engineers, American Society of Civil Engineers, Reston, VA.
STEVENS, 2008, Sustainability assessment methdologies, Presented at Workshop on Sustainability Assessment Methdologies Amsterdam.
SURF UK, 2010, A framework for assessing the sustainability of soil and groundwater remediation, Prepared by Sustainable Remediation Forum United Kingdom, Prepared for Contaminated Land: Applications in Real Environments, London.
SUSTAINABLE REMEDIATION FORUM, 2009, Integrating sustainable principles, practices, and metrics into remediation projects, Remediation Journal, Vol. 19(3), pp 5-114.
TCEQ, 2001 (updated 2017), Conducting ecological risk assessments at remediation sites in Texas, RG-263, Texas Commission on Environmental Quality, Austin, TX.
TEMANORD, 2007, Nordic guideline for cost-benefit analysis in waste management, Nordic Council of Ministers, Nordic Council, Copenhagen.
TOFFELETTO, DESCHENES & SAMPSON, 2005, LCA of ex-situ bioremediation of diesel contaminated soil, The International Journal of Life Cycle Assessment, Vol. 10(6), pp 406-416.
UK DEPT FOR COMMUNITIES AND LOCAL GOVERNMENT, 2009, Multi-criteria analysis: A manual, United Kingdom Department for Communities and Local Government, London.
UK EA, 1999, Cost benefit analysis for remediation of land contamination, United Kingdom Environmental Agency, Bristol.
UK EA, 2011 (withdrawn 2016), Horizontal guidance note H1: Overview document, United
CRC CARE National Remediation Framework Guideline on performing cost-benefit and sustainability analysis of remediation options
Information correct at time of publication 137 Version 0.1: August 2018
Kingdon Environment Agency, Bristol.
UK EA, 2011 (withdrawn 2016), Horizontal guidance note H1: Overview document, Annex K - cost-benefit analysis, United Kingdon Environment Agency, Bristol.
UNITED NATIONS, 1987, Our common future: Report of the world commission on environment and development, United Nations,
US ACE, 2000, Planning guidance notebook, Engineer Regulation ER 1105-2-100, United States Army Corps of Engineers, Washington, DC.
US ACE, 2002, Trade-off analysis planning and procedures guidebook, IWR 02-R-2, United States Army Corps of Engineers, Institute for Water Resources, Alexandria, VA.
US ACE, 2012, IWR planning suite MCDA module: User guide, Prepared by CDM Inc, Prepared for United States Army Corps of Engineers, Institute for Water Resources, Carbondale, IL.
US AFCEE, 2008, AFCEE sustainable remediation tool (SRT), United States Air Force Centre for Engineering and the Environment, http://www.afcee.af.mil/resources/technologytransfer/programsandinitiatives/sustainableremediation/srt/index.asp.
US ARMY, 2013, US Army cost benefit analysis guide, United States Office of the Deputy Assistant Secretary of the Army (Cost and Economics), Washington, DC.
US DEPT OF NAVY, 2012, Guidance on green and sustainable remediation, Technical Report no UG-2093-ENV rev1, Prepared by Battelle Memorial Institute, Prepared for United States Naval Facilities Engineering Service Centre, Port Hueneme, CA.
US DOE, 2003, A framework for net environmental benefit analysis for remediation or restoration of petroleum-contaminated sites, Report no. ORNL/TM-2003/17, Prepared by UT-Battelle LLC, Prepared for United States Department of Energy, Oak Ridge, TN.
US EPA, 1994, Summary of executive order 12898 - federal actions to address environmental justice in minority populations and low-income populations, Reference no. 59-FR-7629, United States Environmental Protection Agency, Washington, DC.
US EPA, 1997, Ecological risk assessment guidance for superfund: Process for conducting ecological risk assessment (interim final), EPA/540/R-97/006, United States Environmental Protection Agency, Washington, DC.
US EPA, 1999, Issuance of final guidance: Ecological risk assessment and risk management principles for superfund sites, Directive 9285.7-28 P, United States Environmental Protection Agency, Office of Solid Waste and Emergency Response, Washington, DC.
US EPA, 2006, Ecological benefits assessment strategic plan, EPA/240/R-06_001, United States Environmental Protection Agency, Cincinnati, OH.
US EPA, 2006, Life cycle assessment: Principles and practice, EPA/600/R-06/060, Produced by Scientific Applications International Corporation, Produced for United States Environmental Protection Agency, Cincinnati, OH.
US EPA, 2008, Draft final report - Demonstrating the net benefit of site cleanup: An evaluation of ecological and economic metrics at two superfund sites, United States Environmental Protection Agency, Office of Solid Waste and Emergency Response, Washington, DC.
US EPA, 2008, Technology primer - Green remediation: Incorporating sustainable environmental practices into remediation of contaminated sites, EPA/542/R-08/002, United States Environmental Protection Agency, Office of Solid Waste and Emergency Response, Washington, DC.
CRC CARE National Remediation Framework Guideline on performing cost-benefit and sustainability analysis of remediation options
Information correct at time of publication 138 Version 0.1: August 2018
US EPA, 2009, Valuing the protection of ecological systems and services, EPA/SAB/09/012, United States Environmental Protection Agency, Science Advisory Board,
US EPA, 2010, Guidelines for preparing economic analysis, EPA/240/R-10/001, United States Environmental Protection Agency, Office of Policy, National Centre for Environmental Economics, Washington, DC.
US EPA, Plan EJ 2014, United States Environmental Protection Agency, Office of Environmental Justice,
US EPA, 2012, Methodology for understanding and reducing a project's environmental footprint, EPA/542/R-12/002, United States Environmental Protection Agency, Office of Solid Waste and Emergency Response, Office of Superfund Remediation and Technology Innovation, Washington, DC.
US EPA, 2013, Mapping tools for communities to identify assest and hazards in local areas, United States Environmental Protection Agency, Office of Environmental Justice,
US EPA, 2014, Framework for human health risk assessment to inform decision making, EPA/100/R-14/001, United States Environmental Protection Agency, Risk Assessment Forum, Cincinnati, OH.
US NATIONAL RESEARCH COUNCIL, 2009, Science and decisions: Advancing risk assessment, National Academies Press, Washington, DC.
VAN WEZEL, FRANKEN, DRISSEN, VERSLUIJS & VAN DER BERG, 2008, Societal cost-benefit analysis for soil remediation in The Netherlands, Integrated Environmental Assessment and Management, Vol. 4(1), pp 61-74.
VIC DTF, 2013, Economic evaluation for business cases: Technical guidelines, Victorian Department of Treasury and Finance, Melbourne.
VON WINTERFELDT & EDWARDS, 1986, Decision analysis and behavioral research, Cambridge University Press, Cambridge, US.
WASHINGTON STATE, Chapter 173-340 Washington Code: Model Toxics Control Act - Cleanup, Washington State Legislature,
WENNING, SORENSEN & MAGAR, 2006, Importance of implementation and residual risk analyses in sediment remediation, Integrated Environmental Assessment and Management, Vol. 2(1), pp 59-65.