Embed Size (px)
Citation preview

Guide to System Center Management Pack for SQL Server 2014 Analysis ServicesMicrosoft Corporation
Published: June, 2017
The Operations Manager team encourages you to provide any feedbacks on the management pack by sending them to [email protected].
CopyrightThis document is provided "as-is". Information and views expressed in this document, including URL and other Internet website references, may change without notice. You bear the risk of using it.
Some examples depicted herein are provided for illustration only and are fictitious. No real association or connection is intended or should be inferred.
This document does not provide you with any legal rights to any intellectual property in any Microsoft product. You may copy and use this document for your internal, reference purposes. You may modify this document for your internal, reference purposes.
© 2017 Microsoft Corporation. All rights reserved.
Microsoft, Active Directory, Windows, and Windows Server are trademarks of the Microsoft group of companies.
All other trademarks are property of their respective owners.

ContentsGuide to System Center Management Pack for SQL Server 2014 Analysis Services....................5
Guide History............................................................................................................................... 5Supported Configurations............................................................................................................5
Management Pack Scope........................................................................................................6Mandatory Configuration..........................................................................................................6Files in this Management Pack................................................................................................7
Management Pack Purpose........................................................................................................8Monitoring Scenarios...............................................................................................................8How Health Rolls Up..............................................................................................................12
Configuring Management Pack for SQL Server 2014 Analysis Services......................................13Best Practice: Create a Management Pack for Customizations.............................................13How to Create a New Management Pack for Customizations................................................13How to import a Management Pack.......................................................................................14How to enable Agent Proxy option.........................................................................................14
Security Configuration...............................................................................................................14Viewing Information in the Operations Manager Console..........................................................16
Version-independent (generic) views and dashboards...........................................................16SQL Server 2014 Analysis Services views.............................................................................17Dashboards............................................................................................................................ 18
Links.......................................................................................................................................... 19
Appendix: Management Pack Contents........................................................................................19Views and Dashboards..............................................................................................................19Analysis Services Database Group...........................................................................................20
Analysis Services Database Group - Discoveries..................................................................20Analysis Services Server Roles Group......................................................................................20
Analysis Services Server Roles Group - Discoveries.............................................................20Server Roles Group................................................................................................................... 21
Server Roles Group - Discoveries..........................................................................................21SQL Server Alerts Scope Group................................................................................................21
SQL Server Alerts Scope Group - Discoveries.......................................................................21SQL Server Analysis Services Alerts Scope Group...................................................................21
SQL Server Analysis Services Alerts Scope Group - Discoveries..........................................21SQL Server Computers.............................................................................................................21
SQL Server Computers - Discoveries....................................................................................21SSAS 2014 Event Log Collection Target...................................................................................22
SSAS 2014 Event Log Collection Target - Discoveries..........................................................22SSAS 2014 Event Log Collection Target - Rules (alerting).....................................................22

SSAS 2014 Instance................................................................................................................. 22SSAS 2014 Instance - Unit monitors......................................................................................22SSAS 2014 Instance - Rules (non-alerting)...........................................................................29
SSAS 2014 Multidimensional DB..............................................................................................38SSAS 2014 Multidimensional DB - Discoveries.....................................................................38SSAS 2014 Multidimensional DB - Unit monitors...................................................................39SSAS 2014 Multidimensional DB - Dependency (rollup) monitors.........................................41SSAS 2014 Multidimensional DB - Rules (non-alerting)........................................................41
SSAS 2014 Multidimensional Instance......................................................................................45SSAS 2014 Multidimensional Instance - Discoveries.............................................................45SSAS 2014 Multidimensional Instance - Dependency (rollup) monitors................................46
SSAS 2014 Multidimensional Partition......................................................................................46SSAS 2014 Multidimensional Partition - Discoveries.............................................................46SSAS 2014 Multidimensional Partition - Unit monitors...........................................................46SSAS 2014 Multidimensional Partition - Rules (non-alerting)................................................47
SSAS 2014 PowerPivot Instance..............................................................................................49SSAS 2014 PowerPivot Instance - Discoveries.....................................................................49
SSAS 2014 Seed.......................................................................................................................49SSAS 2014 Seed - Discoveries..............................................................................................49
SSAS 2014 Tabular DB.............................................................................................................50SSAS 2014 Tabular DB - Discoveries....................................................................................50SSAS 2014 Tabular DB - Unit monitors..................................................................................50SSAS 2014 Tabular DB - Rules (non-alerting).......................................................................52
SSAS 2014 Tabular Instance.....................................................................................................56SSAS 2014 Tabular Instance - Discoveries............................................................................56SSAS 2014 Tabular Instance - Dependency (rollup) monitors...............................................57
Appendix: Known Issues and Troubleshooting.............................................................................57

Guide to System Center Management Pack for SQL Server 2014 Analysis ServicesThis guide was written based on version 6.7.31.0 of Management Pack for SQL Server 2014 Analysis Services.
Guide HistoryRelease Date Changes
June, 2017 (version 6.7.31.0 RTM)
Restricted the length of some string class properties Updated the visualization library
December, 2016 (version 6.7.15.0 RTM)
Added support for configurations where computer host names are longer than 15 symbols
Fixed: AS workflows sometimes crash Updated the visualization library
March, 2016 Updated references and removed deprecated elements to support 6.6.4.0+ visualization library
Fixed bug when SSAS Management Pack could not collect OS performance counters with localized names
Updated discoveries to throw errors in case of some problems detected during the discovery
Fixed module error collection on cluster instances to reduce the noise Changed defaults for CPU Usage monitor, added sampling to
Memory Usage on the server monitor Reduced inner complexity of modules Fixed the discoveries; now the last items can be undiscovered Simplified the dashboard to make it quicker and more informative Reviewed and updated the Knowledge Bases Added timeout support for every non-native workflow Fixed Blocking Session Monitor – in some situations it could calculate
blocking sessions incorrectly Win10 support: fixed OS version detection issue Fixed CPU usage alert description “Known Issues and Troubleshooting” section of the guide is updated
June, 2015 Dashboards were replaced with the new ones
October, 2014 Original release of this management pack
Supported ConfigurationsThis monitoring pack requires System Center Operations Manager 2012 RTM or later (Dashboards are supported starting with SCOM 2012 SP1). A dedicated Operations Manager management group is not required.
The following table details the supported configurations for Management Pack for SQL Server 2014 Analysis Services:
5

Configuration Support
SQL Server 2014 Analysis Services
64-bit SQL Server 2014 Analysis Services on 64-bit OS
x86 SQL Server 2014 Analysis Services on x86 OS
Clustered servers Yes
Agentless monitoring Not supported
Virtual environment Yes
Management Pack ScopeManagement Pack for SQL Server 2014 Analysis Services enables the monitoring of the following features:
Instance of SQL Server 2014 Analysis Services running in one of these modes: Multidimensional Mode; Tabular Mode; PowerPivot Mode;
SQL Server 2014 Analysis Services Databases; SQL Server 2014 Analysis Services Database Partitions.
Please refer to “Monitoring Scenarios” section for a complete list of monitoring scenarios supported by this management pack.
This management pack supports up to 50 Databases per SSAS Instance. Exceeding the number of monitored Databases and a high number of Partitions may lead to performance degradation. It is recommended to disable discovery workflow for Partitions in this case.
Mandatory Configuration Import the Management Pack.
Associate SSAS Run As profiles with an account that has administrator permissions for both Windows Server and SQL Server Analysis Services instance.
Enable the Agent Proxy option on all agents installed on the servers that are members of a cluster. It is not necessary to enable this option for standalone servers. For instructions, see the procedure that follows this list.
Note that SQL Server Browser service is mandatory for Analysis Services discovery and monitoring. SQL Server Browser must be installed and turned on.
Files in this Management PackManagement Pack for SQL Server 2014 Analysis Services includes the following files:
Important
6

File Description
Microsoft.SQLServer.2014.AnalysisServices.Discovery.mpb
This Management Pack discovers Microsoft SQL Server 2014 Analysis Services Instances and related objects. The management pack contains discovery logic only, and requires a separate monitoring management pack to be imported to monitor the discovered objects. Required.
Microsoft.SQLServer.2014.AnalysisServices.Monitoring.mpb
This Management Pack enables the monitoring of Microsoft SQL Server 2014 Analysis Services. It depends on Microsoft SQL 2014 Analysis Services (Discovery) Management Pack. Required.
Microsoft.SQLServer.2014.AnalysisServices.Presentation.mpb
This Management Pack adds SQL Server 2014 Analysis Services Dashboards. Optional.
Microsoft.SQLServer.2014.AnalysisServices.Views.mp
This Management Pack contains views and folder structure for Microsoft SQL Server 2014 Analysis Services management pack. Optional.
Microsoft.SQLServer.Generic.Presentation.mp
This Management Pack defines common folder structure and views. Optional.
Microsoft.SQLServer.Generic.Dashboards.mp
This Management Pack defines common components required for SQL Server dashboards. Optional.
Microsoft.SQLServer.Visualization.Library.mpb
This Management Pack contains basic visual components required for SQL Server dashboards. Optional.
7

Management Pack PurposeThis Management Pack provides monitoring for SQL Server 2014 Analysis Services instances, databases and partitions.
In this section:
Monitoring Scenarios How Health Rolls Up
For details on the discoveries, rules, monitors, views, and reports contained in this management pack, see Appendix: Management Pack Contents.
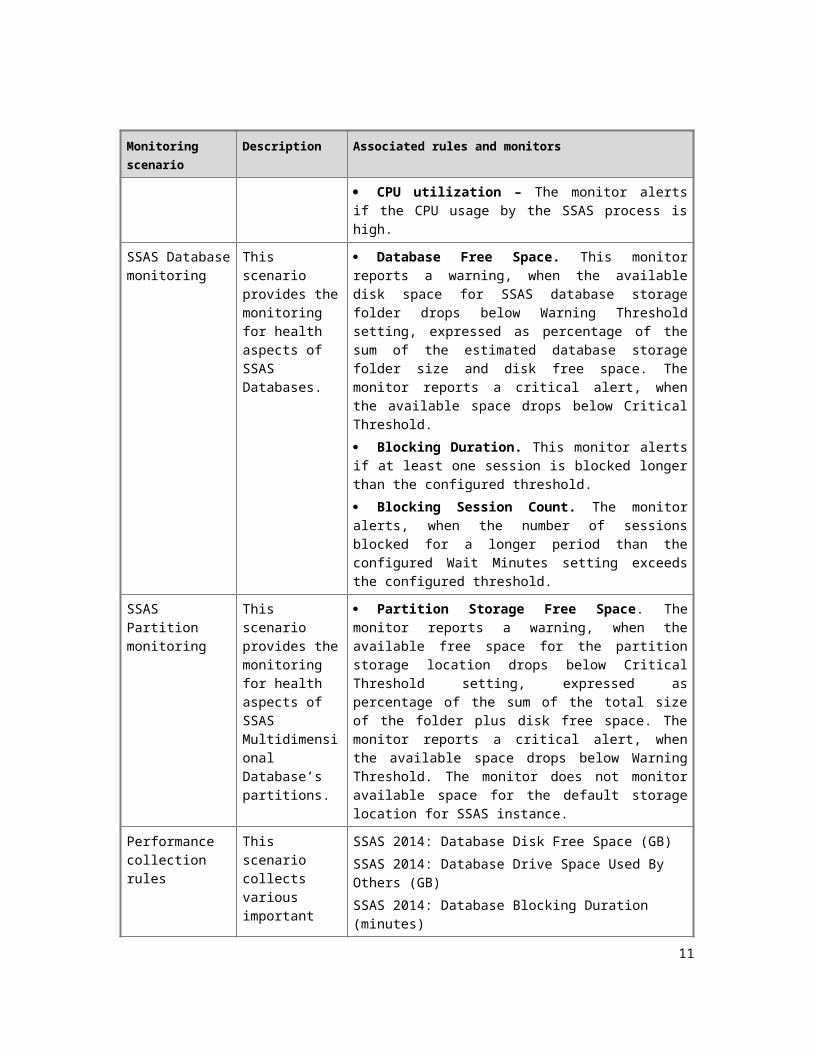
Monitoring Scenarios
Monitoring scenario
Description Associated rules and monitors
SSAS Instance monitoring
This scenario provides the monitoring for health aspects of SSAS Instances.
Service State. This monitor alerts, when the Windows service for SSAS instance is not in running state for a period longer than the configured threshold.
Memory Configuration Conflict with SQL Server. This monitor alerts if there is an SQL Server relational database engine process running on the server, and TotalMemoryLimit configuration for SSAS instance is higher than the specified threshold, in order to ensure that SQL Server process has sufficient memory.
TotalMemoryLimit Configuration. This monitor alerts, when the configured TotalMemoryLimit for SSAS instance exceeds the configured threshold, risking allocation of physical memory required for the operating system to perform the necessary basic functions (at least 2 GB).
Memory Usage. This monitor reports a warning, when memory allocations by SSAS instance surpass the configured Warning Threshold, expressed as a percentage of TotalMemoryLimit setting for SSAS instance. The monitor issues a critical alert, when these allocations surpass the configured Critical Threshold.
Memory Usage on the Server. This monitor observes the memory usage by non-SSAS processes on the server, to ensure that TotalMemoryLimit for Analysis Services is always available.
8

Monitoring scenario
Description Associated rules and monitors
Processing Pool I/O Job Queue length. This monitor alerts, when the length of the processing pool I/O job queue for SSAS instance is greater than the configured threshold.
Processing Pool Job Queue length. This monitor alerts, when the length of the processing pool job queue for SSAS instance is greater than the configured threshold.
Query Pool Queue length. This monitor alerts, when the length of the query pool queue for SSAS instance is greater than the configured threshold.
Default Storage Free Space. This monitor reports a warning, when the available free space for the instance default storage drops below Warning Threshold setting, expressed as percentage of the sum of estimated default storage folder (DataDir) size and disk free space. The monitor reports a critical alert, when the available space drops below Critical Threshold. The monitor does not take into account the databases or partitions located in folders other than the default storage folder (DataDir).
CPU utilization – The monitor alerts if the CPU usage by the SSAS process is high.
SSAS Database monitoring
This scenario provides the monitoring for health aspects of SSAS Databases.
Database Free Space. This monitor reports a warning, when the available disk space for SSAS database storage folder drops below Warning Threshold setting, expressed as percentage of the sum of the estimated database storage folder size and disk free space. The monitor reports a critical alert, when the available space drops below Critical Threshold.
Blocking Duration. This monitor alerts if at least one session is blocked longer than the configured threshold.
Blocking Session Count. The monitor alerts, when the number of sessions blocked for a longer period than the configured Wait Minutes setting exceeds the configured threshold.
SSAS Partition monitoring
This scenario provides the
Partition Storage Free Space. The monitor reports a warning, when the available free space for the partition
9

Monitoring scenario
Description Associated rules and monitors
monitoring for health aspects of SSAS Multidimensional Database’s partitions.
storage location drops below Critical Threshold setting, expressed as percentage of the sum of the total size of the folder plus disk free space. The monitor reports a critical alert, when the available space drops below Warning Threshold. The monitor does not monitor available space for the default storage location for SSAS instance.
Performance collection rules
This scenario collects various important performance metrics
SSAS 2014: Database Disk Free Space (GB)
SSAS 2014: Database Drive Space Used By Others (GB)
SSAS 2014: Database Blocking Duration (minutes)
SSAS 2014: Database Free Space (%)
SSAS 2014: Database Free Space (GB)
SSAS 2014: Number of Database Blocked Sessions
SSAS 2014: Database Size (GB)
SSAS 2014: Database Storage Folder Size (GB)
SSAS 2014: Partition Size (GB)
SSAS 2014: Partition Free Space (GB)
SSAS 2014: Partition Used by Others (GB)
SSAS 2014: Partition Free Space (%)
SSAS 2014: Total Drive Size (GB)
SSAS 2014: Drive Used Space (GB)
SSAS 2014: Actual System Cache (GB)
SSAS 2014: Instance Free Space (%)
SSAS 2014: Instance Free Space (GB)
SSAS 2014: Cache Evictions/sec
SSAS 2014: Cache Inserts/sec
SSAS 2014: Cache KB added/sec
SSAS 2014: CPU utilization (%)
SSAS 2014: Default Storage Folder Size (GB)
SSAS 2014: Low Memory Limit (GB)
SSAS 2014: Cleaner Current Price
SSAS 2014: Memory Usage on the Server (GB)
SSAS 2014: Memory Usage on the Server (%)
10
Monitoring scenario
Description Associated rules and monitors
SSAS 2014: Memory Usage by AS Non-shrinkable (GB)
SSAS 2014: Processing Pool I/O Job Queue Length
SSAS 2014: Processing Pool Job Queue Length
SSAS 2014: Processing Rows read/sec
SSAS 2014: Instance Memory (GB)
SSAS 2014: Instance Memory (%)
SSAS 2014: Query Pool Job Queue Length
SSAS 2014: Storage Engine Query Rows sent/sec
SSAS 2014: Total Memory Limit (GB)
SSAS 2014: Total Memory on the Server (GB)
SSAS 2014: Used Space on Drive (GB)
Alert rules The rule notifies about occurred errors
An error occurred during execution of a SSAS 2014 MP managed module
11

How Health Rolls UpThe following diagram shows how health states of the objects roll up in this management pack.
12

Configuring Management Pack for SQL Server 2014 Analysis ServicesThis section provides guidance on configuring and tuning this management pack.
Best Practice: Create a Management Pack for Customizations How to import a Management Pack How to enable Agent Proxy option Security Configuration
Best Practice: Create a Management Pack for CustomizationsManagement Pack for Microsoft SQL Server 2014 Analysis Services is sealed so that you cannot change any of the original settings in the management pack file. However, you can create customizations, such as overrides or new monitoring objects, and save them to a different management pack. By default, the Operations Manager saves all customizations to the default management pack. As a best practice, you should instead create a separate management pack for each sealed management pack you want to customize.
Creating a new management pack for storing overrides has the following advantages:
When you create a management pack for the purpose of storing customized settings for a sealed management pack, it is helpful to base the name of the new management pack on the name of the management pack that it is customizing, such as “Microsoft SQL Server 2014 Analysis Services Overrides”.
Creating a new management pack for storing customizations of each sealed management pack makes it easier to export the customizations from a test environment to a production environment. It also makes it easier to delete a management pack, because you must delete any dependencies before you can delete a management pack. If customizations for all management packs are saved in the Default Management Pack and you need to delete a single management pack, you must first delete the Default Management Pack, which also deletes customizations to other management packs.
For more information about sealed and unsealed management packs, see Management Pack Formats. For more information about management pack customizations and the default management pack, see About Management Packs.
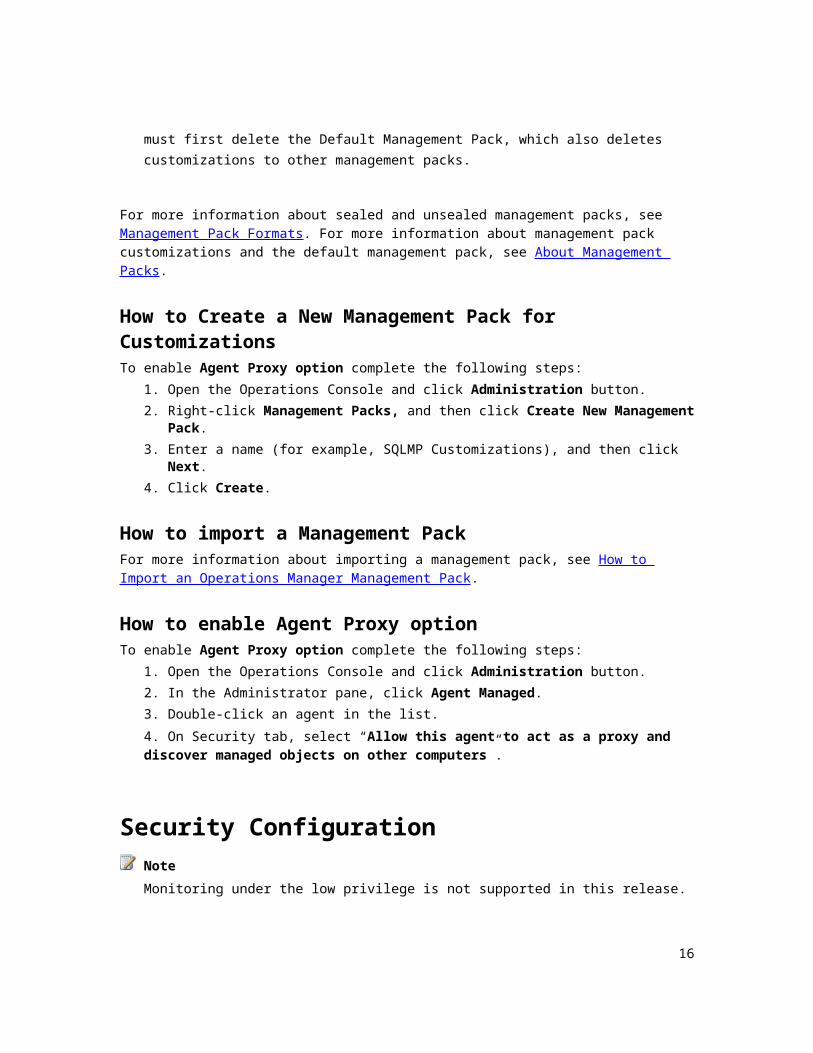
How to Create a New Management Pack for CustomizationsTo enable Agent Proxy option complete the following steps:
1. Open the Operations Console and click Administration button.2. Right-click Management Packs, and then click Create New Management Pack.3. Enter a name (for example, SQLMP Customizations), and then click Next.
13

4. Click Create.
How to import a Management PackFor more information about importing a management pack, see How to Import an Operations Manager Management Pack.
How to enable Agent Proxy optionTo enable Agent Proxy option complete the following steps:
1. Open the Operations Console and click Administration button.2. In the Administrator pane, click Agent Managed.3. Double-click an agent in the list.
4. On Security tab, select “Allow this agent to act as a proxy and discover managed objects on other computers”.
Security Configuration
Monitoring under the low privilege is not supported in this release.
Run As ProfilesWhen Management Pack for Microsoft SQL Server Analysis Services is imported for the first time, it creates two new Run As profiles:
Microsoft SQL Server 2014 Analysis Services Discovery Run As Profile – this profile is associated with all discoveries.
Microsoft SQL Server 2014 Analysis Services Monitoring Run As Profile – this profile is associated with all monitors and rules.
By default, all discoveries and monitors defined in SQL Server management pack use accounts defined in “Default Action Account” Run As profile. If the default action account for a given system does not have the necessary permissions to discover or monitor the instance of SQL Server Analysis Services, then those systems can be bound to more specific credentials in “Microsoft SQL Server 2014 …” Run As profiles, which do have access.
Run As Profile Name Associated Rules, Monitors and Discoveries Notes
Microsoft SQL Server 2014 Analysis Services Discovery Run As Profile
SSAS 2014 Group DiscoverySSAS 2014 Seed DiscoverySSAS 2014 Multidimensional Instance DiscoverySSAS 2014 Multidimensional DB DiscoverySSAS 2014 Multidimensional Partition Discovery
Account with administrator permissions for both Windows
Note
14

Run As Profile Name Associated Rules, Monitors and Discoveries Notes
SSAS 2014 PowerPivot Instance DiscoverySSAS 2014 Tabular Instance DiscoverySSAS 2014 Tabular DB Discovery
Server and SQL Server Analysis Services instance should be used
Microsoft SQL Server 2014 Analysis Services Monitoring Run As Profile
SSAS 2014: Database Disk Free Space (GB)
SSAS 2014: Database Drive Space Used By Others (GB)
SSAS 2014: Database Blocking Duration (minutes)
SSAS 2014: Database Free Space (%)
SSAS 2014: Database Free Space (GB)
SSAS 2014: Number of Database Blocked Sessions
SSAS 2014: Database Size (GB)
SSAS 2014: Database Storage Folder Size (GB)
SSAS 2014: Partition Size (GB)
SSAS 2014: Partition Free Space (GB)
SSAS 2014: Partition Used by Others (GB)
SSAS 2014: Partition Free Space (%)
SSAS 2014: Total Drive Size (GB)
SSAS 2014: Drive Used Space (GB)
SSAS 2014: Actual System Cache (GB)
SSAS 2014: Instance Free Space (%)
SSAS 2014: Instance Free Space (GB)
SSAS 2014: Cache Evictions/sec
SSAS 2014: Cache Inserts/sec
SSAS 2014: Cache KB added/sec
SSAS 2014: CPU utilization (%)
SSAS 2014: Default Storage Folder Size (GB)
SSAS 2014: Low Memory Limit (GB)
SSAS 2014: Cleaner Current Price
SSAS 2014: Memory Usage on the Server (GB)
SSAS 2014: Memory Usage on the Server (%)
SSAS 2014: Memory Usage by AS Non-shrinkable (GB)
SSAS 2014: Processing Pool I/O Job Queue Length
Account with administrator permissions for both Windows Server and SQL Server Analysis Services instance should be used
15
Run As Profile Name Associated Rules, Monitors and Discoveries Notes
SSAS 2014: Processing Pool Job Queue Length
SSAS 2014: Processing Rows read/sec
SSAS 2014: Instance Memory (GB)
SSAS 2014: Instance Memory (%)
SSAS 2014: Query Pool Job Queue Length
SSAS 2014: Storage Engine Query Rows sent/sec
SSAS 2014: Total Memory Limit (GB)
SSAS 2014: Total Memory on the Server (GB)
SSAS 2014: Used Space on Drive (GB)
Viewing Information in the Operations Manager Console
Version-independent (generic) views and dashboardsMicrosoft.SQLServer.Generic.Presentation management pack introduces a common folder structure, which will be used by future management packs releases for different components of SQL Server. The following views and dashboards are version-independent, and show information about all versions of SQL Server:
Microsoft SQL Server
Active Alerts
SQL Server Roles
Summary
Computers
Task Status
“SQL Server Roles” dashboard provides information about all instances of SQL Server Database Engine, SQL Server Reporting Services, SQL Server Analysis Services and SQL Server Integration Services:
16

SQL Server 2014 Analysis Services viewsManagement Pack for Microsoft SQL Server 2014 Analysis Services introduces a comprehensive set of state, performance and alert views, which can be found in the dedicated folder:
Monitoring
Microsoft SQL Server
SQL Server Analysis Services
SQL Server 2014 Analysis Services
Please refer to “Appendix: Views and Dashboards” section of this guide for the complete list of views.
Some views may contain very long list of objects or metrics. To find a specific object or group of objects, you can use the Scope, Search, and Find buttons on the Operations Manager toolbar. For more information, see the “Finding Data and Objects in the Operations Manager Consoles” article in the Operations Manager Help.
Note
Note
17

DashboardsThis management pack includes a set of rich dashboards which provide detailed information about SQL Server 2014 Analysis Services (Instances) and Databases.
For detailed information, see SQLServerDashboards.doc.
Note
18
LinksThe following links connect you to information about common tasks that are associated with System Center Management Packs:
1. Management Pack Life Cycle
2. How to Import an Operations Manager Management Pack
3. Creating a Management Pack for Overrides
4. Managing Run As Accounts and Profiles
5. How to Export an Operations Manager Management Pack
6. How to Remove an Operations Manager Management Pack
If you already have some familiarity with the basic functionality of Management Packs and would like to expand your Service Pack knowledge, you may check out a free System Center 2012 R2 Operations Manager Management Pack course at Microsoft Virtual Academy (MVA).
For questions about the Operations Manager and management packs, see the System Center Operations Manager community forum (http://go.microsoft.com/fwlink/?LinkID=179635).
All information and content on non-Microsoft sites is provided by the owner or the users of the website. Microsoft makes no warranties, express, implied, or statutory, as to the information at this website.
Appendix: Management Pack ContentsManagement Pack for Microsoft SQL Server 2014 Analysis Services discovers objects of classes described in the following sections. Not all of the objects are automatically discovered. Use overrides to enable discovery of those objects that are not discovered automatically.
Views and DashboardsThis Management Pack contains the following folders, views and dashboards:
Microsoft SQL Server 2014 Analysis Services
Active Alerts
Important
19

Database State
Summary
Instance State
Multidimensional Analysis Services
Active Alerts
Database State
Instance State
Partition State
Performance
PowerPivot Analysis Services
Active Alerts
Instance State
Performance
Tabular Analysis Services
Active Alerts
Database State
Instance State
Performance
Analysis Services Database GroupAnalysis Services Database Group contains all SQL Server root objects such as Analysis Services instance.
Analysis Services Database Group - DiscoveriesSSAS 2014: Server Database Group DiscoveryThis object discovery populates Server Roles group to contain all SQL Server 2014 Analysis Services Server Roles.
20

Analysis Services Server Roles GroupAnalysis Services Server Roles Group contains all SQL Server root objects such as Analysis Services instance.
Analysis Services Server Roles Group - DiscoveriesSSAS 2014: Server Roles Group DiscoveryThis object discovery populates Server Roles group to contain all SQL Server 2014 Analysis Services Server Roles.
Server Roles GroupServer Roles Group contains all SQL Server root objects such as Database Engine, Analysis Services instance or Reporting Service instance.
Server Roles Group - DiscoveriesSSAS 2014: Server Roles Group DiscoveryThis object discovery populates Server Roles group to contain all SQL Server 2014 Analysis Services Server Roles.
SQL Server Alerts Scope GroupSQL Server Alerts Scope Group contains SQL Server objects which can throw alerts.
SQL Server Alerts Scope Group - DiscoveriesSSAS 2014: Alerts Scope Group DiscoveryThis object discovery populates the Alerts Scope group to contain all SQL Server 2014 Analysis Services Server Roles.
SQL Server Analysis Services Alerts Scope GroupSQL Server Analysis Services Alerts Scope Group contains SQL Server Analysis Services objects which can throw alerts.
SQL Server Analysis Services Alerts Scope Group - DiscoveriesSSAS 2014: Alerts Scope Group DiscoveryThis object discovery populates Alerts Scope group to contain all SQL Server 2014 Analysis Services Server Roles.
21

SQL Server ComputersThis group contains all Windows computers that are running a component of Microsoft SQL Server
SQL Server Computers - DiscoveriesSSAS 2014: Discover SQL Server Computer Group membershipPopulates the computer group to contain all computers running SQL Server 2014 Analysis Services.
SSAS 2014 Event Log Collection TargetThis object is used to collect errors from event log of computers that have SSAS 2014 components.
SSAS 2014 Event Log Collection Target - DiscoveriesSSAS 2014 Event Log Collection Target DiscoveryThis discovery rule discovers an event log collection target for a Microsoft SQL Server 2014 Analysis Services. This object is used to collect module errors from event log of computers that have SSAS 2014 components.
Name Description Default value
Enabled Yes
Frequency in seconds 14400
SSAS 2014 Event Log Collection Target - Rules (alerting)An error occurred during execution of a SSAS 2014 MP managed moduleThe rule oversees the Event Log and watches for error events submitted by SSAS 2014 management pack. If one of the workflows (discovery, rule or monitor) fails, an event is logged and a critical alert is reported.
Name Description Default value
Enabled Yes
Generate Alerts Yes
Priority 2
Severity 2
22

SSAS 2014 InstanceAn installation of Microsoft SQL Server 2014 Analysis Services
SSAS 2014 Instance - Unit monitorsCPU Utilization (%)The monitor alerts if SSAS process CPU usage exceeds the Threshold.
Name Description Default value
Enabled Yes
Generate Alerts True
Critical Threshold (%) The monitor alerts if the CPU utilization caused by SSAS process is higher than the threshold.
95
Interval Seconds The recurring interval of time in seconds in which to run the workflow.
900
Number of samples Indicates how many times a measured value should breach a threshold before the state is changed.
4
Synchronization Time The synchronization time specified by using a 24-hour format. May be omitted.
Timeout (seconds) Specifies the time the workflow is allowed to run before being closed and marked as failed.
300
Memory Usage on the ServerThe monitor observes the memory usage by non Analysis Services processes on the server, to ensure Total Memory Limit for Analysis Services is always available.
Name Description Default value
Enabled Yes
Generate Alerts True
Critical Threshold (%) Health State changes to Critical, when Free Unreserved (%) drops below the threshold.
5
Interval Seconds The recurring interval of time in seconds in which to run the workflow.
900
23

Synchronization Time The synchronization time specified by using a 24-hour format. May be omitted.
Timeout (seconds) Specifies the time the workflow is allowed to run before being closed and marked as failed.
300
Warning Threshold (%) Health State changes to Warning, when Free Unreserved (%) drops below the threshold, but is still higher than Critical Threshold (%).
10
Default Storage Free SpaceThe monitor reports a warning, when the available free space for the default instance storage drops below Warning Threshold setting, expressed as percentage of the sum of estimated default storage folder (Data Directory) size and disk free space. The monitor reports a critical alert, when the available space drops below Critical Threshold. The monitor does not take into account databases or partitions located in folders other than the default storage folder (Data Directory).
Name Description Default value
Enabled Yes
Generate Alerts True
Critical Threshold (%) Health State changes to Critical, if AS Instance Free Space (%) performance counter drops below the threshold.
5
Interval Seconds The recurring interval of time in seconds in which to run the workflow.
900
Synchronization Time The synchronization time specified by using a 24-hour format. May be omitted.
Timeout (seconds) Specifies the time the workflow is allowed to run before being closed and marked as failed.
300
Warning Threshold (%) Health State changes to Warning, if AS Instance Free Space (%) performance counter drops below the threshold, but is still higher than Critical Threshold (%).
10
Service State
24

The monitor alerts, when Windows service for SSAS instance is not in running state for a duration greater than the configured threshold.
Name Description Default value
Enabled Yes
Generate Alerts True
Alert only if service startup type is automatic
This may only be set to 'True' or 'False'. If set to 'False', then alerts will be triggered, no matter what the startup type is set to. Default is 'True'.
true
Interval Seconds The recurring interval of time in seconds in which to run the workflow.
60
Number of samples Health State changes, if the number of subsequent check failures is greater than or equal to the Minimum Number of Checks.
15
Synchronization Time The synchronization time specified by using a 24-hour format. May be omitted.
Timeout (seconds) Specifies the time the workflow is allowed to run before being closed and marked as failed.
300
Memory Configuration Conflict with SQL ServerThe monitor alerts if there is a SQL Server relational database engine process running on the server, and Total Memory Limit configuration for SSAS instance is higher than the specified threshold, in order to ensure that the SQL server process has sufficient memory.
Name Description Default value
Enabled Yes
Generate Alerts True
Interval Seconds The recurring interval of time in seconds in which to run the workflow.
604800
Synchronization Time The synchronization time specified by using a 24-hour format. May be omitted.
Timeout (seconds) Specifies the time the workflow is allowed to run before being closed and marked as failed.
300
25

Warning Threshold (%) Health State changes, if there is an SQL Server relational database engine process running on the server, and Total Memory Limit configuration setting for SSAS instance exceeds the threshold.
40
Processing Pool I/O Job Queue lengthThe monitor alerts, when the length of the processing pool I/O job queue for SSAS instance is greater than the configured threshold.
Name Description Default value
Enabled Yes
Generate Alerts True
Interval Seconds The recurring interval of time in seconds in which to run the workflow.
900
Number of samples Health State changes, if the number of threshold breaches is greater than or equal to the Minimum Number of Breaches.
4
Synchronization Time The synchronization time specified by using a 24-hour format. May be omitted.
Timeout (seconds) Specifies the time the workflow is allowed to run before being closed and marked as failed.
300
Warning Threshold Health State changes, if Analysis Services performance counter exceeds the threshold.
0
Processing Pool Job Queue lengthThe monitor alerts, when the length of the processing pool job queue for SSAS instance is greater than the configured threshold.
Name Description Default value
Enabled Yes
Generate Alerts True
Interval Seconds The recurring interval of time in seconds in which to run the workflow.
900
26

Number of samples Health State changes, if the number of threshold breaches is greater than or equal to the Minimum Number of Breaches.
4
Synchronization Time The synchronization time specified by using a 24-hour format. May be omitted.
Timeout (seconds) Specifies the time the workflow is allowed to run before being closed and marked as failed.
300
Warning Threshold Health State changes, if Analysis Services performance counter exceeds the threshold.
0
Total Memory Limit ConfigurationThe monitor alerts, when the configured Total Memory Limit for SSAS instance exceeds the configured threshold, risking allocation of physical memory required for the operating system to perform its essential functions, at least 2 GB.
Name Description Default value
Enabled Yes
Generate Alerts True
Interval Seconds The recurring interval of time in seconds in which to run the workflow.
604800
Synchronization Time The synchronization time specified by using a 24-hour format. May be omitted.
Timeout (seconds) Specifies the time the workflow is allowed to run before being closed and marked as failed.
300
Warning Threshold (GB) The monitor alerts, when the configured Total Memory Limit for the operating system exceeds the configured threshold, risking allocation of physical memory required for the operating system to perform its essential functions, at least 2 GB.
2
Memory UsageThe monitor reports a warning, when memory allocations by SSAS instance surpass the configured Warning Threshold, expressed as a percentage of Total Memory Limit setting for
27

SSAS instance. The monitor issues a critical alert, when these allocations surpass the configured Critical Threshold.
Name Description Default value
Enabled Yes
Generate Alerts True
Critical Threshold (%) Health State changes to Critical, when Analysis Services Memory Usage (%) exceeds the threshold.
95
Interval Seconds The recurring interval of time in seconds in which to run the workflow.
900
Synchronization Time The synchronization time specified by using a 24-hour format. May be omitted.
Timeout (seconds) Specifies the time the workflow is allowed to run before being closed and marked as failed.
300
Warning Threshold (%) Health State changes to Warning, when Analysis Services Memory Usage (%) exceeds the threshold, but is still lower than Critical Threshold (%).
80
Query Pool Queue lengthThe monitor alerts, when the size of query pool queue for SSAS instance is greater than the configured threshold.
Name Description Default value
Enabled Yes
Generate Alerts True
Interval Seconds The recurring interval of time in seconds in which to run the workflow.
900
Number of samples Health State changes, if the number of threshold breaches is greater than or equal to the Minimum Number of Breaches.
4
Synchronization Time The synchronization time specified by using a 24-hour format. May be omitted.
28

Timeout (seconds) Specifies the time the workflow is allowed to run before being closed and marked as failed.
300
Warning Threshold Health State changes, if Analysis Services performance counter exceeds the threshold.
0
SSAS 2014 Instance - Rules (non-alerting)SSAS 2014: Processing Pool Job Queue LengthThe rule collects the length of the processing pool job queue.
Name Description Default value
Enabled Yes
Generate Alerts No
Interval Seconds The recurring interval of time in seconds in which to run the workflow.
900
Synchronization Time The synchronization time specified by using a 24-hour format. May be omitted.
Timeout (seconds) Specifies the time the workflow is allowed to run before being closed and marked as failed.
300
SSAS 2014: Total Memory on the Server (GB)The rule collects the total size of memory in gigabytes on the computer, where SSAS instance is running.
Name Description Default value
Enabled Yes
Generate Alerts No
Interval Seconds The recurring interval of time in seconds in which to run the workflow.
900
Synchronization Time The synchronization time specified by using a 24-hour format. May be omitted.
Timeout (seconds) Specifies the time the workflow is allowed to run before being closed and marked as failed.
300
29

SSAS 2014: Instance Free Space (%)The rule collects the amount of free space on the drive, where the default storage folder (Data Directory) for SSAS instance is located, expressed as percentage of the sum of estimated default storage folder (Data Directory) size and disk free space.
Name Description Default value
Enabled Yes
Generate Alerts No
Interval Seconds The recurring interval of time in seconds in which to run the workflow.
900
Synchronization Time The synchronization time specified by using a 24-hour format. May be omitted.
Timeout (seconds) Specifies the time the workflow is allowed to run before being closed and marked as failed.
300
SSAS 2014: Memory Usage by AS Non-shrinkable (GB)The rule collects non-shrinkable memory in gigabytes allocated by SSAS instance.
Name Description Default value
Enabled Yes
Generate Alerts No
Interval Seconds The recurring interval of time in seconds in which to run the workflow.
900
Synchronization Time The synchronization time specified by using a 24-hour format. May be omitted.
Timeout (seconds) Specifies the time the workflow is allowed to run before being closed and marked as failed.
300
SSAS 2014: Processing Rows read/secThe rule collects Rate of rows read from all relational databases.
Name Description Default value
Enabled Yes
Generate Alerts No
30

Interval Seconds The recurring interval of time in seconds in which to run the workflow.
900
Synchronization Time The synchronization time specified by using a 24-hour format. May be omitted.
Timeout (seconds) Specifies the time the workflow is allowed to run before being closed and marked as failed.
300
SSAS 2014: Cache added KB/secThe rule collects SSAS rate of memory added to the cache, KB/sec.
Name Description Default value
Enabled Yes
Generate Alerts No
Interval Seconds The recurring interval of time in seconds in which to run the workflow.
900
Synchronization Time The synchronization time specified by using a 24-hour format. May be omitted.
Timeout (seconds) Specifies the time the workflow is allowed to run before being closed and marked as failed.
300
SSAS 2014: Memory Usage on the Server (%)The rule collects total memory usage in percent on the server, where SSAS instance is located.
Name Description Default value
Enabled Yes
Generate Alerts No
Interval Seconds The recurring interval of time in seconds in which to run the workflow.
900
Synchronization Time The synchronization time specified by using a 24-hour format. May be omitted.
Timeout (seconds) Specifies the time the workflow is allowed to run before being closed and marked as failed.
300
31

SSAS 2014: Instance Free Space (GB)The rule collects the amount of free space on the drive, where the default storage folder (Data Directory) for SSAS instance is located in gigabytes.
Name Description Default value
Enabled Yes
Generate Alerts No
Interval Seconds The recurring interval of time in seconds in which to run the workflow.
900
Synchronization Time The synchronization time specified by using a 24-hour format. May be omitted.
Timeout (seconds) Specifies the time the workflow is allowed to run before being closed and marked as failed.
300
SSAS 2014: Used Space on Drive (GB)The rule collects the total amount of used disk space on the disk, where SSAS instance Data Directory is located.
Name Description Default value
Enabled Yes
Generate Alerts No
Interval Seconds The recurring interval of time in seconds in which to run the workflow.
900
Synchronization Time The synchronization time specified by using a 24-hour format. May be omitted.
Timeout (seconds) Specifies the time the workflow is allowed to run before being closed and marked as failed.
300
SSAS 2014: Low Memory Limit (GB)The rule collects the current configuration for the Low Memory Limit of SSAS instance in gigabytes.
Name Description Default value
Enabled Yes
Generate Alerts No
32

Interval Seconds The recurring interval of time in seconds in which to run the workflow.
900
Synchronization Time The synchronization time specified by using a 24-hour format. May be omitted.
Timeout (seconds) Specifies the time the workflow is allowed to run before being closed and marked as failed.
300
SSAS 2014: Instance Memory (GB)The rule collects the total size in gigabytes of memory allocated by SSAS instance.
Name Description Default value
Enabled Yes
Generate Alerts No
Interval Seconds The recurring interval of time in seconds in which to run the workflow.
900
Synchronization Time The synchronization time specified by using a 24-hour format. May be omitted.
Timeout (seconds) Specifies the time the workflow is allowed to run before being closed and marked as failed.
300
SSAS 2014: Cache Inserts/secThe rule collects SSAS rate of insertions into the cache.
Name Description Default value
Enabled Yes
Generate Alerts No
Interval Seconds The recurring interval of time in seconds in which to run the workflow.
900
Synchronization Time The synchronization time specified by using a 24-hour format. May be omitted.
Timeout (seconds) Specifies the time the workflow is allowed to run before being closed and marked as failed.
300
33

SSAS 2014: Processing Pool I/O Job Queue LengthThe rule collects the length of SSAS processing pool I/O job queue.
Name Description Default value
Enabled Yes
Generate Alerts No
Interval Seconds The recurring interval of time in seconds in which to run the workflow.
900
Synchronization Time The synchronization time specified by using a 24-hour format. May be omitted.
Timeout (seconds) Specifies the time the workflow is allowed to run before being closed and marked as failed.
300
SSAS 2014: Default Storage Folder Size (GB)The rule collects the total size in gigabytes of the default storage folder (Data Directory) for SSAS instance, calculated as a sum of estimated sizes of the DBs and partitions located in the Data Directory.
Name Description Default value
Enabled Yes
Generate Alerts No
Interval Seconds The recurring interval of time in seconds in which to run the workflow.
900
Synchronization Time The synchronization time specified by using a 24-hour format. May be omitted.
Timeout (seconds) Specifies the time the workflow is allowed to run before being closed and marked as failed.
300
SSAS 2014: Cache Evictions/secThe rule collects SSAS rate of evictions from the cache.
Name Description Default value
Enabled Yes
Generate Alerts No
34

Interval Seconds The recurring interval of time in seconds in which to run the workflow.
900
Synchronization Time The synchronization time specified by using a 24-hour format. May be omitted.
Timeout (seconds) Specifies the time the workflow is allowed to run before being closed and marked as failed.
300
SSAS 2014: Actual System Cache (GB)The rule collects the size in gigabytes of system cache on the computer, where SSAS instance is located.
Name Description Default value
Enabled Yes
Generate Alerts No
Interval Seconds The recurring interval of time in seconds in which to run the workflow.
900
Synchronization Time The synchronization time specified by using a 24-hour format. May be omitted.
Timeout (seconds) Specifies the time the workflow is allowed to run before being closed and marked as failed.
300
35

SSAS 2014: Total Drive Size (GB)The rule collects the total size in gigabytes of the drive, where the default storage folder (Data Directory) for SSAS instance is located.
Name Description Default value
Enabled Yes
Generate Alerts No
Interval Seconds The recurring interval of time in seconds in which to run the workflow.
900
Synchronization Time The synchronization time specified by using a 24-hour format. May be omitted.
Timeout (seconds) Specifies the time the workflow is allowed to run before being closed and marked as failed.
300
SSAS 2014: Storage Engine Query Rows sent/secThe rule collects Rate of rows sent by server to clients.
Name Description Default value
Enabled Yes
Generate Alerts No
Interval Seconds The recurring interval of time in seconds in which to run the workflow.
900
Synchronization Time The synchronization time specified by using a 24-hour format. May be omitted.
Timeout (seconds) Specifies the time the workflow is allowed to run before being closed and marked as failed.
300
SSAS 2014: CPU utilization (%)The rule collects rate of CPU usage by SSAS Instance.
Name Description Default value
Enabled Yes
Generate Alerts No
Interval Seconds The recurring interval of time in seconds in which to run the
900
36

workflow.
Synchronization Time The synchronization time specified by using a 24-hour format. May be omitted.
Timeout (seconds) Specifies the time the workflow is allowed to run before being closed and marked as failed.
300
SSAS 2014: Total Memory Limit (GB)The rule collects the configuration on SSAS instance for Total Memory Limit in gigabytes.
Name Description Default value
Enabled Yes
Generate Alerts No
Interval Seconds The recurring interval of time in seconds in which to run the workflow.
900
Synchronization Time The synchronization time specified by using a 24-hour format. May be omitted.
Timeout (seconds) Specifies the time the workflow is allowed to run before being closed and marked as failed.
300
SSAS 2014: Cleaner Current PriceThe rule collects current cost of memory as calculated by SSAS (cost per byte per unit of time) normalized and expressed on a scale from 0 to 1000.
Name Description Default value
Enabled Yes
Generate Alerts No
Interval Seconds The recurring interval of time in seconds in which to run the workflow.
900
Synchronization Time The synchronization time specified by using a 24-hour format. May be omitted.
Timeout (seconds) Specifies the time the workflow is allowed to run before being closed and marked as failed.
300
37

SSAS 2014: Query Pool Job Queue LengthThe rule collects the length of the query pool job queue.
Name Description Default value
Enabled Yes
Generate Alerts No
Interval Seconds The recurring interval of time in seconds in which to run the workflow.
900
Synchronization Time The synchronization time specified by using a 24-hour format. May be omitted.
Timeout (seconds) Specifies the time the workflow is allowed to run before being closed and marked as failed.
300
SSAS 2014: Instance Memory (%)The rule collects the total size in percent of memory allocated by SSAS instance.
Name Description Default value
Enabled Yes
Generate Alerts No
Interval Seconds The recurring interval of time in seconds in which to run the workflow.
900
Synchronization Time The synchronization time specified by using a 24-hour format. May be omitted.
Timeout (seconds) Specifies the time the workflow is allowed to run before being closed and marked as failed.
300
SSAS 2014: Memory Usage on the Server (GB)The rule collects total memory usage in gigabytes on the server, where SSAS instance is located.
Name Description Default value
Enabled Yes
Generate Alerts No
Interval Seconds The recurring interval of time in seconds in which to run the workflow.
900
38

Synchronization Time The synchronization time specified by using a 24-hour format. May be omitted.
Timeout (seconds) Specifies the time the workflow is allowed to run before being closed and marked as failed.
300
SSAS 2014 Multidimensional DBSSAS 2014 Multidimensional DB
SSAS 2014 Multidimensional DB - DiscoveriesSSAS 2014 Multidimensional DB DiscoveryThe object discovery discovers all databases of an instance of Microsoft SQL Server 2014 Analysis Services, Multidimensional Mode.
Name Description Default value
Enabled Yes
Interval Seconds The recurring interval of time in seconds in which to run the workflow.
14400
Synchronization Time The synchronization time specified by using a 24-hour format. May be omitted.
Timeout (seconds) Specifies the time the workflow is allowed to run before being closed and marked as failed.
300
SSAS 2014 Multidimensional DB - Unit monitorsBlocking DurationThe monitor alerts if at least one session is blocked for a longer period than the configured threshold.
Name Description Default value
Enabled Yes
Generate Alerts True
Interval Seconds The recurring interval of time in seconds in which to run the workflow.
900
39

Synchronization Time The synchronization time specified by using a 24-hour format. May be omitted.
Timeout (seconds) Specifies the time the workflow is allowed to run before being closed and marked as failed.
300
Warning Threshold (min) Health State changes, if at least one session is blocked longer than the threshold.
1
Database Free SpaceThe monitor reports a warning, when the available disk space for SSAS multidimensional database storage folder drops below Warning Threshold setting, expressed as percentage of the sum of the estimated database storage folder size plus disk free space. The monitor reports a critical alert, when the available space drops below Critical Threshold. The monitor does not take into account partitions located in folders other than the DB storage folder.
Name Description Default value
Enabled Yes
Generate Alerts True
Critical Threshold (%) Health State changes to Critical, when Database Free Space (%) performance counter drops below the threshold.
5
Interval Seconds The recurring interval of time in seconds in which to run the workflow.
900
Synchronization Time The synchronization time specified by using a 24-hour format. May be omitted.
Timeout (seconds) Specifies the time the workflow is allowed to run before being closed and marked as failed.
300
Warning Threshold (%) Health State changes to Warning, if Database Free Space (%) performance counter drops below the threshold, but is still higher than Critical Threshold (%).
10
40

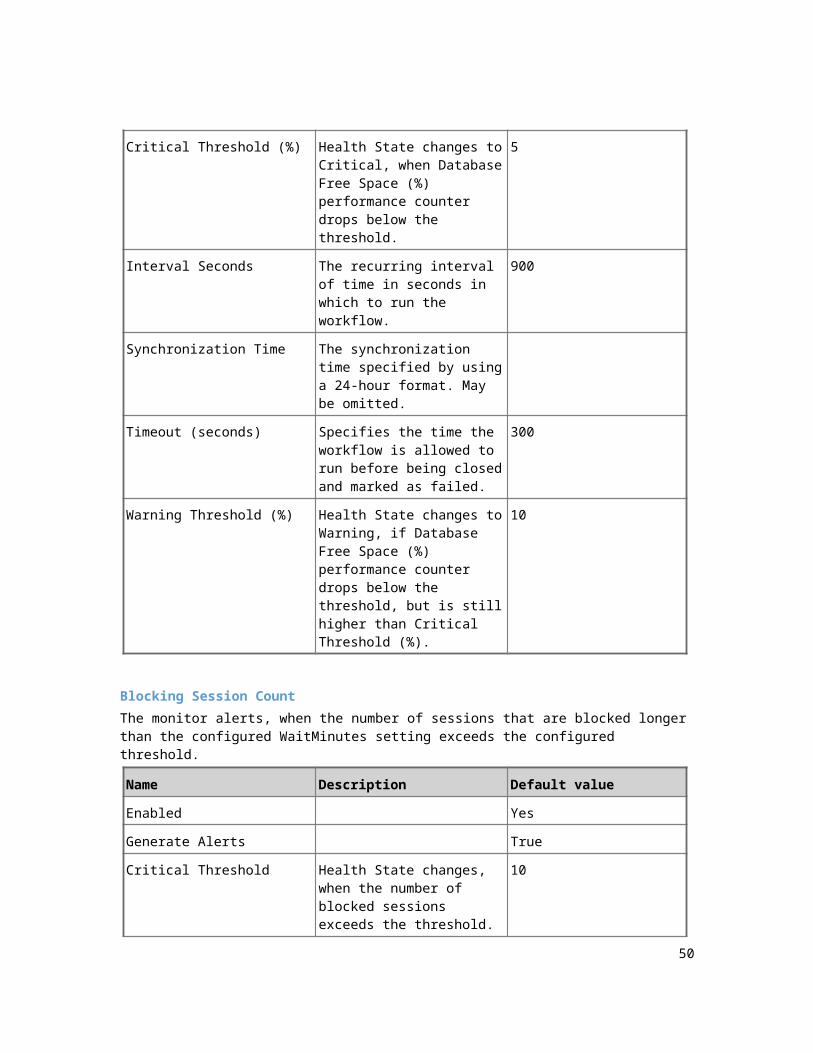
Blocking Session CountThe monitor alerts, when the number of sessions that are blocked longer than the configured WaitMinutes setting exceeds the configured threshold.
Name Description Default value
Enabled Yes
Generate Alerts True
Critical Threshold Health State changes, when the number of blocked sessions exceeds the threshold.
10
Interval Seconds The recurring interval of time in seconds in which to run the workflow.
900
Number of samples Health State changes, if the number of threshold breaches is greater than or equal to the Minimum Number of Breaches.
4
Synchronization Time The synchronization time specified by using a 24-hour format. May be omitted.
Timeout (seconds) Specifies the time the workflow is allowed to run before being closed and marked as failed.
300
Wait Minutes Wait Minutes parameter defines the minimum waiting time for the session to be considered by the monitor.
1
SSAS 2014 Multidimensional DB - Dependency (rollup) monitorsPartitions Performance RollupSQL Server 2014 Analysis Services Multidimensional Partitions Performance Health Rollup
SSAS 2014 Multidimensional DB - Rules (non-alerting)SSAS 2014: Database Size (GB)The rule collects the total estimated database size in gigabytes including size of all partitions.
Name Description Default value
Enabled Yes
Generate Alerts No
41

Interval Seconds The recurring interval of time in seconds in which to run the workflow.
900
Synchronization Time The synchronization time specified by using a 24-hour format. May be omitted.
Timeout (seconds) Specifies the time the workflow is allowed to run before being closed and marked as failed.
300
SSAS 2014: Drive Used Space (GB)The rule collects the total size in gigabytes of all files and folders on the drive, where the database storage folder is located.
Name Description Default value
Enabled Yes
Generate Alerts No
Interval Seconds The recurring interval of time in seconds in which to run the workflow.
900
Synchronization Time The synchronization time specified by using a 24-hour format. May be omitted.
Timeout (seconds) Specifies the time the workflow is allowed to run before being closed and marked as failed.
300
SSAS 2014: Total Drive Size (GB)The rule collects the total size in gigabytes of the drive, where the database storage folder is located.
Name Description Default value
Enabled Yes
Generate Alerts No
Interval Seconds The recurring interval of time in seconds in which to run the workflow.
900
Synchronization Time The synchronization time specified by using a 24-hour format. May be omitted.
Timeout (seconds) Specifies the time the workflow is allowed to run before being
300
42

closed and marked as failed.
SSAS 2014: Number of Database Blocked SessionsThe rule collects the number of currently blocked sessions.
Name Description Default value
Enabled Yes
Generate Alerts No
Interval Seconds The recurring interval of time in seconds in which to run the workflow.
900
Synchronization Time The synchronization time specified by using a 24-hour format. May be omitted.
Timeout (seconds) Specifies the time the workflow is allowed to run before being closed and marked as failed.
300
Name Description Default value
Enabled Yes
Generate Alerts No
Interval Seconds The recurring interval of time in seconds in which to run the workflow.
900
Synchronization Time The synchronization time specified by using a 24-hour
43

format. May be omitted.
Timeout (seconds) Specifies the time the workflow is allowed to run before being closed and marked as failed.
300
SSAS 2014: Database Drive Space Used By Others (GB)The rule collects the amount of used space on the drive, where the database is located, other than space used by the database itself.
Name Description Default value
Enabled Yes
Generate Alerts No
Interval Seconds The recurring interval of time in seconds in which to run the workflow.
900
Synchronization Time The synchronization time specified by using a 24-hour format. May be omitted.
Timeout (seconds) Specifies the time the workflow is allowed to run before being closed and marked as failed.
300
SSAS 2014: Database Free Space (GB)The rule collects the amount of free space in gigabytes on the drive, where the storage folder of the database is located.
Name Description Default value
Enabled Yes
Generate Alerts No
Interval Seconds The recurring interval of time in seconds in which to run the workflow.
900
Synchronization Time The synchronization time specified by using a 24-hour format. May be omitted.
Timeout (seconds) Specifies the time the workflow is allowed to run before being closed and marked as failed.
300
SSAS 2014: Database Disk Free Space (GB)The rule collects the amount of free space on the drive, where the database is located.
44

Name Description Default value
Enabled Yes
Generate Alerts No
Interval Seconds The recurring interval of time in seconds in which to run the workflow.
900
Synchronization Time The synchronization time specified by using a 24-hour format. May be omitted.
Timeout (seconds) Specifies the time the workflow is allowed to run before being closed and marked as failed.
300
SSAS 2014: Database Storage Folder Size (GB)The rule collects the estimated size of the database storage folder in gigabytes.
Name Description Default value
Enabled Yes
Generate Alerts No
Interval Seconds The recurring interval of time in seconds in which to run the workflow.
900
Synchronization Time The synchronization time specified by using a 24-hour format. May be omitted.
Timeout (seconds) Specifies the time the workflow is allowed to run before being closed and marked as failed.
300
SSAS 2014 Multidimensional InstanceAn installation of Microsoft SQL Server 2014 Analysis Services, Multidimensional Mode
SSAS 2014 Multidimensional Instance - DiscoveriesSSAS 2014 Multidimensional Instance DiscoveryThe object discovery discovers all instances of Microsoft SQL Server 2014 Analysis Services, Multidimensional Mode.
Name Description Default value
Enabled Yes
45

Interval Seconds The recurring interval of time in seconds in which to run the workflow.
14400
Synchronization Time The synchronization time specified by using a 24-hour format. May be omitted.
Timeout (seconds) Specifies the time the workflow is allowed to run before being closed and marked as failed.
300
SSAS 2014 Multidimensional Instance - Dependency (rollup) monitorsDatabase Performance RollupSQL Server 2014 Analysis Services Multidimensional Database Performance Health Rollup
SSAS 2014 Multidimensional PartitionMicrosoft SQL Server 2014 Analysis Services Multidimensional Partition
SSAS 2014 Multidimensional Partition - DiscoveriesSSAS 2014 Multidimensional Partition DiscoveryThe object discovery discovers all partitions for Microsoft SQL Server 2014 Analysis Services Database, Multidimensional Mode.
Name Description Default value
Enabled Yes
Interval Seconds The recurring interval of time in seconds in which to run the workflow.
14400
Synchronization Time The synchronization time specified by using a 24-hour format. May be omitted.
Timeout (seconds) Specifies the time the workflow is allowed to run before being closed and marked as failed.
300
SSAS 2014 Multidimensional Partition - Unit monitorsPartition Storage Free Space
46

The monitor reports a warning, when the available free space for the partition storage location drops below Critical Threshold setting expressed as percentage of the sum of the total size of the folder plus disk free space. The monitor reports a critical alert, when the available space drops below Warning Threshold. The monitor does not monitor available space for the default storage location for SSAS instance.
Name Description Default value
Enabled Yes
Generate Alerts True
Critical Threshold (%) Health State changes to Critical, when Partition Free Space (%) performance counter drops below the threshold.
5
Interval Seconds The recurring interval of time in seconds in which to run the workflow.
900
Synchronization Time The synchronization time specified by using a 24-hour format. May be omitted.
Timeout (seconds) Specifies the time the workflow is allowed to run before being closed and marked as failed.
300
Warning Threshold (%) Health State changes to Warning, when Partition Free Space (%) performance counter drops below the threshold, but is still higher than Critical Threshold (%).
10
47

SSAS 2014 Multidimensional Partition - Rules (non-alerting)SSAS 2014: Partition Free Space (%)The rule collects the size of free space on the drive, where the partition storage is located, expressed as percentage of the sum of the partition storage folder total size plus disk free space.
Name Description Default value
Enabled Yes
Generate Alerts No
Interval Seconds The recurring interval of time in seconds in which to run the workflow.
900
Synchronization Time The synchronization time specified by using a 24-hour format. May be omitted.
Timeout (seconds) Specifies the time the workflow is allowed to run before being closed and marked as failed.
300
SSAS 2014: Partition Size (GB)The rule collects the estimated size of the partition in gigabytes.
Name Description Default value
Enabled Yes
Generate Alerts No
Interval Seconds The recurring interval of time in seconds in which to run the workflow.
900
Synchronization Time The synchronization time specified by using a 24-hour format. May be omitted.
Timeout (seconds) Specifies the time the workflow is allowed to run before being closed and marked as failed.
300
SSAS 2014: Partition Used by Others (GB)The rule collects the total amount of space in gigabytes on the drive, where the storage folder of the partition is located, which is allocated by files and folders other than the storage folder of the partition.
Name Description Default value
Enabled Yes
48

Generate Alerts No
Interval Seconds The recurring interval of time in seconds in which to run the workflow.
900
Synchronization Time The synchronization time specified by using a 24-hour format. May be omitted.
Timeout (seconds) Specifies the time the workflow is allowed to run before being closed and marked as failed.
300
SSAS 2014: Partition Free Space (GB)The rule collects the amount of free space in gigabytes on the drive, where the storage folder of the partition is located.
Name Description Default value
Enabled Yes
Generate Alerts No
Interval Seconds The recurring interval of time in seconds in which to run the workflow.
900
Synchronization Time The synchronization time specified by using a 24-hour format. May be omitted.
Timeout (seconds) Specifies the time the workflow is allowed to run before being closed and marked as failed.
300
SSAS 2014 PowerPivot InstanceAn installation of Microsoft SQL Server 2014 Analysis Services, PowerPivot Mode
SSAS 2014 PowerPivot Instance - DiscoveriesSSAS 2014 PowerPivot Instance DiscoveryThe object discovery discovers all instances of Microsoft SQL Server 2014 Analysis Services, PowerPivot Mode.
Name Description Default value
Enabled Yes
Interval Seconds The recurring interval of time in 14400
49
seconds in which to run the workflow.
Synchronization Time The synchronization time specified by using a 24-hour format. May be omitted.
Timeout (seconds) Specifies the time the workflow is allowed to run before being closed and marked as failed.
300
SSAS 2014 SeedAn installation of Microsoft SQL Server 2014 Analysis Services Seed
SSAS 2014 Seed - DiscoveriesSSAS 2014 Seed DiscoveryThis object discovery discovers a seed for Analysis Services installation. This object indicates that the particular server computer contains Analysis Services installation.
Name Description Default value
Enabled Yes
Frequency in seconds 14400
SSAS 2014 Tabular DBSSAS 2014 Tabular DB
SSAS 2014 Tabular DB - DiscoveriesSSAS 2014 Tabular DB DiscoveryThis object discovery discovers all databases running for a given instance of Microsoft SQL Server 2014 Analysis Services, Tabular Mode.
Name Description Default value
Enabled Yes
Interval Seconds The recurring interval of time in seconds in which to run the workflow.
14400
Synchronization Time The synchronization time specified by using a 24-hour format. May be omitted.
50

Timeout (seconds) Specifies the time the workflow is allowed to run before being closed and marked as failed.
300
SSAS 2014 Tabular DB - Unit monitorsDatabase Free SpaceThe monitor reports a warning, when the available disk space for SSAS tabular database storage folder drops below Warning Threshold setting, expressed as percentage of the sum of the estimated database storage folder size and disk free space. The monitor reports a critical alert, when the available space drops below Critical Threshold.
Name Description Default value
Enabled Yes
Generate Alerts True
Critical Threshold (%) Health State changes to Critical, when Database Free Space (%) performance counter drops below the threshold.
5
Interval Seconds The recurring interval of time in seconds in which to run the workflow.
900
Synchronization Time The synchronization time specified by using a 24-hour format. May be omitted.
Timeout (seconds) Specifies the time the workflow is allowed to run before being closed and marked as failed.
300
Warning Threshold (%) Health State changes to Warning, if Database Free Space (%) performance counter drops below the threshold, but is still higher than Critical Threshold (%).
10
Blocking DurationThe monitor alerts if at least one session is blocked for a longer period than the configured threshold.
Name Description Default value
Enabled Yes
Generate Alerts True
51

Interval Seconds The recurring interval of time in seconds in which to run the workflow.
900
Synchronization Time The synchronization time specified by using a 24-hour format. May be omitted.
Timeout (seconds) Specifies the time the workflow is allowed to run before being closed and marked as failed.
300
Warning Threshold (min) Health State changes, if at least one session is blocked longer than the threshold.
1
Blocking Session CountThe monitor alerts, when the number of sessions that are blocked longer than the configured WaitMinutes setting exceeds the configured threshold.
Name Description Default value
Enabled Yes
Generate Alerts True
Critical Threshold Health State changes, when the number of blocked sessions exceeds the threshold.
10
Interval Seconds The recurring interval of time in seconds in which to run the workflow.
900
Number of samples Health State changes, if the number of threshold breaches is greater than or equal to the Minimum Number of Breaches.
4
Synchronization Time The synchronization time specified by using a 24-hour format. May be omitted.
Timeout (seconds) Specifies the time the workflow is allowed to run before being closed and marked as failed.
300
Wait Minutes Wait Minutes parameter defines the minimum waiting time for the session to be considered by the monitor.
1
52

SSAS 2014 Tabular DB - Rules (non-alerting)SSAS 2014: Drive Used Space (GB)The rule collects the total size in gigabytes of all files and folders on the drive, where the database storage folder is located.
Name Description Default value
Enabled Yes
Generate Alerts No
Interval Seconds The recurring interval of time in seconds in which to run the workflow.
900
Synchronization Time The synchronization time specified by using a 24-hour format. May be omitted.
Timeout (seconds) Specifies the time the workflow is allowed to run before being closed and marked as failed.
300
SSAS 2014: Database Drive Space Used By Others (GB)The rule collects the amount of used space on the drive, where the database is located, other than space used by database itself.
Name Description Default value
Enabled Yes
Generate Alerts No
Interval Seconds The recurring interval of time in seconds in which to run the workflow.
900
Synchronization Time The synchronization time specified by using a 24-hour format. May be omitted.
Timeout (seconds) Specifies the time the workflow is allowed to run before being closed and marked as failed.
300
SSAS 2014: Database Free Space (GB)The rule collects the amount of free space in gigabytes on the drive, where the storage folder of the database is located.
Name Description Default value
Enabled Yes
53

Generate Alerts No
Interval Seconds The recurring interval of time in seconds in which to run the workflow.
900
Synchronization Time The synchronization time specified by using a 24-hour format. May be omitted.
Timeout (seconds) Specifies the time the workflow is allowed to run before being closed and marked as failed.
300
SSAS 2014: Database Disk Free Space (GB)The rule collects the amount of free space on the drive, where the database is located.
Name Description Default value
Enabled Yes
Generate Alerts No
Interval Seconds The recurring interval of time in seconds in which to run the workflow.
900
Synchronization Time The synchronization time specified by using a 24-hour format. May be omitted.
Timeout (seconds) Specifies the time the workflow is allowed to run before being closed and marked as failed.
300
SSAS 2014: Database Blocking Duration (minutes)The rule collects the longest blocking duration for currently blocked sessions.
Name Description Default value
Enabled Yes
Generate Alerts No
Interval Seconds The recurring interval of time in seconds in which to run the workflow.
900
Synchronization Time The synchronization time specified by using a 24-hour format. May be omitted.
Timeout (seconds) Specifies the time the workflow is allowed to run before being
300
54

closed and marked as failed.
SSAS 2014: Database Size (GB)The rule collects the total database size in gigabytes.
Name Description Default value
Enabled Yes
Generate Alerts No
Interval Seconds The recurring interval of time in seconds in which to run the workflow.
900
Synchronization Time The synchronization time specified by using a 24-hour format. May be omitted.
Timeout (seconds) Specifies the time the workflow is allowed to run before being closed and marked as failed.
300
SSAS 2014: Number of Database Blocked SessionsThe rule collects the number of currently blocked sessions.
Name Description Default value
Enabled Yes
Generate Alerts No
Interval Seconds The recurring interval of time in seconds in which to run the workflow.
900
Synchronization Time The synchronization time specified by using a 24-hour format. May be omitted.
Timeout (seconds) Specifies the time the workflow is allowed to run before being closed and marked as failed.
300
SSAS 2014: Total Drive Size (GB)The rule collects the total size in gigabytes of the drive, where the database storage folder is located.
Name Description Default value
Enabled Yes
55

Generate Alerts No
Interval Seconds The recurring interval of time in seconds in which to run the workflow.
900
Synchronization Time The synchronization time specified by using a 24-hour format. May be omitted.
Timeout (seconds) Specifies the time the workflow is allowed to run before being closed and marked as failed.
300
SSAS 2014: Database Free Space (%)The rule collects the amount of free space on the drive, where the storage folder of the database is located, expressed as percentage of the sum of estimated database storage folder size and disk free space.
Name Description Default value
Enabled Yes
Generate Alerts No
Interval Seconds The recurring interval of time in seconds in which to run the workflow.
900
Synchronization Time The synchronization time specified by using a 24-hour format. May be omitted.
Timeout (seconds) Specifies the time the workflow is allowed to run before being closed and marked as failed.
300
SSAS 2014: Database Storage Folder Size (GB)The rule collects the size of the database storage folder in gigabytes.
Name Description Default value
Enabled Yes
Generate Alerts No
Interval Seconds The recurring interval of time in seconds in which to run the workflow.
900
Synchronization Time The synchronization time specified by using a 24-hour format. May be omitted.
56

Timeout (seconds) Specifies the time the workflow is allowed to run before being closed and marked as failed.
300
SSAS 2014 Tabular InstanceAn installation of Microsoft SQL Server 2014 Analysis Services, Tabular Mode
SSAS 2014 Tabular Instance - DiscoveriesSSAS 2014 Tabular Instance DiscoveryThe object discovery discovers all instances of Microsoft SQL Server 2014 Analysis Services, Tabular Mode.
Name Description Default value
Enabled Yes
Interval Seconds The recurring interval of time in seconds in which to run the workflow.
14400
Synchronization Time The synchronization time specified by using a 24-hour format. May be omitted.
Timeout (seconds) Specifies the time the workflow is allowed to run before being closed and marked as failed.
300
Events 6200 and 4513 “Category does not exist” are reported into the Operations Manager event log.Issue: The issue may occur on a monitored machine right after a new instance of SQL Server Analysis Services Business Intelligence Edition is installed.
Resolution: Restart the Operations Manager agent on the machine.
If the last SSAS database or partition is deleted, the object will be still displayed in SCOM as if it exists.Issue: The current implementation of SSAS database and partition discoveries incorrectly resolves the situation, when the last SSAS database or partition is deleted: in this case the information regarding the deleted object remains visible to the user.
57
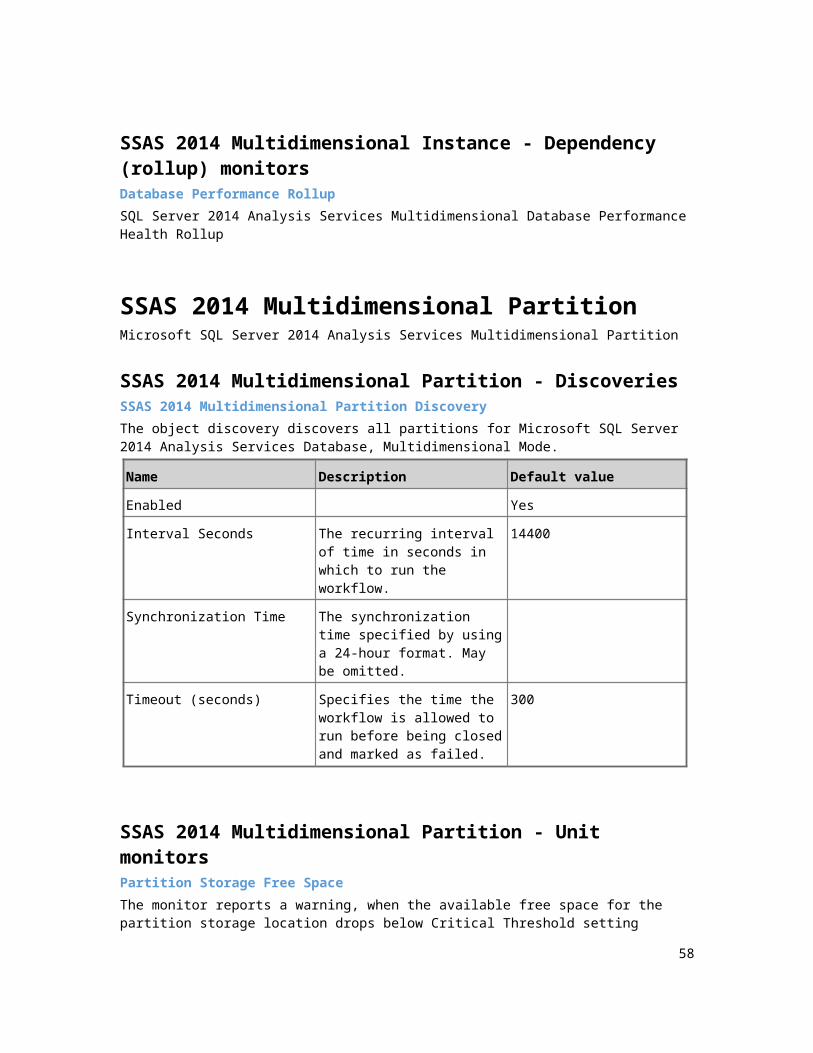
Resolution: There is no resolution. The error may be addressed in future releases of the management pack. The user can either add a SSAS database/partition, or remove SSAS instance.
An error occurred during execution of SSAS 2014 MP managed module: alert rule generates extra alerts for virtual nodes.Issue: The current implementation of the rule uses ‘SSAS 2014 Seed’ as a target. Virtual nodes have mutual seed; therefore, each time an error occurs on a node of a cluster, an alert is automatically reported from every virtual entity, which is currently associated with that node.
Resolution: There is no resolution. The error may be addressed in future releases of the management pack.
Event 6200 “Analysis Services connection failed” error is reported into the Operations Manager event log.Issue: Instance discovery workflows of SSAS management pack require connection to a SSAS instance; if the connection is not provided, the workflows report about encountered problems. Such issue may occur when the instance is stopped during execution of a workflow, or when the instance is incorrectly configured.
Resolution: Set ‘Threadpool\Query\MaxThreads’ property to a value of less than or equal to two times the number of processors on the server.
Operations Consoles crashes, when the user simultaneously opens two or more Instance/Database Summary dashboards on the same machine.Issue: It is allowed to run two or more Operations Consoles on the same machine, but opening summary dashboards in more than one of them leads to a crash of all consoles. The issue is not observed in Web-consoles.
Resolution: There is no resolution.
Operations console crashes, if the user selects a SSAS Instance which has already been deleted while browsing Instance Summary dashboard.Issue: The action causes a crash of Operations Console.
Resolution: Open Operation console again.
“Health Service State” monitor is in critical state, and Health Service restarts periodically.Issue: By default, the threshold of “Monitoring Host Private Bytes Threshold Monitor” from the System Management Pack is 300 Mbytes. “MonitoringHost.exe” process may exceed the threshold and “Health Service State” monitor may start the recovery procedure, when SSAS 2014 Management Pack is collecting information about a large number of objects (more than 50 SSAS databases or 1500 partitions per server).
Resolution: Override the threshold of “Monitoring Host Private Bytes Threshold Monitor”, or reduce the number of objects being monitored by disabling discovery of the partition objects.
58

Event 6200 “Category does not exist” (source – “SSAS 2014 MP”) is being generated on 64-bit operating systems running 32-bit SSAS instances.Issue: SSAS doesn’t register performance counters properly when a 32-bit SSAS instance is installed on a 64-bit OS. In this case the required performance counters cannot be found by Management Pack, and SSAS 2014 MP is unable to run properly.
Resolution: This issue cannot be resolved, WoW64 is not supported. It is highly recommended to use either 32-bit SSAS instances on 32-bit OS, or 64-bit SSAS instances on 64-bit OS.
Health Service and Monitoring Host processes consume too much memory on systems running SSAS 2014 instances with large number of databasesIssue: On agent-managed systems that host one or more instance of SQL Server 2014 Analysis Services with large number of databases and/or partitions, “Health Service” and “Monitoring Host” processes may consume too much memory.
Resolution: It is not recommended to monitor more than 50 SSAS Databases on a single server. It is recommended to disable SSAS partitions discovery, if you have more than 1500 partitions on a single server.
SSAS 2014 Summary Dashboards for Instances, Databases and Partitions display all active alerts if nothing is selected in the navigation widget (leftmost widget on the dashboard).Issue: Dashboards display all active alerts if nothing is selected in the navigation widget (the leftmost widget on the dashboard).
Resolution: Make sure that at least one Instance, Database or Partition is selected in the navigation widget.
Partition Storage Free Space Monitor may generate too many alerts.Issue: The monitor may generate a lot of alerts if database default storage folder and partition storage folder are sharing the same drive.
Resolution: Disable the monitor for all partitions, which are sharing the same drive with database storage folder.
SSAS 2014 Management Pack generates an alert: “An error occurred during execution of a SSAS 2014 MP managed module”.Issue: “An Error occurred during execution of a SSAS 2014 MP managed module” alert can be found in global “Active Alerts” view.
Resolution: This alert is generated, if SSAS 2014 Management Pack cannot execute one of the workflows due to unknown issue. Examine the alert message and alert context to determine the root cause.
59

SSAS 2014 Management Pack may register Errors in the event log during installation of a new instance of SQL Server Analysis Services.Issue: SSAS 2014 Management Pack may generate a lot of errors in event log during installation of a new instance of SQL Server Analysis Services.
Resolution: The issue occurs, because the Management Pack cannot get all required properties from the registry and WMI during the installation process. Once the installation process is completed, the Management Pack will be able to operate properly.
SQL Server 2014 Analysis Services reports incorrect value for Total and Low memory limit performance counters.Issue: SQL Server Analysis Services may report incorrect values for Total and Low memory limit performance counters after reconfiguration.
Resolution: SQL Server Analysis Services don’t apply new configuration values immediately. SSAS service should be restarted to apply the new settings.
SSAS 2014 Management Pack generates an alert: “Could not find a part of the path to configuration file 'msmdsrv.ini'” Issue: SSAS 2014 Management Pack reports an error in the Event log and generates “Could not find a part of the path to configuration file 'msmdsrv.ini'” alert. The issue occurs during a cluster failover.
Resolution: There is no resolution. The issue may occur, when monitoring workflow is trying to collect information during a cluster failover. Once the failover is completed, the Management Pack will be able to operate properly.
Collecting counters from x86 instances installed on x64 OS machines is not available.Issue: If x86 instances are installed on a machine with x64 OS, collection of counters from such instances may not work.
Resolution: Mind bitness of the instances during installation.
The dashboards may crash upon MP upgrade.Issue: In some cases, upon upgrade of the MP to version 6.6.7.6 the Operations Console may crash with ObjectNotFoundException error.
Resolution: Wait until the importing process is completed, and restart the Operations Console. Mind that the Operations Console restarting is essential after MP upgrade. Otherwise the dashboards will not work.
60