Embed Size (px)
Citation preview
Guide to the Swift archive
Version 2.
March 2007
Lorella Angelini (HEASARC)
Contents
1 Archive 2
1.1 Where and when the data are available . . . . . . . . . . . . . . . . . . . . . . . . . 2
1.2 Overview of the Swift archive . . . . . . . . . . . . . . . . . . . . . . . . . . . . . . . 3
1.2.1 Observation data . . . . . . . . . . . . . . . . . . . . . . . . . . . . . . . . . . 3
1.2.2 TDRSS messages . . . . . . . . . . . . . . . . . . . . . . . . . . . . . . . . . . 3
1.2.3 Trend and Monitoring data . . . . . . . . . . . . . . . . . . . . . . . . . . . . 4
1.2.4 Archival calibration data . . . . . . . . . . . . . . . . . . . . . . . . . . . . . 4
1.2.5 GRB Summary products . . . . . . . . . . . . . . . . . . . . . . . . . . . . . 4
1.2.6 BAT, XRT, and UVOT surveys . . . . . . . . . . . . . . . . . . . . . . . . . . 4
1.3 Database tables . . . . . . . . . . . . . . . . . . . . . . . . . . . . . . . . . . . . . . . 4
1.4 Proprietary Data Rights . . . . . . . . . . . . . . . . . . . . . . . . . . . . . . . . . . 5
2 Observation definition 6
2.1 Observation definition . . . . . . . . . . . . . . . . . . . . . . . . . . . . . . . . . . . 6
2.2 Target Id, Observation segment and Sequence number . . . . . . . . . . . . . . . . . 7
3 Archive structure 11
3.1 Data organization . . . . . . . . . . . . . . . . . . . . . . . . . . . . . . . . . . . . . 11
3.2 The ’obs’ data directory structure . . . . . . . . . . . . . . . . . . . . . . . . . . . . 11
3.3 The ’tdrss’ and ’trend’ directory structure . . . . . . . . . . . . . . . . . . . . . . . . 13
4 Data files 14
4.1 Filename convention . . . . . . . . . . . . . . . . . . . . . . . . . . . . . . . . . . . . 14
4.2 Data content within an observation . . . . . . . . . . . . . . . . . . . . . . . . . . . . 15
4.2.1 /auxil . . . . . . . . . . . . . . . . . . . . . . . . . . . . . . . . . . . . . . . . 15
4.2.2 /log . . . . . . . . . . . . . . . . . . . . . . . . . . . . . . . . . . . . . . . . . 16
4.2.3 /bat . . . . . . . . . . . . . . . . . . . . . . . . . . . . . . . . . . . . . . . . . 16
4.2.4 /uvot . . . . . . . . . . . . . . . . . . . . . . . . . . . . . . . . . . . . . . . . 18
4.2.5 /xrt . . . . . . . . . . . . . . . . . . . . . . . . . . . . . . . . . . . . . . . . . 21
4.3 TDRSS data . . . . . . . . . . . . . . . . . . . . . . . . . . . . . . . . . . . . . . . . 22
i
Guide to the Swift archive 1
4.4 Trend data . . . . . . . . . . . . . . . . . . . . . . . . . . . . . . . . . . . . . . . . . 24
4.4.1 BAT . . . . . . . . . . . . . . . . . . . . . . . . . . . . . . . . . . . . . . . . . 25
4.4.2 UVOT . . . . . . . . . . . . . . . . . . . . . . . . . . . . . . . . . . . . . . . . 25
4.4.3 XRT . . . . . . . . . . . . . . . . . . . . . . . . . . . . . . . . . . . . . . . . 25
4.4.4 Others . . . . . . . . . . . . . . . . . . . . . . . . . . . . . . . . . . . . . . . . 26
Chapter 1
Archive
This guide describes the contents and organization of the Swift archive.
1.1 Where and when the data are available
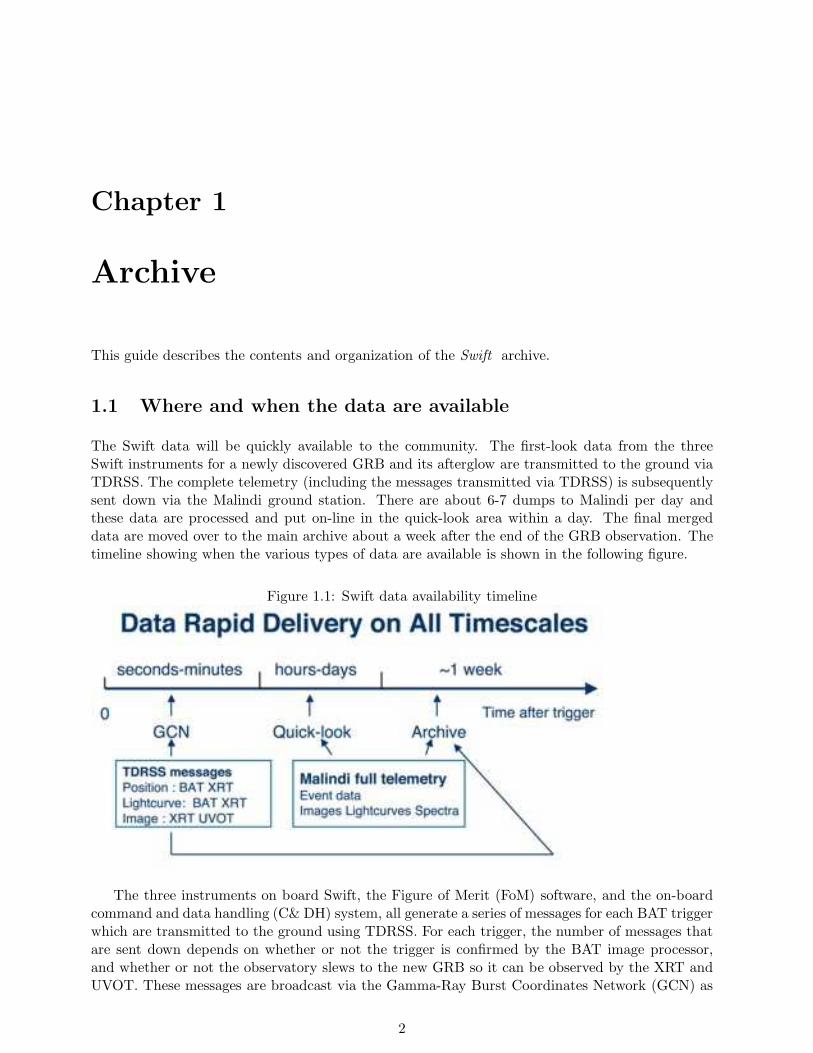
The Swift data will be quickly available to the community. The first-look data from the threeSwift instruments for a newly discovered GRB and its afterglow are transmitted to the ground viaTDRSS. The complete telemetry (including the messages transmitted via TDRSS) is subsequentlysent down via the Malindi ground station. There are about 6-7 dumps to Malindi per day andthese data are processed and put on-line in the quick-look area within a day. The final mergeddata are moved over to the main archive about a week after the end of the GRB observation. Thetimeline showing when the various types of data are available is shown in the following figure.
Figure 1.1: Swift data availability timeline
The three instruments on board Swift, the Figure of Merit (FoM) software, and the on-boardcommand and data handling (C& DH) system, all generate a series of messages for each BAT triggerwhich are transmitted to the ground using TDRSS. For each trigger, the number of messages thatare sent down depends on whether or not the trigger is confirmed by the BAT image processor,and whether or not the observatory slews to the new GRB so it can be observed by the XRT andUVOT. These messages are broadcast via the Gamma-Ray Burst Coordinates Network (GCN) as
2
Guide to the Swift archive 3
soon as they arrive on the ground, and later included in the archive. If users want to be notifiedof these alerts, they should enrol in the GCN (http://gcn.gsfc.nasa.gov). The processing ofthe data telemetered to Malindi occurs at the Science Data Center (SDC), which produces boththe quick-look and the final archive data. Quick-look data are produced after each Malindi dump.This typically results in the same observation (see Chapter 2) being reprocessed several times asnew data arrive to fill in any gaps. After each processing, the data are made publicly availablewithin a few hours on the SDC’s Quick Look facility.
When an observation is complete, the data flow through the processing pipeline one final timeto produce data for the final archive. Therefore, the data for the final archive are generated by thesame pipeline and software used for the quick-look data.
When no new processing has occurred on a particular observation for one week, the data aremoved from the SDC’s Quick Look Facility to the Swift Archive at the HEASARC and the otherEuropean archive centers in Italy and UK, and then removed from the Quick Look Facility. Usersshould be aware that the quick-look data for a given observation may not be complete, especiallythe early dumps of an observation, and that the contents may change when and if subsequenttelemetry dumps arrive.
1.2 Overview of the Swift archive
The Swift archive contains all the information, data and software which are needed to analyze Swiftdata. The Swift archival data are divided into six main areas, which are all populated on differenttimescales:
1.2.1 Observation data
The Swift data are divided into observations which are identified by a specific sequence number.For each observation, the archive will contain the data generated by the final processing pipeline.The data for an observation include the telemetry converted into FITS format with minimumprocessing (Level I), the calibrated and filtered data (Level II), and the results from the standardanalysis carried out on the Level II data (Level III). The latter category provides a quick overviewfor each GRB/afterglow observation, and includes BAT light curves in several energy bands andspectra, XRT images, spectra and light curves, and UVOT integrated color images. All data are inFITS format and follow the OGIP standards for high-energy astronomy data. In addition to theFITS files, each observation includes GIF plots which preview the FITS products, and an HTMLfile which records the processing history. The observation data populate the archive from the start(see the section on the Swift data proprietary period), and is used to create additional catalogs anddata products.
1.2.2 TDRSS messages
As mentioned in the previous section, the TDRSS messages also form part of the Swift archive.The messages will be converted into FITS, and the long messages will also be processed in order,for example to reproject the images from the XRT and UVOT and the UVOT finding chart intosky coordinates. The TDRSS data populate the archive immediantly after processed by the SDC.
Guide to the Swift archive 4
1.2.3 Trend and Monitoring data
This data set is created as part of the reformatting process of the Malindi data into FITS, andmay include files containing monitoring information on specific instrument parameters, or sometelemetered data which may not be strictly relevant to the science data. The trend data areorganized in directories, each dedicated to a data type, such as background files.
1.2.4 Archival calibration data
The calibration data necessary for data analysis are available in the calibration database (CALDB).The Swift instrument teams have the responsibility of providing the results of their calibrationefforts to the Science Support Center (SSC), accompanied by the proper documentation. The filesare delivered in FITS format, and follow the recommended CALDB standards. The SSC thendelivers the calibration data to the HEASARC and the other data centers in a form suitable forinclusion in the CALDB area. CALDB is populated every time new CALDB files become availableor in conjunction with the software releases, if the files impact the software.
1.2.5 GRB Summary products
A typical GRB/afterglow will be followed up in several observations, depending on the brightness ofthe afterglow in the optical through X-ray regions. In order to give a standard overview of the GRBand its afterglow evolution, summary products will be systematically generated by a processing runat the HEASARC once the afterglow has faded away. These products will include all of the datafrom the three Swift instruments which are available in the archive. These data sets will start beingpopulated into the Swift public area when software and products mature.
1.2.6 BAT, XRT, and UVOT surveys
Each of the instruments will conduct a survey in their respective energy bands. These surveys willcontain information about the serendipitous sources found in the FOV of the three instrumentswhile following GRB afterglows. While the XRT and UVOT will cover only a small fraction of thesky, the survey results for the BAT will effectively form an all-sky survey. Each instrument willproduce a source catalog and derived data products, and, depending on the instrument, these willbe either associated with individual sources and/or with the FOVs. Each survey will be conductedby combining the appropriate data for that instrument. The analysis of the BAT survey will beperformed on a number of different timescales. Data products and catalogs from the XRT, UVOTand BAT will began to populate the Swift archive after the first year of the mission. The XRTsurvey by is being conducted by ISAC, the BAT survey by the BAT team at GSFC and LANL,and the UVOT survey by the UVOT team members at MSSL.
1.3 Database tables
Database tables recording high level information on the observation are used to browse the data.There is one general table and one specific table for each of the instruments describing the specificmodes used during the observation. There is also a table dedicated to the TDRSS messages whichincludes most of the TDRSS messages content.
Guide to the Swift archive 5
1.4 Proprietary Data Rights
There are no proprietary rights for any of the data obtained by the Swift Observatory. All datawill be released to the community as soon as it has been processed by the SDC. The only exceptionto this was during the initial activation and verification phase of the spacecraft and instrumentsoperation. The verification phase lasted approximately 4.5 months starting from launch.
Chapter 2
Observation definition
2.1 Observation definition
The typical Swift observing strategy for a Gamma Ray Burst (GRB)/afterglow consists of a clusterof ‘snapshots’ (defined below) which are aimed to follow the GRB and its afterglow evolution.Soon after an event is triggered by the BAT, the Figure of Merit (FoM) algorithm, part of theobservatory software for autonomous operations, decides if it is worth requesting a slew maneuverin order to point the narrow field instruments (NFIs) on Swift (XRT and UVOT) in the direction ofthe trigger. The initial follow-up is automatically set at the spacecraft level, i.e., the FoM initiatesthe observation using a standard configuration of modes and filters for the NFIs. These types ofobservation are named Automatic Targets (ATs). Observations of GRBs can be also triggered byground commands based on observations made by other satellites. Once the trigger has occurred(based either on Swift or other satellites), a monitoring schedule is planned and uploaded fromthe ground. The monitoring of the GRB/afterglow will typically be initiated as soon as possibleafter its detection and will last until the afterglow reaches a specified minimum flux or until aspecified time interval has elapsed. It is also possible that the follow-up of a particular trigger maybe abandoned by Swift because other targets are deemed to be more interesting.
• The minimum unit of time spent on a target is called a snapshot. This is defined as the timeinterval spent observing the same position continuously. Because of observing constraints,the length of a snapshot will be shorter than a single orbit (∼ 95 minutes). The snapshotcan be interrupted either because of a new intervening trigger or because the time allocatedto it expires. Instrument configurations, such as mode and/or filter, can change during asnapshot.
• An observation is a cluster of snapshots designed to carry out a particular set of scientificgoals via a series of instrument mode configurations. Given the nature of the NFIs, this willalmost always be a sequential, but not necessarily continuous, set of snapshots of the sametarget. During the first 10 months into the mission the roll angle within an observation waskept constant. After mid September 2005 the roll angle changed by +/− 2 deg for eachsnapshot, therefore this was not longer constant within an observation. An observation willusually be interrupted by observation of other targets (for example an AT) or because of theobserving constraints of the NFIs. The length of an observation can vary. However, to allowfor quick delivery of data to the community, an observation has a duration which is limitedin time to a maximum of 2 days. An observation is archived only when all the data for thatobservation are available.
6
Guide to the Swift archive 7
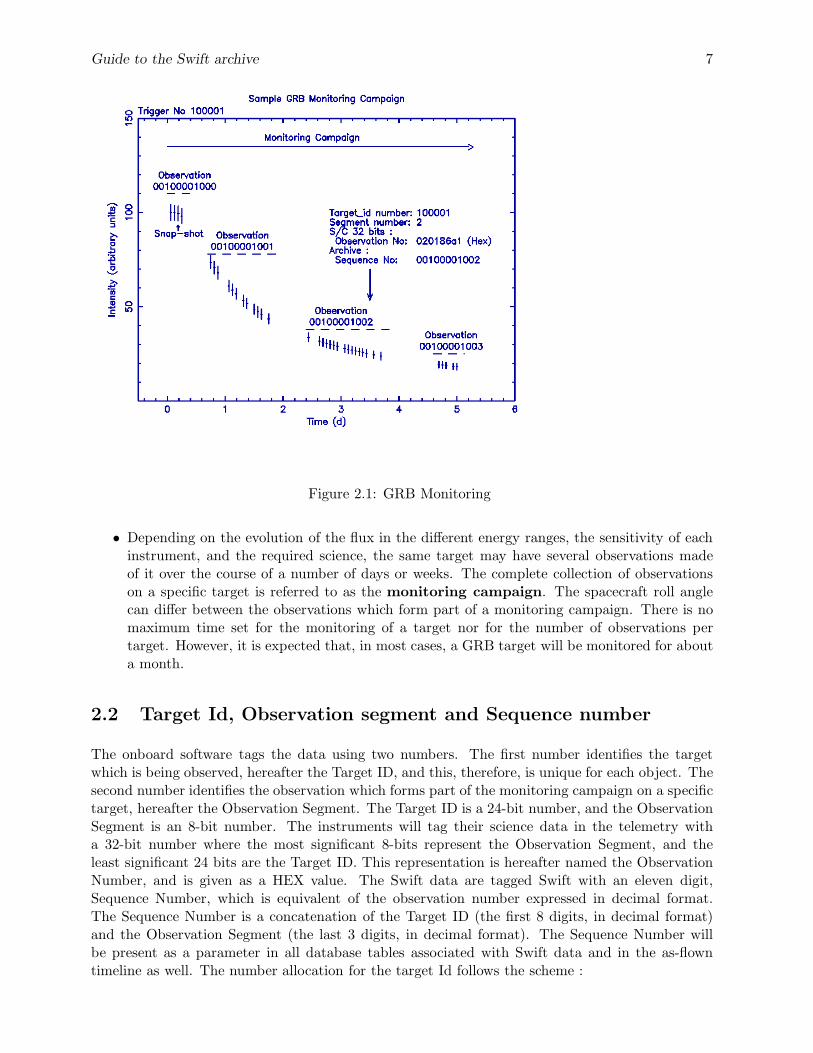
Figure 2.1: GRB Monitoring
• Depending on the evolution of the flux in the different energy ranges, the sensitivity of eachinstrument, and the required science, the same target may have several observations madeof it over the course of a number of days or weeks. The complete collection of observationson a specific target is referred to as the monitoring campaign. The spacecraft roll anglecan differ between the observations which form part of a monitoring campaign. There is nomaximum time set for the monitoring of a target nor for the number of observations pertarget. However, it is expected that, in most cases, a GRB target will be monitored for abouta month.
2.2 Target Id, Observation segment and Sequence number
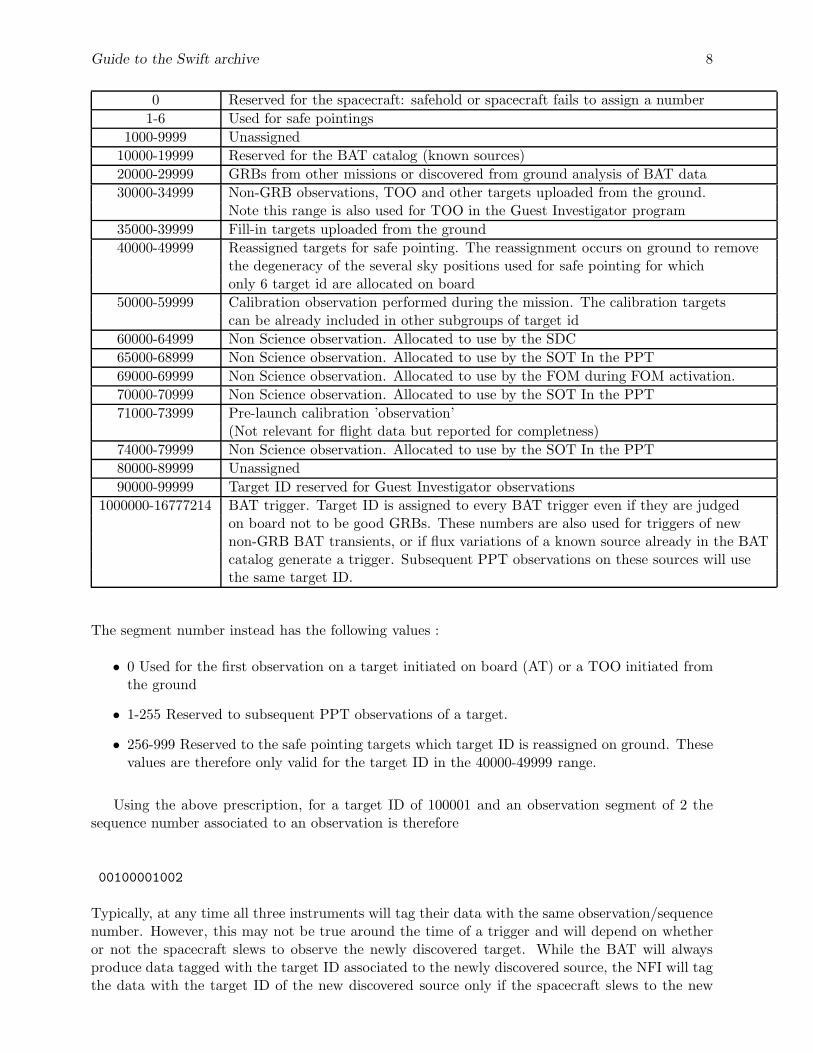
The onboard software tags the data using two numbers. The first number identifies the targetwhich is being observed, hereafter the Target ID, and this, therefore, is unique for each object. Thesecond number identifies the observation which forms part of the monitoring campaign on a specifictarget, hereafter the Observation Segment. The Target ID is a 24-bit number, and the ObservationSegment is an 8-bit number. The instruments will tag their science data in the telemetry witha 32-bit number where the most significant 8-bits represent the Observation Segment, and theleast significant 24 bits are the Target ID. This representation is hereafter named the ObservationNumber, and is given as a HEX value. The Swift data are tagged Swift with an eleven digit,Sequence Number, which is equivalent of the observation number expressed in decimal format.The Sequence Number is a concatenation of the Target ID (the first 8 digits, in decimal format)and the Observation Segment (the last 3 digits, in decimal format). The Sequence Number willbe present as a parameter in all database tables associated with Swift data and in the as-flowntimeline as well. The number allocation for the target Id follows the scheme :
Guide to the Swift archive 8
0 Reserved for the spacecraft: safehold or spacecraft fails to assign a number
1-6 Used for safe pointings
1000-9999 Unassigned
10000-19999 Reserved for the BAT catalog (known sources)
20000-29999 GRBs from other missions or discovered from ground analysis of BAT data
30000-34999 Non-GRB observations, TOO and other targets uploaded from the ground.Note this range is also used for TOO in the Guest Investigator program
35000-39999 Fill-in targets uploaded from the ground
40000-49999 Reassigned targets for safe pointing. The reassignment occurs on ground to removethe degeneracy of the several sky positions used for safe pointing for whichonly 6 target id are allocated on board
50000-59999 Calibration observation performed during the mission. The calibration targetscan be already included in other subgroups of target id
60000-64999 Non Science observation. Allocated to use by the SDC
65000-68999 Non Science observation. Allocated to use by the SOT In the PPT
69000-69999 Non Science observation. Allocated to use by the FOM during FOM activation.
70000-70999 Non Science observation. Allocated to use by the SOT In the PPT
71000-73999 Pre-launch calibration ’observation’(Not relevant for flight data but reported for completness)
74000-79999 Non Science observation. Allocated to use by the SOT In the PPT
80000-89999 Unassigned
90000-99999 Target ID reserved for Guest Investigator observations
1000000-16777214 BAT trigger. Target ID is assigned to every BAT trigger even if they are judgedon board not to be good GRBs. These numbers are also used for triggers of newnon-GRB BAT transients, or if flux variations of a known source already in the BATcatalog generate a trigger. Subsequent PPT observations on these sources will usethe same target ID.
The segment number instead has the following values :
• 0 Used for the first observation on a target initiated on board (AT) or a TOO initiated fromthe ground
• 1-255 Reserved to subsequent PPT observations of a target.
• 256-999 Reserved to the safe pointing targets which target ID is reassigned on ground. Thesevalues are therefore only valid for the target ID in the 40000-49999 range.
Using the above prescription, for a target ID of 100001 and an observation segment of 2 thesequence number associated to an observation is therefore
00100001002
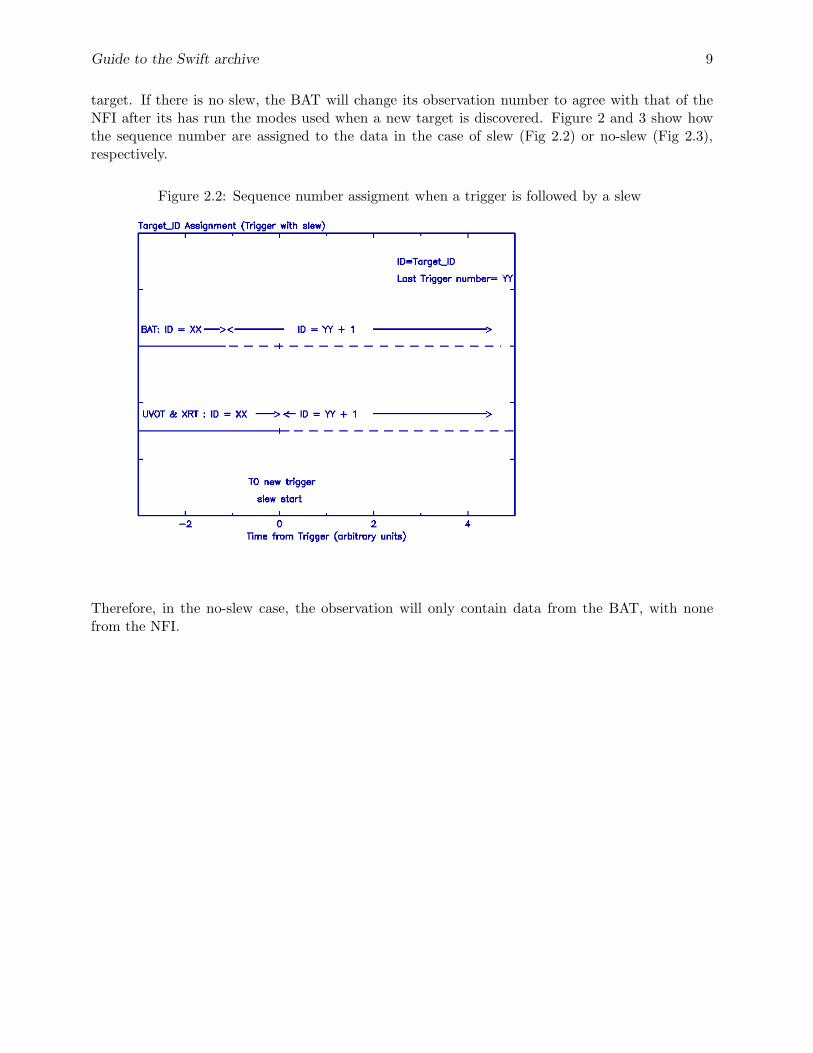
Typically, at any time all three instruments will tag their data with the same observation/sequencenumber. However, this may not be true around the time of a trigger and will depend on whetheror not the spacecraft slews to observe the newly discovered target. While the BAT will alwaysproduce data tagged with the target ID associated to the newly discovered source, the NFI will tagthe data with the target ID of the new discovered source only if the spacecraft slews to the new
Guide to the Swift archive 9
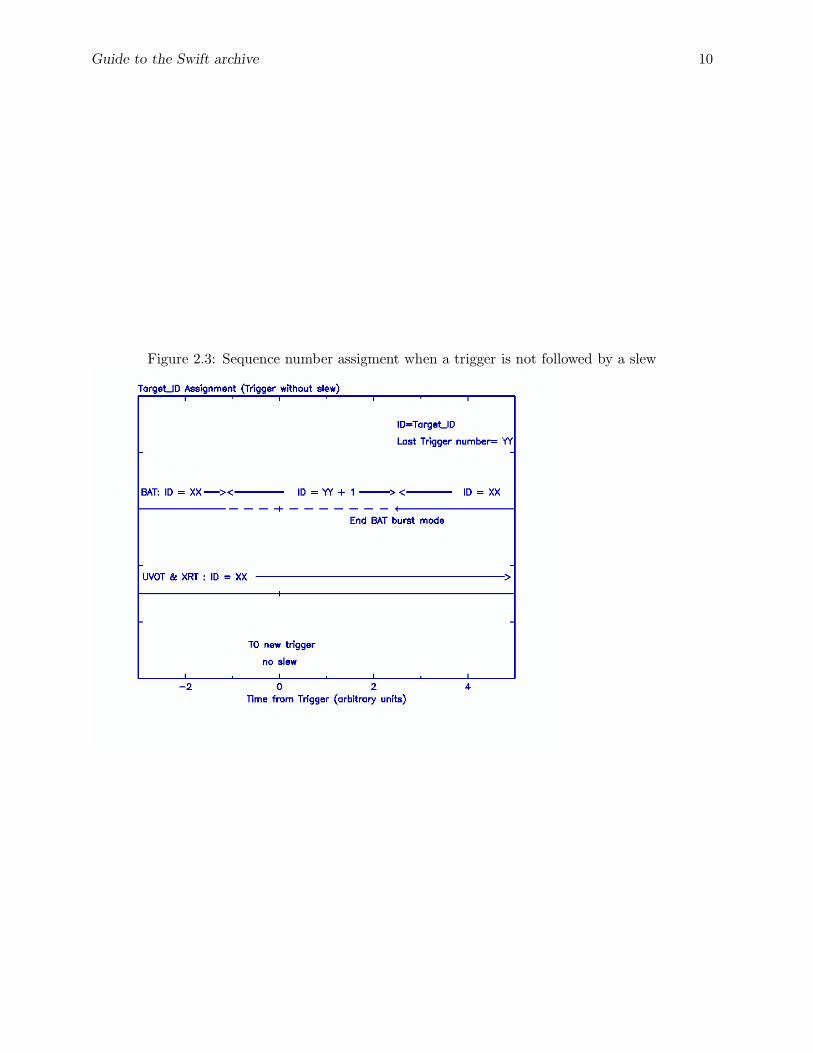
target. If there is no slew, the BAT will change its observation number to agree with that of theNFI after its has run the modes used when a new target is discovered. Figure 2 and 3 show howthe sequence number are assigned to the data in the case of slew (Fig 2.2) or no-slew (Fig 2.3),respectively.
Figure 2.2: Sequence number assigment when a trigger is followed by a slew
Therefore, in the no-slew case, the observation will only contain data from the BAT, with nonefrom the NFI.
Guide to the Swift archive 10
Figure 2.3: Sequence number assigment when a trigger is not followed by a slew
Chapter 3
Archive structure
3.1 Data organization
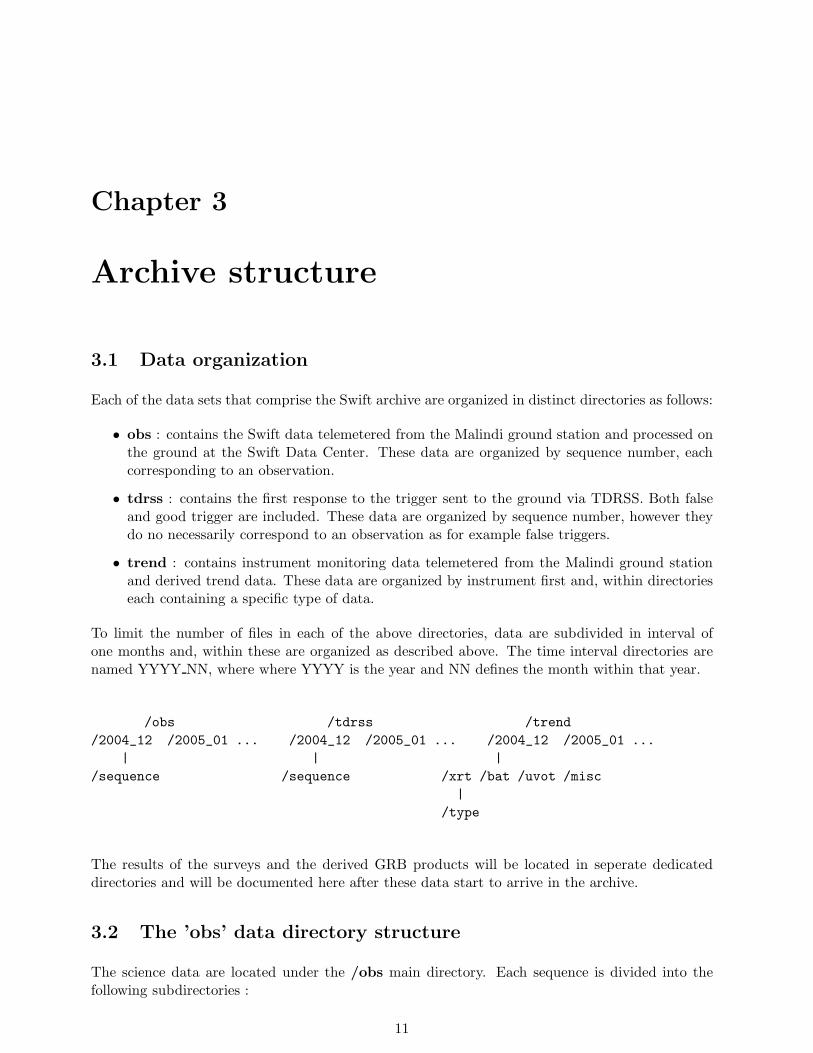
Each of the data sets that comprise the Swift archive are organized in distinct directories as follows:
• obs : contains the Swift data telemetered from the Malindi ground station and processed onthe ground at the Swift Data Center. These data are organized by sequence number, eachcorresponding to an observation.
• tdrss : contains the first response to the trigger sent to the ground via TDRSS. Both falseand good trigger are included. These data are organized by sequence number, however theydo no necessarily correspond to an observation as for example false triggers.
• trend : contains instrument monitoring data telemetered from the Malindi ground stationand derived trend data. These data are organized by instrument first and, within directorieseach containing a specific type of data.
To limit the number of files in each of the above directories, data are subdivided in interval ofone months and, within these are organized as described above. The time interval directories arenamed YYYY NN, where where YYYY is the year and NN defines the month within that year.
/obs /tdrss /trend
/2004_12 /2005_01 ... /2004_12 /2005_01 ... /2004_12 /2005_01 ...
| | |
/sequence /sequence /xrt /bat /uvot /misc
|
/type
The results of the surveys and the derived GRB products will be located in seperate dedicateddirectories and will be documented here after these data start to arrive in the archive.
3.2 The ’obs’ data directory structure
The science data are located under the /obs main directory. Each sequence is divided into thefollowing subdirectories :
11
Guide to the Swift archive 12
• /auxil : contains files common to all instruments such as attitude and orbit as well as acatalog listing all the files present in the sequence.
• /log : contains html files reporting logs on the data processing. item /bat : contains all thescience and HK files related to the BAT instrument. The data within are further sub-dividedinto directories related to the data mode and file types.
• /uvot : contains all the science and HK files related to the UVOT instrument. The datawithin are further sub-divided into directories related to the data mode and file types.
• /xrt : contains all the science and HK files related to the XRT instrument. The data withinare further sub-divided into directories related to the data mode and file types.
• /tdrss : contains the science TDRSS messages related to thedata included in the sequence.
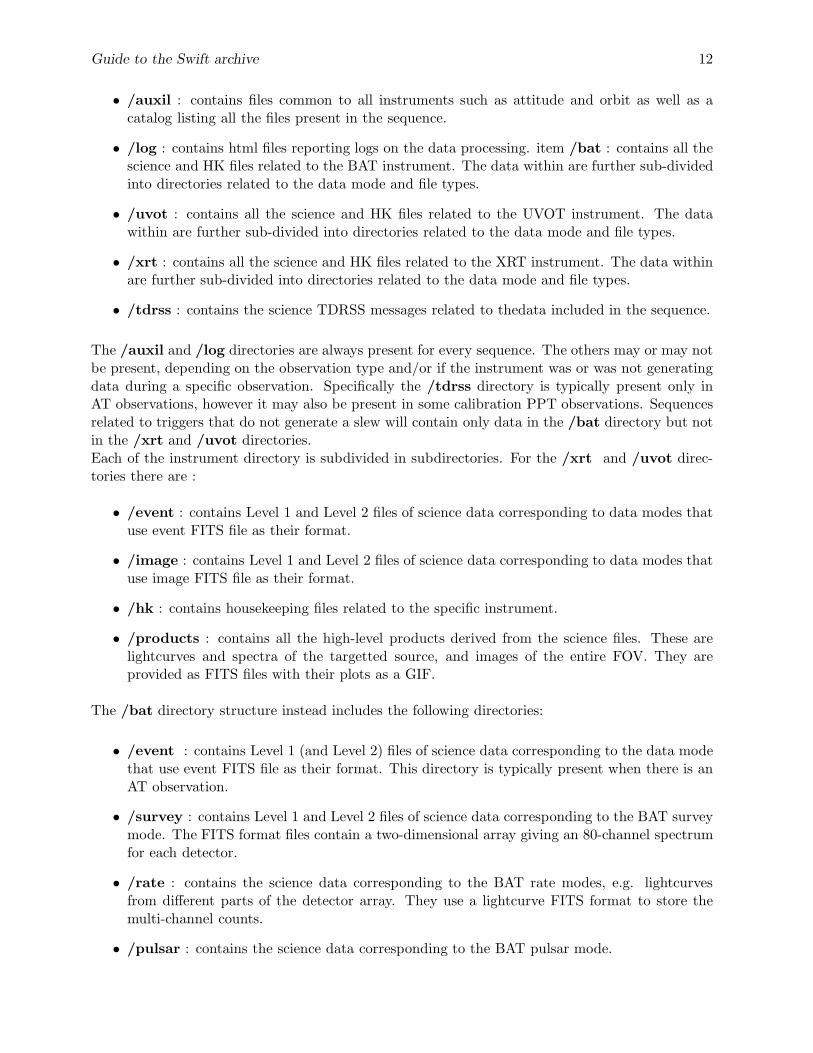
The /auxil and /log directories are always present for every sequence. The others may or may notbe present, depending on the observation type and/or if the instrument was or was not generatingdata during a specific observation. Specifically the /tdrss directory is typically present only inAT observations, however it may also be present in some calibration PPT observations. Sequencesrelated to triggers that do not generate a slew will contain only data in the /bat directory but notin the /xrt and /uvot directories.Each of the instrument directory is subdivided in subdirectories. For the /xrt and /uvot direc-tories there are :
• /event : contains Level 1 and Level 2 files of science data corresponding to data modes thatuse event FITS file as their format.
• /image : contains Level 1 and Level 2 files of science data corresponding to data modes thatuse image FITS file as their format.
• /hk : contains housekeeping files related to the specific instrument.
• /products : contains all the high-level products derived from the science files. These arelightcurves and spectra of the targetted source, and images of the entire FOV. They areprovided as FITS files with their plots as a GIF.
The /bat directory structure instead includes the following directories:
• /event : contains Level 1 (and Level 2) files of science data corresponding to the data modethat use event FITS file as their format. This directory is typically present when there is anAT observation.
• /survey : contains Level 1 and Level 2 files of science data corresponding to the BAT surveymode. The FITS format files contain a two-dimensional array giving an 80-channel spectrumfor each detector.
• /rate : contains the science data corresponding to the BAT rate modes, e.g. lightcurvesfrom different parts of the detector array. They use a lightcurve FITS format to store themulti-channel counts.
• /pulsar : contains the science data corresponding to the BAT pulsar mode.
Guide to the Swift archive 13
• /masktag : contains the science data corresponding to the BAT masktag mode. During anobservation the BAT can ’tag’ the temporal behaviour of individual sources. Typically, oneof the sources is the latest GRB observed, and the others are taken from the BAT on-boardcatalog. These data use a FITS lightcurve format to store the multi-channel counts.
• /hk : contains the housekeeping files related to the specific instrument.
• /products : contains all of the high-level products derived from the science files. These arethe lightcurves, and spectra of the main source, and the images of the entire FOV. They areprovided in FITS format and with their plots as GIF files.
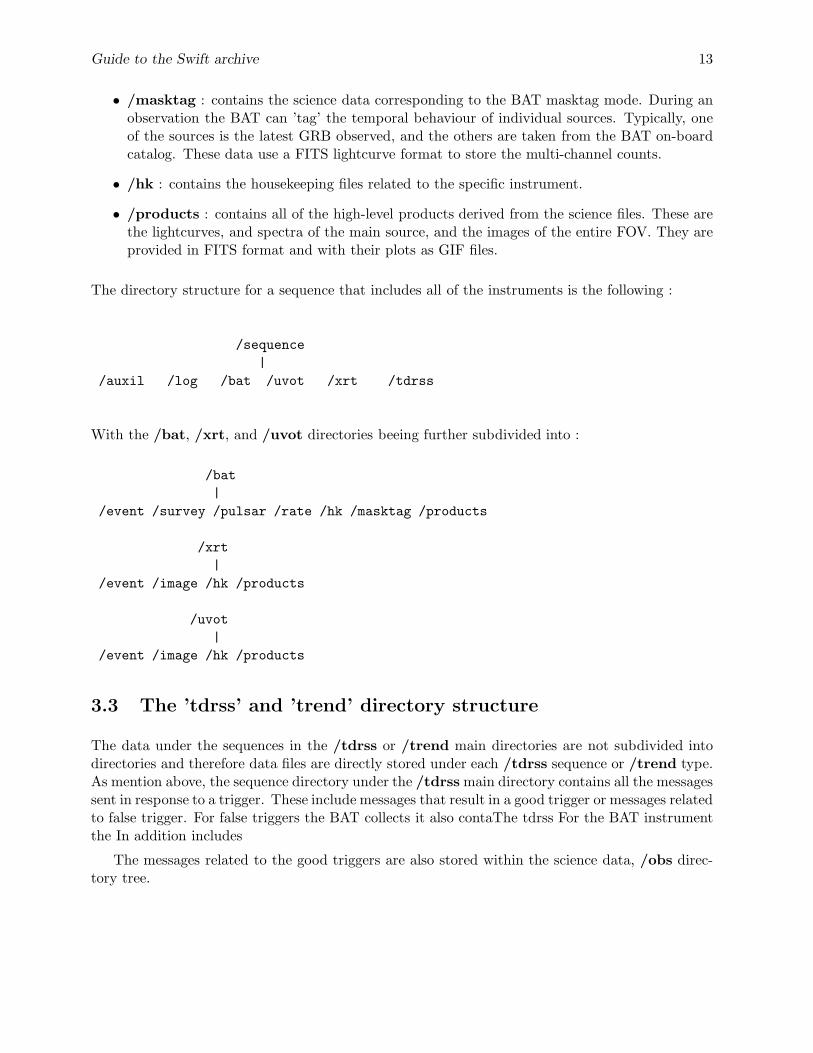
The directory structure for a sequence that includes all of the instruments is the following :
/sequence
|
/auxil /log /bat /uvot /xrt /tdrss
With the /bat, /xrt, and /uvot directories beeing further subdivided into :
/bat
|
/event /survey /pulsar /rate /hk /masktag /products
/xrt
|
/event /image /hk /products
/uvot
|
/event /image /hk /products
3.3 The ’tdrss’ and ’trend’ directory structure
The data under the sequences in the /tdrss or /trend main directories are not subdivided intodirectories and therefore data files are directly stored under each /tdrss sequence or /trend type.As mention above, the sequence directory under the /tdrss main directory contains all the messagessent in response to a trigger. These include messages that result in a good trigger or messages relatedto false trigger. For false triggers the BAT collects it also contaThe tdrss For the BAT instrumentthe In addition includes
The messages related to the good triggers are also stored within the science data, /obs direc-tory tree.
Chapter 4
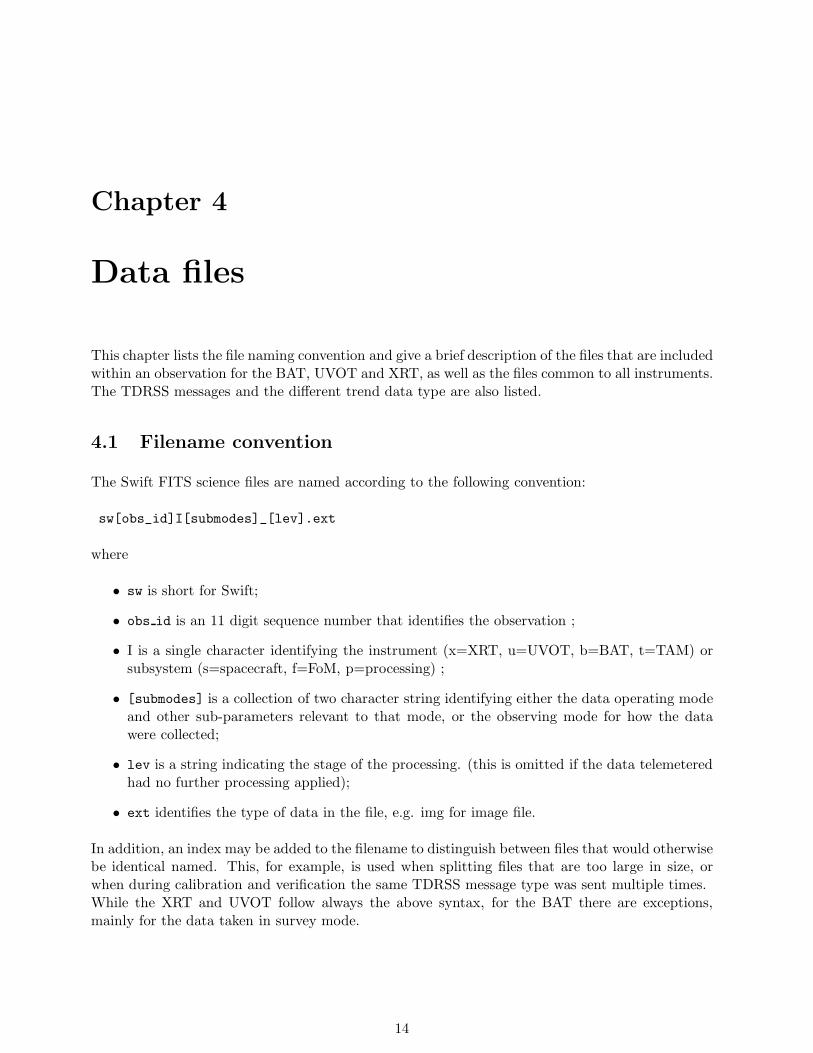
Data files
This chapter lists the file naming convention and give a brief description of the files that are includedwithin an observation for the BAT, UVOT and XRT, as well as the files common to all instruments.The TDRSS messages and the different trend data type are also listed.
4.1 Filename convention
The Swift FITS science files are named according to the following convention:
sw[obs_id]I[submodes]_[lev].ext
where
• sw is short for Swift;
• obs id is an 11 digit sequence number that identifies the observation ;
• I is a single character identifying the instrument (x=XRT, u=UVOT, b=BAT, t=TAM) orsubsystem (s=spacecraft, f=FoM, p=processing) ;
• [submodes] is a collection of two character string identifying either the data operating modeand other sub-parameters relevant to that mode, or the observing mode for how the datawere collected;
• lev is a string indicating the stage of the processing. (this is omitted if the data telemeteredhad no further processing applied);
• ext identifies the type of data in the file, e.g. img for image file.
In addition, an index may be added to the filename to distinguish between files that would otherwisebe identical named. This, for example, is used when splitting files that are too large in size, orwhen during calibration and verification the same TDRSS message type was sent multiple times.While the XRT and UVOT follow always the above syntax, for the BAT there are exceptions,mainly for the data taken in survey mode.
14
Guide to the Swift archive 15
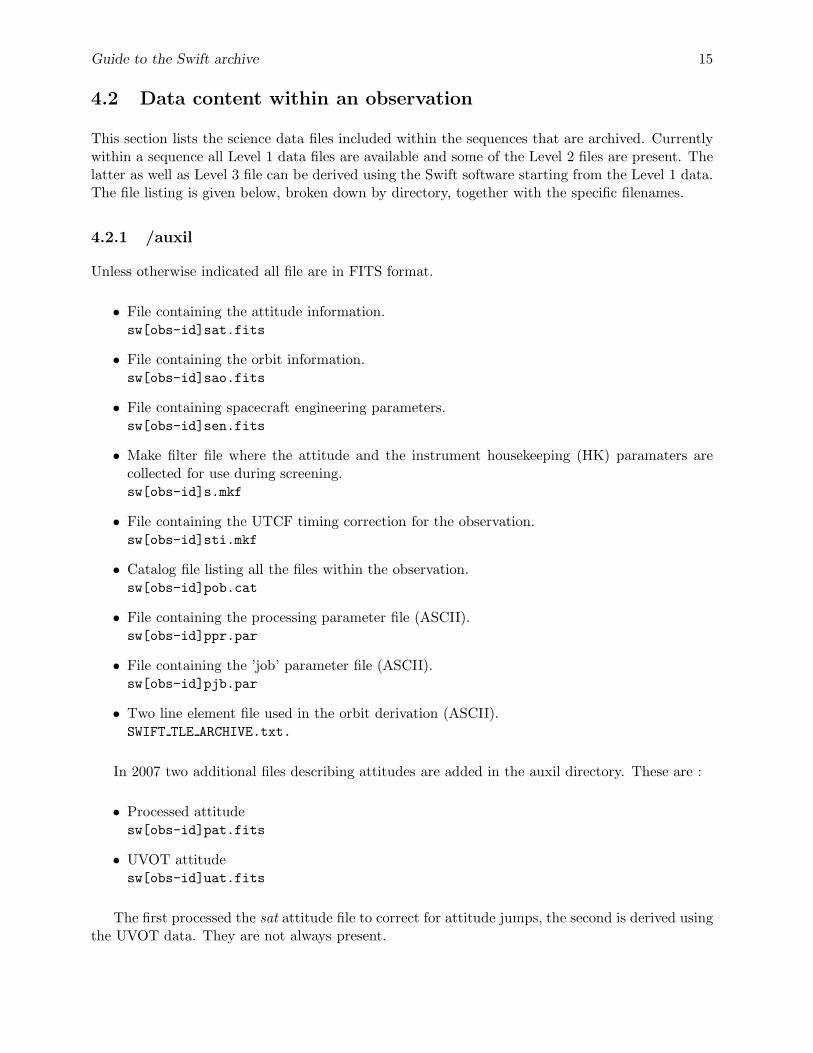
4.2 Data content within an observation
This section lists the science data files included within the sequences that are archived. Currentlywithin a sequence all Level 1 data files are available and some of the Level 2 files are present. Thelatter as well as Level 3 file can be derived using the Swift software starting from the Level 1 data.The file listing is given below, broken down by directory, together with the specific filenames.
4.2.1 /auxil
Unless otherwise indicated all file are in FITS format.
• File containing the attitude information.sw[obs-id]sat.fits
• File containing the orbit information.sw[obs-id]sao.fits
• File containing spacecraft engineering parameters.sw[obs-id]sen.fits
• Make filter file where the attitude and the instrument housekeeping (HK) paramaters arecollected for use during screening.sw[obs-id]s.mkf
• File containing the UTCF timing correction for the observation.sw[obs-id]sti.mkf
• Catalog file listing all the files within the observation.sw[obs-id]pob.cat
• File containing the processing parameter file (ASCII).sw[obs-id]ppr.par
• File containing the ’job’ parameter file (ASCII).sw[obs-id]pjb.par
• Two line element file used in the orbit derivation (ASCII).SWIFT TLE ARCHIVE.txt.
In 2007 two additional files describing attitudes are added in the auxil directory. These are :
• Processed attitudesw[obs-id]pat.fits
• UVOT attitudesw[obs-id]uat.fits
The first processed the sat attitude file to correct for attitude jumps, the second is derived usingthe UVOT data. They are not always present.
Guide to the Swift archive 16
4.2.2 /log
The files in this directory are all in HTML format.
• File containing a summary of the availble information.sw[obs-id]psu.html
• File containing the list of files created during processing.sw[obs-id]pfi.html
• File containing the instrument (BAT) exposure report.sw[obs-id]bir.html
• File containing the instrument (UVOT) exposure report.sw[obs-id]uir.html
• File containing the instrument (XRT) exposure report.sw[obs-id]xir.html
• File containing the log of the processing.sw[obs-id]pjl.html
• File containing an index of the major steps during the processing.sw[obs-id]pin.html
• File containing the errors that occur during the processing.sw[obs-id]per.html
4.2.3 /bat
The BAT data are divided into five subdirectories, each containing the following files:
/event
• An event file containing the data obtained in Event mode. This mode is used when a burstis detected. The file contains data taken just before the burst occurs, the interval when thesatellite slews to the new position and after the slew. The time interval typically includesdata for 10 minutes (Level 1).The file is named sw[obs id]bXXYYZZ uf.evt, where XX is the mode set to ’ev’ for event,YY is set to ’sh’ to stand for short events, ZZ is set to ’sp’ to indicate that the file containsdata from both Slew and Pointing and ’uf’ indicates that the data are unfiltered.
Starting in 2007 the BAT uses the event mode more regularly also during the slews. Theending of the event mode not always end at the end of the slew boundary and some eventdata during the pointing are taken in event mode. The slew and pointing event mode datataken during normal observation, e.g. not trigger by a burst, are kept in separate files onefor the slew and one for the pointing The filename is as above sw[obs id]bXXYYZZ uf.evt
where the suffix ZZ is set to ’sl’ for slew and ’po’ for poiting. .
Guide to the Swift archive 17
• A file containing additional information derived from a ray-trancing program necessary to begenerate respense file. This is present when the event data are generated because a burs hasbeen detected. The file is named sw[obs id]bXXYY.fits, where XX is the mode set to ’ev’for event, and YY is set to ’rt’ for ray-tracing.
/rate
• A lightcurve file containing the 1 second data from the entire array in 4 energy bands.sw[obs id]bXXYY.lc , where XX is the data mode set to ’rt’ for rate and YY is ’1s’.
• A lightcurve file containing the 64ms data from the entire array in 4 energy bands.sw[obs id]bXXYY.lc , where XX is the data mode set to ’rt’ for rate and YY is ’ms’.
• A lightcurve containing the 1.6 second data per quadrant (4 in total) in 4 energy bands.sw[obs id]bXXYY.lc , where XX is the data mode set to ’rt’ for rate and YY is ’qd’.
• A lightcurve histogram which records the maximum count rate per quadrant in 4 energybands for various integration times (4ms, 8ms, 16ms, 32ms, 64ms). All data are stored in onefile with 5 extensions, one for each of the integration times.sw[obs id]bXXYY.lc , where XX is the data mode set to ’rt’ for rate and YY is ’mc’
/masktag
• N lightcurves from the mask-tagged rate data mode obtained for sources that were simulta-neously monitored (typically 3) within the large BAT FOV. The integration time is 1.6 sec(Level 1).sw[obs id]bXX[target id] rw.lc , where XX is the data mode set to ’mt’ for mask taggedand [target id] is an 8 digit number identifing the target ID associated with the object thathas been monitored (Level 1).
• N lightcurves from the mask-tagged rate data mode processed (Level 2). There should beone Level 2 lightcurve for any Level 1 file.sw[obs id]bXX[target id].lc , where XX is the data mode set to ’mt’ for mask taggedand [target id] is an 8 digit number identifing the target ID associated with the object thathas been monitored.
NOTE: In some sequence there are a number of Level 1 superior of the Level 2. These excessof Level 1 lightcurves are to be considered not valid their content is already included in differentfiles and they will be removed in subsequent data re-processing. .
/survey
• M survey files, one for each combination of gain and offset calculated on-board during anobservation. This type of file is also known as a Detector Plane Histogram (DPH, Level 1).sw[obs id]bXXYYoxxxxgzzz.dph, where XX is the data mode set to ’sv’ for survey mode,YY indicates if the survey data are from after a burst (’ab’) or pre-burst (’pb’), oxxxx andgzzzz are the offset and gain respectively.
Guide to the Swift archive 18
/pulsar
• One file per observation for a given source containing 80-channel spectra folded on-board in32 bins.sw[obs id]bXX[target id].fits , where XX is the data mode set to ’pl’ for pulsar modeand [target id] is an 8 digit number identifing the target ID associated with the object forwhich the folded spectra were calculated.
NOTE: Pulsar mode is not always running. From July 2006 in fact it seems beeing turned off.
/hk
• Housekeeping data containing the header information written in the Large Data Productstelemetry format.sw[obs id]bXX.hk , where XX is set to ’hd’ to indicate the telemetry header.
• Housekeeping data containing the engineering parameters.sw[obs id]bXX.hk , where XX is set to ’en’ to indicate engineering.
• Housekeeping data containing information of the detector array panel.sw[obs id]bXX.hk , where XX is set to ’dp’ to indicate the detector panel.
• Housekeeping data containing the timestamps of the event packets.sw[obs id]bXXYYZZ.hk , where XX is set to ’ev’ to indicate the mode, YY is set to ’ts’ toindicate time stamps, and ZZ is set to ’sp’ to indicate that the file contains data from bothSlew and Pointing.
• Housekeeping data containing additional telemetry information present in the event data.sw[obs id]bXXYYZZ.hk , where XX is set to ’ev’ to indicate the mode, YY is set to ’tl’ toindicate general telemetry, and ZZ is set to ’sp’ to indicate that the file contains data fromboth Slew and Pointing.
• Calibration file containing the gain and offset for the observation.sw[obs id]bXXYY.hk, where XX is set to ’go’ for gain and offset and YY is set to ’cb’ forcalibration.
• Calibration file containing the detector enabled during an observation.sw[obs id]bXXYY.hk, where XX is set to ’de’ for detector enable and YY to ’cb’ for calibra-tion.
• Calibration file containing the detector quality flagssw[obs id]bXXYY.hk, where XX is set to ’dq’ for detector quality flag and YY to ’cb’ forcalibration.
4.2.4 /uvot
The UVOT instrument is equipped with several filters. Data files include in their names a twocharacter string used as a mnemonic for the filter. These are :
Filter Filter
----------------------------------
V vv | White wh
Guide to the Swift archive 19
U uu | VGRISM gv
B bb | UGRISM gu
UVW1 w1 | MAGNIFIER mg
UVW2 w2 | Blocked bl
UVM2 m2 |
The UVOT data are divided into three subdirectories each containing the following files:
/event
The filename of the UVOT event files changed in June 2006. The description below includes bothnaming. With the next data re-processing the new naming convention wil be apply to al data.
• N event files, each containing data taken in Event mode for a specific filter and observingmode (Level 1).sw[obs id]uXXYY uf.evt , where XX is set to the filter mnemonic as listed in the table ofthe /uvot section, and YY indicates the observing mode. The UVOT collects data duringthe settling and pointing phases, for which YY is set to ’sd’ and ’po’, respectively. As for theBAT event file, ’uf’ indicates that the data are unfiltered.
After June 2006 the filename has been changed as :sw[obs id]uXXYYZZ uf.evt , where XX is set to the filter mnemonic as listed in the table ofthe /uvot section, YY is the hardware window used (see table below) and ZZ indicates theobserving mode. The UVOT collects data during the settling and pointing phases, for whichYY is set to ’sd’ and ’po’, respectively. As for the BAT event file, ’uf’ indicates that the dataare unfiltered.
• N event files, each containing the calibrated and screened data taken in Event mode for aspecific filter and observing mode (Level 2) (as for feb 2007 these have not been generated):sw[obs id]uXXYY cl.evt , where XX is set to the filter mnemonic as listed in the table ofthe /uvot section, and YY indicates the observing mode. The UVOT collects data during thesettling and pointing phases, for which YY is set to ’sd’ and ’po’, respectively. ’cl’ indicatesthat the data have been cleaned.
After June 2006 the filename has been changed as :sw[obs id]uXXYYZZ cl.evt , where XX is set to the filter mnemonic as listed in the table ofthe /uvot section, YY is the hardware window used (see table below) and ZZ indicates theobserving mode. The UVOT collects data during the settling and pointing phases, for whichYY is set to ’sd’ and ’po’, respectively. ’cl’ indicates that the data have been cleaned.
The uvot hardware window sizes are:
Size YY value
----------------------------------
0,0,128,128 | w1
30,35,60,60 | w2
41,46,38,38 | w3
Unknown | wu
Guide to the Swift archive 20
/image
• M files containing data taken in Image mode. There is one file per filter and each file cancontain one or more extensions, one for each exposure. The coordinates in the file correspondto the raw detector coordinates (Level 1).sw[obs id]uXX rw.img , where XX is set to the filter mnemonic in the table of the /uvotsection
• N files containing data taken in Image mode and Event mode transformed to sky cordinates.There is one file per filter and each file can contain one or more extensions, one for eachexposure. (Level 2).sw[obs id]uXX sk.img , where XX is set to the filter mnemonic in the table of the /uvotsection
• N files containing the exposure maps for the images included in the extension of the ’ sk’files. There is one file for filter, and each file can contain one or more extensions one for eachexposure.sw[obs id]uXX ex.img , where XX is set to the filter mnemonic in the table of the /uvotsection
NOTE : The number of raw image file corresponds to the number of filters M used in Imagemode only. If the same filter is used in Image and Event mode, the raw image file contains onlythe exposure taken in Image mode however the sky image contains both data taken in image andin event mode. The number N of sky and exposure files include data taken with filter in image orevent mode (N ¿ M).
/hk
• Housekeeping data containing the information written in the Event mode telemetry headers.sw[obs id]uXX.hk , where XX is set to ’hd’ to indicate the telemetry header.
• Housekeeping data containing the engineering parameters.sw[obs id]uXX.hk , where XX is set to ’en’ to indicate engineering.
• Housekeeping data containing information at the start of each exposure.sw[obs id]uXX.hk , where XX is set to ’es’ to indicate exposure start.
• Housekeeping data containing a report on the exposure.sw[obs id]uXX.hk , where XX is set to ’er’ to indicate exposure report.
• Housekeeping data containing a catalog of all exposure within the observation.sw[obs id]uXX.hk , where XX is set to ’ct’ for catalog.
• Aspect correction done on ground within the observation. Not always presentsw[obs id]uXX.hk , where XX is set to ’ac’ for catalog.
• Aspect correction done on board (aspect following). Not always presentsw[obs id]uXX.hk , where XX is set to ’af’ for catalog.
Guide to the Swift archive 21
4.2.5 /xrt
Data from the XRT instrument are collected on-board via different read-out modes. Data filesinclude in their names a two character string as the mnemonic for the modes. These are :
Modes
----------------------------------
Image im
Piled-up Photodiode pu
Low-rate Photodiode lr
Windowed Timing wt
Photon Counting pc
----------------------------------
The XRT data are divided into three subdirectories, each containing the following files:
/event
• N event files, each containing data taken with a specific read-out mode and observing modecombination (Level 1).sw[obs id]uXXYYZZ uf.evt , where XX is set to the read-out modes mnemonic as listed inthe table of the /xrt section, YY indicates a submode of the read-out mode and ZZ theobserving mode. In Photodiode (Low-rate and Piled-up), YY indicates whether or not thebias has been subtracted on-board, being set to ’b1’ if the bias has been subtracted on-board,otherwise being set to ’b0’. In Photon Counting and Windowed Timing modes, YY insteadgives the mnemonic for the fraction of the FOV exposed, according to the following table:
ww Windowed Timing Photon counting
---------------------------------------
w1 100 columns 490x490 pixel
w2 200 columns 500x500 pixel
w3 300 columns 600x600 pixel
w4 400 columns 480X480 pixel
The XRT collects data during the slew, settling and pointing phases, for which ZZ is set to’sl’, ’sd’, and ’po’, respectively. As for the BAT and UVOT, ’uf’ indicates that the data areunfiltered.
• K event files, each containing the reconstructed events for Windowed Timing and Photodiodemodes (Level 1a)sw[obs id]uXXYYZZ ufre.evt, where the submode specifications XX, YY and ZZ are iden-tical to those for the unfiltered files, but with the level specification set to ’ufre’ for unfilteredreconstructed. Processing is required to obtain the Level 2 (cleaned events)
• N event files, each containing data taken with a specific read-out mode and observing modecombination (Level 2).sw[obs id]uXXYYZZ cl.evt , where XX, YY and ZZ has the same meaning as above, and’cl’ indicates that the data have been cleaned.
Guide to the Swift archive 22
/image
• File containing data taken in Image mode containing one or more extensions one for eachexposure (Level 1).sw[obs id]xXX rw.img , where XX is set to ’im’ to indicate image mode. In order to obtaina Level 2 data file user processing is required.
/hk
• Housekeeping data containing the information written in the telemetry header of the eventpackets.sw[obs id]xXX.hk , where XX is set to ’hd’ to indicate the telemetry header of the eventpackets.
• Housekeeping data containing the information written in the telemetry trailes of the LargeData Products format event mode files.sw[obs id]xXX.hk , where XX is set to ’tr’ to indicate trailers.
• Housekeeping data containing the engineering parameters.sw[obs id]xXX.hk , where XX is set to ’en’ to indicate engineering.
• Bias map for the Photon Counting data.sw[obs id]xXX rw.img , where XX is set to ’bf’ to indicate bias frame.
4.3 TDRSS data
The TDRSS data consist of a number of files, corresponding to messages that are sent to the groundas soon as an on-board trigger occurs. Each instrument generates specific messages, the number ofwhich depends on whether or not a position has been obtained. The filenaming convention for theTDRSS messages is the following
sw[obs_id]msI[submodes].ext
where
• sw is short for Swift;
• obs id is an 11-digit sequence number that identifies the observation ;
• I is a single character identifying the instrument (x=XRT, u=UVOT, b=BAT) or subsystem(s=spacecraft, f=FoM, p=processing) ;
• [submodes] is a collection of two character string identifying the data.
• ext identifies the type of data in the file, e.g. img for an image file.
The TDRSS files and their names are :
• File containing the BAT alert message.sw[obs id]msbXX.fits , where XX is set to ’al’ to indicate alert.
Guide to the Swift archive 23
• File containing the BAT position.sw[obs id]msbXX.fits , where XX is set to ’ce’ to indicate centroid.
• File containing the message that a Position was not found on-board by the BAT.sw[obs id]msbXX.fits , where XX is set to ’no’ to indicate that no position was found.
• File containing the BAT lightcurve.sw[obs id]msb.lc
• File containing the BAT attitude.sw[obs id]msbat.hk
• File containing the BAT timestamp.sw[obs id]msbevtssp.hk
• File containing the BAT telemetered events.sw[obs id]msbevtlsp.hk
• File containing the BAT events.sw[obs id]msbevshsp uf.evt
• File containing the XRT centroid message.sw[obs id]msxXX.fits , where XX is set to ’ce’ to indicate centroid.
• File containing the message that a position was not found on-board by the XRT.sw[obs id]msxXX.fits , where XX is set to ’no’ to indicate that no position was found.
• File containing the raw XRT postage stamp image centered on the GRB sent on ground onlyif a position was successfully calculated.sw[obs id]msxXX rw.img , where XX is set to ’ps’ to indicate postage stamp.
• File containing the sky XRT postage stamp image centered on the GRB sent on ground onlyif a position was successfully calculated.sw[obs id]msxXX sk.img , where XX is set to ’ps’ to indicate postage stamp.
• File containing the XRT lightcurve.sw[obs id]msx.lc
• File containing the raw XRT images full size from which the postage stamp is derivedsw[obs id]msxXX rw.img , where XX is set to ’im’ to indicate the XRT data mode
• File containing the sky XRT images full size from which the postage stamp is derivedsw[obs id]msxXX sk.img , where XX is set to ’im’ to indicate postage stamp.
• File containing the XRT spectrum, up to two spectra can be calculated on board.sw[obs id]msxXX rw.pha, where XX is set to ’lr’ or ’wt’ to indicate the XRT data mode.The spectra may need some ground processing.
• File containing the unfiltered event data recorded in PC mode taken soon after the burst.These data are a subset of the full dataset and it is used to derive the position if unsuccefullwith the imagessw[obs id]msxXX uf.evt , where XX is set to ’pc’ to indicate the XRT data mode.
• File containing the cleaned event data recorded in PC mode taken soon after the burst. Thesedata are a subset of the full dataset and it is used to derive the position if unsuccefull withthe imagessw[obs id]msxXX cl.evt , where XX is set to ’pc’ to indicate the XRT data mode.
Guide to the Swift archive 24
• File containing the UVOT finding chart.sw[obs id]msuXX.img, where XX is set to ’fc’ for finding chart.
• File containing the ’dark burst’ UVOT image centered on the XRT position.sw[obs id]msuXX rw.img, where ’ni’ is the identifier and ’rw’ indicate that is raw coordinates.
• File containing the listing of the files included in the directory.sw[obs id]mspob.cat
4.4 Trend data
For each of the instruments, the trend and monitoring data files are organized by type. The mainpurpose of these data is to monitor various aspects of the instrument during the mission. Thesedata are listed in the following tables by instrument, together with their filenames and the directorynames where they are located. These data arrive on a daily basis in the archive. In most cases, afile contains data for an entire observation, therefore these files are updated on a daily basis untilall the data for the observation has arrived.
Guide to the Swift archive 25
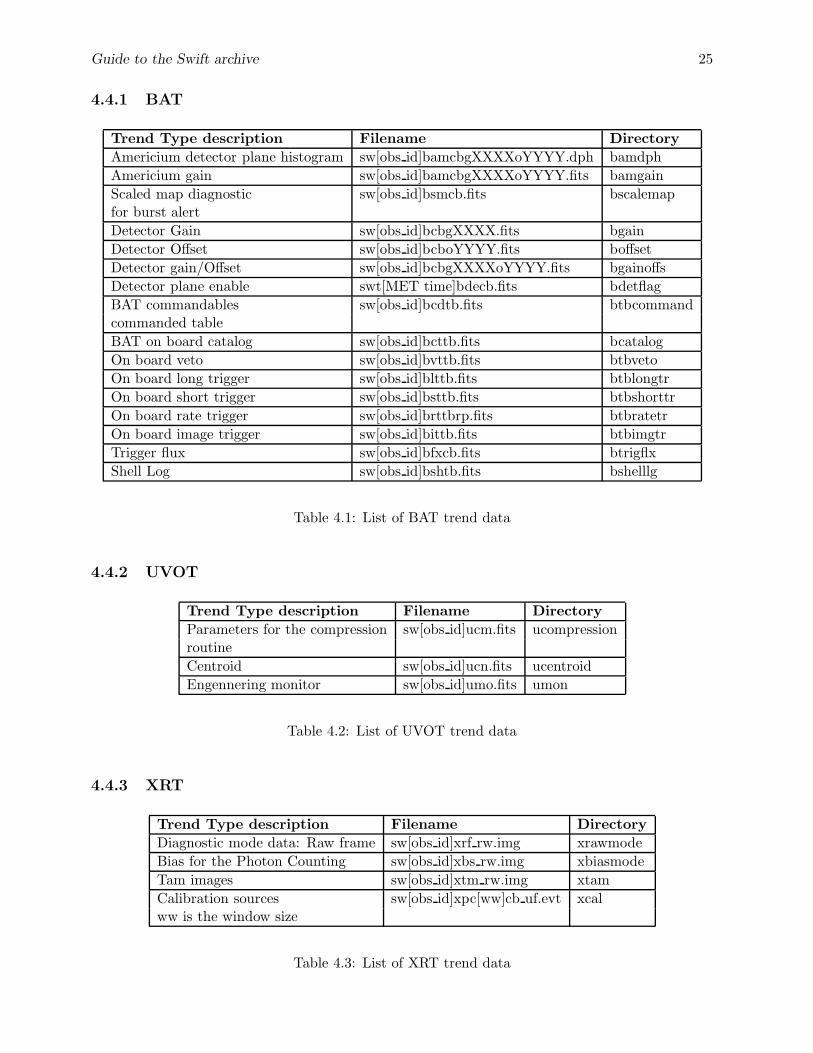
4.4.1 BAT
Trend Type description Filename Directory
Americium detector plane histogram sw[obs id]bamcbgXXXXoYYYY.dph bamdph
Americium gain sw[obs id]bamcbgXXXXoYYYY.fits bamgain
Scaled map diagnostic sw[obs id]bsmcb.fits bscalemapfor burst alert
Detector Gain sw[obs id]bcbgXXXX.fits bgain
Detector Offset sw[obs id]bcboYYYY.fits boffset
Detector gain/Offset sw[obs id]bcbgXXXXoYYYY.fits bgainoffs
Detector plane enable swt[MET time]bdecb.fits bdetflag
BAT commandables sw[obs id]bcdtb.fits btbcommandcommanded table
BAT on board catalog sw[obs id]bcttb.fits bcatalog
On board veto sw[obs id]bvttb.fits btbveto
On board long trigger sw[obs id]blttb.fits btblongtr
On board short trigger sw[obs id]bsttb.fits btbshorttr
On board rate trigger sw[obs id]brttbrp.fits btbratetr
On board image trigger sw[obs id]bittb.fits btbimgtr
Trigger flux sw[obs id]bfxcb.fits btrigflx
Shell Log sw[obs id]bshtb.fits bshelllg
Table 4.1: List of BAT trend data
4.4.2 UVOT
Trend Type description Filename Directory
Parameters for the compression sw[obs id]ucm.fits ucompressionroutine
Centroid sw[obs id]ucn.fits ucentroid
Engennering monitor sw[obs id]umo.fits umon
Table 4.2: List of UVOT trend data
4.4.3 XRT
Trend Type description Filename Directory
Diagnostic mode data: Raw frame sw[obs id]xrf rw.img xrawmode
Bias for the Photon Counting sw[obs id]xbs rw.img xbiasmode
Tam images sw[obs id]xtm rw.img xtam
Calibration sources sw[obs id]xpc[ww]cb uf.evt xcalww is the window size
Table 4.3: List of XRT trend data
Guide to the Swift archive 26
4.4.4 Others
In addition to the instrumental trend data, there are four other types of files with general trenddata. These are :
• Clock offset table (ASCII). These files contain the measurements on-board of the clock offsetcompared with UTC. These files are not part of the data processing, but they are generated atthe Mission Operation Center. The table is updated on a daily basis and the latest file alwayscontains all the previous measurements. These files are located in the /clocklog directory.
• As Flown Timeline (ASCII). These files contain the timeline of what has observed. They arenot part of the data processing but are generated at the Mission Operation Center. Each filecontains a one day timeline and arrives at the archive one week later. These files are locatedin the /asflown directory.
• TDRSS diagnostic (FITS). In addition to the science TDRSS messages, there are messagesthat are used for diagnostics. All diagnostic messages within an observation are included inone file. As for the instrument trend files, they are updated daily until the observation iscomplete. These files are located in the /tdrssdiagnostic directory.
• Make filter file (FITS). This file is included within each observation directory but it is alsoincluded in the trend area so as to facilitate the instrument team’s global studies of someparameters included in the mkf file. Each file corresponds to an observation. As for the otherinstrumental trend data, these files will change daily until an observation is completed. Thesefiles are located in the /mkfilter directory.