Embed Size (px)
Citation preview

Guide to the Markets
Our goal is to provide a clear perspective on the global financial markets, as well as a logical framework to discuss them, thereby enabling investors to recognize both the opportunities and risks that exist in today's investment environment.
------------------------------------
The Guide to the Markets-Asia, as part of the Market Insights program, is not j id h A i k I d i ff l b l i f A ijust a guide to the Asian markets. Instead, it offers a global perspective for Asian investors.
It provides the framework for timely market updates---also be available in 6 different languages including English, Traditional Chinese Hong Kong, Traditional Chinese Taiwan, Simplified Chinese, Japanese, and Korean.
The Guide is delivered the first week of each quarterThe Guide is delivered the first week of each quarter.
We purposely do not put commentaries in the Guide because we believe the numbers allow us to tell a story in an unbiased way.
------------------------------------
Download the Guide to the Markets here: http://www.jpmorganam.com.hk/guide
1

2

Looking back to Q1, it was DM that performed well due to the US and Japan.
EM, both in terms of equities and debt, has gone through a rather disappointing quarter. It is also worth noting that despite the intensifying discussion of the Fed raising interest rates and the media talking about the great rotation, the performance amongst different fixed income categories varied. High yield had another strong quarter but EM debt and US Agg suffered.
3
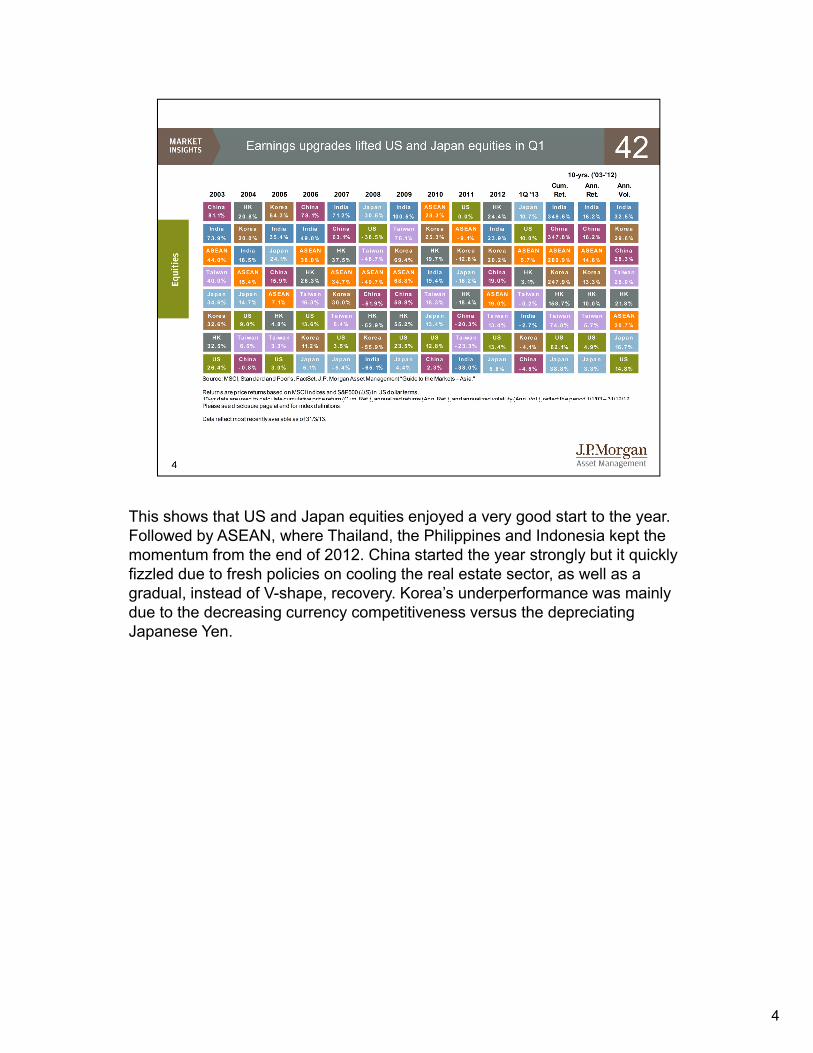
This shows that US and Japan equities enjoyed a very good start to the year. Followed by ASEAN, where Thailand, the Philippines and Indonesia kept the momentum from the end of 2012. China started the year strongly but it quickly fizzled due to fresh policies on cooling the real estate sector, as well as a gradual, instead of V-shape, recovery. Korea’s underperformance was mainly due to the decreasing currency competitiveness versus the depreciating Japanese Yen.
4

These charts help to explain the strong performance in the US and Japan equities. Upward revision for Japanese corporate earnings is partly due to a weaker Japanese yen. Both markets have enjoyed upgrades by analysts which have yet to happen for Asia ex-Japan or EM as a whole. Meanwhile, net margin for EM and Asia ex-Japan actually dipped, while the US and Japan have enjoyed a pick up.
5

Now looking ahead. We mentioned in the first quarter that global growth recovery is likely to remain gradual and data so far is consistent with this view. Economic growth in emerging markets, notably China and Brazil, is already rebounding.
In addition, US outlook continues to look more optimistic than Europe despite recent worries due to the fiscal cliff and sequester. Japan’s growth outlook is improving due to the aggressive measures taken by the Abe administration and BoJ.
6

In the US, the first quarter was all about the fiscal cliff and sequester. But it is worth noting that there are some positive development happening. For example, household net worth continues to rise due to good stock market performance and a rebound in house prices. The housing market is also making gradual improvement. Meanwhile, the household debt service ratio continues to drop. This implies American families have more disposable household income and thus provide support to private consumption.
7

This has resulted in car sales returning to its long term trend growth, and f li f t bl ith di Whil tconsumers feeling more comfortable with spending. While recent consumer
spending and sentiment data have been weaker than expected due to the payroll tax hike and uncertainties from sequestration, consumption and business investment should provide some support for stable US economic growth in 2013.
88

In contrast, economic growth in Europe remains highly challenging. Government spending, especially in peripheral Europe, is still being cut. Recent events in Cyprus have undermined investor confidence in the region and renewed concerns that politics could jeopardise the region’s financial stability once more. For Asia exporters, the demand from Europe will continue to be in stall mode due to the region’s lackluster growth.
9

Japan has been the star of Q1. And now the real work starts. The Bank of Japan has stepped up its asset purchase programme and this has already led to a significant weakening of the Japanese yen and in turn boost Japan’s corporate earnings expectation. However, high government debt and banks reluctant to lend will make these revival plans more difficult to succeed. The good news is that PM Abe enjoys strong public support and he has made use of this popularity to make some important reforms, such as joining the TPP and also reforming the electricity marketreforming the electricity market.
10

China’s rebound is largely led by fixed asset investment. Infrastructure spending b d d t l i l t 2012 d th i l i l i l t trebounded strongly in late 2012 and there is also a revival in real estate
investment. Retail sales have been weak due to the anti-corruption drive by the top leaders. Manufacturing PMIs, effectively a survey of business sentiment, have been gradually improving. A smooth transition of leadership should not come as a surprise but the policy direction of the new leadership could take some time to clarify. The bottom line is that early comments from Premier Li indicates quality of growth will take precedent to the speed. This could involve reforms in the banking and SOE sector changing the underlying dynamics ofreforms in the banking and SOE sector, changing the underlying dynamics of some of these markets.
1111

For the rest of emerging markets, Global PMIs are still pointing towards better growth performance ahead, with limited inflationary pressure in the economy in the short term due to stable food and energy prices.
Also countries like India, Thailand and Korea are still keeping policy rates on hold or considering further rate cuts – these are key factors for consideration when investing in fixed income products.
1212

Overall, we still think that fixed income is a very important asset class because of the stability it provides to a portfolio. That said, a frequently asked question is what would happen if US starts to tighten its monetary policy. You can see from the “25bps” column the sensitivity of different types of bonds to a 25bps increase in US Treasury yield. Some react more than others and more importantly, the yield to maturity for high yield and local currency EM debt is sufficient to compensate for a sizeable increase in USD interest rates.
1313

In addition to interest rate risk and protection provided by coupons, it is also worth taking into account the compression of sovereign credit spread for EM debt. Due to stronger economic growth and lower government debt, many EM governments have experienced sovereign rating upgrades and this has helped to justify narrower sovereign credit spreads. This advantage has also cascaded down to the corporate sector.
1414
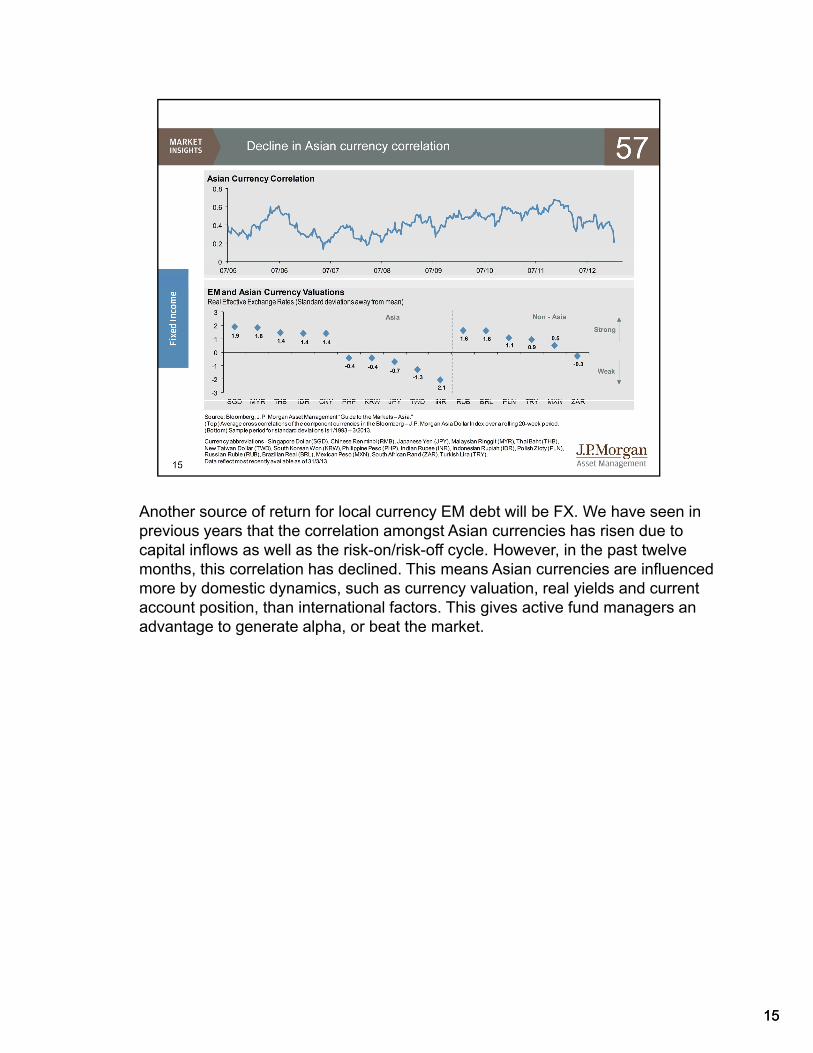
Another source of return for local currency EM debt will be FX. We have seen in i th t th l ti t A i i h i d tprevious years that the correlation amongst Asian currencies has risen due to
capital inflows as well as the risk-on/risk-off cycle. However, in the past twelve months, this correlation has declined. This means Asian currencies are influenced more by domestic dynamics, such as currency valuation, real yields and current account position, than international factors. This gives active fund managers an advantage to generate alpha, or beat the market.
1515
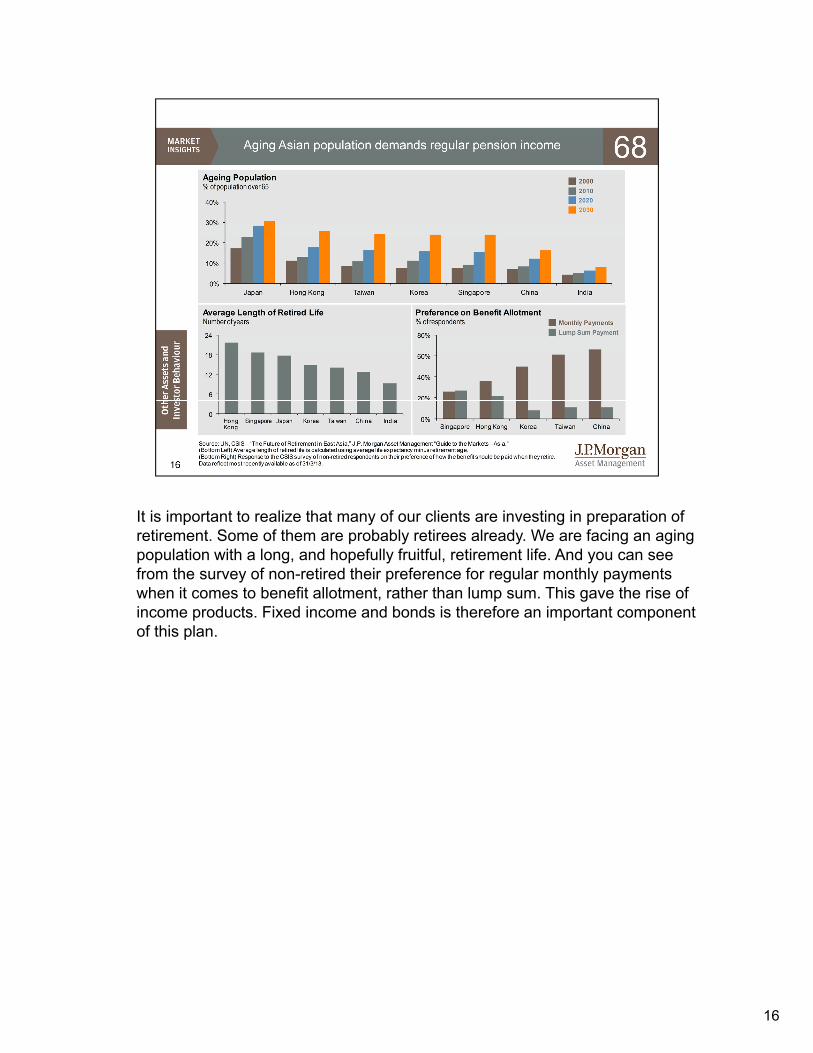
It is important to realize that many of our clients are investing in preparation of retirement. Some of them are probably retirees already. We are facing an aging population with a long, and hopefully fruitful, retirement life. And you can see from the survey of non-retired their preference for regular monthly payments when it comes to benefit allotment, rather than lump sum. This gave the rise of income products. Fixed income and bonds is therefore an important component of this plan.
16

It is worth reiterating the importance of considering the real return on cash in Asia. A low interest rate environment is likely to persist for some time while inflation is unlikely to drop significantly. Hence, the negative real deposit rates facing most Asian savers are unlikely to leave anytime soon.
17

Overall, we think there is still value to be investing in fixed income and we need t b l ti i hi h t f C h i t t hto be selective in which space to focus on. Cash, as an investment, has consistently underperformed except in extreme events, such as 2008. We still see equities as a space where investors should add. In Asia and EM, valuation has been attractive. Key catalyst for performance turnaround would be analyst upgrades on earnings outlook.
1818
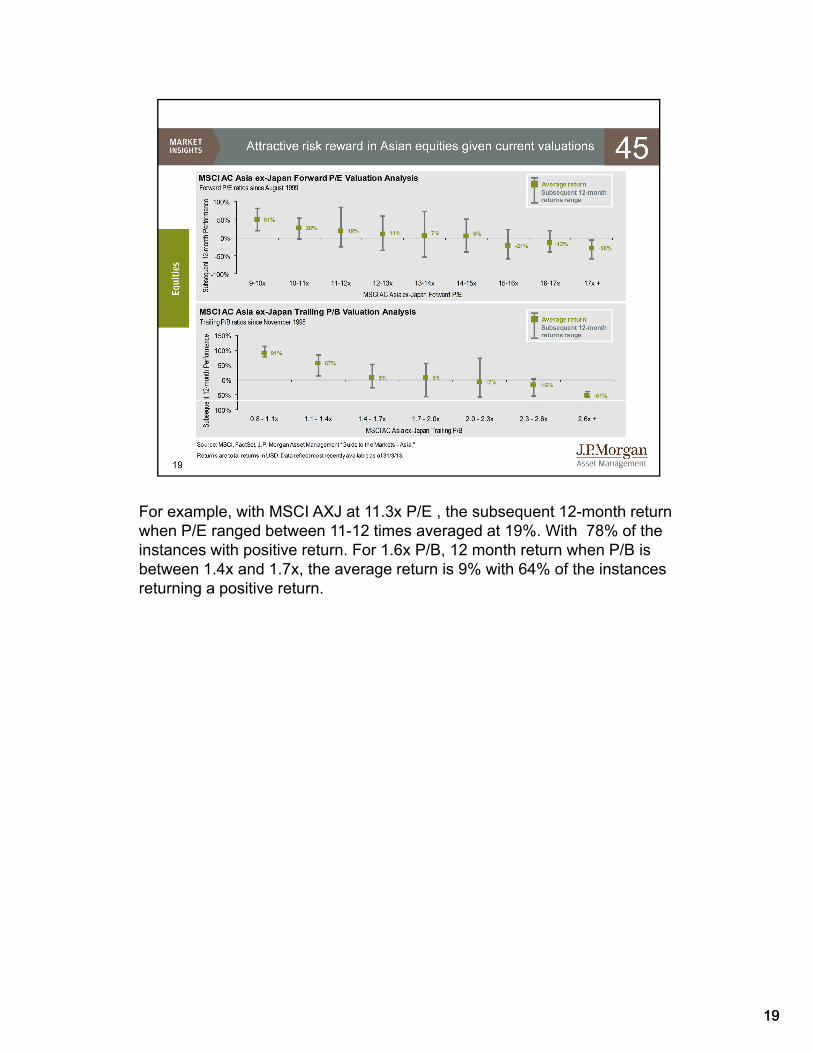
For example, with MSCI AXJ at 11.3x P/E , the subsequent 12-month return h P/E d b t 11 12 ti d t 19% With 78% f thwhen P/E ranged between 11-12 times averaged at 19%. With 78% of the
instances with positive return. For 1.6x P/B, 12 month return when P/B is between 1.4x and 1.7x, the average return is 9% with 64% of the instances returning a positive return.
1919

Similar to fixed income, many clients are concerned what would happen if the Fed raises interest rates. This chart shows the MSCI AXJ and 2yr US Treasury yield. The blue shaded areas are periods when the Fed raised interest rates. In the late 1980s, mid 90s, late 90s and mid 2000s, MSCI AXJ performed strongly ahead of rate hikes. Fundamentally, US economic strength is a positive for Asian economies, via the export link. Moreover, Asian companies have also reduced their gearing and increase liquidity, which means they are more resilient towards rising interest rates Hence we see this period of rate hike anticipation to be anrising interest rates. Hence, we see this period of rate hike anticipation to be an opportunity to enter equities.
On risks, the near term concerns are event risks, such as tension in North Korea, avian flu in China. Meanwhile, Europe debt problems will continue to be a drag on investor sentiment.
20

21

22

23

24


![Head of Middle East/ South Asia Markets ICIS · PDF fileHead of Middle East/ South Asia Markets ICIS Singapore ... Head of Middle East, South Asia Markets. ... [Pata] GAIL HDPE/LLDPE](https://img.pdfslide.us/doc/110x75/5aa1714f7f8b9a84398ba14c/head-of-middle-east-south-asia-markets-icis-of-middle-east-south-asia-markets.jpg)