Embed Size (px)
Citation preview
NATIONAL QUALIFICATIONS CURRICULUM SUPPORT
Chemistry
A Guide to Practical Work
[ADVANCED HIGHER]
David Hawley
αβχ

Acknowledgements This document is produced by Learning and Teaching Scotland as part of the National Qualifications support programme for Chemistry. Grateful thanks are due to all who responded to requests for comment, both informal and formal, on the drafts. The support of the Higher Still Development Unit and the editorial advice of Douglas Buchanan are also acknowledged. First published 2001 Electronic version 2002 © Learning and Teaching Scotland 2001 This publication may be reproduced in whole or in part for educational purposes by educational establishments in Scotland provided that no profit accrues at any stage. ISBN 1 85955 911 5
CHEMISTRY i i i
CONTENTS Preface v Section 1: Introduction 1 Section 2: Safety 3 Section 3: Significant Figures 5 Scientific notation 5 Exact and inexact numbers 6 Significant figures defined 6 Rounding off numbers 9 Significant figures in simple calculations 10 Significant figures in complex calculations 16 Section 4: Errors 21 Accuracy and precision 21 Repeatability and reproducibility 23 Random and systematic errors 23 Quantifying errors 26 Absolute uncertainties and percentage uncertainties 28 Combining uncertainties 30 Some ‘forgotten’ uncertainties 33 Section 5: Chemical Analysis 43 Qualitative and quantitative analysis 43 Volumetric analysis 43 Gravimetric analysis 60 Volumetric versus gravimetric 63 Colorimetric analysis 64 Section 6: Organic Techniques 69 Introduction 69 Preparation 69 Isolation 72 Purification 77 Identification 84 Percentage yield 87
iv CHEMISTRY
Section 7: Writing PPA Reports 91 Introduction 91 Exemplar materials 95 Section 8: Appendices 109 Appendix 1: Solutions to exercises 109 Appendix 2: Fluting a filter paper 119
CHEMISTRY v
PREFACE This publication has been written to support students with the practical work in Advanced Higher Chemistry. While specific mention is made of the Prescribed Practical Activities (PPAs), it is envisaged that the material will also be useful with particular studies in the 20 hour Investigation unit. The material is not in any way prescriptive and, as such, teachers/lecturers are at liberty to use as much or as little of it with students as they see fit. The booklet includes a brief Introduction followed by a short section on Safety and more extensive sections on Significant Figures, Errors, Chemical Analysis, Organic Techniques and Writing PPA Reports. The Introduction, Safety and Writing PPA Reports sections are written in a style of language which makes them particularly suitable for student hand-outs. With the widespread use of calculators, students tend to lose sight of significant figures, and in Section 3 significant figures are defined and the rules governing their use in calculations are carefully explained. In practical chemistry, there is a greater emphasis on evaluation than there has been in the past and this is now formally assessed in both the PPAs and the Investigation. One way of evaluating a quantitative experiment is to calculate the overall uncertainty in the final result and it is for this reason that a section on Errors has been included in the booklet. The conventional method of calculating the overall uncertainty in a result is to take the square root of the sum of the squares of the standard deviations of the measurements contributing to the result. Experience has shown that many students get lost in the mathematics of such a statistical approach and are unable to see the wood for the trees. The approach used in this booklet is deliberately simpler – the overall uncertainty in the final result is calculated by summing the individual measurement uncertainties. The latter are based on the tolerances of the equipment used to make the measurements.

iv CHEMISTRY
The PPAs where it is suggested that an uncertainty calculation might be carried out are: Unit 2 PPA 1: Complexometric Determination of Nickel using EDTA PPA 3: Determination of a Partition Coefficient Unit 3 PPA 5: Aspirin Determination Currently, the calculation of uncertainties is not obligatory but few would disagree that it should be encouraged in order to give students a better appreciation of the accuracy and/or precision of their quantitative results. In both the Significant Figures and Errors sections, numerous worked examples and exercises have been included. Solutions to the exercises are presented in Appendix 1. The main aims of the sections on Chemical Analysis and Organic Techniques are to introduce students to a wide variety of techniques, to provide them with a sound understanding of the underlying chemical principles and to develop their laboratory skills. It is envisaged that these sections will probably be treated as reference texts, to be dipped into when the need arises. The penultimate section, Writing PPA Reports, builds on the ideas outlined on the sheet Outcome 3: Advice to candidates* and the student guide accompanying each PPA. Two exemplar PPAs and reports on these have been included to give an indication of the detail expected in a student write-up.
* The Outcome 3: Advice to candidates sheet can be found in section 5 of the first NAB of each unit.

INTRODUCTION
CHEMISTRY 1
SECTION 1 Introduction Chemistry is an experimental science and, like all sciences, its theories are formulated from experimental evidence. Practical work is therefore an integral part of chemistry and one of the main aims of a practical experience is to enable you to better understand the theories and concepts discussed in the classroom. Another crucial aim of practical work is to allow you to develop and hone important skills, which include: • preparing and planning experiments • designing experiments • manipulating equipment • making measurements and observations • recording and presenting data • analysing data • interpreting results • evaluating data and procedures • writing reports • working as a team. A chemist has to be conscientious in observing, collecting, recording and interpreting experimental data. There is always the temptation to ‘fiddle’ a result if it deviates from the true or accepted value but in such circumstances it is far better to offer reasons and explanations for any deviation. If you have confidence in your data then others will have confidence in them as well – only honest work is acceptable in chemistry. Practical work in Advanced Higher chemistry is divided into two distinct parts. On the one hand, there are experiments designed to illustrate the content statements of the course, including 12 Prescribed Practical Activities (PPAs), and on the other hand, there is the Investigation. The PPAs are assessed both internally and externally. As far as the internal component is concerned, evidence of achievement of Outcome 3 – collect and analyse information obtained by experiment – is based on one written report of a PPA from each of the three ‘theory’ units. External assessment, however, samples all of the PPAs and it is essential preparation for the external examination that you have first- hand experience of all 12 PPAs and not just one from each unit. Like the
INTRODUCTION
2 CHEMISTRY
PPAs, assessment of the Investigation is both internal and external. This guide covers various aspects of practical work under the following broad headings: • Safety • Significant Figures • Errors • Chemical Analysis • Organic Techniques • Writing PPA Reports While this guide is designed primarily to support you in carrying out and completing the PPAs, much of it is pertinent to the Investigation unit. The student instructions sheet for each of the PPAs includes a very detailed procedure for the experiment and it is vital that you don’t treat it like a recipe. The key to avoiding this is good preparation. Before carrying out a PPA you should be absolutely clear about the following points: • the aim(s) of the experiment • how the aim(s) is to be achieved • the procedural details of the experiment • the measurements/observations to be made • how the measurements/observations will be recorded • the safety measures associated with the experiment.

SAFETY
CHEMISTRY 3
SECTION 2 Safety By its very nature, practical work involves a degree of risk – accidents can happen and unfortunately do happen. However, strict adherence to a set of laboratory safety rules will go far towards preventing or at least minimising the effect of accidents. One of the primary sources of risk in the laboratory arises from many of the chemicals you will use and make. Before any experiment is carried out, it is vital that you are aware of the possible hazards associated with the chemicals involved, namely: • explosive • flammable • oxidising • toxic • radioactive • harmful • corrosive • irritant • dangerous for the environment. In addition, you must also be familiar with the control measures that must be adopted when working with such chemicals. In each of the PPAs you will be alerted to these hazards and control measures under the heading Hazcon. This safety information is to be found on the student instructions sheet and that from the first PPA in Unit 1: Electronic Structure and the Periodic Table is reproduced here:
Hazcon Wear eye protection and if any chemical splashes on your skin wash it off immediately. Hydrated ammonium iron(II) sulphate may be harmful if ingested and may irritate the eyes. Wear gloves. Oxalic acid solution, potassium oxalate solution and the product, potassium trioxalatoferrate(III), are all harmful by ingestion and are irritating to the eyes and skin. Wear gloves. ‘20 volume’ hydrogen peroxide is irritating to the eyes and skin. Wear gloves. Ethanol is volatile, highly flammable, irritating to the eyes and intoxicating if inhaled or ingested. Dilute sulphuric acid is corrosive. Wear gloves.

SAFETY
4 CHEMISTRY
While risk assessments have been provided for the PPAs, this is not possible for the Investigation as a result of its open-ended nature. Nevertheless, risk assessments are required for the activities you propose to carry out in the investigation and you should consult your teacher/lecturer, who will advise you on how to prepare them. Safety information can be obtained from a variety of sources but you are strongly advised to consult the SSERC publication, Hazardous Chemicals: A Manual for Science Education and to visit the SSERC’s web site at www.sserc.org.uk. It is important to bear in mind that these rules and regulations for safe practice are a legal requirement and are not designed to strike fear into you nor inhibit practical work in any way. Provided you abide by the rules, exercise some common sense and treat chemicals with respect then practical work will be a good learning experience and one that ought to be enjoyed.
SIGNIFICANT FIGURES
CHEMISTRY 5
SECTION 3 Significant Figures Scientific notation Numbers in science have a habit of being either extremely large or extremely small. Take Avogadro’s constant and Plank’s constant, for example. We can write them in the ordinary way as:
602 300 000 000 000 000 000 000 mol–1 0.000 000 000 000 000 000 000 000 000 000 000 663 J s
but this notation is very clumsy and with so many zeros there is always a risk of making a mistake when writing them. It is much neater and more convenient to express such numbers in scientific notation, i.e. in the form:
N × 10n
where N is a number between 1 and 10 and n is the exponent or the power to which 10 is raised. So in scientific notation, Avogadro’s constant and Plank’s constant would be written as:
6.023 × 10²³ mol–1 6.63 × 10⁻³⁴ J s
As the definition implies and the following examples illustrate, any number – not just very large or very small numbers – can be expressed in scientific notation: 96 500 = 9.65 × 10⁴ 105.8 = 1.058 × 10² 10 = 1 × 101 0.049 = 4.9 × 10⁻² 0.005820 = 5.820 × 10⁻³
Scientific notation is not merely a more convenient way of expressing numbers, it has other distinct advantages, as we shall see later.

SIGNIFICANT FIGURES
6 CHEMISTRY
Exact and inexact numbers In scientific work, we come across two kinds of numbers: exact numbers and inexact numbers. An exact number is one which has no uncertainty associated with it. For example, when we say that there are 1000 g in a kilogram, the number ‘1000’ is an exact number – it cannot be 1001 or 999 but is exactly 1000. Similarly, the number ‘100’ is an exact number when we use it to describe the number of years in a century or the number of millimetres in a decimetre (10 cm). Although the exact numbers we have looked at so far are whole numbers, they don’t need to be. For example, the number ‘0.001’ is an exact number when we use it to define the number of litres in a cm3 or the number of metres in a millimetre. Likewise, the number ‘1/3’ or ‘0.333’ is an exact number when we use it to describe the fraction of carbon atoms in an ethene (C2H4) molecule. An inexact number is one which has some uncertainty associated with it. Suppose, for example, we weighed out a sample of a chemical on a digital balance that read to ±0.01 g. Let’s say the measured mass was 5.37 g. What this means is that the true mass of the sample must lie somewhere between 5.36 g and 5.38 g. So while we can be certain about the first two digits – the ‘5’ and the ‘3’ – in the measured mass, there is uncertainty in the last digit – the ‘7’. Hence, the number ‘5.37’ is an inexact number. ‘5.37’ is obviously not a whole number but is it possible for whole numbers to be inexact? To answer this question, let’s suppose the same chemical sample had been weighed out on a balance that read to ±1 g. The reported mass would have been 5 g but there is uncertainty associated with this measurement since the true mass would lie somewhere between 4 g and 6 g. So the number ‘5’ is an inexact number despite the fact that it is a whole number. Numbers obtained by measurement, whether they are whole numbers or not, are always inexact and this is a result of the inherent limitations of the equipment used in making the measurement. Significant figures defined The uncertainty in a measurement or inexact number can be expressed in terms of its number of significant figures. Significant figures are the meaningful digits in a number, i.e. the digits of which we are certain plus the first uncertain digit in the number. To illustrate this idea let’s return to the example above in which a sample of a chemical was weighed out
SIGNIFICANT FIGURES
CHEMISTRY 7
on a digital balance that read to ±0.01 g and the measured mass was reported as 5.37 g. The ‘5’ and the ‘3’ are the certain digits and they are followed by the ‘7’, which is the uncertain digit. So all three digits in the number ‘5.37’ are significant and we say that the number has been quoted to three significant figures. In reporting a measurement it is important to use the correct number of significant figures – neither too many nor too few. For example, let’s assume we determined the mass of a sample on a digital balance reading to ±0.1 g and got 17.2 g (3 significant figures). If we reported this mass as 17 g (2 significant figures) then we have used too few significant figures since it doesn’t reflect the readability of the balance used in the measurement. If, on the other hand, we reported the mass as 17.20 g (4 significant figures), then too many significant figures have been used since the balance is not capable of reading to ±0.01 g, as the number 17.20 implies. Before progressing any further, it is important that we are clear about how we decide which digits in a measurement or inexact number are significant or not. We can apply a few simple rules in order to achieve this and in what follows the significant figures are shown in bold type: • Digits that are not zero are always significant. So, 232 cm has 3
significant figures and 3.248 g has 4 significant figures. • Zeros that lie between non-zero digits are always significant. Thus,
6007 kg has 4 significant figures while 5.08 cm3 has 3 significant figures. • Zeros at the beginning of a number are never significant – all they do is
set the position of the decimal point. Hence, 0.321 g has 3 significant figures and 0.005 litres has 1 significant figure.
• Zeros at the end of a number are always significant if the number
contains a decimal point. Thus, 210.0 mm has 4 significant figures and 0.0600 mol l–1 has 3 significant figures.
• Zeros at the end of a number may or may not be significant if the number contains no decimal point. Take the measurement 300 mm, for example – does it have 1, 2 or 3 significant figures? It is
impossible to decide which is correct without more information. What we need to know is how the measurement was made. If a rule
capable of measuring to the nearest 10 mm had been used then the zero immediately following the ‘3’ would be significant but the other
SIGNIFICANT FIGURES
8 CHEMISTRY
zero would not. In other words, we are saying that 300 mm has 2 significant figures. But this is still ambiguous and to remove that ambiguity it is best to quote the measurement in scientific notation, i.e. as 3.0 × 102 mm. It is now clear that this number has 2 significant figures (the exponential part of the number has no bearing on the number of significant figures). Had the measurement been reported as 3.00 × 103 mm, then this number has 3 significant figures and implies that a rule measuring to the nearest mm must have been used. If no information is given or even suggested about the accuracy of the instrument used to make a measurement, then it must be assumed that the trailing zeros in a number with no decimal point are not significant. For example, in the absence of further information, the measurement 2600 kg only has two significant figures – the ‘2’ and the ‘6’. The zeros that follow are not significant. All shadow of doubt is removed if the measurement is reported in scientific notation, i.e. as 2.6 × 10³ kg.
We can also apply the principle of significant figures to exact numbers. Take the number ‘10’, for example. ‘10’ is an exact number when we use it to describe the number of years in a decade or the number of millimetres in a centimetre. Since there is no uncertainty associated with it, we could in fact write it as 10.00000… with the zeros continuing forever. All the digits in this number are significant, which means that it must have an infinite number of significant figures. This is true of all exact numbers.
Exercise 1 1. State the number of significant figures in each of the following
measurements: (a) 21 cm (e) –0.0037°C (b) 13.00 g (f) 105.50 kg (c) 0.0055 m (g) 1.03 × 10⁻³ mol l–1
(d) 20.20 cm3 (h) 5 × 10³ J 2. Consider the measurement 4000 mg. (a) How many significant figures could 4000 mg have? (b) In the absence of further information, report this
measurement in scientific notation showing the correct number of significant figures.

SIGNIFICANT FIGURES
CHEMISTRY 9
(c) If this measurement had been made using a balance that read to ± 0.1 g, quote the measurement showing the correct number of significant figures.
(d) If the measurement had been quoted as 4.00 × 10³ mg, state the
readability of the balance that must have been used in making the measurement.
Rounding off numbers The rules for rounding off numbers are best explained by looking at some examples. Take the number 168.741. When we round it off to 3 significant figures we obtain 169. We have rounded the 8 up to 9 because the digit immediately following the 8 is greater than 5. The reason we do this is that 169 is closer to 168.741 than is 168. If we round off 168.741 to 4 significant figures we obtain 168.7. In this case the 7 remains as 7 because the digit immediately following it is less than 5. Again, the reason for this is that 168.7 is closer to 168.741 than is 168.8. Now take the number 168.501. Rounding it off to 3 significant figures gives 169 since 169 is marginally closer to 168.501 than is 168. Finally, take the number 168.50 which lies exactly halfway between 169 and 168. If we round it off to 3 significant figures do we round it up to 169 or down to 168? There are two ways in which this can be tackled. One rule says that we always round up in such circumstances. Hence, 168.50 would round up to 169. The other rule says that we round off to the nearest even digit. Thus, 168.50 would round down to 168. The number 167.50, on the other hand, would round up to 168.
SIGNIFICANT FIGURES
10 CHEMISTRY
Exercise 2 Round off the number 5075.650 to: (a) 1 significant figure (d) 4 significant figures (b) 2 significant figures (e) 5 significant figures (c) 3 significant figures (f) 6 significant figures. Where appropriate write the number in scientific notation.
Significant figures in simple calculations Measurements are often used in calculations and, since measurements have uncertainty associated with them, it follows that results derived from them will also be uncertain. It is important, therefore, that a calculated result is reported with the correct number of significant figures and this will depend not only on the number of significant figures in the individual measurements but also on the type of mathematical operation being carried out on the measurements. Multiplication and division In multiplying and dividing measurements, the result must have the same number of significant figures as the measurement with the fewest significant figures. Example 1 Calculate the number of moles of solute in 0.0253 litres of a solution with concentration 1.2 mol l–1. number of moles of solute = concentration × volume = 1.2 × 0.0253 = 0.0303600 mol (calculator answer) The concentration measurement has the fewer number of significant figures, i.e. 2, and so, according to the above rule, the result must be quoted to 2 significant figures. The calculator answer is therefore rounded off to give: number of moles of solute = 0.030 mol
SIGNIFICANT FIGURES
CHEMISTRY 11
Example 2 Calculate the density of aluminium given that a block of the metal has a mass of 21.5 g and a volume of 8 cm3. density = = = 2.68750 g cm–3 (calculator answer) The volume measurement has the fewer significant figures, i.e. 1, and so the density must be quoted to 1 significant figure. Hence, density = 3 g cm–3 Example 3 Calculate the number of moles of carbon atoms in 0.367 mol of benzene (C6H6). Since a benzene molecule contains 6 carbon atoms: number of moles of C atoms = 6 × 0.367 = 2.20200 mol (calculator answer) What we have to remember in this case is that the number ‘6’ is an exact number and, as such, has an infinite number of significant figures. The limiting factor is therefore the number of significant figures in 0.367 mol, i.e. 3. Thus, number of moles of C atoms = 2.20 mol Addition and subtraction The rule to determine the number of significant figures for addition and subtraction is quite different to that for multiplication and division. In adding and subtracting measurements, the result must be reported with the same number of decimal places as the measurement with the least number of decimal places. If a measurement has no decimal place then it will be the limiting factor.
mass
volume
21.5
8

SIGNIFICANT FIGURES
12 CHEMISTRY
Example 4 A solution of potassium iodide was prepared by dissolving 2.56 g of the solid in 25.2 g of water. Calculate the total mass of the solution. total mass = 2.56 +25.2 27.76 g The measurement with the least number of decimal places is the 25.2 g of water and so, according to the above rule, the result must be quoted to 1 decimal place. Thus, total mass = 27.8 g Example 5 In a titration the initial and final burette readings were 12.7 cm3 and 19.6 cm3 respectively. Calculate the titre volume. titre volume = 19.6 –12.7 6.9 cm3 Both burette readings are quoted to 1 decimal place and so the titre volume must show 1 decimal place. Thus, titre volume = 6.9 cm3
In this case, the reported result is identical to the calculated result because no rounding off was required. Notice, too, that the number of significant figures in the titre volume is 2 despite the fact that the burette readings have 3 significant figures. Example 6 Calculate the total volume of a sample of water prepared by adding 2.4 cm3 to 5 cm3. total volume = 2.4 +5 7.4 cm3

SIGNIFICANT FIGURES
CHEMISTRY 13
The 5 cm3 volume is the limiting factor here since it has no decimal place. The total volume therefore must have no decimal place. Thus, total volume = 7 cm3
Example 7 10600 kg and 9900 kg of a chemical were produced in a plant over two successive days. Calculate the total mass produced over the two-day period. These masses have trailing zeros and since we have no information regarding their accuracy we have to assume that the trailing zeros are not significant. You’ll recall that numbers like these are best written in scientific notation, i.e. as 1.06 × 10⁴ kg and 9.9 × 10³ kg. However, for their addition to be valid they must be expressed to the same power of 10. Hence, total mass = 1.06 × 10⁴ +0.99 × 10⁴ 2.05 × 10⁴ kg Both measurements are quoted to 2 decimal places and so the result must have 2 decimal places. Hence, total mass = 2.05 × 10⁴ kg Logarithms and antilogarithms A logarithm is made up of two parts: a characteristic and a mantissa. To explain what we mean by these terms, let’s consider an example. The logarithm of 4.55 × 10¹² is:
12.658 The digits to the left of the decimal place – the 1 and the 2 – make up the characteristic while the digits to the right of the decimal place, i.e. those in bold type, make up the mantissa. We can see from our example that the characteristic, 12, corresponds to the power to which 10 is raised in the original number. Since the power is there merely to set the position of the decimal point, it contains no significant figures. This implies that the digits in the characteristic of a logarithm are not significant. It is only the digits in the mantissa of the logarithm – the 6, the 5 and the 8 – that are significant. The distinction between the
SIGNIFICANT FIGURES
14 CHEMISTRY
characteristic and the mantissa is therefore very important in deciding how many significant figures to retain in calculations that involve logarithms and antilogarithms. The logarithm of a number must contain the same number of significant figures as the number itself. In other words, the number of digits in the mantissa must equal the number of significant figures in the original number. Example 8 Calculate the pH of 0.053 mol l–1 hydrochloric acid. pH = – log[H+] = – log(0.053) = 1.27572 (calculator answer) The number of significant figures in 0.053 mol l–1 is 2 and so according to the above rule, the mantissa of the logarithm must also contain 2 significant figures. Thus, pH = 1.28 In converting a logarithm to an antilogarithm the number of significant figures in the antilogarithm must be the same as that in the logarithm, i.e. the number of digits in the antilogarithm must equal the number of significant figures in the mantissa of the logarithm. Example 9 Calculate the dissociation constant of the weak acid methanoic acid, given that its pKa value is 3.75. Ka = antilog(–pKa) = antilog(–3.75) = 1.77828 × 10⁻⁴ (calculator answer) The number of significant figures in the mantissa of 3.75 is 2. This implies that the Ka value should be quoted to 2 significant figures. Hence, Ka = 1.8 × 10⁻⁴

SIGNIFICANT FIGURES
CHEMISTRY 15
Exercise 3 In the following calculations, report each result with the correct number of significant figures. 1. The concentration of magnesium in seawater is 0.00133 mg l–1. What mass of magnesium would be present in 6.0 litres of
seawater? 2. Given that one mole of potassium chloride has a mass of 74.6 g, calculate the number of moles of potassium chloride in a
2.0 g sample. 3. Calculate the number of molecules in 8.3 mol of carbon dioxide.
The Avogadro constant is 6.02 × 10²³ mol–1. 4. What volume of 0.150 mol l–1 sodium hydroxide solution will
contain 0.300 mol of solute? 5. Calculate the mass of one mole of potassium bromide given that
the relative atomic masses of potassium and bromine are 39.1 and 79.9 respectively.
6. A weighing bottle containing a liquid sample had a total mass of
15.653 g. After transferring the liquid into a reaction flask, the weighing bottle was reweighed and had a mass of 12.793 g.
Calculate the mass of liquid transferred to the flask. 7. 1.65 × 10⁶ tonnes of a chemical were produced and 9.22 × 10⁵ tonnes were sold. Calculate the mass of the chemical that remained unsold. 8. Given that [H+] = antilog(–pH), calculate the concentration of
hydrogen ions in a solution of potassium hydroxide with a pH of 11.76.
9. The dissociation constant Ka of iodic(I) acid is 3.02 × 10⁻¹¹.
Calculate its pKa value given that pKa = –logKa.

SIGNIFICANT FIGURES
16 CHEMISTRY
Significant figures in complex calculations By complex calculations we mean those that involve • one step but include two or more mathematical operations • two or more steps. The rules about significant figures outlined in the last section are also applicable here but with the following proviso. When a calculation involves two or more steps, it is important to postpone rounding off to the correct number of significant figures until the final step has been completed. At least one extra digit beyond the last significant digit should be retained in intermediate results. This procedure ensures that small errors from rounding off at each step do not combine to affect the final result. Example 10 In an organic preparation, 8.62 g of benzoic acid were obtained by the hydrolysis of ethyl benzoate. Calculate the percentage yield of benzoic acid if the theoretical yield was 12.32 g. % yield = = = 69.9675 % (calculator answer) In this calculation, the limiting piece of data is the actual yield of benzoic acid, i.e. 8.62 g. It has 3 significant figures and so the final result must be rounded off to 3 significant figures. Thus, % yield = 70.0% Notice that the number ‘100’ is an exact number and has an infinite number of significant figures. Example 11 0.53 g of sodium chloride was dissolved in approximately 20 cm3 of water in a beaker. The solution plus rinsings from the beaker were transferred to a 100 cm3 volumetric flask. The solution was made up to the graduation mark with water. The flask was stoppered and inverted several times to ensure complete mixing.
actual yield100
theoretical yield!
8.62100
12.32!

SIGNIFICANT FIGURES
CHEMISTRY 17
Calculate the concentration of the resulting sodium chloride solution. NaCl: mass of one mole = 23.0 + 35.5 = 58.5 g no. of moles = = 0.00906 mol Although this result should be quoted to 2 significant figures (0.0091 mol), it is an intermediate one and this is why we carry the extra digit. concentration =
= = 0.0906 mol l–1
You’ll have noticed that the volume has been quoted to 3 significant figures (0.100 litre) rather than 1 significant figure (0.1 litre). This is because we are told that a 100 cm3 volumetric flask has been used in the preparation and its accuracy is such that the trailing zeros are significant. The limiting measurement in this calculation is the mass of sodium chloride (0.53 g) since it has only 2 significant figures. This implies that we cannot justify more than 2 significant figures in the final answer. Hence, concentration = 0.091 mol l–1
Example 12 A flask full of chlorine has a mass of 87.52 g. When it is emptied of all gas, its mass is 87.21 g. Assuming the flask has a volume of 102.5 cm3, calculate the molar volume of chlorine under the conditions of temperature and pressure of the experiment. mass of chlorine = 87.52 – 87.21 = 0.31 g Notice that the mass of chlorine has 2 significant figures yet the data used to derive it have 4. volume of chlorine = 102.5 cm3 = 0.1025 litre Cl2: mass of one mole = 35.5 + 35.5 = 71.0 g
0.53
58.5
n
V
0.00906
0.100
SIGNIFICANT FIGURES
18 CHEMISTRY
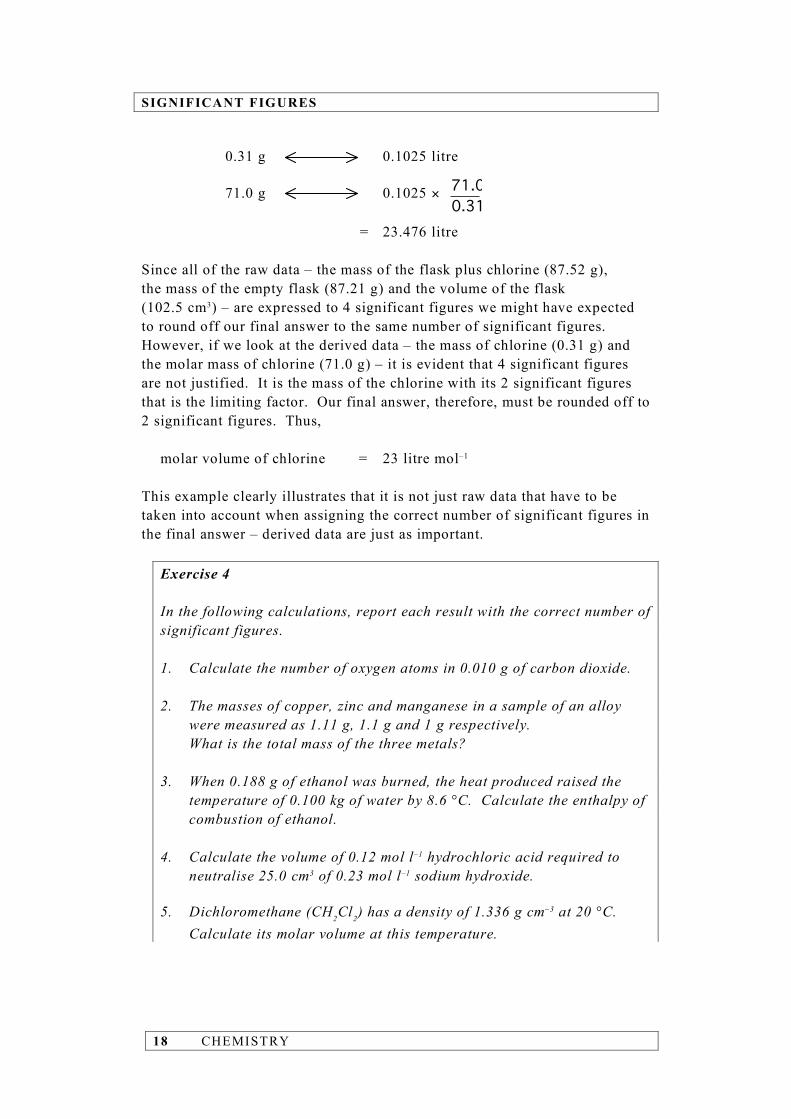
0.31 g 0.1025 litre 71.0 g 0.1025 × = 23.476 litre Since all of the raw data – the mass of the flask plus chlorine (87.52 g), the mass of the empty flask (87.21 g) and the volume of the flask (102.5 cm3) – are expressed to 4 significant figures we might have expected to round off our final answer to the same number of significant figures. However, if we look at the derived data – the mass of chlorine (0.31 g) and the molar mass of chlorine (71.0 g) – it is evident that 4 significant figures are not justified. It is the mass of the chlorine with its 2 significant figures that is the limiting factor. Our final answer, therefore, must be rounded off to 2 significant figures. Thus, molar volume of chlorine = 23 litre mol–1
This example clearly illustrates that it is not just raw data that have to be taken into account when assigning the correct number of significant figures in the final answer – derived data are just as important.
Exercise 4 In the following calculations, report each result with the correct number of significant figures. 1. Calculate the number of oxygen atoms in 0.010 g of carbon dioxide. 2. The masses of copper, zinc and manganese in a sample of an alloy
were measured as 1.11 g, 1.1 g and 1 g respectively. What is the total mass of the three metals? 3. When 0.188 g of ethanol was burned, the heat produced raised the
temperature of 0.100 kg of water by 8.6 °C. Calculate the enthalpy of combustion of ethanol.
4. Calculate the volume of 0.12 mol l–1 hydrochloric acid required to
neutralise 25.0 cm3 of 0.23 mol l–1 sodium hydroxide. 5. Dichloromethane (CH2Cl2) has a density of 1.336 g cm–3 at 20 °C. Calculate its molar volume at this temperature.
71.0
0.31
SIGNIFICANT FIGURES
CHEMISTRY 19
6. An irregularly–shaped piece of silver weighing 97.2 g is placed in a measuring cylinder containing 154 cm3 of water. The volume reading on the cylinder increases to 163 cm3. From these data, calculate the density of silver. 7. A current of 2 A was passed through dilute sulphuric acid for
503s. Calculate the volume of hydrogen gas that would be produced assuming that the molar volume of hydrogen is
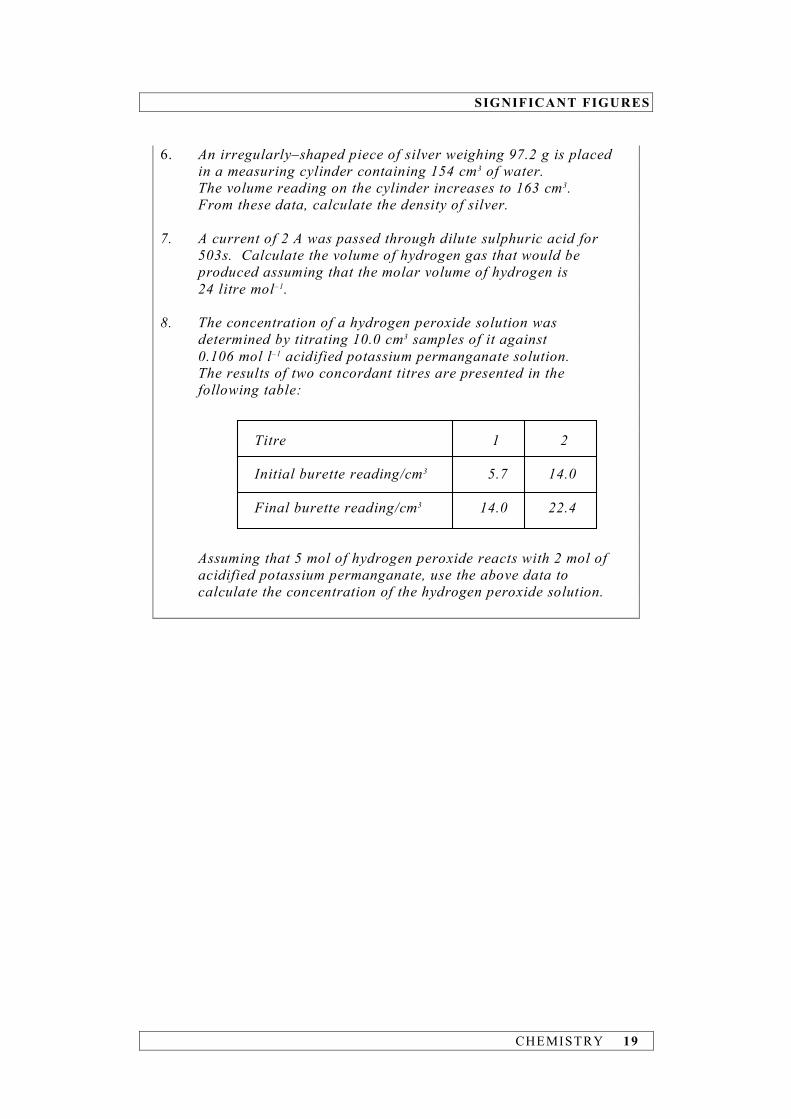
24 litre mol–1. 8. The concentration of a hydrogen peroxide solution was
determined by titrating 10.0 cm3 samples of it against 0.106 mol l–1 acidified potassium permanganate solution. The results of two concordant titres are presented in the following table: Titre 1 2 Initial burette reading/cm3 5.7 14.0 Final burette reading/cm3 14.0 22.4 Assuming that 5 mol of hydrogen peroxide reacts with 2 mol of
acidified potassium permanganate, use the above data to calculate the concentration of the hydrogen peroxide solution.

CHEMISTRY 20

ERRORS
CHEMISTRY 21
SECTION 4 Errors Accuracy and precision The terms ‘accuracy’ and ‘precision’ are commonly used to mean the same thing but there is a subtle difference in their meanings. This difference can be illustrated by looking at the results of three dart players each aiming for the bull’s-eye on a dart board (see Figure 1). Figure 1
A B C
Player A is not very skilled at the game. Since the darts are all over the place we can describe his results as being imprecise. Since none is in the bull’s-eye we can also describe them as inaccurate. Player B is much more skilful. His darts are clustered close together and so they are precise. They are all in the bull’s-eye and are therefore accurate. Because player C’s darts are very close together we can describe them as precise but because they are not in the bull’s-eye they are inaccurate. Had player C been aiming for ‘double eighteen’ then his results would have been accurate as well as being precise. The terms ‘accuracy’ and ‘precision’ can equally well be applied to measurements and to results derived from measurements. An accurate measurement or result is defined as one that is in close agreement with the true or accepted value. Precise measurements or results are those that are in close agreement with each other.

ERRORS
22 CHEMISTRY
Let’s now consider an example from analytical chemistry. Suppose four students analysed samples of anhydrous ammonium sulphate in order to determine the percentage by mass of nitrogen and let’s say they each performed the procedure four times. Their results are presented in the following table:
Student Lynn Mary Naveed David
21.3 22.5 20.2 21.9 Percentage 21.2 22.4 19.6 19.6 nitrogen 21.0 22.6 21.0 22.8 21.2 22.5 18.8 20.5 Average value 21.2 22.5 19.9 21.2
In order to analyse these results in terms of accuracy and precision it is more helpful to present them in pictorial fashion and this has been done in Figure 2. Figure 2
The black dots represent the individual results and the black diamonds indicate the average values. The dotted line shows the true or accepted value for the percentage by mass of nitrogen in anhydrous ammonium sulphate, namely 21.2%.
ERRORS
CHEMISTRY 23
Since Lynn’s results are clustered together and in close agreement with one another, we can describe them as precise. For the same reason, Mary’s results are also precise. In fact, the precision that Mary has achieved is marginally better than Lynn’s because the spread in her results is slightly less than in Lynn’s – Mary’s results range from 22.4% to 22.6% with a spread of 0.2%, while the spread in Lynn’s results is 0.3%. Both Naveed and David’s results are widely scattered and so are imprecise. The imprecision in David’s results is worse than that in Naveed’s since the spread in his results (3.2%) is larger than that in Naveed’s (2.2%). As far as accuracy is concerned, all of Lynn’s results are reasonably accurate since they deviate only slightly from the true value. Mary’s results differ significantly from the true value and are therefore inaccurate and this is despite the fact that they are precise. One of Naveed’s results, 21.0%, is accurate but the other three are inaccurate. None of David’s results is accurate. His average (21.2%), however, is highly accurate – but this is just fortuitous. In summary, the closer a result is to its true value then the greater is its accuracy and the smaller the spread in a set of results the more precise they are. Furthermore, while it is true to say that a set of accurate results will always be precise, e.g. Lynn’s results, a set of precise results may not always be accurate, e.g. Mary’s results. Repeatability and reproducibility When an analyst obtains a set of results by repeating the same analytical procedure and these results are in close agreement then we can describe the results as not only being precise but repeatable. The procedure the analyst used can also be described as repeatable. If a second analyst carries out the same analytical procedure and gains a set of results which are precise and close to those obtained by the first analyst, then we can describe both the results and the procedure used as reproducible. Let’s look back at Lynn’s results. They are precise and so they must be repeatable but they don’t agree with Mary’s results and so they cannot be described as reproducible. Random and systematic errors We already know that measurements and results derived from measurements have some uncertainty associated with them. We call this uncertainty experimental error and there are two types: random error

ERRORS
24 CHEMISTRY
and systematic error. Random error affects the precision of results while systematic error affects their accuracy. These relationships are illustrated in Figure 3 using Lynn and Mary’s results once again. Figure 3
As before, the black circles represent individual results while the black diamonds represent averages. The dotted line shows the true result. It is evident from the diagram that Mary’s results suffer a marginally smaller random error but a much larger systematic error in comparison with Lynn’s. You’ll notice that random error causes results to be scattered more or less symmetrically around the mean or average value. In other words, it has a random effect on the results – some are higher than the average value while others are lower. Systematic error, on the other hand, has a consistent or systematic effect on the results causing all of them to be higher or all of them to be lower than the true result. The systematic error in Mary’s results, for example, has caused all of them to be approximately 1.3% higher than they ought to be. Systematic error, therefore, causes a bias in results. One of the main sources of random error is in the equipment we use in making measurements. Suppose, for example, we had to prepare 250 cm3 of a standard solution. The procedure would involve the use of a 250 cm3 volumetric flask and let’s say the measurement uncertainty associated with such a flask is ±0.3 cm3. This means that the volume of the solution it holds will lie somewhere between 250.3 cm3 and 249.7 cm3. Because the volume of the solution could equally well be above 250.0 cm3 as below it, we can classify this error as a random one. Random errors of this type are always present and cannot be eliminated
ERRORS
CHEMISTRY 25
– they are a result of the limitations inherent in the equipment we use and are outwith our control. Some random errors, however, can be eliminated or at least reduced. Suppose, for example, we were weighing a sample of a chemical near an open window. The draughts of air from the window would move the balance pan up and down, thereby decreasing or increasing the mass measurement in a random fashion. By closing the window or by surrounding the pan with a draught excluder, this random error could be eliminated. Systematic error can arise from • flaws in the equipment we use in making measurements. Suppose, for
example, that a stopwatch used to record reaction times was running fast. The reaction times would be underestimated and since all of them would be less than the true value then this error would be classified as systematic.
• flaws in the procedures we employ. For example, if a 25.0 cm3 pipette was
used in a laboratory at a temperature of 25°C rather than at the calibration temperature of 20°C, then the volume it delivered would be consistently above 25.0 cm3 as a result of its expansion.
• the lack of purity in reagents. Suppose an old sample of potassium
permanganate solution had been used in determining the concentration of a hydrogen peroxide solution by volumetric analysis. Since its initial preparation, some of the potassium permanganate would have been reduced, thus lowering its concentration. If the potassium permanganate had not been re–standardised just prior to the analysis then this would lead to a systematic error in the calculated concentration of the hydrogen peroxide solution – it would always be higher than its true concentration.
A systematic error is often difficult to detect but once this has been achieved, it can usually be corrected and thus eliminated.
Exercise 5 1. In acid/base titrations it is important to use the minimum volume
of indicator – usually 2–3 drops – since acid/base indicators are themselves weak acids or weak bases.
In a series of titrations a student always used 10 drops of indicator per titration. Would this lead to a random or systematic error in his titre volumes? Explain your answer.
2. A student calibrated a pH meter using a buffer solution of pH 7.00 and then went on to measure the pH values of a number
ERRORS
26 CHEMISTRY
of aqueous solutions. She later discovered that the pH of the buffer she had used to calibrate the meter was really 7.09.
Would this cause a random or systematic error in her pH results? Explain your answer.
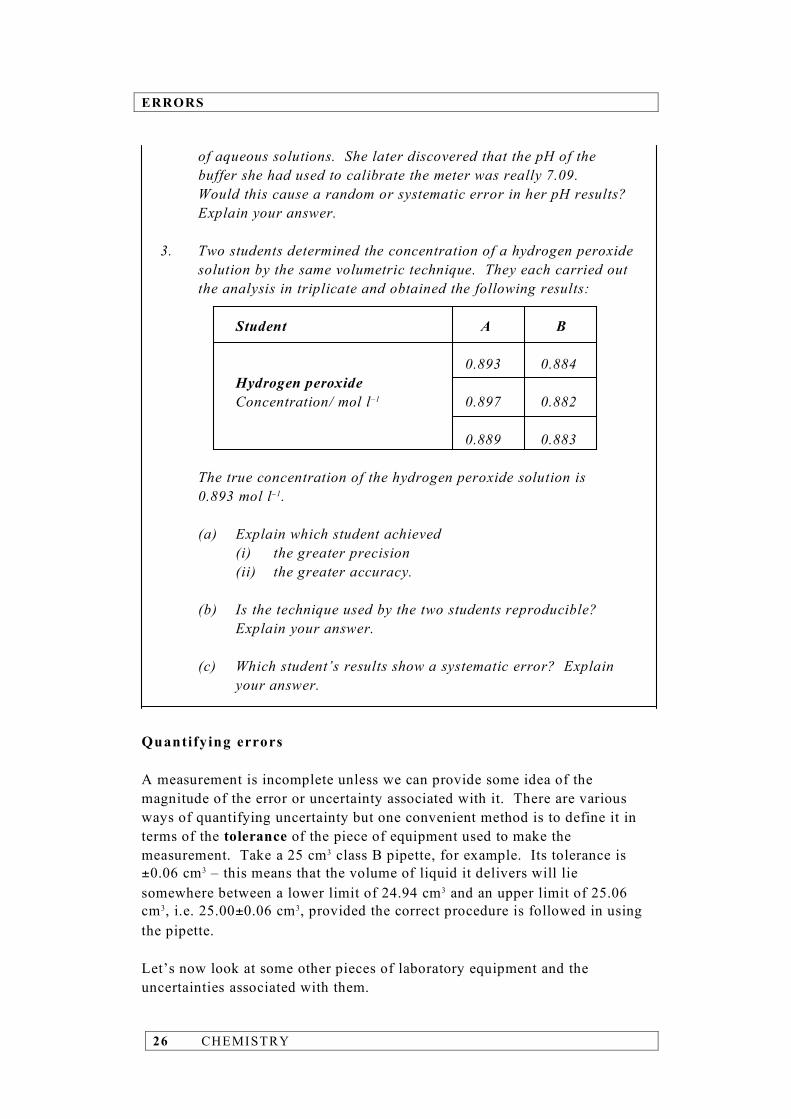
3. Two students determined the concentration of a hydrogen peroxide
solution by the same volumetric technique. They each carried out the analysis in triplicate and obtained the following results:
Student A B 0.893 0.884 Hydrogen peroxide Concentration/ mol l–1 0.897 0.882 0.889 0.883
The true concentration of the hydrogen peroxide solution is 0.893 mol l–1.
(a) Explain which student achieved (i) the greater precision (ii) the greater accuracy. (b) Is the technique used by the two students reproducible?
Explain your answer. (c) Which student’s results show a systematic error? Explain
your answer. Quantifying errors A measurement is incomplete unless we can provide some idea of the magnitude of the error or uncertainty associated with it. There are various ways of quantifying uncertainty but one convenient method is to define it in terms of the tolerance of the piece of equipment used to make the measurement. Take a 25 cm3 class B pipette, for example. Its tolerance is ±0.06 cm3 – this means that the volume of liquid it delivers will lie somewhere between a lower limit of 24.94 cm3 and an upper limit of 25.06 cm3, i.e. 25.00±0.06 cm3, provided the correct procedure is followed in using the pipette. Let’s now look at some other pieces of laboratory equipment and the uncertainties associated with them.
ERRORS
CHEMISTRY 27
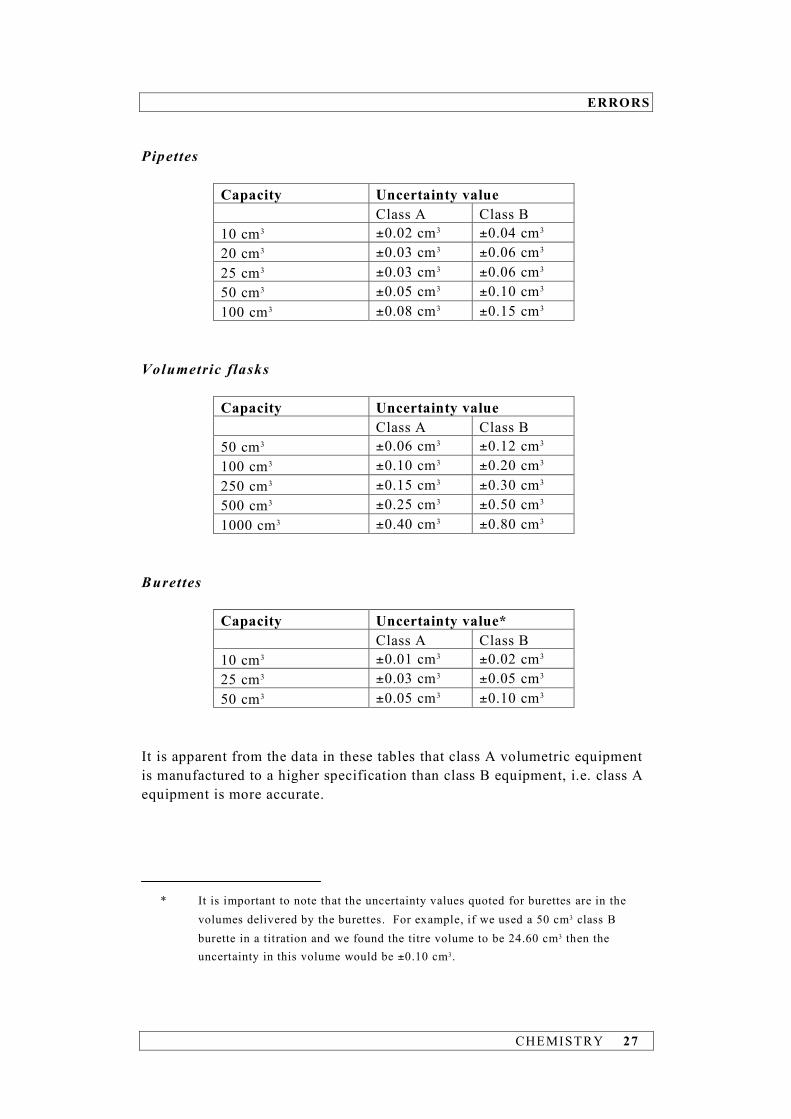
Pipettes
Capacity Uncertainty value Class A Class B 10 cm3 ±0.02 cm3 ±0.04 cm3 20 cm3 ±0.03 cm3 ±0.06 cm3 25 cm3 ±0.03 cm3 ±0.06 cm3 50 cm3 ±0.05 cm3 ±0.10 cm3 100 cm3 ±0.08 cm3 ±0.15 cm3
Volumetric flasks Capacity Uncertainty value Class A Class B 50 cm3 ±0.06 cm3 ±0.12 cm3 100 cm3 ±0.10 cm3 ±0.20 cm3 250 cm3 ±0.15 cm3 ±0.30 cm3 500 cm3 ±0.25 cm3 ±0.50 cm3 1000 cm3 ±0.40 cm3 ±0.80 cm3
Burettes Capacity Uncertainty value* Class A Class B 10 cm3 ±0.01 cm3 ±0.02 cm3 25 cm3 ±0.03 cm3 ±0.05 cm3 50 cm3 ±0.05 cm3 ±0.10 cm3
It is apparent from the data in these tables that class A volumetric equipment is manufactured to a higher specification than class B equipment, i.e. class A equipment is more accurate.
* It is important to note that the uncertainty values quoted for burettes are in the volumes delivered by the burettes. For example, if we used a 50 cm3 class B burette in a titration and we found the titre volume to be 24.60 cm3 then the uncertainty in this volume would be ±0.10 cm3.
ERRORS
28 CHEMISTRY
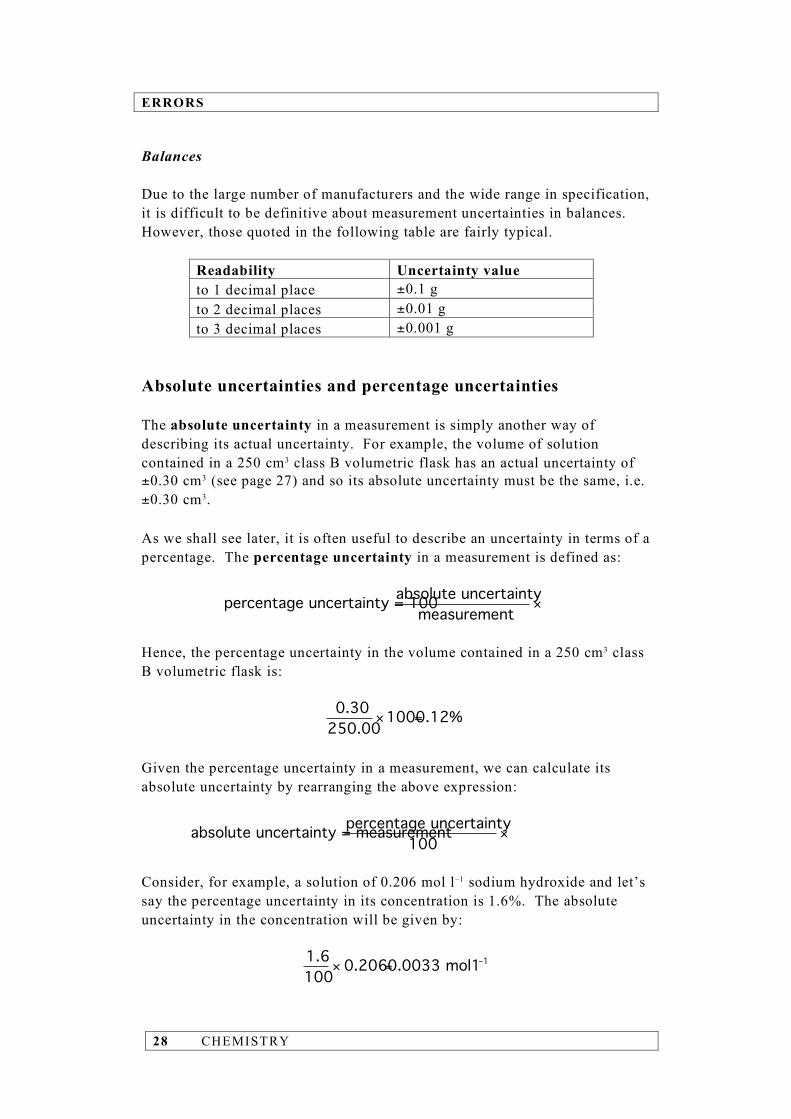
Balances Due to the large number of manufacturers and the wide range in specification, it is difficult to be definitive about measurement uncertainties in balances. However, those quoted in the following table are fairly typical.
Readability Uncertainty value to 1 decimal place ±0.1 g to 2 decimal places ±0.01 g to 3 decimal places ±0.001 g
Absolute uncertainties and percentage uncertainties The absolute uncertainty in a measurement is simply another way of describing its actual uncertainty. For example, the volume of solution contained in a 250 cm3 class B volumetric flask has an actual uncertainty of ±0.30 cm3 (see page 27) and so its absolute uncertainty must be the same, i.e. ±0.30 cm3. As we shall see later, it is often useful to describe an uncertainty in terms of a percentage. The percentage uncertainty in a measurement is defined as:
absolute uncertaintypercentage uncertainty = 100
measurement!
Hence, the percentage uncertainty in the volume contained in a 250 cm3 class B volumetric flask is:
0.301000.12%
250.00! =
Given the percentage uncertainty in a measurement, we can calculate its absolute uncertainty by rearranging the above expression:
percentage uncertaintyabsolute uncertainty = measurement
100!
Consider, for example, a solution of 0.206 mol l–1 sodium hydroxide and let’s say the percentage uncertainty in its concentration is 1.6%. The absolute uncertainty in the concentration will be given by:
–11.60.2060.0033 mol1
100! =

ERRORS
CHEMISTRY 29
Thus,
sodium hydroxide concentration = 0.206 ± 0.003 mol l–1
Exercise 6
1. (a) Calculate the percentage uncertainty in the volume of solution
(i) delivered by a 100 cm3 class A pipette (ii) contained in a 100 cm3 class A volumetric flask.
(b) 10.00 cm3 of a solution was delivered from a burette. Calculate the percentage uncertainty in this volume had a (i) 10 cm3 class B burette (ii) 50 cm3 class B burette been used. (c) A student had to measure out 50 cm3 of water and she had the
following pieces of equipment available: (i) a 50 cm3 class A pipette (ii) a 50 cm3 class B volumetric flask (iii) a 50 cm3 class A burette (iv) a balance reading to two decimal places. By calculating percentage uncertainties, decide which piece
of equipment she should use to measure out 50 cm3 of water as accurately as possible.
(Assume that the density of water is 1.000 g cm–3)
2. (a) The relative formula mass of sodium chloride is 58.4425 and has a percentage uncertainty of 3.4 × 10⁻⁴%.
Calculate the absolute uncertainty in the relative formula mass of sodium chloride.
(b) 9.0 cm3 of a solution with a percentage uncertainty of 0.22%
was delivered from a burette. Calculate the absolute uncertainty in the volume and decide
which type of burette (capacity and class) is likely to have been used to deliver this volume of solution.
(c) You have been asked to weigh out 17 g of calcium carbonate
to within ± 0.2%. Calculate the absolute uncertainty in this mass and explain
whether a balance reading to one decimal place would meet the accuracy required.
ERRORS
30 CHEMISTRY
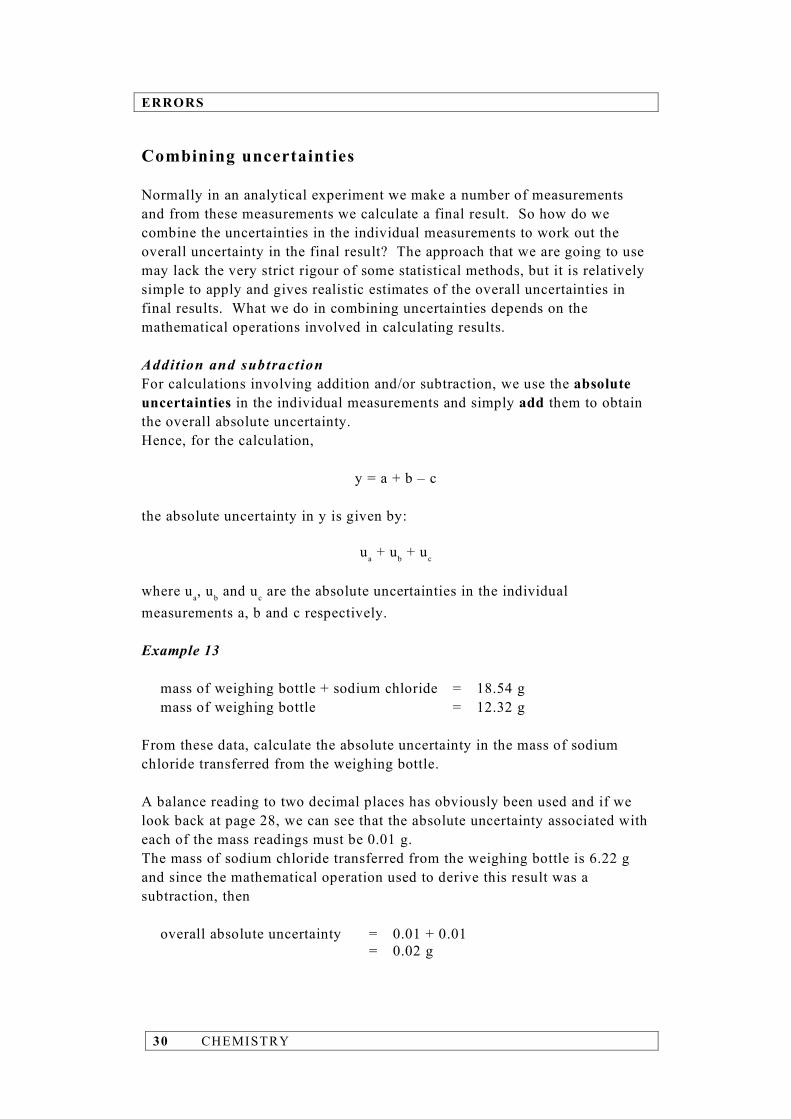
Combining uncertainties Normally in an analytical experiment we make a number of measurements and from these measurements we calculate a final result. So how do we combine the uncertainties in the individual measurements to work out the overall uncertainty in the final result? The approach that we are going to use may lack the very strict rigour of some statistical methods, but it is relatively simple to apply and gives realistic estimates of the overall uncertainties in final results. What we do in combining uncertainties depends on the mathematical operations involved in calculating results. Addition and subtraction For calculations involving addition and/or subtraction, we use the absolute uncertainties in the individual measurements and simply add them to obtain the overall absolute uncertainty. Hence, for the calculation,
y = a + b – c the absolute uncertainty in y is given by:
ua + ub + uc
where ua, ub and uc are the absolute uncertainties in the individual measurements a, b and c respectively. Example 13 mass of weighing bottle + sodium chloride = 18.54 g mass of weighing bottle = 12.32 g From these data, calculate the absolute uncertainty in the mass of sodium chloride transferred from the weighing bottle. A balance reading to two decimal places has obviously been used and if we look back at page 28, we can see that the absolute uncertainty associated with each of the mass readings must be 0.01 g. The mass of sodium chloride transferred from the weighing bottle is 6.22 g and since the mathematical operation used to derive this result was a subtraction, then overall absolute uncertainty = 0.01 + 0.01 = 0.02 g
ERRORS
CHEMISTRY 31
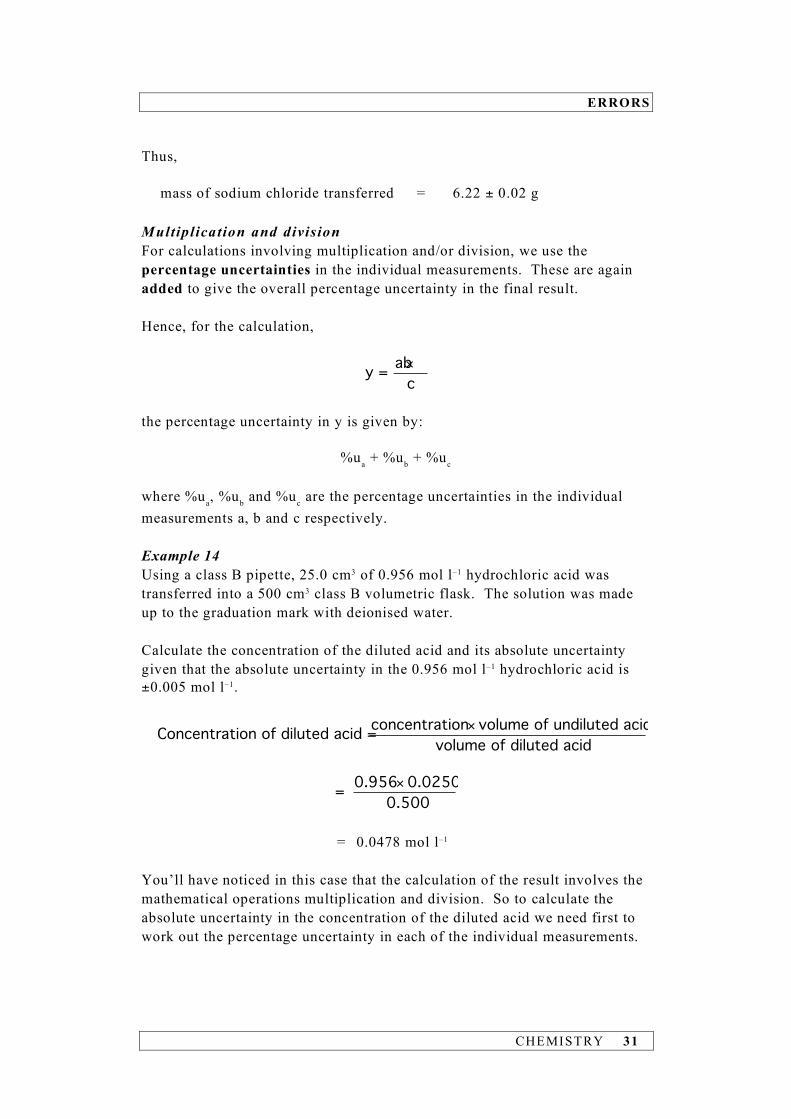
Thus, mass of sodium chloride transferred = 6.22 ± 0.02 g Multiplication and division For calculations involving multiplication and/or division, we use the percentage uncertainties in the individual measurements. These are again added to give the overall percentage uncertainty in the final result. Hence, for the calculation,
aby =
c
!
the percentage uncertainty in y is given by:
%ua + %ub + %uc
where %ua, %ub and %uc are the percentage uncertainties in the individual measurements a, b and c respectively. Example 14 Using a class B pipette, 25.0 cm3 of 0.956 mol l–1 hydrochloric acid was transferred into a 500 cm3 class B volumetric flask. The solution was made up to the graduation mark with deionised water. Calculate the concentration of the diluted acid and its absolute uncertainty given that the absolute uncertainty in the 0.956 mol l–1 hydrochloric acid is ±0.005 mol l–1.
concentration volume of undiluted acidConcentration of diluted acid =
volume of diluted acid
!
0.956 0.0250=
0.500
!
= 0.0478 mol l–1
You’ll have noticed in this case that the calculation of the result involves the mathematical operations multiplication and division. So to calculate the absolute uncertainty in the concentration of the diluted acid we need first to work out the percentage uncertainty in each of the individual measurements.
ERRORS
32 CHEMISTRY
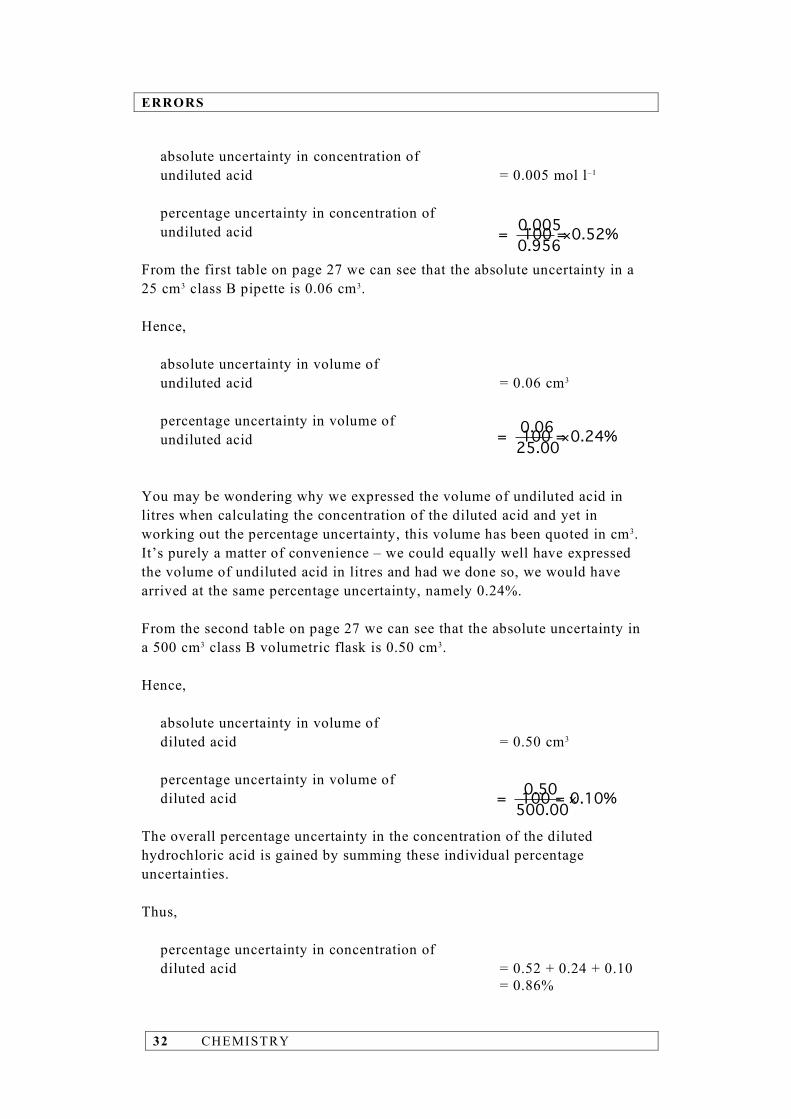
absolute uncertainty in concentration of undiluted acid = 0.005 mol l–1
percentage uncertainty in concentration of undiluted acid From the first table on page 27 we can see that the absolute uncertainty in a 25 cm3 class B pipette is 0.06 cm3. Hence, absolute uncertainty in volume of undiluted acid = 0.06 cm3
percentage uncertainty in volume of undiluted acid You may be wondering why we expressed the volume of undiluted acid in litres when calculating the concentration of the diluted acid and yet in working out the percentage uncertainty, this volume has been quoted in cm3. It’s purely a matter of convenience – we could equally well have expressed the volume of undiluted acid in litres and had we done so, we would have arrived at the same percentage uncertainty, namely 0.24%. From the second table on page 27 we can see that the absolute uncertainty in a 500 cm3 class B volumetric flask is 0.50 cm3. Hence, absolute uncertainty in volume of diluted acid = 0.50 cm3
percentage uncertainty in volume of diluted acid The overall percentage uncertainty in the concentration of the diluted hydrochloric acid is gained by summing these individual percentage uncertainties. Thus, percentage uncertainty in concentration of diluted acid = 0.52 + 0.24 + 0.10 = 0.86%
0.005= 100 = 0.52%
0.956!
0.06= 100 = 0.24%
25.00!
0.50= 100 = 0.10%
500.00!

ERRORS
CHEMISTRY 33
Now that we have the percentage uncertainty in the concentration of the diluted acid, we can calculate its absolute uncertainty: absolute uncertainty in concentration of diluted acid = 0.00041 mol l–1 Thus,
concentration of diluted acid = 0.0478 ± 0.0.004 mol l–1
To sum up ... • add the absolute uncertainties in the individual measurements if the
calculation involves an addition and/or a subtraction • add the percentage uncertainties in the individual measurements if
the calculation involves a multiplication and/or a division. Some ‘forgotten’ uncertainties The uncertainties we have considered so far have been confined to those that arise from the equipment we use to make measurements. But there are others and although they are quite often overlooked, they may contribute significantly to the overall uncertainty in a result. One such uncertainty is that in detecting the end-point of a titration, i.e. in judging the point at which the indicator just changes colour. We ought to be able to estimate the end-point in a titration to within one drop of the titrant and since the average volume of a drop is 0.05 cm3 then the absolute uncertainty in the end-point will be ±0.05 cm3. Let’s consider an example to gauge the significance of this uncertainty. Suppose a 50 cm3 class A burette was used in a titration and let’s say the titre volume was 23.2 cm3. We now know that there are two uncertainties associated with this titre volume – one arising from the burette itself, namely ±0.05 cm3, and the other in estimating the end-point, namely ±0.05 cm3. So, overall absolute uncertainty in the titre volume = 0.05 + 0.05 = 0.10 cm3 Thus,
titre volume = 23.2±0.1 cm3
0.86= 0.0478
100!
ERRORS
34 CHEMISTRY
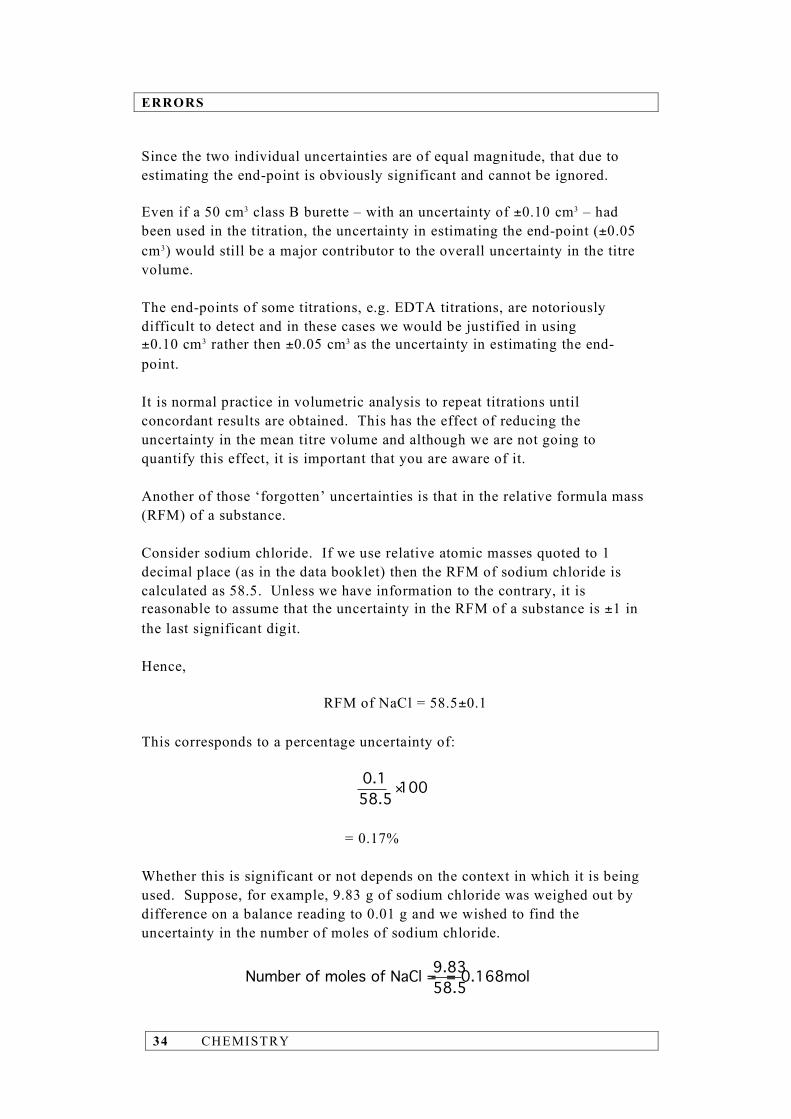
Since the two individual uncertainties are of equal magnitude, that due to estimating the end-point is obviously significant and cannot be ignored. Even if a 50 cm3 class B burette – with an uncertainty of ±0.10 cm3 – had been used in the titration, the uncertainty in estimating the end-point (±0.05 cm3) would still be a major contributor to the overall uncertainty in the titre volume. The end-points of some titrations, e.g. EDTA titrations, are notoriously difficult to detect and in these cases we would be justified in using ±0.10 cm3 rather then ±0.05 cm3 as the uncertainty in estimating the end-point. It is normal practice in volumetric analysis to repeat titrations until concordant results are obtained. This has the effect of reducing the uncertainty in the mean titre volume and although we are not going to quantify this effect, it is important that you are aware of it. Another of those ‘forgotten’ uncertainties is that in the relative formula mass (RFM) of a substance. Consider sodium chloride. If we use relative atomic masses quoted to 1 decimal place (as in the data booklet) then the RFM of sodium chloride is calculated as 58.5. Unless we have information to the contrary, it is reasonable to assume that the uncertainty in the RFM of a substance is ±1 in the last significant digit. Hence,
RFM of NaCl = 58.5±0.1
This corresponds to a percentage uncertainty of:
0.1 100
58.5!
= 0.17% Whether this is significant or not depends on the context in which it is being used. Suppose, for example, 9.83 g of sodium chloride was weighed out by difference on a balance reading to 0.01 g and we wished to find the uncertainty in the number of moles of sodium chloride.
9.83Number of moles of NaCl = = 0.168mol
58.5

ERRORS
CHEMISTRY 35
To determine the overall uncertainty in the number of moles of sodium chloride, we need to work out the percentage uncertainties in the mass and RFM of sodium chloride and then add these together.
0.02percentage uncertainty in mass of NaCl = 100 = 0.20%
9.83!
Notice that the absolute uncertainty in the mass of sodium chloride is ±0.02 g. This is because the sodium chloride has been weighed by difference (see page 30).
0.1percentage uncertainty in RFM of NaCl = 100 = 0.17%
58.5!
So, the percentage uncertainty in the number of moles of NaCl = 0.20 + 0.17 = 0.37% We can see that the individual uncertainties are of the same order of magnitude and so the percentage uncertainty in the RFM of sodium chloride makes a significant contribution to the overall uncertainty in the number of moles of sodium chloride and cannot be ignored. Had the relative formula mass of the sodium chloride been calculated using relative atomic masses quoted to 2 decimal places, it would take the value 58.44 and the uncertainty associated with it would be ±0.01. Hence,
0.01percentage uncertainty in RFM of NaCl = 100
58.44!
= 0.017% The overall percentage uncertainty in the number of moles of sodium chloride would then be: 0.20 + 0.02 = 0.22% In this case, the percentage uncertainty in the RFM of sodium chloride is 10 times smaller than that in the mass of sodium chloride and so its contribution to the overall uncertainty in the number of moles of sodium chloride is negligibly small and can be ignored.

ERRORS
36 CHEMISTRY
In conclusion.. If we use a balance reading to 0.01 g and • relative formula masses quoted to 1 decimal place then the uncertainty
associated with the RFM cannot be ignored. • relative formula masses quoted to 2 decimal places then the
uncertainty associated with the RFM can be safely ignored. Relative formula masses quoted to 2 decimal places can also be found in the catalogues of chemical suppliers and on reagent bottles. Example 15 Oxalic acid [(COOH)2.2H2O] is a primary standard and, as such, can be used directly in making a standard solution. A sample of the oxalic acid was weighed by difference giving the following results: mass of weighing bottle + oxalic acid = 14.21 g mass of weighing bottle = 12.58 g The sample was dissolved in approximately 25 cm3 of deionised water contained in a beaker. The resulting solution plus rinsings from the beaker were transferred to a 250 cm3 class B volumetric flask. The solution was carefully made up to the graduation mark with deionised water. The flask was stoppered and inverted several times to ensure thorough mixing. From these data, calculate the concentration of the resulting oxalic acid solution and its absolute uncertainty. mass of oxalic acid = 14.21 – 12.58 = 1.63 g RFM of oxalic acid = 126.07 Number of moles of oxalic acid
= 0.01293 mol Notice here that we are carrying an extra digit beyond the last significant figure – this is done because it is an intermediate result. Concentration of oxalic acid = 0.0517 mol l–1
1.63=
126.07
n=
V
0.01293=
0.2500

ERRORS
CHEMISTRY 37
Uncertainty calculation Working out the mass of oxalic acid involved a subtraction. This implies that we must add the absolute uncertainties in the mass readings in order to find the uncertainty in the mass of oxalic acid. Since a balance reading to 2 decimal places has been used, the uncertainty in each mass reading must be ±0.01 g. Hence, absolute uncertainty in mass of oxalic acid = 0.01 + 0.01 = 0.02 g Since the rest of the calculation involved divisions, the overall percentage uncertainty in the concentration of the oxalic acid solution is obtained by summing the individual percentage uncertainties. Hence, percentage uncertainty in mass of oxalic acid Since a 250 cm3 class B volumetric flask with an uncertainty of ±0.30 cm3 (see page 27) was used, then percentage uncertainty in volume of oxalic acid solution The RFM of oxalic acid has been quoted to 2 decimal places and so its percentage uncertainty (0.008%) is tiny compared with the others – we are therefore justified in ignoring it. Thus, percentage uncertainty in concentration of oxalic acid solution = 1.23 + 0.12 = 1.35 % absolute uncertainty in concentration of oxalic acid solution = 0.00070 mol l–1
Hence,
concentration of oxalic acid = 0.0517±0.0007 mol l–1
0.02= 100 = 1.23%
1.63!
0.30= 100 = 0.12%
250.00!
1.35= 0.0517
100!
ERRORS
38 CHEMISTRY
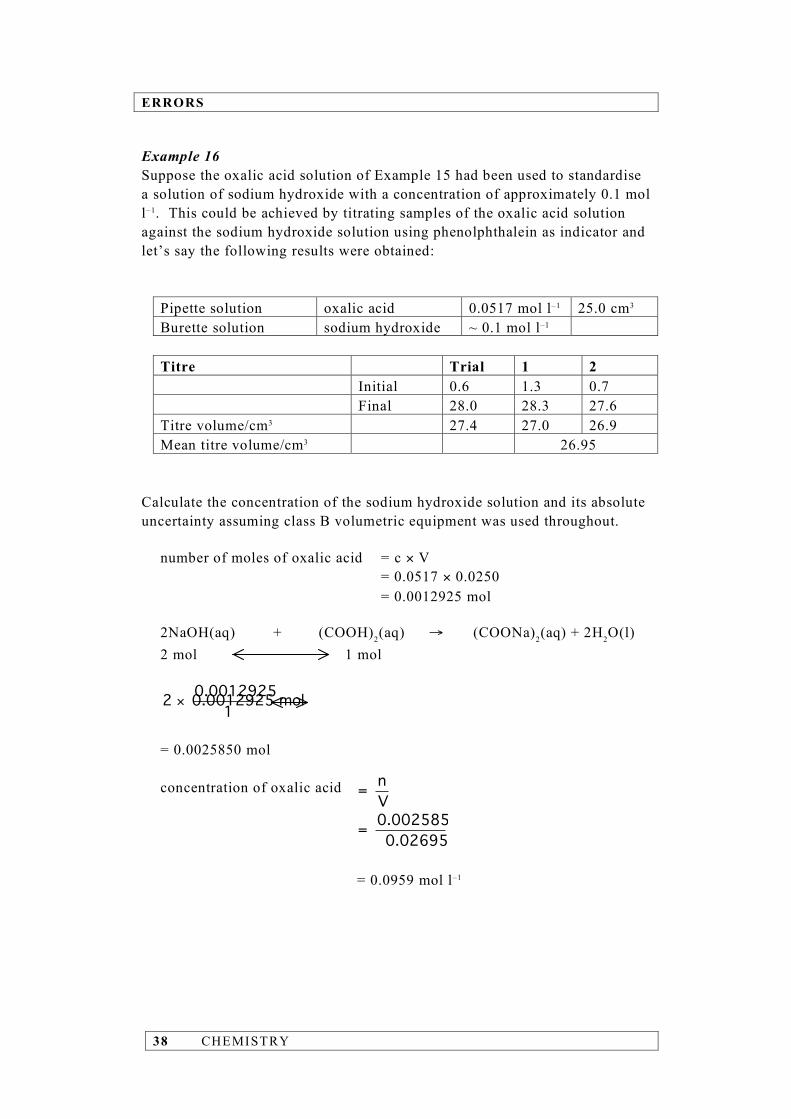
Example 16 Suppose the oxalic acid solution of Example 15 had been used to standardise a solution of sodium hydroxide with a concentration of approximately 0.1 mol l–1. This could be achieved by titrating samples of the oxalic acid solution against the sodium hydroxide solution using phenolphthalein as indicator and let’s say the following results were obtained:
Pipette solution oxalic acid 0.0517 mol l–1 25.0 cm3 Burette solution sodium hydroxide ~ 0.1 mol l–1
Titre Trial 1 2 Initial 0.6 1.3 0.7 Final 28.0 28.3 27.6 Titre volume/cm3 27.4 27.0 26.9 Mean titre volume/cm3 26.95
Calculate the concentration of the sodium hydroxide solution and its absolute uncertainty assuming class B volumetric equipment was used throughout. number of moles of oxalic acid = c × V = 0.0517 × 0.0250 = 0.0012925 mol 2NaOH(aq) + (COOH)2(aq) → (COONa)2(aq) + 2H2O(l) 2 mol 1 mol
0.00129252 0.0012925 mol
1!
= 0.0025850 mol concentration of oxalic acid = 0.0959 mol l–1
n=
V
0.0025850=
0.02695

ERRORS
CHEMISTRY 39
Uncertainty calculation From the previous example, percentage uncertainty in concentration of oxalic acid = 1.35 % Since the uncertainty in a 25 cm3 class B pipette is ±0.06 cm3, then percentage uncertainty in volume of oxalic acid Since the uncertainty arising from a 50 cm3 class B burette is ±0.10 cm3 and the uncertainty in estimating the end-point of the titration is ±0.05 cm3, then absolute uncertainty in titre volume percentage uncertainty in titre volume Since the calculation to determine the concentration of sodium hydroxide involves only multiplication and division, the overall percentage uncertainty in the concentration of the sodium hydroxide is obtained by summing the individual percentage uncertainties. Hence, percentage uncertainty in concentration of sodium hydroxide = 1.35 + 0.24 + 0.56 = 2.15% absolute uncertainty in concentration of sodium hydroxide = 0.00206 mol l–1 Thus,
concentration of sodium hydroxide = 0.096±0.002 mol l–1
0.06= 100 = 0.24%
25.00!
3
= 0.10 + 0.05
= 0.15cm
0.15= 100 = 0.56%
26.95!
–1
2.15= 0.0959
100
= 0.00206moll
!
ERRORS
40 CHEMISTRY
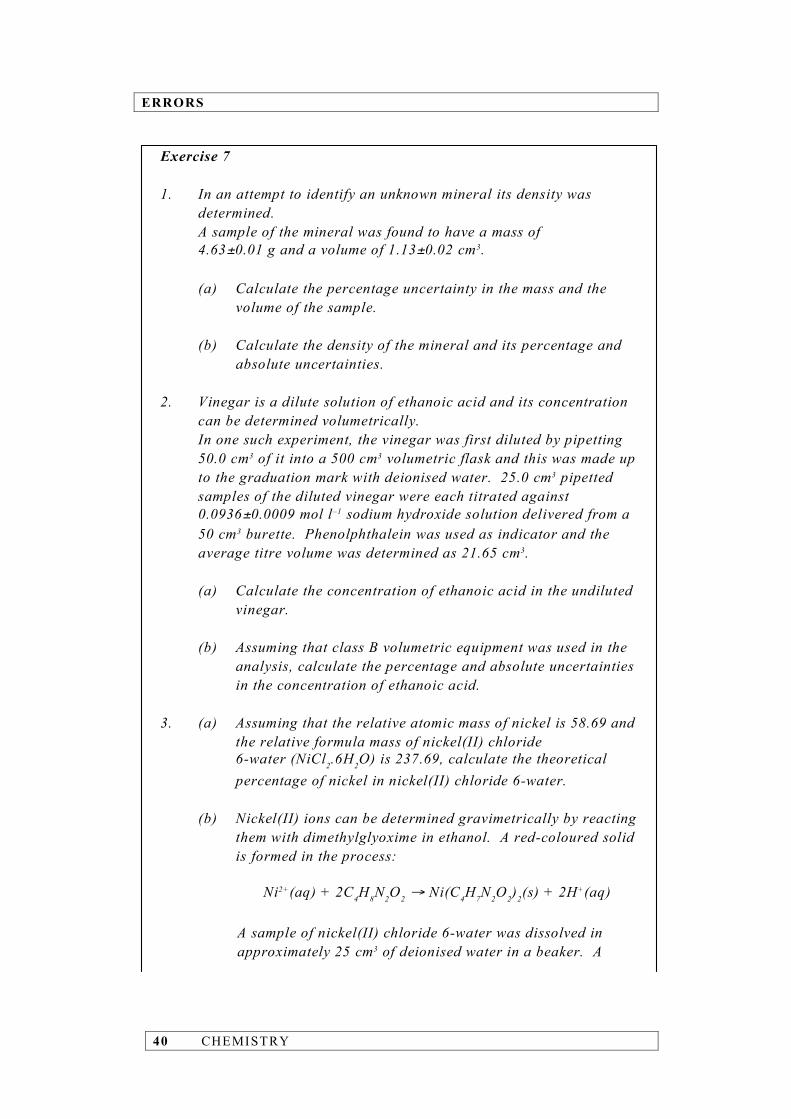
Exercise 7 1. In an attempt to identify an unknown mineral its density was
determined. A sample of the mineral was found to have a mass of 4.63±0.01 g and a volume of 1.13±0.02 cm3.
(a) Calculate the percentage uncertainty in the mass and the volume of the sample.
(b) Calculate the density of the mineral and its percentage and
absolute uncertainties.
2. Vinegar is a dilute solution of ethanoic acid and its concentration can be determined volumetrically.
In one such experiment, the vinegar was first diluted by pipetting 50.0 cm3 of it into a 500 cm3 volumetric flask and this was made up to the graduation mark with deionised water. 25.0 cm3 pipetted samples of the diluted vinegar were each titrated against 0.0936±0.0009 mol l–1 sodium hydroxide solution delivered from a 50 cm3 burette. Phenolphthalein was used as indicator and the average titre volume was determined as 21.65 cm3.
(a) Calculate the concentration of ethanoic acid in the undiluted
vinegar. (b) Assuming that class B volumetric equipment was used in the
analysis, calculate the percentage and absolute uncertainties in the concentration of ethanoic acid.
3. (a) Assuming that the relative atomic mass of nickel is 58.69 and
the relative formula mass of nickel(II) chloride 6-water (NiCl2.6H2O) is 237.69, calculate the theoretical
percentage of nickel in nickel(II) chloride 6-water. (b) Nickel(II) ions can be determined gravimetrically by reacting
them with dimethylglyoxime in ethanol. A red-coloured solid is formed in the process:
Ni2+(aq) + 2C4H8N2O2 → Ni(C4H7N2O2)2(s) + 2H+(aq)
A sample of nickel(II) chloride 6-water was dissolved in approximately 25 cm3 of deionised water in a beaker. A
ERRORS
CHEMISTRY 41
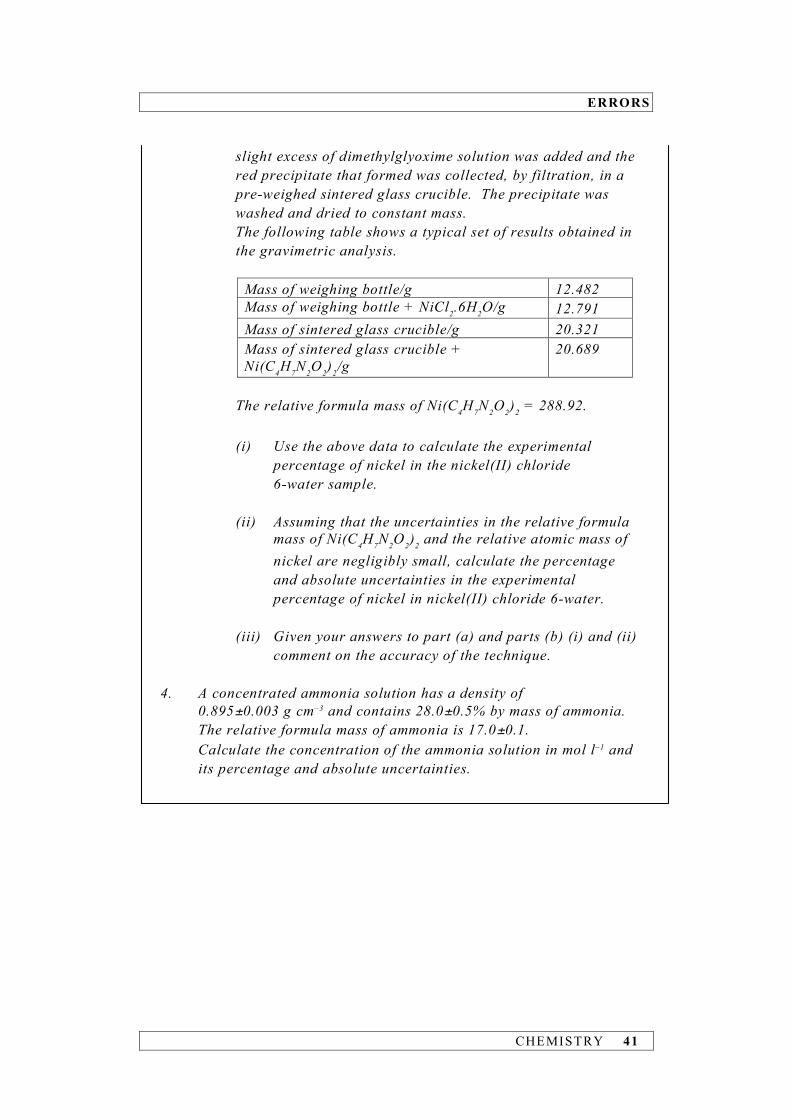
slight excess of dimethylglyoxime solution was added and the red precipitate that formed was collected, by filtration, in a pre-weighed sintered glass crucible. The precipitate was washed and dried to constant mass. The following table shows a typical set of results obtained in the gravimetric analysis.
Mass of weighing bottle/g 12.482 Mass of weighing bottle + NiCl2.6H2O/g 12.791 Mass of sintered glass crucible/g 20.321 Mass of sintered glass crucible + Ni(C4H7N2O2)2/g
20.689
The relative formula mass of Ni(C4H7N2O2)2 = 288.92. (i) Use the above data to calculate the experimental
percentage of nickel in the nickel(II) chloride 6-water sample. (ii) Assuming that the uncertainties in the relative formula
mass of Ni(C4H7N2O2)2 and the relative atomic mass of nickel are negligibly small, calculate the percentage and absolute uncertainties in the experimental percentage of nickel in nickel(II) chloride 6-water.
(iii) Given your answers to part (a) and parts (b) (i) and (ii)
comment on the accuracy of the technique.
4. A concentrated ammonia solution has a density of 0.895±0.003 g cm–3 and contains 28.0±0.5% by mass of ammonia.
The relative formula mass of ammonia is 17.0±0.1. Calculate the concentration of the ammonia solution in mol l–1 and
its percentage and absolute uncertainties.

ERRORS
CHEMISTRY 42
CHEMICAL ANALYSIS
CHEMISTRY 43
SECTION 5 Chemical Analysis Qualitative and quantitative analysis There are two types of chemical analysis: qualitative and quantitative. Qualitative analysis is the process of identifying what is in a chemical sample whereas quantitative analysis is the process of measuring how much is in the sample. In this section we are concerned with methods of quantitative analysis. Volumetric analysis As the name implies, volumetric analysis relies on methods involving the accurate measurement of volumes of solutions, although at times mass measurements may also be required. Essentially, we measure the volume of a standard solution (one of accurately known concentration) needed to react exactly with a known volume of another solution (one of unknown concentration) in a chemical reaction for which the balanced chemical equation is known. From the data, we are then in a position to calculate the accurate concentration of the other solution. In practical terms, volumetric analysis is achieved by a titration procedure and this is why volumetric analysis is often referred to as titrimetric analysis. In a titration, one of the solutions is added from a burette to a pipetted volume of the other solution contained in a conical flask. The point at which the reaction between the two is just complete is usually detected by adding a suitable indicator to the solution in the flask. It is customary, although not essential, to have the standard solution in the burette and the solution of unknown concentration, often referred to as the analyte, in the flask. The solution in the burette, be it the standard solution or the analyte, is called the titrant. There are numerous types of titration but the most common are: • acid–base titrations, which are based on neutralisation reactions, • redox titrations, which are based on oxidation–reduction reactions • complexometric titrations, which are based on complex-formation
reactions.

CHEMICAL ANALYSIS
44 CHEMISTRY
The principal requirements of a titration reaction are that it goes to completion and that it proceeds rapidly. Standard solutions As mentioned above, a standard solution is one of accurately known concentration and it can be prepared directly from a solute if that solute is a primary standard. To be suitable as a primary standard, a substance has to meet a number of requirements. • It must have a high purity. This is to ensure that the mass of the sample
weighed out is composed entirely of the substance itself and nothing else. If it contained impurities then the true mass of substance present would be less than the measured mass and this in turn would lead to the solution having a concentration less than the calculated value.
• It must be stable in air and in solution. If this were not the case then
some of the substance would be used up in reacting with chemicals in the air or with the solvent. Consequently, the true concentration of the resulting solution would be less than its calculated value.
• It must be readily soluble in a solvent (normally water) and its solubility
should be reasonably high so that solutions of relatively high concentrations can be prepared.
• It should have a reasonably large relative formula mass in order to
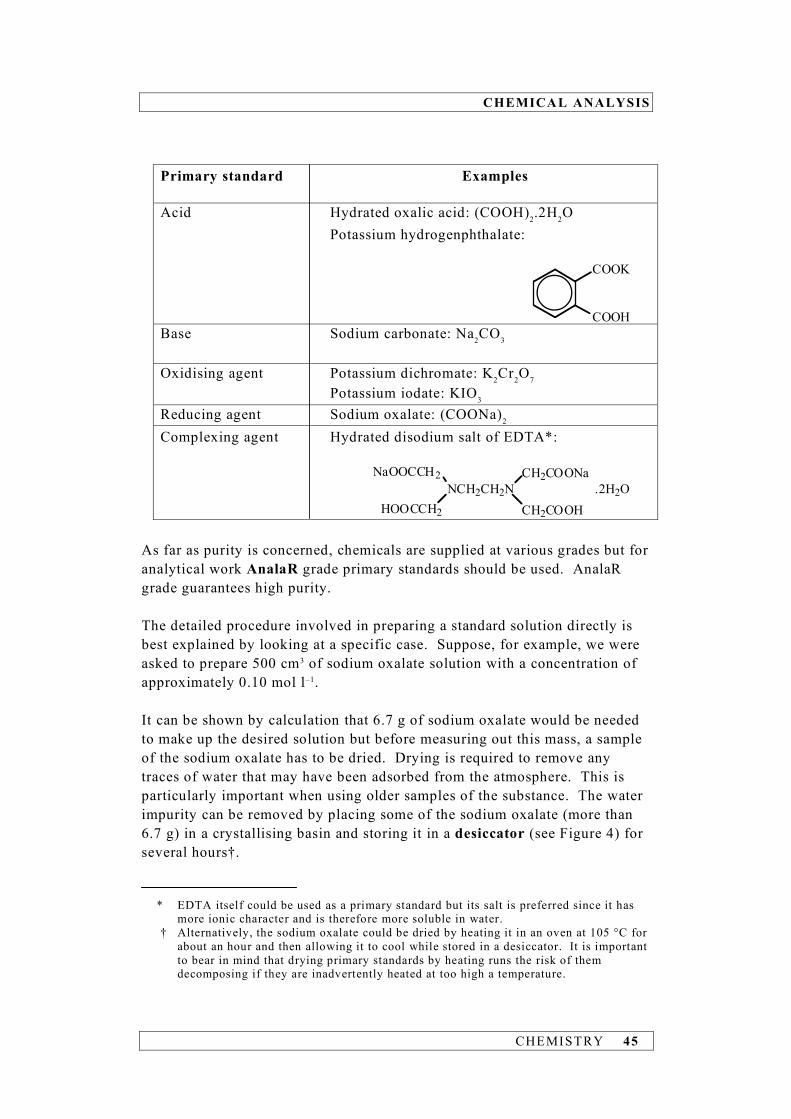
minimise the percentage uncertainty in the mass of substance weighed out. Substances that meet or even approach these criteria are very few and this is why a limited number of primary standards are available to the chemist. Some examples of acids, bases, oxidising, reducing and complexing agents which are used as primary standards are detailed in the following table.
CHEMICAL ANALYSIS
CHEMISTRY 45
Primary standard Examples Acid Hydrated oxalic acid: (COOH)2.2H2O Potassium hydrogenphthalate:
COOK
COOH Base Sodium carbonate: Na2CO3
Oxidising agent Potassium dichromate: K2Cr2O7 Potassium iodate: KIO3 Reducing agent Sodium oxalate: (COONa)2
Complexing agent Hydrated disodium salt of EDTA*:
NCH2CH2N
CH2COONa
CH2COOH
NaOOCCH2
HOOCCH2
.2H2O
As far as purity is concerned, chemicals are supplied at various grades but for analytical work AnalaR grade primary standards should be used. AnalaR grade guarantees high purity. The detailed procedure involved in preparing a standard solution directly is best explained by looking at a specific case. Suppose, for example, we were asked to prepare 500 cm3 of sodium oxalate solution with a concentration of approximately 0.10 mol l–1. It can be shown by calculation that 6.7 g of sodium oxalate would be needed to make up the desired solution but before measuring out this mass, a sample of the sodium oxalate has to be dried. Drying is required to remove any traces of water that may have been adsorbed from the atmosphere. This is particularly important when using older samples of the substance. The water impurity can be removed by placing some of the sodium oxalate (more than 6.7 g) in a crystallising basin and storing it in a desiccator (see Figure 4) for several hours†. * EDTA itself could be used as a primary standard but its salt is preferred since it has
more ionic character and is therefore more soluble in water. † Alternatively, the sodium oxalate could be dried by heating it in an oven at 105 °C for
about an hour and then allowing it to cool while stored in a desiccator. It is important to bear in mind that drying primary standards by heating runs the risk of them decomposing if they are inadvertently heated at too high a temperature.

CHEMICAL ANALYSIS
46 CHEMISTRY
Figure 4
A desiccator is a closed vessel that contains a drying agent, known as a desiccant, in its base. Desiccants include phosphorus pentoxide, anhydrous calcium chloride and concentrated sulphuric acid but the one that is most commonly used is self-indicating silica gel: it is blue when dry and turns pink when it absorbs moisture. An airtight seal is maintained in the desiccator by lightly greasing the ground glass surfaces on the lid and base. Once the sodium oxalate is dry, the next step in the process is to weigh out accurately, approximately 6.7 g. The expression ‘accurately, approximately’ may sound ambiguous and contradictory but what it means is that while the mass of sodium oxalate has to be known accurately, it doesn’t need to be exactly 6.7 g – just close to it. It is good practice to use a weighing bottle (see Figure 5) when weighing out samples of primary standards. There are various types and the one illustrated below is a cylindrical glass container fitted with a ground-glass stopper. Figure 5
The weighing technique described below is known as weighing by difference for reasons that will become obvious.
CHEMICAL ANALYSIS
CHEMISTRY 47
A clean, dry weighing bottle is first weighed empty and then, using a spatula, between 6.5 g and 6.9 g of dry sodium oxalate is added to it. The accurate mass of the weighing bottle and its contents is then measured and recorded. The next step is to transfer the sodium oxalate from the bottle to a clean glass beaker containing some deionised water. Gentle tapping on the base of the weighing bottle will ensure that the bulk of the sample is transferred but it is unimportant if traces of the sample remain. Finally, the weighing bottle and any residual material are accurately weighed and the mass recorded. The accurate mass of sodium oxalate transferred is the difference between the two recorded masses. Throughout the weighing process it is important that the stopper be removed from the weighing bottle only when necessary. This reduces the time the sample is exposed to the open atmosphere and so minimises the chances of it re-adsorbing water. A balance reading to 0.01 g should be adequate in weighing out samples of primary standards but if greater accuracy is required then a balance reading to 3 decimal places should be used. With the sodium oxalate successfully transferred to the beaker of deionised water, the mixture can be stirred to aid dissolving*. A glass rod should be used and not a spatula since the latter may react with the solution and contaminate it. On removing the stirring rod make sure you wash the sodium oxalate solution from its surface back into the beaker. A wash bottle can be used to achieve this. Once the sodium oxalate has dissolved, the resulting solution is carefully poured into a 500 cm3 volumetric flask via a filter funnel resting in the neck of the flask. Both the flask and the funnel must be clean but neither need be dry just so long as they are wet with deionised water. Using a wash bottle, the interior surface of the beaker should then be washed with deionised water and the washings transferred to the flask as before. The washing process ought to be repeated at least two more times – this is to ensure that all of the sodium oxalate is transferred to the flask and that no trace of it is left in the beaker. Deionised water is then added directly to the flask until the level of the solution is within about 1 cm of the graduation mark. With the funnel removed, deionised
• The dissolving process could also be hastened by heating the mixture but before transferring the resulting solution to a volumetric flask, it would have to be cooled. Otherwise, the hot solution would cause the volumetric flask to expand, making its volume marginally greater than that stated.

CHEMICAL ANALYSIS
48 CHEMISTRY
water is carefully added from a dropper until the bottom of the meniscus is level with the graduation mark. During this last operation you should hold a white tile or a piece of white paper behind the neck of the flask – this will help you to see the meniscus more clearly. You must also make sure that the graduation mark is at eye level to avoid error due to parallax. The flask should then be stoppered and inverted repeatedly to ensure the solution is thoroughly mixed and is of uniform concentration. The sodium oxalate solution is finally transferred to a clean, dry reagent bottle. If the reagent bottle happens to be wet with deionised water, then it must first be rinsed with a little of the sodium oxalate solution before the bulk of the solution is transferred to it. Were it not rinsed, then the solution would be diluted by the water, making its true concentration slightly less than the calculated value. Titrations Once a standard solution has been prepared, we can use it to determine the accurate concentration of another solution. This is achieved by titration – a procedure whereby one of the solutions is slowly added from a burette to a pipetted volume of the other until reaction between the two is just complete. Again, the details of the procedure are best illustrated by considering a particular example. Let’s say we wanted to determine the concentration of a given potassium permanganate solution. The first decision to be made is to identify a reagent that could be used to titrate against the potassium permanganate solution. Since the latter is an oxidising agent, a standard solution of a reducing agent, e.g. sodium oxalate, would be needed. It is customary to have the standard solution in the burette and in this case, that would be the sodium oxalate solution. However, for reasons that will be explained later, the burette solution will be the potassium permanganate solution. A clean 50 cm3 burette has first to be rinsed with the potassium permanganate solution. A small portion (5 to 10 cm3) is all that needs to be added. The burette is tilted almost to a horizontal position and rotated to make sure that the potassium permanganate solution wets the entire inner surface. The burette tip is rinsed by draining the ‘rinse’ solution through it. It is good practice to repeat the rinsing procedure at least one more time – this ensures that all impurities adhering to the inner surface are washed away. Remember to discard the rinsings down the sink – don’t return them to the stock solution since they will
CHEMICAL ANALYSIS
CHEMISTRY 49
contaminate it. The burette is then filled with the potassium permanganate solution up to the region of the zero mark and the tip is filled by opening the tap for a second or two. If any air bubbles are lodged in the tip they can be eliminated by momentarily draining the burette with the tap wide open. Now that the burette has been rinsed and filled, the next task is to transfer 25.0 cm3 of sodium oxalate solution to a clean conical flask. A 25.0 cm3 pipette is used and like the burette it too has to be rinsed. This is done by drawing* a small volume (approximately 5 cm3) of the sodium oxalate solution into the pipette and wetting its inner surface by tilting and rotating it. The ‘rinse’ solution is then allowed to drain through the tip and is discarded. After repeating the rinsing procedure, the pipette is filled with the sodium oxalate solution to a point above the graduation mark. With the pipette held vertically and with the eye exactly level with the graduation mark, the solution is allowed to slowly drain until the bottom of the meniscus is coincident with the graduation mark. Holding a white tile or a piece of white paper behind the stem of the pipette helps to define the meniscus more clearly. With the pipette tip placed well within the conical flask the sodium oxalate solution is run into the flask. When free flow ceases, the tip should be touched against the inner wall of the flask to allow some of the remaining solution to drain. A tiny volume of solution will still be retained inside the tip but no attempt should be made to expel it since, at that point, the pipette will have delivered exactly 25.0 cm3 of sodium oxalate solution. Incidentally, if the conical flask had initially been rinsed with deionised water and was still wet before the sodium oxalate solution had been added to it, then no problem results – although the solution would be diluted, the number of moles of sodium oxalate present would not change and this is the critical factor. Prior to carrying out this particular titration between sodium oxalate and potassium permanganate, about 25 cm3 of dilute sulphuric acid must be added to the sodium oxalate solution in the conical flask. The reason for this is that hydrogen ions must be present if the permanganate ions are to be reduced:
MnO4–(aq) + 8H+(aq) + 5e– → Mn2+(aq) + 4H2O(l)
* To draw solutions into a pipette, a pipette filler must be used. On no account should you use your mouth to suck up the solution.
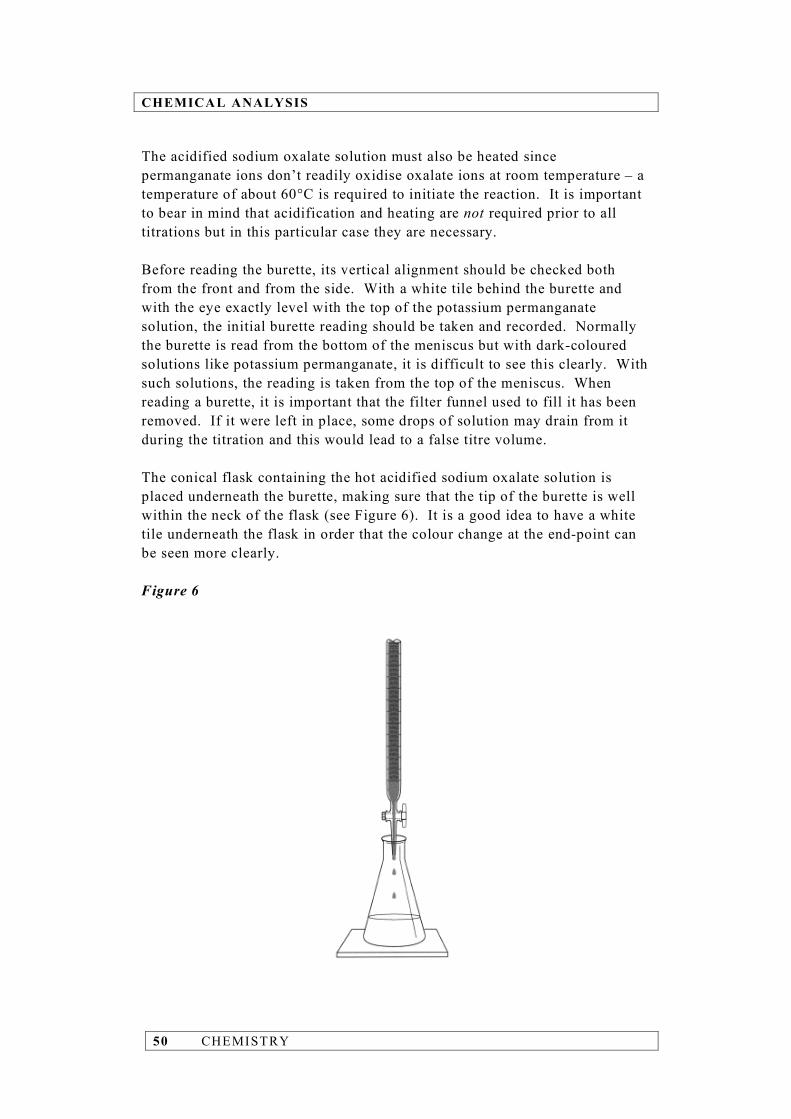
CHEMICAL ANALYSIS
50 CHEMISTRY
The acidified sodium oxalate solution must also be heated since permanganate ions don’t readily oxidise oxalate ions at room temperature – a temperature of about 60°C is required to initiate the reaction. It is important to bear in mind that acidification and heating are not required prior to all titrations but in this particular case they are necessary. Before reading the burette, its vertical alignment should be checked both from the front and from the side. With a white tile behind the burette and with the eye exactly level with the top of the potassium permanganate solution, the initial burette reading should be taken and recorded. Normally the burette is read from the bottom of the meniscus but with dark-coloured solutions like potassium permanganate, it is difficult to see this clearly. With such solutions, the reading is taken from the top of the meniscus. When reading a burette, it is important that the filter funnel used to fill it has been removed. If it were left in place, some drops of solution may drain from it during the titration and this would lead to a false titre volume. The conical flask containing the hot acidified sodium oxalate solution is placed underneath the burette, making sure that the tip of the burette is well within the neck of the flask (see Figure 6). It is a good idea to have a white tile underneath the flask in order that the colour change at the end-point can be seen more clearly. Figure 6

CHEMICAL ANALYSIS
CHEMISTRY 51
The titrations can now begin and the first can be a rough one. Its purpose is to enable you to see what colour change occurs at the end-point and to provide you with an approximate titre volume. In the rough titration, portions of the potassium permanganate solution, about 1 cm3 at a time, are run from the burette into the conical flask. During and after the addition of each portion, the contents of the flask should be swirled – this helps the mixing process and gives the reactants time to react. These 1 cm3 additions are continued until the end-point is reached. In this case, the end-point will be indicated by the flask solution turning from colourless to pink. The final burette reading can then be recorded. If the end-point proves to be difficult, it is worthwhile keeping the rough titrated mixture to aid the detection of end-points in subsequent titrations. A second but more accurate titration can now be performed. 25.0 cm3 of the sodium oxalate solution is pipetted into a clean conical flask along with about 25 cm3 of dilute sulphuric acid and the mixture is heated. The burette is refilled with potassium permanganate solution and the initial reading recorded. Suppose the rough titre volume had been 21 cm3. This means that in the second titration it would be safe to add about 19.5 cm3 of potassium permanganate solution quite rapidly without any danger of over-shooting the end-point. But care must be taken to ensure that the rate of delivery is not too fast otherwise the burette may not drain cleanly. This would leave drops of solution adhering to the walls of the burette, which in turn would lead to an inaccurate titre volume. The titration is completed by adding the potassium permanganate solution very slowly, drop by drop, while vigorously swirling the contents of the flask. The closer you get to the end-point the longer it will take for the purple permanganate ions to be reduced to colourless manganese(II) ions and so it is important that you wait for the flask solution to turn colourless before adding another drop of potassium permanganate solution. The end-point is finally reached when the first trace of a permanent pink colour in the flask solution is detected. The final burette reading should then be recorded. Should any potassium permanganate solution splash onto the walls of the conical flask during the titration wash it into the solution with deionised water from a wash bottle. You may also find a drop of potassium permanganate solution hanging from the tip of the burette and if this happens near the end-point, it should be removed by touching the tip to the wall of the flask and washing it into the solution.
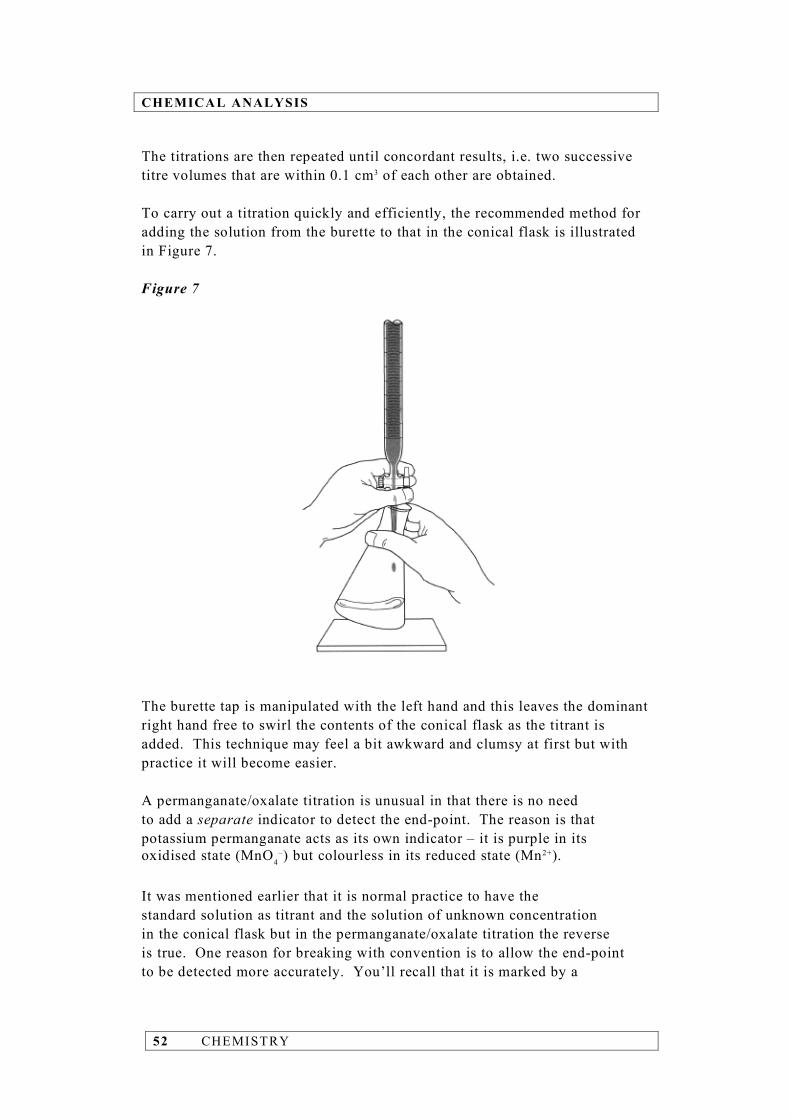
CHEMICAL ANALYSIS
52 CHEMISTRY
The titrations are then repeated until concordant results, i.e. two successive titre volumes that are within 0.1 cm3 of each other are obtained. To carry out a titration quickly and efficiently, the recommended method for adding the solution from the burette to that in the conical flask is illustrated in Figure 7. Figure 7
The burette tap is manipulated with the left hand and this leaves the dominant right hand free to swirl the contents of the conical flask as the titrant is added. This technique may feel a bit awkward and clumsy at first but with practice it will become easier. A permanganate/oxalate titration is unusual in that there is no need to add a separate indicator to detect the end-point. The reason is that potassium permanganate acts as its own indicator – it is purple in its oxidised state (MnO4
–) but colourless in its reduced state (Mn2+). It was mentioned earlier that it is normal practice to have the standard solution as titrant and the solution of unknown concentration in the conical flask but in the permanganate/oxalate titration the reverse is true. One reason for breaking with convention is to allow the end-point to be detected more accurately. You’ll recall that it is marked by a

CHEMICAL ANALYSIS
CHEMISTRY 53
colour change, colourless to pink, and it is simply much easier to see a colour appear than to see it disappear. You will also remember that the sodium oxalate solution had to be heated before it was titrated and since it would be impractical to have a hot solution in the burette, this is yet another reason for breaking with convention. Of course, the potassium permanganate solution could have been heated rather than the sodium oxalate solution but potassium permanganate is unstable and decomposes on heating. Let’s remind ourselves of the purpose of a titration. Ideally what we seek in a titration is the equivalence or stoichiometric point. This occurs when the quantity of reagent added from the burette is the exact amount necessary for stoichiometric reaction with the amount of reagent present in the conical flask. In our permanganate/oxalate titration, for example, the stoichiometric equation for the reaction taking place is:
5C2O42– + 2MnO4
– + 16H+ → 10CO2 + 2Mn2+ + 8H2O So, if 0.0025 mol of oxalate ions were present in the conical flask, the equivalence point would reached when exactly 0.0010 mol of permanganate ions were added from the burette. In practice, what we actually measure in a titration is the end-point and not the equivalence point and there is a subtle difference between the two. Take the permanganate/oxalate titration again. Up to and including the equivalence point all the permanganate ions added from the burette are consumed by the oxalate ions and the flask solution remains colourless. It is the first trace of a permanent pink colour that marks the end-point of the titration and for this colour to be exhibited extra permanganate ions, beyond those needed to react with the oxalate ions, are required. Hence, the end-point of a titration can never coincide with the equivalence point but the more acute your eyesight the closer the end-point will be to the equivalence point. The permanganate/oxalate titration we’ve used to illustrate the general aspects of titrimetry is an example of a redox titration since it is based on a reduction/oxidation reaction – the permanganate ions are reduced while the oxalate ions are oxidised. In general, redox titrations are used to determine oxidising agents by titrating them against standard solutions of reducing agents and vice versa. The most common type of titration and the one with which you will be most familiar is the acid–base titration. Here, the titration reaction is simply a neutralization in which protons are transferred from acid to base. The other type of titration you'll encounter in the Advanced Higher course is the
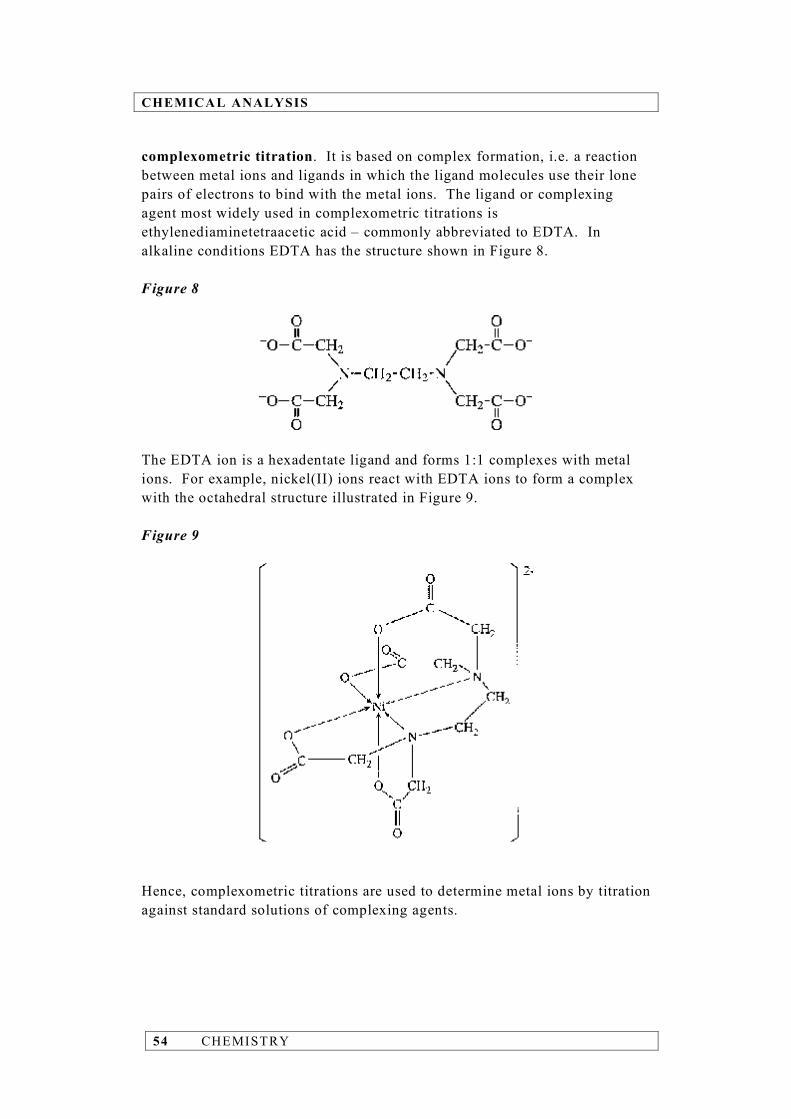
CHEMICAL ANALYSIS
54 CHEMISTRY
complexometric titration. It is based on complex formation, i.e. a reaction between metal ions and ligands in which the ligand molecules use their lone pairs of electrons to bind with the metal ions. The ligand or complexing agent most widely used in complexometric titrations is ethylenediaminetetraacetic acid – commonly abbreviated to EDTA. In alkaline conditions EDTA has the structure shown in Figure 8. Figure 8
The EDTA ion is a hexadentate ligand and forms 1:1 complexes with metal ions. For example, nickel(II) ions react with EDTA ions to form a complex with the octahedral structure illustrated in Figure 9. Figure 9
Hence, complexometric titrations are used to determine metal ions by titration against standard solutions of complexing agents.
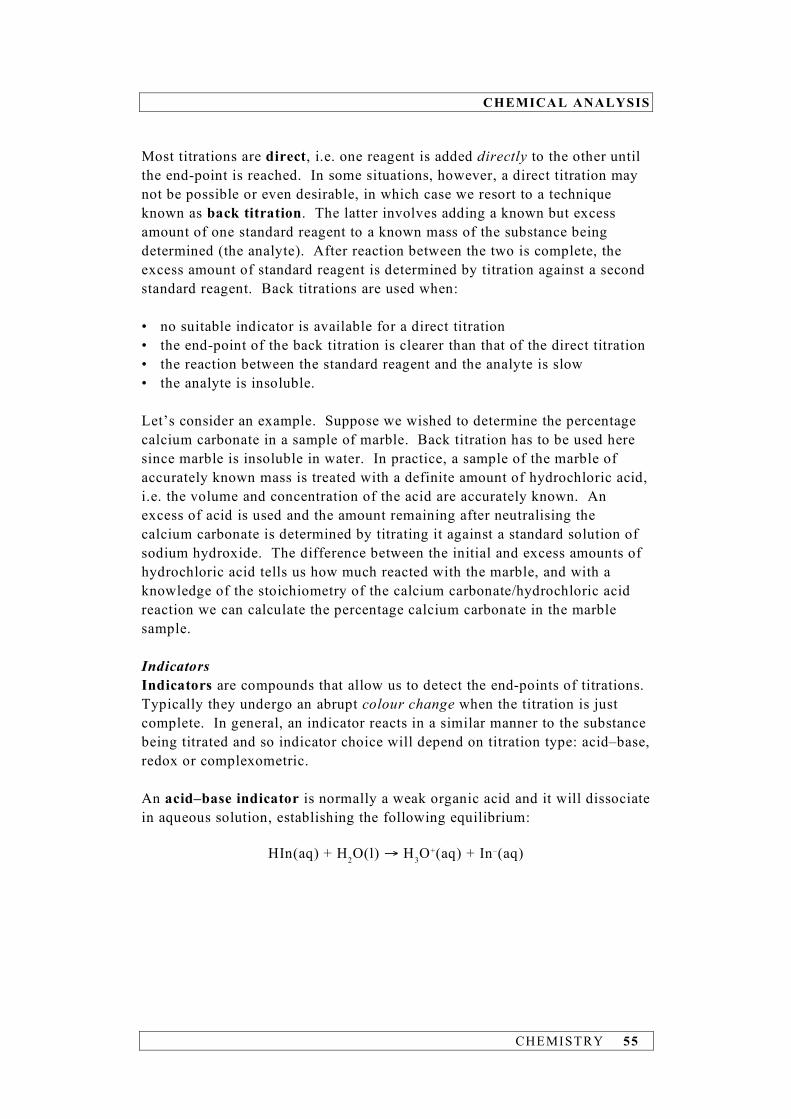
CHEMICAL ANALYSIS
CHEMISTRY 55
Most titrations are direct, i.e. one reagent is added directly to the other until the end-point is reached. In some situations, however, a direct titration may not be possible or even desirable, in which case we resort to a technique known as back titration. The latter involves adding a known but excess amount of one standard reagent to a known mass of the substance being determined (the analyte). After reaction between the two is complete, the excess amount of standard reagent is determined by titration against a second standard reagent. Back titrations are used when: • no suitable indicator is available for a direct titration • the end-point of the back titration is clearer than that of the direct titration • the reaction between the standard reagent and the analyte is slow • the analyte is insoluble. Let’s consider an example. Suppose we wished to determine the percentage calcium carbonate in a sample of marble. Back titration has to be used here since marble is insoluble in water. In practice, a sample of the marble of accurately known mass is treated with a definite amount of hydrochloric acid, i.e. the volume and concentration of the acid are accurately known. An excess of acid is used and the amount remaining after neutralising the calcium carbonate is determined by titrating it against a standard solution of sodium hydroxide. The difference between the initial and excess amounts of hydrochloric acid tells us how much reacted with the marble, and with a knowledge of the stoichiometry of the calcium carbonate/hydrochloric acid reaction we can calculate the percentage calcium carbonate in the marble sample. Indicators Indicators are compounds that allow us to detect the end-points of titrations. Typically they undergo an abrupt colour change when the titration is just complete. In general, an indicator reacts in a similar manner to the substance being titrated and so indicator choice will depend on titration type: acid–base, redox or complexometric. An acid–base indicator is normally a weak organic acid and it will dissociate in aqueous solution, establishing the following equilibrium:
HIn(aq) + H2O(l) → H3O+(aq) + In–(aq)

CHEMICAL ANALYSIS
56 CHEMISTRY
It is able to act as an indicator because it has one colour in its acid form (HIn, where In stands for indicator) and a different colour in its conjugate-base form (In–). The colour difference is due to the fact that HIn and In– have slightly different structures and therefore absorb and consequently transmit different wavelengths of the visible spectrum. Examination of the following table, in which the properties of a selection of some common indicators are presented, shows that an acid–base indicator changes colour over a range of about 1.5 pH units and not at a specific pH. Indicator HIn colour pH range of
colour change In– colour
Bromophenol blue yellow 3.0 – 4.6 blue Methyl red red 4.2 – 6.3 yellow Bromothymol blue yellow 6.0 – 7.6 blue Phenol red yellow 6.8 – 8.4 red Phenolphthalein colourless 8.3 – 10.0 pink Choosing an indicator for a titration depends on the type of acid–base reaction taking place. There are four different types and these are outlined in the following table together with the pH values at their equivalence points.
Acid–base reaction type pH at equivalence point Strong acid/strong base 7 Weak acid/strong base >7 Strong acid/weak base <7 Weak acid/weak base ~7
With the exception of the weak acid/weak base reaction, the pH changes very rapidly in the vicinity of the equivalence point and extends over several pH units. This implies that an indicator can be used to detect the end-point of an acid–base titration if its pH range of colour change falls within this region of rapid pH change. Consequently, of those indicators listed in the above table • bromothymol blue and phenol red would be the most suitable in strong
acid/strong base titrations • phenolphthalein would be appropriate for weak acid/strong base titrations • bromophenol blue and methyl red would be suitable in strong acid/weak
base titrations.
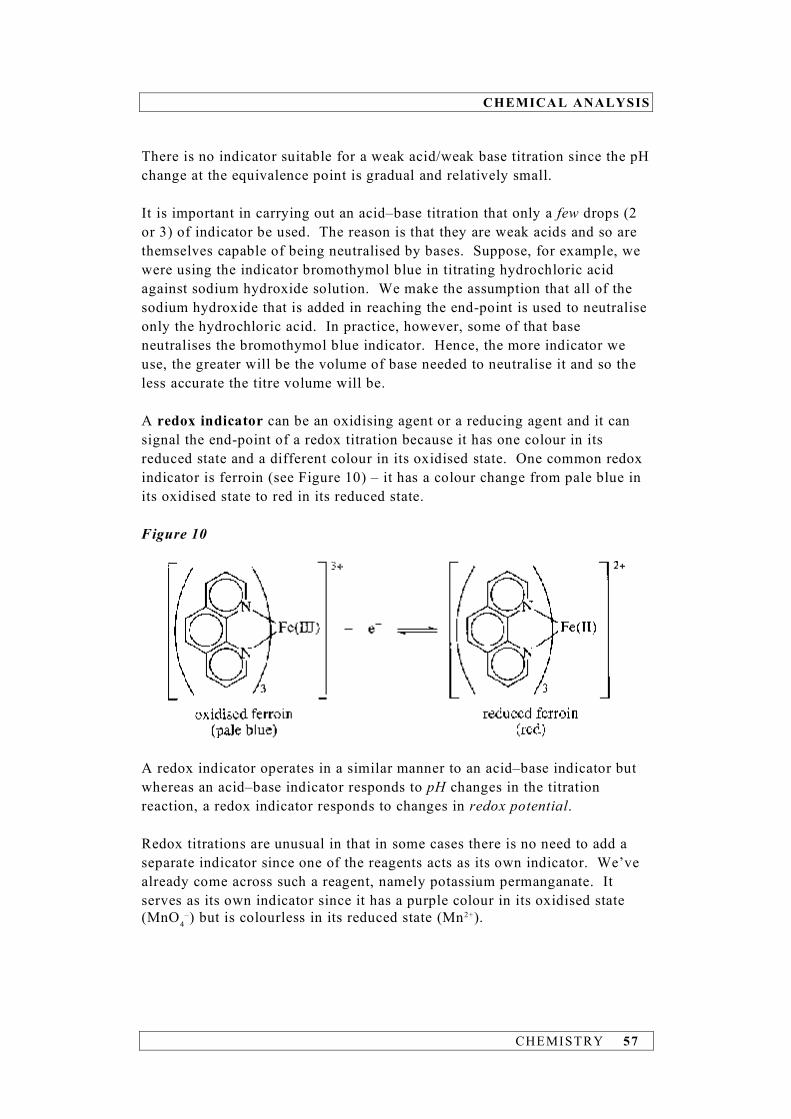
CHEMICAL ANALYSIS
CHEMISTRY 57
There is no indicator suitable for a weak acid/weak base titration since the pH change at the equivalence point is gradual and relatively small. It is important in carrying out an acid–base titration that only a few drops (2 or 3) of indicator be used. The reason is that they are weak acids and so are themselves capable of being neutralised by bases. Suppose, for example, we were using the indicator bromothymol blue in titrating hydrochloric acid against sodium hydroxide solution. We make the assumption that all of the sodium hydroxide that is added in reaching the end-point is used to neutralise only the hydrochloric acid. In practice, however, some of that base neutralises the bromothymol blue indicator. Hence, the more indicator we use, the greater will be the volume of base needed to neutralise it and so the less accurate the titre volume will be. A redox indicator can be an oxidising agent or a reducing agent and it can signal the end-point of a redox titration because it has one colour in its reduced state and a different colour in its oxidised state. One common redox indicator is ferroin (see Figure 10) – it has a colour change from pale blue in its oxidised state to red in its reduced state. Figure 10
A redox indicator operates in a similar manner to an acid–base indicator but whereas an acid–base indicator responds to pH changes in the titration reaction, a redox indicator responds to changes in redox potential. Redox titrations are unusual in that in some cases there is no need to add a separate indicator since one of the reagents acts as its own indicator. We’ve already come across such a reagent, namely potassium permanganate. It serves as its own indicator since it has a purple colour in its oxidised state (MnO4
–) but is colourless in its reduced state (Mn2+).
CHEMICAL ANALYSIS
58 CHEMISTRY
In theory, iodine should also fall into this self-indicating category since it is brown in its oxidised state (I2) and colourless in its reduced state (I–). In practice, however, the colour change is gradual and difficult to pin-point. The reason is that iodine molecules must be present in relatively high concentrations before their colour is discernible. But the problem can be solved by adding starch solution. Starch forms a blue-coloured complex with iodine molecules and even when the iodine concentration is relatively low, the blue colour is evident. When using iodine solution as the titrant, the starch is added to the reagent in the conical flask right at the outset of the titration and the end-point is signalled by the sharp colour change of colourless to blue. If, on the other hand, the iodine solution is being titrated, addition of the starch must be delayed otherwise the concentration of iodine molecules would be so high that some of them would bind permanently to the starch and would never be free to react with the titrant. The starch is therefore added once most of the iodine molecules have been reduced, i.e. when the initial brown colour of the solution has faded to a straw (very pale yellow) colour. On introducing the starch, the solution turns blue and the titration is complete when the blue colour just disappears. A freshly prepared starch solution must be used in iodine titrations. It decomposes quite rapidly and even in solutions that have partially hydrolysed, significant amounts of glucose will be present. The latter, being a reducing agent, will react with the iodine and cause error in the titre volume. Although starch can be used as an indicator in certain redox titrations, it is not, strictly speaking, a redox indicator because it responds specifically to the presence of iodine molecules and not to a change in redox potential. You’ll recollect that complexometric titrations are used to determine metal ions by titrating them against standard solutions of complexing agents. The end-points of such titrations can be detected by means of metal ion indicators. These are organic dyes which form coloured complexes with metal ions and to be suitable as indicators they must bind less strongly with metal ions than does the complexing agent. To explain how a metal ion indicator operates in a complexometric titration, it is best to consider a typical example. Suppose we had to determine magnesium ions by titration against EDTA. Eriochrome Black T is the most suitable indicator for this titration. In its free or

CHEMICAL ANALYSIS
CHEMISTRY 59
uncombined state, Eriochrome Black T is blue but when complexed with magnesium ions it is red. At the start of the titration a tiny amount of indicator (In) is added to the magnesium ions in the conical flask and the colourless solution turns red as the indicator complexes with the magnesium ions:
Mg2+(aq) + In(aq) → MgIn2+(aq) (colourless) (red) On adding EDTA from the burette, the EDTA ions react with the free magnesium ions:
Mg2+(aq) + EDTA4–(aq) → MgEDTA2–(aq) (colourless) (colourless) (colourless) Since the MgEDTA2– complex is colourless, the solution in the flask stays red and remains so right up to the end-point. Once all the free magnesium ions have been consumed, the EDTA ions pick off magnesium ions from the MgIn2+ complex and in so doing release the indicator in its free state. With the completion of this process the solution turns blue. The transition at the end-point can be described by the following equation:
MgIn2+(aq) + EDTA4–(aq) → MgEDTA2–(aq) + In(aq) (red) (colourless) (colourless) (blue) We can now appreciate why the MgIn2+ complex must be less stable than the MgEDTA2– complex. If this were not the case, the EDTA ions would be unable to remove magnesium ions from the MgIn2+ complex and the free indicator would never be released. Consequently, the solution would stay red and no colour change would be observed. It is equally important that the MgIn2+ complex should not be too unstable otherwise the colour change would be gradual and start long before the equivalence point had been reached. As with acid–base and redox titrations, only a minimal amount of metal ion indicator should be used if signicant error in the titre volume is to be avoided. If too much is added the colour change at the end-point would be gradual and occur over the addition of several drops of the complexing agent rather than the ideal one drop.
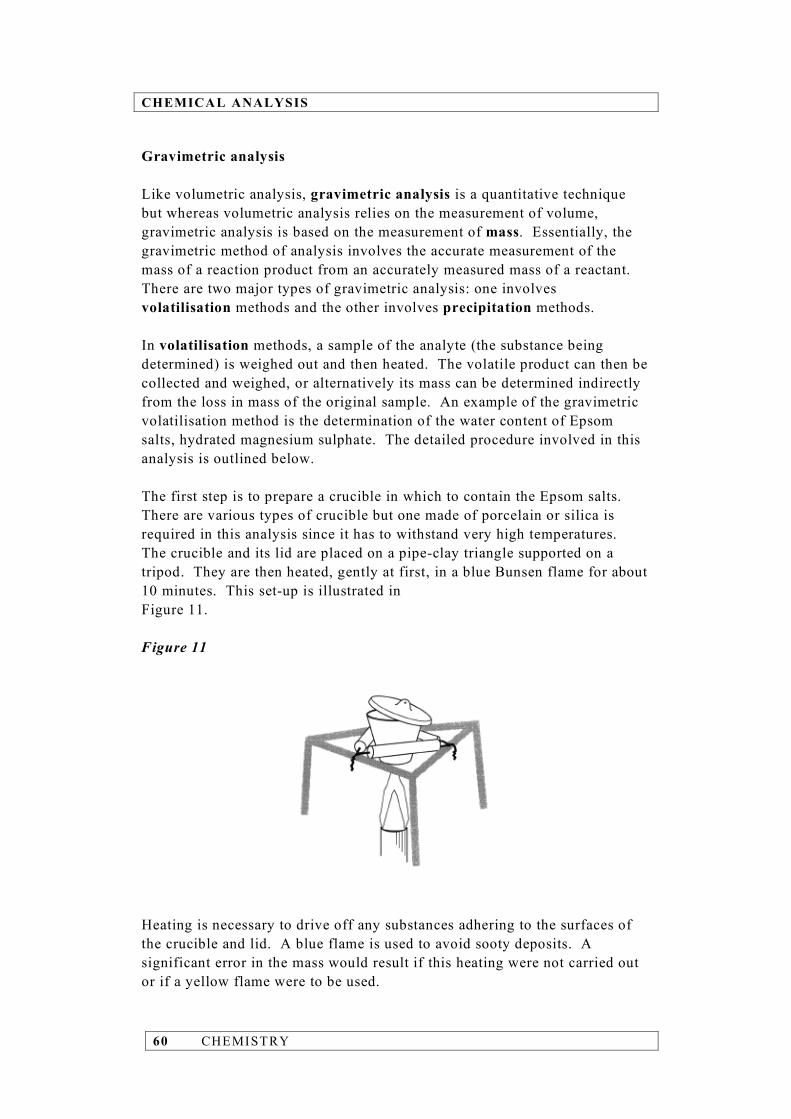
CHEMICAL ANALYSIS
60 CHEMISTRY
Gravimetric analysis Like volumetric analysis, gravimetric analysis is a quantitative technique but whereas volumetric analysis relies on the measurement of volume, gravimetric analysis is based on the measurement of mass. Essentially, the gravimetric method of analysis involves the accurate measurement of the mass of a reaction product from an accurately measured mass of a reactant. There are two major types of gravimetric analysis: one involves volatilisation methods and the other involves precipitation methods. In volatilisation methods, a sample of the analyte (the substance being determined) is weighed out and then heated. The volatile product can then be collected and weighed, or alternatively its mass can be determined indirectly from the loss in mass of the original sample. An example of the gravimetric volatilisation method is the determination of the water content of Epsom salts, hydrated magnesium sulphate. The detailed procedure involved in this analysis is outlined below. The first step is to prepare a crucible in which to contain the Epsom salts. There are various types of crucible but one made of porcelain or silica is required in this analysis since it has to withstand very high temperatures. The crucible and its lid are placed on a pipe-clay triangle supported on a tripod. They are then heated, gently at first, in a blue Bunsen flame for about 10 minutes. This set-up is illustrated in Figure 11. Figure 11
Heating is necessary to drive off any substances adhering to the surfaces of the crucible and lid. A blue flame is used to avoid sooty deposits. A significant error in the mass would result if this heating were not carried out or if a yellow flame were to be used.

CHEMICAL ANALYSIS
CHEMISTRY 61
When heating is complete, the crucible and lid are allowed to cool briefly before transferring them to a desiccator (see Figure 4 on page 46). Throughout the procedure, clean tongs must be used to handle the crucible and lid. This prevents nasty burns and avoids oils from the skin being deposited on them, which would lead to an error in their mass. The desiccator provides a dry atmosphere and allows the crucible and lid to cool without adsorbing a layer of moisture. Once the crucible and lid have cooled to room temperature – this takes about 10 to 15 minutes – they are weighed on a balance which, at the very least, should read to ±0.001 g. The crucible and lid must not be hot when they are weighed otherwise their measured mass will be less than their true mass. The reason for this is that as hot air rises above the crucible and lid, cold air is drawn in and as it heats up and rises, it lifts the crucible ever so slightly from the balance pan (see Figure 12). Figure 12
A sample of the Epsom salts is added to the crucible, taking care none of it spills onto the balance pan. The lid is replaced and the crucible and its contents are reweighed. After placing the crucible back onto the pipe-clay triangle, it is heated gently for about 2 minutes and then strongly for 10 to 15 minutes. This drives the water molecules of crystallisation from the Epsom salts and leaves anhydrous magnesium sulphate. During the heating process, the lid should partially cover the contents of the crucible (see Figure 11). In this way, the volatile product (water) can escape and loss of magnesium sulphate is prevented should ‘spurting’ occur. After cooling in a desiccator, the covered crucible and contents are weighed once more. The heating, cooling and weighing are repeated until two consecutive mass readings, differing by 0.002 g or better, have been achieved. This procedure is known as heating to constant mass and is necessary to ensure that the reaction has gone to completion. From the loss in mass and the initial mass of the sample, the percentage water in Epsom salts can be calculated.

CHEMICAL ANALYSIS
62 CHEMISTRY
Let’s now turn to the other type of gravimetric analysis, namely that which involves precipitation methods. Here, the analyte is dissolved in water and converted into an insoluble product by the addition of a suitable reagent. The resulting precipitate is then filtered, washed, dried and finally weighed. We can illustrate this method by using the same example as we used for the volatilisation method, i.e. the determination of the water content of Epsom salts. Epsom salts are hydrated magnesium sulphate and the sulphate ions present in an aqueous solution of the salts can be precipitated as barium sulphate by treatment with barium chloride solution:
Ba2+(aq) + SO42–(aq) → Ba2+SO4
2–(s) Since barium sulphate is highly insoluble and provided we use an excess of barium chloride solution, we can be confident that the conversion of magnesium sulphate into barium sulphate is virtually quantitative. The practical details of the analysis are outlined below. Using a weighing bottle, a sample of the Epsom salts is weighed by difference on a balance reading to 0.001 g. It is transferred to a beaker containing some deionised water, previously acidified with a little concentrated hydrochloric acid. After the sample dissolves, the resulting solution is heated to boiling. A slight excess of barium chloride solution is then added drop by drop, and throughout the addition the mixture is vigorously stirred using a glass rod. It is during this stage of the process that a fine white precipitate of barium sulphate will appear. The beaker and its contents are placed on a steam bath and heated for at least an hour. The precipitate will settle to the bottom of the beaker, leaving a clear solution above it. At this point, it is important to check that all the sulphate ions have been converted into solid barium sulphate. This is done by adding a drop of barium chloride solution to the clear liquid and if no cloudiness appears then precipitation is complete. The next stage in the procedure is to separate the precipitate and the most convenient way of doing this is to filter the mixture through a sintered glass crucible (see Figure 13). Figure 13

CHEMICAL ANALYSIS
CHEMISTRY 63
This type of crucible has a sintered glass* porous disc in its base which acts as a filter. After washing, drying (in an oven at 120°C), cooling (in a desiccator) and weighing the empty crucible, the barium sulphate precipitate is transferred to it. Applying reduced pressure by use of a water pump speeds up the filtration process. Great care must be taken at this stage to make certain that all traces of the precipitate are transferred from the beaker into the sintered glass crucible. The precipitate is then washed with several portions of hot deionised water and dried in an oven at about 120°C. After cooling in a desiccator, the precipitate and crucible are weighed and the heating, cooling and weighing are repeated until their mass is constant. From the mass of the barium sulphate precipitate, the mass of magnesium sulphate and hence the percentage water present in the Epsom salts can be calculated. In precipitation methods of gravimetric analysis, the particle size of the solids is the crucial factor. Ideally, they should be large. Large particles are more easily filtered than small particles, which would clog the filter or, even worse, pass through it. Furthermore, large particles have a smaller surface area and consequently can be washed free of impurities much more effectively. Production of precipitates made up of large particles, however, is easier said than done. Various techniques can be adopted to help promote their formation. For example, in the analysis described above: • the acidification of the reaction mixture • the slow addition of the barium chloride solution • the vigorous stirring • heating the reaction mixture on a steam bath are all carried out with the sole aim of producing a precipitate of barium sulphate containing particles as large as possible. Volumetric versus gravimetric Many determinations can be achieved both volumetrically and gravimetrically. So how do we decide which method to use? Volumetric procedures can be carried out more rapidly than gravimetric ones and so if time is of the essence, volumetric analysis has the edge. If, on the
* Sintered glass is made by heating powdered glass until the particles just melt and fuse together. The size of the pores in the material can be controlled by the coarseness of the powder and the extent to which it is heated.
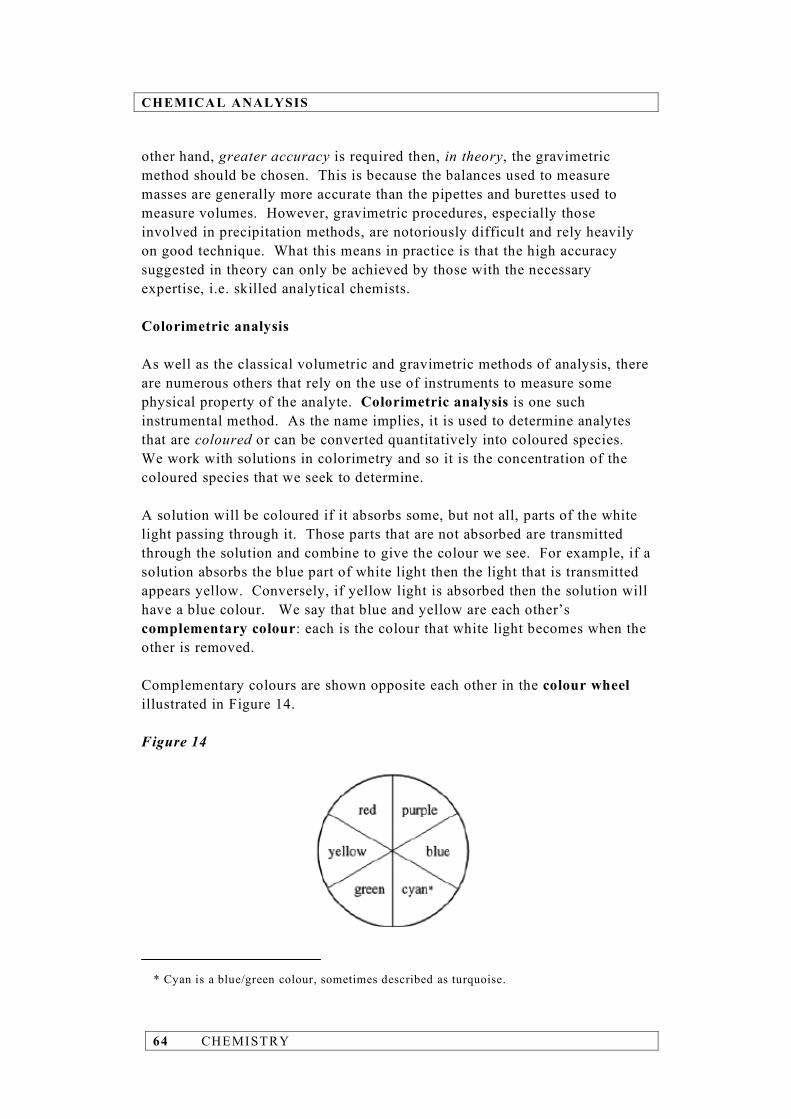
CHEMICAL ANALYSIS
64 CHEMISTRY
other hand, greater accuracy is required then, in theory, the gravimetric method should be chosen. This is because the balances used to measure masses are generally more accurate than the pipettes and burettes used to measure volumes. However, gravimetric procedures, especially those involved in precipitation methods, are notoriously difficult and rely heavily on good technique. What this means in practice is that the high accuracy suggested in theory can only be achieved by those with the necessary expertise, i.e. skilled analytical chemists. Colorimetric analysis As well as the classical volumetric and gravimetric methods of analysis, there are numerous others that rely on the use of instruments to measure some physical property of the analyte. Colorimetric analysis is one such instrumental method. As the name implies, it is used to determine analytes that are coloured or can be converted quantitatively into coloured species. We work with solutions in colorimetry and so it is the concentration of the coloured species that we seek to determine. A solution will be coloured if it absorbs some, but not all, parts of the white light passing through it. Those parts that are not absorbed are transmitted through the solution and combine to give the colour we see. For example, if a solution absorbs the blue part of white light then the light that is transmitted appears yellow. Conversely, if yellow light is absorbed then the solution will have a blue colour. We say that blue and yellow are each other’s complementary colour: each is the colour that white light becomes when the other is removed. Complementary colours are shown opposite each other in the colour wheel illustrated in Figure 14. Figure 14
* Cyan is a blue/green colour, sometimes described as turquoise.
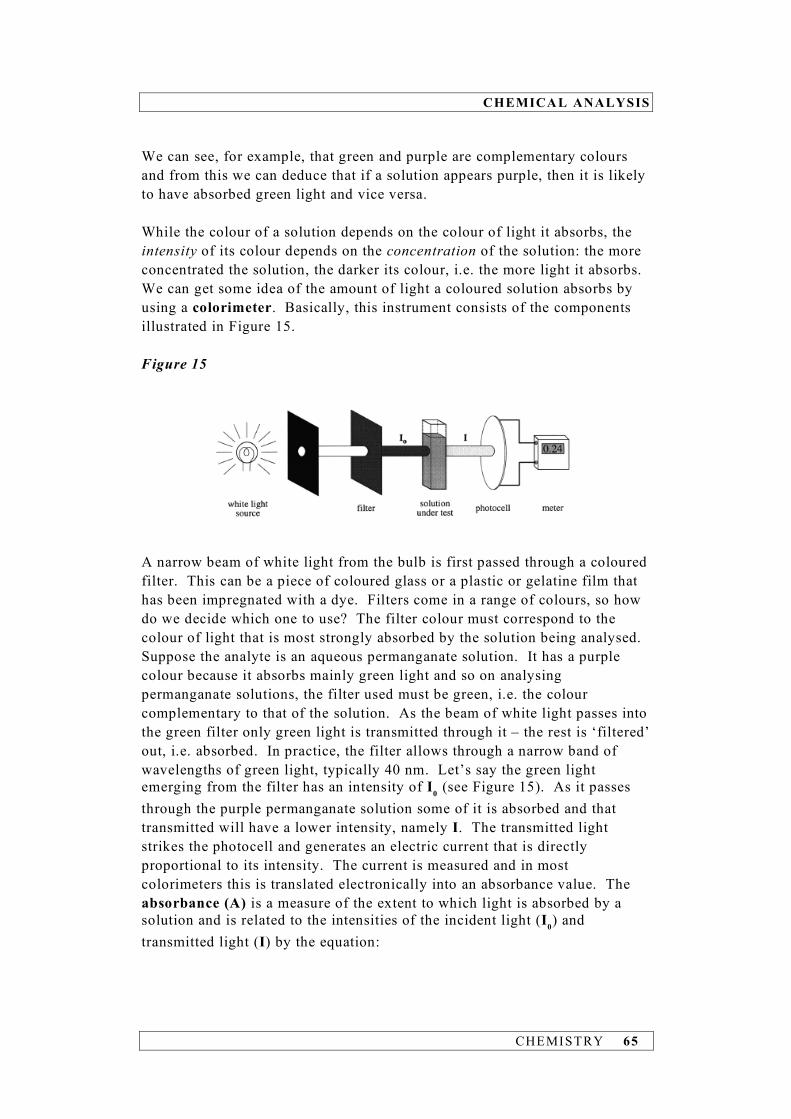
CHEMICAL ANALYSIS
CHEMISTRY 65
We can see, for example, that green and purple are complementary colours and from this we can deduce that if a solution appears purple, then it is likely to have absorbed green light and vice versa. While the colour of a solution depends on the colour of light it absorbs, the intensity of its colour depends on the concentration of the solution: the more concentrated the solution, the darker its colour, i.e. the more light it absorbs. We can get some idea of the amount of light a coloured solution absorbs by using a colorimeter. Basically, this instrument consists of the components illustrated in Figure 15. Figure 15
A narrow beam of white light from the bulb is first passed through a coloured filter. This can be a piece of coloured glass or a plastic or gelatine film that has been impregnated with a dye. Filters come in a range of colours, so how do we decide which one to use? The filter colour must correspond to the colour of light that is most strongly absorbed by the solution being analysed. Suppose the analyte is an aqueous permanganate solution. It has a purple colour because it absorbs mainly green light and so on analysing permanganate solutions, the filter used must be green, i.e. the colour complementary to that of the solution. As the beam of white light passes into the green filter only green light is transmitted through it – the rest is ‘filtered’ out, i.e. absorbed. In practice, the filter allows through a narrow band of wavelengths of green light, typically 40 nm. Let’s say the green light emerging from the filter has an intensity of I0 (see Figure 15). As it passes through the purple permanganate solution some of it is absorbed and that transmitted will have a lower intensity, namely I. The transmitted light strikes the photocell and generates an electric current that is directly proportional to its intensity. The current is measured and in most colorimeters this is translated electronically into an absorbance value. The absorbance (A) is a measure of the extent to which light is absorbed by a solution and is related to the intensities of the incident light (I0) and transmitted light (I) by the equation:
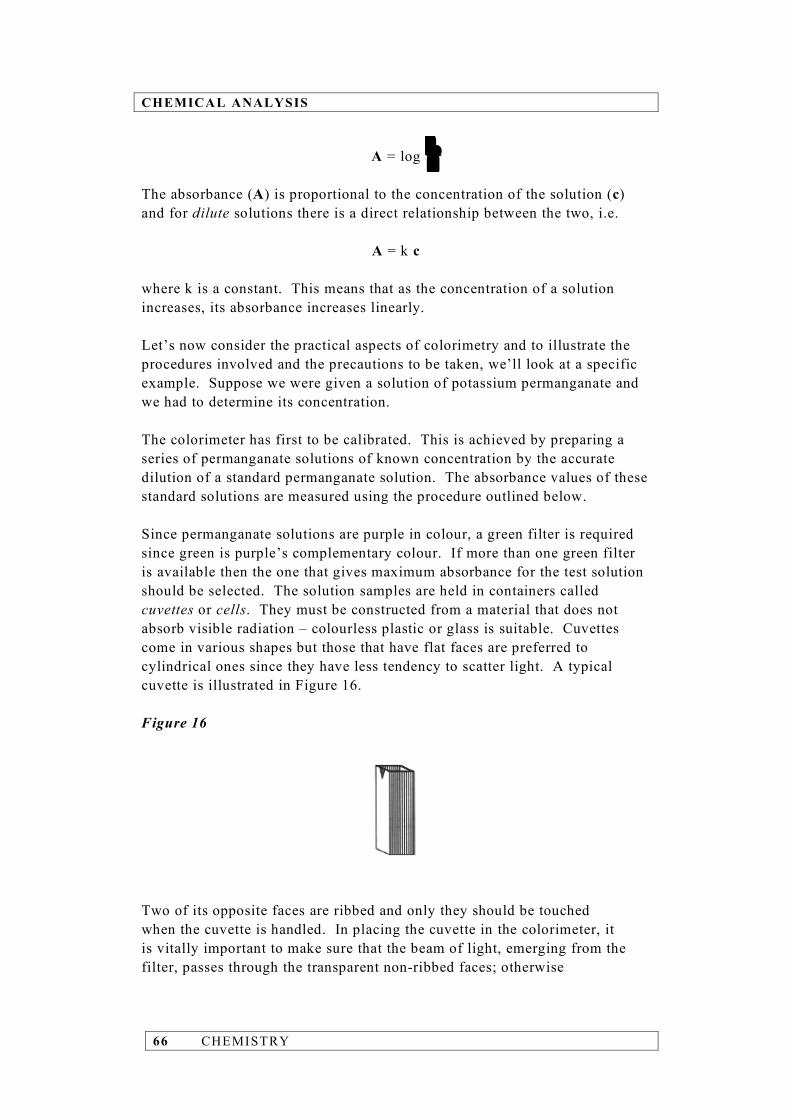
CHEMICAL ANALYSIS
66 CHEMISTRY
A = log
The absorbance (A) is proportional to the concentration of the solution (c) and for dilute solutions there is a direct relationship between the two, i.e.
A = k c where k is a constant. This means that as the concentration of a solution increases, its absorbance increases linearly. Let’s now consider the practical aspects of colorimetry and to illustrate the procedures involved and the precautions to be taken, we’ll look at a specific example. Suppose we were given a solution of potassium permanganate and we had to determine its concentration. The colorimeter has first to be calibrated. This is achieved by preparing a series of permanganate solutions of known concentration by the accurate dilution of a standard permanganate solution. The absorbance values of these standard solutions are measured using the procedure outlined below. Since permanganate solutions are purple in colour, a green filter is required since green is purple’s complementary colour. If more than one green filter is available then the one that gives maximum absorbance for the test solution should be selected. The solution samples are held in containers called cuvettes or cells. They must be constructed from a material that does not absorb visible radiation – colourless plastic or glass is suitable. Cuvettes come in various shapes but those that have flat faces are preferred to cylindrical ones since they have less tendency to scatter light. A typical cuvette is illustrated in Figure 16. Figure 16
Two of its opposite faces are ribbed and only they should be touched when the cuvette is handled. In placing the cuvette in the colorimeter, it is vitally important to make sure that the beam of light, emerging from the filter, passes through the transparent non-ribbed faces; otherwise
0I
I
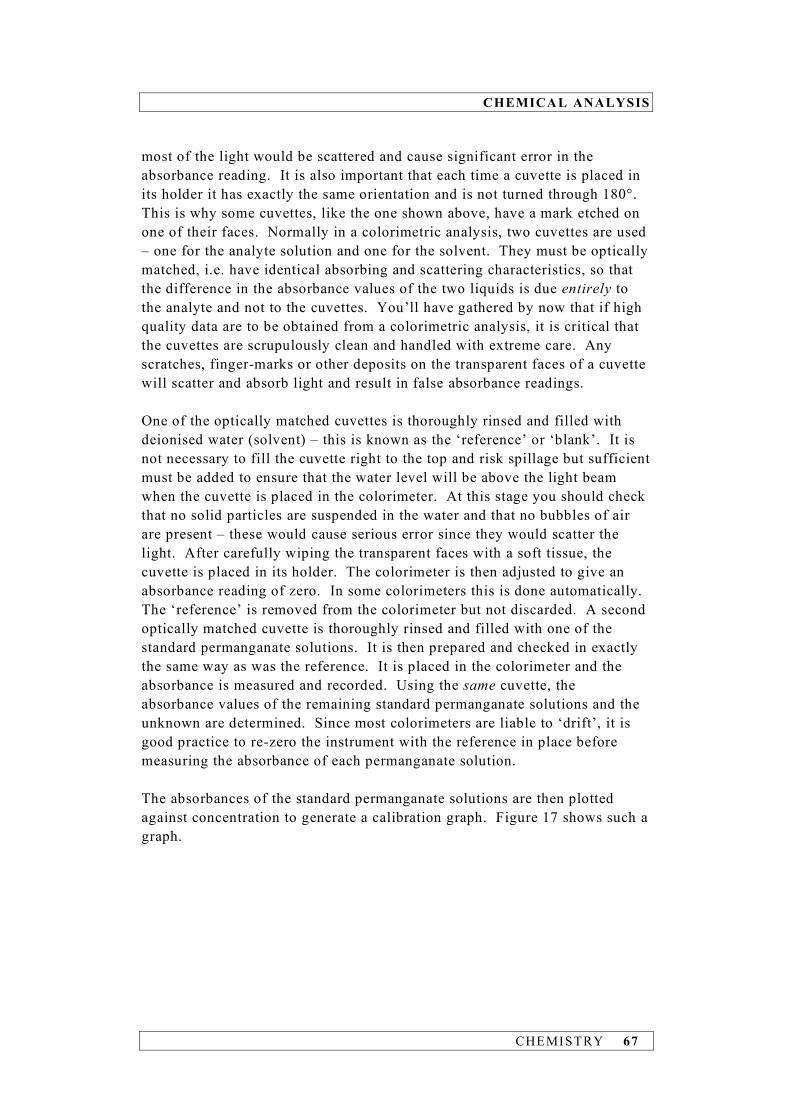
CHEMICAL ANALYSIS
CHEMISTRY 67
most of the light would be scattered and cause significant error in the absorbance reading. It is also important that each time a cuvette is placed in its holder it has exactly the same orientation and is not turned through 180°. This is why some cuvettes, like the one shown above, have a mark etched on one of their faces. Normally in a colorimetric analysis, two cuvettes are used – one for the analyte solution and one for the solvent. They must be optically matched, i.e. have identical absorbing and scattering characteristics, so that the difference in the absorbance values of the two liquids is due entirely to the analyte and not to the cuvettes. You’ll have gathered by now that if high quality data are to be obtained from a colorimetric analysis, it is critical that the cuvettes are scrupulously clean and handled with extreme care. Any scratches, finger-marks or other deposits on the transparent faces of a cuvette will scatter and absorb light and result in false absorbance readings. One of the optically matched cuvettes is thoroughly rinsed and filled with deionised water (solvent) – this is known as the ‘reference’ or ‘blank’. It is not necessary to fill the cuvette right to the top and risk spillage but sufficient must be added to ensure that the water level will be above the light beam when the cuvette is placed in the colorimeter. At this stage you should check that no solid particles are suspended in the water and that no bubbles of air are present – these would cause serious error since they would scatter the light. After carefully wiping the transparent faces with a soft tissue, the cuvette is placed in its holder. The colorimeter is then adjusted to give an absorbance reading of zero. In some colorimeters this is done automatically. The ‘reference’ is removed from the colorimeter but not discarded. A second optically matched cuvette is thoroughly rinsed and filled with one of the standard permanganate solutions. It is then prepared and checked in exactly the same way as was the reference. It is placed in the colorimeter and the absorbance is measured and recorded. Using the same cuvette, the absorbance values of the remaining standard permanganate solutions and the unknown are determined. Since most colorimeters are liable to ‘drift’, it is good practice to re-zero the instrument with the reference in place before measuring the absorbance of each permanganate solution. The absorbances of the standard permanganate solutions are then plotted against concentration to generate a calibration graph. Figure 17 shows such a graph.
CHEMICAL ANALYSIS
68 CHEMISTRY
Figure 17
The fact that it is a straight line plot confirms that for dilute solutions, absorbance is directly proportional to the concentration of the absorbing species. Suppose our unknown permanganate solution had an absorbance of 0.24. We can interpolate from the calibration graph that it must have had a concentration of 1.25 × 10⁻⁴ mol l–1. If the absorbance of the unknown had been found to lie outwith the range of the standard solutions, then it could be accurately diluted and its new absorbance measured. Using the calibration graph, the concentration of the diluted solution can be found and then multiplied by the dilution factor to give the concentration of the original unknown.
ORGANIC TECHNIQUES
CHEMISTRY 69
SECTION 6 Organic Techniques Introduction Practical organic chemistry is primarily concerned with making or synthesising organic compounds and the purpose of a ‘synthesis’ experiment is to prepare a pure sample of a specified compound. Essentially, there are five steps involved: • preparation – the appropriate reaction is carried out and a crude sample
of the desired product is prepared • isolation – the crude sample of the product is separated from the reaction
mixture • purification – the crude product is freed of impurities • identification – the identity of the pure product is confirmed • calculation of the percentage yield. Apart from the last, each of the steps entails a variety of experimental techniques and operations, and in what follows some of the more important ones will be described. While they will be considered mainly from a practical standpoint, we will touch on their theoretical basis where appropriate. Preparation Most organic preparations are carried out in what can be quite complex assemblies of glassware. The glassware we use nowadays has ground glass joints that allow the individual pieces to fit together tightly, thus eliminating any need for corks or rubber stoppers. Suppose we had to prepare a compound that required the reactants to be heated, which is generally the case in organic chemistry. Let’s first look at the glassware we would need. It is illustrated in Figure 18 and consists of a round-bottomed or pear-shaped flask and a condenser.

ORGANIC TECHNIQUES
70 CHEMISTRY
Figure 18
The assembled apparatus is shown in Figure 19 with the condenser mounted vertically above the reaction flask. The latter should be of a size such that when the reactants are in place it is about half full. Figure 19
A heating mantle is generally used to heat the reactants. It contains a cavity, shaped to accommodate the reaction flask and has a variable regulator to control the rate of heating. While other heating devices, e.g. a hot-water bath, a steam bath, an oil bath or a sand bath, can be used, on no account should a reaction mixture be heated using a Bunsen burner. This is because organic compounds are generally flammable and if fires are to be prevented there must be no naked flames around. Once a reaction flask of the correct size has been selected, it is weighed empty and after adding the limiting reactant, i.e. the one that is not in
ORGANIC TECHNIQUES
CHEMISTRY 71
excess, it is re-weighed.* We need to know the initial mass of the limiting reactant in order to calculate the theoretical yield and hence the percentage yield of product. The other reactants can now be added to the flask along with a few anti-bumping granules. If any of the reactants are solids or immiscible liquids, it may be necessary at this stage to add a solvent to give a homogeneous mixture. The apparatus is then assembled (see Figure 19) with the flask resting in a heating mantle. The rubber tubing attached to the lower end of the condenser is connected to the cold-water tap and a steady flow of water is allowed to circulate. Before the heating mantle is switched on and the mixture gently heated, you should check that the flask and condenser are firmly clamped and the joint between them is tight. As the reaction mixture heats up the more volatile components will boil and their vapours will rise into the condenser. There, they will be cooled, liquefied and returned to the reaction flask. So the purpose of the condenser is evident – it is to prevent the escape of any volatile reactants or products from the apparatus. The operation of boiling a reaction mixture and condensing the vapours back into the reaction vessel is known as heating under reflux or more commonly as refluxing. When a reaction mixture is heated, there is a tendency for it to boil violently as large bubbles of superheated vapour suddenly erupt from the mixture. This phenomenon is known as bumping and it can be prevented by the addition of a few anti-bumping granules (also called boiling stones) to the reaction mixture. They are normally made from tiny pieces of alumina (aluminium oxide) or carborundum (silicon carbide) and have an air-filled porous surface that promotes the formation of a steady stream of tiny bubbles instead of a few large ones. Anti-bumping granules must always be added before heating begins because adding them to a hot mixture could cause it to froth over. If the preparation requires the reaction mixture to be cooled and reheated, then fresh anti-bumping granules must be added before reheating commences. This is because when boiling stops, liquid is drawn into the pores of the granules and renders them less effective. Once the reaction is complete, the heating mantle is switched off and the reaction mixture is allowed to cool. During this time the condenser must remain in place and the cold water must be kept circulating, otherwise the product may escape from the top of the condenser.
* During weighing, the f l a sk can be supported on a cork ring to prevent i t toppl ing over.

ORGANIC TECHNIQUES
72 CHEMISTRY
Sometimes, organic preparations require the addition of a reactant during the course of the reaction. If this is the case, then a two- or three-necked round-bottomed flask can be used with the reactant being added from a dropping funnel placed in a side neck. On occasions, it may be necessary to remove the product during the course of the reaction to prevent it undergoing further change. For example, if an aldehyde is prepared by the oxidation of a primary alcohol, then it must be removed from the reaction mixture as soon as it forms, otherwise it will be oxidised to the carboxylic acid. The removal of the desired product can often be achieved by simple distillation (see Figure 22). Isolation After the preparation stage of a synthesis experiment has been completed, we are often faced with a bewildering mixture of substances. Along with the desired product, the mixture is likely to contain: • reactants that had been used in excess • other products of the reaction • compounds that are produced as a result of side-reactions • the limiting reactant if the reaction had been a reversible one. The next step in the overall process is to isolate or separate the compound we set out to prepare from the other components of the mixture. If our desired product is present as a solid, then filtration provides a fast and convenient way of separating it. This is normally carried out under reduced pressure, which is why the technique is often referred to as suction filtration. This type of filtration is performed with the aid of a Buchner funnel and flask and these are illustrated in Figure 20. Figure 20

ORGANIC TECHNIQUES
CHEMISTRY 73
The Buchner funnel has a plate incorporated in its base that is perforated by a number of small holes. The Buchner flask is simply a thick-walled conical flask with a short side arm. The funnel is fitted into the neck of the flask by means of a rubber stopper and the flask is attached to a water pump via its side arm. Before filtration, a filter paper is placed on the perforated plate – it should be of such a size that it sits flat on the plate and covers all the holes. The filter paper is moistened with a few drops of the liquid present in the mixture and the water pump is turned on. This ensures that the filter paper adheres firmly to the perforated plate and in the subsequent filtration will prevent any solid matter from passing round and under the edge of the paper into the flask. The mixture can now be filtered and it is added to the funnel in portions. If the solid is finely divided, then transfer of the bulk of the solid should be delayed to near the end of the filtration, otherwise the pores in the filter paper will become clogged and cause the rate of filtration to slow down. Inevitably some of the solid product will remain in the reaction flask and if we are to gain maximum yield we need it in the funnel. To do this, some of the filtrate is returned to the reaction flask and the mixture is stirred or swirled and quickly poured into the funnel. This operation is repeated until all the solid has been transferred. The product is then washed with two or three portions of liquid to remove the bulk of the impurities adhering to its surface. You will be advised of a suitable solvent but obviously it must not dissolve the solid. To make it easier to handle, the product is partially dried by having air drawn through it for several minutes. The crude solid sample is now ready for purification (see page 77). If our desired product is present as a liquid and it is more volatile than the other substances in the mixture then it is possible to isolate it by simple distillation. The individual items required for such an operation are illustrated and identified in Figure 21.
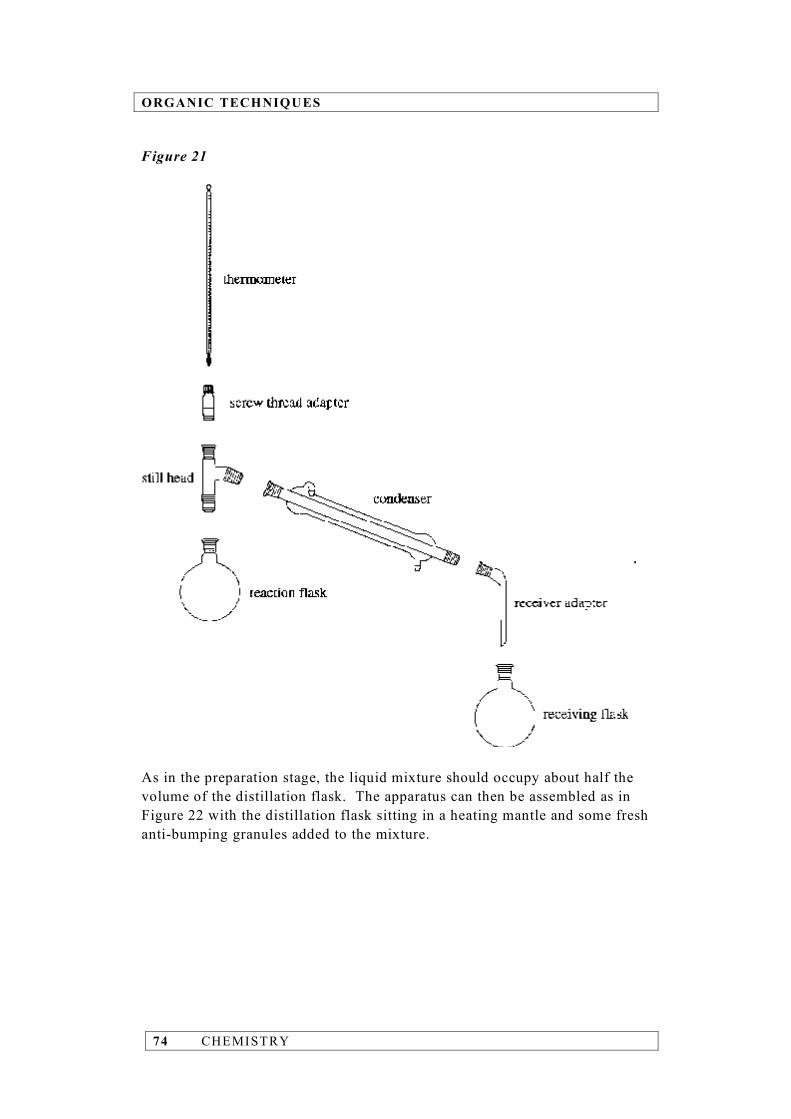
ORGANIC TECHNIQUES
74 CHEMISTRY
Figure 21
As in the preparation stage, the liquid mixture should occupy about half the volume of the distillation flask. The apparatus can then be assembled as in Figure 22 with the distillation flask sitting in a heating mantle and some fresh anti-bumping granules added to the mixture.

ORGANIC TECHNIQUES
CHEMISTRY 75
Figure 22
For the accurate measurement of temperature, it is important that the thermometer is positioned correctly. It should be arranged such that the top of the bulb is level with the bottom of the still head's side arm. The rubber tubing on the lower end of the condenser is attached to the cold-water tap and water is allowed to circulate. Before heating commences, the apparatus must be checked to ensure that it is firmly clamped and the joints are tight. The heating mantle is switched on and the mixture is slowly distilled. Only the liquid that distils over within a certain temperature range should be collected in the receiving flask. The temperature range will be specified in the procedure but it will encompass the temperature at which the pure product boils. The range is also likely to be wide (20°C or so) to make sure that the maximum amount of desired product is isolated from the mixture. If the liquid product is particularly volatile, it is a good idea to place the receiving flask in an ice/water bath and to ensure that the receiver adapter on the condenser extends well into the flask. These measures ought to minimise loss of product through evaporation.

ORGANIC TECHNIQUES
76 CHEMISTRY
On occasions it may not be practicable to isolate the product directly from the mixture by filtration or simple distillation. In such cases, we have to resort to another technique known as solvent extraction. Suppose, for example, our desired product is present in an aqueous mixture, i.e. water is the solvent. It can be removed or extracted from the mixture by the addition of a second solvent. The choice of the second solvent is critical. It must be immiscible with water, i.e. when the two are mixed they form separate layers. Furthermore, the product must not react with the solvent and it must be more soluble in it than in water. Hence, on adding the solvent to the aqueous mixture the product will move out of the aqueous layer and into the solvent layer, from which it can be more readily separated. The practical details of solvent extraction are outlined below. The aqueous mixture is first transferred to a separating funnel, which may be either cylindrical or pear-shaped (see Figure 23). Figure 23
A portion of solvent equal to about one-third of the volume of the aqueous mixture is then added to the funnel. For efficient extraction, the total volume of both liquids should not exceed three-quarters of the funnel’s capacity. With the stopper held firmly in place, the funnel is inverted and the tap opened to release any pressure build-up caused by the solvent vaporising. The tap is closed and the mixture is shaken vigorously for several minutes. This increases the surface area of contact
ORGANIC TECHNIQUES
CHEMISTRY 77
between the two liquids and so speeds up the rate of movement of the product from the aqueous layer into the solvent layer. During the shaking process, it is important to invert the funnel from time to time and open the tap to release the pressure. With the funnel supported, the mixture is allowed to settle until the layers have completely separated – there should be a sharp dividing line between the two. Let’s assume that the aqueous layer is more dense than the solvent layer, in which case the solvent layer will lie above the aqueous layer. With the stopper removed, the lower aqueous layer is drained through the tap into a conical flask. The solvent layer is poured out of the top of the funnel into a separate flask. This avoids contamination with any drops of the aqueous mixture remaining in the stem of the funnel. The aqueous mixture is then returned to the separating funnel and the above procedure is repeated at least twice using a fresh portion of solvent each time.* The reason why several extractions using small volumes of solvent are performed rather than one extraction using a large volume of solvent is that a greater amount of product can be recovered in this way, i.e. the extraction process is more efficient (see Watson, Gibb and Sandison (2000), Unit 2: Principles of Chemical Reactions, Learning and Teaching Scotland, Dundee, pp 17–19). The solvent extracts are then combined and the solvent is removed by careful distillation, leaving the product in the distillation flask. Purification No matter whether the product was isolated from the reaction mixture by filtration, simple distillation or solvent extraction, it is highly unlikely that the separation would be ‘clean’. In other words, impurities will still be present and these require to be removed from the sample. The method used to purify the product sample depends on its state, i.e. whether it is a solid or a liquid. The simplest and most widely used technique of purifying an organic solid is recrystallisation.† In a typical recrystallisation procedure, the crude or impure solid is dissolved, by heating, in the minimum volume of a suitable solvent. The
* If the solvent is more dense than water then it is not necessary to pour the top layer, i.e. the aqueous layer, out of the separating funnel until all of the extractions have been completed.
† The term ‘recrystallisation’ is used rather than ‘crystallisation’ because it involves dissolving a solid that had originally crystallised from a reaction mixture and causing it to crystallise once again from solution.

ORGANIC TECHNIQUES
78 CHEMISTRY
hot saturated solution is filtered, thus removing any insoluble impurities, and allowed to cool, whereupon the solid crystallises out. The crop of pure crystals can then be filtered off, leaving the bulk of the soluble impurities in the filtrate or mother-liquor, as it is often called. The success of the recrystallisation process depends largely on the choice of solvent. First and foremost, the substance to be purified must not react with the solvent. In addition, it should have a high solubility in the hot solvent and be virtually insoluble in the cold solvent. Ideally, the impurities should be completely insoluble in the hot solvent, in which case they will be removed when the hot solution is filtered, or completely soluble in the cold solvent so that they remain in the mother-liquor and will be separated from the pure solid in the second filtration. However, finding a solvent that meets these latter requirements is well nigh impossible. Nevertheless, as the following discussion will demonstrate, the process of recrystallisation is an effective method of purification even when the impurities dissolve to some extent in the solvent. Suppose we had 10.0 g of crude material containing 9.5 g of the desired compound, A, and 0.5 g of an impurity, B, i.e. 5% impurity. First, let’s consider the case where the impurity B is more soluble in the given solvent than the desired compound A. The table below shows possible solubilities of A and B in hot and cold solvent.
Solubility (g/100 cm3 solvent) A B Hot solvent 10.0 20.0 Cold solvent 0.4 0.8
Assuming that the solubilities of A and B are not affected by the presence of each other, and assuming that we used 100 cm3 of solvent, then all 9.5 g of A and all 0.5 g of B would dissolve in the hot solvent. On cooling, 9.1 g of A (9.5 g – 0.4 g) would crystallise out. None of B would crystallise out since its solubility (0.8 g/100 cm3 cold solvent) exceeds the mass present (0.5 g) and so it would remain in the mother-liquor. On filtration, the crop of crystals obtained would be 100% pure A. Of the 9.5 g of A originally present in the crude mixture, 9.1 g would be recovered, i.e. 96% Let’s now look at the situation where the impurity B is less soluble in the given solvent than the desired compound A.

ORGANIC TECHNIQUES
CHEMISTRY 79
Solubility (g/100 cm3
solvent) A B Hot solvent 10.0 5.0 Cold solvent 0.4 0.2
If we again used 100 cm3 of hot solvent, then all 9.5 g of A and 0.5 g of B would dissolve. On cooling, 9.1 g of A (9.5 g – 0.4 g) and 0.3 g of B (0.5 g – 0.2 g) would crystallise out. Clearly, the desired compound A is still contaminated by B but the percentage impurity has been reduced from 5% to 3%. A further recrystallisation from 100 cm3 of solvent would yield a crop of crystals made up of 8.7 g of A (9.1 g – 0.4 g) and 0.1 g of B (0.3 g – 0.2 g). Another recrystallisation would be needed before A would be completely free of impurity. In the end, 8.3 g of pure A would be obtained and this represents a recovery of 87%. Hence, it is desirable, although not essential, that impurities dissolve in the solvent more readily than the substance to be purified since, in general, fewer recrystallisations are required and the percentage recovery is higher. Although theoretical considerations can point us in the right direction, the only sure way of selecting the best solvent from which to recrystallise a given solid is by trial and error. At this stage in your chemistry career, however, it is doubtful that you will have to go through this long and tedious process because in the vast majority of experiments you’ll tackle, the preferred recrystallisation solvent will be specified. It is now appropriate to consider the practical aspects of recrystallisation and the detailed experimental procedure is outlined below. All of the crude material is carefully transferred to a clean conical flask. A small volume of solvent – sufficient to just cover the solid – is added together with a couple of anti-bumping granules. The flask should then be placed on a hot plate and the mixture gently heated until it boils. A hot plate is used since the solvent is likely to be flammable. If the solid hasn’t all dissolved, then a little more solvent should be added and the mixture heated to boiling once again. This process is repeated until all the solid dissolves and then a little excess solvent is added to keep it in solution. Some impurities may be completely insoluble and so care must be taken not to add too much solvent in attempting to dissolve them.
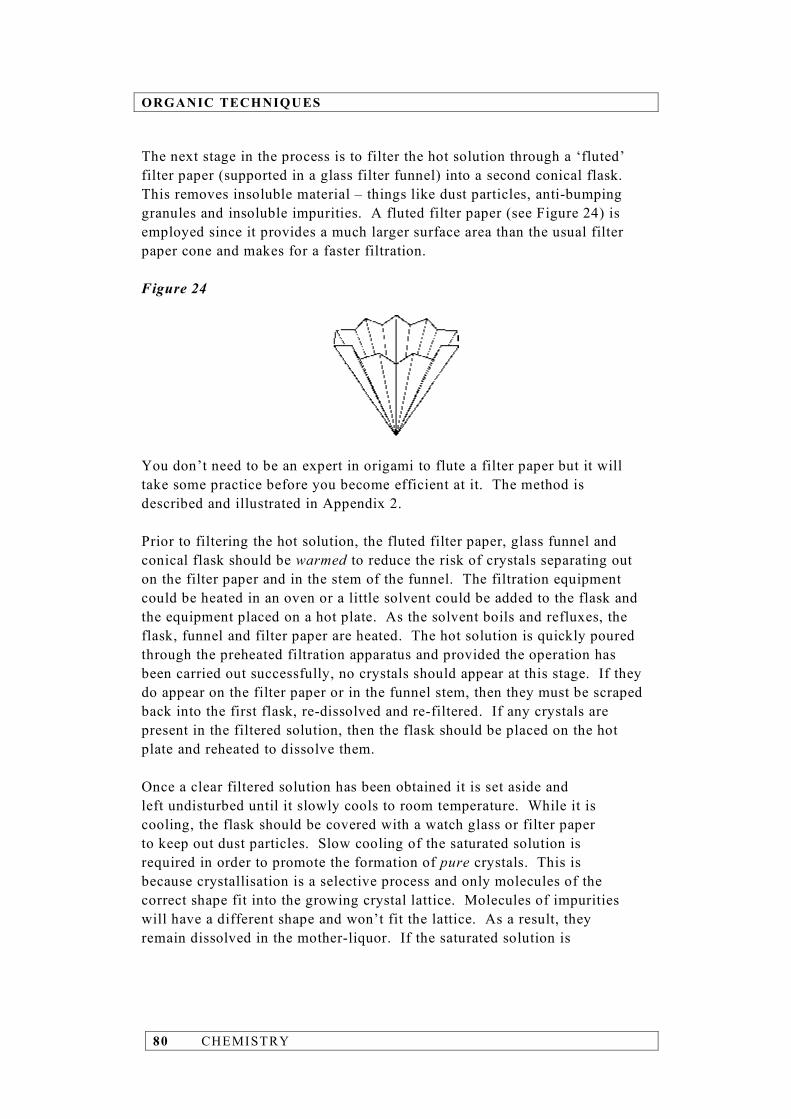
ORGANIC TECHNIQUES
80 CHEMISTRY
The next stage in the process is to filter the hot solution through a ‘fluted’ filter paper (supported in a glass filter funnel) into a second conical flask. This removes insoluble material – things like dust particles, anti-bumping granules and insoluble impurities. A fluted filter paper (see Figure 24) is employed since it provides a much larger surface area than the usual filter paper cone and makes for a faster filtration. Figure 24
You don’t need to be an expert in origami to flute a filter paper but it will take some practice before you become efficient at it. The method is described and illustrated in Appendix 2. Prior to filtering the hot solution, the fluted filter paper, glass funnel and conical flask should be warmed to reduce the risk of crystals separating out on the filter paper and in the stem of the funnel. The filtration equipment could be heated in an oven or a little solvent could be added to the flask and the equipment placed on a hot plate. As the solvent boils and refluxes, the flask, funnel and filter paper are heated. The hot solution is quickly poured through the preheated filtration apparatus and provided the operation has been carried out successfully, no crystals should appear at this stage. If they do appear on the filter paper or in the funnel stem, then they must be scraped back into the first flask, re-dissolved and re-filtered. If any crystals are present in the filtered solution, then the flask should be placed on the hot plate and reheated to dissolve them. Once a clear filtered solution has been obtained it is set aside and left undisturbed until it slowly cools to room temperature. While it is cooling, the flask should be covered with a watch glass or filter paper to keep out dust particles. Slow cooling of the saturated solution is required in order to promote the formation of pure crystals. This is because crystallisation is a selective process and only molecules of the correct shape fit into the growing crystal lattice. Molecules of impurities will have a different shape and won’t fit the lattice. As a result, they remain dissolved in the mother-liquor. If the saturated solution is

ORGANIC TECHNIQUES
CHEMISTRY 81
cooled too quickly then the molecules of impurities become surrounded and trapped within the crystals. Not only does the rate of cooling control the purity of the crystals, it also dictates their size: the slower the rate of cooling the larger and purer will be the crystals. When the solution has cooled completely, and this could take up to an hour, a good crop of crystals should have appeared in the flask. If none appears then it may be that the solution is not saturated, i.e. too much solvent must have been used in the recrystallisation process. In such a case, some of the solvent can be boiled off in order to concentrate the solution and this can be re-cooled. If crystallisation still doesn’t occur then all is not lost since there are a number of tactics available to us to induce the process. One way is to cool the saturated solution by placing the flask in an ice/water bath or in a fridge. Alternatively, a minute amount of the crude material or pure compound (if it is available) can be added to the saturated solution. The tiny particles of solid serve as nuclei around which the crystals can grow. This method is known as seeding and the solid particles that are added are referred to as seed crystals. Another way of inducing crystal formation is to scratch the inside wall of the flask at the liquid surface using a glass rod. The tiny particles of glass that are dislodged act as nuclei for crystal growth. When crystallisation is complete, the mixture of crystals and mother-liquor is filtered at the water pump, using a Buchner funnel and flask as described on page 72. The crystals are then washed with a small portion of ice-cold solvent to remove traces of mother-liquor from their surfaces. With the water pump still running, air is drawn through the crystals to dry them partially. After transferring the crystals to a pre-weighed clock glass, drying may be continued in an oven at a temperature of at least 20°C below the expected melting point. However, under these conditions many organic solids have a tendency to sublime and so it is probably a lot safer to dry the crystals at room temperature but in a desiccator (see Figure 4 on page 46) containing anhydrous calcium chloride or silica gel to absorb the solvent. Once dry, the crystals and clock glass are re-weighed. This is necessary so that the percentage yield of product can be calculated. A second crop of crystals can often be extracted from the mother-liquor. This is achieved by transferring the mother-liquor from the Buchner flask to a conical flask and heating it on a hot plate to drive off about half the solvent. On cooling the saturated solution, crystallisation takes place and the crystals are isolated by filtration and washed and dried in the usual way. Although the second crop of crystals may not be quite as pure as the first, the advantage of taking a second crop is that the percentage yield of product will be enhanced.

ORGANIC TECHNIQUES
82 CHEMISTRY
The most common impurity present in a liquid product is generally water and it can be removed using a drying agent such as anhydrous magnesium sulphate or anhydrous calcium chloride. In practice, a small amount of the powdered or granular drying agent is added directly to the crude sample contained in a conical flask. The mixture is initially swirled and then left to stand for 10 to 15 minutes. If at this point the liquid is completely clear with no hint of cloudiness then we can assume that the product has been successfully dried. The liquid is separated from the drying agent by decanting it or filtering it into a round-bottomed flask. The sample is now ready for further purification by distillation. The type of distillation to be performed will depend largely on the nature of the remaining impurities and in particular their volatility. If they are much less volatile than the desired product then a simple distillation will suffice. A few anti-bumping granules are added to the liquid sample in the round-bottomed flask and the apparatus illustrated in Figure 22 on page 75 is assembled, making sure that the bulb of the thermometer is correctly positioned. Cold water is allowed to circulate through the condenser and the heating mantle is switched on. The rate of heating should be adjusted so that the liquid boils gently and the distillation rate is slow (about one or two drops per second). The liquid, which distils within a narrow temperature range (about 5°C) that embraces the boiling temperature of the pure product, is collected in a pre-weighed receiving flask. The flask and purified product are then re-weighed. To minimise loss of product through evaporation the usual precaution of placing the receiving flask in an ice/water bath should be taken. If the impurities in the crude liquid sample are volatile then fractional distillation rather than simple distillation must be carried out. The procedure is identical to that described above but the apparatus differs slightly in that a fractionating column is inserted vertically between the distillation flask and the still head (see Figure 25). There are various types of fractionating columns but the one illustrated here is packed with lots of tiny glass beads.
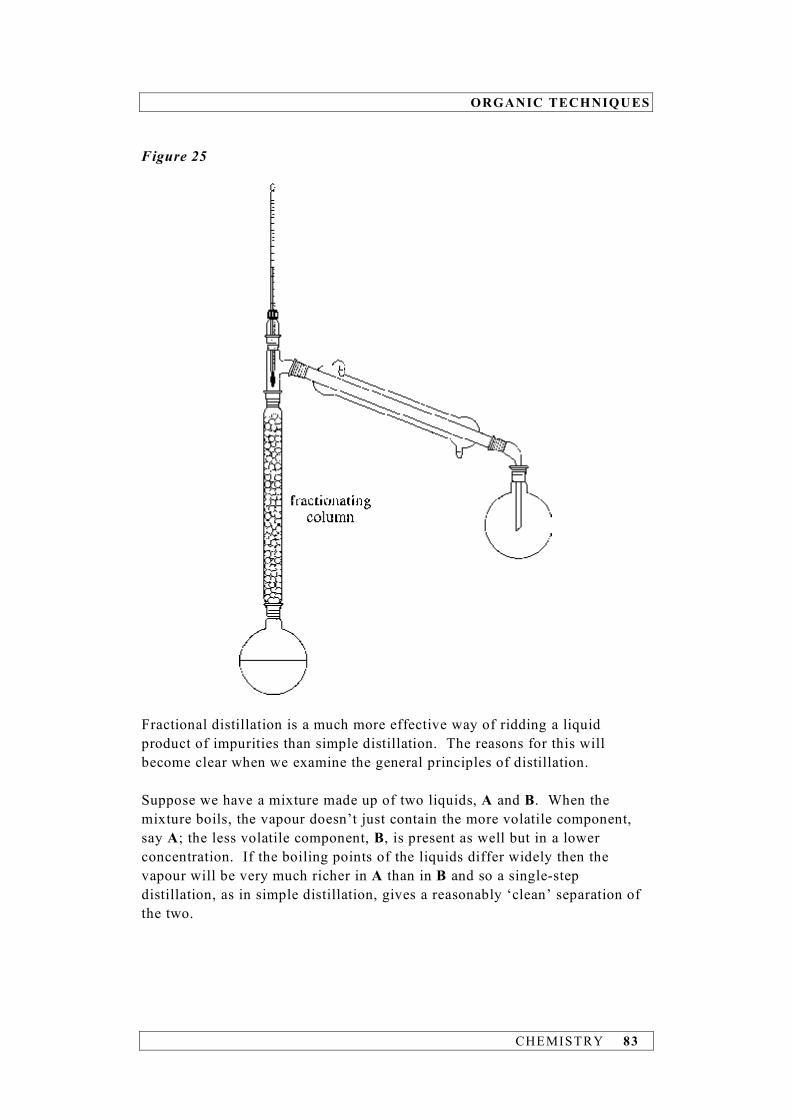
ORGANIC TECHNIQUES
CHEMISTRY 83
Figure 25
Fractional distillation is a much more effective way of ridding a liquid product of impurities than simple distillation. The reasons for this will become clear when we examine the general principles of distillation. Suppose we have a mixture made up of two liquids, A and B. When the mixture boils, the vapour doesn’t just contain the more volatile component, say A; the less volatile component, B, is present as well but in a lower concentration. If the boiling points of the liquids differ widely then the vapour will be very much richer in A than in B and so a single-step distillation, as in simple distillation, gives a reasonably ‘clean’ separation of the two.

ORGANIC TECHNIQUES
84 CHEMISTRY
If, on the other hand, the boiling points of A and B differ by about 25°C or less a simple distillation will result in a distillate that will still contain appreciable amounts of B. What we need to separate A and B completely is a series of distillation steps and this is the purpose of the fractionating column. As the liquid mixture boils, the vapour (richer in A than in B) rises into the fractionating column and condenses on the glass beads in the lower end. This liquid – still richer in A than in B – trickles back down the column but some of it will be re-boiled by the hot vapour rising from the flask to yield a vapour even more rich in A. This vapour will rise further up the column, re-condense, re-boil and so on, yielding a vapour ever richer in A. By the time the vapour reaches the top of the column it will have gone through a multi-step distillation process and will consist almost entirely of A. A clean separation of A and B depends on the efficiency of the fractionating column and this in turn depends on the surface area provided by the glass beads. The greater this is, the more opportunities there are for distillations to take place and the better will be the separation. Identification Once the desired product of an organic reaction has been separated and purified, the next step is to confirm that it is the compound we had set out to prepare. There are numerous ways of doing this but we shall be concentrating on one method, namely the measurement of a physical constant of the compound. If the product is a solid we can determine its melting point and compare it with the accepted or literature value. If these are in close agreement, we can be fairly sure, although not certain, of the identity of the compound. The reason for the doubt is that lots of other compounds will share that same melting point. However, the chance of any one of these being formed in the reaction instead of our desired product is extremely remote. The melting point of a solid is defined as the temperature at which it changes into a liquid. In practice, what we measure is the temperature at which it just starts to melt and the temperature at which it has just completely liquefied. In other words, we measure a melting range rather than a single melting temperature and when we report the melting point, it is the temperature range that we quote, e.g. 148–150°C rather than 150°C. If a substance is pure then it will melt entirely within a range of about 1°C, i.e. it will have a definite and sharp melting point. However, if the substance is impure then the melting point will be indefinite and occur over several degrees. The presence of impurities in
ORGANIC TECHNIQUES
CHEMISTRY 85
a substance lowers its melting point and broadens its melting point range and the greater the amount of impurity present the greater will be the depression of the melting point. Hence, taking a melting point not only helps us to characterise a substance, but also provides confirmation of its purity. The detailed experimental procedure involved in determining the melting point of a substance is outlined below. A few dry* crystals of the substance are placed on a watch glass and crushed to a fine powder using a spatula or glass rod. A glass capillary tube – to contain the powdered sample – is prepared by sealing off one end. This is done by touching one end of the tube to the base of a blue Bunsen flame – the glass melts and closes off that end. Once the tube has cooled, some of the sample is introduced. This is achieved by pushing the open end of the tube into the sample, thus trapping some of the solid. The tube is then inverted and while holding it near the base, the sealed end is sharply tapped against the bench. The solid should fall to the bottom of the tube but if it doesn’t, gently rub the sides of the tube with a small file and that should do the trick. The filling procedure is repeated until there is 1–2 mm (no more) of solid in the tube. Now that the capillary tube has been filled correctly, we are in a position to measure the melting point of the solid. Several types of melting-point devices are available but most contain a metal block in which the capillary tube and a thermometer can be accommodated. The metal block is normally heated electrically and the rate of heating controlled via a rheostat. In addition, the apparatus is likely to have a light to illuminate the sample chamber within the block and an eyepiece containing a small magnifying lens to facilitate observation of the sample. With the filled capillary tube and thermometer in place, the temperature of the metal block is raised quite quickly to within 25°C of the expected melting point. Thereafter, the temperature is increased very slowly at a rate of about 2°C per minute. The thermometer reading is taken when the solid just begins to melt and then again when all of the solid has just melted and only a clear liquid is observed. To obtain an accurate melting point it is vitally important that over the last 25°C or so the temperature of the metal block be raised very, very slowly. Otherwise, the melting point of the solid will be underestimated, i.e. the measured value will be lower than the true
* The crys t a l s mus t be comple te ly d ry s ince any so l ven t presen t w i l l ac t as an impur i t y and lo wer t he melt i n g po in t of t he su bs t ance.

ORGANIC TECHNIQUES
86 CHEMISTRY
value. This is because the mercury in the thermometer takes time to respond to the rising temperature of the block. Consequently, the thermometer reading lags behind the temperature of the block and the more rapid the heating rate, the wider will be the gap between the two. It was mentioned earlier that knowledge of the melting point of a compound doesn’t allow us to identify it with absolute certainty. One way of removing any shadow of doubt is to carry out what is known as the mixed melting point technique. This involves mixing a pure sample of the compound we have prepared and, if available, a pure sample of the compound we think we have prepared. Roughly equal amounts of the two compounds are thoroughly ground together and the melting point of the intimate mixture is then measured in the usual way. If the melting point turns out to be sharp and close to the expected value, then the two compounds must be identical. In other words, the identity of the compound we have prepared has been confirmed. Had the two compounds not been the same then the melting point of the mixture would have been lower and the melting range broader. This results from the fact that each would act as an impurity on the other. If our reaction product is a liquid rather than a solid then the physical constant we measure to help us identify it is its boiling point. If this is close to the accepted value then our product is likely to be the compound we had set out to prepare. One way of determining the boiling point of a liquid is by a simple distillation using the apparatus illustrated in Figure 22 on page 75. The round-bottom flask is half-filled with the liquid and a few anti-bumping granules are added to ensure smooth boiling. The apparatus is assembled with the thermometer correctly positioned. The water to the condenser is turned on, and the flask and its contents are heated using a heating mantle. Initially, the rate of heating can be quite rapid but once the liquid starts to boil, it should be reduced and adjusted so that the distillate collects in the receiving flask at a rate of about a drop per second. Provided the liquid is pure and is distilling steadily, the thermometer reading should remain constant. This constant temperature is the boiling point of the liquid. There is one slight drawback in using boiling point to characterise our liquid product and it arises from the fact that boiling point varies with atmospheric pressure. The deviation between the observed boiling point and the true value can be quite significant – up to several degrees. Consequently, the number of compounds having a boiling point in the vicinity of the observed value could be very large. However, they are
ORGANIC TECHNIQUES
CHEMISTRY 87
unlikely to be produced in the reaction and so most, if not all, of them can be eliminated. It would have been quite a different matter had the liquid been an unknown. One way of removing the uncertainty attaching to the identity of our liquid product is to covert it into a solid derivative and determine the melting point. Melting points are much more reproducible than boiling points since their variation with atmospheric pressure is negligibly small. Suppose, for example, we had carried out a reaction with the intention of preparing the aldehyde propanal. After purification, a little of the liquid product is treated with 2,4-dinitrophenylhydrazine solution, i.e. Brady’s reagent. This converts it into an orange-coloured precipitate, which is the solid derivative. The derivative is then recrystallised and its melting point determined. If it is close to 155°C – the melting point of the 2,4-dinitrophenylhydrazone of propanal – then we can be confident that the product of the reaction was propanal. Percentage yield An organic preparation is incomplete unless the percentage yield of pure product has been calculated and reported. You’ll recall from Higher chemistry that percentage yield is defined as:
actual yieldpercentage yield = 100
theoretical yield!
The actual yield (often shortened to yield) is the mass of pure product obtained in the reaction while the theoretical yield is the maximum mass that might have been expected. The latter can be calculated from a knowledge of the stoichiometric equation for the reaction and the mass of the limiting reactant, i.e. the one that is not in excess. The percentage yield always falls short of 100% – sometimes embarrassingly short! – but there are many good reasons for this: • The reaction may be reversible, in which case a state of equilibrium will
be reached. While we’ll never get 100% conversion of reactants into products in a reversible reaction, some tactics can be adopted to maximise the yield. For example, we could ensure that the other reactants are used in large excess compared to the limiting one or it may be possible to add a reagent that reacts with one of the products. Both measures would encourage the equilibrium position to move to the right and so improve the yield of the desired product.

ORGANIC TECHNIQUES
88 CHEMISTRY
• Side reactions of many kinds may occur. In other words, the limiting reactant undergoes other reactions in addition to the desired one. Consider, for example, the preparation of the ether, ethoxybutane, from 1-bromobutane. This can be achieved by heating the bromoalkane with sodium ethoxide in ethanol:
CH3CH2CH2CH2Br CH3CH2CH2CH2OCH2CH3
CH3CH2O-Na
+
in ethanol A nucleophilic substitution reaction takes place to form the ether but
because sodium ethoxide is such a strong base, some of the 1-bromobutane will undergo a base-induced elimination reaction to form
but-1-ene (CH3CH2CH=CH2). Formation of a side product inevitably reduces the yield of the main product.
• The product may undergo further reaction before it can be isolated from
the reaction mixture. This is particularly relevant in the preparation of aldehydes from primary alcohols. The alcohol is normally oxidised by heating it with acidified potassium dichromate solution and unless the aldehyde is distilled from the reaction mixture as soon as it forms, significant amounts will undergo further oxidation to the corresponding carboxylic acid. Consequently, the aldehyde yield is reduced.
• There may be uncertainty in the purity of the limiting reactant. No
problem arises if we know the percentage purity because we can take account of it when calculating the theoretical yield of product. Suppose, for example, we had carried out a reaction in which ethanol was the limiting reactant. On the grounds of cost we would use industrial ethanol (96% pure) rather than absolute ethanol (100% pure). Let’s say 5.83 g of the industrial ethanol had been weighed out initially. Of this 5.83 g sample only 5.60 g (96% of 5.83 g) is actually ethanol and so in calculating the theoretical yield we would use 5.60 g as the mass of limiting reactant rather than 5.83 g. If the percentage purity of the limiting reactant is unknown then we can’t compensate for it. We must assume it to be 100% pure and this will result in the percentage yield being underestimated.
• Mechanical loss of the product may occur. For example, during isolation and purification the product may be transferred from one vessel to another on numerous occasions. As a result, some of it will fail to reach the final container. Product loss will also occur in

ORGANIC TECHNIQUES
CHEMISTRY 89
recrystallisation since some will remain dissolved in the mother-liquor. Loss can also occur through evaporation and this would be the case if the product were a volatile liquid. While mechanical loss of product cannot be eliminated, good experimental technique will minimise it.

CHEMISTRY 90
WRITING PPA REPORTS
CHEMISTRY 91
SECTION 7 Writing PPA Reports Introduction For each of the Prescribed Practical Activities (PPAs) you will be provided with: • a student guide, which contains advice on preparing for and carrying out
the PPA • a student instructions sheet, which includes a brief introduction to the
PPA, a list of requirements (equipment and chemicals), the hazards and control measures associated with the chemicals used and a detailed experimental procedure.
Once the practical work has been completed, a report on the PPA should be written. As far as internal assessment is concerned, it is important to remember that a report on only one PPA from each of the three theory units is required as evidence of achievement of Outcome 3. In the external examination, however, approximately six marks are allocated to questions on the PPAs and you will require a working knowledge of all twelve. As well as that outlined below, advice on writing a PPA report is included in the sheet Outcome 3: Advice to candidates.* The student guide mentioned above also raises specific points about the PPA – addressing these in your report will help you meet the performance criteria on which you will be assessed. It is not necessary that reports be word-processed – hand-written accounts are equally acceptable. You should head the report with your name and the date on which the PPA was carried out. Your report must be titled and this can be copied directly from the student instructions sheet. The rest of the report should be sub-divided into four main sections – Introduction, Procedure, Results and Discussion – and written in the past tense and in your own words. The
* The Outcome 3: Advice to candidates sheet can be found in section 5 of the first NAB of each unit.
WRITING PPA REPORTS
92 CHEMISTRY
passive voice should also be used, thus: ‘25.0 cm3 of the sodium hydroxide solution was pipetted into a conical flask’ rather than the imperative: ‘Pipette 25.0 cm3 of the sodium hydroxide solution into a conical flask’ or the personal voice: ‘I pipetted 25.0 cm3 of the sodium hydroxide solution into a conical flask’. The purpose of the Introduction is to set the scene and this should be done in general terms. It will start with a clear statement of the aim of the experiment and should include a brief description of how the aim is to be achieved along with the relevant background theory. It is in this section of the report that equations for any reactions involved in the experiment should be presented. The Procedure should contain a succinct account of how the experiment was carried out. It should be much briefer than the exhaustive instructions given in the student instructions sheet – the detail should be such that anyone reading your report would know what you did rather than be able to repeat the experiment exactly.* There is no need to list the requirements of the experiment and the Procedure should be presented as a paragraph of prose rather than a numbered list of procedural points.
When describing techniques or apparatus, you should bear in mind that a well-labelled diagram can convey far more than several paragraphs of prose. For example, in preparing benzoic acid from ethyl benzoate, a mixture of ethyl benzoate and sodium hydroxide solution is heated under reflux. Rather than describe the assembled apparatus in words it is far better to provide a diagram such as that illustrated in Figure 26.
* This is in contrast to the Investigation report where procedural details must be sufficient to allow the investigation to be repeated.

WRITING PPA REPORTS
CHEMISTRY 93
Figure 26
You need not attempt an elaborate drawing to convey the three-dimensional aspect of the assembled apparatus. Keep it simple and draw a sectional line diagram. Imagine the apparatus sliced right through the middle and what you draw are the cut edges. You’ll notice that supporting equipment, such as clamps etc., are not drawn – they clutter the diagram and detract from its purpose. Neither is it necessary to label the individual items of equipment – it is obvious in Figure 26 that a condenser and a round-bottomed flask are being used. Chemicals, however, are treated differently. It would not be apparent from the diagram which chemicals had been used unless they were clearly labelled. It is not conventional to draw heating devices such as Bunsen burners and heating mantles. Instead, draw a couple of arrows to the point of heating and write the word ‘heat’ below them. In the Procedure it is appropriate to include certain observations, e.g. indicator colour changes, and to make comment on important aspects of safety. In the Results section it is vital that you include all raw data as well as processed or derived data. By raw data we mean the readings you actually record during the course of the experiment. For example, in titrations, the raw data are the burette readings and the titre volumes are processed data.
WRITING PPA REPORTS
94 CHEMISTRY
The style and layout of the Results section will depend on the nature of the experiment but where appropriate raw and processed data should be presented in tabular form. Tables should be suitably headed and units must be specified. Results may also be presented in graphical form as long as tables of raw and/or processed data support the graphs. In other words, a graph on its own is not sufficient – the data from which it has been derived must also be presented. In drawing a graph, make sure that: • scales are chosen so that the plotted points are widely spread • each axis is labelled with the name of the quantity and the unit • data are plotted accurately • a best-fit straight line or curve is drawn – not a zig-zag. Care must be taken with significant figures in presenting and processing data. In calculations, for example, it is appropriate that intermediate results carry one or two extra digits beyond the last significant one, but the raw data and final result should be quoted with the correct number of significant figures. It is in the Results section that any uncertainty calculations you choose to do should be presented. The final section of the report, the Discussion, allows you to demonstrate your skills of critical awareness. It should begin with a conclusion, which must relate back to the aim of the experiment and must be based solely on your findings. The Discussion should also contain an evaluation of the results and the procedures. Points to be considered here might include: • comparing your result with theory or some accepted value and making
comment on the accuracy • comparing duplicate results and commenting on the precision • identifying sources of error • discussing the limitations of the equipment and the procedures and
suggesting possible improvements • explaining unexpected results or behaviour.

WRITING PPA REPORTS
CHEMISTRY 95
Exemplar materials In the pages that follow, a student guide and a student instructions sheet for two exemplar PPAs, Preparation of ethyl ethanoate and Determination of the percentage calcium carbonate in marble, are presented along with an exemplar report on each one.
WRITING PPA REPORTS
96 CHEMISTRY
EXEMPLAR1
ADVANCEDHIGHER
CHEMISTRYPreparation of ethyl ethanoate
- STUDENT GUIDE -
Preparing for the PPA The outcome of a PPA is largely dependent on your initial preparation. For success, this preparation must be thorough and detailed. You should read through the student instructions sheet for the PPA and be clear about the following points: • the aim(s) of the experiment • how the aim(s) is to be achieved • the procedural details of the experiment • the measurements/observation to be made • how the measurements/observations will be recorded • the safety measures associated with the experiment. It is also important to be aware of how long it will take to carry out the experiment and to plan your time accordingly. If you are working as a group, decide how the PPA will be managed by allocating tasks to each member. It is vital that you play an active part in preparing for the PPA. Carrying out the PPA You should carry out the experiment safely and efficiently according to the procedural details outlined in the student instructions sheet. If you are working as a group, it is important that you take an active role in carrying out the experiment. Writing a report on the PPA You should write a report on the experiment paying attention to relevant points outlined in the sheet Outcome 3: Advice to candidates. In your report you may also wish to address the following points: (a) In the Introduction you could:
• write the equation for the reaction taking place between ethanol and ethanoic acid
• identify the type of reaction that takes place. (b) In the Procedure section you could:
• draw labelled diagrams of the assembled apparatus used for refluxing and for the initial distillation
• explain why the crude product is treated with sodium carbonate solution.
(c) In the Discussion section you could: • offer reasons for the fact that the yield of ethyl ethanoate is less than
100%.
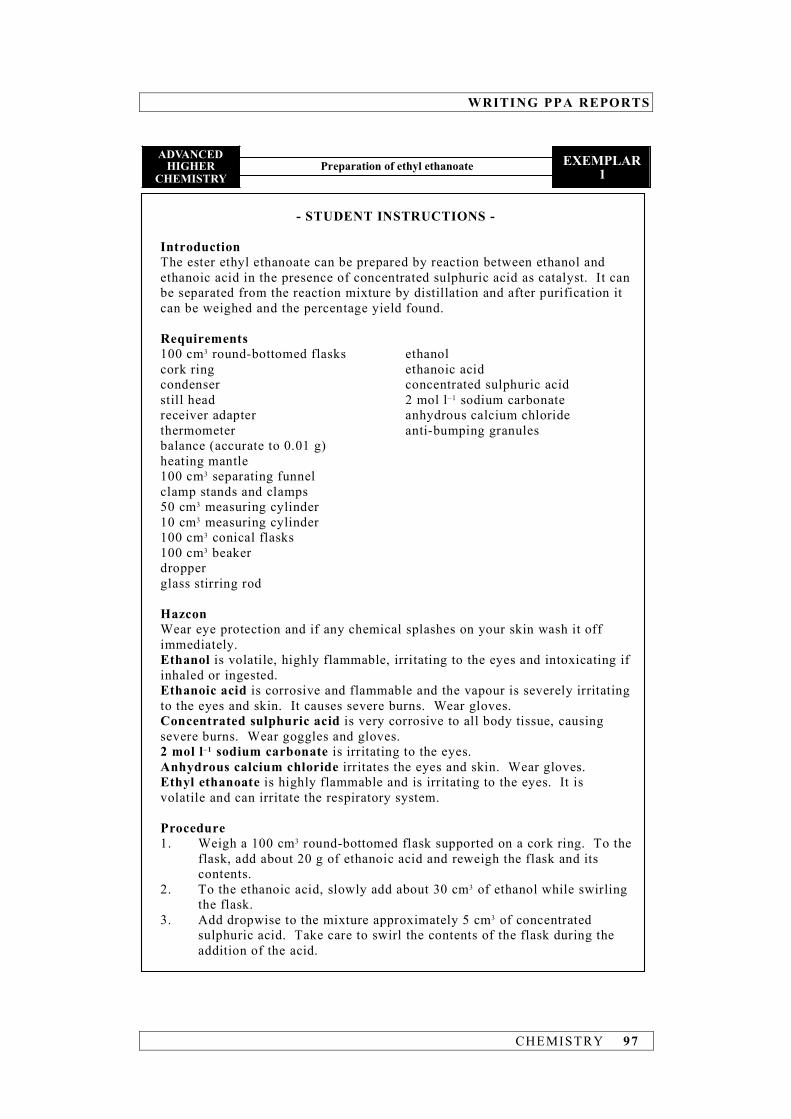
WRITING PPA REPORTS
CHEMISTRY 97
EXEMPLAR1
ADVANCEDHIGHER
CHEMISTRYPreparation of ethyl ethanoate
- STUDENT INSTRUCTIONS - Introduction The ester ethyl ethanoate can be prepared by reaction between ethanol and ethanoic acid in the presence of concentrated sulphuric acid as catalyst. It can be separated from the reaction mixture by distillation and after purification it can be weighed and the percentage yield found. Requirements 100 cm3 round-bottomed flasks ethanol cork ring ethanoic acid condenser concentrated sulphuric acid still head 2 mol l– 1 sodium carbonate receiver adapter anhydrous calcium chloride thermometer anti-bumping granules balance (accurate to 0.01 g) heating mantle 100 cm3 separating funnel clamp stands and clamps 50 cm3 measuring cylinder 10 cm3 measuring cylinder 100 cm3 conical flasks 100 cm3 beaker dropper glass stirring rod Hazcon Wear eye protection and if any chemical splashes on your skin wash it off immediately. Ethanol is volatile, highly flammable, irritating to the eyes and intoxicating if inhaled or ingested. Ethanoic acid is corrosive and flammable and the vapour is severely irritating to the eyes and skin. It causes severe burns. Wear gloves. Concentrated sulphuric acid is very corrosive to all body tissue, causing severe burns. Wear goggles and gloves. 2 mol l–1 sodium carbonate is irritating to the eyes. Anhydrous calcium chloride irritates the eyes and skin. Wear gloves. Ethyl ethanoate is highly flammable and is irritating to the eyes. It is volatile and can irritate the respiratory system. Procedure 1. Weigh a 100 cm3 round-bottomed flask supported on a cork ring. To the
flask, add about 20 g of ethanoic acid and reweigh the flask and its contents.
2. To the ethanoic acid, slowly add about 30 cm3 of ethanol while swirling the flask.
3. Add dropwise to the mixture approximately 5 cm3 of concentrated sulphuric acid. Take care to swirl the contents of the flask during the addition of the acid.
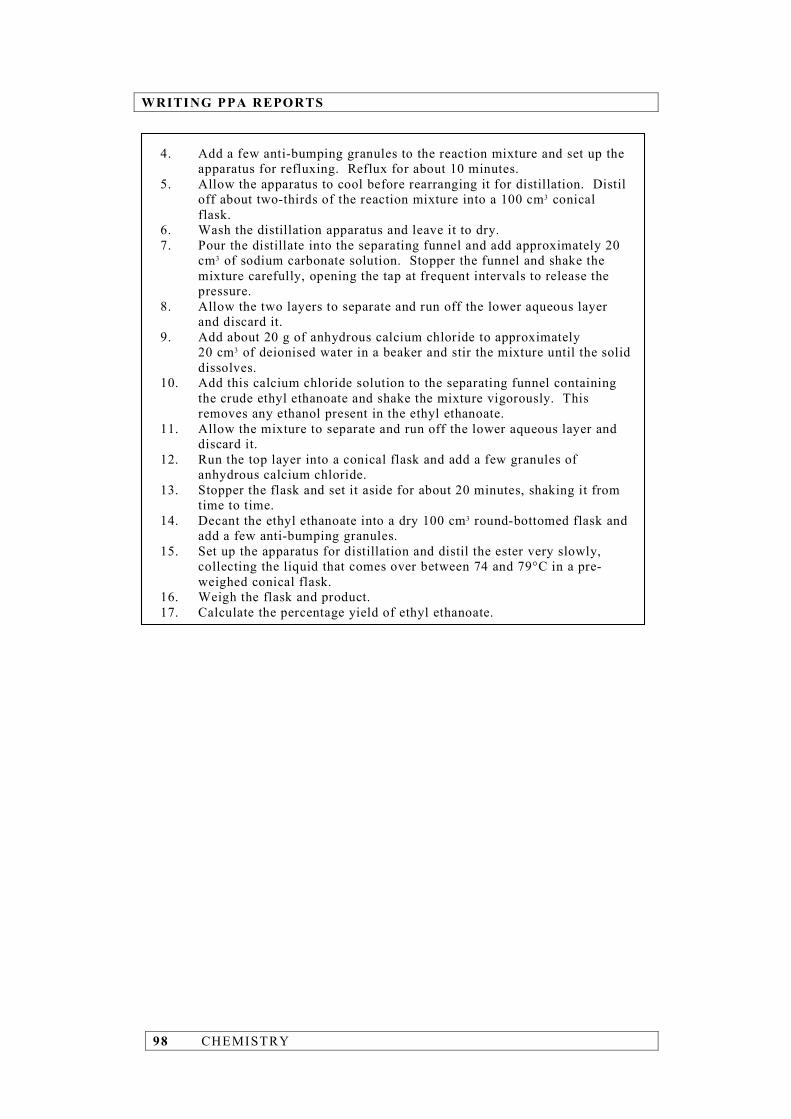
WRITING PPA REPORTS
98 CHEMISTRY
4. Add a few anti-bumping granules to the reaction mixture and set up the apparatus for refluxing. Reflux for about 10 minutes.
5. Allow the apparatus to cool before rearranging it for distillation. Distil off about two-thirds of the reaction mixture into a 100 cm3 conical flask.
6. Wash the distillation apparatus and leave it to dry. 7. Pour the distillate into the separating funnel and add approximately 20
cm3 of sodium carbonate solution. Stopper the funnel and shake the mixture carefully, opening the tap at frequent intervals to release the pressure.
8. Allow the two layers to separate and run off the lower aqueous layer and discard it.
9. Add about 20 g of anhydrous calcium chloride to approximately 20 cm3 of deionised water in a beaker and stir the mixture until the solid
dissolves. 10. Add this calcium chloride solution to the separating funnel containing
the crude ethyl ethanoate and shake the mixture vigorously. This removes any ethanol present in the ethyl ethanoate.
11. Allow the mixture to separate and run off the lower aqueous layer and discard it.
12. Run the top layer into a conical flask and add a few granules of anhydrous calcium chloride.
13. Stopper the flask and set it aside for about 20 minutes, shaking it from time to time.
14. Decant the ethyl ethanoate into a dry 100 cm3 round-bottomed flask and add a few anti-bumping granules.
15. Set up the apparatus for distillation and distil the ester very slowly, collecting the liquid that comes over between 74 and 79°C in a pre-weighed conical flask.
16. Weigh the flask and product. 17. Calculate the percentage yield of ethyl ethanoate.
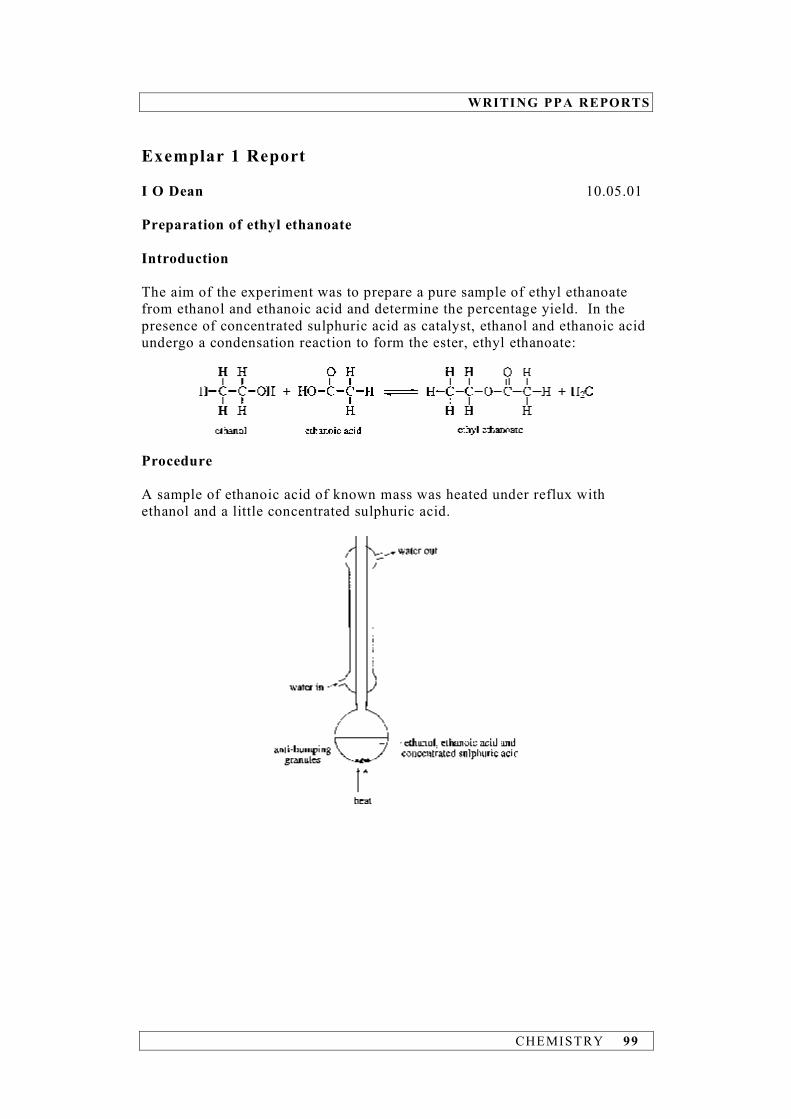
WRITING PPA REPORTS
CHEMISTRY 99
Exemplar 1 Report I O Dean 10.05.01 Preparation of ethyl ethanoate Introduction The aim of the experiment was to prepare a pure sample of ethyl ethanoate from ethanol and ethanoic acid and determine the percentage yield. In the presence of concentrated sulphuric acid as catalyst, ethanol and ethanoic acid undergo a condensation reaction to form the ester, ethyl ethanoate:
Procedure A sample of ethanoic acid of known mass was heated under reflux with ethanol and a little concentrated sulphuric acid.
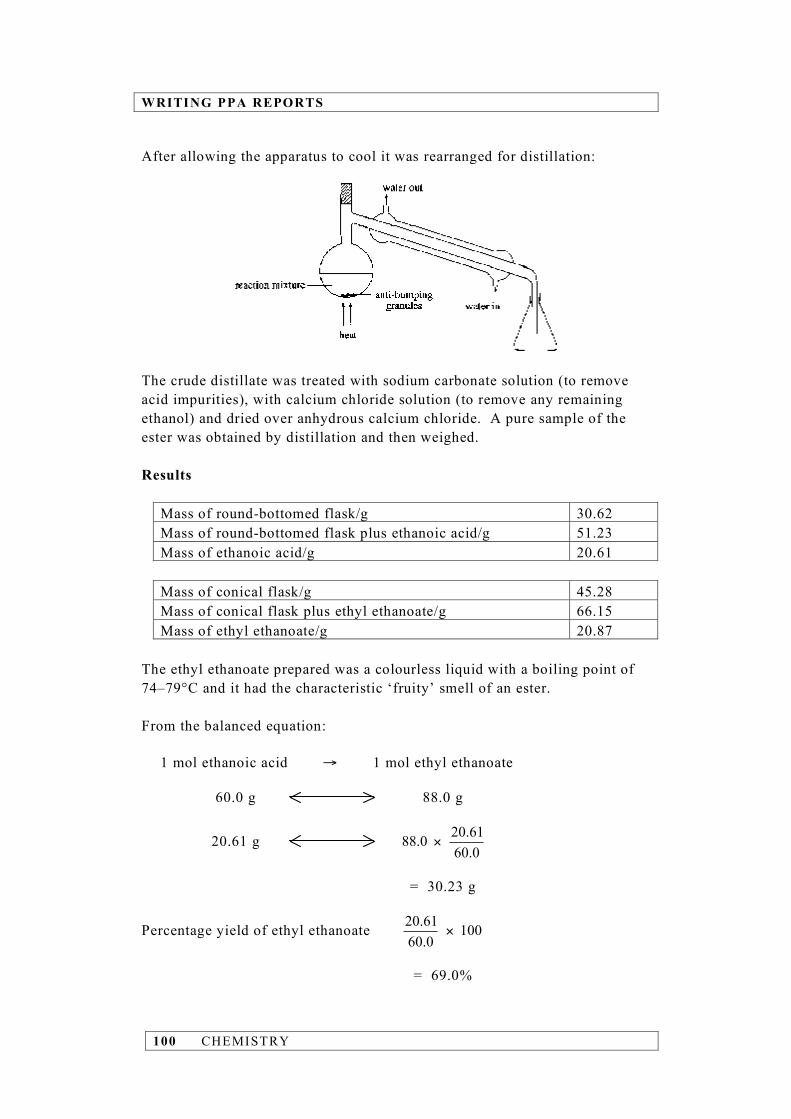
WRITING PPA REPORTS
100 CHEMISTRY
After allowing the apparatus to cool it was rearranged for distillation:
The crude distillate was treated with sodium carbonate solution (to remove acid impurities), with calcium chloride solution (to remove any remaining ethanol) and dried over anhydrous calcium chloride. A pure sample of the ester was obtained by distillation and then weighed. Results
Mass of round-bottomed flask/g 30.62 Mass of round-bottomed flask plus ethanoic acid/g 51.23 Mass of ethanoic acid/g 20.61 Mass of conical flask/g 45.28 Mass of conical flask plus ethyl ethanoate/g 66.15 Mass of ethyl ethanoate/g 20.87
The ethyl ethanoate prepared was a colourless liquid with a boiling point of 74–79°C and it had the characteristic ‘fruity’ smell of an ester. From the balanced equation: 1 mol ethanoic acid → 1 mol ethyl ethanoate 60.0 g 88.0 g
20.61 g 20.6188.0
60.0!
= 30.23 g
Percentage yield of ethyl ethanoate 20.61 100
60.0!
= 69.0%

WRITING PPA REPORTS
CHEMISTRY 101
Discussion A sample of ethyl ethanoate with a boiling point of 74–79°C was successfully prepared from ethanol and ethanoic acid. The yield was 69%. The yield fell short of 100% because: • the reaction is reversible • product would be lost during its transfer from one container to another • ethyl ethanoate is volatile and appreciable quantities would be lost through
evaporation • ethyl ethanoate is slightly soluble in water and during the extraction
process some of it would remain dissolved in the sodium carbonate and calcium chloride solutions.

WRITING PPA REPORTS
102 CHEMISTRY
ADVANCEDHIGHER
CHEMISTRYDetermination of the percentage calcium carbonate in marble EXEMPLAR
2
- STUDENT GUIDE -
Preparing for the PPA The outcome of a PPA is largely dependent on your initial preparation. For success, this preparation must be thorough and detailed. You should read through the student instructions sheet for the PPA and be clear about the following points: • the aim(s) of the experiment • how the aim(s) is to be achieved • the procedural details of the experiment • the measurements/observation to be made • how the measurements/observations will be recorded • the safety measures associated with the experiment. It is also important to be aware of how long it will take to carry out the experiment and to plan your time accordingly. If you are working as a group, decide how the PPA will be managed by allocating tasks to each member. It is vital that you play an active part in preparing for the PPA. Carrying out the PPA You should carry out the experiment safely and efficiently according to the procedural details outlined in the student instructions sheet. If you are working as a group, it is important that you take an active role in carrying out the experiment. Writing a report on the PPA You should write a report on the experiment paying attention to relevant points outlined in the sheet Outcome 3: Advice to candidates. In your report you may also wish to address the following points: (a) The Introduction could include: • an explanation of the back titration technique and why it is necessary
in this determination • equations for the reactions taking place in the determination. (b) In the Procedure section you could: • state how you knew the reaction between the hydrochloric acid and
marble was complete. (c) In the Discussion section you could: • comment on whether or not the difference in your two independent
estimates of the percentage calcium carbonate in marble is covered by the calculated uncertainty
• identify the major factor(s) contributing to the uncertainty in the percentage calcium carbonate in marble.

WRITING PPA REPORTS
CHEMISTRY 103
ADVANCEDHIGHER
CHEMISTRYDetermination of the percentage calcium carbonate in marble EXEMPLAR
2
- STUDENT INSTRUCTIONS -
Introduction Marble is a natural form of calcium carbonate and can be determined by a back titration technique. A known mass of marble is treated with a definite amount of hydrochloric acid and the excess acid is determined by titration against a standard solution of sodium hydroxide. Requirements 250 cm3 standard flask powdered marble 100 cm3 conical flasks ~1.0 mol l– 1 hydrochloric acid 50 cm3 pipette ~0.10 mol l–1 sodium hydroxide 25 cm3 pipette bromophenol blue 50 cm3 burette deionised water beakers weighing bottle balance (accurate to 0.01 g) pipette filler filter funnel white tile wash bottle dropper Hazcon Wear eye protection and if any chemical splashes on your skin wash it off immediately. 1.0 mol l–1 hydrochloric acid irritates the eyes, skin and respiratory system. 0.1 mol l–1 sodium hydroxide irritates the eyes and skin. Procedure Carry out the following procedure in duplicate.
1. Transfer about 1.0 g of powdered marble to the weighing bottle and weigh
the bottle and contents. 2. Add the marble to the 250 cm3 standard flask and reweigh the weighing
bottle. 3. Rinse the 50 cm3 pipette with 1.0 mol l–1 hydrochloric acid and pipette 50 cm3 of this solution into the standard flask containing the marble. 4. When the reaction between the marble and the acid is complete, add
deionised water to the standard flask until the solution level is within about a centimetre of the graduation mark.
5. Using a dropper, make up the solution to the graduation mark with deionised water.
6. Stopper the flask and invert it several times to ensure the contents are thoroughly mixed.
7. Rinse the burette, including the tip, with 0.10 mol l–1 sodium hydroxide and fill it with the same solution.
WRITING PPA REPORTS
104 CHEMISTRY
8. Rinse the 25 cm3 pipette with a little of the reaction solution from the standard flask and pipette 25 cm3 of it into a 100 cm3 conical flask.
9. Add a few drops of bromophenol blue indicator to the solution in the conical flask and titrate to the end-point.
10. Repeat the titrations until two concordant results are obtained. 11. Calculate the percentage by mass of calcium carbonate in the marble
sample using the accurate concentrations of the hydrochloric acid and sodium hydroxide solutions provided by your teacher/lecturer.
12. For one of your determinations, calculate the percentage uncertainty and hence the absolute uncertainty in the percentage calcium carbonate in marble. Your teacher/lecturer will provide you with the uncertainties in the concentrations of the hydrochloric acid and sodium hydroxide solutions.
WRITING PPA REPORTS
CHEMISTRY 105
Exemplar 2 Report K Ripton 11.05.01 Determination of the percentage calcium carbonate in marble Introduction The aim of the experiment was to determine the percentage by mass of calcium carbonate in a given sample of marble. Since marble is insoluble in water, its calcium carbonate content cannot be determined by direct titration against a standard acid and so an indirect method, namely back titration, must be used. A known but excess amount of hydrochloric acid is added to a marble sample of accurately known mass:
CaCO3(s) + 2HCl(aq) → CO2(g) + H2O(l) + CaCl2(aq) After reaction, the amount of hydrochloric acid remaining is found by titrating the reaction mixture against a standard sodium hydroxide solution:
HCl(aq) + NaOH(aq) → H2O(l) + NaCl(aq) The difference between the initial and excess amounts of hydrochloric acid allows the mass and hence the percentage by mass of calcium carbonate in the marble sample to be calculated. Procedure An accurately known mass of powdered marble was transferred to a standard flask followed by a sample of hydrochloric acid of known volume and concentration. When reaction was complete, the solution was made up to the graduation mark with deionised water. After thorough mixing, portions of the reaction solution were titrated against a standard solution of sodium hydroxide until concordant results were obtained. Bromophenol blue was used as the indicator (yellow to blue colour change). The above procedure was repeated using a second sample of marble.
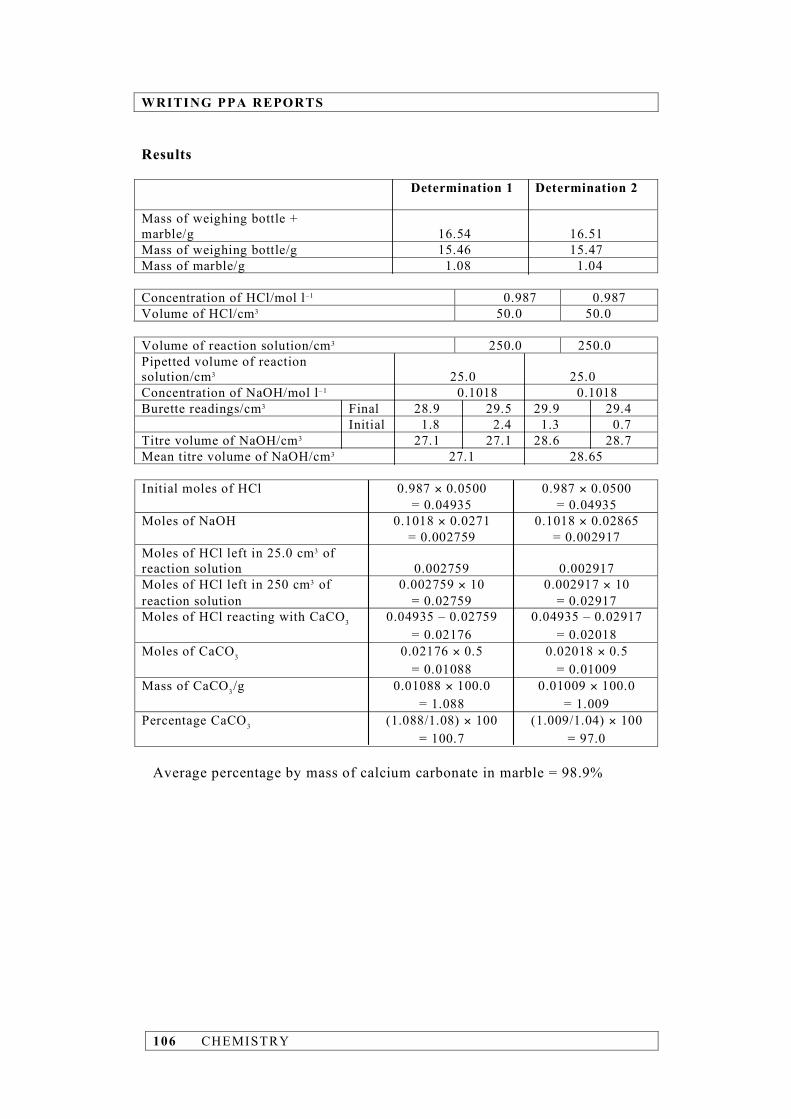
WRITING PPA REPORTS
106 CHEMISTRY
Results Determination 1 Determination 2
Mass of weighing bottle + marble/g 16.54 16.51 Mass of weighing bottle/g 15.46 15.47 Mass of marble/g 1.08 1.04 Concentration of HCl/mol l–1 0.987 0.987 Volume of HCl/cm3 50.0 50.0 Volume of reaction solution/cm3 250.0 250.0 Pipetted volume of reaction solution/cm3 25.0 25.0 Concentration of NaOH/mol l– 1 0.1018 0.1018 Burette readings/cm3 Final 28.9 29.5 29.9 29.4 Initial 1.8 2.4 1.3 0.7 Titre volume of NaOH/cm3 27.1 27.1 28.6 28.7 Mean titre volume of NaOH/cm3 27.1 28.65
Initial moles of HCl 0.987 × 0.0500 0.987 × 0.0500 = 0.04935 = 0.04935 Moles of NaOH 0.1018 × 0.0271 0.1018 × 0.02865 = 0.002759 = 0.002917 Moles of HCl left in 25.0 cm3 of reaction solution 0.002759 0.002917 Moles of HCl left in 250 cm3 of 0.002759 × 10 0.002917 × 10 reaction solution = 0.02759 = 0.02917 Moles of HCl reacting with CaCO3 0.04935 – 0.02759 0.04935 – 0.02917 = 0.02176 = 0.02018 Moles of CaCO3 0.02176 × 0.5 0.02018 × 0.5 = 0.01088 = 0.01009 Mass of CaCO3/g 0.01088 × 100.0 0.01009 × 100.0 = 1.088 = 1.009 Percentage CaCO3 (1.088/1.08) × 100 (1.009/1.04) × 100 = 100.7 = 97.0
Average percentage by mass of calcium carbonate in marble = 98.9%
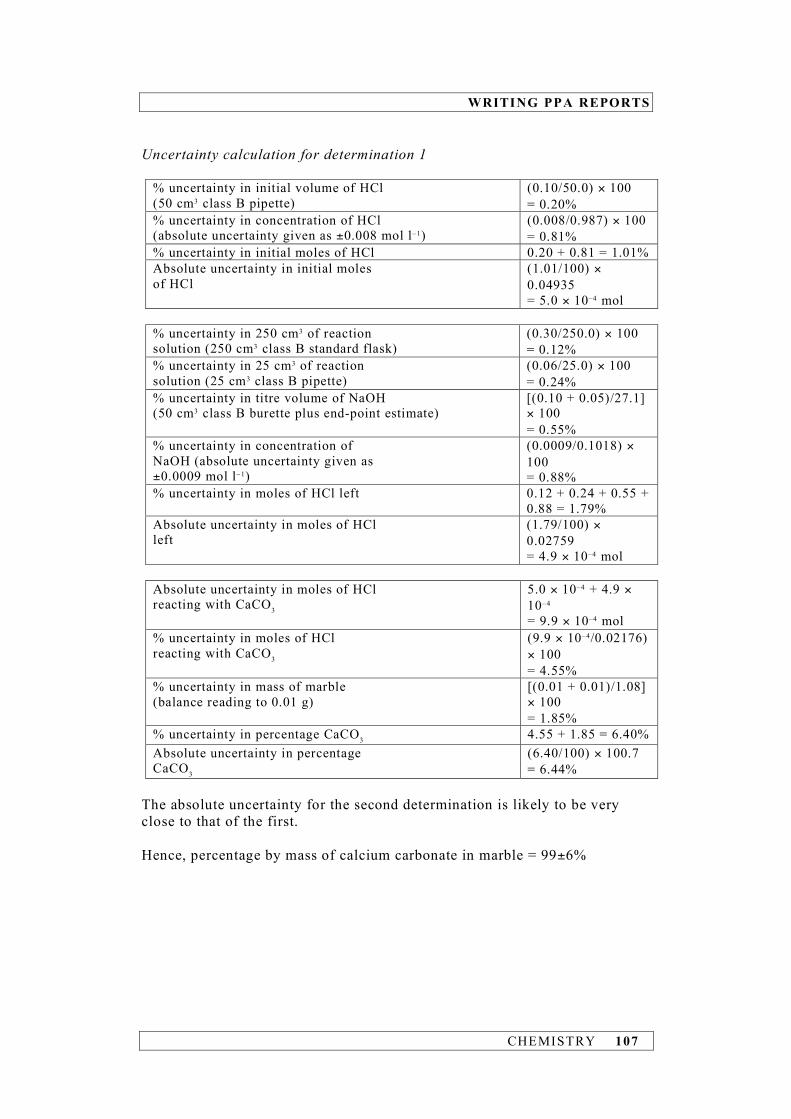
WRITING PPA REPORTS
CHEMISTRY 107
Uncertainty calculation for determination 1
% uncertainty in initial volume of HCl (50 cm3 class B pipette)
(0.10/50.0) × 100 = 0.20%
% uncertainty in concentration of HCl (absolute uncertainty given as ±0.008 mol l– 1)
(0.008/0.987) × 100 = 0.81%
% uncertainty in initial moles of HCl 0.20 + 0.81 = 1.01% Absolute uncertainty in initial moles of HCl
(1.01/100) × 0.04935 = 5.0 × 10⁻⁴ mol
% uncertainty in 250 cm3 of reaction solution (250 cm3 class B standard flask)
(0.30/250.0) × 100 = 0.12%
% uncertainty in 25 cm3 of reaction solution (25 cm3 class B pipette)
(0.06/25.0) × 100 = 0.24%
% uncertainty in titre volume of NaOH (50 cm3 class B burette plus end-point estimate)
[(0.10 + 0.05)/27.1] × 100 = 0.55%
% uncertainty in concentration of NaOH (absolute uncertainty given as ±0.0009 mol l– 1)
(0.0009/0.1018) × 100 = 0.88%
% uncertainty in moles of HCl left 0.12 + 0.24 + 0.55 + 0.88 = 1.79%
Absolute uncertainty in moles of HCl left
(1.79/100) × 0.02759 = 4.9 × 10⁻⁴ mol
Absolute uncertainty in moles of HCl reacting with CaCO3
5.0 × 10⁻⁴ + 4.9 × 10– 4
= 9.9 × 10⁻⁴ mol % uncertainty in moles of HCl reacting with CaCO3
(9.9 × 10– 4/0.02176) × 100 = 4.55%
% uncertainty in mass of marble (balance reading to 0.01 g)
[(0.01 + 0.01)/1.08] × 100 = 1.85%
% uncertainty in percentage CaCO3 4.55 + 1.85 = 6.40% Absolute uncertainty in percentage CaCO3
(6.40/100) × 100.7 = 6.44%
The absolute uncertainty for the second determination is likely to be very close to that of the first. Hence, percentage by mass of calcium carbonate in marble = 99±6%

WRITING PPA REPORTS
108 CHEMISTRY
Discussion The aim of the experiment was met in that the percentage by mass of calcium carbonate present in the marble sample was determined as 99±6 %. The difference in the two independent estimates (101% and 97%) is 4% and this is within the calculated uncertainty of 6%. The major factor contributing to the overall uncertainty is in the mass of marble (approximately 2%) and this could have been reduced had a balance reading to ±0.001 g been used.
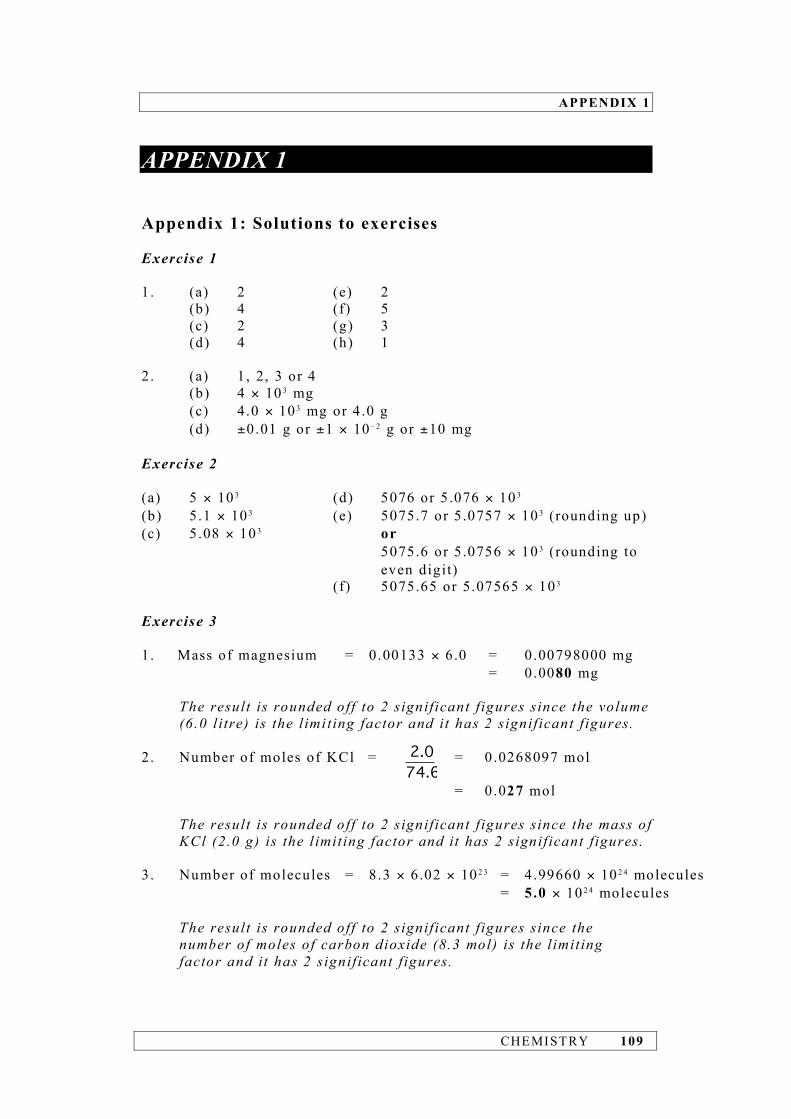
APPENDIX 1
CHEMISTRY 109
APPENDIX 1 Appendix 1: Solutions to exercises Exercise 1 1 . (a) 2 (e) 2 (b) 4 (f) 5 (c) 2 (g) 3 (d) 4 (h) 1 2 . (a) 1 , 2, 3 or 4 (b) 4 × 10 3 mg (c) 4 .0 × 10 3 mg or 4 .0 g (d) ±0.01 g or ±1 × 10 – 2 g or ±10 mg Exercise 2 (a) 5 × 10 3 (d) 5076 or 5 .076 × 10 3 (b) 5 .1 × 10 3 (e) 5075.7 or 5 .0757 × 10 3 (rounding up) (c) 5 .08 × 10 3 or 5075.6 or 5 .0756 × 10 3 (rounding to even digit) (f) 5075.65 or 5.07565 × 10 3 Exercise 3 1 . Mass of magnesium = 0.00133 × 6 .0 = 0.00798000 mg = 0 .0080 mg The result is rounded off to 2 significant figures since the volume
(6.0 li tre) is the limi ting factor and it has 2 significant figures. 2 . Number of moles of KCl = = 0.0268097 mol = 0 .027 mol The result is rounded off to 2 significant figures since the mass of
KCl (2.0 g) is the limiting factor and it has 2 significant figures. 3 . Number of molecules = 8.3 × 6 .02 × 10 2 3 = 4.99660 × 10 2 4 molecules = 5.0 × 10 2 4 molecules The result is rounded off to 2 significant figures since the
number of moles of carbon dioxide (8.3 mol) is the limiting factor and it has 2 significant figures.
2.0
74.6

APPENDIX 1
110 CHEMISTRY
4. Volume of NaOH(aq) = = 2.00000 litre = 2.00 l i tre Both the number of moles and concentration have 3 significant
figures and so the result is rounded off to 3 significant figures. 5 . KBr: mass of one mole = 39.1 +79.9 = 119.0 g The result is quoted to 1 decimal place since both relative atomic
masses are quoted to 1 decimal place. Notice that the number of significant figures in the result i s 4 yet the relat ive atomic masses only have 3 significant figures.
6 . Mass of liquid transferred = 15.653 –12.793 = 2.860 g Both masses are quoted to 3 decimal places and so the result
must have the same number of decimal places. 7 . Mass of chemical unsold = 1.65 × 10 6 –0.922 × 10 6 = 0 .728 × 10 6 tonnes = 0 .73 × 10 6 tonnes (or 7.3 × 10 5 tonnes) The original mass of the chemical is quoted to 2 decimal places
and so must the final result when expressed to the same power of 10.
8 . [H+] = antilog(–11.76) = 1.73780 × 10 – 1 2 mol l– 1 = 1.7 × 10 – 1 2 mol l– 1
The pH is a logarithm and since there are 2 digits in the
mantissa then the final result can only have 2 significant figures. 9 . pKa = –log(3.02 × 10 – 1 1) = 10.5200 = 10.520 The K a value has 3 significant figures and so the pK a value must
have 3 digits in its mantissa.
0.300
0.150
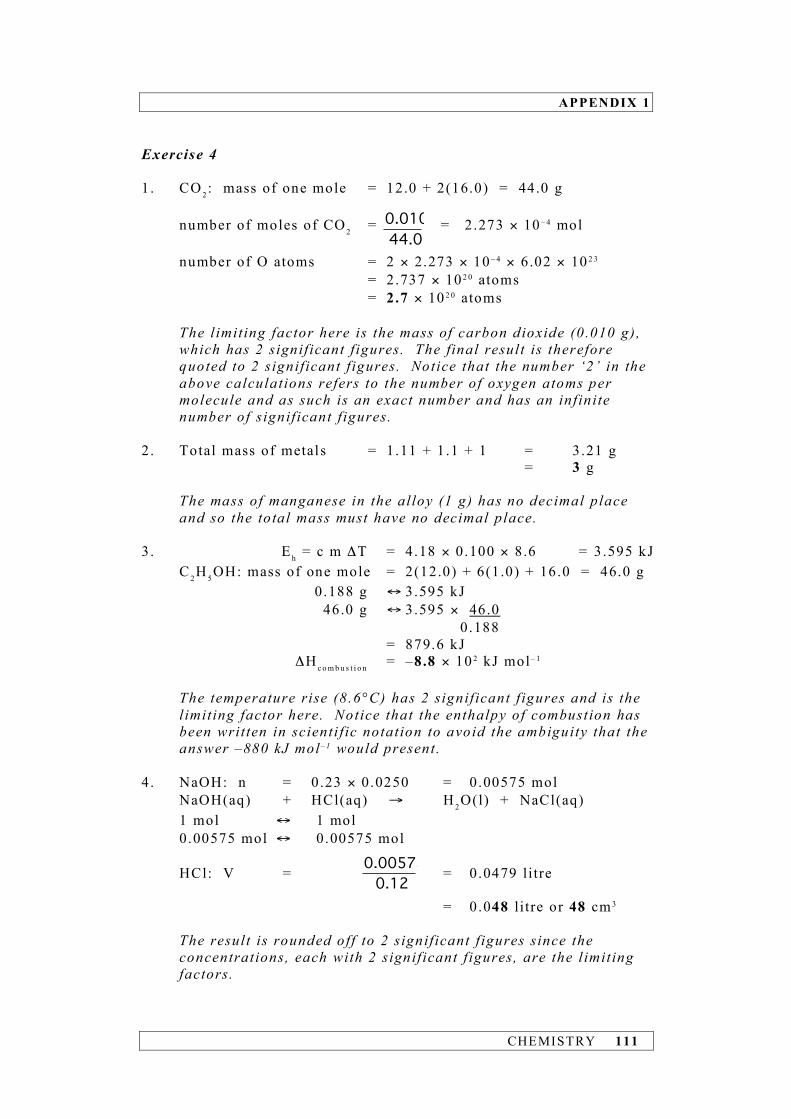
APPENDIX 1
CHEMISTRY 111
Exercise 4 1 . CO2: mass of one mole = 12.0 + 2(16.0) = 44.0 g number of moles of CO2 = = 2.273 × 10 – 4 mol number of O atoms = 2 × 2.273 × 10 – 4 × 6 .02 × 10 2 3 = 2 .737 × 10 2 0 atoms = 2.7 × 10 2 0 atoms The limiting factor here is the mass of carbon dioxide (0.010 g),
which has 2 significant figures. The final result is therefore quoted to 2 significant figures. Notice that the number ‘2’ in the above calculations refers to the number of oxygen atoms per molecule and as such is an exact number and has an infinite number of significant figures.
2 . Total mass of metals = 1.11 + 1.1 + 1 = 3.21 g = 3 g The mass of manganese in the alloy (1 g) has no decimal place
and so the total mass must have no decimal place. 3 . E h = c m ΔT = 4.18 × 0 .100 × 8 .6 = 3.595 kJ C 2H5OH: mass of one mole = 2(12.0) + 6(1.0) + 16.0 = 46.0 g 0 .188 g ↔ 3.595 kJ 46.0 g ↔ 3 .595 × 46.0 0 .188 = 879.6 kJ ΔHc o m b u s t i o n = –8.8 × 10 2 kJ mol– 1
The temperature rise (8 .6°C) has 2 significant figures and is the
limiting factor here. Notice that the enthalpy of combustion has been written in scienti fic notation to avoid the ambiguity that the answer –880 kJ mol– 1 would present.
4 . NaOH: n = 0.23 × 0.0250 = 0.00575 mol NaOH(aq) + HCl(aq) → H2O(l) + NaCl(aq) 1 mol ↔ 1 mol 0 .00575 mol ↔ 0 .00575 mol HCl: V = = 0.0479 litre = 0 .048 l i tre or 48 cm3
The result is rounded off to 2 significant figures since the
concentrations, each with 2 significant figures, are the limiting factors.
0.010
44.0
0.00575
0.12

APPENDIX 1
112 CHEMISTRY
5. CH2Cl2: mass of one mole = 12.0 + 2(1.0) + 2(35.5) = 85.0 g molar volume = = 63.623 cm3
= 63.6 cm3
The result is rounded off to 3 significant figures since the molar
mass of CH2Cl2 (85.0 g) is the limiting factor and it has 3 significant figures.
6 . Volume of silver = 16.3 – 154 = 9 cm3
density of silver = = 10.8 g cm– 3
= 1 × 10 1 g cm– 3
In this case, i t is the volume of silver (9 cm3) that is the limiting
factor. Notice, too, that the result is written in scientific notation – this is to avoid the confusion that would be raised by the answer 10 g cm– 3.
7 . Q = It = 2 × 503 = 1006 C 2H+(aq) + 2e → H2(g) 2 mol 1 mol 2 × 9.65 × 10 4 C ↔ 24 litre 1006 C ↔ 24 × = 0 .125 litre = 0 .1 l i tre The current (2 A) has only 1 significant figure and so the final
result must be rounded off to 1 significant figure. 8 . Titre volume 1 = 14.0 – 5.7 = 8.3 cm3 Titre volume 2 = 22.4 – 14.0 = 8.4 cm3 Mean titre volume = 8.35 cm3 MnO4
–: n = 0.106 × 0 .00835 = 8 .851 × 10 – 4 mol 2MnO4
– + 5H2O2 → 2 mol ↔ 5 mol 8 .851 × 10 – 4 mol ↔ 5 × = 2 .213 × 10 – 3 mol H2O2: C = = 0 .2213 mol l– 1 = 0 .22 mol l– 1
85.0
1.336
97.2
9
4
1006
29.6510! !
–48.85110
2
!
–32.21310
0.0100
!

APPENDIX 1
CHEMISTRY 113
Only 2 significant figures are justi f ied in the mean titre volume but since it is an intermediate result , i t carries an extra digit . Nevertheless, i t i s sti l l the limit ing factor in the calculation and this is why the final result must be rounded off to 2 significant figures.
Exercise 5 1 . It would lead to a systematic error since the student’s ti t re
volumes would all be greater than the true value or all be less than the true value.
2 . There would be a systematic error in her results since all of them
would be less than the true values by about 0 .09 pH units. 3 . (a) (i) Student B achieved greater precision since the spread
in her results (0 .002 mol l– 1) is smaller than the spread in student A’s results (0 .008 mol l– 1) .
(i i) Student A achieved the greater accuracy since her results are closer to the true value than student B’s results.
(b) The technique is not reproducible since student A’s results are not in close agreement with student B’s results.
(c) Student B’s results show a systematic error since they are all less than the true value.
Exercise 6 1. (a) (i) % uncertainty = × 100 = 0.08%
(i i) % uncertainty = 0.10
100.00 × 100 = 0.1%
(b) (i) % uncertainty = × 100 = 0.2% (i i) % uncertainty = × 100 = 1% (c) (i) 50 cm3 class A pipette % uncertainty = × 100 = 0.1%
0.05
50.00
0.10
10.00
0.02
10.00
0.08
100.00
APPENDIX 1
114 CHEMISTRY
(ii) 50 cm3 class B volumetric flask
% uncertainty = × 100 = 0.24%
(iii) 50 cm3 class A burette
% uncertainty = × 100 = 0.1%
(iv) Balance reading to ±0.01 g
% uncertainty = × 100 = 0.02% The balance should be used. 2 . (a) absolute uncertainty = × 58.4425 = 0 .0002 Hence, RFM of NaCl = 58.4425 ± 0 .0002 (b) absolute uncertainty = × 9 .0 = 0 .02 cm3 A 10 cm3 class B burette must have been used. (c) absolute uncertainty = × 17 = 0 .03 g A balance reading to 1 decimal place would not meet the
accuracy required since it would have an absolute uncertainty of ±0.1 g, which is greater than ±0.03 g.
Exercise 7 1. (a) % uncertainty in mass = × 100 = 0.22% % uncertainty in volume = × 100 = 1.77% (b) density = = 4.10 g cm– 3
% uncertainty in density = 0.22 + 1.77 = 1.99% absolute uncertainty in density = × 4 .10 = 0.08 g cm– 3
Hence, density = 4.10 ± 0 .08 g cm– 3
0.12
50.00
0.05
50.00
0.01
50.00
–43.410
100
!
0.22
100
0.2
100
0.01
4.63
4.63
1.13
1.99
100
0.02
1.13
APPENDIX 1
CHEMISTRY 115
2. (a) NaOH: n = 0 .0936 × 0 .02165 = 2.0264 × 10 – 3 mol CH3COOH(aq) + NaOH(aq) → H2O(l) + CH3COONa(aq)
1 mol ↔ 1 mol
2 .0264 × 10 – 3 mol ↔ 2 .0264 × 10 – 3 mol
no. of moles NaOH in 500 cm3 = 2.0264 × 10 – 3 × = 4.0528 ×10 – 2 mol
CH3COOH: C = = 0.811 mol l– 1 (b) % uncertainty in volume of undiluted acid (50 cm3 class B
pipette) = × 100 = 0.20%
% uncertainty in volume of diluted acid (500 cm3 class B
volumetric flask) = × 100 = 0.10%
% uncertainty in pipetted volume of diluted acid (25 cm3 class B
pipette) = × 100 = 0.24%
% uncertainty in ti tre volume (50 cm3 class B burette + end-point
estimate) = × 100 = 0.69%
% uncertainty in concentration of NaOH = × 100 = 0.96% % uncertainty in concentration of CH3COOH = 0 .20 + 0.10 + 0.24 + 0.69 + 0.96 = 2.19% absolute uncertainty in concentration of CH3COOH = × 0.811 = 0.018 mol l– 1
Hence, concentration of CH3COOH = 0.81 ± 0 .02 mol l– 1
500
25.0
–24.052810
0.0500
!
0.10
50.00
0.50
500.00
0.06
25.00
0.100.05
21.65
+
0.0009
0.0936
2.19
100

APPENDIX 1
116 CHEMISTRY
3. (a) % Ni = × 100 = 24.69% (b) (i) mass of NiCl2 .6H2O = 12.791 – 12.482 = 0 .309 g mass of complex = 20.689 – 20.321 = 0 .368 g mass of Ni in complex= × 58.69 = 0 .07475 g Hence, mass of Ni in NiCl2 .6H2O sample = 0.07475 g % Ni in NiCl2 .6H2O sample = × 100 = 24.2%
(ii) % uncertainty in mass of NiCl2 .6H2O (balance reading to 0 .001 g)
= × 100 = 0.65% % uncertainty in mass of complex (balance reading to
0 .001 g) = × 100 = 0.54% % uncertainty in % of Ni = 0.65 + 0.54 = 1.19% absolute uncertainty in % of Ni = × 24.2 = 0.29% Hence, % Ni in NiCl2 .6H2O = 24.2 ± 0 .3% (i i i) Theoretical % of Ni = 24.69 % Experimental % of Ni = 24.2±0.3% The experimental percentage of Ni will l ie between 23.9% and 24.5%. The theoretical % of Ni lies outwith th is range and so
the technique is not accurate. 4 . Consider 1000 cm3 (1.000 litre) of ammonia solution. mass of ammonia solution = 0.895 × 1000 = 895.0 g mass of NH3 in solution = × 895.0 = 250.6 g number of moles of NH3 = = 14.74 mol
58.69
237.69
0.368
288.92
0.07475
0.309
0.0010.001
0.309
+
0.0010.001
0.368
+
1.19
100
28.0
100
250.6
17.0
APPENDIX 1
CHEMISTRY 117
Hence, concentration of NH3 solution = 14.7 mol l– 1
% uncertainty in density = × 100 = 0.34% % uncertainty in % of NH3 = × 100 = 1.79% % uncertainty in RFM of NH3 = × 100 = 0.59% % uncertainty in concentration of NH3 = 0.34 + 1.79 + 0.59 = 2.72% absolute uncertainty in concentration of NH3 = × 14.7 = 0.40 mol l– 1
Hence, concentration of NH3 solution = 14.7±0.4 mol l– 1
2.72
100
0.1
17.0
0.5
28.0
0.003
0.895

CHEMISTRY 118
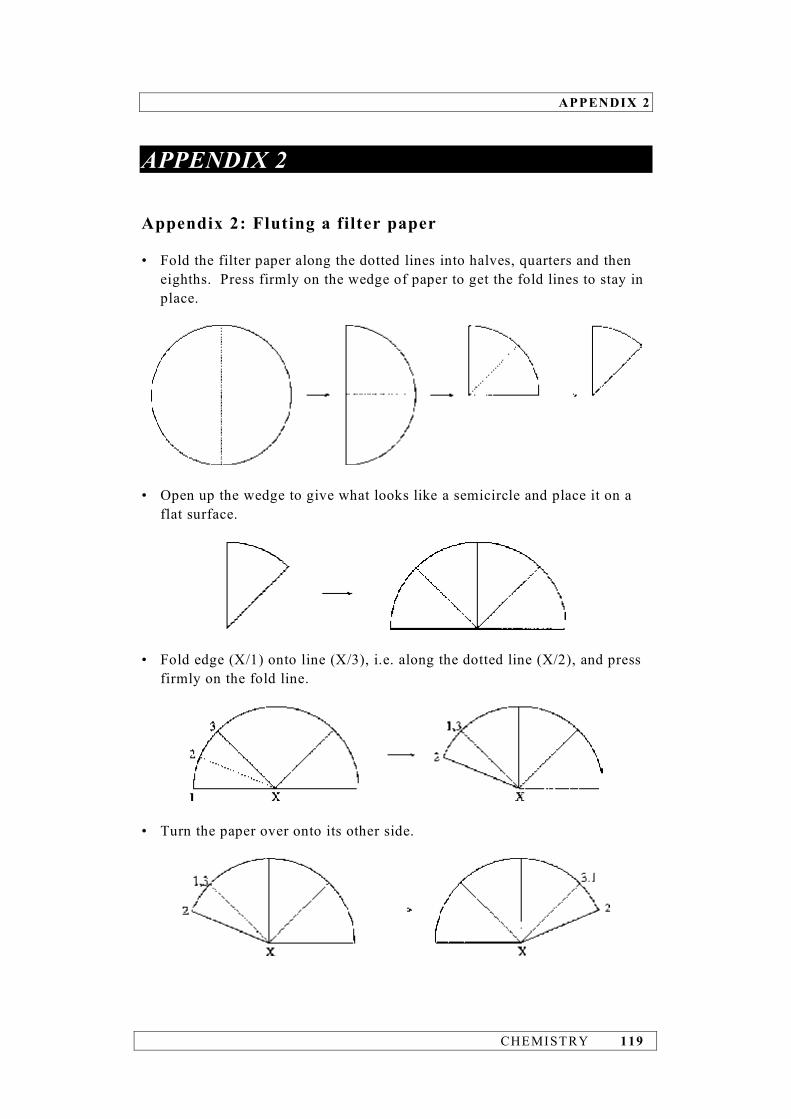
APPENDIX 2
CHEMISTRY 119
APPENDIX 2 Appendix 2: Fluting a filter paper • Fold the filter paper along the dotted lines into halves, quarters and then
eighths. Press firmly on the wedge of paper to get the fold lines to stay in place.
• Open up the wedge to give what looks like a semicircle and place it on a
flat surface.
• Fold edge (X/1) onto line (X/3), i.e. along the dotted line (X/2), and press
firmly on the fold line.
• Turn the paper over onto its other side.

APPENDIX 1
120 CHEMISTRY
• Fold edge (X/2) onto the dotted line (X/4), i.e. along line (X/3,1), and press firmly on the fold line.
• Turn the paper on its other side and fold edge (X/1,3) onto line (X,5).
Press firmly along the fold line (X/4,2).
• Continuing this pleating process produces a fan arrangement. On opening
the fan, the fluted filter paper is obtained!