Embed Size (px)
Citation preview
Version 1.3 2005-20-06 www.eionet.eu.int/gis Page 1 of 55
TEEA operational guidelinesT
Guide to geographical data and maps
June 2005
Draft version 1.3

Version 1.3 2005-20-06 www.eionet.eu.int/gis Page 2 of 55
Version management and approval Nr Date Changes Author 0.1 26-05-2003 Circulated draft Arvid Lillethun,
Sheila Cryan, Jan Bliki, Thor Jessen, Mette Lund
0.9 07-06-2004 Update and removal of sections, restructure of document, review comments from Andrus Meiner, Chris Steenmans and Tim Haigh
Mette Lund, Thor Jessen
1.0 22-07-2004 Corrections and edits of proof read version. Draft received from proof reading 10-06-2004
Mette Lund
1.0 26-07-2004 Review by programme manager Sigfús Bjarnason
1.0 20-08-2004 Corrections section 2 and 3 on coordinate reference systems and projections
Chris Steenmans
Sent to Senior Management Team.
1.2 18-02-2005 Minor corrections to the technical content Mette Lund, Thor Jessen
1.3 20-06-2005 Corrections to the technical content section 3 “Working With Point Locations: Latitude/Longitude” and major revision of section 5 “Using Grids”. Chapter 5 reviewed by Andrus Meiner and Chris Steenmans. Corrections in “EEA general guidelines on coordinate reference systems” and “Specification of map extents by coordinates”.
Thor Jessen, Linda Bredahl
Project manager: Chris Steenmans

Version 1.3 2005-20-06 www.eionet.eu.int/gis Page 3 of 55
Foreword The EEA is mandated by its regulation to provide high quality information to support the environmental policy process and sustainable development, and for the assessment of environmental achievements and outcomes. In this context, the EEA will provide more and better quality geographical information. Common routines and standardised processes are essential to obtain input data of acceptable quality in order to undertake quality assessments. The aim of these guidelines is to provide guidance on spatial data handling to all GIS users who deliver material to EEA products: internally at the EEA, at European topic centres (ETCs), or other partners. There is a need to strengthen the harmonisation of spatial data handling by different topic areas and to ensure improved quality control on spatial data and derived products, e.g. maps. These guidelines and accompanying EEA map data and EEA map templates were presented as draft versions at the HTUData Managers Workshop in June 2002 UTH, and have now been used by the EEA and several of the ETCs since summer 2002. The experience gained since the draft versions were introduced has led to the creation of this version 1.0 of the EEA guide for geographical data and maps (pending final approval of the EEA Senior Management Team) The guidelines are linked as far as possible to standardisation agreements within the European Commission and also to the initial work developed by Inspire – Infrastructure for spatial information in Europe (HTUhttp://www.ec-gis.org/inspireUTH). Data handling and information services are under rapid development. This affects the development of guidelines. It is expected that the development of different tools and information products will influence the recommendations for data handling and map productions, and thus that the guidelines too will need revision from time to time. Users of the guidelines will find updated information at the EEA website: HTUhttp://www.eionet.eu.int/gisUTH. Any comments and questions can be forwarded using the web interface at HTUhttp://www.eea.eu.int/help/infocentre/enquiriesUTH.
Version 1.3 2005-20-06 www.eionet.eu.int/gis Page 4 of 55
Contents
TU1. UT TUOVERVIEW OF TOPICSUT ....................................................................................................... 6 TU1.1. UT TUOVERVIEW OF TOPICS BY CHAPTERUT .................................................................................... 6
TU2. UT TUCOORDINATE REFERENCE SYSTEMS AND PROJECTIONS UT .................................... 7 TU2.1. UT TUBACKGROUND AND FOCUS UT ................................................................................................. 7 TU2.2. UT TUEUROPEAN INITIATIVE AND RECOMMENDATIONS UT .............................................................. 7 TU2.3. UT TUEEA GENERAL GUIDELINES ON COORDINATE REFERENCE SYSTEMSUT ................................. 8 TU2.4. UT TUEEA RECOMMENDATIONS: SPECIFIC PROJECTIONS FOR DIFFERENT PURPOSES AND PRODUCTSUT....................................................................................................................................... 9 TU2.5. UT TUAVAILABLE DOCUMENTS AND FILES FOR WORKING WITH PROJECTIONS UT ......................... 11
TU3. UT TUWORKING WITH POINT LOCATIONS: LATITUDE/LONGITUDEUT ......................... 12 TU3.1. UT TUBACKGROUNDUT .................................................................................................................. 12 TU3.2. UT TUFORMATTING LATITUDE/LONGITUDE COORDINATESUT ....................................................... 12 TU3.3. UT TUCONVERSION FROM DMS FORMAT TO DD FORMAT UT ........................................................ 12
TU4. UT TUGIS DATA DELIVERY: VECTOR AND RASTER FORMATSUT...................................... 14 TU4.1. UT TUQUALITY AND QUALITY CONTROL UT ................................................................................... 14 TU4.2. UT TUPROJECTION AND SCALE UT................................................................................................... 14 TU4.3. UT TURESOLUTION AND GENERALISATION UT ................................................................................ 15 TU4.4. UT TUGEOMETRIC QUALITY REPRESENTATION AND TOPOLOGY UT ............................................... 15 TU4.5. UT TUTHEMATIC QUALITYUT ......................................................................................................... 16 TU4.6. UT TUNAMING OF FILES AND ATTRIBUTESUT................................................................................. 16 TU4.7. UT TURECOMMENDED FORMATS FOR GEOGRAPHICAL DATASETSUT............................................. 16
TU5. UT TUWORKING WITH GRIDSUT ................................................................................................... 20 TU5.1. UT TUINTRODUCTION UT ................................................................................................................. 20 TU5.2. UT TUEXAMPLES OF GRIDS USED IN ENVIRONMENTAL MAPPING UT .............................................. 20 TU5.3. UT TUTYPES OF REFERENCE GRIDSUT ............................................................................................ 20 TU5.4. UT TURECOMMENDATIONS FOR SELECTING OR DEFINING A GRIDUT ............................................. 23
TU6. UT TUMAP EXTENTS USED BY THE EEAUT ................................................................................ 27 TU6.1. UT TUMAP EXTENTS: NORTH, SOUTH, EAST, WEST UT .................................................................... 27 TU6.2. UT TURECOMMENDED MAP EXTENTS: A FULL SERIESUT................................................................ 27 TU6.3. UT TUMAP EXTENTS: ILLUSTRATIONS OF EEA MAP EXTENT SERIESUT ......................................... 28 TU6.4. UT TUSPECIFICATION OF MAP EXTENTS BY COORDINATESUT ........................................................ 34
TU7. UT TUEEA MAP LAYOUT AND POSTSCRIPT MAP TEMPLATES FOR REPORTSUT ......... 35 TU7.1. UT TUSTANDARD SIZE FOR POSTSCRIPT MAPSUT ........................................................................... 35 TU7.2. UT TUSTANDARD MAP PROJECTIONS UT.......................................................................................... 36 TU7.3. UT TUMAP EXTENTS FOR POSTSCRIPT MAPS AND OTHER FINAL VERSION MAPS UT ....................... 36 TU7.4. UT TUSCALES OF POSTSCRIPT MAPS UT........................................................................................... 36 TU7.5. UT TULEVEL OF GENERALISATIONUT ............................................................................................. 37 TU7.6. UT TUSTANDARD ELEMENTS/FEATURES IN MAPS UT ...................................................................... 37 TU7.7. UT TUSTANDARD LAYER ORDERSUT .............................................................................................. 39 TU7.8. UT TUCOLOUR AND GRAPHICS DEFINITIONS UT .............................................................................. 39 TU7.9. UT TULEGENDUT ............................................................................................................................ 41
Version 1.3 2005-20-06 www.eionet.eu.int/gis Page 5 of 55
TU7.10. UT TUTEXT: TRANSLATION IMPLICATIONS UT ............................................................................ 42 TU7.11. UT TUMAP TEMPLATES IN ARCGIS UT........................................................................................ 42 TU7.12. UT TUMAP TEMPLATES IN ADOBE ILLUSTRATOR FORMAT UT .................................................... 42
TU8. UT TUEEA MAP TEMPLATES FOR GIS: TOOLS FOR EASY MAP MAKINGUT ................... 44 TU8.1. UT TUWHY USE A PREDEFINED MAP TEMPLATE? UT ....................................................................... 44 TU8.2. UT TUAVAILABLE GIS TEMPLATE FILESUT .................................................................................... 44 TU8.3. UT TUARCGIS TEMPLATE FILES AND USING OTHER SOFTWARE UT ................................................ 44 TU8.4. UT TUSTANDARD MAP DATA FOR MAP TEMPLATES UT ................................................................... 45 TU8.5. UT TUQUICK GUIDE TO USING ARCGIS MXT TEMPLATE FILESUT .................................................. 45 TU8.6. UT TUPREDEFINED MAP EXTENTS AND STANDARD MAP DATA FOR ARCVIEW 3.X AND OTHER SOFTWARE UT .................................................................................................................................... 47
TU9. UT TUMETADATA FOR GEOGRAPHICAL DATA AND MAPSUT ............................................. 48 TU9.1. UT TUREQUIREMENTS ON GIS AND MAP DELIVERABLESUT .......................................................... 48 TU9.2. UT TUEEA STANDARD FOR METADATA UT ..................................................................................... 48 TU9.3. UT TUDIFFERENT METADATA REQUIREMENTS FOR DIFFERENT KINDS OF GEODATA UT................. 48 TU9.4. UT TUUSING EEA METADATA EDITOR FOR ARCCATALOGUT....................................................... 49 TU9.5. UT TUUSING EEA SPATIAL DATA METADATA INFORMATION FORMUT .......................................... 54 TU9.6. UT TUUSING EEA METADATA FORM FOR MAPS UT......................................................................... 54

Version 1.3 2005-20-06 www.eionet.eu.int/gis Page 6 of 55
1. Overview of topics
Since 2001, the EEA has worked on developing guidelines and tools with the aims of: • standardising the handling of geographical data by considering the following aspects:
o projections o accuracy o formats o data structure o quality control routines;
• standardising maps for printed reports and Web applications in terms of: o map extents o colours o creating generalised data and template files for use with ArcGIS o creating ready-to-use maps for use with Adobe Illustrator;
• developing Web services; • developing standards and tools for metadata handling; • improving quality of information delivered to and used by EEA.
1.1. Overview of topics by chapter
The table is a quick guide to which chapters contain information on the listed topics. Topic Ch. 2 Ch. 3 Ch. 4 Ch. 5 Ch. 6 Ch. 7 Ch. 8 Ch. 9
Datum X X EEA map data X Geodatabases X GIS map templates X Grids X Latitude/longitude X X Map extents X Map layout standards X Metadata on data X Metadata on maps X Postscript maps X Projection X Raster data X Vector data X

Version 1.3 2005-20-06 www.eionet.eu.int/gis Page 7 of 55
2. Coordinate reference systems and projections
2.1. Background and focus
This chapter describes the EEA standardisation of coordinate reference systems and projections for the storage and treatment of geographical databases and map display. This is a follow-up to the European Commission decisions from 2003 to use specific coordinate reference systems and projections. Producers and users of spatial data and maps should be aware that different assessment operations require different projections, and that maps should have a projection defined by the EEA. Using defined standards has made it possible to develop templates and efficient tools for data handling, and will reduce the burden of documentation both for the EEA and its cooperating partners. There are several reasons why the EEA finds it necessary to develop specifications in this field.
• The lack of documentation and skills in the field of transformations and projections causes frustrations, inefficient handling of geographical data, inaccurate data and analysis results.
• A variety of different projections are being used among the EEA, ETCs and national institutions, while documentation is limited.
• ETCs and other European projects experience severe problems when combining data from different countries. The EEA is cooperating with more than 30 countries. In order to streamline the data flow, standardisation is needed in the field of coordinate reference systems and projections.
• It is foreseen that the EEA will use spatial assessments more actively in the coming years, making it important to follow guiding principles for the best possible use of the data available.
2.2. European initiative and recommendations
The experiences linked to EEA activities are typical for other agencies working with many partners and with partners covering large areas. This resulted in an initiative from the European Commission. The aim has been to develop pan-European standards for coordinate reference systems and recommended projections, to be applied by national mapping agencies, the European Commission and other agencies treating geographical information. The work was carried out by an expert group of the cartographic projections workshop. The EEA participated alongside other experts from national mapping agencies, the Joint Research Centre, Eurostat/GISCO, Eurogeographics and others. Their recommendations were released in November 2001, and were approved by COGI (Commission Inter Service Group on Geographical Information) in 2003 for use within the Commission services. Through working groups, Inspire – Infrastructure for spatial information in Europe (HTUhttp://www.ec-gis.org/inspireUTH) – has recommended their use to a wider user community.
Version 1.3 2005-20-06 www.eionet.eu.int/gis Page 8 of 55
2.3. EEA general guidelines on coordinate reference systems
The recommendations by the European Commission and the wider European initiatives should be followed as far as possible by the EEA.
2.3.1. A common European spatial reference system – ETRS89 and EVRS
Different workshops and expert group contributions prepared the ground for the definition of the common European spatial reference system and its use for geo-referencing of the data of the European Commission. The definition will be used in future specifications of products to be delivered to the Commission within projects, contracts, etc, and for the promotion of wider use within all Member States. The European Terrestrial Reference System 1989 (ETRS89) and the European Vertical Reference System (EVRS) form together the European Spatial Reference System as an integrated reference. The name of the coordinate reference system is ETRS89. The European terrestrial reference system 1989 (ETRS89) is the geodetic datum for pan-European spatial data collection, storage and analysis. It is based on the GRS80 ellipsoid and is the basis for a coordinate reference system using ellipsoidal coordinates. The ETRS89 ellipsoidal coordinate reference system is recommended to express and to store positions. In Europe, about 20 different physical height systems are used based on different tide gauges, resulting in inconsistencies within a two metre range. Data exchange related to altitude between different countries and communities in Europe should be handled carefully. For referencing height, the European vertical reference system (EVRS) is proposed for adoption by the European Commission to promote widespread use as a standard for future pan-European data products. EVRS includes a European Vertical Datum and the European Vertical Reference Frame (EVRF2000). National height datums in Europe should be transformed into EVRF datum NAP (Normaal Amsterdams Peil).
• The EEA and the ETCs should use ETRS89 as the common coordinate reference system for storage of data and as a basis for defined projections to be used in analysis and map production. Data delivered to the EEA, in particular data with European coverage, should use ETRS89 as the coordinate reference system.
• National data delivered should also use ETRS89 or coordinate reference systems easily
transformable to ETRS89. If the national/local coordinate system is not found in commonly accessible documentation, the delivering institution should add a documentation following the ISO19111 referred to below.
The description and definition of ETRS89 is based on the convention of ISO19111, the ‘Spatial referencing by coordinates’ standard. For further documentation on ETRS89, see HTUhttp://crs.ifag.de/UTH and HTUhttp://www.eionet.eu.int/gisUTH. For more on EVRS, see HTUhttp://gi-gis.jrc.it/ws/evrs/UTH.
2.3.2. Conversion from national coordinate reference systems
At national level, a series of different coordinate reference systems is used. It is essential that conversion is done with care, without losing significant accuracy. Therefore, proper transformation routines have to be observed. The European initiative on coordinate reference systems also provides information at national level: the national mapping agencies or comparable institutions/organisations provide information for the

Version 1.3 2005-20-06 www.eionet.eu.int/gis Page 9 of 55
descriptions of the national coordinate reference systems, and for transformation parameters between the national coordinate reference systems and the European coordinate reference system ETRS89 and EVRS. For more information, see the website HTUhttp://crs.ifag.de/UTH
• The EEA recommends that transformation between national systems and the European
coordinate reference system be done by using the agreed transformation parameters for different countries (see the link above).
2.4. EEA recommendations: specific projections for different purposes and products
The guidelines below are relevant for any organisation involved in handling geographical information systems (GIS) data to be delivered to the EEA, or in the treatment of such data on behalf of the EEA. The projection guidelines are also relevant to the EEA’s own data use and management. The European Commission recommends use of three different projections in different products and activities, all based on the ETRS89 datum. The choice depends upon scale, data quality (raster/vector) and purpose of work. The EEA recommends the use of:
• Lambert Azimuthal Equal Area (ETRS89-LAEA): for storing raster data, for statistical analysis and for map display purposes;
• Lambert Conformal Conical (ETRS89-LCC): for storing raster data and for map display purposes;
• Universal Transversal Mercator (ETRS89-TMzn or UTM): to be used in large-scale mapping and storage of large-scale data. Allow different zones to be used.
See HTUhttp://www.eionet.eu.int/gisUTH for detailed definition documents.
Coordinate reference system/ projection
Name and definition
Types of coordinates
Datum
When to be used – purpose
EEA use
Lambert Azimuthal Equal Area 5210 Latitude of origin: 52 N Longitude of origin (central meridian): 10 E (*)
Map projection ETRS89 Small scale mapping 1:500 000 or smaller applications including - spatial analysis - storing raster data - map display covering Europe
Yes
Lambert Azimuthal Equal Area 5220 Latitude of origin: 52 N Longitude of origin (central meridian): 20 E (*)
Map projection ETRS89 Small scale mapping 1:500 000 or smaller applications including - map display covering Europe including all of Turkey
Yes
ETRS-LAEA
Lambert Azimuthal Equal Area 5265 Latitude of origin: 52 N Longitude of origin (central meridian): 65 E (*)
Map projection ETRS89 Small scale mapping 1:500 000 or smaller applications including - map display covering Europe and western part of Asia
Yes
ETRS-LCC Lambert Conformal Conical Latitude of origin (Parallels) at
Map projection ETRS89 Small scale mapping Only to be used for
Yes
Version 1.3 2005-20-06 www.eionet.eu.int/gis Page 10 of 55
35 N and 65 N Longitude of origin (central meridian): 10 E
applications requiring an object to be rendered in its true shape
ETRS-TMzn (UTM)
Universal Transversal Mercator Different zones can be used
Map projection ETRS89 Large-scale mapping 1:10 000–1:499 999
Yes
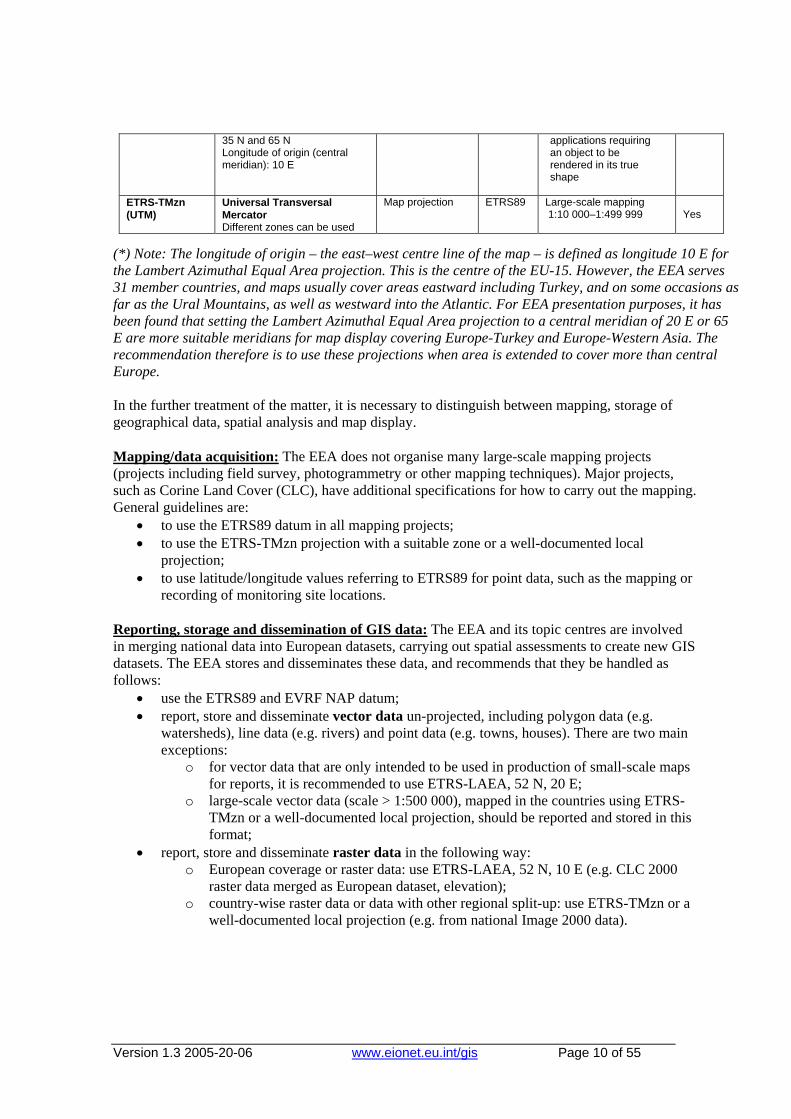
(*) Note: The longitude of origin – the east–west centre line of the map – is defined as longitude 10 E for the Lambert Azimuthal Equal Area projection. This is the centre of the EU-15. However, the EEA serves 31 member countries, and maps usually cover areas eastward including Turkey, and on some occasions as far as the Ural Mountains, as well as westward into the Atlantic. For EEA presentation purposes, it has been found that setting the Lambert Azimuthal Equal Area projection to a central meridian of 20 E or 65 E are more suitable meridians for map display covering Europe-Turkey and Europe-Western Asia. The recommendation therefore is to use these projections when area is extended to cover more than central Europe. In the further treatment of the matter, it is necessary to distinguish between mapping, storage of geographical data, spatial analysis and map display. UMapping/data acquisition:U The EEA does not organise many large-scale mapping projects (projects including field survey, photogrammetry or other mapping techniques). Major projects, such as Corine Land Cover (CLC), have additional specifications for how to carry out the mapping. General guidelines are:
• to use the ETRS89 datum in all mapping projects; • to use the ETRS-TMzn projection with a suitable zone or a well-documented local
projection; • to use latitude/longitude values referring to ETRS89 for point data, such as the mapping or
recording of monitoring site locations. UReporting, storage and dissemination of GIS data:U The EEA and its topic centres are involved in merging national data into European datasets, carrying out spatial assessments to create new GIS datasets. The EEA stores and disseminates these data, and recommends that they be handled as follows:
• use the ETRS89 and EVRF NAP datum; • report, store and disseminate vector data un-projected, including polygon data (e.g.
watersheds), line data (e.g. rivers) and point data (e.g. towns, houses). There are two main exceptions:
o for vector data that are only intended to be used in production of small-scale maps for reports, it is recommended to use ETRS-LAEA, 52 N, 20 E;
o large-scale vector data (scale > 1:500 000), mapped in the countries using ETRS-TMzn or a well-documented local projection, should be reported and stored in this format;
• report, store and disseminate raster data in the following way: o European coverage or raster data: use ETRS-LAEA, 52 N, 10 E (e.g. CLC 2000
raster data merged as European dataset, elevation); o country-wise raster data or data with other regional split-up: use ETRS-TMzn or a
well-documented local projection (e.g. from national Image 2000 data).

Version 1.3 2005-20-06 www.eionet.eu.int/gis Page 11 of 55
UMeasurements and spatial analysis: U It is important to use a projection suited for the purpose. • For European-wide measurements/analysis, the EEA recommends using ETRS-LAEA, 52
N, 10E as this is an area-true projection. It should be used when combining layers, measuring areas and distances, and in sampling processes for statistical purposes.
UMaps in reports, factsheets and on the Web:U The EEA has decided upon some common projections for all map presentations in main reports, factsheets and on the EEA websites, including the ETC and Eionet websites. Different projections were compared, leading to the following recommendations. All template files for maps available from HTUhttp://www.eionet.eu.int/gisUTH are based on these specifications.
• For maps with European-wide coverage or more limited coverage such as the European sea catchments, the seas or other major regions: use ETRS-LAEA, 52 N, 20 E.
• Exceptions are wide Eurasian maps using ETRS-LAEA, 52 N, 65 E, world maps using Times 10 E (WGS84) and maps showing local examples, where the preferred projection is ETRS-TMzn.
• If a map producer intends to use another projection than the one recommended, please contact the EEA using the web interface at HTUhttp://www.eea.eu.int/help/infocentre/enquiriesUTH.
2.5. Available documents and files for working with projections
The EEA has developed template files for map production based on the recommendations above (see Chapter 8). The documentation for the coordinate reference systems can be found at HTUhttp://ww.eionet.eu.int/gisUTH and HTUhttp://crs.ifag.de/UTH.
2.5.1. prj files for shape file format
When using the general predefined projection files in ArcGIS software, be aware that ETRS89 is called ETRF89. In ArcGIS it is possible to copy in your most used projections. Place prj files in the directory of projections. prj-files for the most common projections used by the EEA are available at the EEA data service at HTUhttp://dataservice.eionet.eu.int/dataservice/metadetails.asp?id=587UTH
• ETRS-LAEA4809.prj (48 N, 9 E. Commonly used by Eurostat/GISCO); • ETRS-LAEA5210.prj (recommended by the Commission, centre of EU-15. See note in Section
2.4); • ETRS-LAEA5220.prj (standard for the EEA map presentations, centre of EEA member
countries); • ETRS-LAEA5265.prj (standard for the EEA map presentations, centre of Eurasia).
When placed in the correct directory, these projections will be available as an option under predefined projections in ArcGIS 8.x. The prj-files should be placed in: arcexe8x/Coordinate Systems/Projected Coordinate Systems/Continental/Europe.
2.5.2. Projected coverages as ArcInfo template files
When projecting a coverage in ArcInfo 8.x, it is possible to activate the information in existing files with the correct projection. This is a helpful and easy-to-use method. The EEA offers coverages in the most common projections to ease transformations and definitions of coverage data.
Version 1.3 2005-20-06 www.eionet.eu.int/gis Page 12 of 55
3. Working with point locations: latitude/longitude
3.1. Background
A lot of data received by the EEA are georeferenced point locations in a tabular data format. Most of the data are tables with point locations for cities, water quality stations, waste treatment sites, oil spill sites, etc. Commonly, the EEA finds incorrect positions and position formatting in the delivered files for locations. If such errors are not identified early in the map production or analysis chain, it causes problems and an unnecessary workload. Practical guidelines are provided below on how to create a file containing proper point location data.
3.2. Formatting latitude/longitude coordinates
Degrees/minutes/seconds (DMS) are a unit of measure for describing latitude and longitude. A degree is 1/360th of a circle. A degree is further divided into 60 minutes and a minute is divided into 60 seconds. However point data delivered in DMS format is not suitable for GIS systems. Therefore all point locations should always be delivered to EEA in latitude/longitude decimal degrees (DD) and not in DMS format. DD format is commonly accepted by GIS systems. When delivering data at European scale, DD formatted points should have at least two decimals for obtaining an acceptable precision of location.
3.3. Conversion from DMS format to DD format
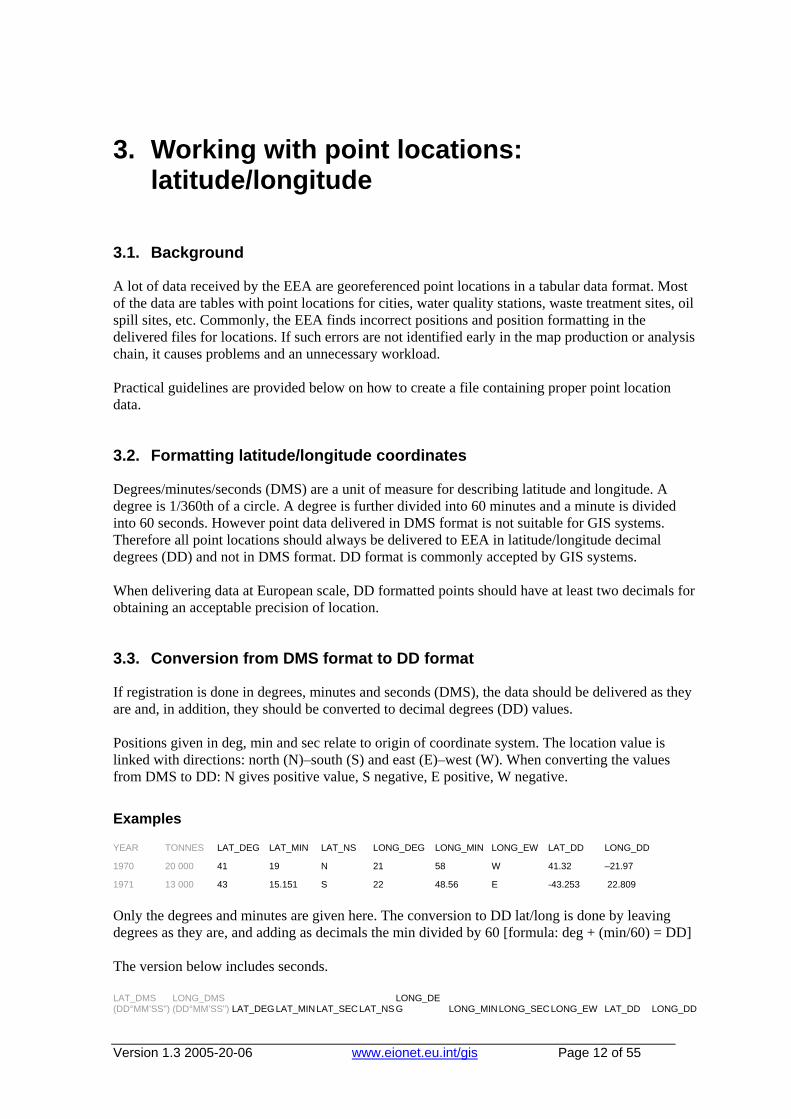
If registration is done in degrees, minutes and seconds (DMS), the data should be delivered as they are and, in addition, they should be converted to decimal degrees (DD) values. Positions given in deg, min and sec relate to origin of coordinate system. The location value is linked with directions: north (N)–south (S) and east (E)–west (W). When converting the values from DMS to DD: N gives positive value, S negative, E positive, W negative.
Examples
YEAR TONNES LAT_DEG LAT_MIN LAT_NS LONG_DEG LONG_MIN LONG_EW LAT_DD LONG_DD
1970 20 000 41 19 N 21 58 W 41.32 –21.97
1971 13 000 43 15.151 S 22 48.56 E -43.253 22.809
Only the degrees and minutes are given here. The conversion to DD lat/long is done by leaving degrees as they are, and adding as decimals the min divided by 60 [formula: deg + (min/60) = DD] The version below includes seconds. LAT_DMS (DD°MM’SS")
LONG_DMS (DD°MM’SS") LAT_DEG LAT_MIN LAT_SEC LAT_NS
LONG_DEG LONG_MIN LONG_SECLONG_EW LAT_DD LONG_DD

Version 1.3 2005-20-06 www.eionet.eu.int/gis Page 13 of 55
58°56’05" N 17°51’35" E 58 56 05 N 17 51 35 E 58.9347 17.8597
7°32’10" N 18°03’46" E 7 32 10 N 18 03 46 E 7.5361 18.0628 58°12’44.45" N
17°51’48.05" W 58 12 44.45 N 17 51 48.05 W 58.2123 -17.8633
Here, the conversion to DD lat/long is done by leaving degrees as they are, and adding as decimals the min and sec by taking the min value and dividing by 60 and taking the sec value and dividing by 3 600 [formula: deg + (min/60) + (sec/3600) = DD]. Remember that west values should give negative ‘long’ values and south values should give negative ‘lat’ values.

Version 1.3 2005-20-06 www.eionet.eu.int/gis Page 14 of 55
4. GIS data delivery: vector and raster formats
This chapter addresses central issues about how the EEA and its partners should deliver and store GIS data. GIS data are all data stored in a GIS format and with geographical referencing linked to a coordinate reference system. GIS data are used for different operations: for data collection, spatial analyses, assessments and for the production of maps. GIS data do not include maps pasted or stored in files without a reference system. Such maps are labelled postscript maps. Postscript files are, for example, AI, EPS, WMF, EMF, or PDF (see Chapter 7). The EEA receives data from three main sources:
• countries responding to reporting obligations; • ETCs merging national data into new European datasets and carrying out assessments
resulting in new GIS data; • third parties delivering reference data or other thematic data for spatial assessment and map
production.
4.1. Quality and quality control
It is essential that data delivered to the EEA are homogeneous and of general good quality. Quality control includes the following questions:
• Are values and codes in tabular data within the range defined in guideline documents? • Are ‘ids’ in accordance with standards? • Does the geometry, either being points, lines or polygons, have an acceptable structure and
topology, e.g. are polygons closed and lines forming networks linked properly to nodes? • Do the geometric accuracy, coordinate reference system, projection and file format follow
specifications? • Are metadata filled in, including aspects of accuracy, coordinate system, methodology and
source? A document listing the requested information is available from HTUhttp://www.eionet.eu.int/gisUTH.
Quality control must be carried out and documented before delivery of data to the Agency. In the flow of data from ETCs to the EEA, it is important that the ETC data managers are aware of the quality control procedures and ensure that they are posted to Circa in the ETC Consortium Interest Group, even if a partner organisation is responsible for the production task.
4.2. Projection and scale
The projection and scale of a vector dataset are fixed at the stage of product specification. Unless the Agency has provided written specifications to the contrary, the GISCO reference database should be used as basic reference data. This practice ensures that EEA datasets are compatible with each other and with the Commission GI/GIS projects. The GISCO reference database is distributed to ETCs by the EEA under the licensing agreement between Eurostat and the EEA.
Version 1.3 2005-20-06 www.eionet.eu.int/gis Page 15 of 55
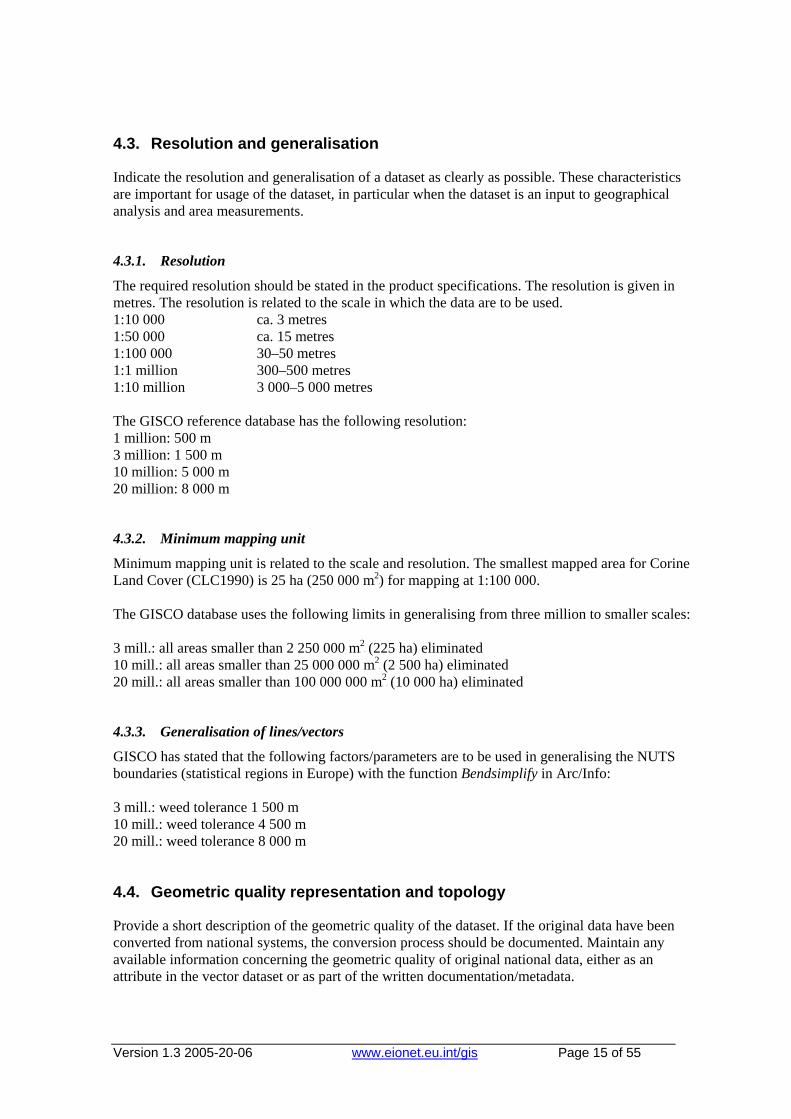
4.3. Resolution and generalisation
Indicate the resolution and generalisation of a dataset as clearly as possible. These characteristics are important for usage of the dataset, in particular when the dataset is an input to geographical analysis and area measurements.
4.3.1. Resolution
The required resolution should be stated in the product specifications. The resolution is given in metres. The resolution is related to the scale in which the data are to be used. 1:10 000 ca. 3 metres 1:50 000 ca. 15 metres 1:100 000 30–50 metres 1:1 million 300–500 metres 1:10 million 3 000–5 000 metres The GISCO reference database has the following resolution: 1 million: 500 m 3 million: 1 500 m 10 million: 5 000 m 20 million: 8 000 m
4.3.2. Minimum mapping unit
Minimum mapping unit is related to the scale and resolution. The smallest mapped area for Corine Land Cover (CLC1990) is 25 ha (250 000 mP
2P) for mapping at 1:100 000.
The GISCO database uses the following limits in generalising from three million to smaller scales: 3 mill.: all areas smaller than 2 250 000 mP
2P (225 ha) eliminated
10 mill.: all areas smaller than 25 000 000 mP
2P (2 500 ha) eliminated
20 mill.: all areas smaller than 100 000 000 mP
2P (10 000 ha) eliminated
4.3.3. Generalisation of lines/vectors
GISCO has stated that the following factors/parameters are to be used in generalising the NUTS boundaries (statistical regions in Europe) with the function Bendsimplify in Arc/Info: 3 mill.: weed tolerance 1 500 m 10 mill.: weed tolerance 4 500 m 20 mill.: weed tolerance 8 000 m
4.4. Geometric quality representation and topology
Provide a short description of the geometric quality of the dataset. If the original data have been converted from national systems, the conversion process should be documented. Maintain any available information concerning the geometric quality of original national data, either as an attribute in the vector dataset or as part of the written documentation/metadata.
Version 1.3 2005-20-06 www.eionet.eu.int/gis Page 16 of 55
4.5. Thematic quality
Provide a short description of the quality of the thematic attributes in the dataset. Indicate which attributes are original data (supplied by countries or third-party organisations) and which attributes are added by ETCs or other partners. The latter is often needed for the purpose of harmonising measurement units.
4.6. Naming of files and attributes
Naming of files and attributes should normally follow the style recommended by the GISCO database manual. If this is not considered practical, then an alternative proposal should be made to the responsible person in the EEA topic team with a copy to the EEA GIS team.
4.7. Recommended formats for geographical datasets
Geographical datasets can either be vector data, raster data or tabular data. The EEA provides recommendations on the data formats for each of these data categories. The recommendations are relevant for:
• the EEA in its internal data handling and dissemination; • ETCs; • national organisations delivering data to the EEA through Eionet data flows; • other external contractors.
The EEA follows the European Commission decision to use ESRI products and formats where possible. The tables below list the formats handled by the EEA, indicating the preferred ones. In addition to format recommendations, the EEA requires certain metadata for all geographical data deliverables, including detailed description of the geographic reference system. If possible, provide ESRI projection files (*.prj). Metadata issues are treated further in Chapter 9.
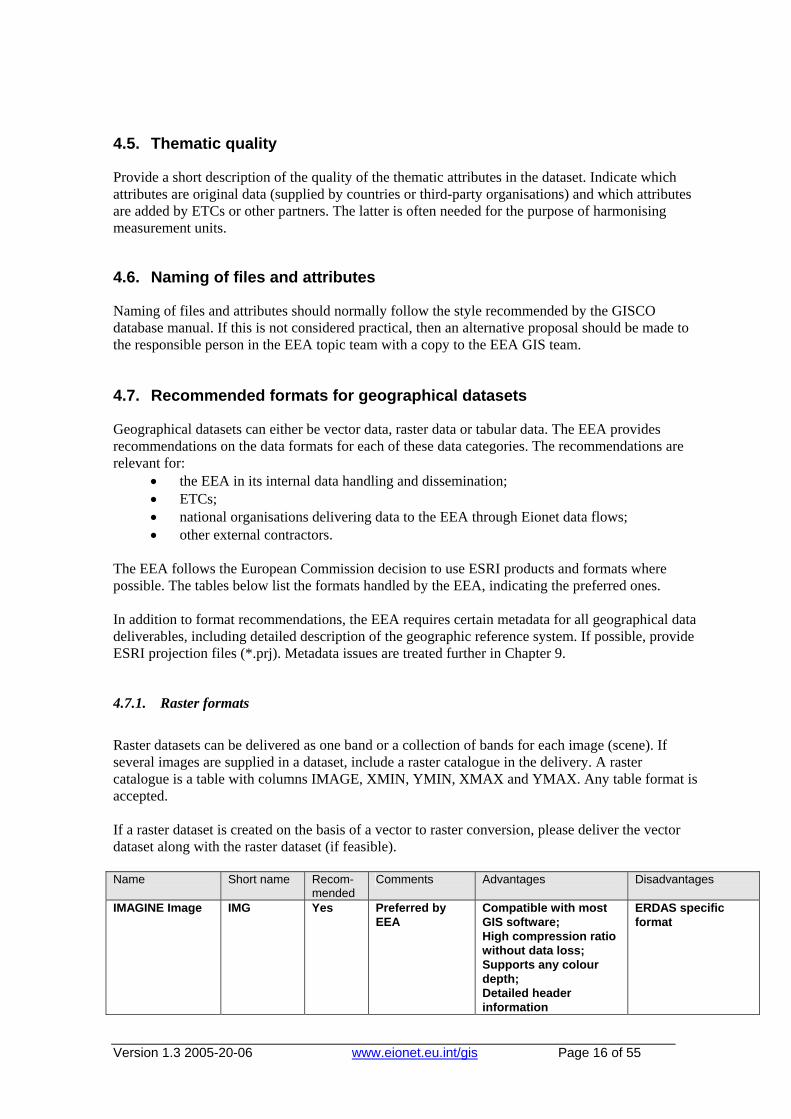
4.7.1. Raster formats
Raster datasets can be delivered as one band or a collection of bands for each image (scene). If several images are supplied in a dataset, include a raster catalogue in the delivery. A raster catalogue is a table with columns IMAGE, XMIN, YMIN, XMAX and YMAX. Any table format is accepted. If a raster dataset is created on the basis of a vector to raster conversion, please deliver the vector dataset along with the raster dataset (if feasible). Name Short name Recom-
mended Comments Advantages Disadvantages
IMAGINE Image IMG Yes Preferred by EEA
Compatible with most GIS software; High compression ratio without data loss; Supports any colour depth; Detailed header information
ERDAS specific format
Version 1.3 2005-20-06 www.eionet.eu.int/gis Page 17 of 55
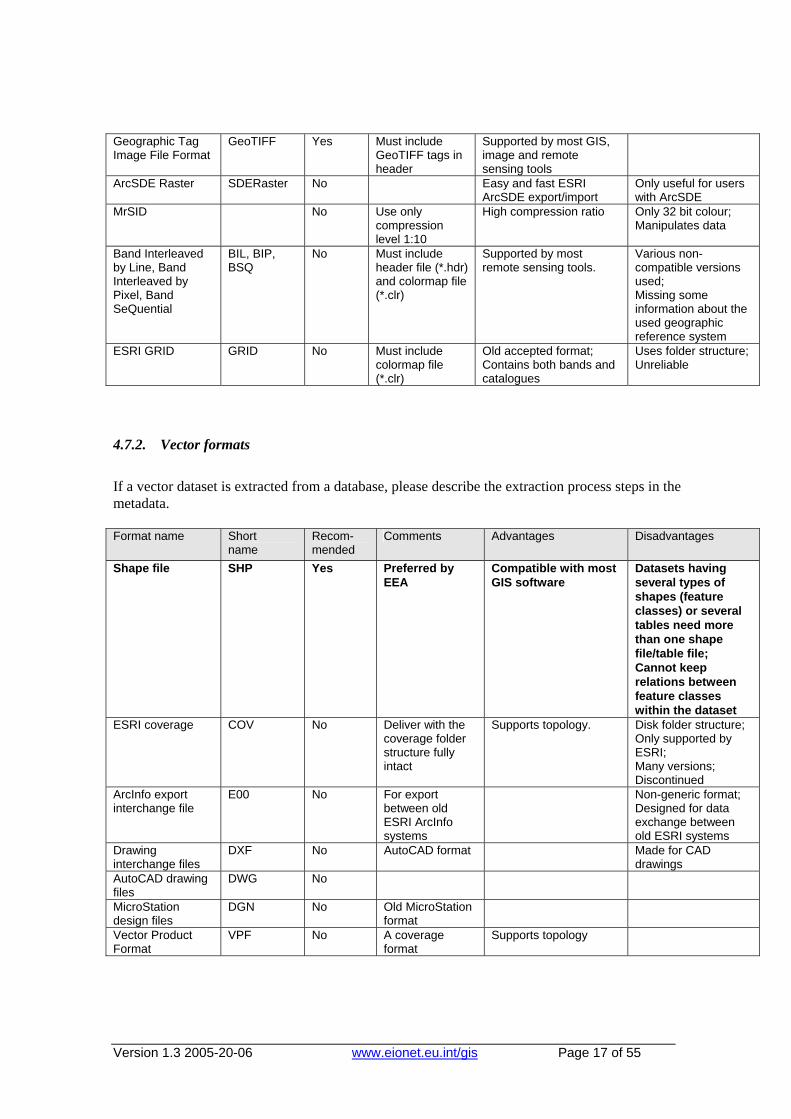
Geographic Tag Image File Format
GeoTIFF Yes Must include GeoTIFF tags in header
Supported by most GIS, image and remote sensing tools
ArcSDE Raster SDERaster No Easy and fast ESRI ArcSDE export/import
Only useful for users with ArcSDE
MrSID No Use only compression level 1:10
High compression ratio Only 32 bit colour; Manipulates data
Band Interleaved by Line, Band Interleaved by Pixel, Band SeQuential
BIL, BIP, BSQ
No Must include header file (*.hdr) and colormap file (*.clr)
Supported by most remote sensing tools.
Various non-compatible versions used; Missing some information about the used geographic reference system
ESRI GRID GRID No Must include colormap file (*.clr)
Old accepted format; Contains both bands and catalogues
Uses folder structure;Unreliable
4.7.2. Vector formats
If a vector dataset is extracted from a database, please describe the extraction process steps in the metadata. Format name Short
name Recom-mended
Comments Advantages Disadvantages
Shape file SHP Yes Preferred by EEA
Compatible with most GIS software
Datasets having several types of shapes (feature classes) or several tables need more than one shape file/table file; Cannot keep relations between feature classes within the dataset
ESRI coverage COV No Deliver with the coverage folder structure fully intact
Supports topology. Disk folder structure; Only supported by ESRI; Many versions; Discontinued
ArcInfo export interchange file
E00 No For export between old ESRI ArcInfo systems
Non-generic format; Designed for data exchange between old ESRI systems
Drawing interchange files
DXF No AutoCAD format Made for CAD drawings
AutoCAD drawing files
DWG No
MicroStation design files
DGN No Old MicroStation format
Vector Product Format
VPF No A coverage format
Supports topology
Version 1.3 2005-20-06 www.eionet.eu.int/gis Page 18 of 55
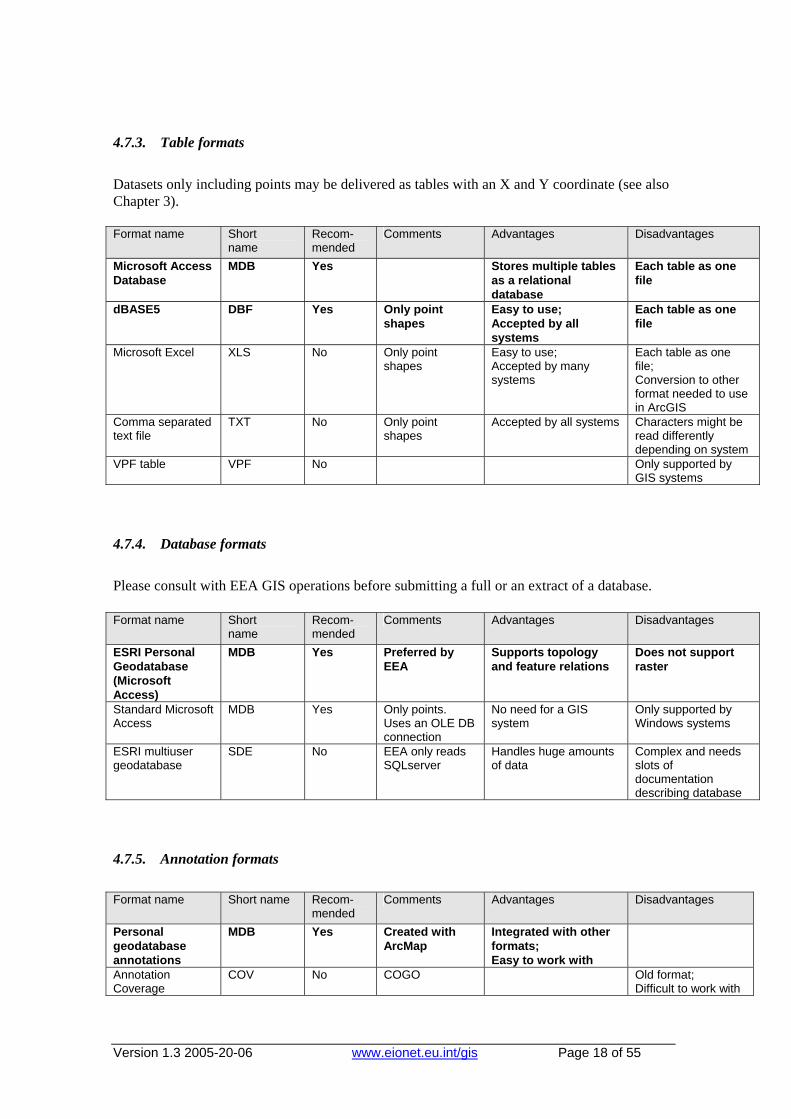
4.7.3. Table formats
Datasets only including points may be delivered as tables with an X and Y coordinate (see also Chapter 3). Format name Short
name Recom-mended
Comments Advantages Disadvantages
Microsoft Access Database
MDB Yes Stores multiple tables as a relational database
Each table as one file
dBASE5 DBF Yes Only point shapes
Easy to use; Accepted by all systems
Each table as one file
Microsoft Excel XLS No Only point shapes
Easy to use; Accepted by many systems
Each table as one file; Conversion to other format needed to use in ArcGIS
Comma separated text file
TXT No Only point shapes
Accepted by all systems Characters might be read differently depending on system
VPF table VPF No Only supported by GIS systems
4.7.4. Database formats
Please consult with EEA GIS operations before submitting a full or an extract of a database. Format name Short
name Recom-mended
Comments Advantages Disadvantages
ESRI Personal Geodatabase (Microsoft Access)
MDB Yes Preferred by EEA
Supports topology and feature relations
Does not support raster
Standard Microsoft Access
MDB Yes Only points. Uses an OLE DB connection
No need for a GIS system
Only supported by Windows systems
ESRI multiuser geodatabase
SDE No EEA only reads SQLserver
Handles huge amounts of data
Complex and needs slots of documentation describing database
4.7.5. Annotation formats
Format name Short name Recom-
mended Comments Advantages Disadvantages
Personal geodatabase annotations
MDB Yes Created with ArcMap
Integrated with other formats; Easy to work with
Annotation Coverage
COV No COGO Old format; Difficult to work with

Version 1.3 2005-20-06 www.eionet.eu.int/gis Page 19 of 55
4.7.6. Geoservice formats
The EEA accepts that geographical datasets are made available to the EEA as Internet geoservices. The EEA handles datasets delivered as OGC Web Map Service 1.1 and OGC Web Feature Service 1.0. Please contact EEA GIS operations for further information using the web interface at HTUhttp://www.eea.eu.int/help/infocentre/enquiriesUTH.
Version 1.3 2005-20-06 www.eionet.eu.int/gis Page 20 of 55
5. Working with grids
5.1. Introduction
Spatial reference is a fundamental property of data used in environmental analyses and assessments. The location of an object is in most cases stored as ‘direct position’ based on a coordinate reference system specifying the geodetic datum and a coordinate system. However, spatial reference based on ‘indirect position’ is also interesting when managing environmental data. One of the most common methods of storing spatial information with indirect position is by using spatial reference grids. Grids omit direct spatial reference and average the qualitative properties of the subject. This makes them powerful tools for harmonisation and reduction of the complexity of spatial datasets. Spatial reference grids are also effective communication means for reporting spatial variability of features. Technically, grids for geographical data are predefined spatial reference structures composed of cells regular in shape or area. Cells are usually squares based on a given geographical coordinate system but, in rare cases, they can be shaped differently, e.g. as hexagons.
5.2. Examples of grids used in environmental mapping
Air pollution, ozone and UV Grids are used for presenting data on atmospheric and air pollution. Examples are data on emissions and deposition of air pollutants such as nitrogen or sulphur, but also concentrations in soil as a result of air-borne deposition. Specific usage of a spatial reference grid is related to ecosystem exposure expressed through calculated critical loads and exceedances of ecosystems’ buffering capacity. Grids are also used for indicating spatial variation of exposure to ultraviolet radiation and depletion of the stratospheric ozone layer. Biodiversity assessment Species distributions such as used by the TAtlas Florae EuropaeaeT are mapped by grid cells for mapping and assessment of biodiversity. Several European research institutes use a coordinated approach to map the distribution of, for example, plant species, birds, amphibians and mammals. Climate change and hydrology Temperature changes registered on the longitude/latitude grid and average annual runoff distribution are examples of applying reference grids in the area of climate change and hydrology. Land cover and soil Grids are also used for mapping of land cover, e.g. the Corine Land Cover project. Even if the original database is created as vector data, the grids are used for data distribution because this format has less volume and is often more suitable for analysis at a regional and European scale such as ecosystem fragmentation or soil erosion risk assessments.
5.3. Types of reference grids
There are many types of grids available for different purposes. Ideally, one grid that is useful for all purposes ought to be created but it is not possible for one grid to cover uniformly the whole of
Version 1.3 2005-20-06 www.eionet.eu.int/gis Page 21 of 55
Europe. Any one type of grid will always have some disadvantages that disqualify it for certain use. Therefore it is important to understand the advantages and disadvantages inherent in a given grid type. The following grid examples are presented to help identify suitable types of grids for different applications. In chapter 5.4 you will find recommendations for selecting or defining a grid, as well as definitions for the recommended multipurpose grid called ETRS-LAEA5210.
5.3.1. World geographic reference system grid
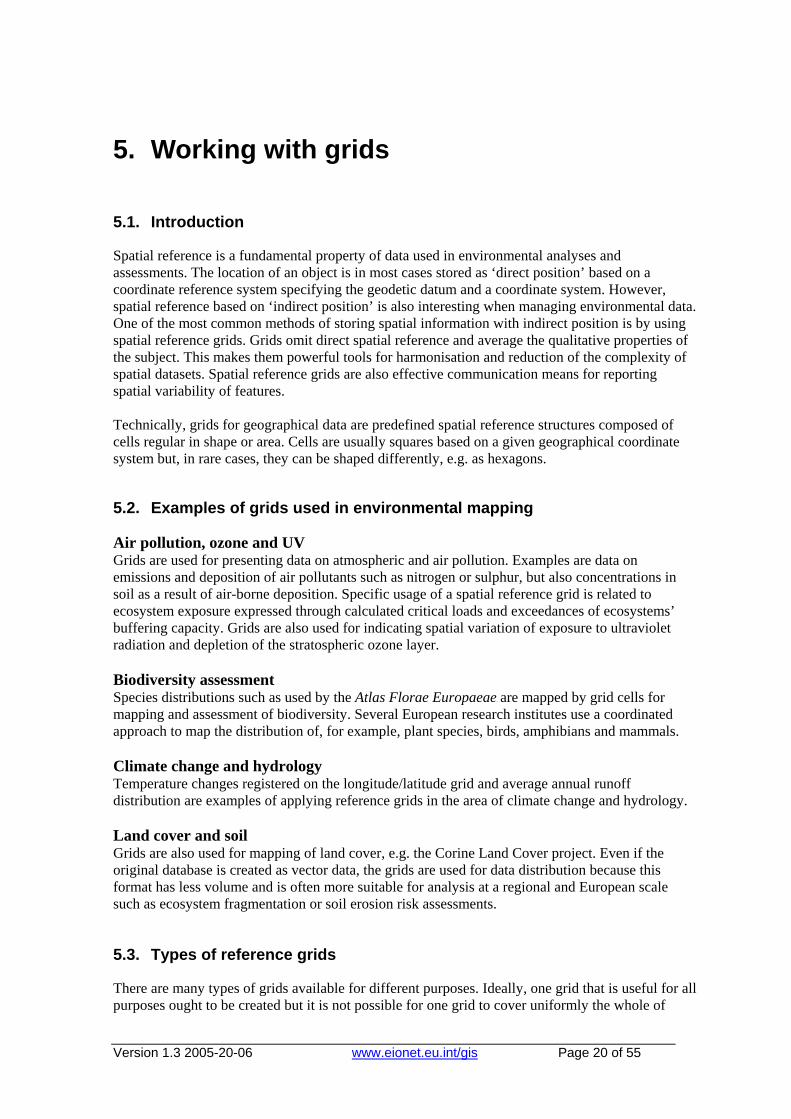
The world geographic reference system (Georef) is made for aircraft navigation. It is also suitable for grid mapping with world coverage. Georef is based on geographical latitude and longitude. The globe is divided into 12 bands of latitude and 24 zones of longitude, each 15 degrees in extent. These 15-degree areas are further divided into one-degree units identified by 15 characters. Georef disadvantages are that the shape, area and distance of cells are distorted.
5.3.2. National grid systems
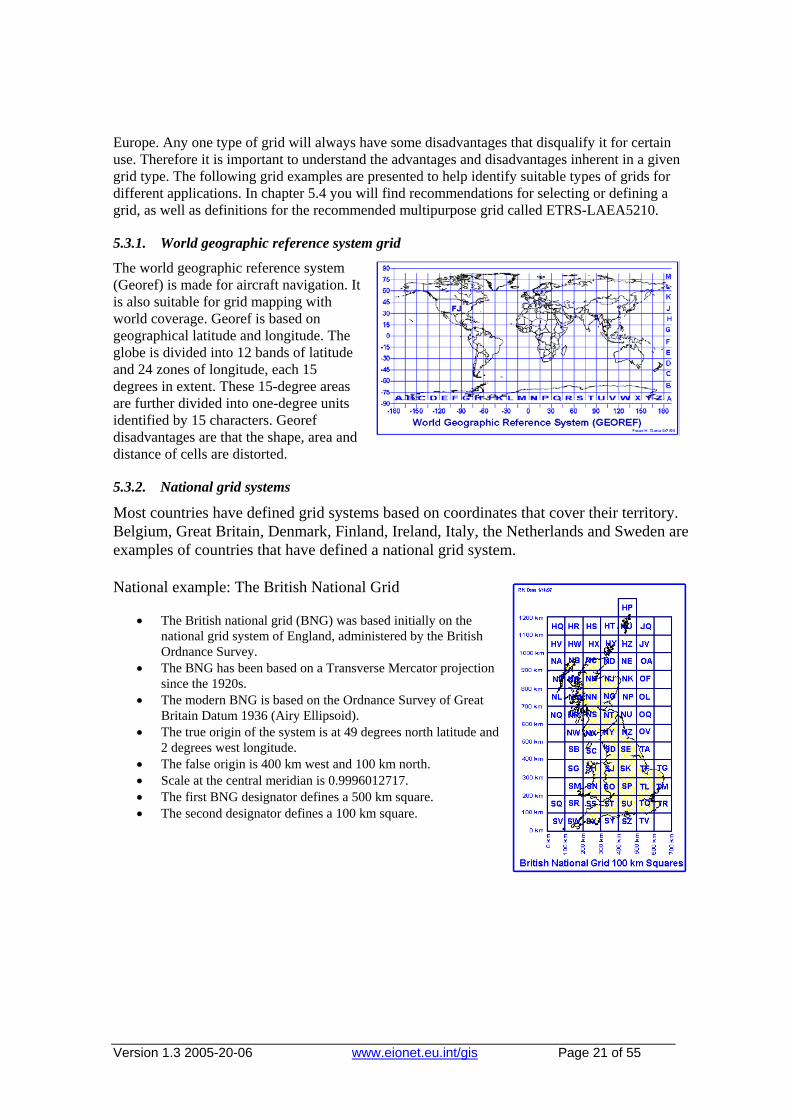
Most countries have defined grid systems based on coordinates that cover their territory. Belgium, Great Britain, Denmark, Finland, Ireland, Italy, the Netherlands and Sweden are examples of countries that have defined a national grid system. National example: The British National Grid
• The British national grid (BNG) was based initially on the national grid system of England, administered by the British Ordnance Survey.
• The BNG has been based on a Transverse Mercator projection since the 1920s.
• The modern BNG is based on the Ordnance Survey of Great Britain Datum 1936 (Airy Ellipsoid).
• The true origin of the system is at 49 degrees north latitude and 2 degrees west longitude.
• The false origin is 400 km west and 100 km north. • Scale at the central meridian is 0.9996012717. • The first BNG designator defines a 500 km square. • The second designator defines a 100 km square.
Version 1.3 2005-20-06 www.eionet.eu.int/gis Page 22 of 55
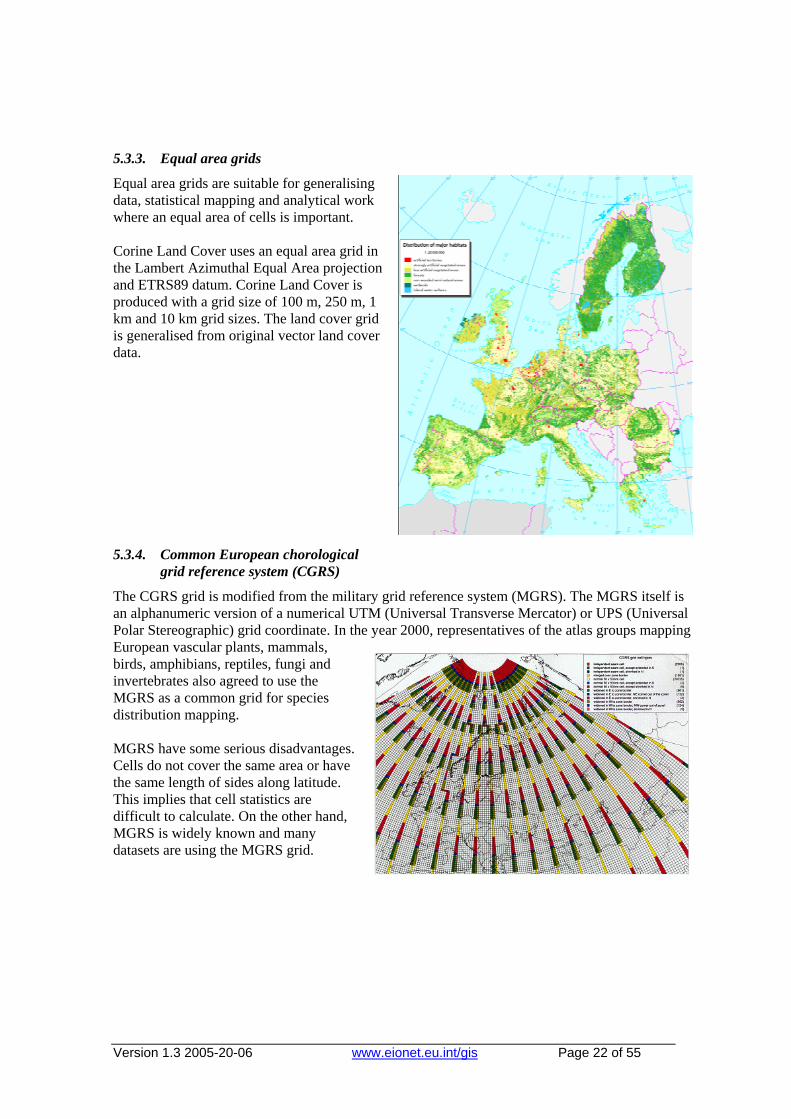
5.3.3. Equal area grids
Equal area grids are suitable for generalising data, statistical mapping and analytical work where an equal area of cells is important. Corine Land Cover uses an equal area grid in the Lambert Azimuthal Equal Area projection and ETRS89 datum. Corine Land Cover is produced with a grid size of 100 m, 250 m, 1 km and 10 km grid sizes. The land cover grid is generalised from original vector land cover data.
5.3.4. Common European chorological grid reference system (CGRS)
The CGRS grid is modified from the military grid reference system (MGRS). The MGRS itself is an alphanumeric version of a numerical UTM (Universal Transverse Mercator) or UPS (Universal Polar Stereographic) grid coordinate. In the year 2000, representatives of the atlas groups mapping European vascular plants, mammals, birds, amphibians, reptiles, fungi and invertebrates also agreed to use the MGRS as a common grid for species distribution mapping. MGRS have some serious disadvantages. Cells do not cover the same area or have the same length of sides along latitude. This implies that cell statistics are difficult to calculate. On the other hand, MGRS is widely known and many datasets are using the MGRS grid.
Version 1.3 2005-20-06 www.eionet.eu.int/gis Page 23 of 55
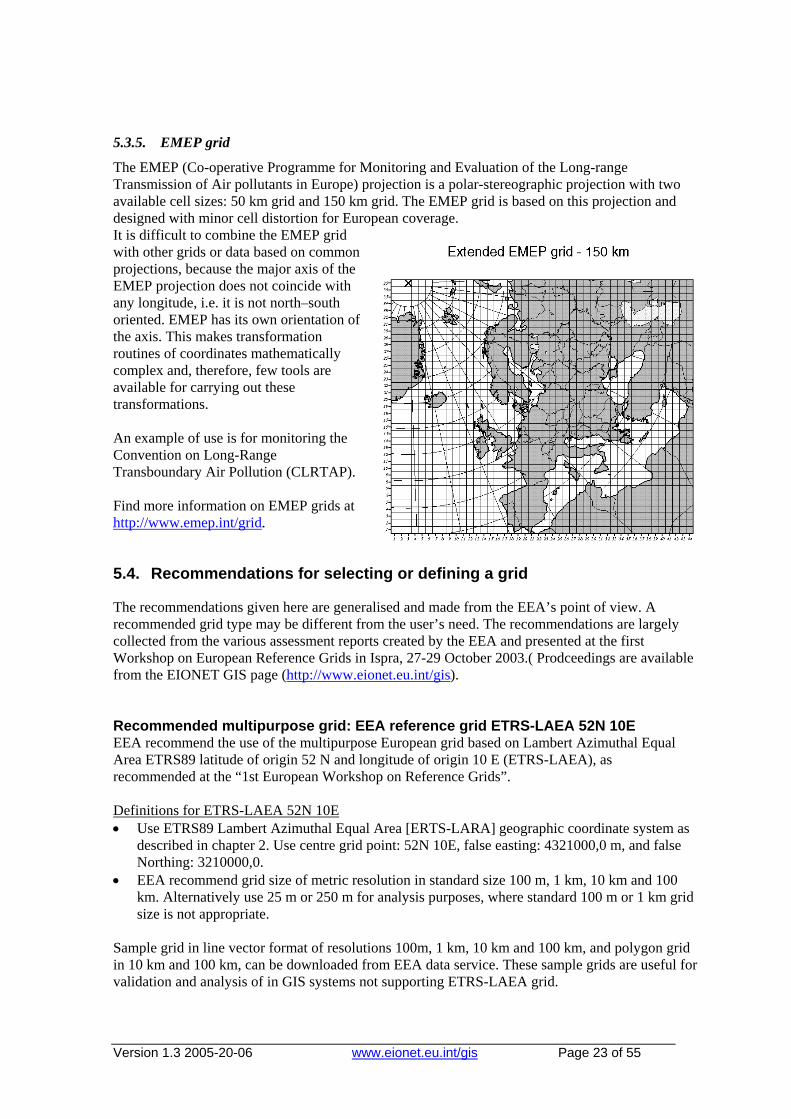
5.3.5. EMEP grid
The EMEP (Co-operative Programme for Monitoring and Evaluation of the Long-range Transmission of Air pollutants in Europe) projection is a polar-stereographic projection with two available cell sizes: 50 km grid and 150 km grid. The EMEP grid is based on this projection and designed with minor cell distortion for European coverage. It is difficult to combine the EMEP grid with other grids or data based on common projections, because the major axis of the EMEP projection does not coincide with any longitude, i.e. it is not north–south oriented. EMEP has its own orientation of the axis. This makes transformation routines of coordinates mathematically complex and, therefore, few tools are available for carrying out these transformations. An example of use is for monitoring the Convention on Long-Range Transboundary Air Pollution (CLRTAP). Find more information on EMEP grids at HTUhttp://www.emep.int/grid UTH.
5.4. Recommendations for selecting or defining a grid
The recommendations given here are generalised and made from the EEA’s point of view. A recommended grid type may be different from the user’s need. The recommendations are largely collected from the various assessment reports created by the EEA and presented at the first Workshop on European Reference Grids in Ispra, 27-29 October 2003.( Prodceedings are available from the EIONET GIS page (HTUhttp://www.eionet.eu.int/gisUTH). Recommended multipurpose grid: EEA reference grid ETRS-LAEA 52N 10E EEA recommend the use of the multipurpose European grid based on Lambert Azimuthal Equal Area ETRS89 latitude of origin 52 N and longitude of origin 10 E (ETRS-LAEA), as recommended at the “1st European Workshop on Reference Grids”. UDefinitions for ETRS-LAEA 52N 10E • Use ETRS89 Lambert Azimuthal Equal Area [ERTS-LARA] geographic coordinate system as
described in chapter 2. Use centre grid point: 52N 10E, false easting: 4321000,0 m, and false Northing: 3210000,0.
• EEA recommend grid size of metric resolution in standard size 100 m, 1 km, 10 km and 100 km. Alternatively use 25 m or 250 m for analysis purposes, where standard 100 m or 1 km grid size is not appropriate.
Sample grid in line vector format of resolutions 100m, 1 km, 10 km and 100 km, and polygon grid in 10 km and 100 km, can be downloaded from EEA data service. These sample grids are useful for validation and analysis of in GIS systems not supporting ETRS-LAEA grid.
Version 1.3 2005-20-06 www.eionet.eu.int/gis Page 24 of 55
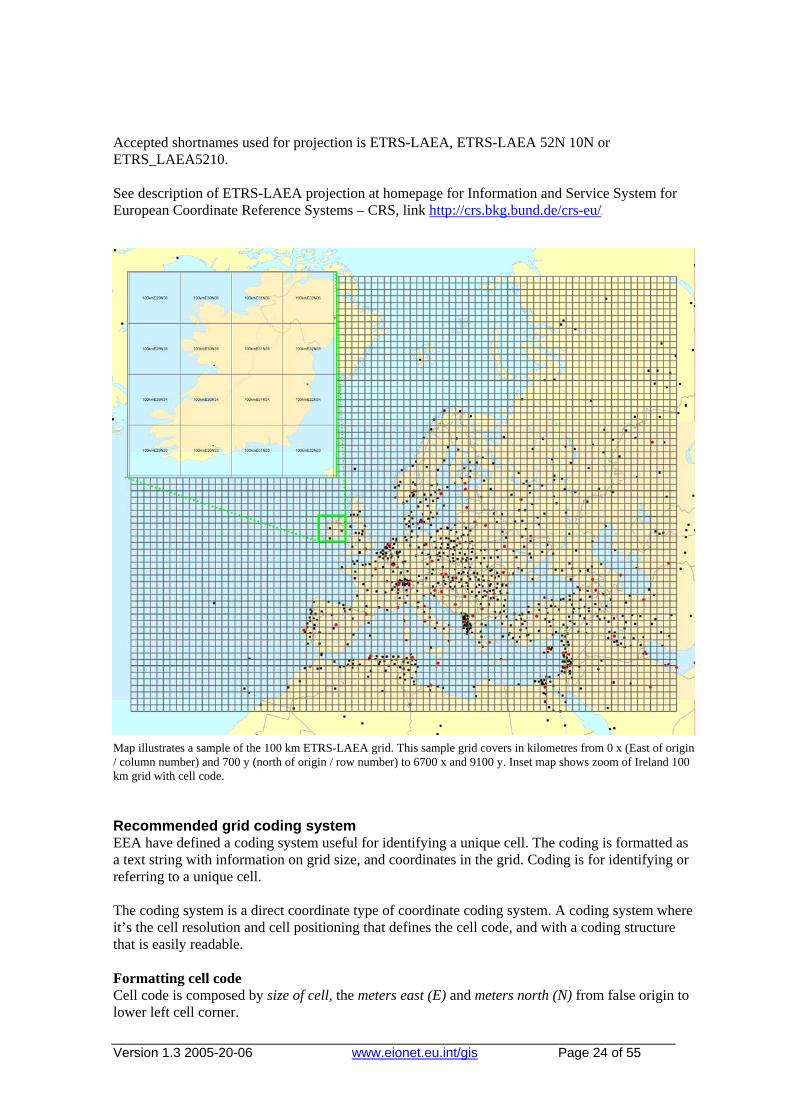
Accepted shortnames used for projection is ETRS-LAEA, ETRS-LAEA 52N 10N or ETRS_LAEA5210. See description of ETRS-LAEA projection at homepage for Information and Service System for European Coordinate Reference Systems – CRS, link HTUhttp://crs.bkg.bund.de/crs-eu/UTH
Map illustrates a sample of the 100 km ETRS-LAEA grid. This sample grid covers in kilometres from 0 x (East of origin / column number) and 700 y (north of origin / row number) to 6700 x and 9100 y. Inset map shows zoom of Ireland 100 km grid with cell code. Recommended grid coding system EEA have defined a coding system useful for identifying a unique cell. The coding is formatted as a text string with information on grid size, and coordinates in the grid. Coding is for identifying or referring to a unique cell. The coding system is a direct coordinate type of coordinate coding system. A coding system where it’s the cell resolution and cell positioning that defines the cell code, and with a coding structure that is easily readable. Formatting cell code Cell code is composed by size of cell, the meters east (E) and meters north (N) from false origin to lower left cell corner.
Version 1.3 2005-20-06 www.eionet.eu.int/gis Page 25 of 55
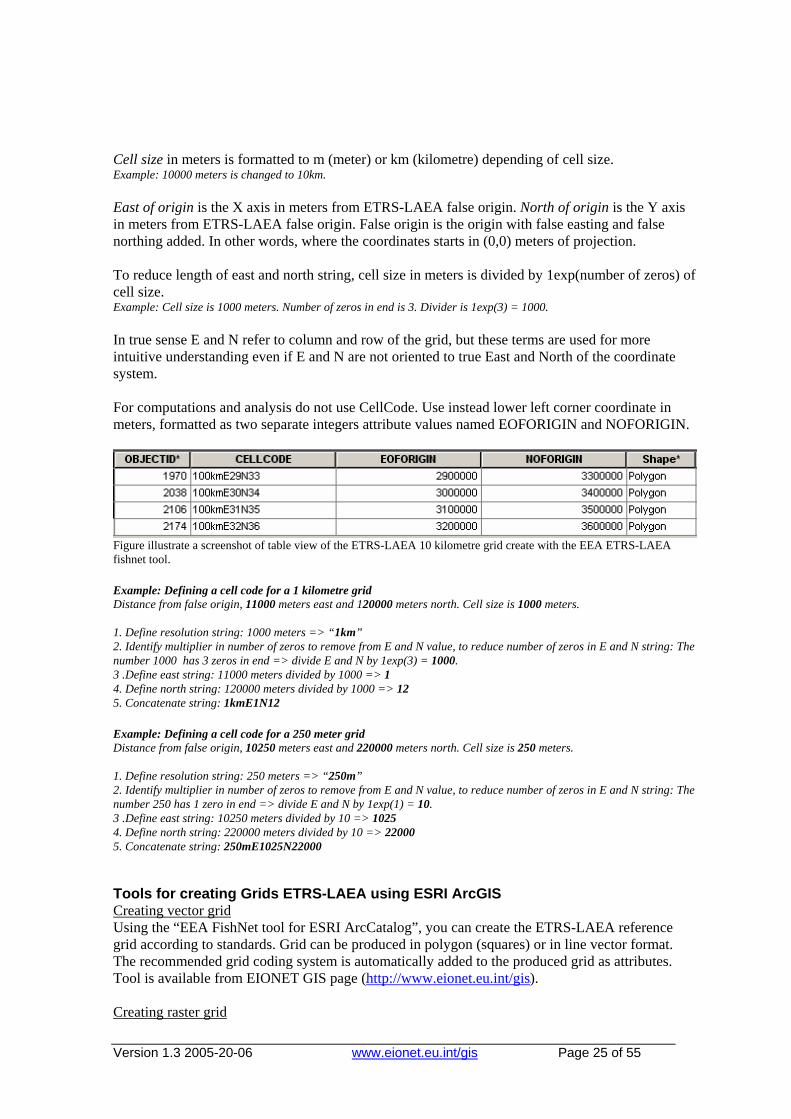
Cell size in meters is formatted to m (meter) or km (kilometre) depending of cell size. Example: 10000 meters is changed to 10km. East of origin is the X axis in meters from ETRS-LAEA false origin. North of origin is the Y axis in meters from ETRS-LAEA false origin. False origin is the origin with false easting and false northing added. In other words, where the coordinates starts in (0,0) meters of projection. To reduce length of east and north string, cell size in meters is divided by 1exp(number of zeros) of cell size. Example: Cell size is 1000 meters. Number of zeros in end is 3. Divider is 1exp(3) = 1000. In true sense E and N refer to column and row of the grid, but these terms are used for more intuitive understanding even if E and N are not oriented to true East and North of the coordinate system. For computations and analysis do not use CellCode. Use instead lower left corner coordinate in meters, formatted as two separate integers attribute values named EOFORIGIN and NOFORIGIN.
Figure illustrate a screenshot of table view of the ETRS-LAEA 10 kilometre grid create with the EEA ETRS-LAEA fishnet tool. Example: Defining a cell code for a 1 kilometre grid Distance from false origin, 11000 meters east and 120000 meters north. Cell size is 1000 meters. 1. Define resolution string: 1000 meters => “1km” 2. Identify multiplier in number of zeros to remove from E and N value, to reduce number of zeros in E and N string: The number 1000 has 3 zeros in end => divide E and N by 1exp(3) = 1000. 3 .Define east string: 11000 meters divided by 1000 => 1 4. Define north string: 120000 meters divided by 1000 => 12 5. Concatenate string: 1kmE1N12 Example: Defining a cell code for a 250 meter grid Distance from false origin, 10250 meters east and 220000 meters north. Cell size is 250 meters. 1. Define resolution string: 250 meters => “250m” 2. Identify multiplier in number of zeros to remove from E and N value, to reduce number of zeros in E and N string: The number 250 has 1 zero in end => divide E and N by 1exp(1) = 10. 3 .Define east string: 10250 meters divided by 10 => 1025 4. Define north string: 220000 meters divided by 10 => 22000 5. Concatenate string: 250mE1025N22000 Tools for creating Grids ETRS-LAEA using ESRI ArcGIS UCreating vector grid Using the “EEA FishNet tool for ESRI ArcCatalog”, you can create the ETRS-LAEA reference grid according to standards. Grid can be produced in polygon (squares) or in line vector format. The recommended grid coding system is automatically added to the produced grid as attributes. Tool is available from EIONET GIS page (HTUhttp://www.eionet.eu.int/gisUTH). UCreating raster grid

Version 1.3 2005-20-06 www.eionet.eu.int/gis Page 26 of 55
Using ESRI ArcGIS Spatial Analyst extension it’s possible to create a LAEA-ETRS grid. You can create a clean grid with no data, or create a grid based on other data, like a feature dataset. Consult the online help for ArcGIS Spatial Analyst for more information. Selecting a custom grid A custom grid is a grid that is not yet defined. For some projects a custom grid has to be designed to facilitating specific analysis, mapping or data collection purposes. This paragraph identify some of the issues that should be taken into account When selecting a custom grid following issues should be noted; • Use of ETRS89 (GRS80) datum for the grid projection. A grid based on a projection using
ETRS89 can easily be combined with other grids and data using the European accepted ETRS89.
• If possible, use one of the agreed European projections such as Lambert Azimuthal Equal Area, Transverse Mercator and Lambert Conic Conformal (see Chapter 2).
• Ensure efficiency for data storage and access assured through hierarchical data structure with square shaped cells.
• Use logarithmic decimal grid sizes. For example, 10 m, 100 m, 1 km, 10 km, 100 km or alternatively quadratic subdivision of the grid cell such as 25 m and 50 m for the 100 m grid, 250 and 500 m for the 1 km grid cell, etc. This eases computation on data such as generalisation, statistics and storage.
• Consider the future of dataset. Will the selected grid support possible extension of coverage and will it allow easy use with other related data?
• Quality of data; the resolution of the selected grid must correspond to spatial variability of mapped feature in order to capture relevant detail. Do not use grid cell sizes below the accuracy of data. Instead, generalisation of the grid to coarser resolution (larger cells) is allowed.
• Identifying if the grid is suitable for the data collection or mapping. General technical concerns when using grids • Make sure hardware and software are prepared for the selected grid type and able to support
the data collection and analytical processes. • Take time to understand how selected algorithms for manipulation and analyses on grids are
working. If you do not understand the algorithms, it is impossible to guarantee that the output will be exactly what you expected. An example: Generalisation from a thematic vector layer to a thematic grid. Some algorithms allocate the thematic value of the centre point of the vector layer cell to the thematic cell value of the grid. In situations where statistics are later done on an area, this is not a useful approach. The cell value should in this case represent the value of the most significant thematic value within the area of the cell. It does not necessarily coincide with the centre point. In this example, an algorithm selecting thematic value on majority area instead of centre point should be used.
Version 1.3 2005-20-06 www.eionet.eu.int/gis Page 27 of 55
6. Map extents used by the EEA
The EEA has developed a set of defined map extents to cover all ‘standard’ needs. The map extents have been used in Environmental signals reports and Europe’s environment: the third assessment, and are expected to be used in all future EEA publications and information material.
6.1. Map extents: north, south, east, west
When defining map extents (north–south, east–west) the following aspects were considered: • Covering the needs for standard maps in reports, roughly covering some 70–80 % of the total
needs. There will always be additional maps in other sizes and formats; • Ability to reuse and mix data from different productions. In earlier productions, it has been difficult
to reuse map components in maps based on different productions as map extents and projections have varied;
• Reusability also requires a standard reference coordinate system and projection. Most of the maps are based on the projection: Lambert Azimuthal Equal Area projection 52 N, 10 E or Lambert Azimuthal Equal Area projection 52 N, 20 E (see Chapter 2). Some maps extending outside Europe use other parameters and projections;
• Harmonious appearances of maps; • Map sizes that fit report layout standards (Chapter 7).
6.2. Recommended map extents: a full series
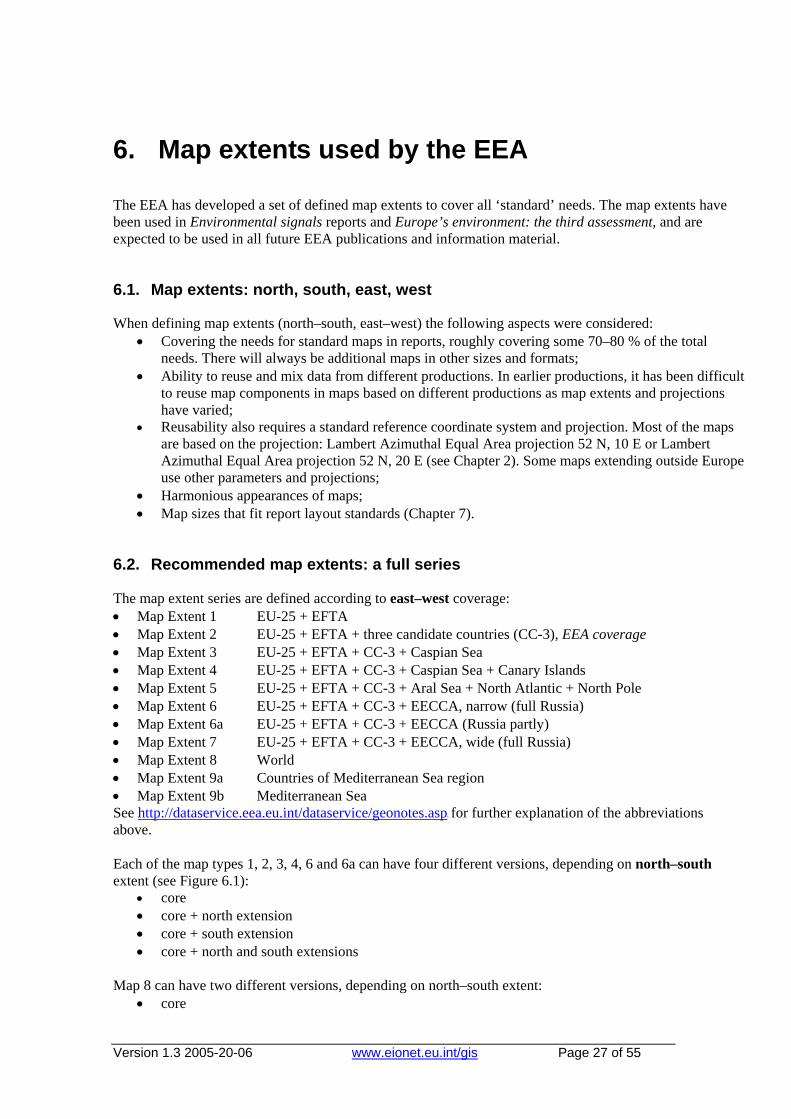
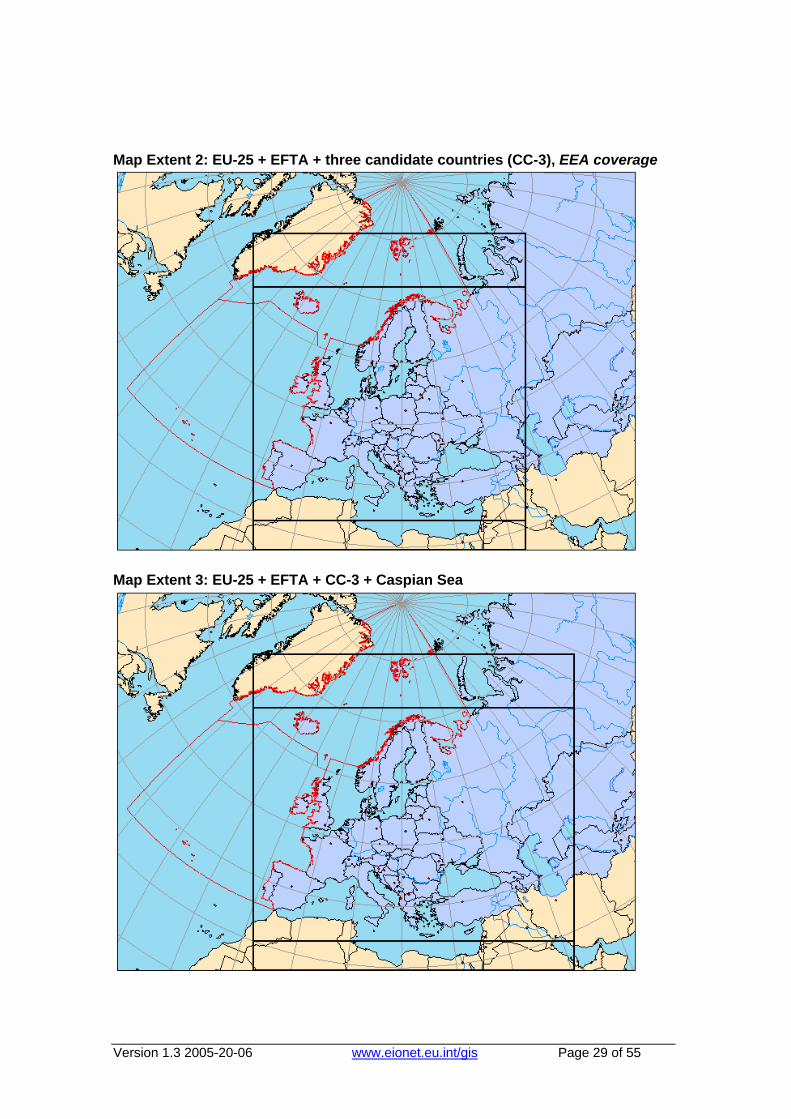
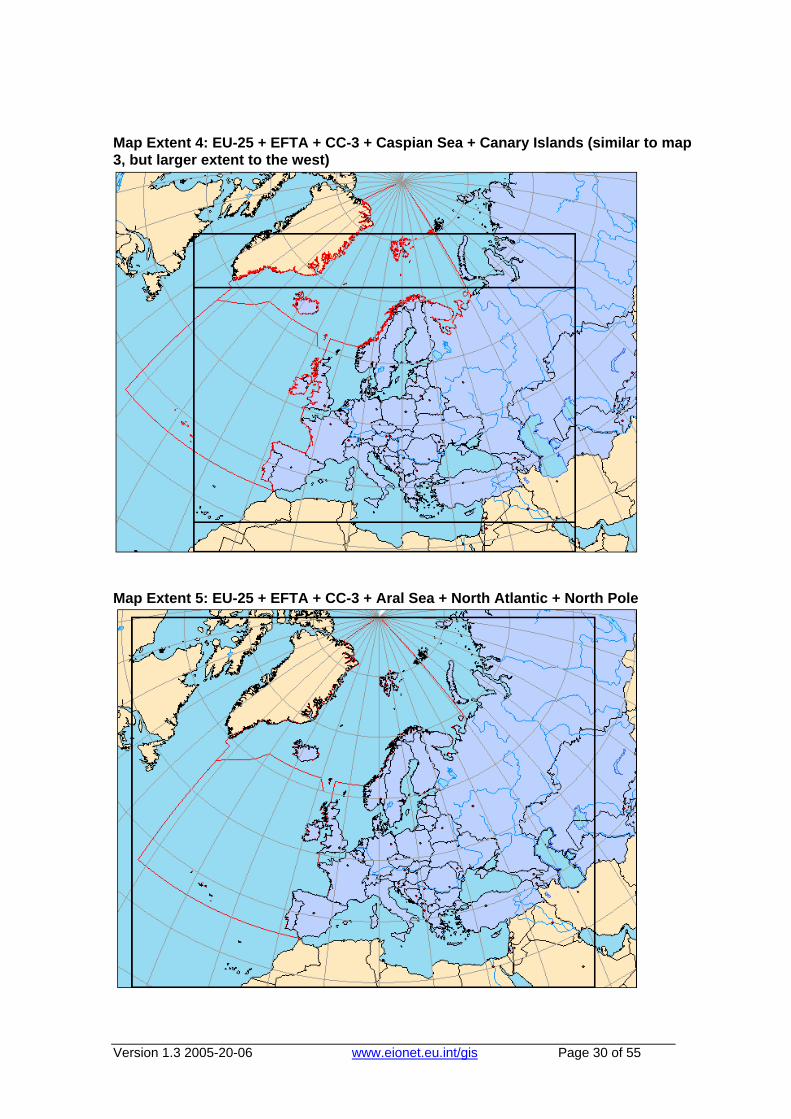
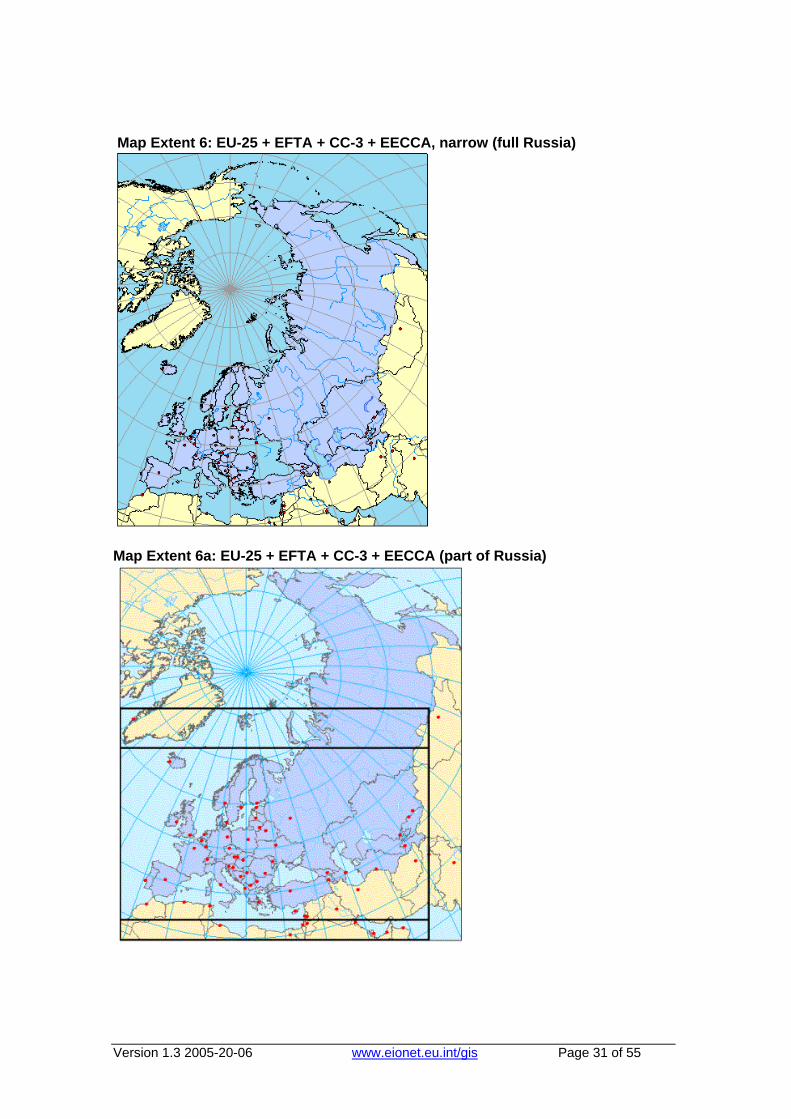
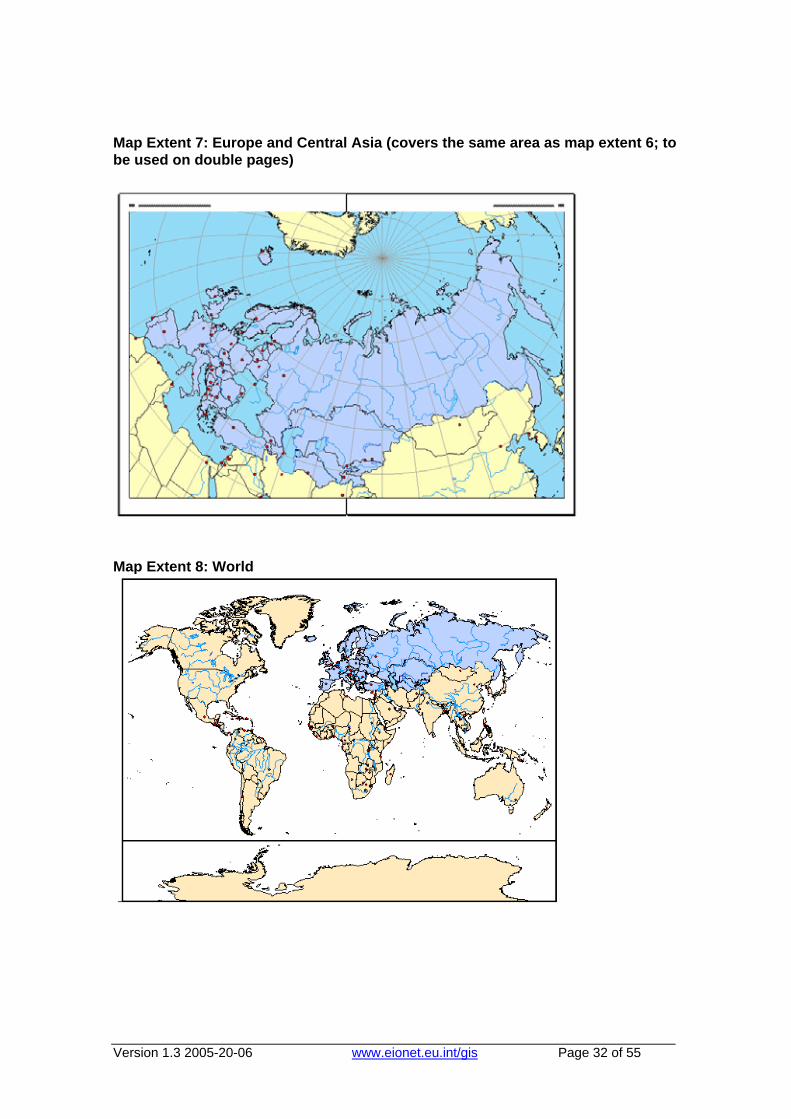
The map extent series are defined according to east–west coverage: • Map Extent 1 EU-25 + EFTA • Map Extent 2 EU-25 + EFTA + three candidate countries (CC-3), EEA coverage • Map Extent 3 EU-25 + EFTA + CC-3 + Caspian Sea • Map Extent 4 EU-25 + EFTA + CC-3 + Caspian Sea + Canary Islands • Map Extent 5 EU-25 + EFTA + CC-3 + Aral Sea + North Atlantic + North Pole • Map Extent 6 EU-25 + EFTA + CC-3 + EECCA, narrow (full Russia) • Map Extent 6a EU-25 + EFTA + CC-3 + EECCA (Russia partly) • Map Extent 7 EU-25 + EFTA + CC-3 + EECCA, wide (full Russia) • Map Extent 8 World • Map Extent 9a Countries of Mediterranean Sea region • Map Extent 9b Mediterranean Sea See HTUhttp://dataservice.eea.eu.int/dataservice/geonotes.aspUTH for further explanation of the abbreviations above. Each of the map types 1, 2, 3, 4, 6 and 6a can have four different versions, depending on north–south extent (see Figure 6.1):
• core • core + north extension • core + south extension • core + north and south extensions
Map 8 can have two different versions, depending on north–south extent:
• core
Version 1.3 2005-20-06 www.eionet.eu.int/gis Page 28 of 55
• core + Antarctica
Figure 6.1: Example of a map extent and its possible extensions to the north and south. The map number refers to an extent in east–west direction.
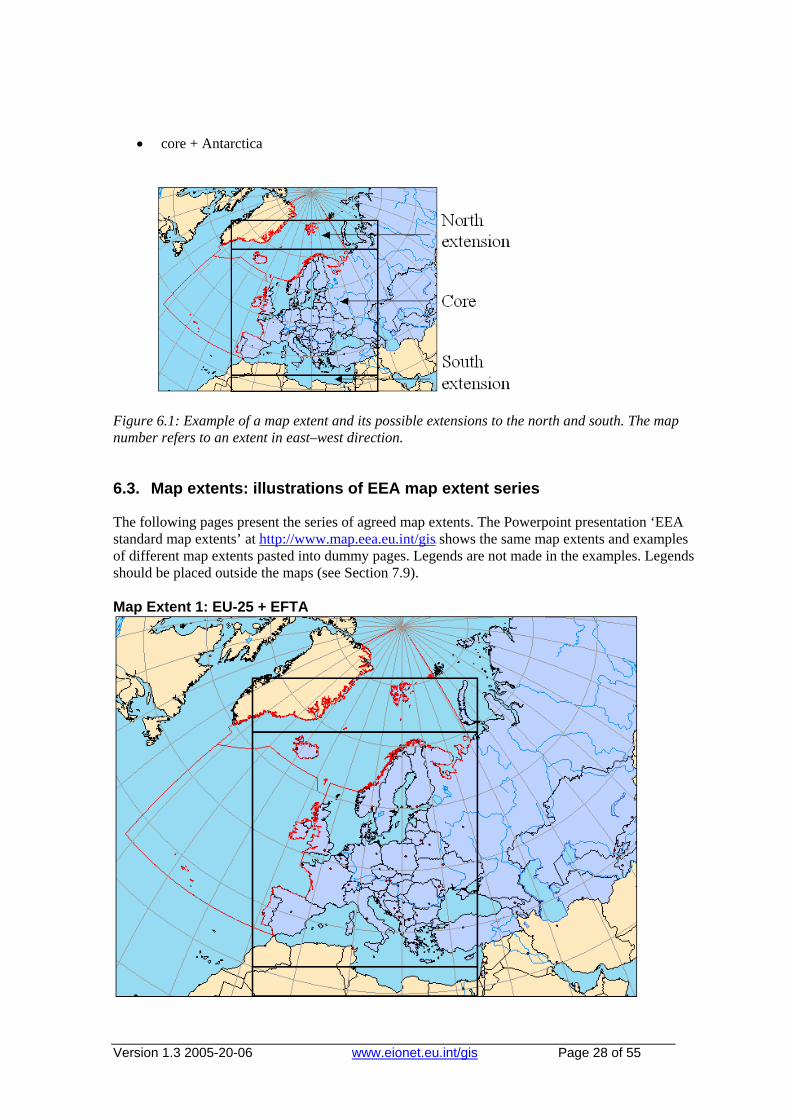
6.3. Map extents: illustrations of EEA map extent series
The following pages present the series of agreed map extents. The Powerpoint presentation ‘EEA standard map extents’ at HTUhttp://www.map.eea.eu.int/gisUTH shows the same map extents and examples of different map extents pasted into dummy pages. Legends are not made in the examples. Legends should be placed outside the maps (see Section 7.9). Map Extent 1: EU-25 + EFTA
Version 1.3 2005-20-06 www.eionet.eu.int/gis Page 29 of 55
Map Extent 2: EU-25 + EFTA + three candidate countries (CC-3), EEA coverage
Map Extent 3: EU-25 + EFTA + CC-3 + Caspian Sea
Version 1.3 2005-20-06 www.eionet.eu.int/gis Page 30 of 55
Map Extent 4: EU-25 + EFTA + CC-3 + Caspian Sea + Canary Islands (similar to map 3, but larger extent to the west)
Map Extent 5: EU-25 + EFTA + CC-3 + Aral Sea + North Atlantic + North Pole
Version 1.3 2005-20-06 www.eionet.eu.int/gis Page 31 of 55
Map Extent 6: EU-25 + EFTA + CC-3 + EECCA, narrow (full Russia)
Map Extent 6a: EU-25 + EFTA + CC-3 + EECCA (part of Russia)
Version 1.3 2005-20-06 www.eionet.eu.int/gis Page 32 of 55
Map Extent 7: Europe and Central Asia (covers the same area as map extent 6; to be used on double pages) Map Extent 8: World
Version 1.3 2005-20-06 www.eionet.eu.int/gis Page 33 of 55
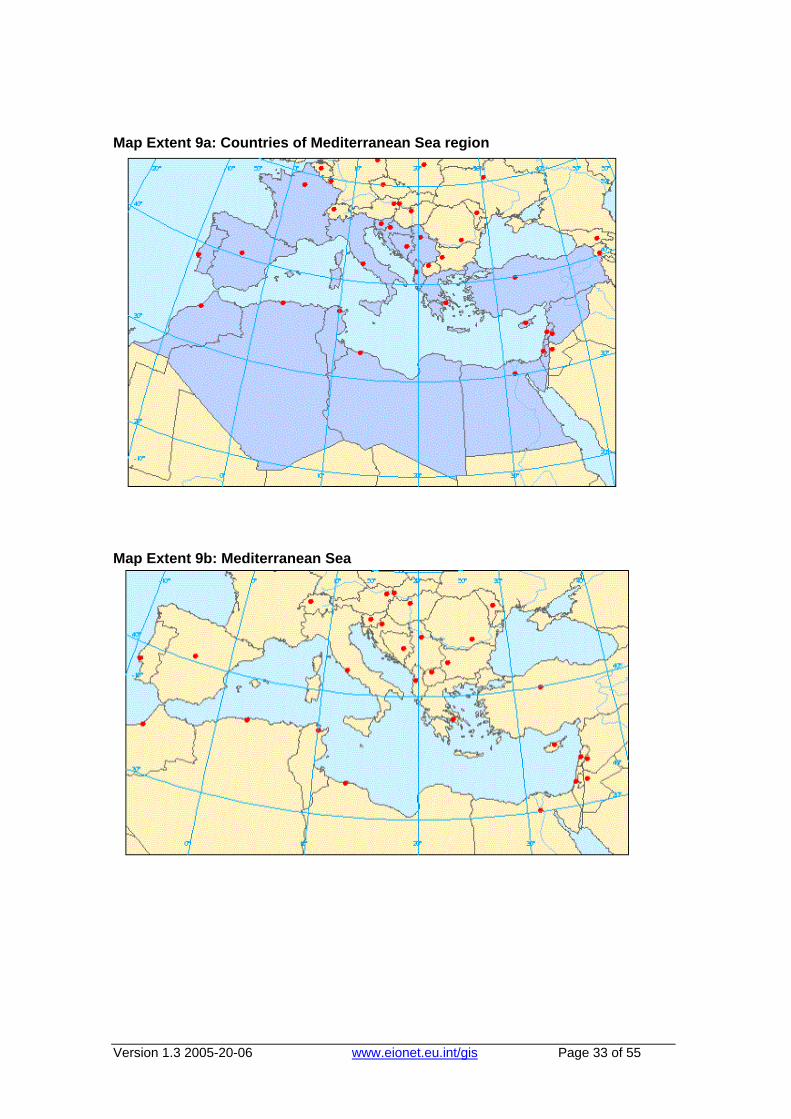
Map Extent 9a: Countries of Mediterranean Sea region
Map Extent 9b: Mediterranean Sea
Version 1.3 2005-20-06 www.eionet.eu.int/gis Page 34 of 55
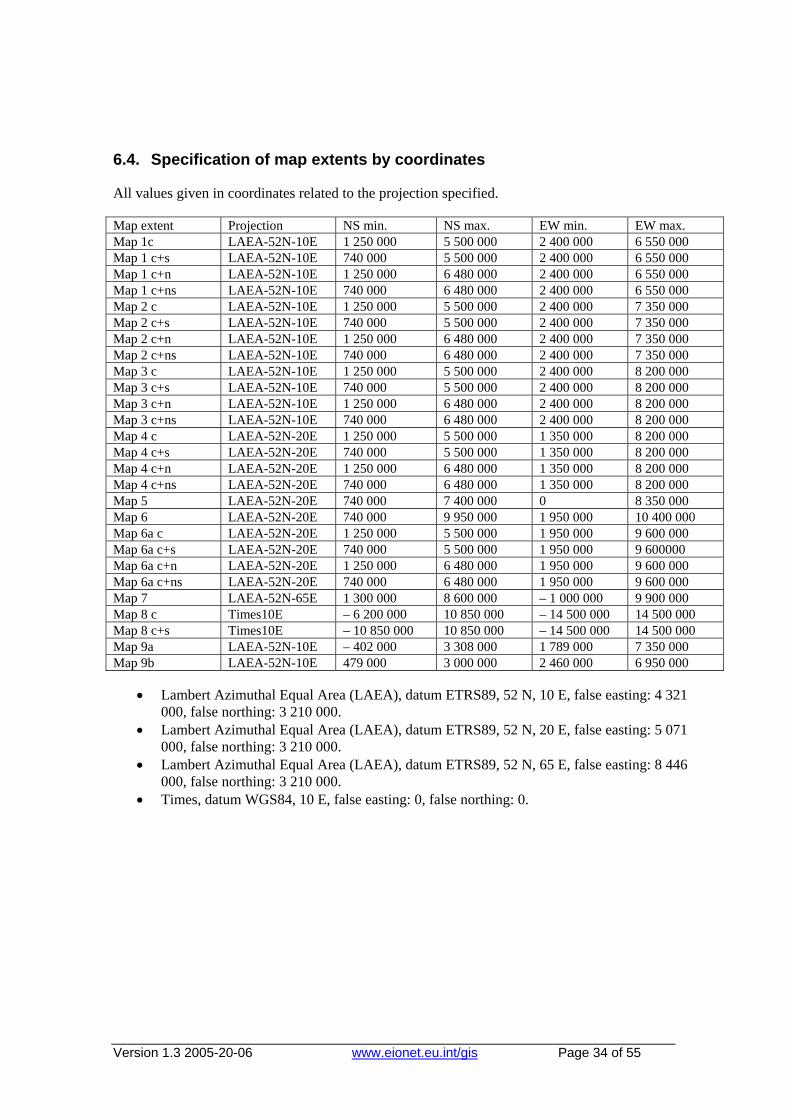
6.4. Specification of map extents by coordinates
All values given in coordinates related to the projection specified. Map extent Projection NS min. NS max. EW min. EW max. Map 1c LAEA-52N-10E 1 250 000 5 500 000 2 400 000 6 550 000 Map 1 c+s LAEA-52N-10E 740 000 5 500 000 2 400 000 6 550 000 Map 1 c+n LAEA-52N-10E 1 250 000 6 480 000 2 400 000 6 550 000 Map 1 c+ns LAEA-52N-10E 740 000 6 480 000 2 400 000 6 550 000 Map 2 c LAEA-52N-10E 1 250 000 5 500 000 2 400 000 7 350 000 Map 2 c+s LAEA-52N-10E 740 000 5 500 000 2 400 000 7 350 000 Map 2 c+n LAEA-52N-10E 1 250 000 6 480 000 2 400 000 7 350 000 Map 2 c+ns LAEA-52N-10E 740 000 6 480 000 2 400 000 7 350 000 Map 3 c LAEA-52N-10E 1 250 000 5 500 000 2 400 000 8 200 000 Map 3 c+s LAEA-52N-10E 740 000 5 500 000 2 400 000 8 200 000 Map 3 c+n LAEA-52N-10E 1 250 000 6 480 000 2 400 000 8 200 000 Map 3 c+ns LAEA-52N-10E 740 000 6 480 000 2 400 000 8 200 000 Map 4 c LAEA-52N-20E 1 250 000 5 500 000 1 350 000 8 200 000 Map 4 c+s LAEA-52N-20E 740 000 5 500 000 1 350 000 8 200 000 Map 4 c+n LAEA-52N-20E 1 250 000 6 480 000 1 350 000 8 200 000 Map 4 c+ns LAEA-52N-20E 740 000 6 480 000 1 350 000 8 200 000 Map 5 LAEA-52N-20E 740 000 7 400 000 0 8 350 000 Map 6 LAEA-52N-20E 740 000 9 950 000 1 950 000 10 400 000 Map 6a c LAEA-52N-20E 1 250 000 5 500 000 1 950 000 9 600 000 Map 6a c+s LAEA-52N-20E 740 000 5 500 000 1 950 000 9 600000 Map 6a c+n LAEA-52N-20E 1 250 000 6 480 000 1 950 000 9 600 000 Map 6a c+ns LAEA-52N-20E 740 000 6 480 000 1 950 000 9 600 000 Map 7 LAEA-52N-65E 1 300 000 8 600 000 – 1 000 000 9 900 000 Map 8 c Times10E – 6 200 000 10 850 000 – 14 500 000 14 500 000 Map 8 c+s Times10E – 10 850 000 10 850 000 – 14 500 000 14 500 000 Map 9a LAEA-52N-10E – 402 000 3 308 000 1 789 000 7 350 000 Map 9b LAEA-52N-10E 479 000 3 000 000 2 460 000 6 950 000
• Lambert Azimuthal Equal Area (LAEA), datum ETRS89, 52 N, 10 E, false easting: 4 321 000, false northing: 3 210 000.
• Lambert Azimuthal Equal Area (LAEA), datum ETRS89, 52 N, 20 E, false easting: 5 071 000, false northing: 3 210 000.
• Lambert Azimuthal Equal Area (LAEA), datum ETRS89, 52 N, 65 E, false easting: 8 446 000, false northing: 3 210 000.
• Times, datum WGS84, 10 E, false easting: 0, false northing: 0.
Version 1.3 2005-20-06 www.eionet.eu.int/gis Page 35 of 55
7. EEA map layout and postscript map templates for reports
Among its variety of information products, the EEA often includes map presentations. In order to facilitate efficient production of the maps and to generate harmonised presentations, the EEA has developed a set of specifications for maps and accompanying legends. This chapter focuses on maps produced for reports, but much of the information is also relevant for maps produced for the Web. The EEA and ETCs are expected to be frequent users of the map specifications.
7.1. Standard size for postscript maps
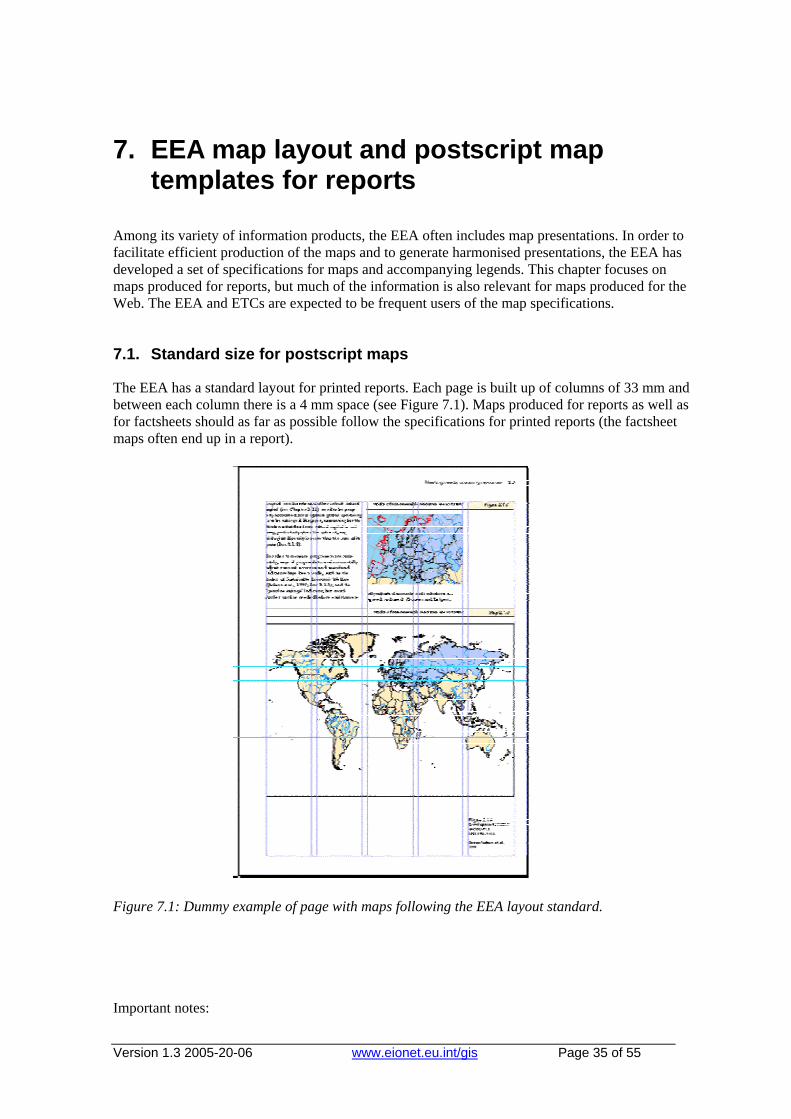
The EEA has a standard layout for printed reports. Each page is built up of columns of 33 mm and between each column there is a 4 mm space (see Figure 7.1). Maps produced for reports as well as for factsheets should as far as possible follow the specifications for printed reports (the factsheet maps often end up in a report).
Figure 7.1: Dummy example of page with maps following the EEA layout standard. Important notes:
Version 1.3 2005-20-06 www.eionet.eu.int/gis Page 36 of 55
• Postscript maps should have a size compatible with the EEA layout norm. Accepted widths are:
– 33 mm – 70 mm – 107 mm – 144 mm – 181 mm
• The EEA will sometimes use and require maps covering two pages, with a maximum width of 402 mm.
• If the EEA has not specified the width of the map, the map should be made with a width of 144 mm, and the legend at the side with a width of 33 mm. It will then be possible to scale it according to the final use in the reports.
• All EEA postscript template maps follow the width (and height) prescriptions. • All EEA ArcGIS template files (drawing instruction files) follow the width (and height)
prescriptions (HTUhttp://www.eionet.eu.int/gisUTH).
7.2. Standard map projections
The map data and template files available from the EEA – both the GIS data and the postscript versions (Adobe Illustrator) – follow the prescribed projections. See Chapter 6 for details about the map extents, Chapter 8 for use of the template files and Chapter 2 for details about projections and reference systems.
7.3. Map extents for postscript maps and other final version maps
The EEA has defined a series of standard map extents as a basis for illustrations in reports and on the Web. Use of a set of standard map extents makes map making easier and more effective. Map data and template files are tailored for the specific purpose of getting harmonised outputs that fit the general EEA standard layout of reports. Use these map extents, defined in detail in Chapter 6, when producing maps for reports and when presenting maps on the EEA Web pages. The series of map extents are defined according to east–west coverage. Each of the map types can have four different versions, depending on north–south extent. There are at present nine map series with different east–west coverage, but only a couple of these are frequently used.
7.4. Scales of postscript maps
The EEA does not focus on certain scales for the maps presented in reports. The scaling of maps in order to provide one of the standard layout widths will probably not result in a rounded map scale. The EEA finds this of low importance for small-scale maps. The map producer should make the map following the standard map extents outlined above. These can be presented in different scales. The focus is on the size of the maps as planned in the report according to where they are to be used. Follow the standard for map width in reports (see Section 7.1).
Version 1.3 2005-20-06 www.eionet.eu.int/gis Page 37 of 55
7.5. Level of generalisation
Different generalisation of elements, e.g. rivers, coastline, land surface, are available from the EEA:
• EEA GIS data (core data) are environmental data, and some general features are not specifically selected for illustration map purposes. The data are primarily for producing environmental indicators;
• for most of the basic features, the GISCO reference database is delivered in three or four different levels of generalisation (scale 1, 3, 10 and 20 mill.). If a dataset is available at different scales, the data with the smallest scale should be used for illustration maps;
• some datasets have a fixed generalisation. Datasets with polygons cut along the coast with a certain coastline will remain with this coastline;
• the EEA has put together a selection of generalised datasets that are adapted to illustration maps at small scales. ETCs and others producing maps on behalf of the EEA should use this selection. The data are labelled EEA map data. The data are GIS data and are the basis for postscript map template files. The EEA’s ArcGIS map templates (see Chapter 8) are also based on the use of these GIS datasets. The data are available from HTUhttp://www.eionet.eu.int/gisUTH.
7.6. Standard elements/features in maps
The maps which the EEA use in reports are usually very simplified. Therefore, the maps delivered to the EEA should contain few elements in the small-scale maps: • few general elements/background features; • few topic issues per map – usually one issue is enough. Maps covering more than one issue
usually appear overloaded and the message in the map is lost. The features delivered from the EEA to be used in map production are based on a level of generalisation comparable to 1:40 mill. in scale or even lower.
Version 1.3 2005-20-06 www.eionet.eu.int/gis Page 38 of 55
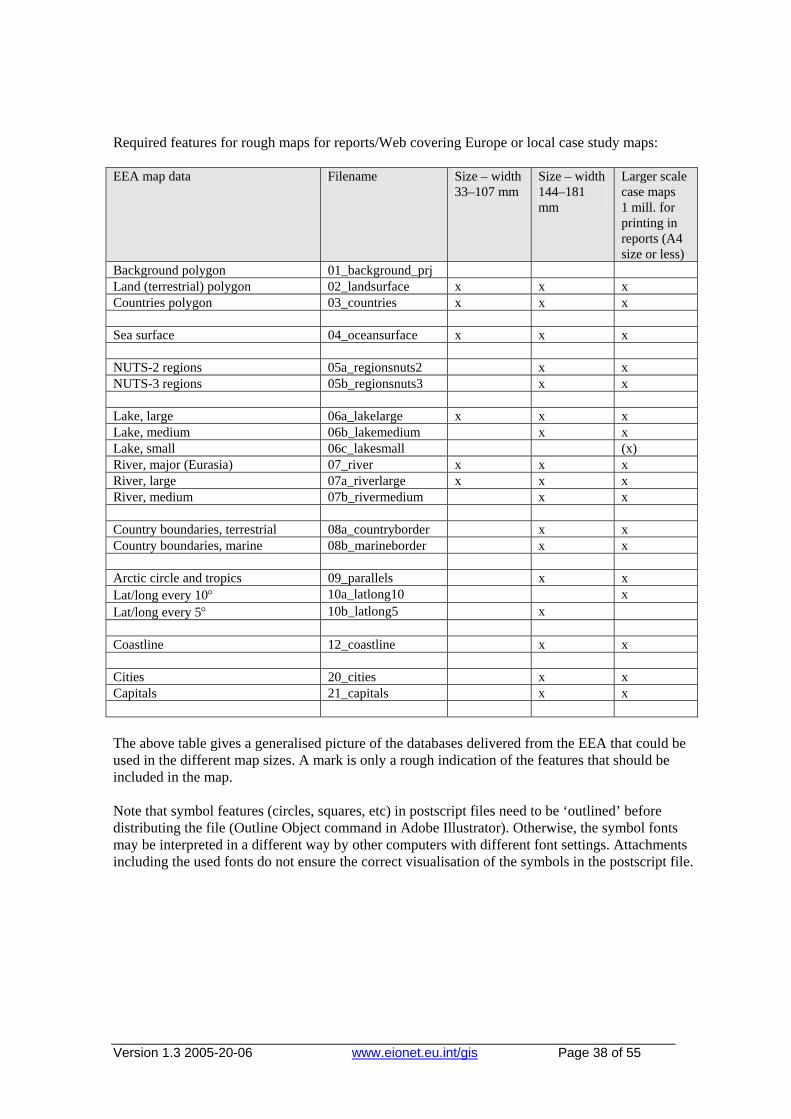
Required features for rough maps for reports/Web covering Europe or local case study maps: EEA map data Filename Size – width
33–107 mm Size – width 144–181 mm
Larger scale case maps 1 mill. for printing in reports (A4 size or less)
Background polygon 01_background_prj Land (terrestrial) polygon 02_landsurface x x x Countries polygon 03_countries x x x Sea surface 04_oceansurface x x x NUTS-2 regions 05a_regionsnuts2 x x NUTS-3 regions 05b_regionsnuts3 x x Lake, large 06a_lakelarge x x x Lake, medium 06b_lakemedium x x Lake, small 06c_lakesmall (x) River, major (Eurasia) 07_river x x x River, large 07a_riverlarge x x x River, medium 07b_rivermedium x x Country boundaries, terrestrial 08a_countryborder x x Country boundaries, marine 08b_marineborder x x Arctic circle and tropics 09_parallels x x Lat/long every 10° 10a_latlong10 x Lat/long every 5° 10b_latlong5 x Coastline 12_coastline x x Cities 20_cities x x Capitals 21_capitals x x The above table gives a generalised picture of the databases delivered from the EEA that could be used in the different map sizes. A mark is only a rough indication of the features that should be included in the map. Note that symbol features (circles, squares, etc) in postscript files need to be ‘outlined’ before distributing the file (Outline Object command in Adobe Illustrator). Otherwise, the symbol fonts may be interpreted in a different way by other computers with different font settings. Attachments including the used fonts do not ensure the correct visualisation of the symbols in the postscript file.
Version 1.3 2005-20-06 www.eionet.eu.int/gis Page 39 of 55
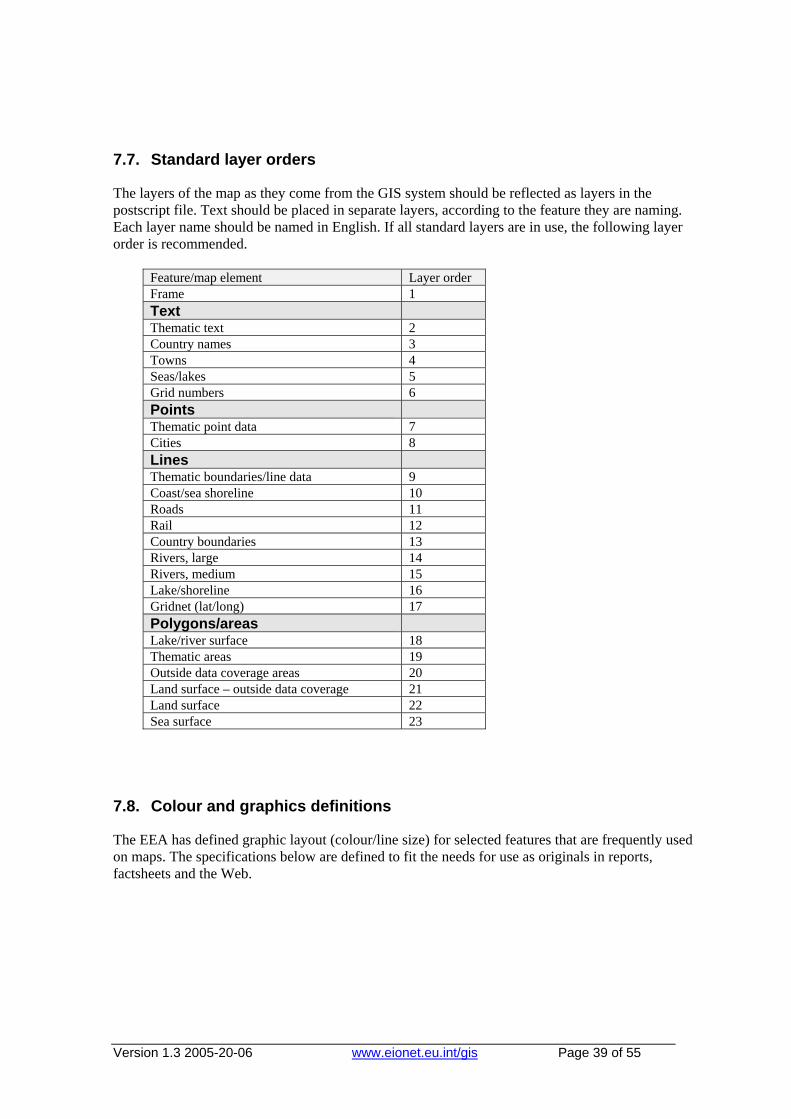
7.7. Standard layer orders
The layers of the map as they come from the GIS system should be reflected as layers in the postscript file. Text should be placed in separate layers, according to the feature they are naming. Each layer name should be named in English. If all standard layers are in use, the following layer order is recommended.
Feature/map element Layer order Frame 1 Text Thematic text 2 Country names 3 Towns 4 Seas/lakes 5 Grid numbers 6 Points Thematic point data 7 Cities 8 Lines Thematic boundaries/line data 9 Coast/sea shoreline 10 Roads 11 Rail 12 Country boundaries 13 Rivers, large 14 Rivers, medium 15 Lake/shoreline 16 Gridnet (lat/long) 17 Polygons/areas Lake/river surface 18 Thematic areas 19 Outside data coverage areas 20 Land surface – outside data coverage 21 Land surface 22 Sea surface 23
7.8. Colour and graphics definitions
The EEA has defined graphic layout (colour/line size) for selected features that are frequently used on maps. The specifications below are defined to fit the needs for use as originals in reports, factsheets and the Web.
Version 1.3 2005-20-06 www.eionet.eu.int/gis Page 40 of 55
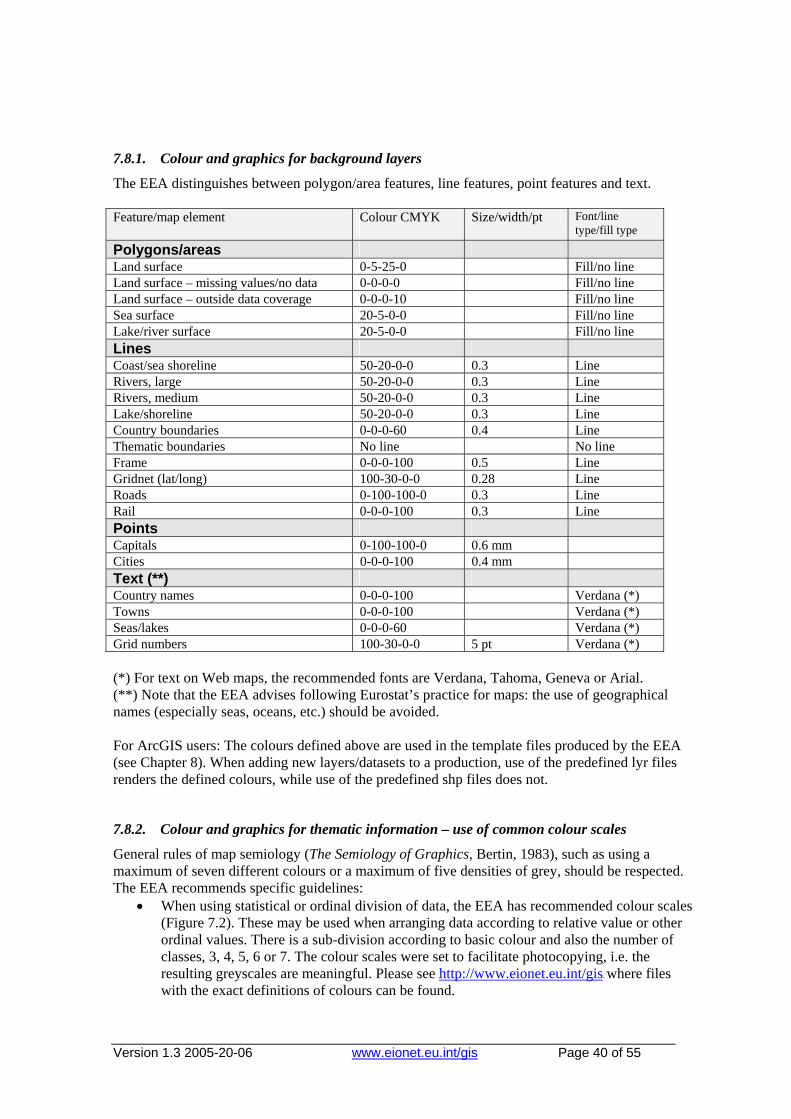
7.8.1. Colour and graphics for background layers
The EEA distinguishes between polygon/area features, line features, point features and text. Feature/map element Colour CMYK
Size/width/pt Font/line
type/fill type
Polygons/areas Land surface 0-5-25-0 Fill/no line Land surface – missing values/no data 0-0-0-0 Fill/no line Land surface – outside data coverage 0-0-0-10 Fill/no line Sea surface 20-5-0-0 Fill/no line Lake/river surface 20-5-0-0 Fill/no line Lines Coast/sea shoreline 50-20-0-0 0.3 Line Rivers, large 50-20-0-0 0.3 Line Rivers, medium 50-20-0-0 0.3 Line Lake/shoreline 50-20-0-0 0.3 Line Country boundaries 0-0-0-60 0.4 Line Thematic boundaries No line No line Frame 0-0-0-100 0.5 Line Gridnet (lat/long) 100-30-0-0 0.28 Line Roads 0-100-100-0 0.3 Line Rail 0-0-0-100 0.3 Line Points Capitals 0-100-100-0 0.6 mm Cities 0-0-0-100 0.4 mm Text (**) Country names 0-0-0-100 Verdana (*) Towns 0-0-0-100 Verdana (*) Seas/lakes 0-0-0-60 Verdana (*) Grid numbers 100-30-0-0 5 pt Verdana (*) (*) For text on Web maps, the recommended fonts are Verdana, Tahoma, Geneva or Arial. (**) Note that the EEA advises following Eurostat’s practice for maps: the use of geographical names (especially seas, oceans, etc.) should be avoided. For ArcGIS users: The colours defined above are used in the template files produced by the EEA (see Chapter 8). When adding new layers/datasets to a production, use of the predefined lyr files renders the defined colours, while use of the predefined shp files does not.
7.8.2. Colour and graphics for thematic information – use of common colour scales
General rules of map semiology (The Semiology of Graphics, Bertin, 1983), such as using a maximum of seven different colours or a maximum of five densities of grey, should be respected. The EEA recommends specific guidelines:
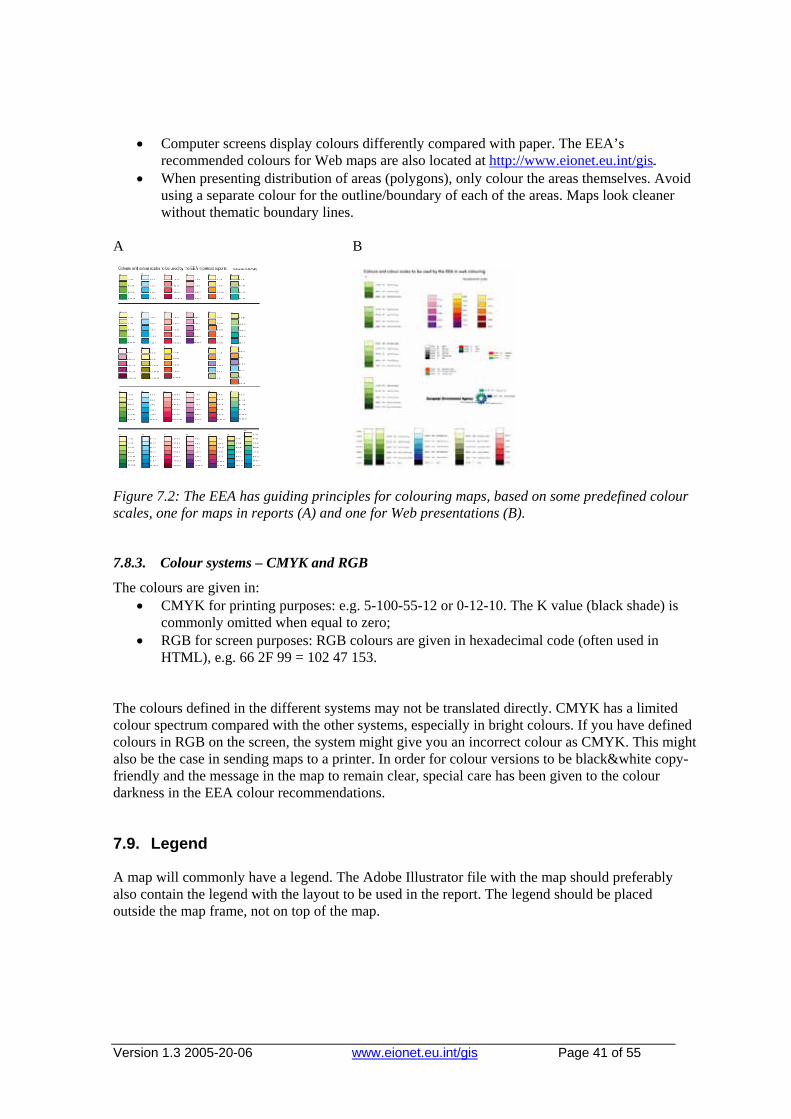
• When using statistical or ordinal division of data, the EEA has recommended colour scales (Figure 7.2). These may be used when arranging data according to relative value or other ordinal values. There is a sub-division according to basic colour and also the number of classes, 3, 4, 5, 6 or 7. The colour scales were set to facilitate photocopying, i.e. the resulting greyscales are meaningful. Please see HTUhttp://www.eionet.eu.int/gisUTH where files with the exact definitions of colours can be found.
Version 1.3 2005-20-06 www.eionet.eu.int/gis Page 41 of 55
• Computer screens display colours differently compared with paper. The EEA’s recommended colours for Web maps are also located at HTUhttp://www.eionet.eu.int/gisUTH.
• When presenting distribution of areas (polygons), only colour the areas themselves. Avoid using a separate colour for the outline/boundary of each of the areas. Maps look cleaner without thematic boundary lines.
A B
Figure 7.2: The EEA has guiding principles for colouring maps, based on some predefined colour scales, one for maps in reports (A) and one for Web presentations (B).
7.8.3. Colour systems – CMYK and RGB
The colours are given in: • CMYK for printing purposes: e.g. 5-100-55-12 or 0-12-10. The K value (black shade) is
commonly omitted when equal to zero; • RGB for screen purposes: RGB colours are given in hexadecimal code (often used in
HTML), e.g. 66 2F 99 = 102 47 153. The colours defined in the different systems may not be translated directly. CMYK has a limited colour spectrum compared with the other systems, especially in bright colours. If you have defined colours in RGB on the screen, the system might give you an incorrect colour as CMYK. This might also be the case in sending maps to a printer. In order for colour versions to be black&white copy-friendly and the message in the map to remain clear, special care has been given to the colour darkness in the EEA colour recommendations.
7.9. Legend
A map will commonly have a legend. The Adobe Illustrator file with the map should preferably also contain the legend with the layout to be used in the report. The legend should be placed outside the map frame, not on top of the map.
Version 1.3 2005-20-06 www.eionet.eu.int/gis Page 42 of 55
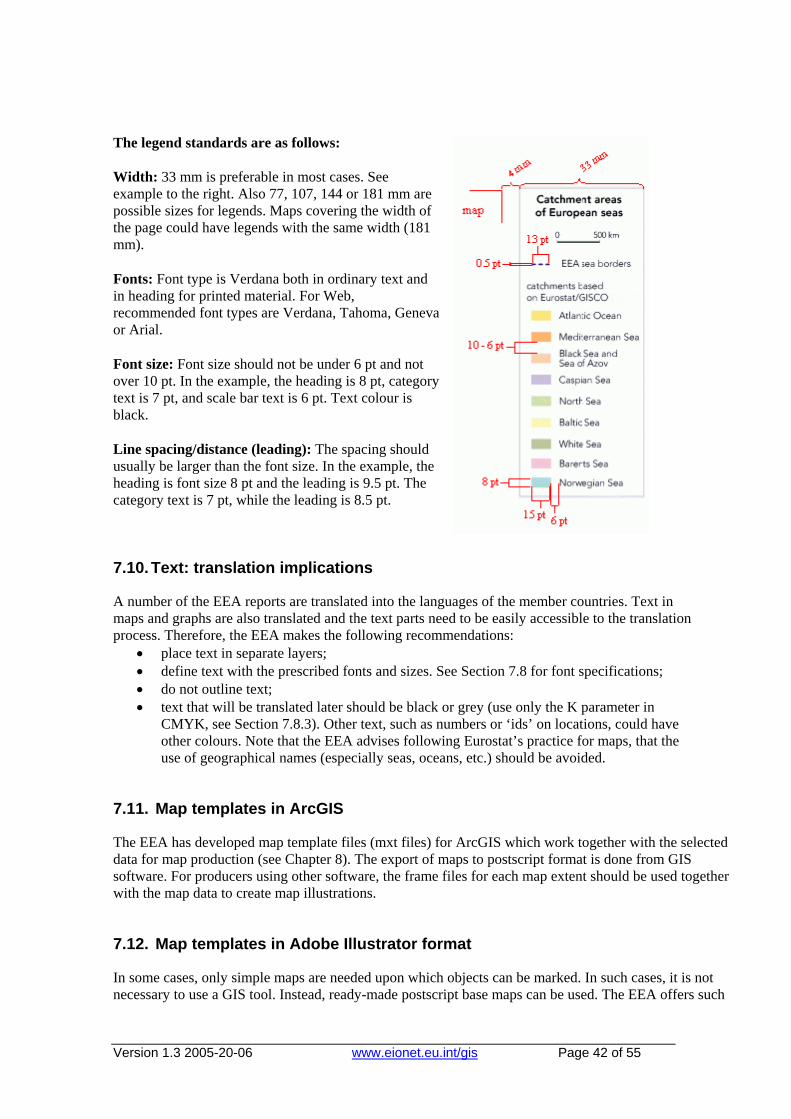
The legend standards are as follows: Width: 33 mm is preferable in most cases. See example to the right. Also 77, 107, 144 or 181 mm are possible sizes for legends. Maps covering the width of the page could have legends with the same width (181 mm). Fonts: Font type is Verdana both in ordinary text and in heading for printed material. For Web, recommended font types are Verdana, Tahoma, Geneva or Arial. Font size: Font size should not be under 6 pt and not over 10 pt. In the example, the heading is 8 pt, category text is 7 pt, and scale bar text is 6 pt. Text colour is black. Line spacing/distance (leading): The spacing should usually be larger than the font size. In the example, the heading is font size 8 pt and the leading is 9.5 pt. The category text is 7 pt, while the leading is 8.5 pt.
7.10. Text: translation implications
A number of the EEA reports are translated into the languages of the member countries. Text in maps and graphs are also translated and the text parts need to be easily accessible to the translation process. Therefore, the EEA makes the following recommendations:
• place text in separate layers; • define text with the prescribed fonts and sizes. See Section 7.8 for font specifications; • do not outline text; • text that will be translated later should be black or grey (use only the K parameter in
CMYK, see Section 7.8.3). Other text, such as numbers or ‘ids’ on locations, could have other colours. Note that the EEA advises following Eurostat’s practice for maps, that the use of geographical names (especially seas, oceans, etc.) should be avoided.
7.11. Map templates in ArcGIS
The EEA has developed map template files (mxt files) for ArcGIS which work together with the selected data for map production (see Chapter 8). The export of maps to postscript format is done from GIS software. For producers using other software, the frame files for each map extent should be used together with the map data to create map illustrations.
7.12. Map templates in Adobe Illustrator format
In some cases, only simple maps are needed upon which objects can be marked. In such cases, it is not necessary to use a GIS tool. Instead, ready-made postscript base maps can be used. The EEA offers such

Version 1.3 2005-20-06 www.eionet.eu.int/gis Page 43 of 55
maps at HTUhttp://www.eionet.eu.int/gisUTH: Adobe Illustrator template files with different map extents. The template files follow the specifications defined by the EEA. When producing, delivering and storing postscript maps using this method, it will still be important for the EEA to receive and store GIS compatible data related to the presentation for documentation. ETCs and other producers of maps should provide the data files, e.g. thematic tables with lat/long values for point locations.
Version 1.3 2005-20-06 www.eionet.eu.int/gis Page 44 of 55
8. EEA map templates for GIS: tools for easy map making
8.1. Why use a predefined map template?
The EEA handles geographical data from many institutions and sources, and presents them as maps in different publications and on the Web. In 2001, the EEA started standardising the handling of this large body of data, and also started work on simplifying the production of maps. Map templates are one of several developments in this respect, and are now being used by the EEA and its partners. The templates are available at HTUhttp://www.eea.eu.int/gisUTH. Map templates are developed for small-scale standard map presentations in printed reports and Web applications. The use of templates will simplify map production as map extents, map projections, background features (e.g. country boundaries, lakes, rivers) and colour schemes are predefined.
• Whenever possible, the use of map templates is strongly recommended. Maps presented in reports and on the Web will appear harmonious and ease the final layout process. In future, it will be possible to reuse and mix data from different productions. Additionally, individual users save time and effort as there is no need to reproduce manually common parts of the maps.
8.2. Available GIS template files
The EEA has developed GIS template files for all map extents, identical to the extents presented in Chapter 6. The templates cover smaller or larger areas of Europe up to the Urals, predefined for use in small-scale maps ranging from 1:70 000 000 to 1:1 000 000. Some templates, as described in Chapter 6, cover wider areas.
There is one template file for each map extent. This means that there are several templates for each of the map series as each series can have up to four different versions, concerning north–south coverage. Below is an example for map series 2: Map 2 EEA area: EU-25 + EFTA + CC-3 Template filename Core map_2c.* Core + north extension map_2c_n.* Core + south extension map_2c_s.* Core + north and south extensions map_2c_ns.*
8.3. ArcGIS template files and using other software
The European Commission has decided to use ESRI products in their services and the EEA follows this recommendation. The ArcGIS map template files (.mxt) are made with the use of lyr-files that define colour and symbol definitions. However, users of other GIS software may use the standard EEA map data, the map extent frames (all in shape format) and the layout definitions in Chapter 7.
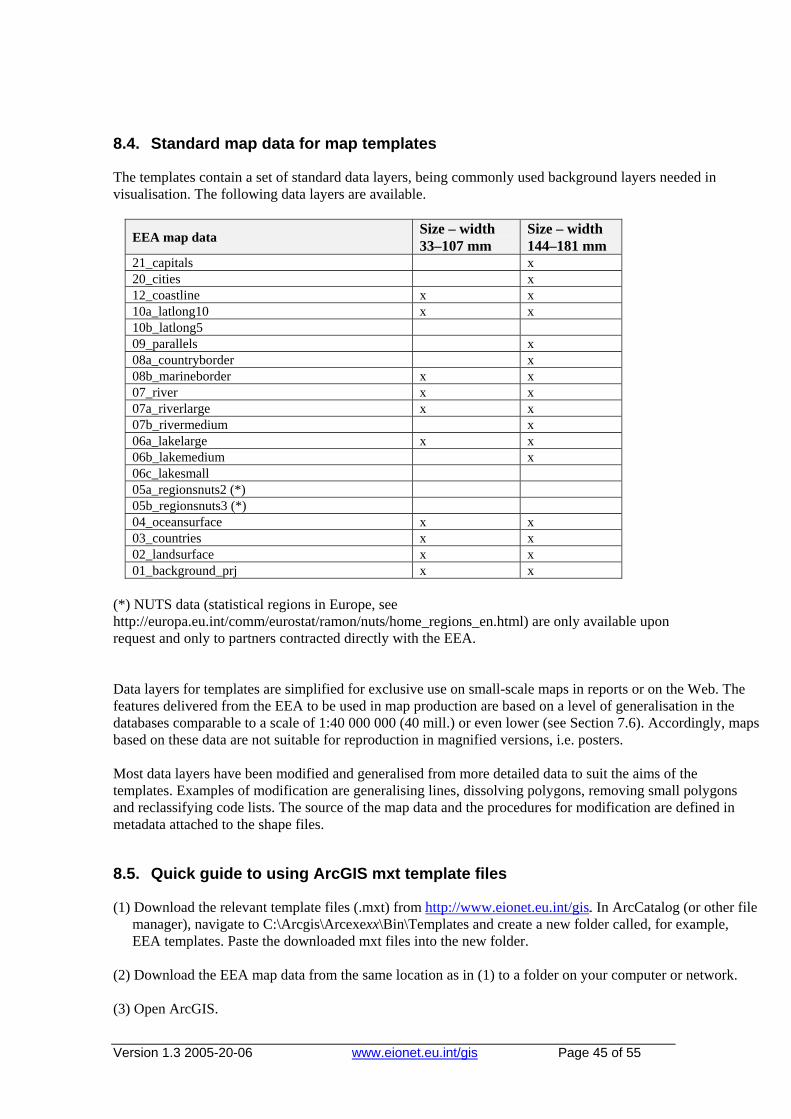
Version 1.3 2005-20-06 www.eionet.eu.int/gis Page 45 of 55
8.4. Standard map data for map templates
The templates contain a set of standard data layers, being commonly used background layers needed in visualisation. The following data layers are available.
EEA map data Size – width 33–107 mm
Size – width 144–181 mm
21_capitals x 20_cities x 12_coastline x x 10a_latlong10 x x 10b_latlong5 09_parallels x 08a_countryborder x 08b_marineborder x x 07_river x x 07a_riverlarge x x 07b_rivermedium x 06a_lakelarge x x 06b_lakemedium x 06c_lakesmall 05a_regionsnuts2 (*) 05b_regionsnuts3 (*) 04_oceansurface x x 03_countries x x 02_landsurface x x 01_background_prj x x
(*) NUTS data (statistical regions in Europe, see http://europa.eu.int/comm/eurostat/ramon/nuts/home_regions_en.html) are only available upon request and only to partners contracted directly with the EEA. Data layers for templates are simplified for exclusive use on small-scale maps in reports or on the Web. The features delivered from the EEA to be used in map production are based on a level of generalisation in the databases comparable to a scale of 1:40 000 000 (40 mill.) or even lower (see Section 7.6). Accordingly, maps based on these data are not suitable for reproduction in magnified versions, i.e. posters. Most data layers have been modified and generalised from more detailed data to suit the aims of the templates. Examples of modification are generalising lines, dissolving polygons, removing small polygons and reclassifying code lists. The source of the map data and the procedures for modification are defined in metadata attached to the shape files.
8.5. Quick guide to using ArcGIS mxt template files
(1) Download the relevant template files (.mxt) from HTUhttp://www.eionet.eu.int/gisUTH. In ArcCatalog (or other file manager), navigate to C:\Arcgis\Arcexexx\Bin\Templates and create a new folder called, for example, EEA templates. Paste the downloaded mxt files into the new folder.
(2) Download the EEA map data from the same location as in (1) to a folder on your computer or network. (3) Open ArcGIS.
Version 1.3 2005-20-06 www.eionet.eu.int/gis Page 46 of 55
(4) If you get the dialog ‘Start using ArcGIS with’, tick ‘A template’. If you do not get the dialog box, go to
File > New. (5) In the ‘New’ dialog, choose a suitable template from the ‘EEA templates’ tab. Make sure that ‘Create
New Document’ is ticked in the lower left corner. (6) The first time you open a template, all data layer names in the ‘Table of Contents’ appear grey and with a
red exclamation mark. You have to re-establish the connection between the template and the data layers. Right-click on one of the greyed data layers, go to Data > Set data source, browse to the same data layer in the folder where you placed the data in step (2) and click ‘OK’. As all data layers are located in the same folder, all layers in the template should now be connected. Note that a graticule with lat/long numbering is defined as graphics from Data Frame Properties > Grid tab.
(7) Go to File > Add data and browse to find your own data layers. Turn off unnecessary data layers that
came with the map template. (8) Modify the legend in agreement with Section 7.9. (9) Save your map: File > Save. Make sure that the file type is mxd (map document). (This is the default
option.) (10) Export to postscript format (eps or other) is often required. Go to File > Export and, in the export dialog,
choose format (.eps). Resolution of the output is set in Options; 300 dpi is usually sufficient in vector maps and 600 dpi in maps with raster data. It is recommended to examine the output file in Adobe or other image editing software to verify that the resulting map is satisfactory.
Note: If you regret your choice of map template while working with your map, you can change the template. On the Layout Toolbar (you must be in Layout View), click the ‘Change layout’ button. You will then be able to choose from the available map templates.
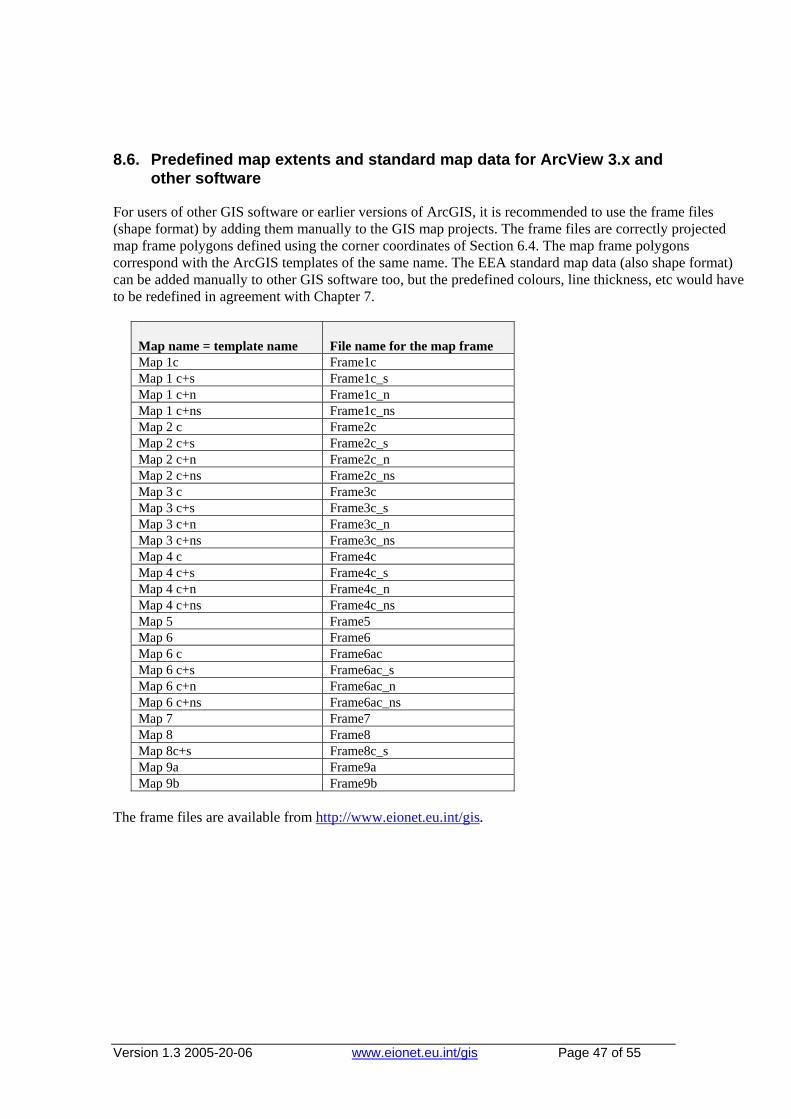
Version 1.3 2005-20-06 www.eionet.eu.int/gis Page 47 of 55
8.6. Predefined map extents and standard map data for ArcView 3.x and other software
For users of other GIS software or earlier versions of ArcGIS, it is recommended to use the frame files (shape format) by adding them manually to the GIS map projects. The frame files are correctly projected map frame polygons defined using the corner coordinates of Section 6.4. The map frame polygons correspond with the ArcGIS templates of the same name. The EEA standard map data (also shape format) can be added manually to other GIS software too, but the predefined colours, line thickness, etc would have to be redefined in agreement with Chapter 7.
Map name = template name
File name for the map frame
Map 1c Frame1c Map 1 c+s Frame1c_s Map 1 c+n Frame1c_n Map 1 c+ns Frame1c_ns Map 2 c Frame2c Map 2 c+s Frame2c_s Map 2 c+n Frame2c_n Map 2 c+ns Frame2c_ns Map 3 c Frame3c Map 3 c+s Frame3c_s Map 3 c+n Frame3c_n Map 3 c+ns Frame3c_ns Map 4 c Frame4c Map 4 c+s Frame4c_s Map 4 c+n Frame4c_n Map 4 c+ns Frame4c_ns Map 5 Frame5 Map 6 Frame6 Map 6 c Frame6ac Map 6 c+s Frame6ac_s Map 6 c+n Frame6ac_n Map 6 c+ns Frame6ac_ns Map 7 Frame7 Map 8 Frame8 Map 8c+s Frame8c_s Map 9a Frame9a Map 9b Frame9b
The frame files are available from HTUhttp://www.eionet.eu.int/gisUTH.
Version 1.3 2005-20-06 www.eionet.eu.int/gis Page 48 of 55
9. Metadata for geographical data and maps
9.1. Requirements on GIS and map deliverables
Metadata (information about a data file/dataset) should accompany any geographically related deliverable to the EEA, including tabular data, GIS data and postscript data. The EEA has developed specifications, guidelines and tools for handling metadata. Data producers are responsible for delivering true and well-formed metadata according to specifications. The EEA is responsible for validating received metadata as well as the main data files, and for making the metadata and data available (if conditions allow). End products are published through the EEA dataservice: HTUhttp://dataservice.eea.eu.int/dataserviceUTH. The following guidelines and tools for dealing with metadata are relevant for the EEA, the ETCs, national institutions and other external partners delivering geographical data (geodata) to the EEA.
9.2. EEA standard for metadata
The EEA has developed a metadata standard for geodata. The standard – termed the European Environment Agency Metadata Standard for Geographic Information (EEA-MSGI) – is a profile of the ISO19115 standard for geographical metadata. EEA-MSGI is defined as a set of metadata for discovery and quick understanding of geographical data. Some of the main aspects covered in a metadataset are: name of data, description of data, coordinate reference system, source and methodology – including version of specification on which the compilation is based, responsible party, ownership, and user rights. EEA-MSGI is designed to meet future needs and demands for inter-operability of metadata. Metadata will become a key component in the coming EEA spatial data infrastructure (EEA-SDI), the node linking the EEA to other European infrastructures such as Inspire (Infrastructure for spatial information in Europe) and the broader EEIS (European environment information system).
9.3. Different metadata requirements for different kinds of geodata
The EEA splits geographically related deliverables into two groups (see Figure 9.1): • original geodata, e.g. tables, geodatasets and geodatabases (GIS data) • compiled geodata, usually maps.
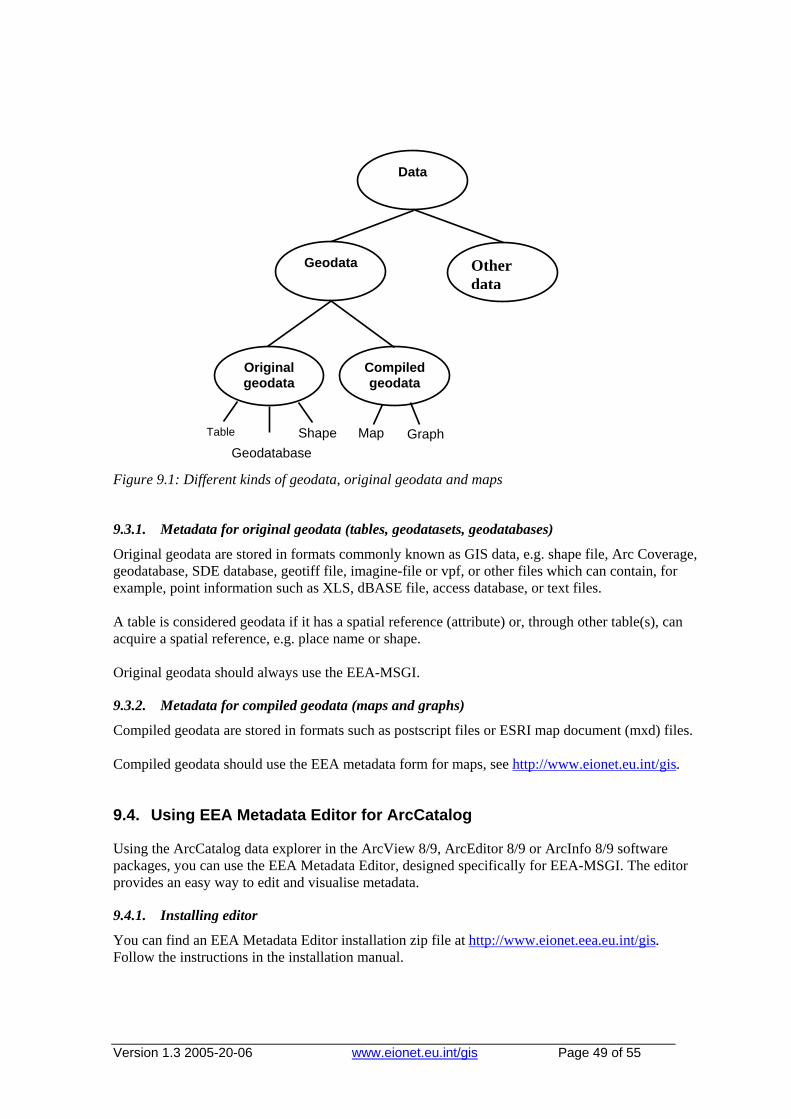
Version 1.3 2005-20-06 www.eionet.eu.int/gis Page 49 of 55
Figure 9.1: Different kinds of geodata, original geodata and maps
9.3.1. Metadata for original geodata (tables, geodatasets, geodatabases)
Original geodata are stored in formats commonly known as GIS data, e.g. shape file, Arc Coverage, geodatabase, SDE database, geotiff file, imagine-file or vpf, or other files which can contain, for example, point information such as XLS, dBASE file, access database, or text files. A table is considered geodata if it has a spatial reference (attribute) or, through other table(s), can acquire a spatial reference, e.g. place name or shape. Original geodata should always use the EEA-MSGI.
9.3.2. Metadata for compiled geodata (maps and graphs)
Compiled geodata are stored in formats such as postscript files or ESRI map document (mxd) files. Compiled geodata should use the EEA metadata form for maps, see HTUhttp://www.eionet.eu.int/gisUTH.
9.4. Using EEA Metadata Editor for ArcCatalog
Using the ArcCatalog data explorer in the ArcView 8/9, ArcEditor 8/9 or ArcInfo 8/9 software packages, you can use the EEA Metadata Editor, designed specifically for EEA-MSGI. The editor provides an easy way to edit and visualise metadata.
9.4.1. Installing editor
You can find an EEA Metadata Editor installation zip file at HTUhttp://www.eionet.eea.eu.int/gisUTH. Follow the instructions in the installation manual.
Data
Other data
Geodata
Original geodata
Compiledgeodata
Geodatabase Table Shape Map Graph
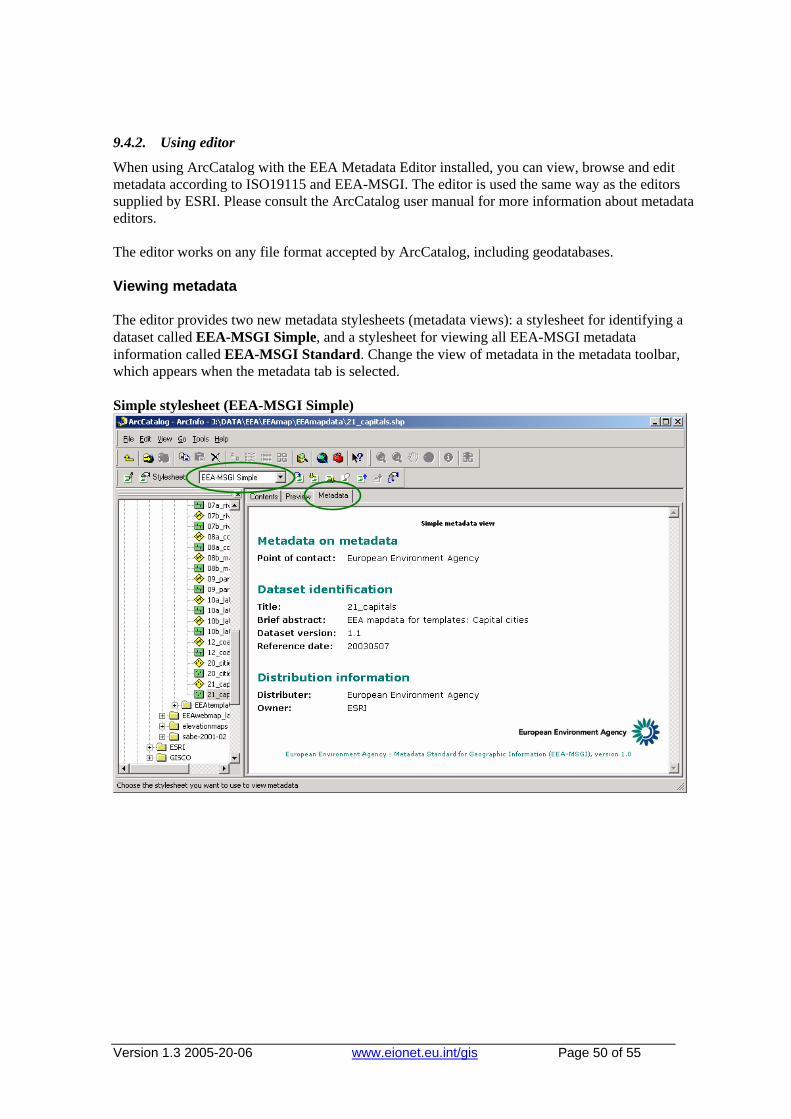
Version 1.3 2005-20-06 www.eionet.eu.int/gis Page 50 of 55
9.4.2. Using editor
When using ArcCatalog with the EEA Metadata Editor installed, you can view, browse and edit metadata according to ISO19115 and EEA-MSGI. The editor is used the same way as the editors supplied by ESRI. Please consult the ArcCatalog user manual for more information about metadata editors. The editor works on any file format accepted by ArcCatalog, including geodatabases. Viewing metadata The editor provides two new metadata stylesheets (metadata views): a stylesheet for identifying a dataset called EEA-MSGI Simple, and a stylesheet for viewing all EEA-MSGI metadata information called EEA-MSGI Standard. Change the view of metadata in the metadata toolbar, which appears when the metadata tab is selected. Simple stylesheet (EEA-MSGI Simple)
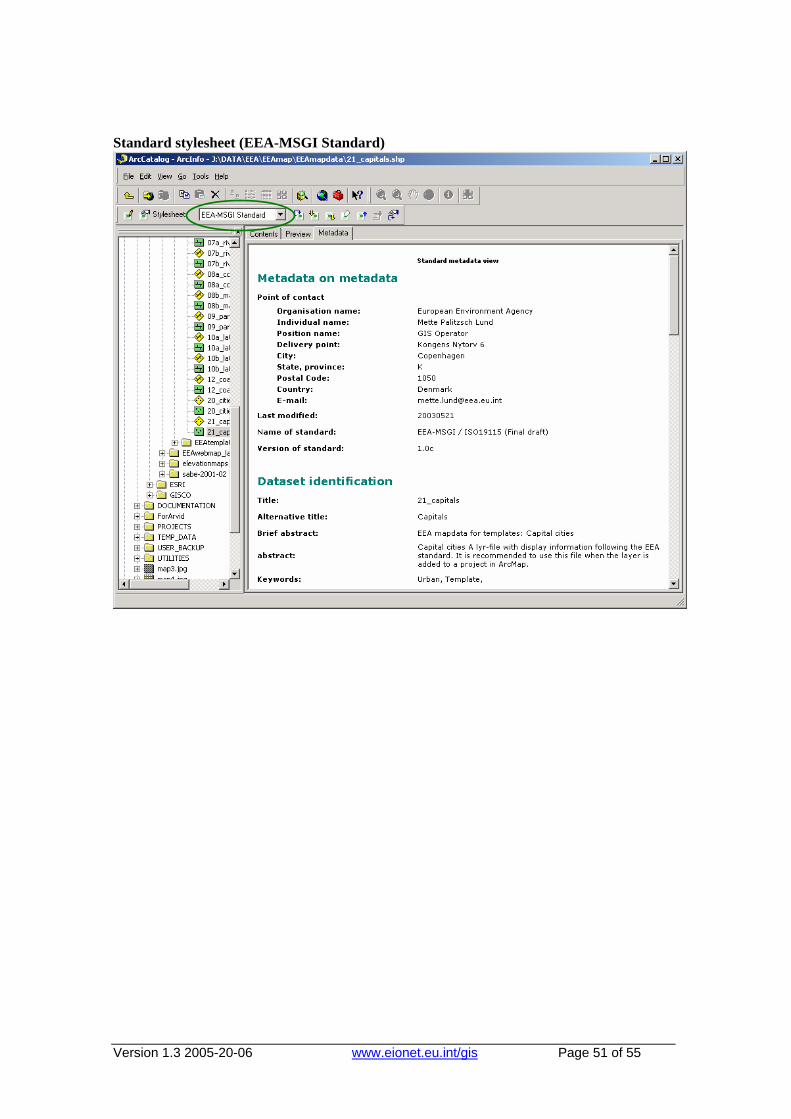
Version 1.3 2005-20-06 www.eionet.eu.int/gis Page 51 of 55
Standard stylesheet (EEA-MSGI Standard)
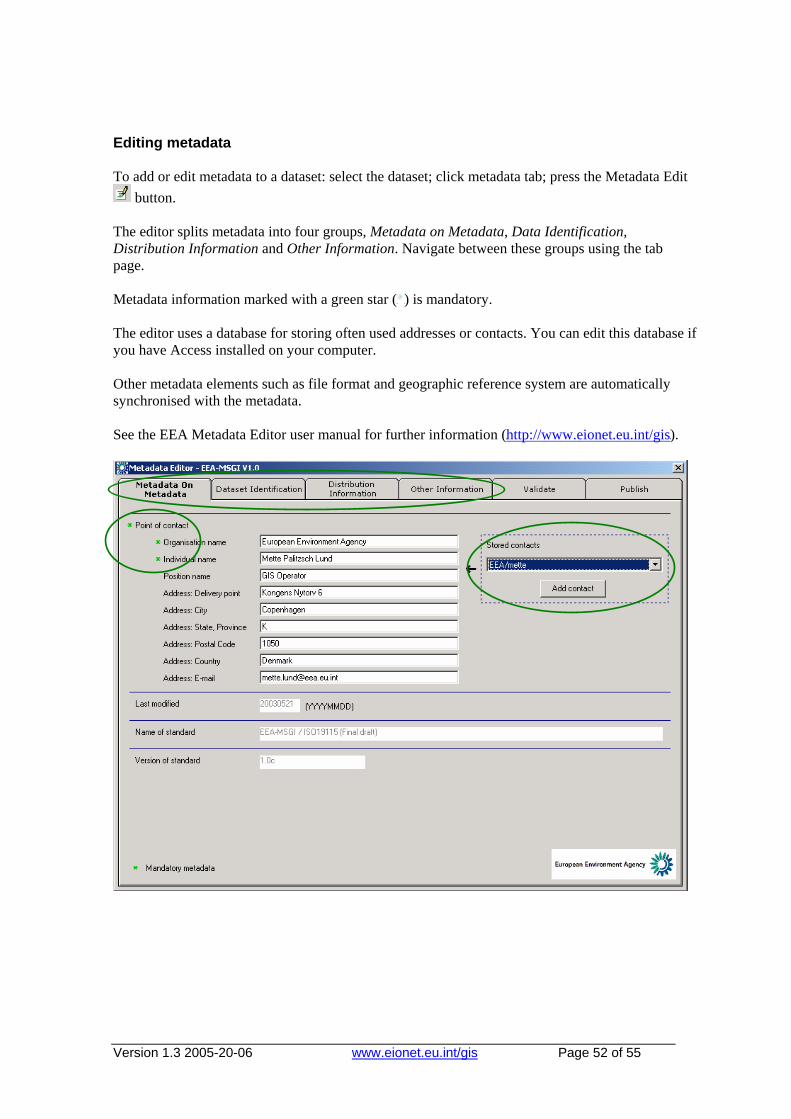
Version 1.3 2005-20-06 www.eionet.eu.int/gis Page 52 of 55
Editing metadata To add or edit metadata to a dataset: select the dataset; click metadata tab; press the Metadata Edit
button. The editor splits metadata into four groups, Metadata on Metadata, Data Identification, Distribution Information and Other Information. Navigate between these groups using the tab page. Metadata information marked with a green star (O O) is mandatory. The editor uses a database for storing often used addresses or contacts. You can edit this database if you have Access installed on your computer. Other metadata elements such as file format and geographic reference system are automatically synchronised with the metadata. See the EEA Metadata Editor user manual for further information (HTUhttp://www.eionet.eu.int/gisUTH).
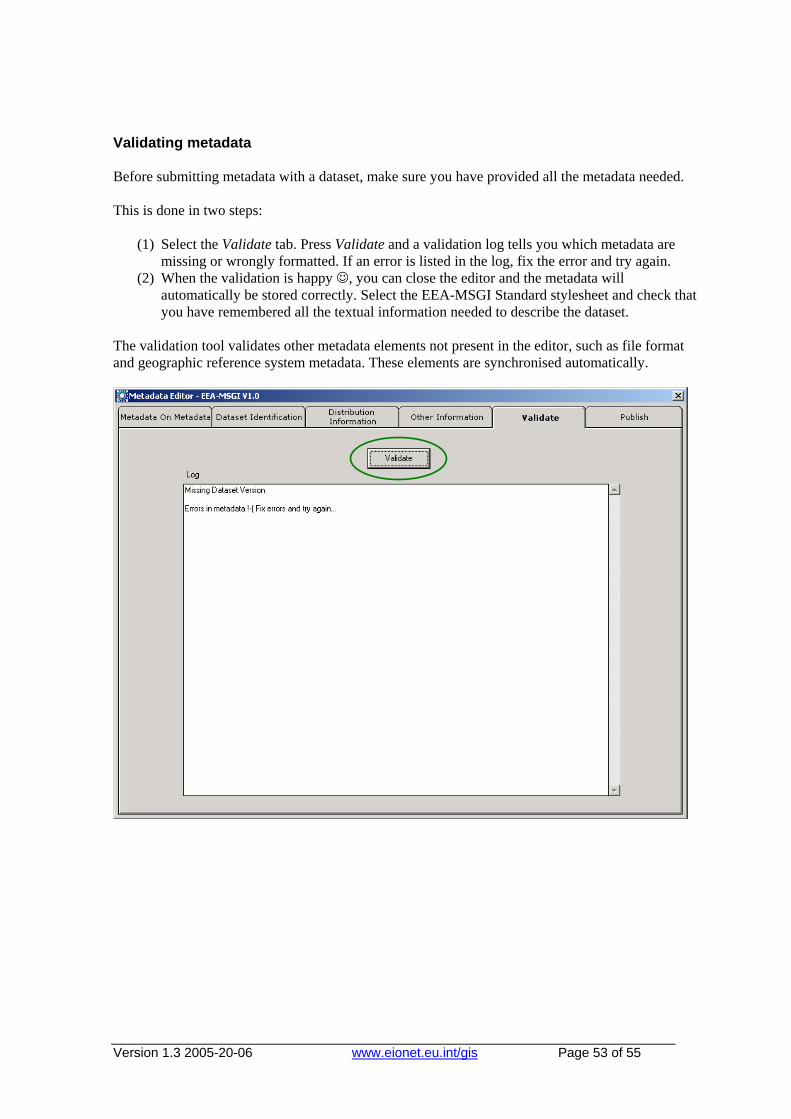
Version 1.3 2005-20-06 www.eionet.eu.int/gis Page 53 of 55
Validating metadata Before submitting metadata with a dataset, make sure you have provided all the metadata needed. This is done in two steps:
(1) Select the Validate tab. Press Validate and a validation log tells you which metadata are missing or wrongly formatted. If an error is listed in the log, fix the error and try again.
(2) When the validation is happy ☺, you can close the editor and the metadata will automatically be stored correctly. Select the EEA-MSGI Standard stylesheet and check that you have remembered all the textual information needed to describe the dataset.
The validation tool validates other metadata elements not present in the editor, such as file format and geographic reference system metadata. These elements are synchronised automatically.
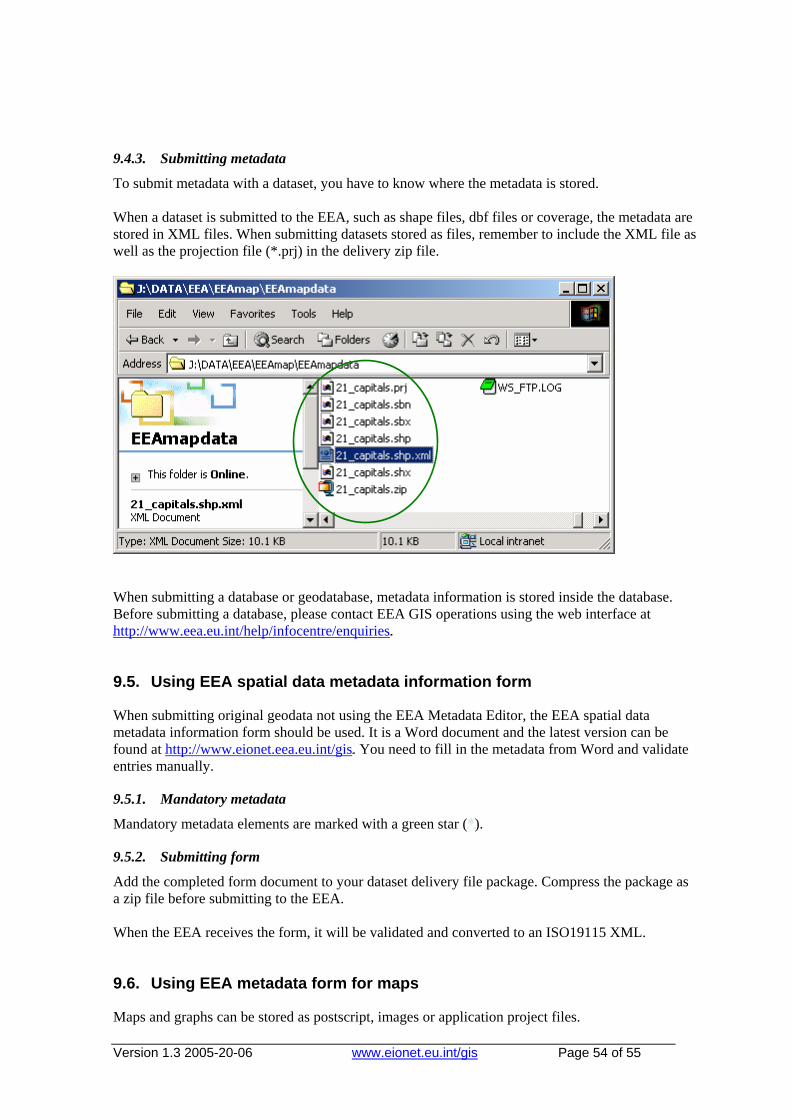
Version 1.3 2005-20-06 www.eionet.eu.int/gis Page 54 of 55
9.4.3. Submitting metadata
To submit metadata with a dataset, you have to know where the metadata is stored. When a dataset is submitted to the EEA, such as shape files, dbf files or coverage, the metadata are stored in XML files. When submitting datasets stored as files, remember to include the XML file as well as the projection file (*.prj) in the delivery zip file.
When submitting a database or geodatabase, metadata information is stored inside the database. Before submitting a database, please contact EEA GIS operations using the web interface at HTUhttp://www.eea.eu.int/help/infocentre/enquiriesUTH.
9.5. Using EEA spatial data metadata information form
When submitting original geodata not using the EEA Metadata Editor, the EEA spatial data metadata information form should be used. It is a Word document and the latest version can be found at HTUhttp://www.eionet.eea.eu.int/gisUTH. You need to fill in the metadata from Word and validate entries manually.
9.5.1. Mandatory metadata
Mandatory metadata elements are marked with a green star (O O).
9.5.2. Submitting form
Add the completed form document to your dataset delivery file package. Compress the package as a zip file before submitting to the EEA. When the EEA receives the form, it will be validated and converted to an ISO19115 XML.
9.6. Using EEA metadata form for maps
Maps and graphs can be stored as postscript, images or application project files.

Version 1.3 2005-20-06 www.eionet.eu.int/gis Page 55 of 55
Find the latest version of the EEA metadata form for maps at HTUhttp://www.eionet.eea.eu.int/gisUTH. The metadata elements are based on Dublin Core standards.
9.6.1. Submitting form
Add the completed form document to your dataset delivery file package. Compress the package as a zip file before submitting to the EEA.