Embed Size (px)
Citation preview
A GUIDE TOCAROTENOIDANALYSIS INFOODS
Delia B. Rodriguez-Amaya, Ph.D.
This publication is made possible bysupport from Opportunities for Micronutri-ent Interventions (OMNI) Research, a projectof the Office of Health and Nutrition, Bureauof Global Programs, Field Support and Re-search, the U.S. Agency for InternationalDevelopment (USAID) under cooperativeagreement HRN-5122-A-00-3046-00 with theInternational Life Sciences Institute (ILSI)Research Foundation.
The information presented herein doesnot necessarily reflect the scientific recom-mendations or views of OMNI Research,USAID, or ILSI.
Additional copies of this and otherOMNI Research publications are availablefree of charge to developing countries andfor US$3.50 to developed countries. Copiescan be ordered from OMNI Research at:
OMNI ResearchILSI Human Nutrition InstituteOne Thomas Circle, NWWashington, DC 20005-5802, USAEmail: [email protected]: hni.ilsi.org/publications
A G
UID
E TO C
ARO
TENO
ID A
NALYSIS IN
FOO
DS
RO
DRIG
UEZ-A
MAYA
A GUIDE TO CAROTENOID ANALYSIS IN FOODS
Delia B. Rodriguez-Amaya, Ph.D.Departamento de Ciência de AlimentosFaculdade de Engenharia de AlimentosUniversidade Estadual de CampinasC.P. 6121, 13083-970 Campinas, SP., Brasil
The use of trade names and commercial sources in this document is for purposes of identification only, and does not imply endorse-ment by ILSI. In addition, the views expressed herein are those of the individual authors and/or their organizations, and do notnecessarily reflect those of ILSI.
Other publications from OMNI Research are available through the ILSI Human Nutrition Institute website: http://hni.ilsi.org/publications.
OMNI ResearchILSI Human Nutrition InstituteOne Thomas Circle, N.W.Washington, D. C. 20005-5802Email: [email protected]
ILSI PRESS
International Life Sciences InstituteOne Thomas Circle, N.W.Washington, D. C. 20005-5802
ISBN 1-57881-072-8
Printed in the United States of America—2001
CONTENTS
Nature of Carotenoids in Foods ......................................................................................................................................... 1Common Food Carotenoids ...................................................................................................................................... 2Composition of Carotenoids in Foods ...................................................................................................................... 5Factors Influencing Carotenoid Composition .........................................................................................................10
Some Physicochemical Properties of Carotenoids ..........................................................................................................14Solubility ..................................................................................................................................................................14Light Absorption ......................................................................................................................................................14Adsorption and Partition Properties ........................................................................................................................18Isomerization and Oxidation ....................................................................................................................................20Chemical Reactions of Functional Groups ...............................................................................................................22
General Procedure and Sources of Errors in Carotenoid Analysis ................................................................................23Special Precautions in Carotenoid Work ..................................................................................................................23General Analytic Procedure .....................................................................................................................................24Prechromatographic Steps .......................................................................................................................................25Chromatographic Separation ...................................................................................................................................27Identification and Quantification .............................................................................................................................31
Do’s and Don’ts in Carotenoid Analysis ...........................................................................................................................34
Sampling and Sample Preparation ...................................................................................................................................37Sampling ...................................................................................................................................................................38Sample Preparation ...................................................................................................................................................38Sampling and Sample Preparation in Food Carotenoid Analysis ............................................................................39
Open-column Method ........................................................................................................................................................41Precautions ..............................................................................................................................................................41Reagents and Apparatus ..........................................................................................................................................41Extraction .................................................................................................................................................................42Partitioning to Petroleum Ether ................................................................................................................................42Saponification ..........................................................................................................................................................42Concentration ..........................................................................................................................................................42Chromatographic Separation ...................................................................................................................................42Thin-layer Chromatography ....................................................................................................................................43Chemical Tests .........................................................................................................................................................44Identification ............................................................................................................................................................45Calculation of the Concentration .............................................................................................................................45
iv A Guide to Carotenoid Analysis in Foods
High-performance Liquid Chromatographic Methods ....................................................................................................46Method of Bushway et al. ........................................................................................................................................46Method of Heinonen et al. .......................................................................................................................................47Method of Hart and Scott ........................................................................................................................................47Method of Khachik et al. ..........................................................................................................................................49
Conclusive Identification ..................................................................................................................................................51
Method Validation and Quality Assurance .......................................................................................................................54Validation of Methods .............................................................................................................................................54Quality Assurance ...................................................................................................................................................56
Calculation of Retention in Processed Foods ..................................................................................................................58
References ........................................................................................................................................................................60
v
PREFACE
There is a worldwide consensus — in different fields of studies and in programs to control micronutrient deficiencyand promote better human health — that more extensive and accurate data on the carotenoid composition of foods areurgently needed. Carotenoid analysis, however, is inherently complicated. Nevertheless, the difficulty can be eased ifthe analyst is provided with sufficient background information about these fascinating compounds and is wellinformed of the problems associated with their identification and quantification.
For many years we have worked on various aspects of food carotenoids. This monograph is an attempt to pass on ouraccumulated experience in the hope that others can study these compounds without much frustration, in less time, atlower cost, and with greater reliability. Although written with the would-be carotenoid analysts in mind, some informa-tions herein presented and discussed may also be useful to workers in this area.
I acknowledge with gratitude the Opportunities for Micronutrient Intervention (OMNI) Research Program, supportedby the United States Agency for International Development, for the publication of this monograph. Thanks are alsodue to the Brazilian Ministry of Science and Technology (PRONEX/FINEP/CNPq/MCT) for supporting my currentresearch in this area.
I greatly appreciate the efforts of several people who contributed to the publication of this work: Drs. FrancesDavidson and Penelope Nestel who saw it through to completion; Drs. Gary Beecher and Steven J. Schwartz forcarefully evaluating the scientific content; the OMNI Research staff, Suzanne Harris, Paula Trumbo, and DorothyFoote; Judith Dickson for editing; Kenn Holmberg for the layout; and Marcos Antonio de Castro for preparing the firstmanuscript.
Delia B. Rodriguez-Amaya
NATURE OF CAROTENOIDS IN FOODS
Food carotenoids are usually C40 tetraterpenoids builtfrom eight C5 isoprenoid units, joined so that thesequence is reversed at the center. The basic linearand symmetrical skeleton, which can be cyclized atone or both ends, has lateral methyl groups separatedby six C atoms at the center and five C atomselsewhere. Cyclization and other modifications, suchas hydrogenation, dehydrogenation, double-bondmigration, chain shortening or extension,rearrangement, isomerization, introduction of oxygenfunctions, or combinations of these processes, resultin a myriad of structures. A distinctive characteristicis an extensive conjugated double-bond system, whichserves as the light-absorbing chromophore responsiblefor the yellow, orange, or red color that thesecompounds impart to many foods. Hydrocarboncarotenoids (i.e., carotenoids made up of only carbonand hydrogen) are collectively called carotenes; thosecontaining oxygen are termed xanthophylls. In nature,they exist primarily in the more stable all-transisomeric form, but cis isomers do occur. The firsttwo C40 carotenoids formed in the biosyntheticpathway have the 15-cis configuration in plants. Thepresence of small amounts of cis isomers of othercarotenoids in natural sources has been increasinglyreported.
Because plants are able to synthesize carotenoidsde novo, the carotenoid composition of plant foods isenriched by the presence of small or trace amountsof biosynthetic precursors, along with derivatives ofthe main components. Although commonly thoughtof as plant pigments, carotenoids are also encounteredin some animal foods. Animals are incapable ofcarotenoid biosynthesis, thus their carotenoids are dietderived, selectively or unselectively absorbed, andaccumulated unchanged or modified slightly intotypical animal carotenoids.
In the early stages of carotenoid biosynthesis, theC5 primer for chain elongation undergoes successive
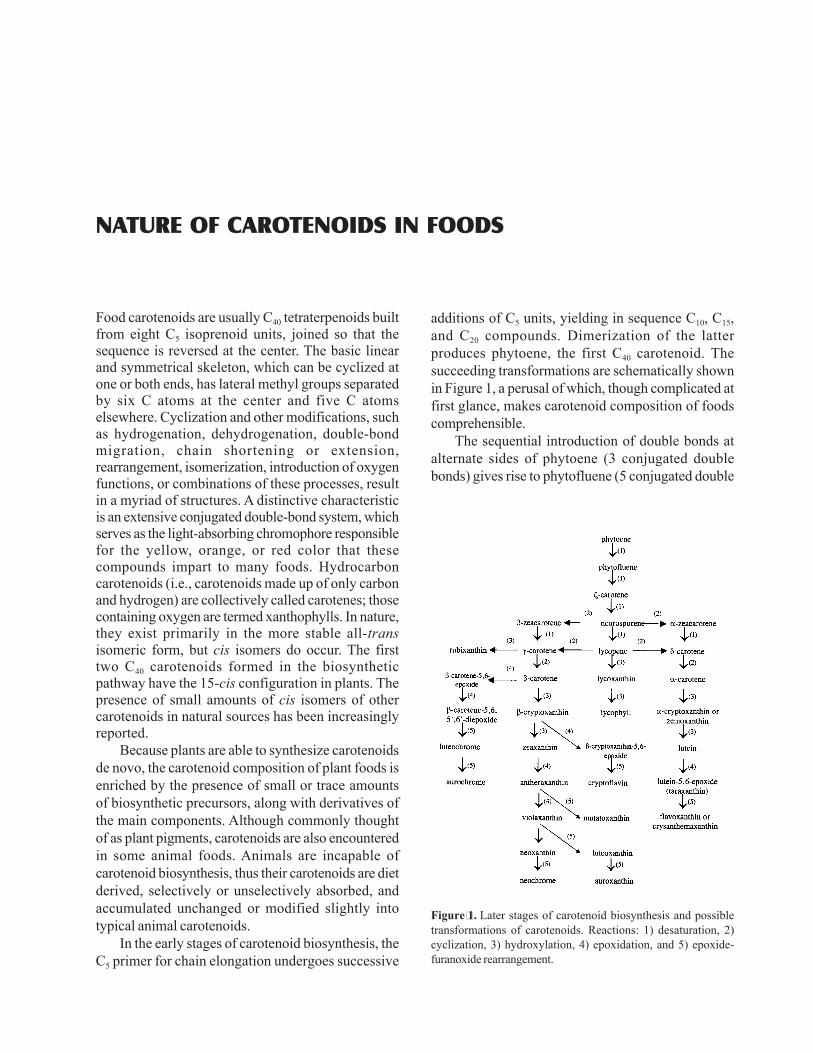
additions of C5 units, yielding in sequence C10, C15,and C20 compounds. Dimerization of the latterproduces phytoene, the first C40 carotenoid. Thesucceeding transformations are schematically shownin Figure 1, a perusal of which, though complicated atfirst glance, makes carotenoid composition of foodscomprehensible.
The sequential introduction of double bonds atalternate sides of phytoene (3 conjugated doublebonds) gives rise to phytofluene (5 conjugated double
Figure 1. Later stages of carotenoid biosynthesis and possibletransformations of carotenoids. Reactions: 1) desaturation, 2)cyclization, 3) hydroxylation, 4) epoxidation, and 5) epoxide-furanoxide rearrangement.
2 A Guide to Carotenoid Analysis in Foods
bonds), ζ-carotene (7 conjugated double bonds),neurosporene (9 conjugated double bonds), andlycopene (11 conjugated double bonds). With thecyclization of one or both ends of the molecule, thebiosynthetic pathway branches out, forming themonocyclic β-zeacarotene and γ-carotene and thebicyclic β-carotene on one side and the monocyclicα-zeacarotene and δ-carotene and the bicyclic α-carotene on the other side. α-Carotene may also beproduced through γ-carotene, the β ring being formedbefore the ε ring. Hydroxylation leads to the formationof rubixanthin (monohydroxy) from γ-carotene andto lycoxanthin (monohydroxy) and lycophyll(dihydroxy) from lycopene. Introduction of a hydroxylgroup in β-carotene results in β-cryptoxanthin and ofa second hydroxyl group, in zeaxanthin. Similarmodifications of α -carotene produces themonohydroxy α-cryptoxanthin or zeinoxanthin and the
dihydroxy lutein. Epoxidation of β-carotene, β-cryptoxanthin, zeaxanthin, and lutein yields a largenumber of epoxy carotenoids.
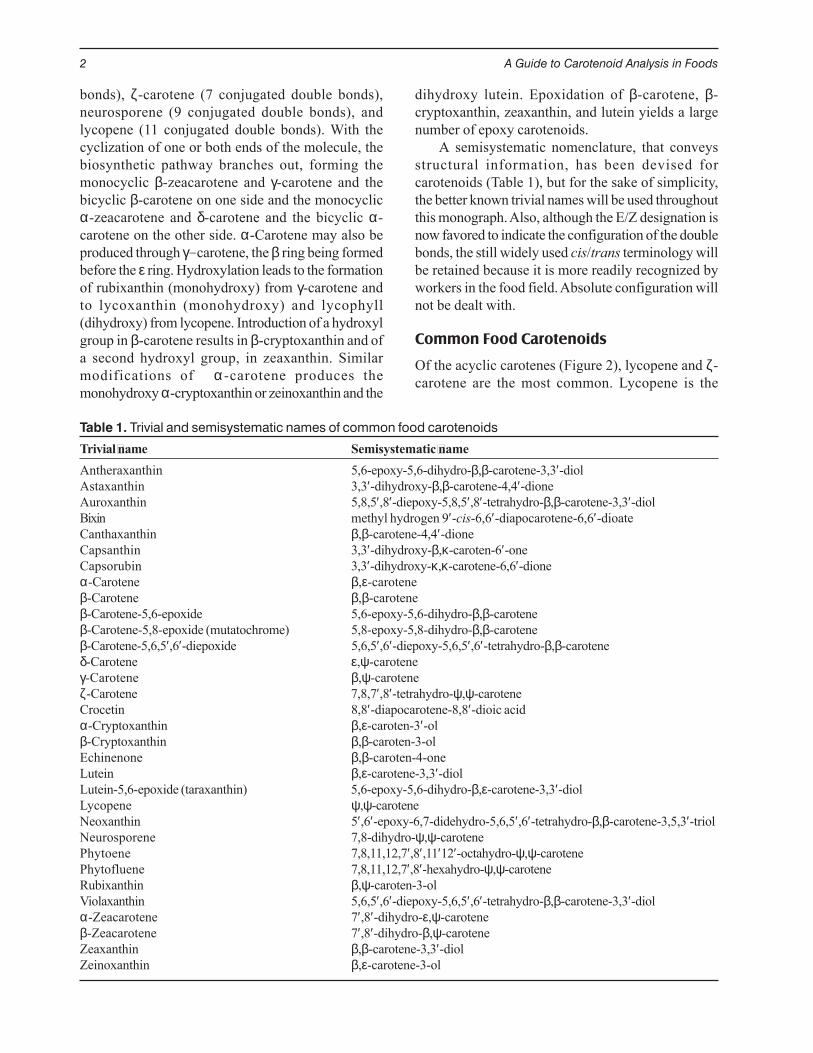
A semisystematic nomenclature, that conveysstructural information, has been devised forcarotenoids (Table 1), but for the sake of simplicity,the better known trivial names will be used throughoutthis monograph. Also, although the E/Z designation isnow favored to indicate the configuration of the doublebonds, the still widely used cis/trans terminology willbe retained because it is more readily recognized byworkers in the food field. Absolute configuration willnot be dealt with.
Common Food Carotenoids
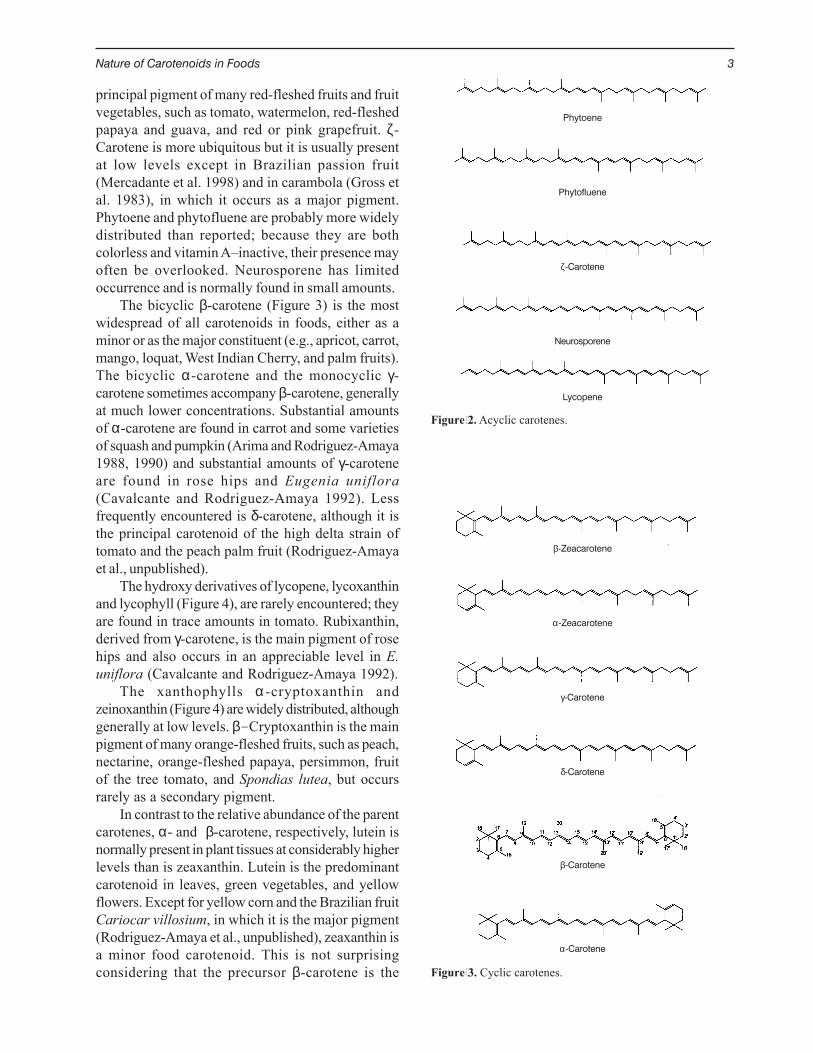
Of the acyclic carotenes (Figure 2), lycopene and ζ-carotene are the most common. Lycopene is the
Table 1. Trivial and semisystematic names of common food carotenoids
Trivial name Semisystematic nameAntheraxanthin 5,6-epoxy-5,6-dihydro-β,β-carotene-3,3′-diolAstaxanthin 3,3′-dihydroxy-β,β-carotene-4,4′-dioneAuroxanthin 5,8,5′,8′-diepoxy-5,8,5′,8′-tetrahydro-β,β-carotene-3,3′-diolBixin methyl hydrogen 9′-cis-6,6′-diapocarotene-6,6′-dioateCanthaxanthin β,β-carotene-4,4′-dioneCapsanthin 3,3′-dihydroxy-β,κ-caroten-6′-oneCapsorubin 3,3′-dihydroxy-κ,κ-carotene-6,6′-dioneα-Carotene β,ε-caroteneβ-Carotene β,β-caroteneβ-Carotene-5,6-epoxide 5,6-epoxy-5,6-dihydro-β,β-caroteneβ-Carotene-5,8-epoxide (mutatochrome) 5,8-epoxy-5,8-dihydro-β,β-caroteneβ-Carotene-5,6,5′,6′-diepoxide 5,6,5′,6′-diepoxy-5,6,5′,6′-tetrahydro-β,β-caroteneδ-Carotene ε,ψ-caroteneγ-Carotene β,ψ-caroteneζ-Carotene 7,8,7′,8′-tetrahydro-ψ,ψ-caroteneCrocetin 8,8′-diapocarotene-8,8′-dioic acidα-Cryptoxanthin β,ε-caroten-3′-olβ-Cryptoxanthin β,β-caroten-3-olEchinenone β,β-caroten-4-oneLutein β,ε-carotene-3,3′-diolLutein-5,6-epoxide (taraxanthin) 5,6-epoxy-5,6-dihydro-β,ε-carotene-3,3′-diolLycopene ψ,ψ-caroteneNeoxanthin 5′,6′-epoxy-6,7-didehydro-5,6,5′,6′-tetrahydro-β,β-carotene-3,5,3′-triolNeurosporene 7,8-dihydro-ψ,ψ-carotenePhytoene 7,8,11,12,7′,8′,11′12′-octahydro-ψ,ψ-carotenePhytofluene 7,8,11,12,7′,8′-hexahydro-ψ,ψ-caroteneRubixanthin β,ψ-caroten-3-olViolaxanthin 5,6,5′,6′-diepoxy-5,6,5′,6′-tetrahydro-β,β-carotene-3,3′-diolα-Zeacarotene 7′,8′-dihydro-ε,ψ-caroteneβ-Zeacarotene 7′,8′-dihydro-β,ψ-caroteneZeaxanthin β,β-carotene-3,3′-diolZeinoxanthin β,ε-carotene-3-ol
Nature of Carotenoids in Foods 3
principal pigment of many red-fleshed fruits and fruitvegetables, such as tomato, watermelon, red-fleshedpapaya and guava, and red or pink grapefruit. ζ-Carotene is more ubiquitous but it is usually presentat low levels except in Brazilian passion fruit(Mercadante et al. 1998) and in carambola (Gross etal. 1983), in which it occurs as a major pigment.Phytoene and phytofluene are probably more widelydistributed than reported; because they are bothcolorless and vitamin A–inactive, their presence mayoften be overlooked. Neurosporene has limitedoccurrence and is normally found in small amounts.
The bicyclic β-carotene (Figure 3) is the mostwidespread of all carotenoids in foods, either as aminor or as the major constituent (e.g., apricot, carrot,mango, loquat, West Indian Cherry, and palm fruits).The bicyclic α-carotene and the monocyclic γ-carotene sometimes accompany β-carotene, generallyat much lower concentrations. Substantial amountsof α-carotene are found in carrot and some varietiesof squash and pumpkin (Arima and Rodriguez-Amaya1988, 1990) and substantial amounts of γ-caroteneare found in rose hips and Eugenia uniflora(Cavalcante and Rodriguez-Amaya 1992). Lessfrequently encountered is δ-carotene, although it isthe principal carotenoid of the high delta strain oftomato and the peach palm fruit (Rodriguez-Amayaet al., unpublished).
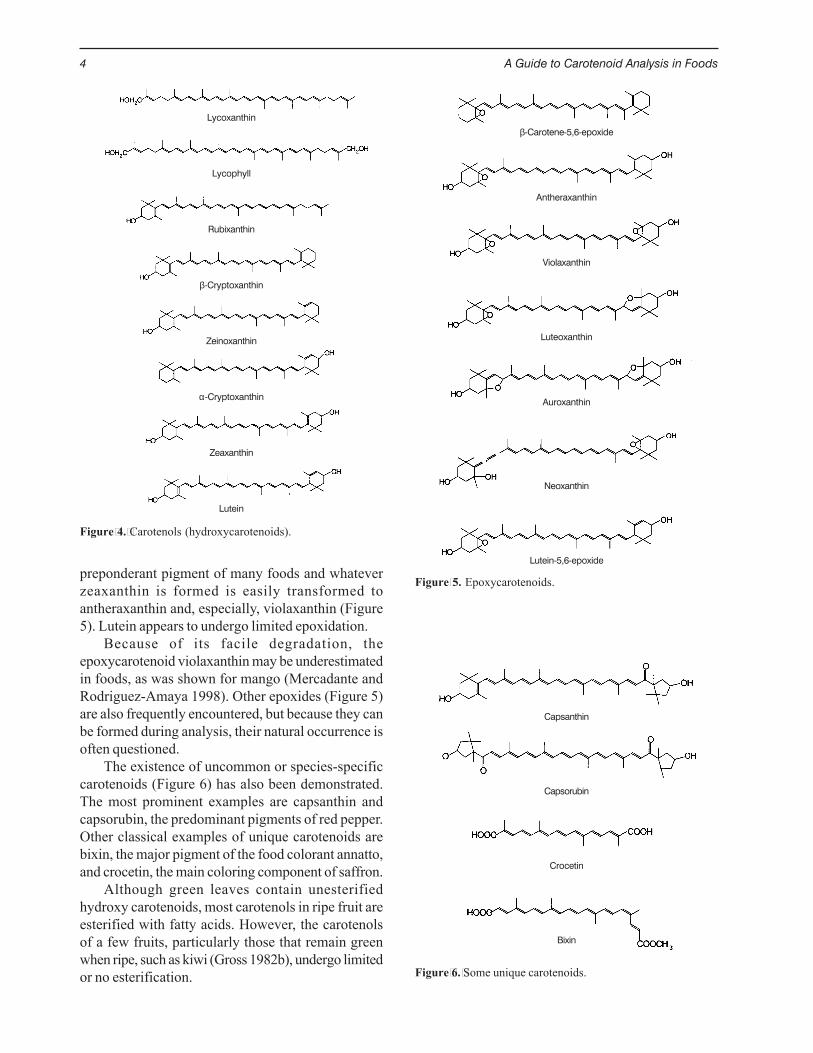
The hydroxy derivatives of lycopene, lycoxanthinand lycophyll (Figure 4), are rarely encountered; theyare found in trace amounts in tomato. Rubixanthin,derived from γ-carotene, is the main pigment of rosehips and also occurs in an appreciable level in E.uniflora (Cavalcante and Rodriguez-Amaya 1992).
The xanthophylls α -cryptoxanthin andzeinoxanthin (Figure 4) are widely distributed, althoughgenerally at low levels. β-Cryptoxanthin is the mainpigment of many orange-fleshed fruits, such as peach,nectarine, orange-fleshed papaya, persimmon, fruitof the tree tomato, and Spondias lutea, but occursrarely as a secondary pigment.
In contrast to the relative abundance of the parentcarotenes, α- and β-carotene, respectively, lutein isnormally present in plant tissues at considerably higherlevels than is zeaxanthin. Lutein is the predominantcarotenoid in leaves, green vegetables, and yellowflowers. Except for yellow corn and the Brazilian fruitCariocar villosium, in which it is the major pigment(Rodriguez-Amaya et al., unpublished), zeaxanthin isa minor food carotenoid. This is not surprisingconsidering that the precursor β-carotene is the Figure 3. Cyclic carotenes.
β-Zeacarotene
α-Zeacarotene
γ-Carotene
δ-Carotene
β-Carotene
α-Carotene
Figure 2. Acyclic carotenes.
Phytoene
Phytofluene
ζ-Carotene
Neurosporene
Lycopene
4 A Guide to Carotenoid Analysis in Foods
preponderant pigment of many foods and whateverzeaxanthin is formed is easily transformed toantheraxanthin and, especially, violaxanthin (Figure5). Lutein appears to undergo limited epoxidation.
Because of its facile degradation, theepoxycarotenoid violaxanthin may be underestimatedin foods, as was shown for mango (Mercadante andRodriguez-Amaya 1998). Other epoxides (Figure 5)are also frequently encountered, but because they canbe formed during analysis, their natural occurrence isoften questioned.
The existence of uncommon or species-specificcarotenoids (Figure 6) has also been demonstrated.The most prominent examples are capsanthin andcapsorubin, the predominant pigments of red pepper.Other classical examples of unique carotenoids arebixin, the major pigment of the food colorant annatto,and crocetin, the main coloring component of saffron.
Although green leaves contain unesterifiedhydroxy carotenoids, most carotenols in ripe fruit areesterified with fatty acids. However, the carotenolsof a few fruits, particularly those that remain greenwhen ripe, such as kiwi (Gross 1982b), undergo limitedor no esterification.
Figure 4. Carotenols (hydroxycarotenoids).
Lycoxanthin
Lycophyll
Rubixanthin
β-Cryptoxanthin
Zeinoxanthin
α-Cryptoxanthin
Zeaxanthin
Lutein
Figure 5. Epoxycarotenoids.
β-Carotene-5,6-epoxide
Antheraxanthin
Violaxanthin
Luteoxanthin
Auroxanthin
Neoxanthin
Lutein-5,6-epoxide
Figure 6. Some unique carotenoids.
Capsanthin
Capsorubin
Crocetin
Bixin
Nature of Carotenoids in Foods 5
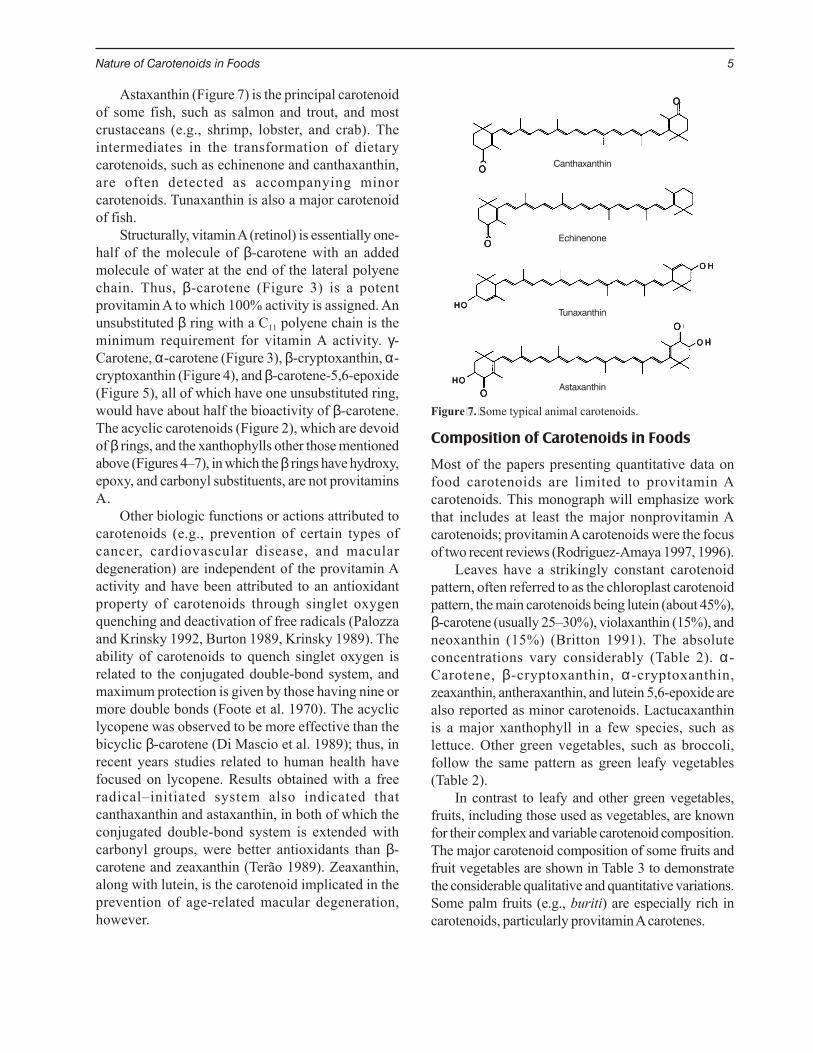
Astaxanthin (Figure 7) is the principal carotenoidof some fish, such as salmon and trout, and mostcrustaceans (e.g., shrimp, lobster, and crab). Theintermediates in the transformation of dietarycarotenoids, such as echinenone and canthaxanthin,are often detected as accompanying minorcarotenoids. Tunaxanthin is also a major carotenoidof fish.
Structurally, vitamin A (retinol) is essentially one-half of the molecule of β-carotene with an addedmolecule of water at the end of the lateral polyenechain. Thus, β-carotene (Figure 3) is a potentprovitamin A to which 100% activity is assigned. Anunsubstituted β ring with a C11 polyene chain is theminimum requirement for vitamin A activity. γ-Carotene, α-carotene (Figure 3), β-cryptoxanthin, α-cryptoxanthin (Figure 4), and β-carotene-5,6-epoxide(Figure 5), all of which have one unsubstituted ring,would have about half the bioactivity of β-carotene.The acyclic carotenoids (Figure 2), which are devoidof β rings, and the xanthophylls other those mentionedabove (Figures 4–7), in which the β rings have hydroxy,epoxy, and carbonyl substituents, are not provitaminsA.
Other biologic functions or actions attributed tocarotenoids (e.g., prevention of certain types ofcancer, cardiovascular disease, and maculardegeneration) are independent of the provitamin Aactivity and have been attributed to an antioxidantproperty of carotenoids through singlet oxygenquenching and deactivation of free radicals (Palozzaand Krinsky 1992, Burton 1989, Krinsky 1989). Theability of carotenoids to quench singlet oxygen isrelated to the conjugated double-bond system, andmaximum protection is given by those having nine ormore double bonds (Foote et al. 1970). The acycliclycopene was observed to be more effective than thebicyclic β-carotene (Di Mascio et al. 1989); thus, inrecent years studies related to human health havefocused on lycopene. Results obtained with a freeradical–initiated system also indicated thatcanthaxanthin and astaxanthin, in both of which theconjugated double-bond system is extended withcarbonyl groups, were better antioxidants than β-carotene and zeaxanthin (Terão 1989). Zeaxanthin,along with lutein, is the carotenoid implicated in theprevention of age-related macular degeneration,however.
Composition of Carotenoids in Foods
Most of the papers presenting quantitative data onfood carotenoids are limited to provitamin Acarotenoids. This monograph will emphasize workthat includes at least the major nonprovitamin Acarotenoids; provitamin A carotenoids were the focusof two recent reviews (Rodriguez-Amaya 1997, 1996).
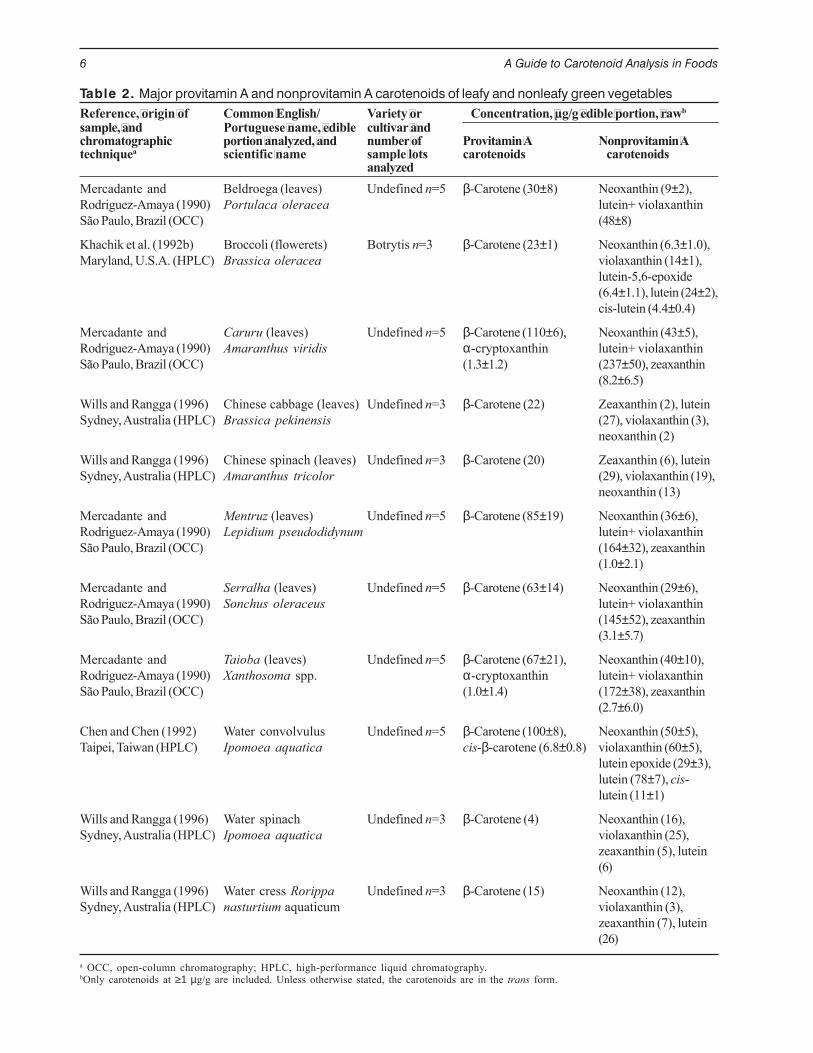
Leaves have a strikingly constant carotenoidpattern, often referred to as the chloroplast carotenoidpattern, the main carotenoids being lutein (about 45%),β-carotene (usually 25–30%), violaxanthin (15%), andneoxanthin (15%) (Britton 1991). The absoluteconcentrations vary considerably (Table 2). α-Carotene, β-cryptoxanthin, α -cryptoxanthin,zeaxanthin, antheraxanthin, and lutein 5,6-epoxide arealso reported as minor carotenoids. Lactucaxanthinis a major xanthophyll in a few species, such aslettuce. Other green vegetables, such as broccoli,follow the same pattern as green leafy vegetables(Table 2).
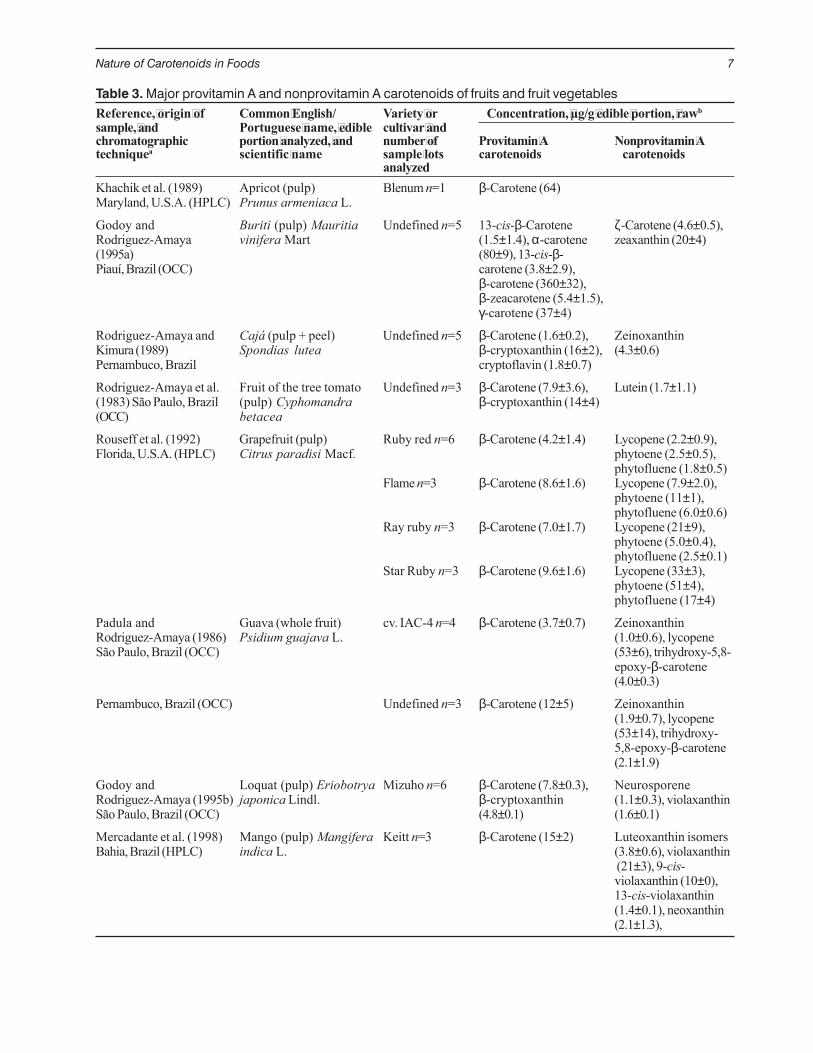
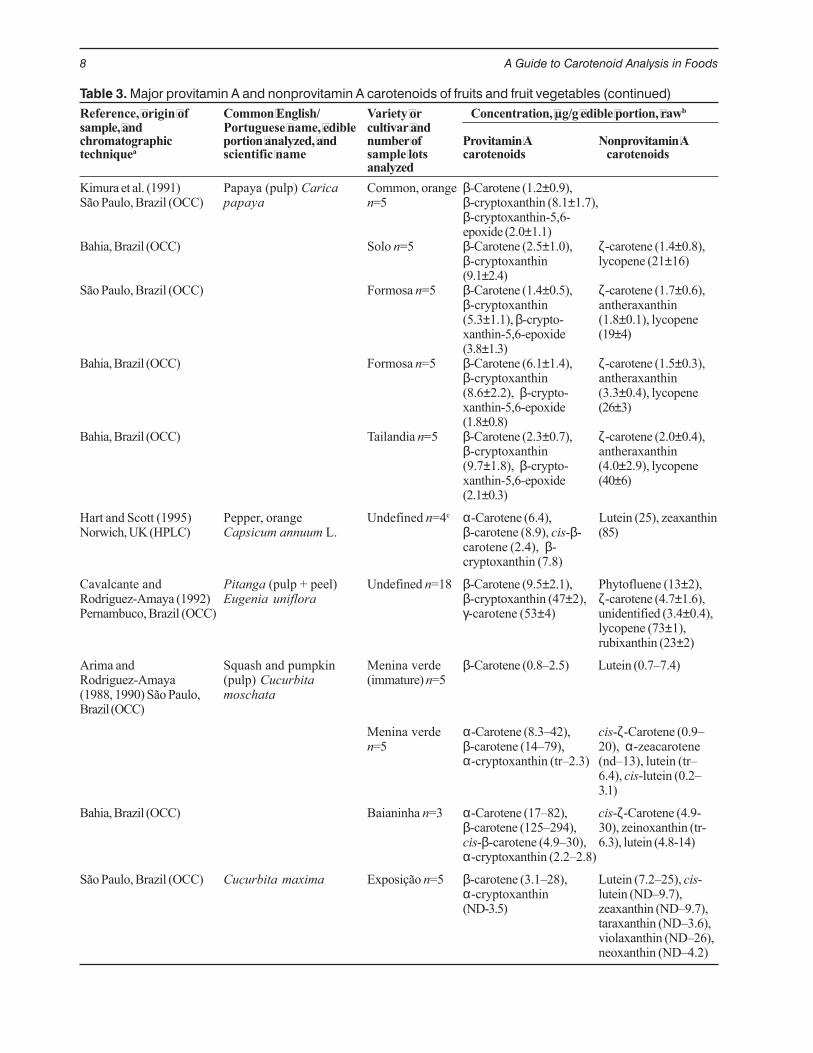
In contrast to leafy and other green vegetables,fruits, including those used as vegetables, are knownfor their complex and variable carotenoid composition.The major carotenoid composition of some fruits andfruit vegetables are shown in Table 3 to demonstratethe considerable qualitative and quantitative variations.Some palm fruits (e.g., buriti) are especially rich incarotenoids, particularly provitamin A carotenes.
Figure 7. Some typical animal carotenoids.
Canthaxanthin
Echinenone
Tunaxanthin
Astaxanthin
OOOOO
HHHHHOOOOO
OOOOO
OOOOO
OOOOO
OOOOO
OOOOO HHHHH
HHHHHOOOOO
OOOOO HHHHH
6 A Guide to Carotenoid Analysis in Foods
Table 2. Major provitamin A and nonprovitamin A carotenoids of leafy and nonleafy green vegetablesReference, origin of Common English/ Variety or Concentration, µg/g edible portion, rawbsample, and Portuguese name, edible cultivar andchromatographic portion analyzed, and number of Provitamin A Nonprovitamin Atechniquea scientific name sample lots carotenoids carotenoids
analyzedMercadante and Beldroega (leaves) Undefined n=5 β-Carotene (30±8) Neoxanthin (9±2),Rodriguez-Amaya (1990) Portulaca oleracea lutein+ violaxanthinSão Paulo, Brazil (OCC) (48±8)
Khachik et al. (1992b) Broccoli (flowerets) Botrytis n=3 β-Carotene (23±1) Neoxanthin (6.3±1.0),Maryland, U.S.A. (HPLC) Brassica oleracea violaxanthin (14±1),
lutein-5,6-epoxide(6.4±1.1), lutein (24±2),cis-lutein (4.4±0.4)
Mercadante and Caruru (leaves) Undefined n=5 β-Carotene (110±6), Neoxanthin (43±5),Rodriguez-Amaya (1990) Amaranthus viridis α-cryptoxanthin lutein+ violaxanthinSão Paulo, Brazil (OCC) (1.3±1.2) (237±50), zeaxanthin
(8.2±6.5)
Wills and Rangga (1996) Chinese cabbage (leaves) Undefined n=3 β-Carotene (22) Zeaxanthin (2), luteinSydney, Australia (HPLC) Brassica pekinensis (27), violaxanthin (3),
neoxanthin (2)
Wills and Rangga (1996) Chinese spinach (leaves) Undefined n=3 β-Carotene (20) Zeaxanthin (6), luteinSydney, Australia (HPLC) Amaranthus tricolor (29), violaxanthin (19),
neoxanthin (13)
Mercadante and Mentruz (leaves) Undefined n=5 β-Carotene (85±19) Neoxanthin (36±6),Rodriguez-Amaya (1990) Lepidium pseudodidynum lutein+ violaxanthinSão Paulo, Brazil (OCC) (164±32), zeaxanthin
(1.0±2.1)
Mercadante and Serralha (leaves) Undefined n=5 β-Carotene (63±14) Neoxanthin (29±6),Rodriguez-Amaya (1990) Sonchus oleraceus lutein+ violaxanthinSão Paulo, Brazil (OCC) (145±52), zeaxanthin
(3.1±5.7)
Mercadante and Taioba (leaves) Undefined n=5 β-Carotene (67±21), Neoxanthin (40±10),Rodriguez-Amaya (1990) Xanthosoma spp. α-cryptoxanthin lutein+ violaxanthinSão Paulo, Brazil (OCC) (1.0±1.4) (172±38), zeaxanthin
(2.7±6.0)
Chen and Chen (1992) Water convolvulus Undefined n=5 β-Carotene (100±8), Neoxanthin (50±5),Taipei, Taiwan (HPLC) Ipomoea aquatica cis-β-carotene (6.8±0.8) violaxanthin (60±5),
lutein epoxide (29±3),lutein (78±7), cis-lutein (11±1)
Wills and Rangga (1996) Water spinach Undefined n=3 β-Carotene (4) Neoxanthin (16),Sydney, Australia (HPLC) Ipomoea aquatica violaxanthin (25),
zeaxanthin (5), lutein(6)
Wills and Rangga (1996) Water cress Rorippa Undefined n=3 β-Carotene (15) Neoxanthin (12),Sydney, Australia (HPLC) nasturtium aquaticum violaxanthin (3),
zeaxanthin (7), lutein(26)
a OCC, open-column chromatography; HPLC, high-performance liquid chromatography.bOnly carotenoids at ≥1 µg/g are included. Unless otherwise stated, the carotenoids are in the trans form.
Nature of Carotenoids in Foods 7
Table 3. Major provitamin A and nonprovitamin A carotenoids of fruits and fruit vegetablesReference, origin of Common English/ Variety or Concentration, µg/g edible portion, rawbsample, and Portuguese name, edible cultivar andchromatographic portion analyzed, and number of Provitamin A Nonprovitamin Atechniquea scientific name sample lots carotenoids carotenoids
analyzedKhachik et al. (1989) Apricot (pulp) Blenum n=1 β-Carotene (64)Maryland, U.S.A. (HPLC) Prunus armeniaca L.
Godoy and Buriti (pulp) Mauritia Undefined n=5 13-cis-β-Carotene ζ-Carotene (4.6±0.5),Rodriguez-Amaya vinifera Mart (1.5±1.4), α-carotene zeaxanthin (20±4)(1995a) (80±9), 13-cis-β-Piauí, Brazil (OCC) carotene (3.8±2.9),
β-carotene (360±32),β-zeacarotene (5.4±1.5),γ-carotene (37±4)
Rodriguez-Amaya and Cajá (pulp + peel) Undefined n=5 β-Carotene (1.6±0.2), ZeinoxanthinKimura (1989) Spondias lutea β-cryptoxanthin (16±2), (4.3±0.6)Pernambuco, Brazil cryptoflavin (1.8±0.7)
Rodriguez-Amaya et al. Fruit of the tree tomato Undefined n=3 β-Carotene (7.9±3.6), Lutein (1.7±1.1)(1983) São Paulo, Brazil (pulp) Cyphomandra β-cryptoxanthin (14±4)(OCC) betacea
Rouseff et al. (1992) Grapefruit (pulp) Ruby red n=6 β-Carotene (4.2±1.4) Lycopene (2.2±0.9),Florida, U.S.A. (HPLC) Citrus paradisi Macf. phytoene (2.5±0.5),
phytofluene (1.8±0.5)Flame n=3 β-Carotene (8.6±1.6) Lycopene (7.9±2.0),
phytoene (11±1),phytofluene (6.0±0.6)
Ray ruby n=3 β-Carotene (7.0±1.7) Lycopene (21±9),phytoene (5.0±0.4),phytofluene (2.5±0.1)
Star Ruby n=3 β-Carotene (9.6±1.6) Lycopene (33±3),phytoene (51±4),phytofluene (17±4)
Padula and Guava (whole fruit) cv. IAC-4 n=4 β-Carotene (3.7±0.7) ZeinoxanthinRodriguez-Amaya (1986) Psidium guajava L. (1.0±0.6), lycopeneSão Paulo, Brazil (OCC) (53±6), trihydroxy-5,8-
epoxy-β-carotene(4.0±0.3)
Pernambuco, Brazil (OCC) Undefined n=3 β-Carotene (12±5) Zeinoxanthin(1.9±0.7), lycopene(53±14), trihydroxy-5,8-epoxy-β-carotene(2.1±1.9)
Godoy and Loquat (pulp) Eriobotrya Mizuho n=6 β-Carotene (7.8±0.3), NeurosporeneRodriguez-Amaya (1995b) japonica Lindl. β-cryptoxanthin (1.1±0.3), violaxanthinSão Paulo, Brazil (OCC) (4.8±0.1) (1.6±0.1)
Mercadante et al. (1998) Mango (pulp) Mangifera Keitt n=3 β-Carotene (15±2) Luteoxanthin isomersBahia, Brazil (HPLC) indica L. (3.8±0.6), violaxanthin
(21±3), 9-cis-violaxanthin (10±0),13-cis-violaxanthin(1.4±0.1), neoxanthin(2.1±1.3),
8 A Guide to Carotenoid Analysis in Foods
Table 3. Major provitamin A and nonprovitamin A carotenoids of fruits and fruit vegetables (continued)Reference, origin of Common English/ Variety or Concentration, µg/g edible portion, rawbsample, and Portuguese name, edible cultivar andchromatographic portion analyzed, and number of Provitamin A Nonprovitamin Atechniquea scientific name sample lots carotenoids carotenoids
analyzedKimura et al. (1991) Papaya (pulp) Carica Common, orange β-Carotene (1.2±0.9),São Paulo, Brazil (OCC) papaya n=5 β-cryptoxanthin (8.1±1.7),
β-cryptoxanthin-5,6-epoxide (2.0±1.1)
Bahia, Brazil (OCC) Solo n=5 β-Carotene (2.5±1.0), ζ-carotene (1.4±0.8),β-cryptoxanthin lycopene (21±16)(9.1±2.4)
São Paulo, Brazil (OCC) Formosa n=5 β-Carotene (1.4±0.5), ζ-carotene (1.7±0.6),β-cryptoxanthin antheraxanthin(5.3±1.1), β-crypto- (1.8±0.1), lycopenexanthin-5,6-epoxide (19±4)(3.8±1.3)
Bahia, Brazil (OCC) Formosa n=5 β-Carotene (6.1±1.4), ζ-carotene (1.5±0.3),β-cryptoxanthin antheraxanthin(8.6±2.2), β-crypto- (3.3±0.4), lycopenexanthin-5,6-epoxide (26±3)(1.8±0.8)
Bahia, Brazil (OCC) Tailandia n=5 β-Carotene (2.3±0.7), ζ-carotene (2.0±0.4),β-cryptoxanthin antheraxanthin(9.7±1.8), β-crypto- (4.0±2.9), lycopenexanthin-5,6-epoxide (40±6)(2.1±0.3)
Hart and Scott (1995) Pepper, orange Undefined n=4c α-Carotene (6.4), Lutein (25), zeaxanthinNorwich, UK (HPLC) Capsicum annuum L. β-carotene (8.9), cis-β- (85)
carotene (2.4), β-cryptoxanthin (7.8)
Cavalcante and Pitanga (pulp + peel) Undefined n=18 β-Carotene (9.5±2.1), Phytofluene (13±2),Rodriguez-Amaya (1992) Eugenia uniflora β-cryptoxanthin (47±2), ζ-carotene (4.7±1.6),Pernambuco, Brazil (OCC) γ-carotene (53±4) unidentified (3.4±0.4),
lycopene (73±1),rubixanthin (23±2)
Arima and Squash and pumpkin Menina verde β-Carotene (0.8–2.5) Lutein (0.7–7.4)Rodriguez-Amaya (pulp) Cucurbita (immature) n=5(1988, 1990) São Paulo, moschataBrazil (OCC)
Menina verde α-Carotene (8.3–42), cis-ζ-Carotene (0.9–n=5 β-carotene (14–79), 20), α-zeacarotene
α-cryptoxanthin (tr–2.3) (nd–13), lutein (tr–6.4), cis-lutein (0.2–3.1)
Bahia, Brazil (OCC) Baianinha n=3 α-Carotene (17–82), cis-ζ-Carotene (4.9-β-carotene (125–294), 30), zeinoxanthin (tr-cis-β-carotene (4.9–30), 6.3), lutein (4.8-14)α-cryptoxanthin (2.2–2.8)
São Paulo, Brazil (OCC) Cucurbita maxima Exposição n=5 β-carotene (3.1–28), Lutein (7.2–25), cis-α-cryptoxanthin lutein (ND–9.7),(ND-3.5) zeaxanthin (ND–9.7),
taraxanthin (ND–3.6),violaxanthin (ND–26),neoxanthin (ND–4.2)
Nature of Carotenoids in Foods 9
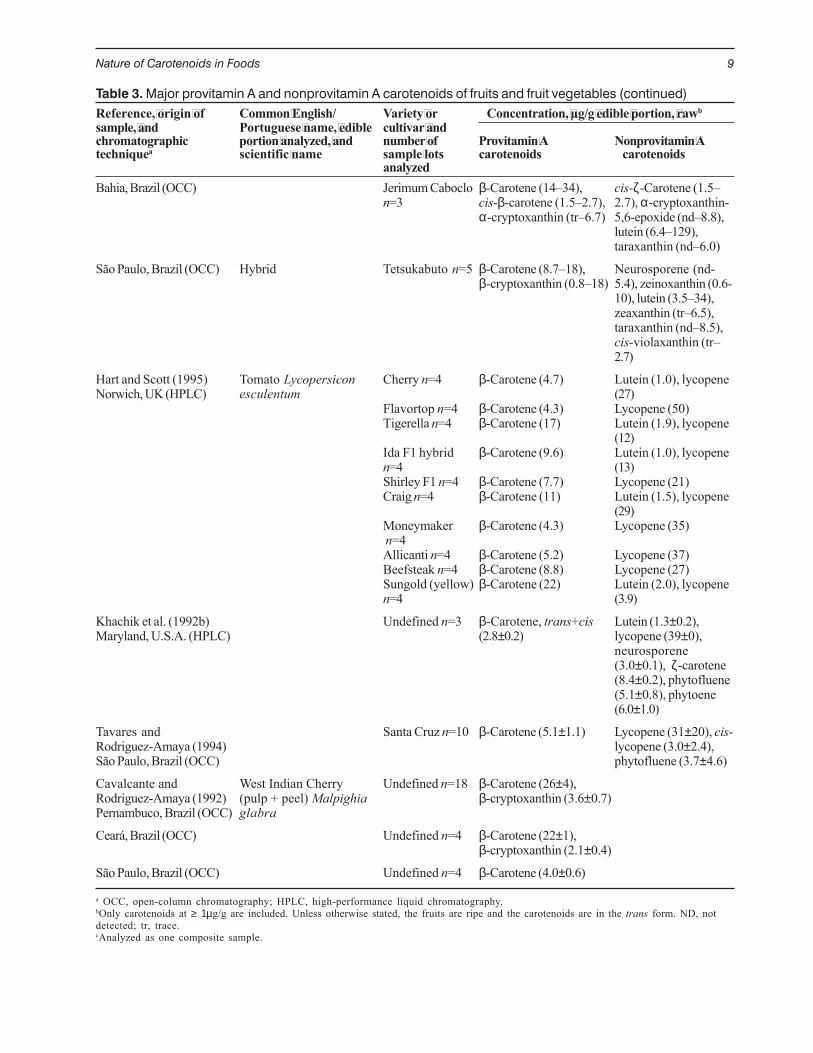
Table 3. Major provitamin A and nonprovitamin A carotenoids of fruits and fruit vegetables (continued)Reference, origin of Common English/ Variety or Concentration, µg/g edible portion, rawbsample, and Portuguese name, edible cultivar andchromatographic portion analyzed, and number of Provitamin A Nonprovitamin Atechniquea scientific name sample lots carotenoids carotenoids
analyzedBahia, Brazil (OCC) Jerimum Caboclo β-Carotene (14–34), cis-ζ-Carotene (1.5–
n=3 cis-β-carotene (1.5–2.7), 2.7), α-cryptoxanthin-α-cryptoxanthin (tr–6.7) 5,6-epoxide (nd–8.8),
lutein (6.4–129),taraxanthin (nd–6.0)
São Paulo, Brazil (OCC) Hybrid Tetsukabuto n=5 β-Carotene (8.7–18), Neurosporene (nd-β-cryptoxanthin (0.8–18) 5.4), zeinoxanthin (0.6-
10), lutein (3.5–34),zeaxanthin (tr–6.5),taraxanthin (nd–8.5),cis-violaxanthin (tr–2.7)
Hart and Scott (1995) Tomato Lycopersicon Cherry n=4 β-Carotene (4.7) Lutein (1.0), lycopeneNorwich, UK (HPLC) esculentum (27)
Flavortop n=4 β-Carotene (4.3) Lycopene (50)Tigerella n=4 β-Carotene (17) Lutein (1.9), lycopene
(12)Ida F1 hybrid β-Carotene (9.6) Lutein (1.0), lycopenen=4 (13)Shirley F1 n=4 β-Carotene (7.7) Lycopene (21)Craig n=4 β-Carotene (11) Lutein (1.5), lycopene
(29)Moneymaker β-Carotene (4.3) Lycopene (35) n=4Allicanti n=4 β-Carotene (5.2) Lycopene (37)Beefsteak n=4 β-Carotene (8.8) Lycopene (27)Sungold (yellow) β-Carotene (22) Lutein (2.0), lycopenen=4 (3.9)
Khachik et al. (1992b) Undefined n=3 β-Carotene, trans+cis Lutein (1.3±0.2),Maryland, U.S.A. (HPLC) (2.8±0.2) lycopene (39±0),
neurosporene(3.0±0.1), ζ-carotene(8.4±0.2), phytofluene(5.1±0.8), phytoene(6.0±1.0)
Tavares and Santa Cruz n=10 β-Carotene (5.1±1.1) Lycopene (31±20), cis-Rodriguez-Amaya (1994) lycopene (3.0±2.4),São Paulo, Brazil (OCC) phytofluene (3.7±4.6)
Cavalcante and West Indian Cherry Undefined n=18 β-Carotene (26±4),Rodriguez-Amaya (1992) (pulp + peel) Malpighia β-cryptoxanthin (3.6±0.7)Pernambuco, Brazil (OCC) glabra
Ceará, Brazil (OCC) Undefined n=4 β-Carotene (22±1),β-cryptoxanthin (2.1±0.4)
São Paulo, Brazil (OCC) Undefined n=4 β-Carotene (4.0±0.6)
a OCC, open-column chromatography; HPLC, high-performance liquid chromatography.bOnly carotenoids at ≥ 1µg/g are included. Unless otherwise stated, the fruits are ripe and the carotenoids are in the trans form. ND, notdetected; tr, trace.cAnalyzed as one composite sample.
10 A Guide to Carotenoid Analysis in Foods
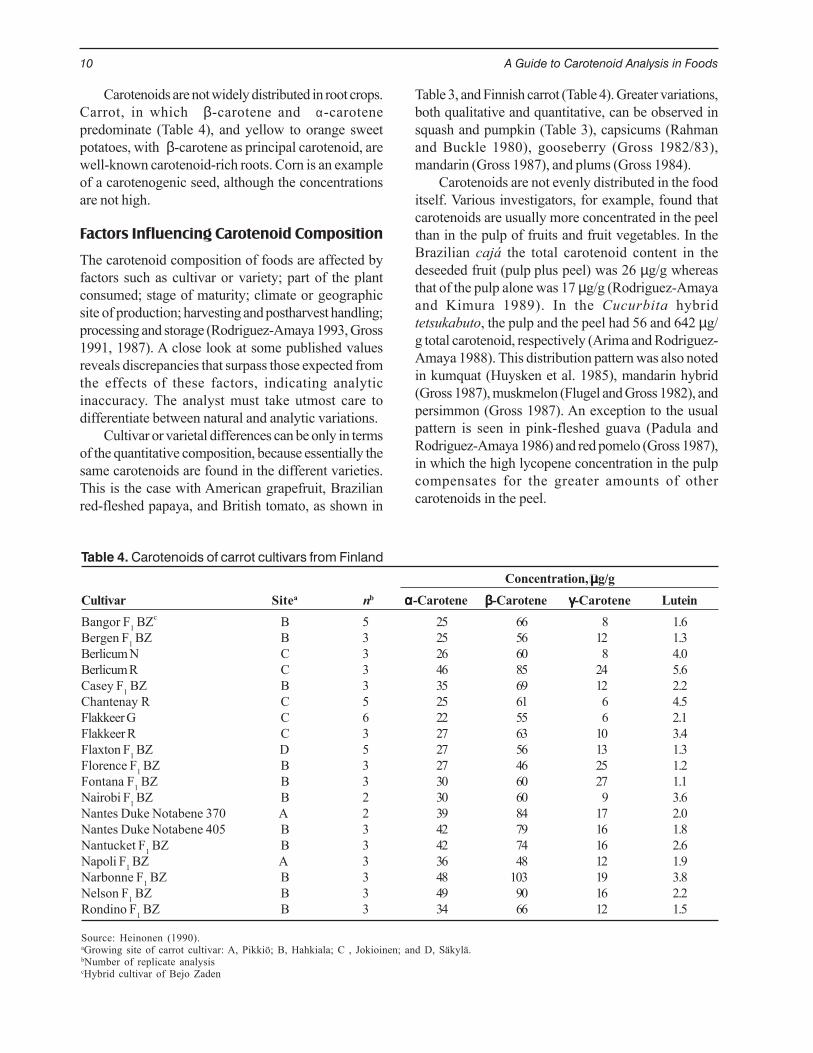
Carotenoids are not widely distributed in root crops.Carrot, in which β-carotene and α-carotenepredominate (Table 4), and yellow to orange sweetpotatoes, with β-carotene as principal carotenoid, arewell-known carotenoid-rich roots. Corn is an exampleof a carotenogenic seed, although the concentrationsare not high.
Factors Influencing Carotenoid Composition
The carotenoid composition of foods are affected byfactors such as cultivar or variety; part of the plantconsumed; stage of maturity; climate or geographicsite of production; harvesting and postharvest handling;processing and storage (Rodriguez-Amaya 1993, Gross1991, 1987). A close look at some published valuesreveals discrepancies that surpass those expected fromthe effects of these factors, indicating analyticinaccuracy. The analyst must take utmost care todifferentiate between natural and analytic variations.
Cultivar or varietal differences can be only in termsof the quantitative composition, because essentially thesame carotenoids are found in the different varieties.This is the case with American grapefruit, Brazilianred-fleshed papaya, and British tomato, as shown in
Table 3, and Finnish carrot (Table 4). Greater variations,both qualitative and quantitative, can be observed insquash and pumpkin (Table 3), capsicums (Rahmanand Buckle 1980), gooseberry (Gross 1982/83),mandarin (Gross 1987), and plums (Gross 1984).
Carotenoids are not evenly distributed in the fooditself. Various investigators, for example, found thatcarotenoids are usually more concentrated in the peelthan in the pulp of fruits and fruit vegetables. In theBrazilian cajá the total carotenoid content in thedeseeded fruit (pulp plus peel) was 26 µg/g whereasthat of the pulp alone was 17 µg/g (Rodriguez-Amayaand Kimura 1989). In the Cucurbita hybridtetsukabuto, the pulp and the peel had 56 and 642 µg/g total carotenoid, respectively (Arima and Rodriguez-Amaya 1988). This distribution pattern was also notedin kumquat (Huysken et al. 1985), mandarin hybrid(Gross 1987), muskmelon (Flugel and Gross 1982), andpersimmon (Gross 1987). An exception to the usualpattern is seen in pink-fleshed guava (Padula andRodriguez-Amaya 1986) and red pomelo (Gross 1987),in which the high lycopene concentration in the pulpcompensates for the greater amounts of othercarotenoids in the peel.
Table 4. Carotenoids of carrot cultivars from Finland
Concentration, µµµµµg/gCultivar Sitea nb ααααα-Carotene βββββ-Carotene γγγγγ-Carotene LuteinBangor F1 BZc B 5 25 66 8 1.6Bergen F1 BZ B 3 25 56 12 1.3Berlicum N C 3 26 60 8 4.0Berlicum R C 3 46 85 24 5.6Casey F1 BZ B 3 35 69 12 2.2Chantenay R C 5 25 61 6 4.5Flakkeer G C 6 22 55 6 2.1Flakkeer R C 3 27 63 10 3.4Flaxton F1 BZ D 5 27 56 13 1.3Florence F1 BZ B 3 27 46 25 1.2Fontana F1 BZ B 3 30 60 27 1.1Nairobi F1 BZ B 2 30 60 9 3.6Nantes Duke Notabene 370 A 2 39 84 17 2.0Nantes Duke Notabene 405 B 3 42 79 16 1.8Nantucket F1 BZ B 3 42 74 16 2.6Napoli F1 BZ A 3 36 48 12 1.9Narbonne F1 BZ B 3 48 103 19 3.8Nelson F1 BZ B 3 49 90 16 2.2Rondino F1 BZ B 3 34 66 12 1.5
Source: Heinonen (1990).aGrowing site of carrot cultivar: A, Pikkiö; B, Hahkiala; C , Jokioinen; and D, Säkylä.bNumber of replicate analysiscHybrid cultivar of Bejo Zaden
Nature of Carotenoids in Foods 11
In carotenogenic fruits and fruit vegetables, ripeningis usually accompanied by enhanced carotenogenesisas chlorophylls decompose and the chloroplasts aretransformed into chromoplasts. The simple chloroplastcarotenoid pattern gives way to a complex composition,the carotenoids increasing dramatically in number andquantity. This is exemplified by Cucurbita meninaverde in Table 3.
Increased carotenogenesis with maturation orripening was also documented in Momordicacharantia (Rodriguez-Amaya et al. 1976a), yellowLauffener gooseberry (Gross 1982/1983), red pepper(Rahman and Buckle 1980), badami mango (John etal. 1970), and leaves (Hulshof et al. 1997, Ramos andRodriguez-Amaya 1987). The one factor that decisivelyaffects the carotenoid content is the maturity of theplant food when harvested and offered for consumption.Squashes and pumpkins showed substantial between-lot variations of the same cultivars so that the rangesrather than the means are presented in Table 3. Thisvariability was attributed to the wide differences inmaturity stage, because these fruit vegetables can beharvested over a long period and have a long shelf lifeduring which carotenoid biosynthesis continues.
In fruits in which the color at the ripe stage is dueto anthocyanins, such as yellow cherry (Gross 1985),red currant (Gross 1982/1983), strawberry (Gross1982a), and olive fruit (Minguez-Mosquera and Garrido-Fernandez 1989), and in fruits that retain their greencolor when ripe, such as kiwi (Gross 1982b), the
carotenoid concentrations decrease with ripening. Thesame trend is seen with some fruits that undergoyellowing simply by unmasking the carotenoids throughchlorophyll degradation (Gross 1987).
Carotenogenesis may continue even after harvestas long as the fruit or vegetable remains intact, as shownin tomato (Raymundo et al. 1967) and African mango(Aina 1990). Carotenoid biosynthesis in the flesh ofripening Indian Alphonso mango was observed to bemaximal at tropical ambient temperature (28–32 °C)(Thomas and Janave 1975). Storage at 7–20 °C for16–43 days caused a substantial decrease in totalcarotenoid content even when the fruits weresubsequently ripened at optimal conditions.
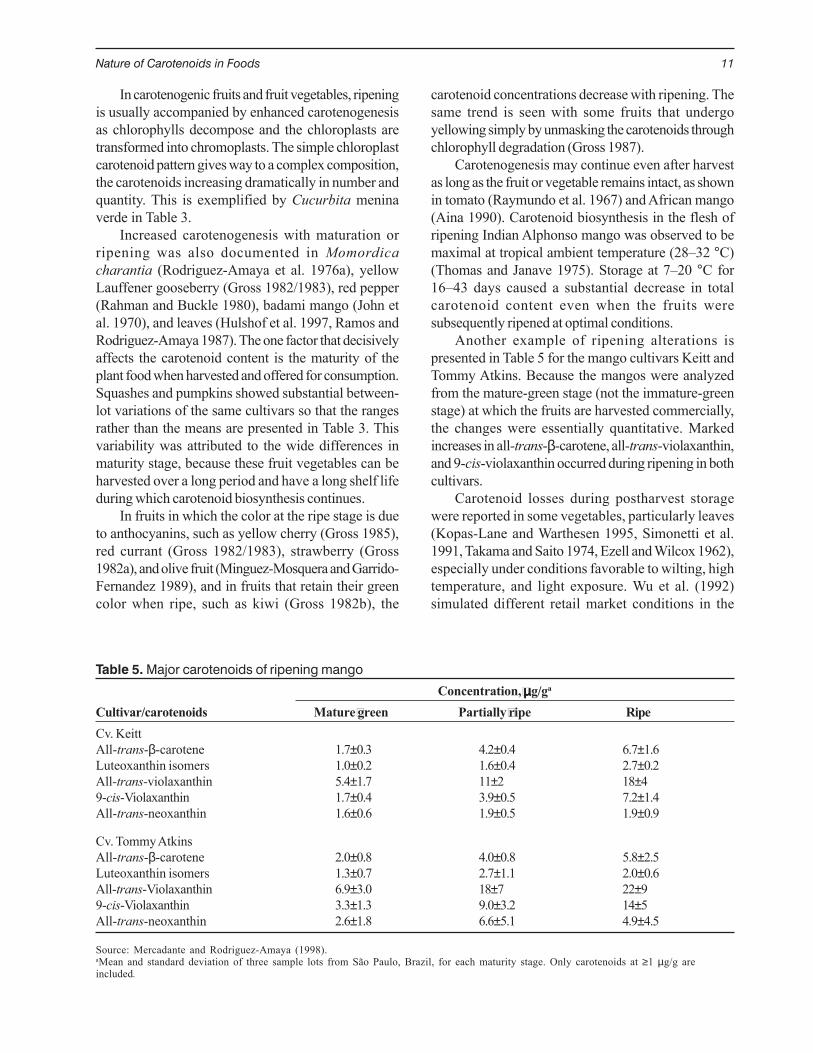
Another example of ripening alterations ispresented in Table 5 for the mango cultivars Keitt andTommy Atkins. Because the mangos were analyzedfrom the mature-green stage (not the immature-greenstage) at which the fruits are harvested commercially,the changes were essentially quantitative. Markedincreases in all-trans-β-carotene, all-trans-violaxanthin,and 9-cis-violaxanthin occurred during ripening in bothcultivars.
Carotenoid losses during postharvest storagewere reported in some vegetables, particularly leaves(Kopas-Lane and Warthesen 1995, Simonetti et al.1991, Takama and Saito 1974, Ezell and Wilcox 1962),especially under conditions favorable to wilting, hightemperature, and light exposure. Wu et al. (1992)simulated different retail market conditions in the
Table 5. Major carotenoids of ripening mango
Concentration, µµµµµg/ga
Cultivar/carotenoids Mature green Partially ripe RipeCv. KeittAll-trans-β-carotene 1.7±0.3 4.2±0.4 6.7±1.6Luteoxanthin isomers 1.0±0.2 1.6±0.4 2.7±0.2All-trans-violaxanthin 5.4±1.7 11±2 18±4 9-cis-Violaxanthin 1.7±0.4 3.9±0.5 7.2±1.4All-trans-neoxanthin 1.6±0.6 1.9±0.5 1.9±0.9
Cv. Tommy AtkinsAll-trans-β-carotene 2.0±0.8 4.0±0.8 5.8±2.5Luteoxanthin isomers 1.3±0.7 2.7±1.1 2.0±0.6All-trans-Violaxanthin 6.9±3.0 18±7 22±9 9-cis-Violaxanthin 3.3±1.3 9.0±3.2 14±5 All-trans-neoxanthin 2.6±1.8 6.6±5.1 4.9±4.5
Source: Mercadante and Rodriguez-Amaya (1998).aMean and standard deviation of three sample lots from São Paulo, Brazil, for each maturity stage. Only carotenoids at ≥1 µg/g areincluded.
12 A Guide to Carotenoid Analysis in Foods
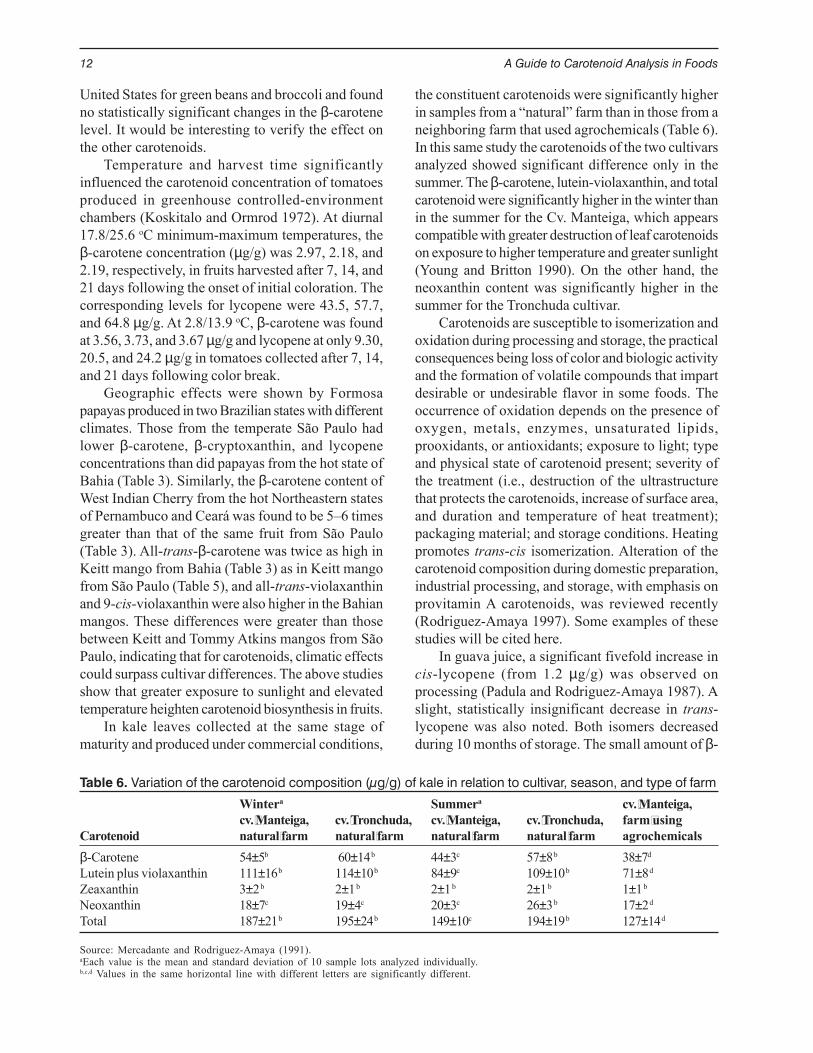
Table 6. Variation of the carotenoid composition (µg/g) of kale in relation to cultivar, season, and type of farm
Wintera Summera cv. Manteiga,cv. Manteiga, cv. Tronchuda, cv. Manteiga, cv. Tronchuda, farm using
Carotenoid natural farm natural farm natural farm natural farm agrochemicalsβ-Carotene 54±5b 60±14 b 44±3c 57±8 b 38±7d
Lutein plus violaxanthin 111±16 b 114±10 b 84±9c 109±10 b 71±8 d
Zeaxanthin 3±2 b 2±1 b 2±1 b 2±1 b 1±1 b
Neoxanthin 18±7c 19±4c 20±3c 26±3 b 17±2 d
Total 187±21 b 195±24 b 149±10c 194±19 b 127±14 d
Source: Mercadante and Rodriguez-Amaya (1991).aEach value is the mean and standard deviation of 10 sample lots analyzed individually.b,c,d Values in the same horizontal line with different letters are significantly different.
United States for green beans and broccoli and foundno statistically significant changes in the β-carotenelevel. It would be interesting to verify the effect onthe other carotenoids.
Temperature and harvest time significantlyinfluenced the carotenoid concentration of tomatoesproduced in greenhouse controlled-environmentchambers (Koskitalo and Ormrod 1972). At diurnal17.8/25.6 oC minimum-maximum temperatures, theβ-carotene concentration (µg/g) was 2.97, 2.18, and2.19, respectively, in fruits harvested after 7, 14, and21 days following the onset of initial coloration. Thecorresponding levels for lycopene were 43.5, 57.7,and 64.8 µg/g. At 2.8/13.9 oC, β-carotene was foundat 3.56, 3.73, and 3.67 µg/g and lycopene at only 9.30,20.5, and 24.2 µg/g in tomatoes collected after 7, 14,and 21 days following color break.
Geographic effects were shown by Formosapapayas produced in two Brazilian states with differentclimates. Those from the temperate São Paulo hadlower β-carotene, β-cryptoxanthin, and lycopeneconcentrations than did papayas from the hot state ofBahia (Table 3). Similarly, the β-carotene content ofWest Indian Cherry from the hot Northeastern statesof Pernambuco and Ceará was found to be 5–6 timesgreater than that of the same fruit from São Paulo(Table 3). All-trans-β-carotene was twice as high inKeitt mango from Bahia (Table 3) as in Keitt mangofrom São Paulo (Table 5), and all-trans-violaxanthinand 9-cis-violaxanthin were also higher in the Bahianmangos. These differences were greater than thosebetween Keitt and Tommy Atkins mangos from SãoPaulo, indicating that for carotenoids, climatic effectscould surpass cultivar differences. The above studiesshow that greater exposure to sunlight and elevatedtemperature heighten carotenoid biosynthesis in fruits.
In kale leaves collected at the same stage ofmaturity and produced under commercial conditions,
the constituent carotenoids were significantly higherin samples from a “natural” farm than in those from aneighboring farm that used agrochemicals (Table 6).In this same study the carotenoids of the two cultivarsanalyzed showed significant difference only in thesummer. The β-carotene, lutein-violaxanthin, and totalcarotenoid were significantly higher in the winter thanin the summer for the Cv. Manteiga, which appearscompatible with greater destruction of leaf carotenoidson exposure to higher temperature and greater sunlight(Young and Britton 1990). On the other hand, theneoxanthin content was significantly higher in thesummer for the Tronchuda cultivar.
Carotenoids are susceptible to isomerization andoxidation during processing and storage, the practicalconsequences being loss of color and biologic activityand the formation of volatile compounds that impartdesirable or undesirable flavor in some foods. Theoccurrence of oxidation depends on the presence ofoxygen, metals, enzymes, unsaturated lipids,prooxidants, or antioxidants; exposure to light; typeand physical state of carotenoid present; severity ofthe treatment (i.e., destruction of the ultrastructurethat protects the carotenoids, increase of surface area,and duration and temperature of heat treatment);packaging material; and storage conditions. Heatingpromotes trans-cis isomerization. Alteration of thecarotenoid composition during domestic preparation,industrial processing, and storage, with emphasis onprovitamin A carotenoids, was reviewed recently(Rodriguez-Amaya 1997). Some examples of thesestudies will be cited here.
In guava juice, a significant fivefold increase incis-lycopene (from 1.2 µg/g) was observed onprocessing (Padula and Rodriguez-Amaya 1987). Aslight, statistically insignificant decrease in trans-lycopene was also noted. Both isomers decreasedduring 10 months of storage. The small amount of β-
Nature of Carotenoids in Foods 13
carotene (2.7 µg/g) was retained on processing andstorage.
The carotenoids were essentially retained duringthe processing of mango slices (Godoy and Rodriguez-Amaya 1987). The only significant change was theincrease in luteoxanthin, compatible with theconversion of 5,6- to 5,8-epoxide. More evidentchanges occurred on processing mango puree. Theprincipal pigment β-carotene decreased 13%;auroxanthin appeared whereas violaxanthin andluteoxanthin decreased. During storage of mangoslices in lacquered or plain tin-plate cans, noappreciable loss of β-carotene was noted for 10months. Between the 10th and 14th months a 50%reduction occurred. Violaxanthin tended to decreaseand auroxanthin to increase during storage. β-Caroteneshowed a greater susceptibility to degrade in bottledmango puree (18% loss after 10 months) than in thecanned product. As with the mango slices, however,both bottled and canned puree suffered a 50% loss ofβ-carotene after the 14th month. Violaxanthin andluteoxanthin tended to decrease whereas auroxanthinmaintained a comparatively high level throughoutstorage. In commercially processed mango juice,processing effects appeared substantial. Violaxanthin,the principal carotenoid of the fresh mango, was notdetected; auroxanthin appeared in an appreciable level;and β-carotene became the principal carotenoid(Mercadante and Rodriguez-Amaya, 1998).
Both lycopene (the major pigment) and β-caroteneshowed no significant change during the processing
of papaya puree (Godoy and Rodriguez-Amaya1991). cis-Lycopene increased sevenfold, β-cryptoxanthin decreased 34%, and cryptoflavinappeared. During 14 months of storage, β-carotene,lycopene and cis-lycopene remained practicallyconstant. β-Cryptoxanthin did not change significantlyduring the first 10 months but decreased 27% after14 months. Auroxanthin and flavoxanthin appearedduring storage.
In olives, only β-carotene and lutein resisted thefermentation and brine storage (Minguez-Mosqueraet al. 1989). Phytofluene and ζ-carotene disappeared.Violaxanthin, luteoxanthin, and neoxanthin gave riseto auroxanthin and neochrome. The total pigmentcontent did not change.
In carrot juice, canning (121 oC for 30 minutes)resulted in the greatest loss of carotenoids, followedby high-temperature short-time heating at 120 oC for30 seconds, 110 oC for 30 seconds, acidification plus105 oC heating for 25 seconds, and acidification (Chenet al. 1995). Heating increased cis isomers, 13-cis-β-carotene being formed in largest amount, followed by13-cis-lutein and 15-cis-α-carotene.
Canning increased the percentage of total cisisomers of provitamin A carotenoids in several fruitsand vegetables (Lessin et al. 1997). Canning of sweetpotatoes caused the largest increase (39%), followedby processing of carrots (33%), tomato juice (20%),collards (19%), tomatoes (18%), spinach (13%), andpeaches (10%).
14 A Guide to Carotenoid Analysis in Foods
SOME PHYSICOCHEMICAL PROPERTIES OF CAROTENOIDS
A good understanding of some of the physical andchemical properties of carotenoids allows analysts todetermine carotenoids with greater ease and reliability.
Solubility
With very few exceptions, carotenoids are lipophilic.They are insoluble in water and soluble in organicsolvents, such as acetone, alcohol, ethyl ether, chlo-roform, and ethyl acetate. Carotenes are readilysoluble in petroleum ether, hexane, and toluene; xan-thophylls dissolve better in methanol and ethanol.Crystalline carotenoids may be difficult to dissolve inthe above solvents but do dissolve in benzene anddichloromethane (Schiedt and Liaaen-Jensen 1995).Solubility of both ß-carotene and the xanthophyll luteinin tetrahydrofuran was shown to be excellent (Craftand Soares 1992).
Light Absorption
The conjugated double-bond system constitutes thelight-absorbing chromophore that gives carotenoidstheir attractive color and provides the visibleabsorption spectrum that serves as a basis for theiridentification and quantification. The color enablesanalysts to monitor the different steps of carotenoidanalysis. Loss or change of color at any time duringthe analysis gives an immediate indication ofdegradation or structural modification. The colorpermits visual monitoring of the separation ofcarotenoids in open-column chromatography, andmainly for this reason this classical technique is still aviable option for quantitative analysis of carotenoids.
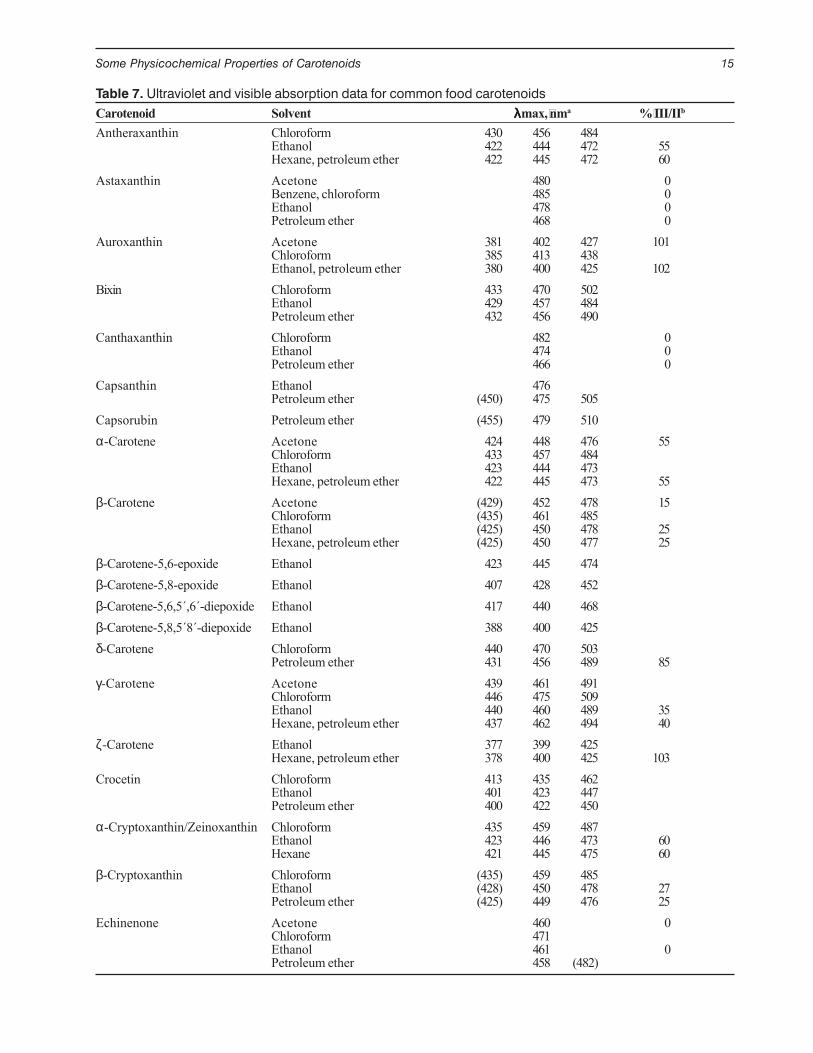
The ultraviolet and visible spectrum is the firstdiagnostic tool for the identification of carotenoids.The wavelength of maximum absorption (λmax) andthe shape of the spectrum (spectral fine structure)are characteristic of the chromophore. The struc-ture-spectrum relationship has been extensively dis-cussed. The λmax values of common carotenoids,
taken mainly from Britton’s (1995) compilation, areshown in Table 7 and will be discussed in relation tothe structures by using the absorption in petroleumether.
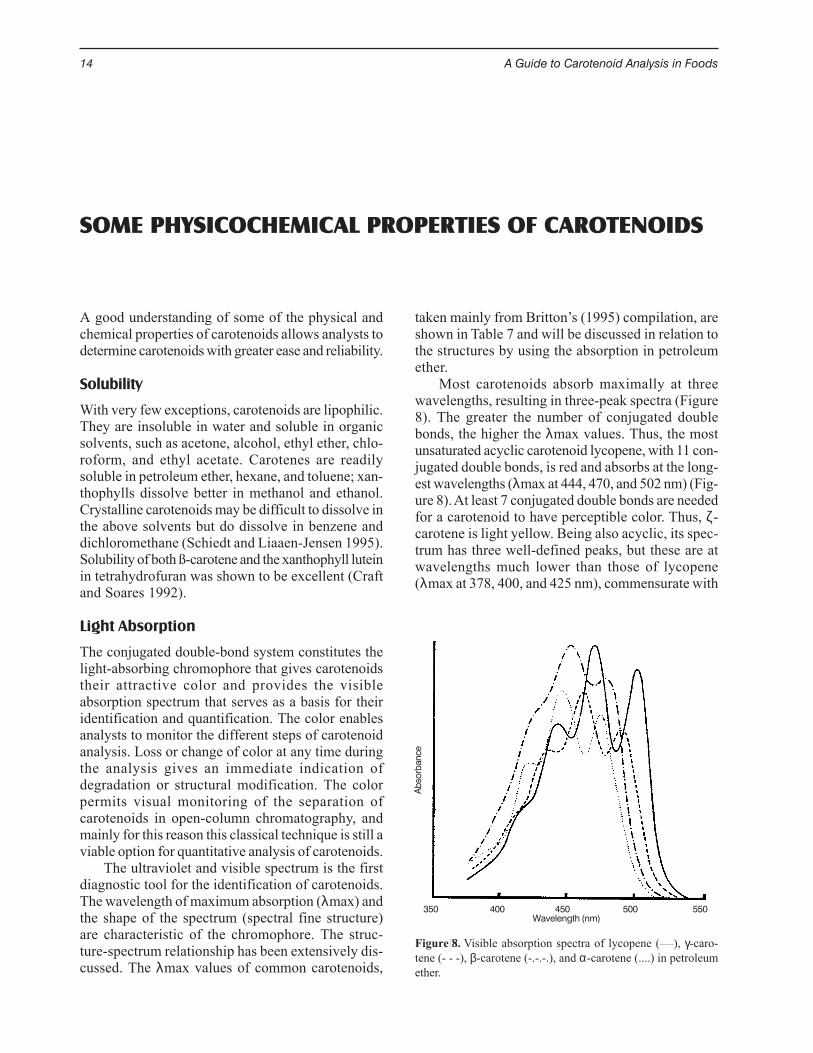
Most carotenoids absorb maximally at threewavelengths, resulting in three-peak spectra (Figure8). The greater the number of conjugated doublebonds, the higher the λmax values. Thus, the mostunsaturated acyclic carotenoid lycopene, with 11 con-jugated double bonds, is red and absorbs at the long-est wavelengths (λmax at 444, 470, and 502 nm) (Fig-ure 8). At least 7 conjugated double bonds are neededfor a carotenoid to have perceptible color. Thus, ζ-carotene is light yellow. Being also acyclic, its spec-trum has three well-defined peaks, but these are atwavelengths much lower than those of lycopene(λmax at 378, 400, and 425 nm), commensurate with
Figure 8. Visible absorption spectra of lycopene (____), γ-caro-tene (- - -), β-carotene (-.-.-.), and α-carotene (....) in petroleumether.
350 400 450 500 550Wavelength (nm)
Abs
orba
nce
Some Physicochemical Properties of Carotenoids 15
Table 7. Ultraviolet and visible absorption data for common food carotenoidsCarotenoid Solvent λλλλλmax, nma % III/IIb
Antheraxanthin Chloroform 430 456 484Ethanol 422 444 472 55Hexane, petroleum ether 422 445 472 60
Astaxanthin Acetone 480 0Benzene, chloroform 485 0Ethanol 478 0Petroleum ether 468 0
Auroxanthin Acetone 381 402 427 101Chloroform 385 413 438Ethanol, petroleum ether 380 400 425 102
Bixin Chloroform 433 470 502Ethanol 429 457 484Petroleum ether 432 456 490
Canthaxanthin Chloroform 482 0Ethanol 474 0Petroleum ether 466 0
Capsanthin Ethanol 476Petroleum ether (450) 475 505
Capsorubin Petroleum ether (455) 479 510α-Carotene Acetone 424 448 476 55
Chloroform 433 457 484Ethanol 423 444 473Hexane, petroleum ether 422 445 473 55
β-Carotene Acetone (429) 452 478 15Chloroform (435) 461 485Ethanol (425) 450 478 25Hexane, petroleum ether (425) 450 477 25
β-Carotene-5,6-epoxide Ethanol 423 445 474β-Carotene-5,8-epoxide Ethanol 407 428 452β-Carotene-5,6,5´,6´-diepoxide Ethanol 417 440 468β-Carotene-5,8,5´8´-diepoxide Ethanol 388 400 425δ-Carotene Chloroform 440 470 503
Petroleum ether 431 456 489 85γ-Carotene Acetone 439 461 491
Chloroform 446 475 509Ethanol 440 460 489 35Hexane, petroleum ether 437 462 494 40
ζ-Carotene Ethanol 377 399 425Hexane, petroleum ether 378 400 425 103
Crocetin Chloroform 413 435 462Ethanol 401 423 447Petroleum ether 400 422 450
α-Cryptoxanthin/Zeinoxanthin Chloroform 435 459 487Ethanol 423 446 473 60Hexane 421 445 475 60
β-Cryptoxanthin Chloroform (435) 459 485Ethanol (428) 450 478 27Petroleum ether (425) 449 476 25
Echinenone Acetone 460 0Chloroform 471Ethanol 461 0Petroleum ether 458 (482)
16 A Guide to Carotenoid Analysis in Foods
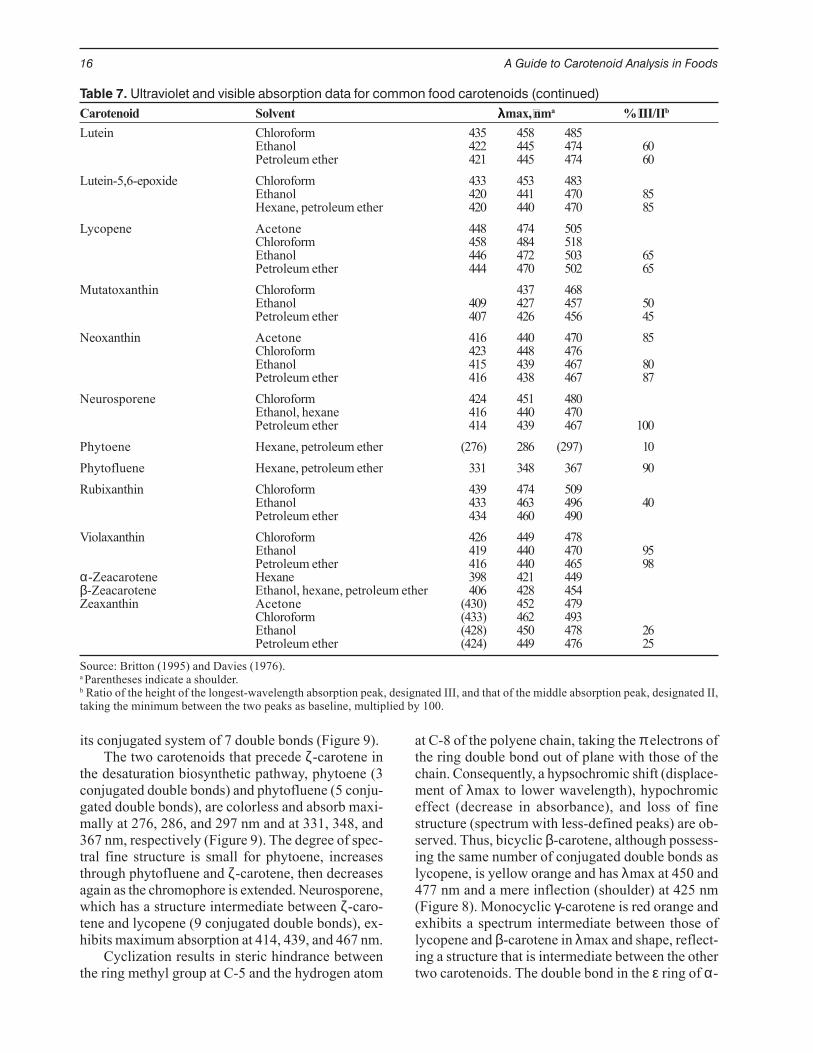
Table 7. Ultraviolet and visible absorption data for common food carotenoids (continued)Carotenoid Solvent λλλλλmax, nma % III/IIb
Lutein Chloroform 435 458 485Ethanol 422 445 474 60Petroleum ether 421 445 474 60
Lutein-5,6-epoxide Chloroform 433 453 483Ethanol 420 441 470 85Hexane, petroleum ether 420 440 470 85
Lycopene Acetone 448 474 505Chloroform 458 484 518Ethanol 446 472 503 65Petroleum ether 444 470 502 65
Mutatoxanthin Chloroform 437 468Ethanol 409 427 457 50Petroleum ether 407 426 456 45
Neoxanthin Acetone 416 440 470 85Chloroform 423 448 476Ethanol 415 439 467 80Petroleum ether 416 438 467 87
Neurosporene Chloroform 424 451 480Ethanol, hexane 416 440 470Petroleum ether 414 439 467 100
Phytoene Hexane, petroleum ether (276) 286 (297) 10Phytofluene Hexane, petroleum ether 331 348 367 90Rubixanthin Chloroform 439 474 509
Ethanol 433 463 496 40Petroleum ether 434 460 490
Violaxanthin Chloroform 426 449 478Ethanol 419 440 470 95Petroleum ether 416 440 465 98
α-Zeacarotene Hexane 398 421 449β-Zeacarotene Ethanol, hexane, petroleum ether 406 428 454Zeaxanthin Acetone (430) 452 479
Chloroform (433) 462 493Ethanol (428) 450 478 26Petroleum ether (424) 449 476 25
Source: Britton (1995) and Davies (1976).a Parentheses indicate a shoulder.b Ratio of the height of the longest-wavelength absorption peak, designated III, and that of the middle absorption peak, designated II,taking the minimum between the two peaks as baseline, multiplied by 100.
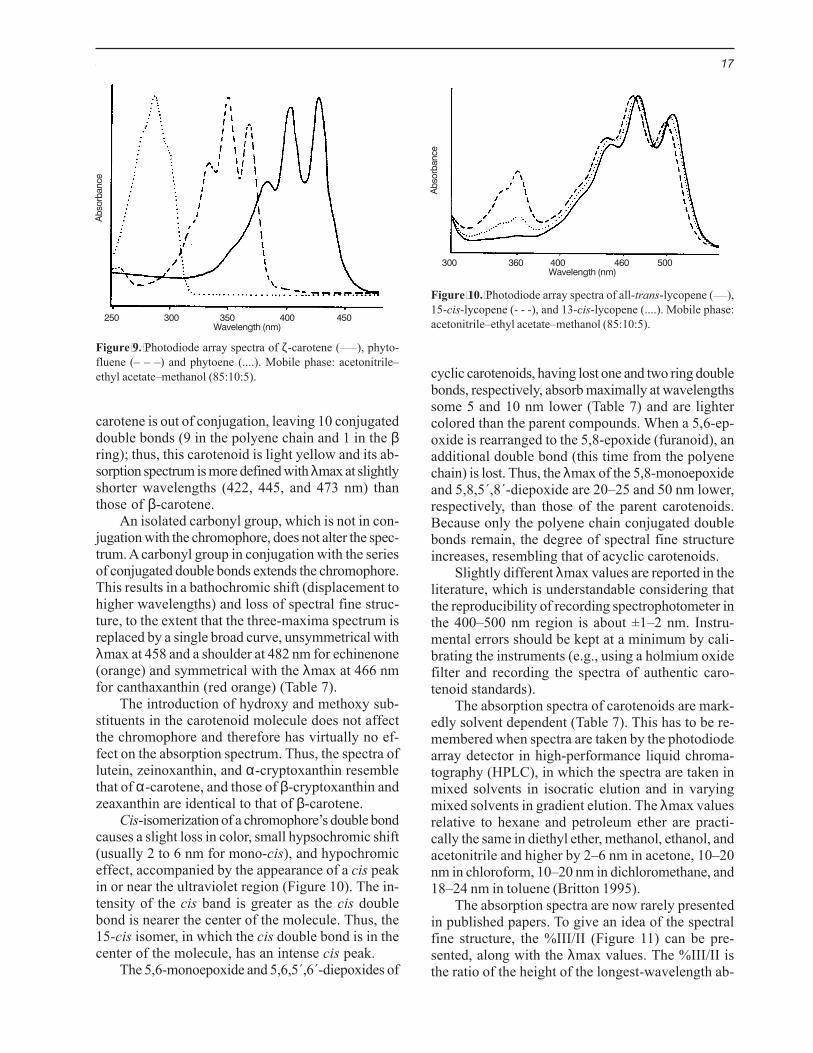
its conjugated system of 7 double bonds (Figure 9).The two carotenoids that precede ζ-carotene in
the desaturation biosynthetic pathway, phytoene (3conjugated double bonds) and phytofluene (5 conju-gated double bonds), are colorless and absorb maxi-mally at 276, 286, and 297 nm and at 331, 348, and367 nm, respectively (Figure 9). The degree of spec-tral fine structure is small for phytoene, increasesthrough phytofluene and ζ-carotene, then decreasesagain as the chromophore is extended. Neurosporene,which has a structure intermediate between ζ-caro-tene and lycopene (9 conjugated double bonds), ex-hibits maximum absorption at 414, 439, and 467 nm.
Cyclization results in steric hindrance betweenthe ring methyl group at C-5 and the hydrogen atom
at C-8 of the polyene chain, taking the π electrons ofthe ring double bond out of plane with those of thechain. Consequently, a hypsochromic shift (displace-ment of λmax to lower wavelength), hypochromiceffect (decrease in absorbance), and loss of finestructure (spectrum with less-defined peaks) are ob-served. Thus, bicyclic β-carotene, although possess-ing the same number of conjugated double bonds aslycopene, is yellow orange and has λmax at 450 and477 nm and a mere inflection (shoulder) at 425 nm(Figure 8). Monocyclic γ-carotene is red orange andexhibits a spectrum intermediate between those oflycopene and β-carotene in λmax and shape, reflect-ing a structure that is intermediate between the othertwo carotenoids. The double bond in the ε ring of α-
Some Physicochemical Properties of Carotenoids 17
carotene is out of conjugation, leaving 10 conjugateddouble bonds (9 in the polyene chain and 1 in the βring); thus, this carotenoid is light yellow and its ab-sorption spectrum is more defined with λmax at slightlyshorter wavelengths (422, 445, and 473 nm) thanthose of β-carotene.
An isolated carbonyl group, which is not in con-jugation with the chromophore, does not alter the spec-trum. A carbonyl group in conjugation with the seriesof conjugated double bonds extends the chromophore.This results in a bathochromic shift (displacement tohigher wavelengths) and loss of spectral fine struc-ture, to the extent that the three-maxima spectrum isreplaced by a single broad curve, unsymmetrical withλmax at 458 and a shoulder at 482 nm for echinenone(orange) and symmetrical with the λmax at 466 nmfor canthaxanthin (red orange) (Table 7).
The introduction of hydroxy and methoxy sub-stituents in the carotenoid molecule does not affectthe chromophore and therefore has virtually no ef-fect on the absorption spectrum. Thus, the spectra oflutein, zeinoxanthin, and α-cryptoxanthin resemblethat of α-carotene, and those of β-cryptoxanthin andzeaxanthin are identical to that of β-carotene.
Cis-isomerization of a chromophore’s double bondcauses a slight loss in color, small hypsochromic shift(usually 2 to 6 nm for mono-cis), and hypochromiceffect, accompanied by the appearance of a cis peakin or near the ultraviolet region (Figure 10). The in-tensity of the cis band is greater as the cis doublebond is nearer the center of the molecule. Thus, the15-cis isomer, in which the cis double bond is in thecenter of the molecule, has an intense cis peak.
The 5,6-monoepoxide and 5,6,5´,6´-diepoxides of
cyclic carotenoids, having lost one and two ring doublebonds, respectively, absorb maximally at wavelengthssome 5 and 10 nm lower (Table 7) and are lightercolored than the parent compounds. When a 5,6-ep-oxide is rearranged to the 5,8-epoxide (furanoid), anadditional double bond (this time from the polyenechain) is lost. Thus, the λmax of the 5,8-monoepoxideand 5,8,5´,8´-diepoxide are 20–25 and 50 nm lower,respectively, than those of the parent carotenoids.Because only the polyene chain conjugated doublebonds remain, the degree of spectral fine structureincreases, resembling that of acyclic carotenoids.
Slightly different λmax values are reported in theliterature, which is understandable considering thatthe reproducibility of recording spectrophotometer inthe 400–500 nm region is about ±1–2 nm. Instru-mental errors should be kept at a minimum by cali-brating the instruments (e.g., using a holmium oxidefilter and recording the spectra of authentic caro-tenoid standards).
The absorption spectra of carotenoids are mark-edly solvent dependent (Table 7). This has to be re-membered when spectra are taken by the photodiodearray detector in high-performance liquid chroma-tography (HPLC), in which the spectra are taken inmixed solvents in isocratic elution and in varyingmixed solvents in gradient elution. The λmax valuesrelative to hexane and petroleum ether are practi-cally the same in diethyl ether, methanol, ethanol, andacetonitrile and higher by 2–6 nm in acetone, 10–20nm in chloroform, 10–20 nm in dichloromethane, and18–24 nm in toluene (Britton 1995).
The absorption spectra are now rarely presentedin published papers. To give an idea of the spectralfine structure, the %III/II (Figure 11) can be pre-sented, along with the λmax values. The %III/II isthe ratio of the height of the longest-wavelength ab-
Figure 9. Photodiode array spectra of ζ-carotene (_____), phyto-fluene (– – –) and phytoene (....). Mobile phase: acetonitrile–ethyl acetate–methanol (85:10:5).
250 300 350 400 450Wavelength (nm)
Abs
orba
nce
Figure 10. Photodiode array spectra of all-trans-lycopene (____),15-cis-lycopene (- - -), and 13-cis-lycopene (....). Mobile phase:acetonitrile–ethyl acetate–methanol (85:10:5).
300 360 400 460 500Wavelength (nm)
Abs
orba
nce
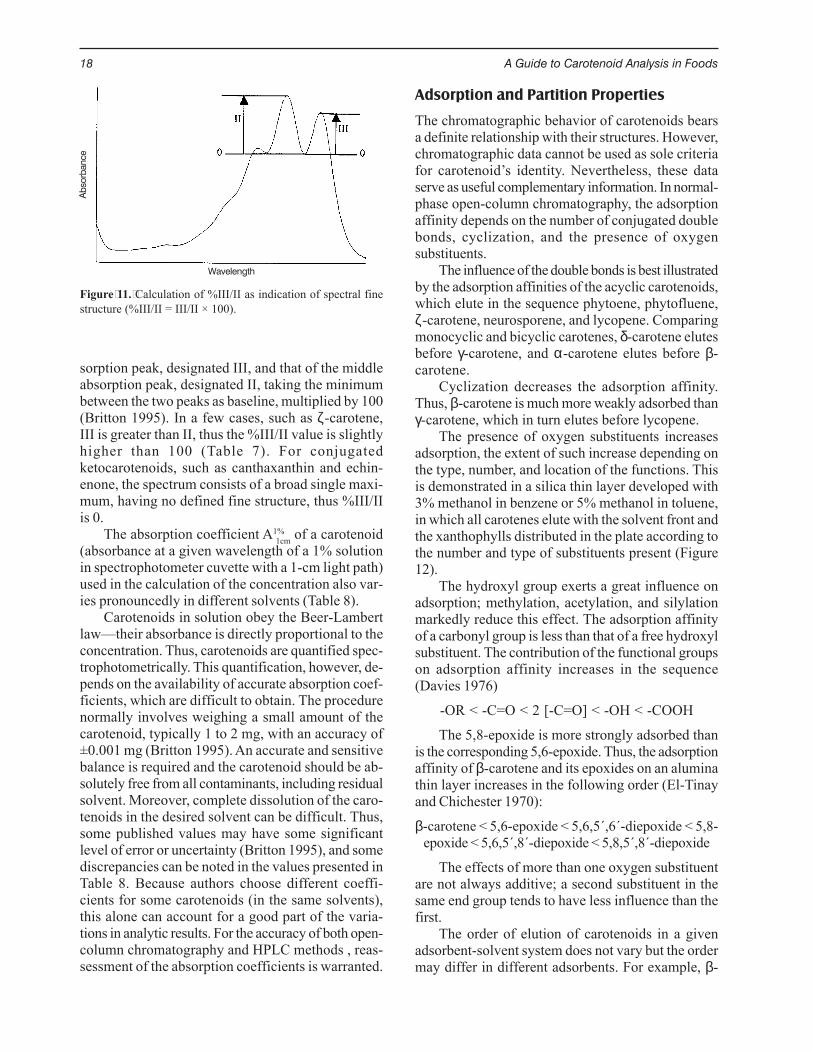
18 A Guide to Carotenoid Analysis in Foods
sorption peak, designated III, and that of the middleabsorption peak, designated II, taking the minimumbetween the two peaks as baseline, multiplied by 100(Britton 1995). In a few cases, such as ζ-carotene,III is greater than II, thus the %III/II value is slightlyhigher than 100 (Table 7). For conjugatedketocarotenoids, such as canthaxanthin and echin-enone, the spectrum consists of a broad single maxi-mum, having no defined fine structure, thus %III/IIis 0.
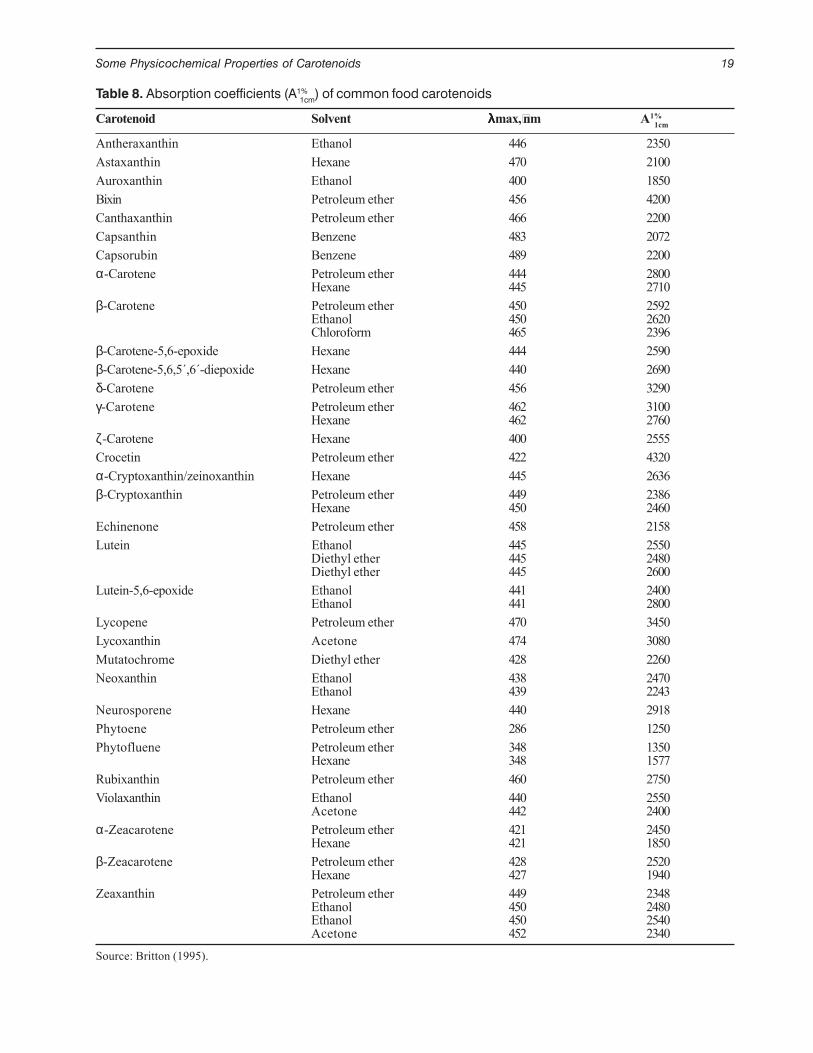
The absorption coefficient A1%1cm of a carotenoid
(absorbance at a given wavelength of a 1% solutionin spectrophotometer cuvette with a 1-cm light path)used in the calculation of the concentration also var-ies pronouncedly in different solvents (Table 8).
Carotenoids in solution obey the Beer-Lambertlaw—their absorbance is directly proportional to theconcentration. Thus, carotenoids are quantified spec-trophotometrically. This quantification, however, de-pends on the availability of accurate absorption coef-ficients, which are difficult to obtain. The procedurenormally involves weighing a small amount of thecarotenoid, typically 1 to 2 mg, with an accuracy of±0.001 mg (Britton 1995). An accurate and sensitivebalance is required and the carotenoid should be ab-solutely free from all contaminants, including residualsolvent. Moreover, complete dissolution of the caro-tenoids in the desired solvent can be difficult. Thus,some published values may have some significantlevel of error or uncertainty (Britton 1995), and somediscrepancies can be noted in the values presented inTable 8. Because authors choose different coeffi-cients for some carotenoids (in the same solvents),this alone can account for a good part of the varia-tions in analytic results. For the accuracy of both open-column chromatography and HPLC methods , reas-sessment of the absorption coefficients is warranted.
Adsorption and Partition Properties
The chromatographic behavior of carotenoids bearsa definite relationship with their structures. However,chromatographic data cannot be used as sole criteriafor carotenoid’s identity. Nevertheless, these dataserve as useful complementary information. In normal-phase open-column chromatography, the adsorptionaffinity depends on the number of conjugated doublebonds, cyclization, and the presence of oxygensubstituents.
The influence of the double bonds is best illustratedby the adsorption affinities of the acyclic carotenoids,which elute in the sequence phytoene, phytofluene,ζ-carotene, neurosporene, and lycopene. Comparingmonocyclic and bicyclic carotenes, δ-carotene elutesbefore γ-carotene, and α-carotene elutes before β-carotene.
Cyclization decreases the adsorption affinity.Thus, β-carotene is much more weakly adsorbed thanγ-carotene, which in turn elutes before lycopene.
The presence of oxygen substituents increasesadsorption, the extent of such increase depending onthe type, number, and location of the functions. Thisis demonstrated in a silica thin layer developed with3% methanol in benzene or 5% methanol in toluene,in which all carotenes elute with the solvent front andthe xanthophylls distributed in the plate according tothe number and type of substituents present (Figure12).
The hydroxyl group exerts a great influence onadsorption; methylation, acetylation, and silylationmarkedly reduce this effect. The adsorption affinityof a carbonyl group is less than that of a free hydroxylsubstituent. The contribution of the functional groupson adsorption affinity increases in the sequence(Davies 1976)
-OR < -C=O < 2 [-C=O] < -OH < -COOH
The 5,8-epoxide is more strongly adsorbed thanis the corresponding 5,6-epoxide. Thus, the adsorptionaffinity of β-carotene and its epoxides on an aluminathin layer increases in the following order (El-Tinayand Chichester 1970):
β-carotene < 5,6-epoxide < 5,6,5´,6´-diepoxide < 5,8-epoxide < 5,6,5´,8´-diepoxide < 5,8,5´,8´-diepoxide
The effects of more than one oxygen substituentare not always additive; a second substituent in thesame end group tends to have less influence than thefirst.
The order of elution of carotenoids in a givenadsorbent-solvent system does not vary but the ordermay differ in different adsorbents. For example, β-
Figure 11. Calculation of %III/II as indication of spectral finestructure (%III/II = III/II × 100).
Wavelength
Abs
orba
nce
Some Physicochemical Properties of Carotenoids 19
Table 8. Absorption coefficients (A1%1cm) of common food carotenoids
Carotenoid Solvent λλλλλmax, nm A1%1cmAntheraxanthin Ethanol 446 2350Astaxanthin Hexane 470 2100Auroxanthin Ethanol 400 1850Bixin Petroleum ether 456 4200Canthaxanthin Petroleum ether 466 2200Capsanthin Benzene 483 2072Capsorubin Benzene 489 2200α-Carotene Petroleum ether 444 2800
Hexane 445 2710β-Carotene Petroleum ether 450 2592
Ethanol 450 2620Chloroform 465 2396
β-Carotene-5,6-epoxide Hexane 444 2590β-Carotene-5,6,5´,6´-diepoxide Hexane 440 2690δ-Carotene Petroleum ether 456 3290γ-Carotene Petroleum ether 462 3100
Hexane 462 2760ζ-Carotene Hexane 400 2555Crocetin Petroleum ether 422 4320α-Cryptoxanthin/zeinoxanthin Hexane 445 2636β-Cryptoxanthin Petroleum ether 449 2386
Hexane 450 2460Echinenone Petroleum ether 458 2158Lutein Ethanol 445 2550
Diethyl ether 445 2480Diethyl ether 445 2600
Lutein-5,6-epoxide Ethanol 441 2400Ethanol 441 2800
Lycopene Petroleum ether 470 3450Lycoxanthin Acetone 474 3080Mutatochrome Diethyl ether 428 2260Neoxanthin Ethanol 438 2470
Ethanol 439 2243Neurosporene Hexane 440 2918Phytoene Petroleum ether 286 1250Phytofluene Petroleum ether 348 1350
Hexane 348 1577Rubixanthin Petroleum ether 460 2750Violaxanthin Ethanol 440 2550
Acetone 442 2400α-Zeacarotene Petroleum ether 421 2450
Hexane 421 1850β-Zeacarotene Petroleum ether 428 2520
Hexane 427 1940Zeaxanthin Petroleum ether 449 2348
Ethanol 450 2480Ethanol 450 2540Acetone 452 2340
Source: Britton (1995).
20 A Guide to Carotenoid Analysis in Foods
Solventfront
Origin1 2 3 4 5 6 7 8
Figure 12. Thin-layer silica-gel chromatogram of carotenoidsand reaction products, developed with 5% methanol in toluene.1) β-Carotene, 2) lycopene, 3) β-cryptoxanthin, 4) β-cryptoxan-thin methylated with acidic methanol—negative response, 5) β-cryptoxanthin acetylated with acetic anhydride, 6) lutein, 7) luteinmethylated with acidic methanol, and 8) lutein acetylated withacetic anhydride.
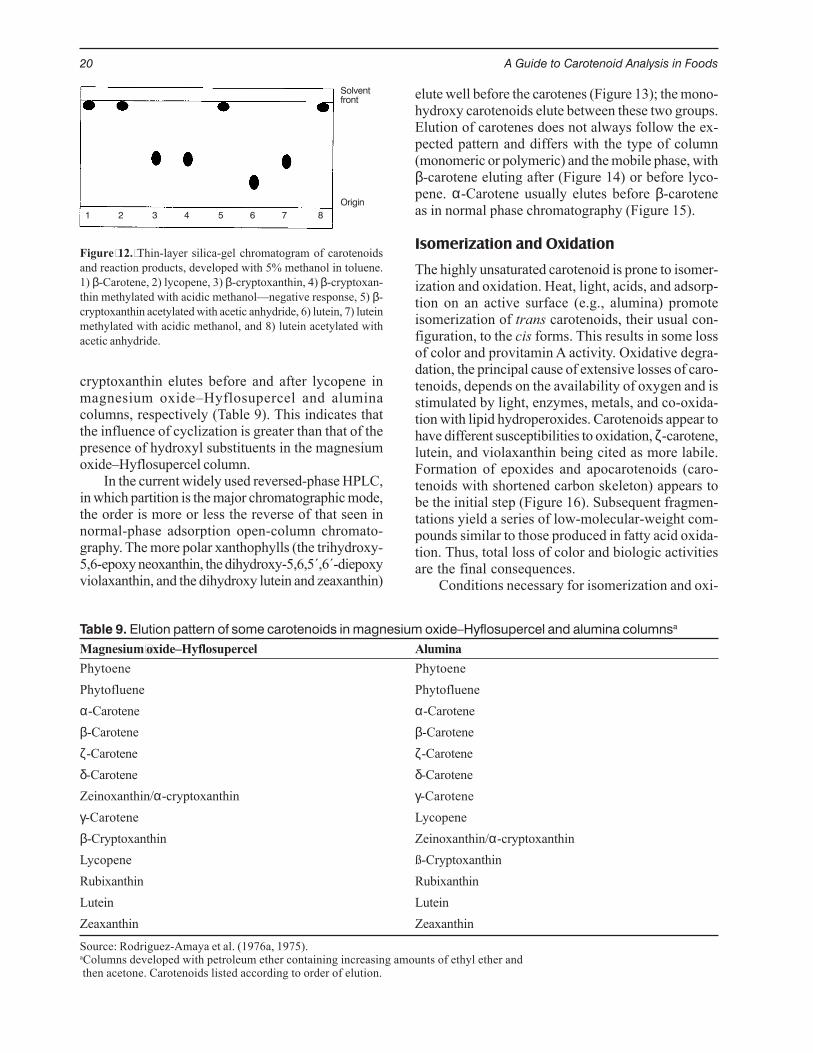
Table 9. Elution pattern of some carotenoids in magnesium oxide–Hyflosupercel and alumina columnsa
Magnesium oxide–Hyflosupercel AluminaPhytoene PhytoenePhytofluene Phytoflueneα-Carotene α-Caroteneβ-Carotene β-Caroteneζ-Carotene ζ-Caroteneδ-Carotene δ-CaroteneZeinoxanthin/α-cryptoxanthin γ-Caroteneγ-Carotene Lycopeneβ-Cryptoxanthin Zeinoxanthin/α-cryptoxanthinLycopene ß-CryptoxanthinRubixanthin RubixanthinLutein LuteinZeaxanthin Zeaxanthin
Source: Rodriguez-Amaya et al. (1976a, 1975).aColumns developed with petroleum ether containing increasing amounts of ethyl ether and then acetone. Carotenoids listed according to order of elution.
cryptoxanthin elutes before and after lycopene inmagnesium oxide–Hyflosupercel and aluminacolumns, respectively (Table 9). This indicates thatthe influence of cyclization is greater than that of thepresence of hydroxyl substituents in the magnesiumoxide–Hyflosupercel column.
In the current widely used reversed-phase HPLC,in which partition is the major chromatographic mode,the order is more or less the reverse of that seen innormal-phase adsorption open-column chromato-graphy. The more polar xanthophylls (the trihydroxy-5,6-epoxy neoxanthin, the dihydroxy-5,6,5´,6´-diepoxyviolaxanthin, and the dihydroxy lutein and zeaxanthin)
elute well before the carotenes (Figure 13); the mono-hydroxy carotenoids elute between these two groups.Elution of carotenes does not always follow the ex-pected pattern and differs with the type of column(monomeric or polymeric) and the mobile phase, withβ-carotene eluting after (Figure 14) or before lyco-pene. α-Carotene usually elutes before β-caroteneas in normal phase chromatography (Figure 15).
Isomerization and Oxidation
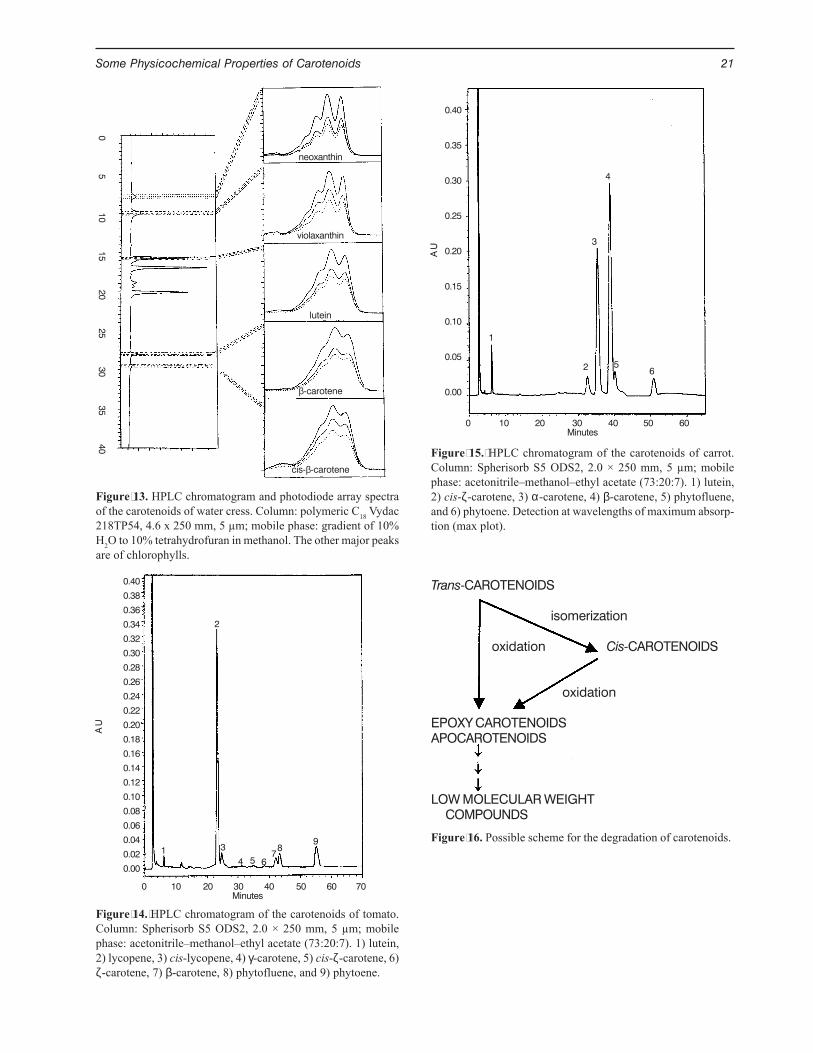
The highly unsaturated carotenoid is prone to isomer-ization and oxidation. Heat, light, acids, and adsorp-tion on an active surface (e.g., alumina) promoteisomerization of trans carotenoids, their usual con-figuration, to the cis forms. This results in some lossof color and provitamin A activity. Oxidative degra-dation, the principal cause of extensive losses of caro-tenoids, depends on the availability of oxygen and isstimulated by light, enzymes, metals, and co-oxida-tion with lipid hydroperoxides. Carotenoids appear tohave different susceptibilities to oxidation, ζ-carotene,lutein, and violaxanthin being cited as more labile.Formation of epoxides and apocarotenoids (caro-tenoids with shortened carbon skeleton) appears tobe the initial step (Figure 16). Subsequent fragmen-tations yield a series of low-molecular-weight com-pounds similar to those produced in fatty acid oxida-tion. Thus, total loss of color and biologic activitiesare the final consequences.
Conditions necessary for isomerization and oxi-
Some Physicochemical Properties of Carotenoids 21
neoxanthin
violaxanthin
lutein
β-carotene
cis-β-carotene
05
1015
2025
3035
40
Figure 13. HPLC chromatogram and photodiode array spectraof the carotenoids of water cress. Column: polymeric C18 Vydac218TP54, 4.6 x 250 mm, 5 µm; mobile phase: gradient of 10%H2O to 10% tetrahydrofuran in methanol. The other major peaksare of chlorophylls.
Figure 14. HPLC chromatogram of the carotenoids of tomato.Column: Spherisorb S5 ODS2, 2.0 × 250 mm, 5 µm; mobilephase: acetonitrile–methanol–ethyl acetate (73:20:7). 1) lutein,2) lycopene, 3) cis-lycopene, 4) γ-carotene, 5) cis-ζ-carotene, 6)ζ-carotene, 7) β-carotene, 8) phytofluene, and 9) phytoene.
0.40
0.38
0.36
0.34
0.32
0.30
0.28
0.26
0.24
0.22
0.20
0.18
0.16
0.14
0.12
0.10
0.08
0.06
0.04
0.02
0.00
0 10 20 30 40 50 60 70Minutes
A U
Figure 15. HPLC chromatogram of the carotenoids of carrot.Column: Spherisorb S5 ODS2, 2.0 × 250 mm, 5 µm; mobilephase: acetonitrile–methanol–ethyl acetate (73:20:7). 1) lutein,2) cis-ζ-carotene, 3) α-carotene, 4) β-carotene, 5) phytofluene,and 6) phytoene. Detection at wavelengths of maximum absorp-tion (max plot).
0 10 20 30 40 50 60Minutes
A U
0.40
0.35
0.30
0.25
0.20
0.15
0.10
0.05
0.00
Figure 16. Possible scheme for the degradation of carotenoids.
Trans-CAROTENOIDS
isomerization
oxidation Cis-CAROTENOIDS
oxidation
EPOXY CAROTENOIDSAPOCAROTENOIDS
LOW MOLECULAR WEIGHTCOMPOUNDS
1
2
3
4 5 67
89
1
2
3
4
56
22 A Guide to Carotenoid Analysis in Foods
dation of carotenoids exist during preparation, pro-cessing, and storage of food. Thus, retention of natu-rally occurring or added carotenoids in prepared, pro-cessed, and stored foods is an important consider-ation. Carotenoids are also subject to isomerizationand oxidation during analysis, and preventative mea-sures must be taken to guarantee the reliability ofanalytic results.
Chemical Reactions of Functional Groups
Xanthophylls undergo group chemical reactions thatcan serve as simple chemical tests in the identifica-tion of carotenoids. Many of the chemical reactions,in extensive use in the late 1960s and early 1970s,have now been supplanted by mass and nuclear mag-netic resonance spectrometry. However, some reac-tions remain useful and can be performed quicklywith only a small amount of the test carotenoid andare amenable to rapid monitoring by ultraviolet or vis-ible spectrometry, thin-layer chromatography, orHPLC.
For example, primary and secondary hydroxygroups are acetylated by acetic anhydride in pyri-dine. Allylic hydroxyls, isolated or allylic to the chro-
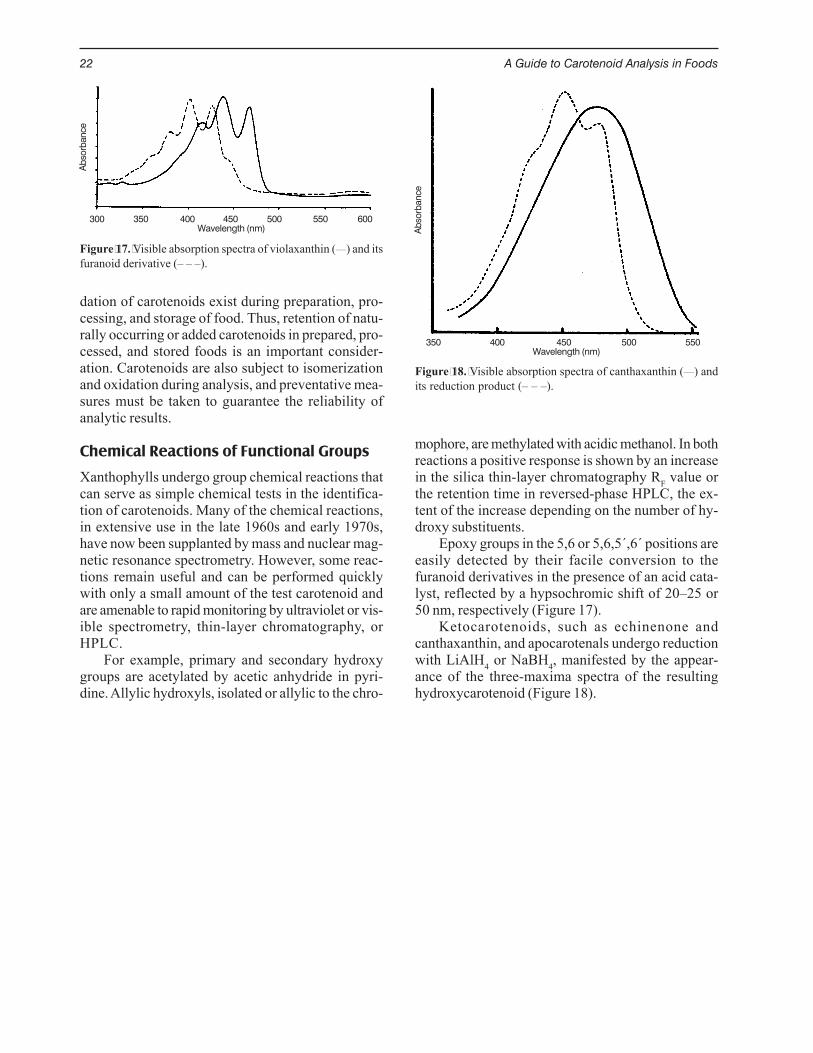
Figure 17. Visible absorption spectra of violaxanthin (___) and itsfuranoid derivative (– – –).
300 350 400 450 500 550 600Wavelength (nm)
Abs
orba
nce
Figure 18. Visible absorption spectra of canthaxanthin (___) andits reduction product (– – –).
350 400 450 500 550Wavelength (nm)
Abs
orba
nce
mophore, are methylated with acidic methanol. In bothreactions a positive response is shown by an increasein the silica thin-layer chromatography RF value orthe retention time in reversed-phase HPLC, the ex-tent of the increase depending on the number of hy-droxy substituents.
Epoxy groups in the 5,6 or 5,6,5´,6´ positions areeasily detected by their facile conversion to thefuranoid derivatives in the presence of an acid cata-lyst, reflected by a hypsochromic shift of 20–25 or50 nm, respectively (Figure 17).
Ketocarotenoids, such as echinenone andcanthaxanthin, and apocarotenals undergo reductionwith LiAlH4 or NaBH4, manifested by the appear-ance of the three-maxima spectra of the resultinghydroxycarotenoid (Figure 18).
General Procedure and Sources of Errors in Carotenoid Analysis 23
GENERAL PROCEDURE AND SOURCES OF ERRORS INCAROTENOID ANALYSIS
Trends in the analysis of carotenoids have mirrorednot only advances in analytic instrumentation, but moreimportantly the perception of the changing or widen-ing role attributed to these compounds from their col-oring properties to their provitamin A activity and theirpotential protective effect against degenerative dis-eases. Determination of the total carotenoid content,through the visible absorption at the λmax of the prin-cipal carotenoid, although still done and attractive forits simplicity, yields insufficient information and isconsidered inadequate except as an estimate of thetotal pigment content. This type of work has givenway to the determination of individual carotenoidsbecause of their differing physicochemical proper-ties and bioactivities.
Analyzing individual carotenoids, however, is in-herently difficult because of several factors(Rodriguez-Amaya and Amaya-Farfan 1992, Rodri-guez-Amaya 1990, 1989):• There are many naturally occurring carotenoids.
More than 600 natural carotenoids are now known,including the enormous variety of carotenoids inalgae, fungi, and bacteria. The number of caro-tenoids found in foods is much less but the foodcarotenoid composition can still be very complex.
• The carotenoid composition of foods varies quali-tatively and quantitatively. Thus, the analytic pro-cedure, principally the chromatographic step, hasto be adapted to the carotenoid composition of eachtype of food sample. The identification of the caro-tenoids in every food has to be done carefully and,in fact, inconclusive or incorrect identification ap-pears to be a common flaw encountered in theliterature.
• The carotenoid concentrations in any given foodvary over a wide range. Typically, one to four prin-cipal carotenoids are present, with a series of caro-tenoids at low or trace levels. The separation, iden-tification, and quantification of these minor caro-tenoids are a formidable challenge to food ana-lysts.
• The highly unsaturated carotenoid molecule is sus-ceptible to isomerization and oxidation, reactionsthat can easily occur during analysis.
Because of these confounding factors, the reli-ability of a substantial part of current data on foodcarotenoids still appears to be questionable.
Special Precautions in Carotenoid Work
The main problem in carotenoid analysis arises fromtheir instability. Thus, whatever the analytic methodchosen, precautionary measures to avoid formationof artifacts and quantitative losses should be stan-dard practice in the laboratory. These include comple-tion of the analysis within the shortest possible time,exclusion of oxygen, protection from light, avoidinghigh temperature, avoiding contact with acid, and useof high purity solvents that are free from harmfulimpurities (Schiedt and Liaaen-Jensen 1995, Britton1991, Davies 1976).
Oxygen, especially in combination with light andheat, is highly destructive. The presence of eventraces of oxygen in stored samples (even at deep-freeze temperatures) and of peroxides in solvents(e.g., diethyl ether and tetrahydrofuran) or of anyoxidizing agent even in crude extracts of carotenoidscan rapidly lead to bleaching and the formation ofartifacts, such as epoxy carotenoids and apocarotenals(Britton 1991). Oxygen can be excluded at severalsteps during analysis and during storage with the useof vacuum and a nitrogen or argon atmosphere. An-tioxidants (e.g., butylated hydroxytoluene, pyrogallol,and ascorbyl palmitate) may also be used, especiallywhen the analysis is prolonged. They can be addedduring sample disintegration or saponification or addedto solvents (e.g., tetrahydrofuran), standard solutions,and isolates.
Exposure to light, especially direct sunlight or ul-traviolet light, induces trans-cis photoisomerizationand photodestruction of carotenoids. Thus, carotenoidwork must be done under subdued light. Open col-
24 A Guide to Carotenoid Analysis in Foods
umns and vessels containing carotenoids should bewrapped with aluminum foil, and thin-layer chroma-tography development tanks should be kept in thedark or covered with dark cloth or aluminum foil.Polycarbonate shields are now available for fluores-cent lights, which are notorious for emission of high-energy, short-wavelength radiation. Absorbing radia-tion of 375–390 nm and shorter wavelengths, theseshields allow the use of full, usual light in laborato-ries. However, this should not preclude coveringflasks, columns, etc., whenever possible.
Speed of manipulation and shielding from lightare especially important in extracts containingchlorophylls (e.g., extracts of green leafy or nonleafyvegetables) or other potential sensitizers. In the pres-ence of these sensitizers, photodegradation andisomerization occur very rapidly, even with brief ex-posure to light.
Because of the thermolability of carotenoids,heating should be done only when absolutely neces-sary. Carotenoid extracts or solution should be con-centrated in a rotary evaporator at reduced pressureand a temperature below 40 oC, and the evaporationof solvent should be finished with nitrogen or argon.Care should be taken to prevent the extract fromgoing to complete dryness in the rotary evaporatorbecause this may result in degradation of carotenoids,especially lycopene (Tonucci et al. 1995). Addition-ally, part of the carotenoids (especially the more po-lar ones), may adhere strongly to the glass walls, pre-cluding quantitative removal from the flask.
Carotenoids may decompose, dehydrate, orisomerize in the presence of acids. 5,6-Epoxycaro-tenoids, such as violaxanthin and neoxanthin, readilyundergo rearrangement to the 5,8-epoxides. Mostcarotenoids are stable towards alkali. A neutralizingagent (e.g., calcium carbonate, magnesium carbon-ate, or sodium bicarbonate) may be added duringextraction to neutralize acids liberated from the foodsample itself. Strong acids and acidic reagents shouldnot be used in rooms where carotenoids are handled.
Reagent-grade, ultraviolet-and-visible-grade, orHPLC-grade solvents should be used. If only techni-cal-grade solvents are available, these should be pu-rified, dried, and freshly distilled before being usedfor extraction or chromatography. Diethyl ether andtetrahydrofuran should be tested for peroxides, whichcan be removed by distillation over reduced iron pow-der or calcium hydride. Because it easily accumu-lates peroxides, tetrahydrofuran is usually suppliedstabilized with the antioxidant butylated hydroxytolu-ene, but there is a time limit to its use.
Chloroform is best avoided because it is difficultto remove all traces of hydrochloric acid. In addition,
it is generally stabilized with 1% ethanol, which canaffect its properties as a solvent for chromatogra-phy. Benzene, although an excellent solvent, shouldalso be avoided because of its toxicity. Chloroformcan be replaced by dichloromethane and benzene bytoluene.
Fractions or isolates should be kept dry undernitrogen or argon or dissolved in a hydrocarbon sol-vent, petroleum ether or hexane, and kept at –20 oCor lower when not in use. Leaving carotenoids in sol-vents such as cyclohexane, dichloromethane, diethylether (Craft and Soares 1992), and acetone can leadto substantial degradation. In our laboratory, caro-tenoids extracted with acetone are immediately trans-ferred to petroleum ether.
It must also be remembered that storing caro-tenoids in flammable volatile solvents, such as ether,in a refrigerator is a safety hazard and should beavoided. An explosion-proof refrigerator is also rec-ommended.
General Analytic Procedure
Carotenoid analysis usually consists of• sampling and sample preparation,• extraction,• partition to a solvent compatible with the subse-
quent chromatographic step,• saponification and washing,• concentration or evaporation of solvent,• chromatographic separation, and• identification and quantification.
Errors can be introduced in each of these steps.Common sources of error in carotenoid analysis aresamples not representing the food lots under investi-gation; incomplete extraction; physical losses duringthe different steps, such as incomplete transfer ofcarotenoids from one solvent to the other when par-tition is carried out, loss of carotenoids in the wash-ing water, and partial recovery of carotenoids adher-ing to walls of containers when carotenoid solutionare brought to dryness; incomplete chromatographicseparation; misidentification; faulty quantification andcalculation; and isomerization and oxidation of caro-tenoids during analysis or storage of food samplesbefore analysis. A good understanding of the pur-pose of each step and the possible errors is thereforewarranted.
Because of the various factors that affect thecarotenoid composition of foods as discussed previ-ously, proper sampling and sample preparation to ob-tain representative and homogeneous samples foranalysis are of paramount importance. In addition,results should be accompanied by pertinent informa-
General Procedure and Sources of Errors in Carotenoid Analysis 25
tion, such as the variety, stage of maturity, season,geographic origin, and part of the plant analyzed. Er-rors incurred in sampling and sample preparation caneasily surpass those of the analysis per se.
Laboratory work should be planned so that thesamples are analyzed as soon as they are collectedbecause it is difficult to store samples without chang-ing their carotenoid composition, even at very lowtemperature. Because carotenoid concentration isexpressed per unit weight of sample, changes in thefood’s weight during storage also affect the final re-sult. The Scientific Committee on Oceanic Research(Mantoura et al. 1997) does not recommend storageof filtered microalgae at –20 oC for longer than 1week.
When storage is absolutely unavoidable, tissuedisintegration should be postponed until after storage(at –20 oC or even lower for longer periods) and thencarried out immediately before or simultaneously withextraction. Degradative enzymatic reactions duringthawing can be minimized by allowing the sample tothaw in the refrigerator (4–6 oC) (Schiedt and Liaaen-Jensen 1995).
Lyophilization is considered by many workers asthe appropriate way of preserving biologic samplesthat have to be stored before carotenoid analysis.However, degradation of carotenoids occurs duringthis processing (Craft et al. 1993, Ramos andRodriguez-Amaya 1993, Park 1987), which alsomakes the sample more porous, thus increasing ex-posure of carotenoids to oxygen during storage. Be-cause lyophilization causes rapid loss and extensivedegradation of chlorophylls and carotenoids, it is notrecommended for storage and transport of filteredsamples of microalgae or phytoplankton (Mantouraet al. 1997).
To prepare a homogeneous, representativesample for analysis and to facilitate the extraction,samples are cut into small pieces or minced. Oncethis is done, extraction should immediately followbecause tissue disruption releases enzymes (e.g.,lipoxygenase) that catalyze substantial carotenoidoxidation and acids that promote trans-cis isomer-ization. In fact, sample maceration, homogenization,and extraction with an organic solvent are usuallycarried out simultaneously.
Prechromatographic Steps
Sampling, sample preparation, and the steps preced-ing chromatography, which are often given only cur-sory attention, can introduce considerable errors thatcannot be compensated for in the measurement stepsregardless of how modern or sophisticated the ana-
lytic instrumentation is. A good extraction procedureshould release all the carotenoids from the food ma-trix and bring them into solution without causing anychange in them. Because carotenoids are found in avariety of foods, the extraction procedure should beadapted to suit the food being analyzed. The solventchosen should efficiently extract the range of caro-tenoids present in the sample.
Carotenoids are usually extracted from biologicsamples, which contain large amounts of water, withwater-miscible organic solvent, such as acetone,methanol, ethanol, or mixtures thereof, to allow bet-ter solvent penetration. Dried materials can be ex-tracted with water-immiscible solvents, but extrac-tion is usually more efficient if the samples are rehy-drated first and then extracted with water-misciblesolvents. Acetone has been frequently used, but withthe advent of HPLC, tetrahydrofuran has also be-come a popular extracting solvent.
The sample is generally homogenized with celite(or Hyflosupercel) and the solvent in a suitable elec-tric blender for 1-2 minutes or with a mortar andpestle. A mechanical blender is fast and efficient formechanical disruption and homogenization of soft fruitsand juice. For samples such as fresh leaves, the simplemortar and pestle is better because small pieces ofleaves, which can escape the blender blades, can bewell ground. A combination of the two can also beused, starting with the blender and finishing with themortar and pestle. In fact, leaves and other difficult-to-extract matrices may also need previous soakingin the extracting solvent (about 15 minutes for leaves)to soften the cell wall. Prolonged soaking should, how-ever, be avoided to prevent isomerization and degra-dation of the carotenoids. Celite facilitates both tis-sue disintegration and filtration. After filtration thesolid residue is returned to the blender and reextractedwith fresh solvent. Extraction and filtration are re-peated until the residue is colorless (three extrac-tions are usually sufficient).
Oxidation can be reduced by directing nitrogeninto the blending vessel or by adding dry ice beforehomogenization. This will, however, increase the costof analysis. In our experience, using cold acetone(left in the refrigerator for a short time before use)and doing the extraction rapidly are sufficient to pre-vent errors in this step.
Filtration can be done with a sintered glass fun-nel (porosity 3; pore size 20–30 µm) or with a Buchnerfunnel. The latter is less expensive and does not havethe problem of clogged pores. The filter paper should,however, be properly fitted so that celite and the finesample particles do not pass through.
Extraction and open-column chromatography
26 A Guide to Carotenoid Analysis in Foods
(OCC) should be carried out under a fume hood toprotect the analyst from inhaling solvent vapor.Breathing hexane, for example, should be avoidedbecause of reported neurotoxicity of some of its oxi-dative metabolites (Schiedt and Liaaen-Jensen 1995).
The extract usually contains a substantial amountof water, which can be removed by partition to hex-ane, petroleum ether, diethyl ether, or dichloromethaneor mixtures of these solvents. Diethyl ether or a mix-ture of ether with hexane or petroleum ether is pre-ferred for extracts with large amounts of xanthophylls,part of which is lost during partition with pure hexaneor petroleum ether. Partition is an integral part ofopen-column methods so that chromatography canbe started at low mobile-phase polarity, the polaritybeing increased during the separation process. InHPLC methods the extract is often evaporated todryness and then dissolved in the mobile phase or asolvent compatible with the mobile phase.
Partition is best done by adding small portions ofthe acetone extract to petroleum ether or anotherappropriate solvent in a separatory funnel. After eachaddition, water is added gently to avoid formation ofan emulsion, preferably by allowing the water to flowalong the walls of the funnel. The two layers areallowed to separate, without agitation, and the loweraqueous phase (with acetone) is discarded. Whenthe entire extract has been added, the petroleum etherphase is washed 4 or 5 times with water to removeresidual acetone.
Alternatively, the acetone extract can be addedto petroleum ether in the separatory funnel all at once,followed by addition of water. Some workers thenagitate the mixture, but this practice leads to the for-mation of an emulsion, which is difficult to break andresults in loss of carotenoids to the aqueous phase.After separation of phases, the lower layer is drawnoff and reextracted with fresh petroleum ether. Thecombined petroleum ether solution is then washed 5times with water. In our experience, the first proce-dure is more efficient and emulsions are less likely toform.
Because the solvents used in extraction or parti-tion ultimately have to be removed or at least re-duced by evaporation, solvents with low boiling pointshave to be chosen to avoid prolonged heating. Thus,the lower-boiling fractions of petroleum ether (b.p.30–60 or 40–60 oC) should be used instead of thehigher-boiling fractions. Dichloromethane (b.p. 42 oC)is to be preferred to chloroform (b.p. 61 oC).
Saponification is an effective means of remov-ing chlorophylls and unwanted lipids, which may in-terfere with the chromatographic separation andshorten the column’s life in HPLC. In samples such
as fruits, saponification hydrolyzes the carotenol es-ters. This simplifies the chromatographic separation,identification, and quantification because the freecarotenols are analyzed instead of the carotenol es-ters, which usually occur as a difficult-to-separatemixture of esters with a variety of fatty acids. How-ever, saponification extends the analysis time, andmay provoke artifact formation and degradation ofcarotenoids. The extent of degradation depends onthe conditions used, being greater with higher con-centration of alkali and on hot saponification (Kimuraet al. 1990).
Although provitamin A carotenoids (α-carotene,β-carotene, γ-carotene, and β-cryptoxanthin) canresist saponification (Kimura et al. 1990, Rodriguez-Amaya et al. 1988), lutein, violaxanthin, and otherdihydroxy-, trihydroxy-, and epoxycarotenoids arereduced considerably during saponification and thesubsequent washing step (Riso and Porrini 1997,Kimura et al. 1990, Khachik et al. 1986). Saponifica-tion should therefore be omitted from the analyticprocedure whenever possible. It is unnecessary, forexample, in the analysis of leafy vegetables, tomato,and carrot, all of which are low-lipid materials andessentially free of carotenol esters. The chlorophyllscoextracted with carotenoids from leaves can be sepa-rated during chromatography.
When indispensable, saponification is best doneafter transferring the carotenoids to petroleum etheror hexane, by adding an equal volume of 10%methanolic potassium hydroxide. The mixture is leftovernight at room temperature in the dark, after whichthe carotenoid solution is washed 5 times with waterto remove the alkali. To avoid losing carotenoids withthe washing water, especially the more polar ones,this step should be done in the same manner as inpartition, described earlier. When apocarotenals (e.g.,β-citraurin in citrus) are present in the sample, alltraces of acetone must be removed before saponifi-cation to avoid facile aldol condensation between theapocarotenals and acetone.
For high-lipid samples, such as red palm oil, abetter procedure for eliminating lipids is being pur-sued. Using the nonspecific Candida cylindracealipase, complete hydrolysis of red palm oil wasachieved after four hours at 35 oC under a nitrogenatmosphere (Lietz and Henry 1997). This mild hy-drolysis allowed quantitative analysis of carotenoidswithout isomerization and degradation. Unfortunately,production of the C. cylindracea lipase has beendiscontinued. Lietz (personal communication) nowinjects the red palm oil samples without fat elimina-tion. The oil (about 0.05 g) is dissolved first with 20%dichloromethane and then with 80% acetone in a 5-
General Procedure and Sources of Errors in Carotenoid Analysis 27
mL flask. An injection volume of around 20 µL andthe acetonitrile-based mobile phase of Hart and Scott(1995) are used. A guard column is required and itshould be changed when the pressure increases to3300 psi.
In our laboratory, the palm oil sample is dissolvedin acetone and left in a freezer (–15 oC) for 4–5 hoursto solidify the lipids (Trujillo et al., unpublished). Thelipids are then separated by filtration with a sinteredglass funnel, the operation being carried out in thefreezer compartment to maintain the low tempera-ture. About 90% of the lipids is removed in this pro-cess. After partition to petroleum ether, the carotenoidsolution is saponified with equal volume of 20% po-tassium hydroxide in methanol overnight at roomtemperature with the addition of butylated hydroxy-toluene. Concern about the possible negative effectsof saponification has recently led researchers toshorten the duration of ambient temperature saponi-fication (e.g., 1 or 2 hours). In our experience, how-ever, carotenol esters of papaya were completelyhydrolyzed only after overnight saponification (Kimuraand Rodriguez-Amaya, unpublished).
To follow the chromatography rule that the samplebe introduced in the chromatographic system in thesmallest volume possible, the carotenoid solution, af-ter partition in unsaponified sample or after washingin saponified sample, is dried with sodium sulfate andthen concentrated for OCC or evaporated to dry-ness to be taken up in the mobile phase or anotherappropriate solvent for HPLC.
Chromatographic Separation
The extent to which chromatographic separation iscarried out in carotenoid analysis depends on the in-formation desired. A perusal of current literatureshows that this type of analysis is carried out to de-termine only the provitamin A carotenoids, major pro-vitamin A and nonprovitamin A carotenoids, cis andtrans isomers of provitamin A carotenoids, and com-plete carotenoid composition. Considering the muchgreater complexity and added cost of complete caro-tenoid analysis and the very low levels of minor caro-tenoids, on one hand, and the importance of both pro-vitamin A and nonprovitamin A carotenoids, on theother hand, the second approach appears to be themost suitable for gathering data for food compositiontables. For research, however, the complete caro-tenoid composition gives valuable, detailed informa-tion. For the first and second approach, classical OCCcan do as well as HPLC (Adewusi and Bradbury1993, Wilberg and Rodriguez-Amaya 1995, Carvalhoet al. 1992) provided that optimum conditions are used
for both techniques. The advantage of HPLC be-comes evident when the analysis is aimed at the fullrange of carotenoids.
Carotenoids are found in nature primarily in themore stable trans configuration, but small amountsof cis isomers are increasingly being encountered.Because cis isomers have different biologic potencyfrom that of their trans counterparts (e.g., lower pro-vitamin A activity), the necessity of separating andquantifying cis isomers apart from the trans caro-tenoids, has been raised. This appears particularlyimportant in green vegetables (Godoy and Rodriguez-Amaya 1998) and in thermally processed or cookedfood (Lessin et al. 1997, Chen et al. 1995, Rodriguez-Amaya and Tavares 1992, Chandler and Schwartz1988, Sweeney and Marsh 1971). This level of de-tail, however, makes the analysis even more compli-cated.
Food samples typically contain both the apolarcarotenes and the more polar xanthophylls. What-ever the method used, the chromatographic processshould be able to cope with this polarity range.
Chromatography in descending, gravity-flow (of-ten with slight pressure provided by a water aspira-tor) columns, currently referred to as OCC, is theclassical method of separating carotenoids for quan-titative analysis. It is also useful in separating andpurifying carotenoids to be used as standards forHPLC. Separation of the carotenoid pigments is fol-lowed visually. Low pressure may also be applied atthe top of the column (e.g., with nitrogen gas), thistechnique being called flash column chromatography.
Thin-layer chromatography, although efficient inmonitoring the progress of chemical tests for identifi-cation purposes, is not adequate for quantitative analy-sis because of the danger of degradation and isomer-ization on a highly exposed plate (Taylor 1983, Liaaen-Jensen 1971). Carotenoids are particularly prone tooxidation by air when adsorbed on the thin layer.Additionally, it is not easy to quantitatively apply thesample on the plate and quantitatively recover theseparated carotenoids from the plate for measure-ment. Gas chromatography is also inappropriate be-cause of the thermal lability and low volatility of caro-tenoids.
A major advantage of OCC is the simple andinexpensive column (i.e., glass column packed withthe adsorbent). However, reproducibility and effi-ciency of the separation of carotenoids depend onthe skill, patience, and experience of the analyst, par-ticularly in packing the column and adjusting the vol-umes and proportions of the eluting solvent, as wellas the analyst’s acuity for detecting the separation.
28 A Guide to Carotenoid Analysis in Foods
The possibility of degradation varies with differentstationary phases (adsorbents) and increases as thechromatographic process is prolonged. Rechromato-graphy of an impure fraction may sometimes be nec-essary, extending the analysis time and increasing thedanger of carotenoid decomposition.
Common adsorbents are magnesium oxide–Hyflosupercel, activated or not, and in different pro-portions (e.g., 1:1 or 1:2), and deactivated, neutralalumina. Magnesium oxide was found to be least likelyto cause carotenoid alteration (Tanaka et al. 1981,Rodriguez-Amaya et al. 1976b), although the con-trary was observed with magnesium oxide activatedaccording to the Association of Official AnalyticalChemists (Rouchaud et al. 1984). Isomerization, deg-radation, or both are more likely to happen in an alu-mina column, so magnesium oxide–Hyflosupercelshould be the first choice. Magnesium oxide is usu-ally diluted with celite or Hyflosupercel to lower ad-sorption affinity and thus prevent irreversible adsorp-tion of polar carotenoids. Also, when used alone,magnesium oxide is sufficiently basic to catalyze al-dol condensation and cause polymerization of acetone.Silica gel is not a popular adsorbent because its in-herent acidity may cause carotenoid isomerization anddegradation (Taylor 1983, Tanaka et al. 1981,Rodriguez-Amaya et al. 1976b). Many solvent com-binations have been tried, but the most common ispetroleum ether or hexane containing increasingamount of diethyl ether and acetone.
Commercially available adsorbents are known tovary in their adsorptive properties, and even minuteamounts of impurities, especially polar substances,alter the solvent’s eluting strength. Although varia-tions are greater between brands, lot-to-lot differ-ences also exist, and these variations tend to begreater in developing countries where quality controlof laboratory materials may not be as rigorous. There-fore, a laboratory’s first attempt may not duplicatereported separation, and adjustment of the chromato-graphic conditions may be necessary.
The adsorption capacity can be increased byactivating the adsorbent for 4 hours at 110 oC or de-creased by increasing the proportion of Hyflosupercel(e.g., magnesium oxide–Hyflosupercel, 1:2). Thecomposition and volumes of the eluting solvents shouldalso be optimized. For example, to increase the sepa-ration of α- and β-carotene, activated magnesiumoxide–Hyflosupercel (1:1) can be used, the volumesof the initial solvents (i.e., petroleum ether and 1%ether in petroleum ether) can be increased, or bothcan be done. Because carotenoids are colored, alter-ations in the eluting solvents can be made withoutresorting to the collection and scanning of numerous
fractions, which would be necessary for colorlesscompounds.
To separate cis and trans isomers by OCC, es-pecially of the provitamin A carotenoids, each frac-tion separated by the magnesium oxide–Hyflosupercel column is rechromatographed on asmaller (dimensions depend on the amount of caro-tenoid) calcium hydroxide column, using 0%, 2%, and4% ethyl ether in petroleum ether to elute the iso-mers of β-carotene and 10% and 20% acetone inpetroleum ether to elute the isomers of β-cryptoxan-thin (Godoy and Rodriguez-Amaya 1998, 1994,Rodriguez-Amaya and Tavares 1992, Bickoff et al.1949). Although quite laborious, this traditional methodis still considered the most effective and practicalway of separating isomeric mixtures of carotenoidsin quantity (Tsukida 1992).
In OCC, a column has to be packed for eachanalysis. A definite improvement in HPLC is the pos-sibility of reproducible separations with a reusablecolumn, under controlled conditions, without undueexposure to air or light. Reversed-phase HPLC onC18 columns is clearly the preferred mode. Reasonsfor the popularity of the C18 column are its weakhydrophobic interactions with the analytes (thus it isexpected to be less destructive than the polar forcesin normal-phase OCC), compatibility with most caro-tenoid solvents and the polarity range of carotenoids,and wide commercial availability.
Many different C18 reversed-phase materials areavailable from different manufacturers and vary inthe degree of carbon loading, end capping, and thenature of the bonded phase (i.e., monomeric or poly-meric). Lack of reproducibility is a persisting prob-lem. The properties and quality of the same kind ofcolumn differ considerably between brands, betweenbatches of the same brand, and even within the samebatch (Pfander and Riesen 1995). Thus, some ad-justments are often needed when published methodsare adapted.
Most carotenoid separations have been carriedout with 5-µm C18 spherical particles packed in a 250× 4.6 mm column. Some laboratories are already us-ing shorter and narrower (narrow bore) columns,smaller particles, and a C30 stationary phase. Mostcommercial reversed-phase columns are now endcapped to minimize polar interaction of the silanolresidues with the analytes and thus diminish tailingand improve column reproducibility.
Monomeric phases are simpler to use and morereproducible. Polymeric C18 phases, on the other hand,have been found to have excellent selectivity for struc-turally similar carotenoids, as in the difficult separa-tion of geometric isomers of β-carotene (Craft et al.
General Procedure and Sources of Errors in Carotenoid Analysis 29
1990, Lesellier et al. 1989, Quackenbush andSmallidge 1986, Bushway 1985) and of lutein andzeaxanthin (Epler et al. 1992). However, the totalcarbon load is lower in the wide-pore polymericphases, resulting in weak retention of the carotenoids(Craft 1992). Additionally, the peaks tend to bebroader and columns from different production lotsare more variable than with monomeric columns.
Guard columns, which should be changed fre-quently, are needed for food samples to prevent par-ticulate material and impurities from entering the ana-lytic column, thus prolonging the column’s life. It can,however, increase band broadening, and the possibil-ity that part of the carotenoid can be retained in itcannot be overlooked.
Metal surfaces, particularly stainless steel fritsin the guard and analytic columns, were reported tobe damaging to carotenoids (Scott 1992). Thus, theuse of metal-free columns (e.g., with “biocompatible”Teflon frits) (Craft et al. 1992) and poly ether etherketone (PEEK) tubing for column connections (Hartand Scott 1995) has been recommended.
The most important properties to be consideredin selecting the mobile phase are polarity, viscosity,volatility, and toxicity. In addition, it must be inert withrespect to the carotenoids. Many solvent systemshave been suggested as mobile phases for caro-tenoids, but the primary solvents are acetonitrile andmethanol, and most systems are actually slight modi-fications of some basic combinations (Craft 1992).Acetonitrile has been widely used because of its lowerviscosity and slightly better selectivity for xanthophyllswhen monomeric C18 column is used (Khachik et al.1986). Epler et al. (1992) reported, however, that withmethanol-based solvents, higher recoveries of caro-tenoids occurred in almost all of 65 columns tested.Methanol is also more available, less expensive, andless toxic than acetonitrile.
Recovery of carotenoids from the column wasimproved when ammonium acetate was added toacetonitrile-based solvents. Addition of triethylamineto the mobile phase containing ammonium acetatefurther increased recovery, from around 60% to over90% (Hart and Scott 1995).
Small amounts of other solvents are added toobtain the desired retention, increase solubility, andimprove resolution. Frequently used for this purposeare chlorinated solvents (e.g., chloroform anddichloromethane) because of their good solvent prop-erties and effects on selectivity, although these sol-vents can be contaminated with traces of hydrochlo-ric acid. Other solvents used as modifiers are tet-rahydrofuran, ethyl acetate, hexane, acetone, andwater. Some methanol has also been added to aceto-
nitrile-based mobile phase. Craft et al. (1992) inves-tigated nine solvent modifiers and found tetrahydro-furan to be the most beneficial modifier of methanol.There is a tendency to use mixtures of three or moresolvents. Craft (1992) cautioned against this practicebecause it can make the method more complicated,enhance demixing, and result in different evapora-tion rates, causing variation in the retention timesduring the course of the day.
Nelis and Leenheer (1983) advocated the use ofnonaqueous reversed-phase liquid chromatographyfor the separation of complex carotenoid mixtures,citing optimal sample solubility hence minimum riskof sample precipitation on the column, increasedsample capacity, excellent chromatographic effi-ciency, and prolonged column life. Many workers,however, use solvent mixtures containing water. Forexample, when using the efficient Vydac columns, asmall amount of water may be needed to resolve theearly eluting free xanthophylls, such as those in leaves.
Gradient elution should only be used when theanalysis cannot be done isocratically. Isocratic sepa-ration is rapid, can be performed with simple equip-ment (with a single high-pressure pump and premixedsolvent), and results in stable baseline and more re-producible retention times. It is usually sufficient forthe determination of provitamin A carotenoids or theprincipal carotenoids of food samples.
Gradient elution has the advantage of greaterresolving power, improved sensitivity, and elution ofstrongly retained compounds. It is more likely to re-solve the whole range of carotenoids found in a givenfood. However, it has several disadvantages: 1) in-creased complexity, 2) requirement for more sophis-ticated and expensive equipment, 3) need for columnreequilibration between runs, 4) greater differentialdetector’s response (i.e., different detector’s signalsfor the same concentration of different compounds),and 5) often poor reproducibility. The column mustbe brought back to the starting solvent and equili-brated for 10–30 minutes in this solvent before a newrun is commenced. Good solvent miscibility is requiredto prevent baseline disturbance resulting from out-gassing and refractive index effects (Craft 1992).
Because of the qualitative and quantitative varia-tion of the carotenoid composition of foods, it is doubt-ful that a single chromatographic system can be es-tablished that can be applicable to the different foods.At least some modification of the mobile phase isneeded when changing from one food to another.
The injection solvent must be compatible withthe HPLC mobile phase. If the carotenoids are muchmore soluble in the injection solvent than in the mo-bile phase, and especially if the solution is nearly satu-
30 A Guide to Carotenoid Analysis in Foods
rated, the carotenoids will precipitate on injection,leading to peak tailing, or they will remain in the in-jection solvent while passing though the column, re-sulting in broad bands and doubled peaks (Craft1992). On the other hand, the sample will not dis-solve completely if the solvent is too weak. Samplescan be injected in the mobile phase to avoid this prob-lem of incompatibility. However, because of the solu-bility range of carotenoids in food samples, anothersolvent may be preferred for solubilization and injec-tion. Porsch (1993) suggested that sample solvent–mobile phase viscosity should be kept fairly below 2,and the much higher dissolving power of the injectionsolvent should be decreased by mixing with the mo-bile phase before injection.
Khachik et al. (1988) observed peak splittingwhen trans carotenoids were injected in dichloro-methane, chloroform, tetrahydrofuran, benzene, ortoluene, the mobile phase being a mixture of metha-nol, acetonitrile, dichloromethane, and hexane. Nosuch splitting occurred when the injection solvent wasacetone, acetonitrile, methanol, or hexane. In ourexperience (Kimura and Rodriguez-Amaya, unpub-lished) and that of other authors (Lietz and Henry1997), acetone is a good injection solvent because ithas similar polarity and solubility properties to thoseof the mobile phase. Zapata and co-workers (Zapataand Garrido 1991, Zapata et al. 1987) reported se-vere peak distortion when acetone extracts were in-jected into their reversed-phase HPLC system witha linear gradient from 100% methanol–1M ammo-nium acetate (8:2) to 100% methanol-acetone (8:2).Because peak splitting depends on the chromato-graphic system and reported results do not seem tobe consistent, analysts should test their own systems.Khachik et al. (1988) also showed the importance ofinjection volume, demonstrating that HPLC peak dis-tortions resulting from the injection solvents mentionedabove can be eliminated if the injection volume isreduced to 5 or 10 µL.
Temperature regulation is recommended to main-tain within- day and day-to-day reproducibility. Varia-tions in column temperature results in substantial fluc-tuation of the carotenoids’ retention times. Tempera-ture also influences selectivity. With a monomeric C18column and acetonitrile-dichloromethane-methanol(70:20:10) as mobile phase, no separation of luteinand zeaxanthin, and 9-cis- and trans-β-carotene oc-curred at ambient (30 °C) temperature (Sander andCraft 1990). At subambient temperature (–13 °C),good separation of lutein and zeaxanthin and baselineseparation of 9-cis- and trans-β-carotene wereachieved. In a Vydac 201TP54 (polymeric) columnwith acetonitrile-methanol-dichloromethane (75:20:5)
as mobile phase, optimum resolution of lutein, zeax-anthin, β-cryptoxanthin, lycopene, α-carotene, andβ-carotene was achieved at 20–22.5 °C (Scott andHart 1993). Also with a Vydac 201TP column and5% tetrahydrofuran in methanol as mobile phase, reso-lution of lutein and zeaxanthin and of β-carotene andlycopene was better at lower temperature, while theseparation of echinenone and α-carotene improvedas the temperature increased (Craft et al. 1992). Thelatter system was optimized at a column temperatureof 20 °C. In addition to good separation, recovery ofseven carotenoids was found to be nearly 100%.
One difficult separation that has been pursued inearnest is the resolution of cis and trans isomers. Atpresent the best column for this purpose is a poly-meric C30 column developed at the National Instituteof Standards and Technology for optimum separa-tion of carotenoids (Sander et al. 1994). It was de-signed to have high absolute retention, enhanced shaperecognition of isomers, and moderate silanol activity.These qualities were achieved by C30 polymeric sur-face modification of a moderate pore size, moderatesurface area silica, and without subsequent end cap-ping.
The C30 column has been shown to provide ex-cellent resolution of photoisomerized standards oflutein, zeaxanthin, β-cryptoxanthin, α-carotene, β-carotene, and lycopene (Emenhiser et al. 1996a,1995), as well as geometric isomers of β-carotene,α-carotene, lutein, and lycopene in extracts of bio-logic samples (Emenhiser et al. 1996b). With anisocratic solvent system consisting of methanol–me-thyl tert-butyl ether (89:11), this column was recentlyused for the quantification of cis-trans isomers ofprovitamin A carotenoids in fresh and processed fruitsand vegetables (Lessin et al. 1997).
Previous to the introduction of the C30 column,the laboratory-packed calcium hydroxide column(Schmitz et al. 1995; Petterson and Jonsson 1990;Chandler and Schwartz 1988, 1987; Tsukida et al.1982), and the polymeric C18 Vydac 201TP column(Craft et al. 1990, Quackenbush and Smallidge 1986)were considered the most efficient (O’Neil et al.1991). Chromatographic analysis of cis-trans caro-tenoid isomers was reviewed by O’Neil and Schwartzin 1992.
Recovery from the HPLC column varies withdifferent carotenoids (Hart and Scott 1995, Epler etal. 1992). Special attention must be given to lyco-pene. Distinctly higher intralaboratory (Hart and Scott1995) and interlaboratory (Scott et al. 1996) coeffi-cients of variation and a lower range of linearity (Risoand Porrini 1997) were found for this carotenoid.Konings and Roomans (1997) observed a consider-
General Procedure and Sources of Errors in Carotenoid Analysis 31
able loss of about 40% of lycopene even when thebiocompatible hastalloy frit was used. This problemwas solved by changing to PAT (PEEK alloyed withTeflon) frits.
Identification and Quantification
The chromatographic behavior and the ultraviolet andvisible absorption spectrum provide the first clues forthe identification of carotenoids. Both the position ofthe absorption maxima (λmax) and the shape (finestructure) of the spectrum reflect the chromophore.The relationship between these two characteristicsof the spectrum and structural features of carotenoidsis discussed in the section on physicochemical prop-erties.
In HPLC the availability of the photodiode arraydetector allows the acquisition of the spectra on-line,making the use of this criterion easier. Spectra canbe taken, stored, and subsequently compared withthose of standards. Spectra taken at points acrossthe peak provide a means of verifying peak purity(i.e., absence of interfering substances). On the otherhand, in OCC enough isolated carotenoids are col-lected to submit to chemical tests.
Identification of carotenoids based solely on theretention times and the absorption spectra may leadto erroneous conclusions. Retention times are diffi-cult to reproduce even within a laboratory and mayvary during the course of a day. Even when caro-tenoid standards are available and co-chromatogra-phy (i.e., spiking) can be done, identification is stillnot conclusive because different carotenoids can havethe same retention time in a given chromatographicsystem. By the same token, different carotenoids mayhave the same chromophore, thus presenting the sameabsorption spectrum. Because of the widespread useof these two parameters as the only criteria, cases ofmisidentification can be discerned in the literature.Thus, it is now recommended that the following mini-mum criteria be fulfilled for identification (Schiedtand Liaaen-Jensen 1995, Pfander et al. 1994):• the visible (or ultraviolet for shorter chromophores)
absorption spectrum (λmax and fine structure) inat least two different solvents must be in agree-ment with the chromophore suggested;
• chromatographic properties must be identical in twosystems, preferably TLC (RF) and HPLC (tR), andco-chromatography with an authentic sampleshould be demonstrated; and
• a mass spectrum should be obtained, which allowsat least confirmation of the molecular mass.
The requirement of a mass spectrum, however,would limit carotenoid analysis to a very few labora-
tories around the world, precluding its execution inareas where it is very much needed. Moreover, com-mon, major carotenoids can be conclusively identi-fied by the judicious and combined use of chromato-graphic data, absorption spectra, and specific chemi-cal reactions, the latter to confirm the type, location,and number of functional groups.
Mass spectrometry (MS) and nuclear magneticresonance (NMR) spectroscopy are, however, indis-pensable in the elucidation of unknown or inconclu-sive structures of carotenoids. MS has been exten-sively used to elucidate the structures of carotenoidsin algae, fungi, and bacteria but had been used only ina few publications on food carotenoids, such as somepapers by Gross and co-workers in the late 1970sand 1980s. Increased use of this technique has beenevident in recent years.
Although newer mass spectrometry ionizationtechniques have been used, such as fast atom bom-bardment (van Breemen et al. 1995, Schmitz et al.1992) and chemical ionization (CI) (Khachik et al.1992a, 1989, 1986), electron impact is still the mostcommonly used technique. Almost all carotenoids givegood molecular ions and, in addition, many fragmen-tations have been identified that are diagnostic ofstructural features. Electron impact–MS was usedrecently to confirm the identity of carotenoids frommango and yellow passion fruit (Mercadante et al.1998, 1997a). A recent chapter on MS presents tabu-lated data for 170 different carotenoid end-group frag-mentations (Enzell and Back 1995). HPLC-MS isbeing applied to carotenoids and is considered par-ticularly important for those coming from naturalsources, which are usually present in trace quantitiesand often contaminated with interfering compounds(van Breemen 1996). When not coupled with HPLC,MS (as well as NMR) requires rigorous isolation andpurification procedures by OCC, TLC, and prepara-tive HPLC.
NMR analysis may prove a carotenoid structureunequivocally, including the geometry of the doublebonds. With refinements in instrumentation in the pastdecade, NMR has become an even more efficientspectroscopic tool for the structural elucidation ofcarotenoids, and comprehensive 1H-NMR and 13C-NMR chemical shift data for carotenoids are avail-able (Englert 1995). Although still limited, it is increas-ingly used in food carotenoids, such as in the struc-tural elucidation of the β-cryptoxanthin monoepoxide(5,6-epoxy-5,6-dihydro-β,β-caroten-3-ol) in papaya(Godoy et al. 1990), cis-isomers of β-carotene(Tsukida et al. 1981) and α-carotene (Emenhiser etal. 1996a), new apocarotenoids from annatto
32 A Guide to Carotenoid Analysis in Foods
(Mercadante et al. 1997b, 1996), carotenoids fromguava (Mercadante et al. 1999), and crocetin deriva-tives from saffron and gardenia (Van Calsteren et al.1997).
The quantification step in OCC methods is fairlystraightforward. The separated carotenoid fractionsare collected and quantified spectrophotometricallythrough the use of tabulated absorption coefficients.In quantitative analysis by HPLC, the following factsshould be considered: carotenoids absorb maximallyat different wavelengths and have different absorp-tion coefficients; solvent effects on absorption aresubstantial (tabulated absorption coefficients andλmax values refer to single solvents, mobile phase inHPLC isocratic elution is usually a mixture, and ingradient elution the mixture’s composition varies dur-ing the chromatographic process); and obtaining andmaintaining carotenoid standards, which are requiredfor calibration, are difficult.
Modern liquid chromatographs allow measure-ment of carotenoids at the wavelengths of maximumabsorption. In older chromatographs, more than oneinjection for the same sample may be necessary forsamples containing phytoene, phytofluene, or ζ-caro-tene along with other carotenoids.
HPLC quantification is carried out by means ofinternal or external calibration for which the concen-trations of the standards are also determined spec-trophotometrically as in OCC. Both OCC and HPLCmethods assume that tabulated absorption coefficientsare accurate, which is not the case for all carotenoidsincluded in the tables.
A constant supply of carotenoid standards isneeded in HPLC methods, especially when externalstandardization is used. The accuracy of the analyticresults depends on how accurately the concentra-tions of the standard solutions are known. Unfortu-nately, only a few carotenoid standards (e.g., α-caro-tene, β-carotene, and lycopene) are available com-mercially. Moreover, commercial β-carotene stan-dards have been shown to have widely varied purity(Craft et al. 1990, Quackenbush and Smallidge 1986).Other carotenoids have to be isolated and purifiedfrom natural sources by the analyst. This can be doneby OCC or by accumulating separated fractions fromseveral HPLC runs. Both procedures are time con-suming and tedious and require experience and pa-tience.
An ideal commercially available internal standardhas not been encountered. It is not easy to find areadily available and stable compound that has chemi-cal and spectral properties similar to those of the caro-tenoids. The stable Sudan I has been used for thedetermination of provitamin A carotenoids
(Quackenbush and Smallidge 1986), but it can co-elute with major nonprovitamin A carotenoids. Syn-thetic carotenoids, such as β-apo-carotenal,canthaxanthin, and echinenone, which are not foundin the samples being analyzed, have also been usedbut are subject to instability problems as the sample’scarotenoids.
The instability of carotenoid standards is a seri-ous problem. Standard carotenoid crystals should besealed in ampoules under nitrogen or argon and storedat –20 °C or preferably at –70 °C until use. Stockand working solutions, even when kept at low tem-perature, have limited validity; the analyst shouldknow when degradation commences under hislaboratory’s conditions. The analyst has to preparesolutions of various concentrations, inject each ofthese solutions, and construct the curve. Inaccura-cies in the preparation of the solutions, determinationof the concentrations, and construction of the cali-brating curves will affect the reliability of the results.
Khachik et al. (1992a) cited the following pa-rameters for evaluating the validity of the standardsand the instrumentation: the correlation coefficientshould be greater than 0.9, the intercept should bevery close to zero, and the relative standard devia-tion of the regression (standard error of the estimatedivided by average concentration of standards multi-plied by 100) should be less than 5%. If any of theseparameters is out of range, the standard as well asthe HPLC instrumentation should be carefully ex-amined and the standard curve should be rerun.
The wide concentration range of carotenoids inany given food is more of a problem in HPLC than inOCC, in which each fraction is simply diluted or con-centrated to have an adequate volume for spectro-metric reading.
In both OCC and HPLC, accurate quantificationrequires conclusive identification and optimal sepa-ration of the carotenoids. Numerous papers have beendedicated to the separation of carotenoids by HPLC.Only a few involved quantification of the carotenoids,but this number has increased notably in recent years.Especially in earlier studies, and despite the repeat-edly cited excellent resolving potential of HPLC, highlyoverlapping peaks have been quantified without men-tion of or allusion to the error involved in such a prac-tice. It is obvious that in quantitative HPLC analysisthe accuracy is dictated by how accurately the peakareas are determined. The continued improvementin column efficiency resulting in chromatograms withwell-resolved peaks is reassuring, indicating that thissource of error is ceasing to be a serious problem incarotenoid analysis.

General Procedure and Sources of Errors in Carotenoid Analysis 33
Aside from the internal standard for calibration,standards also termed internal standards have beenadded at the beginning of the analysis to appraiselosses of carotenoids during extraction and the entirework-up procedures. Given the differing stability ofcarotenoids and the standards themselves, it is ques-tionable whether recovery percentages of the stan-dards do indicate true losses of the carotenoids. Ad-ditionally, use of these standards does not evaluate
the extraction step because they are not intimatelylinked with the food matrices and, therefore, are moreeasily extracted than are the endogenous carotenoids.
Notwithstanding the inherent difficulties and themany possible errors, reliable analytic data on foodcarotenoids can be obtained in the hands of carefuland well-informed analysts. The satisfaction fromaccomplishing such a daunting task is immeasurable.
34 A Guide to Carotenoid Analysis in Foods
DO’S AND DON’TS IN CAROTENOID ANALYSIS
sary to put blinds on windows, use tinted windows,or cover some windows with aluminum foil or otherappropriate material.
• Test your selected analytic method exhaustivelybefore you use it to gather data. The time, re-sources, and effort you spend in testing will be morethan compensated by avoidance of erroneous ormeaningless results.
• Use reagent-grade solvents and reagents for theprechromatographic steps and for open-columnchromatography. If only technical-grade solventsare available, distill them before use. Use HPLC-grade solvents for HPLC. Purification of solventsfor HPLC in the laboratory may be time consum-ing and, in the end, may be more costly.
• Test ethyl ether and tetrahydrofuran for peroxides;if present remove peroxides, for example, by dis-tillation over reduced iron powder. Stabilize tetrahy-drofuran with an antioxidant (e.g., butylated hy-droxytoluene BHT); if stabilized tetrahydrofuranis bought, observe the time limit for its use.
• Carry out all operations as rapidly as possible, es-pecially the steps that introduce risks of oxidationand isomerization. Take advantage of the color ofcarotenoids and monitor carotenoid losses in thedifferent steps by carefully observing color changes.
• Exclude oxygen as much as possible. Store caro-tenoids in air-tight containers under vacuum or ni-trogen.
• Obtain and prepare samples for analysis accord-ing to an adequate plan that meets the objectivesof your work and submits homogeneous and rep-resentative samples for analysis. Unless samplingand sample preparation are done properly, it is use-less to spend time and effort in carrying out theanalysis per se with great accuracy.
• Plan your work so that samples are analyzed im-mediately after collection. Changes are difficult toprevent during storage of samples, even at low tem-perature. If you have to store samples, store them
For emphasis, the necessary measures that shouldbe taken to ensure the reliability of carotenoid dataare summarized below.
Do’s
• Before starting any analytic work, familiarize your-self with the nature of food carotenoids and thephysicochemical properties of these compounds.With this background information, you will savetime and money and prevent analytic errors.
• If you have the opportunity, undergo training for atleast 15 days in an experienced carotenoid labora-tory. This will put you ahead in your work muchfaster.
• If you are going to use a high-performance liquidchromatographic (HPLC) method, be sure that youknow how to use this chromatographic techniquevery well. It is very easy to make errors with thistechnique, and because the results are reproduc-ible (high precision), erroneous data are not easilyperceived.
• Search the literature for previous carotenoid workwith the food samples you intend to analyze. Thiswill give you an idea of what to expect, but re-member that natural variations exist among samplesof the same food (as a function of factors such asstage of maturity, variety, climate or season, andportion taken as edible) and analytic errors persistin the literature.
• Work under subdued artificial light from the ex-traction step on. If the laboratory is used by otheranalysts for other types of analyses (as is usuallythe case in developing countries) and it is not pos-sible to put the whole laboratory under dim light,choose the part of the laboratory most protectedfrom sunlight, turn off the lights in this area, andshield carotenoids from diffuse light by coveringvessels and equipment (e.g., open columns and thin-layer chromatography development tanks) withaluminum foil or black cloth. It may also be neces-
Do’s and Don’ts in Carotenoid Analysis 35
intact at –20 °C or lower for the shortest possibletime.
• While recognizing that carotenoid analysis is in-herently complicated, minimize this complexity andkeep the number of steps to a minimum—withoutjeopardizing the analysis—to limit the opportuni-ties for errors.
• Protect yourself from solvent fumes by working ina well-ventilated laboratory, preferably under afume hood.
• Use amber glassware or cover ampoules, vials,and flasks with aluminum foil. The latter has theadvantage that one can visually verify the com-plete removal of the carotenoids when transfer-ring to another container.
• Make sure that the extraction is complete by usingsolvents capable of penetrating the food matrix anddissolving the range of carotenoids present in thesample without altering or degrading them whileposing minimal or no toxic effects to you, the ana-lyst.
• If partitioning is part of your analytic method, testand improve your operational skill so that caro-tenoids are not lost with the phase to be discarded.
• Dry carotenoid solution by simply adding a smallamount of anhydrous sodium sulfate (until a fewcrystals appear loose). Passing the solution thougha column of sodium sulfate extends the drying time,some carotenoids may be retained in the columnwithout being perceived, and more sodium sulfatethan is necessary may be used.
• Concentrate carotenoid solutions in a rotary evapo-rator, not letting the temperature exceed 40 °C (weuse 35 °C). Avoid bringing carotenoids to com-plete dryness. If it is necessary to remove the sol-vent totally, then evaporate just to dryness. Pro-longed drying increases the possibility of degrada-tion and may leave the carotenoids tightly adheredto the glass walls, making removal from the flaskdifficult. If your budget permits, finish solventevaporation or concentrate small volumes of caro-tenoid with nitrogen.
• Before applying the sample, test the open columnby passing petroleum ether or hexane, adjustingthe solvent flow, and verifying that the flow is evenand the adsorbent smooth, indicating uniform pack-ing. Apply the sample in the smallest volume pos-sible to minimize band broadening.
• Calibrate your ultraviolet-visible spectrophotometerwith a holmium wavelength calibration standard.Because of the variation in reported λmax values,these values should be used with caution and com-pared with spectra recorded in the laboratory withcarotenoid standards. Calibrate absorbance by us-
ing potassium dichromate. As with any spectro-photometric determination, scan carotenoid solu-tion at concentrations corresponding to absor-bances between 0.2 and 1.0.
• Remember that the HPLC injection solvent shouldbe compatible with the mobile phase in eluting anddissolving strength and viscosity to avoid peak dis-tortion and splitting.
• To maximize the lifetime of your column, followclosely the manufacturer’s instructions on caringfor, cleaning and regenerating, and storing the col-umn.
• Use guard and analytic columns with metal-freefrits (e.g., Teflon frits) because metal surfaces mayreact with carotenoids. Use a polymeric, small-bore tubing such as poly ether ether ketone to con-nect components through which carotenoidstraverse (i.e. injector, column, and detector).
• Check the purity of carotenoid standards on ar-rival. Divide pure standards into several portions.Use one portion for preparing stock and workingsolution for current analyses. Store the other por-tions in sealed ampoules under nitrogen or argonat –20 °C or at an even lower temperature for fu-ture use. Verify the time it takes for carotenoids inyour stock and working solutions to start degrad-ing. Remember that the accuracy of your resultcannot be better than the accuracy of the concen-trations of your standard solutions.
• Identify the carotenoids in your sample with thecombined use of chromatographic data (TLC RF,HPLC tR), cochromatography, ultraviolet and vis-ible spectra, and chemical reactions. Mass spec-trometry is required for carotenoids that cannot beconclusively identified by the other parameterscited.
• In HPLC quantification remember that the stan-dard curve should be linear, pass through the ori-gin, and bracket the expected concentrations ofyour samples. It should be constructed with at leastthree, preferably five, different concentrations ofthe standards measured in triplicate.
• Use the least amount of solvents, reagents, andother materials to carry the different steps effi-ciently and recycle used materials (e.g., distill usedpetroleum ether and reuse aluminum foil). Thinkof the cost and resources spent in the manufac-ture of these materials and the ecologic problemof waste disposal.
• Keep all glassware extra clean. To avoid contami-nation with carotenoids of previous analyses, rinseglassware with acetone before and after the usuallaboratory washing.
36 A Guide to Carotenoid Analysis in Foods
Don’ts
• Do not leave or store carotenoids in dichloro-methane, ethyl ether, or acetone because they de-grade faster in these solvents. When not in use,carotenoids should be left in petroleum ether orhexane or dry, under vacuum or nitrogen.
• Do not use blenders with plastic cup. Acetone cor-rodes plastic, and carotenoids adhere to plasticeasily and tightly.
• Do not saponify, unless it is absolutely necessary,to avoid structural changes and degradation of caro-tenoids. If needed, the mildest conditions that canaccomplish its purpose should be used (e.g., sa-ponifying carotenoids dissolved in petroleum etherwith equal volume of 10% methanolic potassiumhydroxide, at room temperature in the dark over-night).
• Do not shake the separatory funnel during parti-tion to avoid forming an emulsion.
• Do not let extracts containing chlorophyll (e.g.,extracts of green vegetables) or other potentialsensitizers stand even for a brief period, especiallywhen exposed to light. Photodegradation andisomerization occur very rapidly under such condi-tions.
• Do not quantify overlapping peaks in the HPLCchromatogram. The accuracy of the quantitativedata depends directly on how accurately the peakareas are known. Efficient columns are now avail-able, and in the right combination with the mobilephase, give baseline or near baseline separationsof at least the major carotenoids.
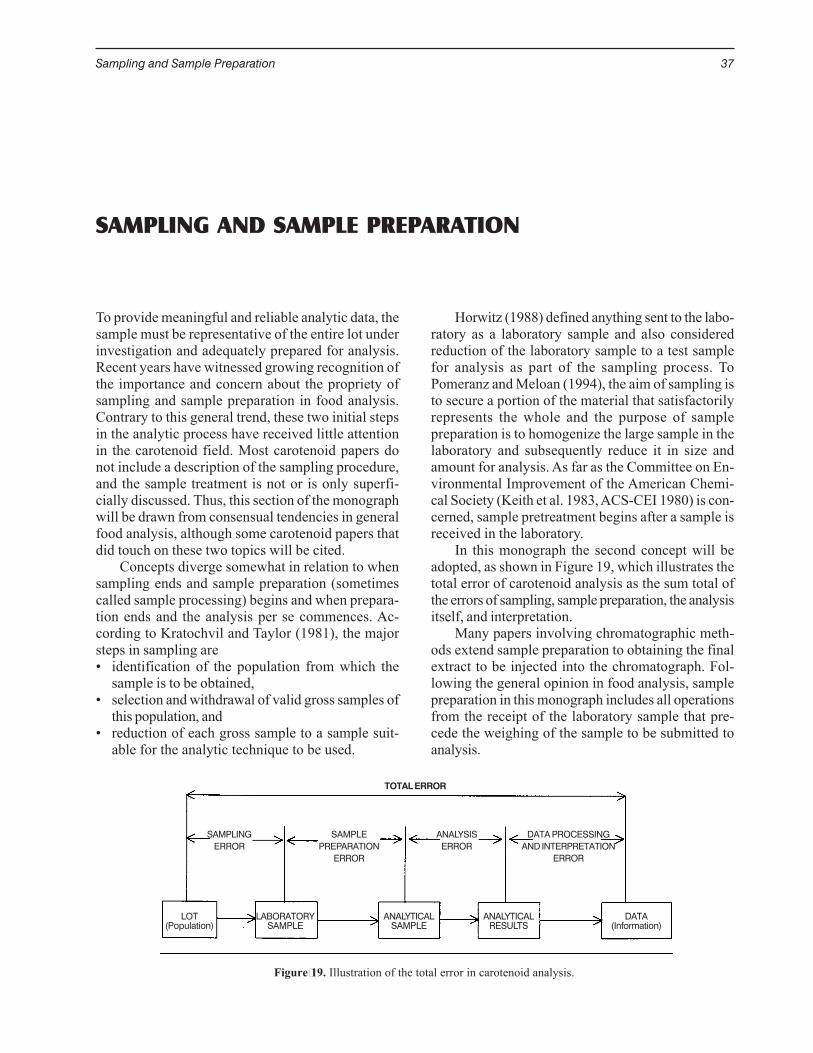
Sampling and Sample Preparation 37
SAMPLING AND SAMPLE PREPARATION
To provide meaningful and reliable analytic data, thesample must be representative of the entire lot underinvestigation and adequately prepared for analysis.Recent years have witnessed growing recognition ofthe importance and concern about the propriety ofsampling and sample preparation in food analysis.Contrary to this general trend, these two initial stepsin the analytic process have received little attentionin the carotenoid field. Most carotenoid papers donot include a description of the sampling procedure,and the sample treatment is not or is only superfi-cially discussed. Thus, this section of the monographwill be drawn from consensual tendencies in generalfood analysis, although some carotenoid papers thatdid touch on these two topics will be cited.
Concepts diverge somewhat in relation to whensampling ends and sample preparation (sometimescalled sample processing) begins and when prepara-tion ends and the analysis per se commences. Ac-cording to Kratochvil and Taylor (1981), the majorsteps in sampling are• identification of the population from which the
sample is to be obtained,• selection and withdrawal of valid gross samples of
this population, and• reduction of each gross sample to a sample suit-
able for the analytic technique to be used.
Horwitz (1988) defined anything sent to the labo-ratory as a laboratory sample and also consideredreduction of the laboratory sample to a test samplefor analysis as part of the sampling process. ToPomeranz and Meloan (1994), the aim of sampling isto secure a portion of the material that satisfactorilyrepresents the whole and the purpose of samplepreparation is to homogenize the large sample in thelaboratory and subsequently reduce it in size andamount for analysis. As far as the Committee on En-vironmental Improvement of the American Chemi-cal Society (Keith et al. 1983, ACS-CEI 1980) is con-cerned, sample pretreatment begins after a sample isreceived in the laboratory.
In this monograph the second concept will beadopted, as shown in Figure 19, which illustrates thetotal error of carotenoid analysis as the sum total ofthe errors of sampling, sample preparation, the analysisitself, and interpretation.
Many papers involving chromatographic meth-ods extend sample preparation to obtaining the finalextract to be injected into the chromatograph. Fol-lowing the general opinion in food analysis, samplepreparation in this monograph includes all operationsfrom the receipt of the laboratory sample that pre-cede the weighing of the sample to be submitted toanalysis.
TOTAL ERROR
SAMPLING SAMPLE ANALYSIS DATA PROCESSINGERROR PREPARATION ERROR AND INTERPRETATION
ERROR ERROR
LOT LABORATORY ANALYTICAL ANALYTICAL DATA(Population) SAMPLE SAMPLE RESULTS (Information)
Figure 19. Illustration of the total error in carotenoid analysis.
38 A Guide to Carotenoid Analysis in Foods
Sampling
In designing a sampling plan, the following factorsshould be considered (Kratochvil and Taylor 1981,Kramer and Twigg 1970):• the purpose of the analysis (information sought),• the nature of the population to be studied,• the nature of the analyte (substance to be mea-
sured),• the distribution of the analyte within the popula-
tion,• the desired accuracy and precision of the analytic
results, and• the analysis to be performed.
The more heterogenous the material, the greaterthe difficulties and effort required to obtain a repre-sentative sample; the more sensitive modern meth-ods become, the smaller the portions of the originallots that are subject to actual analysis, making it morechallenging to minimize sampling errors. Because foodsamples are typically heterogeneous, a large numberof samples should ideally be analyzed. In practice,however, the sampling procedure adopted is usuallya compromise between heterogeneity considerationsand the cost of the operation. It is worthwhile foranalysts to consult statisticians to arrive at a feasiblebut sound sampling protocol.
An acceptable sampling program should at leastinclude a sampling plan that takes into account thegoals of the studies and the expected uncertaintiesassociated with the number of samples collected andthe population variability; instructions for sample col-lection, labeling, preservation, and transport to theanalytic facility; and the training of personnel in thesampling techniques and procedures specified (Keithet al. 1983).
The program should consider the reasons forchoosing sampling sites, number of samples, timingof sample acquisition, and expected levels of fluctua-tion resulting from heterogeneity. Once the samplingsite and time of collection are decided, the followingquestions should be addressed (Kratochvil and Tay-lor 1981):• How many samples should be taken?• How large should each sample be?• From where in the bulk material (population) and
how should the samples be taken?• Should individual samples be analyzed or should a
composite be prepared?A statistical approach to determine the number
of samples to be taken is possible when the standarddeviation of the population is known or can be rea-sonably estimated. A relationship that may be usedfor a given standard deviation and for a given ac-
ceptable error is (Keith et al. 1983, Walpole andMyers 1972)
NS = (zσp/ e)2
where NS is the number of samples, z is the value ofthe standard normal variate (from tables) based onthe level of confidence desired, σp is the standarddeviation of the sample population, and e is the toler-able error in the estimate of the mean for the charac-teristic of interest.
Often, however, the data needed to calculate theminimum number are not available and empirical ap-proaches are used. Kratochvil and Taylor (1981) sug-gested that, in this case, a small number of samples(as representative as possible of the population) shouldbe collected and analyzed. The sampling plan canthen be developed by using this preliminary informa-tion.
If an average compositional value is desired, alarge number of randomly selected samples can beobtained, combined, and blended to obtain a reason-ably homogeneous composite, subsamples of whichmay be analyzed (Keith et al. 1983, ACS-CEI 1980).
Random sampling involves drawing samples fromdifferent parts of the entire lot, each part of the lothaving an equal chance of being collected. It is notas simple as it seems. Samples selected haphazardlymay not constitute a representative sample, but col-lection cannot be so defined that the protocol mayreflect bias (Kratochvil and Taylor 1981).
To evaluate changes in composition with time,temperature, location, etc., systematic sampling shouldbe used and the results should be statistically ana-lyzed.
Sample Preparation
The sample that is brought to the laboratory is usu-ally too large, both in bulk and particle size, for directanalysis. It must be transformed into a homogeneous,small sample for analysis while maintaining its repre-sentativeness. Homogenization and subsampling maybe done simultaneously or sequentially in an inter-changeable order. Physical operations, such as chop-ping, cutting into pieces, mixing, milling, blending, andsieving, are carried out, along with bulk reduction, forexample, by quartering and riffling. The process canbe done manually or through commercially availablemills, blenders, grinders, riffle cutters, etc. Becausethe food product is usually analyzed in the form inwhich it is commonly used, inedible portions (i.e., peel,seed, shell, etc.) are initially removed.
The problems encountered by analysts in thepreparation of samples for analyses include(Pomeranz and Meloan 1994):
Sampling and Sample Preparation 39
• difficulty in obtaining representative small samplesfrom large samples;
• loss of plant material;• difficulty in removal of extraneous material from
plants without removal of plant constituents, includ-ing the analyte;
• enzymatic changes before and during analysis;• compositional changes during grinding; and• changes in unstable components.
The sample preparation procedure should beadapted to the nature of the food, analyte, and ana-lytic method as well as the distribution of the analytein the food.
Sampling and Sample Preparation in FoodCarotenoid Analysis
To obtain representative data for provitamin A caro-tenoids in fresh fruits and vegetables available to con-sumers across the United States, Bureau andBushway (1986) collected samples from five cities(Los Angeles, Dallas, Chicago, Miami, and Boston),3 times during a year (November, March, and July).The foods were shipped by air to the laboratory (onecrate per item). All foods were removed from thecontainers and sampled 3 times. These samples (1–2kg each) were chopped into small pieces and a 10-gsubsample was removed from each of the threesamples. This extensive sampling procedure wasdesigned to account for geographic, seasonal, culti-var, and handling conditions. It was therefore not sur-prising that the ranges of the results were very wideand, apparently because of the very high standarddeviations, no statistically significant differences wereobserved among locations or months of analysis.
In light of Bureau and Bushway’s results, ourinvestigations, and those of others on the effects ofvarious factors and the fact that very wide naturalvariability overshadows refinements in analytic meth-ods, it appears that some delimitation of natural varia-tion should be made. For example, samples of differ-ent cultivars and samples from regions of differentclimates should not be mixed, and the cultivar andregion of origin should be specified in compositiontables. Mature or ripe samples should also be pre-sented separately from immature or unripe samples.
In our laboratory, the sampling and sample prepa-ration scheme depends on the food under investiga-tion and is described in each paper. Sampling for av-erage carotenoid composition is done in distributioncenters, supermarkets, groceries, and other retailoutlets so as to represent the composition of foods asoffered to the consumers. Perennial crops aresampled at different times during the year and sea-
sonal produce is sampled at different times duringthe season. For each laboratory sample, several in-crements are taken at random from different partsof a big lot at the retail outlet. Depending on the foodunder investigation, 200 g to 1 kg are usually taken tothe laboratory. At the laboratory inedible portions areremoved. For small fruits or fruit vegetables, severalfruits are taken at random from the laboratory sampleand homogenized in a mechanical blender; duplicateportions are then weighed and extracted immediatelyto avoid enzymatic oxidation. Big fruits or fruit veg-etables, also taken at random from the laboratorysample, are quartered longitudinally and opposite sec-tions from each fruit are combined and homogenizedin a mechanical blender. Vegetables such as leafyvegetables and green beans are cut into small piecesand mixed. For headed vegetables, such as cabbage,and bunches, such as unheaded lettuce, the head orbunch is opened at the center and a proportional num-ber of young and mature leaves are taken from eachside before cutting. For mature squashes and pump-kins, especially the cultivar menina verde, which canweigh up to 7 kg, a different subsampling procedurewas used (Arima and Rodriguez-Amaya 1988). Forcommercial processed products, which normallywould undergo homogenization during processing, atleast two units are taken randomly from the sameproduction lot and mixed before weighing the samplefor analysis.
Lin and Chen (1995) showed that the concentra-tions of the carotenoids in orange juice of two culti-vars changed during the harvesting season, whichjustifies the collection of samples at different timesduring the season.
In measuring the carotenoid content of vegetablesand fruits commonly consumed in the United King-dom, Hart and Scott (1995) purchased four individualsamples of each item from various retail outlets inthe Norwich area between April and October 1993.After removal of the outer leaves, peeling, coring,etc., large items, such as cabbage, were quartered,cut, and mixed. Small items were cut and mixed, andfrozen or canned items were mixed. Subsamples of100 g were taken from each of the four individualsamples of each food item and bulked to give a com-posite sample of 400 g. Because of the high level ofcarotenoid contribution and frequency of consump-tion, the four individual samples of frozen peas, fro-zen and fresh carrots, and fresh tomatoes were ana-lyzed individually.
To determine the carotenoid content of thermallyprocessed tomato-based food products, Tonucci etal. (1995) purchased frequently consumed productsfrom three U.S. cities (New York, Chicago, and San
40 A Guide to Carotenoid Analysis in Foods
Francisco), which were chosen to represent threedistinct regions (northeast, north central, and west).For each tomato product, analyses were performedon at least one name-brand and one store-brand prod-uct from each of the three cities. For tomato soup,for example, at least two units of a name brand (hav-ing the same lot number) and two units of a storebrand (having the same lot number) were obtainedfrom each of the three cities. Name-brand or store-brand products having the same lot number werecombined. Aliquots from the resulting six sampleswere then analyzed.
To investigate the effects of influencing factors,sampling has to be so designed that variables arecontrolled. For example, to verify cultivar differencesand seasonal variation in the carotenoid compositionof kale, mature leaves of each of two cultivars were
hand-picked at random from the same farm, thusstage of maturity and environmental conditions werethe same for both cultivars (Mercadante andRodriguez-Amaya 1991). Ten sample lots (labora-tory sample: about 250 g each) were collected andanalyzed individually for each cultivar for each sea-son, the lots being harvested at the same time (morn-ing) at different days during the season. One samplelot each of the two cultivars was collected at eachsampling day. At the laboratory, the leaves were finelycut and mixed, and 4–5g subsamples were immedi-ately taken for analysis. To verify the possible ef-fects of agrochemicals, 10 sample lots of mature kalewere collected during the same time period fromneighboring farms, one natural and the other usingagrochemicals.
Open-column Method 41
OPEN-COLUMN METHOD
Analytic methods for carotenoids are classified bychromatographic technique into open-column (OCC)and high-performance liquid chromatography (HPLC)methods. The OCC method herein described wasput together in 1976 (Rodriguez-Amaya et al. 1976a)from the best procedure for each step available atthe time. It has been used in several laboratories inBrazil, evaluated in terms of repeatability for provita-min A carotenoids in different food samples, alongwith the assessment of the extraction and saponifi-cation steps (Rodriguez-Amaya et al. 1988), and com-pared with HPLC methods in terms of provitamin Acarotenoids in different foods (Carvalho et al. 1992)and of major carotenoids in cassava leaves (Adewusiand Bradbury 1993). Additionally, results obtained withthis method compare well with those obtained bysome HPLC methods, as shown for β-carotene andlycopene in tomatoes (Table 3), α-carotene and β-carotene in carrot (Rodriguez-Amaya 1989), andmajor carotenoids of mango, guava, and papaya(Wilberg and Rodriguez-Amaya 1995). In fact, thereseems to be more coherence between the results fromthis method and those of some HPLC methods thanamong results of HPLC methods.
The method as described below may appear te-dious because it has the capacity to identify and quan-tify the range of carotenoids in the sample, includingminor carotenoids. If the objective is to determineonly major provitamin A and nonprovitamin A caro-tenoids, the analysis is much simpler because onlyone to five carotenoids need to be separated, identi-fied, and quantified.
This method is also efficient for isolating caro-tenoids that are not available synthetically or com-mercially to serve as standards for HPLC.
Precautions
Review the precautionary measures discussed in“General Procedure and Sources of Errors in Caro-tenoid Analysis” and put them into practice.
Reagents and Apparatus
• Acetone, reagent-grade or distilled, left in the re-frigerator for about 1 hour.
• Mechanical blender with stainless steel or glasscup, or mortar and pestle.
• Vacuum filtration device—Buchner funnel or sin-tered glass funnel (porosity 3), suction flask, andwater aspirator.
• Separatory funnel with Teflon stopcock.• Potassium hydroxide solution—10% in methanol.
Dissolve 10 g reagent-grade potassium hydroxidein 100 mL methanol, mix, and cool.
• Chromatographic glass tube—2.5 cm i.d. × 30 cm,tapering at the bottom.
• Adsorbent—Mix magnesium oxide andHyflosupercel (diatomaceous earth) (1:1 or 1:2 w/w) by shaking until well mixed. This can be donemanually by shaking the adsorbent in a containerbig enough to allow thorough mixing. If needed,activate the adsorbent already mixed by heating inan oven at 110 °C for 4 hours. After cooling in adesiccator, store in tightly closed container. Whenalumina (activity grade III) is used, mix neutral alu-mina (activity grade I) with 6% water thoroughly(until no lumps can be observed). This is best doneusing a rotary evaporator flask without applyingvacuum. Store in tightly closed container.
• Eluting solvent—Petroleum ether, reagent gradeor distilled (b.p. 30–60 °C), with increasing per-centage of diethyl ether (peroxide-free), acetone,and water (v/v).
• Anhydrous sodium sulfate.• Rotary evaporator.• Ultraviolet-visible recording spectrophotometer.• Volumetric flasks, beakers, Erlenmeyer flasks, and
other common laboratory glassware.• Silica gel thin-layer chromatography (TLC) plates
and TLC development tank.• TLC developing solvent—3% methanol in benzene.
(Because of the high toxicity of benzene, this de-
42 A Guide to Carotenoid Analysis in Foods
veloping solvent has been replaced in our labora-tory with 5% methanol in toluene, the chromato-graphic behavior being equivalent.)
• Reagents and solvents for chemical tests—pyri-dine, acetic anhydride, hydrochloric acid, sodiumborohydride, 95% ethanol, and iodine.
Extraction
Weigh a portion of the homogeneous, representativesample. The weight depends on the carotenoid con-tent of the sample, varying from 2 g of dark greenleafy vegetable to 100 g of low-carotenoid fruit orvegetable. Blend in a mechanical blender for 30–60seconds with enough cold acetone to cover and celiteor Hyflosupercel. Alternatively, grind sample with amortar and pestle, with enough cold acetone to coverand celite or Hyflosupercel. Filter with suction througha Buchner funnel or sintered glass funnel. Wash theblender or mortar, funnel, and residue with smallamounts of acetone, receiving the washings in thesuction flask with the extract. Return the residue tothe blender or mortar, add fresh acetone, and macer-ate again. Filter and wash as before. Repeat the ex-traction and filtration until the residue is devoid ofany color and washings are colorless (usually 3 timesis enough).
Partitioning to Petroleum Ether
Put about 100 mL of petroleum ether in a separatoryfunnel and add a small portion of the acetone ex-tract. Add distilled water slowly, letting it flow alongthe walls of the funnel. To avoid formation of anemulsion, do not shake. (Once formed, an emulsioncan be broken by adding acetone or saturated saltsolution and swirling the funnel to mix. When anemulsion is difficult to break, it is better to start theanalysis over rather than proceed with an analysisthat can give an erroneous result.) Let the two phasesseparate and discard the lower aqueous-acetonephase. Add another portion of the acetone extractand repeat the operation until all of the extract hasbeen transferred to petroleum ether, then wash 4-5times with water to remove residual acetone. Collectthe petroleum ether phase and dry with sodium sul-fate (add sodium sulfate until some crystals becomeloose). If saponification will be carried out, skip thisdrying step. If at any time during this process thelower phase appears colored, collect it and add it backin portions to the upper phase.
The partitioning to petroleum ether is more diffi-cult with the extract obtained from the first extrac-tion, which contains water, lipids, and other compo-nents of the sample. You may want to separate this
first extract so that you can partition it more care-fully. The carotenoids of the succeeding extracts areeasily transferred to petroleum ether.
If your sample has appreciable amount of xan-thophylls, add some diethyl ether to petroleum etherto facilitate the transfer of these xanthophylls fromacetone to petroleum ether.
Saponification
Do this step only when absolutely necessary (see“General Procedure and Sources of Errors in Caro-tenoid Analysis”). To the carotenoid solution in pe-troleum ether, add butylated hydroxytoluene (0.1%in petroleum ether) and an equal volume of 10% po-tassium hydroxide in methanol. Flush with nitrogenbefore stoppering the flask. Let stand in the dark atroom temperature overnight (up to about 16 hours).Wash with distilled water to remove the potassiumhydroxide. Do this as in the partition procedure byadding portions to a separatory funnel, each additionfollowed by washing with water (adding water, al-lowing the phases to separate, and discarding thelower aqueous phase). When all of the carotenoidhas been added to the funnel, wash an additional 4-5times with water to get rid of the potassium hydrox-ide. Collect the carotenoid phase and dry with so-dium sulfate.
Concentration
Concentrate carotenoid solution so that it can be in-troduced into the chromatographic column in thesmallest volume possible. Decant solution to a round-bottom flask and rinse the receiving flask and sodiumsulfate with small amounts of petroleum ether, com-bining washings with the carotenoid solution. If diffi-cult-to-wash xanthophylls are present, rinse also witha small amount of ethyl ether. Connect the flask tothe rotary evaporator and concentrate the solution toabout 10–20 mL, the temperature not exceeding 40°C.
Chromatographic Separation
Preparing the ColumnMount a chromatographic glass tube on a suctionflask. Place a small glass wool plug at the bottom ofthe chromatographic tube. Add adsorbent loosely upto a height of 20 cm and apply a moderate vacuumfrom a water aspirator (the vacuum should be con-tinuously applied from this point on). Use a flat in-strument (such as an inverted cork mounted on a rodor a tampering rod, the diameter just a little bit smaller
Open-column Method 43
than that of the glass tube so that it fits snugly intothe tube) to press down the adsorbent and flatten thesurface (the packed column should about 12 cm high).Top the column with a 1-cm layer of anhydrous so-dium sulfate to ensure that no residual water getsinto the adsorbent. Test the column with petroleumether. Pass about one bed volume of petroleum etherthrough the column (the adsorbent surface must besmooth and the solvent flow even) and adjust thevacuum so that the solvent flow is about 2–3 dropsper second. Once petroleum ether is added to thecolumn, keep the top of column covered with solventuntil the chromatography is completed.
Developing the ColumnPour the carotenoid solution into the column and letthe sample layer go down almost to the surface ofthe sodium sulfate layer before adding the rinse (pe-troleum ether) from the round-bottom flask. The ob-jective is to keep the carotenoids in as small a vol-ume as possible to diminish band broadening and toprevent the separation from initiating before the en-tire carotenoid sample has reached the adsorbent top.
Once the petroleum ether rinse almost reachesthe surface of the sodium sulfate layer, develop themagnesium oxide–Hyflosupercel (1:2) column suc-cessively with 50 mL each of 1%, 2%, and 5% ethylether and then 2%, 5%, 8%, 10%, 15%, and 20%acetone in petroleum ether. Depending on the caro-tenoid composition, the amount of acetone can there-after be increased by 10% and then 20% up to pureacetone. Tightly adsorbed carotenoids can be elutedby 5% and then 10% water in acetone. Hexane maybe used instead of petroleum ether.
For the activated magnesium oxide–Hyflosupercel (1:1) column, start development with1% acetone and continue increasing the acetone per-centage as described above.
For succeeding analyses modify the above de-velopment pattern according to the carotenoid com-position of the sample to obtain the best separationwithin the shortest possible time. Some of the solventmixtures may be deleted or the volume reduced,whereas others may have to be increased. With ex-perience it may not be necessary to develop the col-umn with the entire series of solvents, even when acommodity is being analyzed for the first time. In thiscase, add only a small amount of the eluting solvent.If no separation is observed, go to the next solvent.If, by bypassing a solvent, two bands appear to fusetogether, go back to the previous solvent. Examplesof separation patterns are shown in Figure 20.
Monitor separation of the carotenoids visually and
collect each separated fraction as it leaves the col-umn. Change suction flasks rapidly but gently so thatbreaking the vacuum will not perturb the adsorbentcolumn. Alternatively, when all of the carotenoidshave been separated, let the column dry, remove theadsorbent from the glass tube by tapping the invertedcolumn gently, cut the remaining bands, and extractthem with acetone or acetone with 5–10% water forthe more polar carotenoids. Dilute or concentratefractions eluted with petroleum ether or petroleumether containing small amount of diethyl ether to asuitable volume for spectrophotometric reading.
Because acetone affects the absorption of caro-tenoids in petroleum ether, remove acetone from frac-tions eluted with petroleum ether containing acetoneor transfer carotenoids eluted with acetone or ac-etone with water to petroleum ether. To do this, putthe fraction in the separatory funnel (there is no dan-ger of emulsion formation at this point) all at once,add petroleum ether if necessary, and then add dis-tilled water. After phase separation, discard the lowerphase. Wash with water an additional 3–4 times, col-lect the petroleum ether phase, dry with sodium sul-fate, transfer to a suitable volumetric flask, and ad-just the volume with petroleum ether.
Record the spectrum of all carotenoids in a 1-cmcuvette from 330 nm (lower for phytoene and phyto-fluene) to 550 nm.
For some food samples, better separation isachieved with an alumina column or unresolved frac-tions from the magnesium oxide–Hyflosupercel col-umn are rechromatographed on another magnesiumoxide–Hyflosupercel column or on an alumina col-umn. Pack the alumina column by filling the chro-matographic tube (a smaller tube than that used forthe first separation is usually used forrechromatography) with the adsorbent (usually neu-tral alumina, activity III) and tapping gently to ac-commodate the adsorbent better in the tube. Appli-cation of a vacuum is not required, but the column isalso developed with petroleum ether or hexane con-taining an increasing amount of diethyl ether and thenacetone.
Thin-layer Chromatography
After recording the spectra, concentrate all fractionsand apply on a silica gel thin layer. Develop the thin-layer gel with 5% methanol in toluene. All caroteneswill run with the solvent front. Xanthophylls will bedistributed in the chromatogram according to the typeand number of substituents present. For example,monohydroxy carotenoids will be situated in the middle,trihydroxy carotenoids will remain in the origin, and
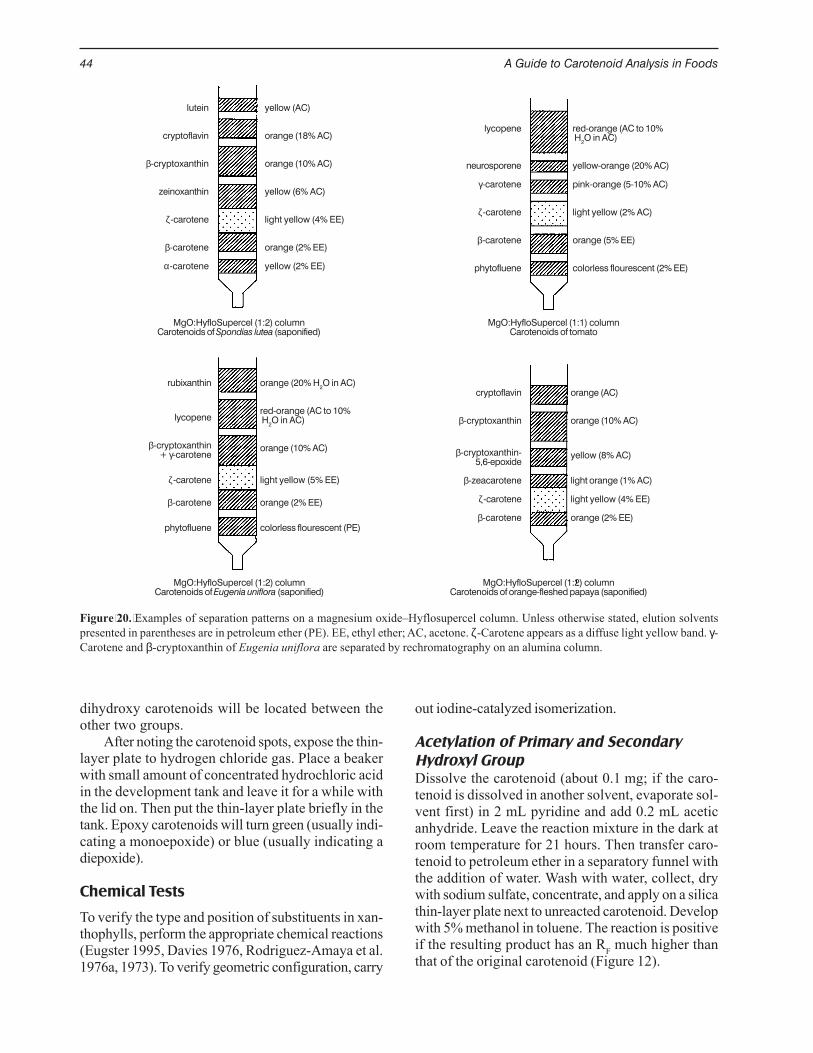
44 A Guide to Carotenoid Analysis in Foods
dihydroxy carotenoids will be located between theother two groups.
After noting the carotenoid spots, expose the thin-layer plate to hydrogen chloride gas. Place a beakerwith small amount of concentrated hydrochloric acidin the development tank and leave it for a while withthe lid on. Then put the thin-layer plate briefly in thetank. Epoxy carotenoids will turn green (usually indi-cating a monoepoxide) or blue (usually indicating adiepoxide).
Chemical Tests
To verify the type and position of substituents in xan-thophylls, perform the appropriate chemical reactions(Eugster 1995, Davies 1976, Rodriguez-Amaya et al.1976a, 1973). To verify geometric configuration, carry
out iodine-catalyzed isomerization.
Acetylation of Primary and SecondaryHydroxyl GroupDissolve the carotenoid (about 0.1 mg; if the caro-tenoid is dissolved in another solvent, evaporate sol-vent first) in 2 mL pyridine and add 0.2 mL aceticanhydride. Leave the reaction mixture in the dark atroom temperature for 21 hours. Then transfer caro-tenoid to petroleum ether in a separatory funnel withthe addition of water. Wash with water, collect, drywith sodium sulfate, concentrate, and apply on a silicathin-layer plate next to unreacted carotenoid. Developwith 5% methanol in toluene. The reaction is positiveif the resulting product has an RF much higher thanthat of the original carotenoid (Figure 12).
Figure 20. Examples of separation patterns on a magnesium oxide–Hyflosupercel column. Unless otherwise stated, elution solventspresented in parentheses are in petroleum ether (PE). EE, ethyl ether; AC, acetone. ζ-Carotene appears as a diffuse light yellow band. γ-Carotene and β-cryptoxanthin of Eugenia uniflora are separated by rechromatography on an alumina column.
lutein
cryptoflavin
β-cryptoxanthin
zeinoxanthin
ζ-carotene
β-carotene
α-carotene
yellow (AC)
orange (18% AC)
orange (10% AC)
yellow (6% AC)
light yellow (4% EE)
orange (2% EE)
yellow (2% EE)
lycopene
neurosporene
γ-carotene
ζ-carotene
β-carotene
phytofluene
red-orange (AC to 10% H2O in AC)
yellow-orange (20% AC)
pink-orange (5-10% AC)
light yellow (2% AC)
orange (5% EE)
colorless flourescent (2% EE)
MgO:HyfloSupercel (1:1) columnCarotenoids of tomato
MgO:HyfloSupercel (1:2) columnCarotenoids of Spondias lutea (saponified)
orange (AC)
orange (10% AC)
yellow (8% AC)
light orange (1% AC)
light yellow (4% EE)
orange (2% EE)
cryptoflavin
β-cryptoxanthin
β-cryptoxanthin- 5,6-epoxide
β-zeacarotene
ζ-carotene
β-carotene
orange (20% H2O in AC)
red-orange (AC to 10% H2O in AC)
orange (10% AC)
light yellow (5% EE)
orange (2% EE)
colorless flourescent (PE)
rubixanthin
lycopene
β-cryptoxanthin + γ-carotene
ζ-carotene
β-carotene
phytofluene
MgO:HyfloSupercel (1:2) columnCarotenoids of Eugenia uniflora (saponified)
MgO:HyfloSupercel (1:2) columnCarotenoids of orange-fleshed papaya (saponified)
Open-column Method 45
Methylation of Allylic Hydroxyl GroupsDissolve the carotenoid (about 0.1 mg) in 5 mL metha-nol. Add a few drops of 0.2 N hydrochloric acid.Allow the reaction to proceed at room temperaturein the dark for 3 hours. Transfer the carotenoid topetroleum ether and submit to thin-layer chromatog-raphy as described above. A positive reaction is alsoshown by an increase in RF (Figure 12). Both theacetylated and methylated products have unchangedultraviolet and visible spectra but are less polar thanthe original carotenoids.
Epoxide-furanoid RearrangementDissolve the carotenoid in ethanol and record thespectrum. Add a few drops of 0.1N hydrochloric acid.Record spectrum again after 3 minutes. A hypsoch-romic shift of 20–25 nm indicates the transformationof a 5,6-epoxide to a 5,8-epoxide.
Reduction of a Conjugated Carbonyl GroupDissolve the carotenoid in 95% ethanol and recordthe spectrum. Add a few crystals of sodium borohy-dride. Let the reaction mixture stand for at least 3hours in the refrigerator. Record the spectrum. If thereaction is positive, the single broad band of aketocarotenoid or an apocarotenal is transformed intothe three-peak spectrum of the resultinghydroxycarotenoid (Figure 18).
Iodine-catalyzed cis-trans IsomerizationDissolve a few crystals of iodine in petroleum ether.Record spectrum of the carotenoid dissolved in pe-troleum ether and add a drop of the iodine solution.Take spectrum after 1–5 minutes of exposure to light.This reaction can be done directly in the spectropho-tometer cuvette. The λmax values of trans caro-
tenoids will shift 3–5 nm to a lower wavelengthwhereas those of cis carotenoids (such as 15-cis-and 13-cis-β-carotene) will shift by the same amountto longer wavelengths. 9-cis-β-Carotene does notchange λmax.
Identification
Identify the separated carotenoids by the combineduse of the following parameters as discussed in “Con-clusive Identification”:• order of elution from the column,• RF values and co-chromatography on thin-layer
chromatography,• ultraviolet and visible spectrum, and• chemical tests.
Calculation of the Concentration
Calculate the concentration of each identified caro-tenoid according to the following formulas:
A • y (mL) • 106
x (µg) = ————————–A1%
1cm • 100
x (µg)x (µg/g) = ————————–
weight of sample (g)
where x is the weight or concentration of the caro-tenoid, y is the volume of the solution that gives anabsorbance of A at a specified wavelength, A1%
1cm isthe absorption coefficient of the carotenoid in thesolvent used, given in Table 8. For example, for β-carotene in petroleum ether, the absorbance (A) at450 nm and an A1%
1cm of 2592 should be used.
46 A Guide to Carotenoid Analysis in Foods
HIGH-PERFORMANCE LIQUID CHROMATOGRAPHICMETHODS
Several high-performance liquid chromatographic(HPLC) methods were selected for presentation hereso that analysts can choose the one that suits theirobjectives and laboratory resources. No HPLCmethod has been generally adopted, although sometrends can be perceived. The methods are presentedas described by the authors responsible for their de-velopment. Mention of a brand of material or equip-ment should not be considered as endorsement. Whensome modifications have been made, the latest ver-sion of the method is presented.
Method of Bushway et al. (Bureau andBushway 1986, Bushway 1985, Bushwayand Wilson 1982)
Developed for the determination of provitamin A caro-tenoids, particularly α-carotene, β-carotene, and β-cryptoxanthin, this method has been used by variouslaboratories in different countries. Mean recovery ofβ-carotene added at 0.25 and 0.75 mg/100 g of car-rots was 100%. For several samples tested for re-peatability, the coefficient of variation (CV) rangedfrom 1.1% to 14.2% for α-carotene and from 1.3%to 8.6% for β-carotene (Bushway and Wilson 1982).Identification was based on retention times comparedwith those of standards, ultraviolet and visible spec-tra, and ratios of absorbance at 470 vs. 450 nm.
Reagents and Apparatus• Tetrahydrofuran (THF) stabilized with butylated
hydroxytoluene (BHT)• Anhydrous sodium sulfate• Magnesium carbonate• Mechanical blender• Buchner funnel, Whatman no. 42 filter paper• Rotary evaporator• α-Carotene, β-carotene, and β-cryptoxanthin stan-
dards• Low-actinic volumetric flasks, round-bottom flasks,
and other glassware
• HPLC equipment with a variable wavelength de-tector; a Partisil 5 ODS column, 250 mm × 4.6 mmi.d.; and acetonitrile-THF-water (85:12.5:2.5 v/v/v) as the mobile phase pumped at a flow rate of2.0 mL/minute
• Ultraviolet-visible light recording spectrophotom-eter
AnalysisWeigh 10 g of the fruit or vegetable. Extract with125 mL THF, 5.0 g anhydrous sodium sulfate, and1.0 g magnesium carbonate in a 1-L mechanicalblender at a moderate speed for 5 minutes. Vacuum-filter through a Buchner funnel fitted with Whatmanno. 42 filter paper. Reextract the filter cake to re-move all carotenoids. Combine the filtrates and bringto a 500-mL volume with THF. Transfer a 100-mLaliquot to a 250-mL round-bottom flask and evapo-rate to dryness, using a rotary evaporator at 40 °C.Redissolve in 10 mL THF with the aid of sonicationand inject 10–25 µL of each sample extract into theHPLC equipment. Quantify using the peak height withthe detection set at 470 nm.
If the sample contains low levels of carotenoids,evaporate the entire filtrate to dryness. Redissolve in10 mL THF and inject 10–25 µL into the chromato-graph.
Preparation of StandardsPrepare stock solutions of α- and β-carotene byweighing 25 mg of each into separate 100-mL low-actinic volumetric flasks. Bring to volume with stabi-lized THF. Take aliquots of 0.5, 1.0, 1.5, and 2.0 mLfrom each and bring to volume in separate 50-mLlow-actinic volumetric flasks.
To prepare a stock solution of β-cryptoxanthin,weigh 12 mg into a 100-mL low-actinic volumetricflask and bring to volume with stabilized THF. Takealiquots of 1.0, 2.0, 2.5, and 3.0 mL; place in four 50-mL low-actinic flasks; and bring these working stan-
High-Performance Liquid Chromatographic Methods 47
dards to volume with stabilized THF. Calibrate HPLCdaily by injecting 10 µL of each working standard induplicate.
Determine the purity of standards spectrophoto-metrically by using A1%
1cm of 2800 at 444 nm in petro-leum ether for α-carotene and of 2396 at 465 nm inchloroform for β-carotene.
Method of Heinonen et al. (Heinonen1990, Heinonen et al. 1989)
The most extensive work of carotenoid analysis infoods in Europe has been carried out by this group.Recovery οf β-carotene in tomato, carrot, and broc-coli was 101% (n=8); lycopene in tomato was 103%(n=4);, and lutein in broccoli was 103% (n=2)(Heinonen et al. 1989). The mean within-laboratoryCV was 10%, ranging from 0.8% to 44%, dependingon the amount and complexity of the carotenoids inthe food item. Identification was based on compari-son of retention times with those of standards, andfor some samples the ultraviolet and visible spectrawere obtained with a photodiode array detector. Themethod was used to determine α-carotene, β-caro-tene, γ-carotene, cryptoxanthin, lutein, and lycopenein Finnish vegetables, fruits, and berries (Heinonenet al. 1989) and in carrot cultivars (Heinonen 1990).
Reagents and Apparatus• Acetone• Mechanical blender• Sodium sulfate• BHT• Vacuum filtration device• Potassium hydroxide solution—100 g potassium
hydroxide + 100 mL H2O• Ethanol• Ascorbic acid• Sodium chloride—10% in H2O• n-Hexane-diethyl ether (70:30 v/v)• HPLC equipment with an ultraviolet and visible
light detector; a guard column, 50 × 4.6 mm i.d.packed with Bondapack Ax/Corasil, 37–50 µm;analytic columns, Zorbax ODS, 250 × 4.6 mm i.d.,5-6 µm; and acetonitrile-dichloromethane-metha-nol (70:20:10 v/v/v) as the mobile phase at a flowrate of 1 mL/min.
• Ultraviolet-visible recording spectrophotometer
AnalysisHomogenize the sample in a blender. Extract 3–10 gof the sample homogenate with 100 mL acetone in amechanical blender, using 20 g sodium sulfate as des-iccant and BHT (0.1% in acetone) as antioxidant.
Vacuum-filter the mixture. Extract the sample 2 to 3times to remove all color. Concentrate the extractbefore saponification. Saponify the extract overnightat room temperature with 1 or 5 mL (for green veg-etables) of potassium hydroxide in a mixture of 50mL ethanol and 20 mL water. Add ascorbic acid (1g/20 mL H2O) as antioxidant. Before solvent extrac-tion, dilute the saponification extract with sodium chlo-ride solution (10% in H2O). Extract the carotenoidswith n-hexane-diethyl ether ( 70:30) with BHT (0.1%in hexane) as antioxidant.
Inject both sample and standard via a full loop,approximately 55 µL. Quantify by using the externalstandard method, the calibration curves being deter-mined daily over the range 50–3600 ng/mL. Use anA1%
1cm of 2550 (445 nm) for lutein in ethanol; 2480(452 nm) for zeaxanthin in benzene; and 2592 (453nm), 2725 (446 nm), 2720 (461 nm), 2470 (452 nm),and 3450 (472 nm) for all-trans-β-carotene (and 15-cis-β-carotene), α-carotene, γ-carotene, cryptoxan-thin, and lycopene in hexane, respectively.
Method of Hart and Scott (Scott et al.1996, Hart and Scott 1995)
This method (without the saponification step) wasevaluated in the proponents’ laboratory by using acandidate vegetable reference material. Short-termrepeatability, measured by analyzing 20 samples ofthe vegetable mix in duplicate over 7 days, showedCVs ranging from 5.6% for lutein to 11.8% for lyco-pene (average 8.3%) (Hart and Scott 1995). Long-term repeatability, measured by the analysis of anadditional 20 samples over 12 months, showed CVsranging from 4.9% for lutein to 10.8% forlycopene(average 7.8%). The method was used todetermine lutein, zeaxanthin, β-cryptoxanthin, lyco-pene, α-carotene, and β-carotene in vegetables com-monly consumed in the United Kingdom.
Evaluation of reproducibility (results of 6–11 par-ticipating laboratories), using the same mixed veg-etable reference material, resulted in CVs rangingfrom 11% for total α-carotene to 40% for total lyco-pene (average 24%). Before or along with thisinterlaboratory analyses, several measures weretaken: evaluation of the homogeneity and stability ofthe reference material; spectrophotometer calibra-tion with circulated holmium reference solution andcirculated β-carotene solution; analysis of circulatedextract of the reference material; and use by the dif-ferent laboratories of the same absorption coefficientsand absorption maxima and of peak area rather thanthe peak height.
48 A Guide to Carotenoid Analysis in Foods
Reagents and Apparatus• Extracting solvent—THF-methanol (1:1 v/v)• Internal standard—β-apo-8´-carotenal or
echinenone• Ultra-turrax homogenizer• Buchner funnel with glass fiber filter pad• Separatory funnel• Petroleum ether—40–60° fraction, containing 0.1%
BHT• Rotary evaporator• Sodium chloride solution—10%• Dichloromethane (DCM), chloroform, hexane• Potassium hydroxide solution—10% potassium
hydroxide in methanol• Standard lutein, lycopene, α-carotene, β-carotene
(Sigma Chemicals), β-apo-8´-carotenal (FlukaChemicals), zeaxanthin, β-cryptoxanthin, andechinenone (Hoffman La Roche).
• HPLC equipment with an ultraviolet and visiblelight variable wavelength detector; a photodiodearray detector; a chromatographic data handlingsystem; a 5-µm ODS 2 metal-free guard column,10 mm; a 5-µm ODS 2 metal-free column, 100 ×4.6 mm; a 5-µm Vydac 201TP54 analytic column,250 × 4.6 mm, modified by the replacement of metalfrits with biocompatible Teflon frits; column con-nections made with poly ether ether ketone tubing;a mobile phase consisting of acetonitrile-metha-nol-dichloromethane (75:20:5 v/v/v) containing0.1% BHT and 0.05% triethylamine (methanolcontains 0.05 M ammonium acetate); a thermo-statically controlled circulating water bath, main-taining the column temperature at 22.5 ± 0.1 °C;and a Rheodyne syringe loading sample injectorfitted with a 50-µL loop.
• Ultraviolet-visible recording spectrophotometer.
AnalysisPlace a 10-g aliquot of the ground sample in conicalflask together with 1 g magnesium carbonate. Add50 mL of THF-methanol (1:1 v/v) along with an in-ternal standard (β-apo-8´-carotenal or echinenone)appropriate for the type of sample. Extract caro-tenoids from the food matrix by homogenizing for 1minute using an ultra-turrax homogenizer. Filterthrough a glass fiber filter pad in a Buchner funnelunder vacuum. Wash the flask and homogenizer with50 mL THF-methanol and filter the washing. Washfilter pad with two further 50-mL aliquots of THF-methanol. Transfer the combined THF-methanol fil-trates to a separatory funnel. Add 50 mL petroleumether (containing 0.1% BHT) and 50 mL 10% so-dium chloride solution and mix by careful shaking.
Draw off the THF-methanol aqueous phase and trans-fer the upper petroleum ether phase to a 250-mLevaporating flask. Extract the THF-methanol aque-ous phase twice more with 50-mL aliquots of petro-leum ether. Combine petroleum ether phases in theflask and evaporate at 35 °C in a rotary evaporatorto near dryness. Add 10–15 mL petroleum ether, re-dissolve the residue by ultrasonic agitation, transferto a 25-mL evaporating flask, and evaporate just todryness. Redissolve the residue by ultrasonic agita-tion to a final volume of 5 mL in DCM. If necessary,saponify this extract as described below. Otherwise,dilute with the mobile phase to a suitable concentra-tion for HPLC analysis and filter through a 0.45-µmPVDF (polyvinylidene diflouride) syringe filter. Per-form all manipulations under gold lighting.
Saponify samples such as pepper and fruit. Sa-ponify 4 mL of the DCM extract with an equal vol-ume of 10% potassium hydroxide in methanol (undernitrogen in the dark) for 1 hour at room temperature.Extract carotenoids from the potassium hydroxide–methanol phase by careful shaking with 20 mL pe-troleum ether and 20 mL 10% sodium chloride solu-tion in a separatory funnel. Remove the lower potas-sium hydroxide–methanol aqueous phase to anotherseparatory funnel and extract twice more with 20-mL aliquots of petroleum ether. Combine the petro-leum ether phases in a separatory funnel and washwith water until washings are neutral on pH paper.Transfer the petroleum ether phase to a 100-mLround-bottom flask and dry in a rotary evaporator at35 °C. Add 10–15 mL of petroleum ether, redissolvethe residue by ultrasonic agitation, transfer to a 25-mL evaporating flask, and evaporate just to dryness.Redissolve the residue by ultrasonic agitation in 4 mLDCM, dilute with mobile phase to a suitable concen-tration for HPLC analysis, and filter through a 0.4-µm PVDF syringe filter. Perform all manipulationsunder gold fluorescent lighting.
Internal StandardsUse internal standard to assess losses during extrac-tion. Use β-apo-8´-carotenal except for green veg-etables, for which echinenone should be used becauseβ-apo-8´-carotenal co-elutes with chlorophyll b.
Preparation of Standard CarotenoidSolution and CalibrationDissolve lutein, α-carotene, β-carotene, and β-apo-8´-carotenal in chloroform and bring to volume withhexane to give a final solvent ratio of 1:9 (v/v). Dis-solve echinenone and β-cryptoxanthin in chloroform-hexane (1:1 v/v). Dissolve zeaxanthin and lycopene
High-Performance Liquid Chromatographic Methods 49
in chloroform. Add BHT at 0.1% to all solvents. Ex-cept for lycopene, store all solutions in air-tight screw-topped brown bottles under nitrogen at –18 °C. Toavoid degradation, divide lycopene solution into 1-mLaliquots in brown glass vials, dry under nitrogen, andseal before storing at –18 °C. When required for use,add 1 mL chloroform to redissolve.
Before measuring absorbance, bring the stocksolutions to room temperature and filter through a0.45-µm PVDF syringe filter. Evaporate an aliquotof the solution under nitrogen and dilute in appropri-ate solvent to give an approximate absorbance read-ing of 0.5 AU. Measure exact absorbance and cal-culate the concentration by using appropriate absorp-tion coefficients (lutein in ethanol at 445 nm, 2550;zeaxanthin in ethanol at 452 nm, 2480; β-cryptoxan-thin in hexane at 451 nm, 2460; lycopene in hexaneat 472 nm, 3450; α-carotene in hexane at 444 nm,2800; β-carotene in hexane at 450, 2592).
Prepare individual working solutions of around0.5–1.0 µg/mL from stock solutions by evaporatingan aliquot under nitrogen and bringing it to volumewith the mobile phase. Assess purity by HPLC. Ex-press the purity of a carotenoid as the peak area ofthat carotenoid as a percentage of the total area ofthe chromatogram and calculate concentration fromthe absorbance reading corrected accordingly. Mea-sure the concentrations and purity of the stock stan-dard solutions each time a new working standard isprepared.
Calculation of Carotenoid ConcentrationCalculate concentrations of carotenoids (µg/100 g)by using response factors relative to β-cryptoxan-thin. Analyze a working solution of β-cryptoxanthinwith each batch of samples on the day of analysis(Equation 1).
Equation 1.
Calculate relative response factor (RF) as follows:Peak area of carotenoid working solution ≡ 1 µg/mL
RF = ———————————————————————Peak area of β-cryptoxanthin working solution ≡ 1 µg/mL
Calculate carotenoid concentration in sample as follows:Carotenoid A (µg/mL of extract) =
area of peak A of diluted extract 100—————————————— • RF (A) • dilution of extract • ——————————————area of β-cryptoxanthin ≡ 1µg/mL % recovery of internal standard
concentration of carotenoid A (µg/mL of extract)Concentration of carotenoid A (µg/100 g) = ———————————————————— • 100
concentration of food sample in extract (g/mL)
Method of Khachik et al. (Tonucci et al.1995, Khachik et al. 1992b, 1986)
This method comes from the laboratory that car-ried out much of the work done on food carotenoidsin the United States in recent years. It has been usedto determine the whole range of carotenoids in thefood sample. Percentage recovery of the internal stan-dard (β-apo-8´-carotenal) was at least 90% for allextractions (Tonucci et al. 1995). The CV of the caro-tenoid concentrations for a vegetables juice used ascontrol sample ranged from 4% for phytoene to 13%for lycopene-5,6-diol. Aliquots from a single large poolof the vegetable juice control sample (stored at –60°C until needed) was extracted and analyzed at thebeginning, after every 10 sample extractions, and atthe end of the study to indicate repeatability over time.Vegetable juice was considered to be a suitable con-trol sample because it contained all the carotenoidsof interest in concentrations that can be easily mea-sured. Identification was based on the comparison ofretention times, ultraviolet and visible spectra obtainedby a photodiode array detector, and mass spectra(desorption chemical ionization, ammonia; negative-ion electron capture, methane).
Reagents and Apparatus• β-Apo-8´-carotenal (internal standard)• THF stabilized with 0.01% BHT• Dichloromethane with 0.1% N,N´-diisopropyl-
ethylamine• Celite• Omni mixer• Buchner funnel• Separatory funnel• Rotary evaporator• Anhydrous sodium sulfate• HPLC equipment with a photodiode array detec-
50 A Guide to Carotenoid Analysis in Foods
tor; Microsorb-MV C18 column, 250 × 4.6 mm i.d.,5 µm; column inlet filter, 0.5 µm, 3 mm i.d.;Brownlee C18 guard column; and printer-plotter.An isocratic mixture of acetonitrile (85%), metha-nol (10%), dichloromethane (2.5%), and hexane(2.5%) at time 0 is followed by a linear gradientbeginning at 10 minutes and completed at 40 min-utes. The final composition of the gradient mixtureis acetonitrile (45%), methanol (10%),dichloromethane (22.5%), and hexane (22.5%).
• Ultraviolet-visible recording spectrophotometer
AnalysisCarry out extraction at 0 °C by immersing the mixerin an ice bath, under gold fluorescent lights. Add anappropriate amount of β-apo-8´-carotenal as the in-ternal standard to each food sample (e.g., 0.85–1.15mg β-apo-8´-carotenal to 50–300 g tomato-basedproduct) before extraction to indicate the extent oflosses as a result of extraction and chromatography.Add magnesium carbonate and celite as a filter aid(each at 10% of the weight of the sample) and blendthe sample for 20 minutes in an Omni mixer withTHF. Filter through Whatman no. 1 filter paper on aBuchner funnel. Extract solid material 2 or 3 moretimes until it is devoid of color after filtering and thefiltrate is colorless. Combine THF extracts and re-duce the volume by about two-thirds under vacuumat 35 °C on a rotary evaporator. Partition compo-nents of the combined extract into dichloromethane
(250 mL) and salt water (150 mL) in a separatoryfunnel. Remove the organic layer and wash withwater (3x150 mL) containing sodium chloride. If colorremains in the water layer, wash it withdichloromethane until carotenoids are completely re-moved. Dry dichloromethane layer containing caro-tenoids over anhydrous sodium sulfate (powder) andfilter through Whatman no. 42 filter paper on aBuchner funnel. Reduce the volume of the filtrateunder vacuum to approximately 10 mL. (Preliminarystudies demonstrated that lycopene was lost if thesolution was permitted to go to complete dryness.)Filter 10 mL of concentrated solution quantitativelythrough a 0.45-µm filter and bring the volume to 50mL in dichloromethane in a volumetric flask. Makeappropriate dilutions by transferring aliquots of thissolution into HPLC injection solvent (acetonitrile, 40%;methanol, 20%; dichloromethane, 20%; hexane,20%). Inject 20 µL of the final dilution onto the HPLCcolumn.
Establish calibration curves based on peak areafor the internal standard and for each carotenoid anduse these curves to determine concentrations. Thewavelength for calibration of standards and integra-tion of peaks from sample extract depend on thewavelength of optimum absorption for each caro-tenoid. Quantify all carotenoids at 450 nm except forthe following: lycopene at 470 nm, β-cryptoxanthinat 445 nm, ζ-carotene at 400 nm, phytofluene at 350nm, and phytoene at 290 nm.
Conclusive Identification 51
CONCLUSIVE IDENTIFICATION
Conclusive identification is obviously a requirementfor the accurate determination of the carotenoid com-position of foods. Ideally, the identification procedureshould include mass spectrometry (MS), especiallyelectron-impact MS, which gives the molecular ionand fragments characteristic of structural featuresof the carotenoid molecule. However, availability ofthe MS equipment is highly limited and well-known,principal carotenoids of foods can be identified bythe judicious combined use of chromatographic data,ultraviolet-visible spectra, and chemical reactions. Theidentification of some carotenoids will be discussedto illustrate this point.
Because the order of elution from open-columnchromatography (OCC; normal phase) is more de-finitive, it will be given more emphasis than the orderof elution in reverse-phase high-performance liquidchromatography (HPLC). Because of the weakerinteractions of carotenoids with the stationary phasein HPLC, inversion of the elution order is commonand co-chromatography is needed in this technique.
For the application of MS to food carotenoids,the readers are referred to Khachik et al. (1992b,1989, 1986) and Mercadante et al. (1998, 1997a), thelatter interpreting characteristic fragmentation. Itmust be remembered that even sophisticated MScannot be used as the sole criterion for identificationof carotenoids.
Phytoene
This carotenoid absorbs maximally at 286 nm withshoulders at 276 and 297 nm in petroleum ether (Table7), commensurate with a conjugated double-bondsystem of only three double bonds (Figure 2), thespectrum having little fine structure (%III/II = 10).The limited number of conjugated double bonds alsoexplains the lack of color and elution as the first caro-tenoid in OCC with magnesium oxide–Hyflosupercelor alumina.
Phytofluene
With five conjugated double bonds, phytofluene (Fig-ure 2) exhibits a spectrum with well-defined peaks(%III/II = 90) at 331, 348, and 367 nm in petroleumether (Table 7). It elutes as a fluorescent band afterphytoene in OCC.
ααααα-Carotene
Having nine conjugated double bonds in the polyenechain and one conjugated double bond in the β ring(Figure 3), α-carotene has a spectrum with λmax at422, 445, and 473 nm in petroleum ether (Table 7).With one of the conjugated double bonds in a ring,the spectrum loses fine structure (%III/II = 55) (Fig-ure 8). The absence of substituents can be shown bysilica gel thin-layer chromatography (TLC), devel-oped with 5% methanol in toluene, in which, as acarotene, it runs with the solvent front. Co-chroma-tography can be done with TLC and HPLC by usinga commercial α-carotene standard or α-carotene iso-lated from carrot by OCC.
βββββ-Carotene
With 11 conjugated double bonds, two of which arelocated in β rings (Figure 3), β-carotene has λmax at(425), 450, and 477 nm in petroleum ether (Table 7)with little fine structure (%III/II = 25), the absorp-tion at 425 appearing as a mere shoulder (Figure 8).It runs with the solvent front in the TLC system, de-scribed above for α-carotene, which reflects the ab-sence of functional groups. For TLC or HPLC co-chromatography, commercial β-carotene standard orβ-carotene isolated from carrot can be used.
ζζζζζ-Carotene
Appearing as a diffuse faint yellow band in the mag-nesium oxide–Hyflosupercel column after β-carotene,ζ-carotene presents a spectrum with well defined
52 A Guide to Carotenoid Analysis in Foods
peaks (%III/II = 103), at 378, 400, and 425 nm inpetroleum ether (Table 7). Its carotene nature canbe shown, as with α- and β-carotene, with TLC. ζ-Carotene is not available commercially; in Brazil itcan be isolated by OCC from passion fruit, in whichit is the principal carotenoid.
βββββ-Carotene-5,6-epoxide
With one of the ring double bonds eliminated byepoxidation (Figure 5), this carotenoid absorbs atwavelengths slightly lower than those of β-carotene(Table 7). On silica gel TLC it runs slightly below thecarotenes, and its yellow color turns greenish-blueon exposure of the plate to hydrogen chloride gas.Addition of dilute hydrochloric acid to an ethanolicsolution of the carotenoid results in a hypsochromicshift of about 20 nm resulting from the rearrange-ment of the 5,6-epoxy group to a 5,8-epoxide.
βββββ-Carotene-5,8-epoxide
The introduction of a 5,8-epoxy group eliminates fromthe β-carotene molecule a double bond from the poly-ene chain, in addition to the double bond of the β ring,resulting in λmax values about 20 nm lower than thoseof β-carotene (Table 7). This carotenoid runs lowerthan β-carotene-5,6-epoxide on the TLC gel and turnsgreenish-blue on exposure to hydrogen chloride gas.
δδδδδ-Carotene
This carotenoid absorbs maximally at 431, 456, and489 nm in petroleum ether (%III/II = 85) (Table 7),reflecting the 10 conjugated double bonds in the poly-ene chain (Figure 3). As a carotene it runs with thesolvent front in the silica TLC plate developed with5% methanol in toluene. Not available commercially,δ-carotene can be isolated from high-δ-carotene to-mato or peach palm for co-chromatography.
γγγγγ-Carotene
This bright orange monocyclic carotenoid has 11 con-jugated double bonds, one of which is in a β ring (Fig-ure 3). Thus, its adsorption spectrum has λmax val-ues at 437, 462, and 494 nm with fine structure (Fig-ure 8) (%III/II = 40) between β-carotene and lyco-pene (Table 7). As with other carotenes, it runs withthe solvent front on TLC. For co-chromatography, itcan be isolated from rose hips (or Eugenia uniflorain Brazil).
Zeinoxanthin
This monohydroxy derivative of α-carotene has the
same chromophore (Figure 4) and, therefore, thesame absorption spectrum as α-carotene. The pres-ence of the single hydroxyl group, already indicatedby the order of elution on OCC and RF on TLC(around 0.56), is confirmed by acetylation with ace-tic anhydride, resulting in a product that behaves al-most like a carotene on TLC. Because the hydroxylgroup is not in the allylic position, response to methy-lation with acidified methanol is negative.
ααααα-Cryptoxanthin
Having the same chromophore, α-cryptoxanthin (Fig-ure 4) has the same absorption spectrum aszeinoxanthin and α-carotene (Table 7). It also hasthe same chromatographic behavior as zeinoxanthin.The only difference in relation to zeinoxanthin is thelocation of the hydroxyl group in the ε rather thanthe β ring, placing this group in an allylic position.Thus, α-cryptoxanthin responds positively not onlyto acetylation but also to methylation.
βββββ-Cryptoxanthin
With the same chromophore as β-carotene (Figure4), this xanthophyll presents a visible spectrum re-sembling that of β-carotene (Table 7). The presenceof the hydroxyl group, manifested in the chromato-graphic behavior on OCC and TLC (RF around 0.44)is confirmed by the positive response to acetylationwith acetic anhydride. That the hydroxyl is not in al-lylic position is demonstrated by the negative responseto methylation with acidified methanol. β-Cryptox-anthin for co-chromatography can be isolated by OCCfrom papaya.
Neurosporene
This carotene is acyclic and has nine conjugateddouble bonds (Figure 2); thus, its visible spectrumhas well defined peaks at 414, 439, and 467 nm inpetroleum ether (%III/II = 100) (Table 7). It behaveslike the other carotenes in the silica TLC plate devel-oped with 5% methanol in toluene, showing the ab-sence of substituents.
Lycopene
The red lycopene absorbs maximally at 444, 470, and502 nm in petroleum ether with defined fine struc-ture (%III/II = 65) (Figure 8), in agreement with 11conjugated double bonds in an acyclic structure (Fig-ure 2). The absence of functional groups is shown byits behavior on TLC. Lycopene standard is availablecommercially but can also be isolated by OCC fromtomato for co-chromatography.
Conclusive Identification 53
Zeaxanthin
The visible spectrum of this derivative of β-caroteneresembles that of β-carotene (Table 7). That it is adihydroxy carotenoid is reflected in its behavior onOCC and TLC (RF is around 0.19 on the silica TLCgel developed with 5% methanol in toluene). The pres-ence and nonallylic position of these groups are shownby the positive response to acetylation with aceticanhydride and negative response to methylation withacidified methanol, respectively. Partial acetylationwill yield two acetylated products, one near the sol-vent front and the other at the middle of the silicaplate developed with 5% methanol in toluene, the lat-ter corresponding to the acetylation of only one ofthe hydroxyl groups. Complete acetylation yields oneproduct with both hydroxyls acetylated, running nearthe solvent front on TLC.
Lutein
This carotenoid has the same chromophore and, con-sequently, the same spectrum as its parent carotenoid,α-carotene (Figure 4, Table 7). Differing only in thelocation of one of the terminal double bonds, it is dif-ficult but possible to separate from zeaxanthin chro-matographically. It exhibits multizoning on TLC, ap-pearing as two spots, with the principal spot havingan RF of around 0.21. The presence of two hydroxygroups can be confirmed by acetylation, as with ze-axanthin. The allylic position of one of the hydroxylsis verified by the positive response to methylation withacidic methanol, producing a compound that behaveslike a monohydroxy carotenoid on TLC. For co-chro-matography, lutein, violaxanthin, and neoxanthin canbe isolated from leaves.
Violaxanthin
Having two epoxy groups at the 5,6 and 5´,6´-posi-tions (Figure 5), this carotenoid has an absorptionspectrum with λmax values about 10 nm lower thanthose of β-carotene and much greater fine structure(%III/II = 98) (Table 7) because the conjugateddouble bonds remaining after epoxidation are of thepolyene chain. The presence of two hydroxy and twoepoxy groups is indicated on TLC (RF lower thanzeaxanthin and yellow color turning blue on exposureof the TLC plate to hydrogen chloride gas). The pres-ence of the hydroxy groups can be confirmed byacetylation. A hypsochromic shift of about 40 nm onaddition of dilute hydrochloric acid to an ethanolicsolution of this carotenoid confirms the presence andposition of the epoxy substituents, the displacementof the λmax being a consequence of the epoxide-
furanoid rearrangement of violaxanthin to auroxanthin(Figure 17).
Neoxanthin
Among the food carotenoids, neoxanthin is uniquebecause it has an allenic group in the polyene chain(Figure 5). The spectrum is close to that ofviolaxanthin (Table 7). On TLC (silica gel with 5%methanol in toluene), this carotenoid stays near theorigin because of the three hydroxy groups and itturns green on exposure of the plate to hydrogen chlo-ride gas because of the presence of an epoxide.Acetylation, partial or complete, can confirm the pres-ence of the three hydroxyls. A shift of the λmax val-ues to lower wavelengths by about 20 nm shows thata 5,6-epoxy group is part of the molecule.
Canthaxanthin
This symmetrical ketocarotenoid with two conjugatedcarbonyl groups (Figure 7), has a spectrum consist-ing of a broad symmetrical peak with the maximumat 466 nm in petroleum ether (%III/II = 0). On re-duction with sodium borohydride, this single maxi-mum transforms into the three-peak spectrum of theresulting dihydroxycarotenoid (isozeaxanthin), simi-lar to that of β-carotene (Figure 18). On TLC thered-orange spot of canthaxanthin, which elutes at anRF of about 0.51, transforms into the yellow spot ofisozeaxanthin with an RF of about 0.2.
Echinenone
Also a ketocarotenoid with one conjugated carbonylgroup (Figure 7), echinenone gives a spectrum hav-ing an unsymmetrical broad peak at 458 nm and ashoulder at 482 nm in petroleum ether (Table 7).Reduction with sodium borohydride transforms thespectrum into the typical three-peak spectrum of theresulting monohydroxy isocryptoxanthin. On the silicaTLC plate, the orange spot of echinenone, which runsat an RF of about 0.72, turns to yellow with an RF ofa monohydroxy carotenoid.
Rubixanthin
A derivative of γ-carotene, rubixanthin has the samespectrum as γ-carotene (Table 7). The presence ofthe single hydroxyl group, which is indicated by itsbehavior on OCC (Table 9) and on TLC (eluting at alower RF than β-cryptoxanthin), can be confirmed bya positive response to acetylation. The nonallylic po-sition is shown by the negative reaction to methyla-tion with acidic methanol.
54 A Guide to Carotenoid Analysis in Foods
METHOD VALIDATION AND QUALITY ASSURANCE
It is now widely recognized that the acquisition ofreliable analytic data requires representative samples,validated analytic methods, quality assurance, ad-equately trained personnel, and ancillary support staffand facilities.
The representativeness of the sample submittedto analysis should be ensured, a properly validatedmethod should be chosen, and the good performanceof the method in the laboratory should be demon-strated. Frequently, the question is not so much howgood the method is but how well it is being used inthe laboratory. Thus, method validation and qualityassurance should always go hand in hand. Obviously,the first three requirements cited above can only befulfilled if the laboratory is run by a quality technicalstaff supported by the necessary back-up staff, re-sources, and infrastructure.
Validation of Methods
Development and validation of an analytic methodusually take place in three stages (Conacher 1990):• evaluation of performance parameters within a
laboratory,• demonstration of successful performance in lim-
ited interlaboratory studies, and• demonstration of successful performance in a rec-
ognized collaborative study.The degree of confidence that can be attributed
to the validity of the method increases as the valida-tion process progresses from the first to the thirdstage. The third stage, conducted according to theguidelines of the Association of Official AnalyticalChemists (AOAC) or similar organization, is gener-ally accepted as the highest degree of method vali-dation. The main performance parameters that shouldbe taken into account in assessing any analytic methodare• accuracy,• precision,• specificity,
• limit of detection,• limit of determination,• linear range, and• scope.
Accuracy is the degree of agreement or close-ness between the determined value and the truevalue. To simulate the actual analysis as closely aspossible, certified reference materials should be ana-lyzed. Ideally, a standard reference material shouldbe a matrix similar to the actual samples to be ana-lyzed, available at analyte concentrations comparablewith those expected of the real samples, homoge-neous, and stable in terms of both the analyte and thematrix.
Unfortunately, the few certified reference mate-rials available are usually of high cost and are at onlyone concentration of the analyte. For carotenoids, amajor concern is instability of the reference material.Because of these limitations, recovery of addedanalyte over an appropriate concentration range iscommonly carried out and taken as the indication ofaccuracy. The concentration range should, as muchas possible, bracket the levels expected in the samplesto be analyzed; to evaluate the performance of theentire method, addition of the analyte should be asearly as possible in the analytic process. It must berecognized, however, that an analyte added to a sub-strate may behave differently from an endogenousanalyte. On one hand, the added analyte, not beingintimately linked with the sample matrix, may be moreeasily extracted, giving an artificially high recovery.On the other hand, added analyte (especially polarcompounds) may tightly adsorb to the glass walls ofthe container, particularly at high concentration, yield-ing low recovery. To approach the real situation,analytes should be added to the substrate with care(with contact with glass walls avoided) and left for areasonable holding time before analysis to allow forbonding with the sample matrix.
The accuracy of a particular method may also
Method Validation and Quality Assurance 55
be assessed by comparison with a method alreadyknown to be accurate.
A standard reference material is now availablefor carotenoids from the U.S. National Institute ofStandards and Technology: baby food composite SRM2383. In Europe a candidate reference material wasprepared from selected vegetables (sweet corn, to-matoes, and carrots), which were size reduced,mixed, pureed, and lyophilized. This mixed vegetablematerial was used in an interlaboratory study involv-ing 17 European laboratories (Scott et al. 1996).
Some authors have resorted to in-house refer-ence or control materials, such as a homogenized babyfood containing carrots, peas, low-fat milk, and pars-ley (Hulshof et al. 1997). This homogeneous, well-mixed material is usually divided and dispensed intosmall sealed bottles, stored under freezing condition,and analyzed periodically along with analytic samples.In-house reference materials are valuable in evalu-ating precision, especially coherence of results overtime, but do not assess accuracy.
Although it is appropriate to use processed foodas a reference material so that enzymatic oxidationwill not be a problem and homogeneity and stabilityof the matrix are better, it must be remembered thatthese materials do not represent raw commodities,which are much more difficult to sample and extract.
Precision evaluates how well a method performsunder different conditions of repeated use. It is thedegree of agreement between determined values andis generally expressed in terms of standard deviationor coefficients of variation (CVs) (also called rela-tive standard deviation, RSD). Repeatability (within-laboratory precision) of a method may be measuredby multiple analyses of identical samples at differentanalyte levels, performed on the same day by a singleanalyst using the same apparatus. Even better, it maybe determined by multiple analyses over differentdays. More important is reproducibility (between-labo-ratory precision), which shows the variability of re-sults produced by different laboratories. Repeatabil-ity is generally one-half to one-third of reproducibil-ity. In the harmonization of protocols, repeatabilityand reproducibility limits and intra- and interlaboratoryrelative standard deviations have been designated r,R, RSDr, and RSDR, respectively (Poncklington 1990).
Although there are exceptions, CV values tendto be greater at low analyte concentrations and smallerat higher analyte concentrations (Lynch 1998). Overa reasonable range of concentrations, however, CVis usually independent of analyte concentration.
Specificity is the ability of a method to measureexclusively the element or compound of interest(analyte). Ideally, to verify the identity and amount of
an analyte, two entirely different analytic principlesshould be used. For organic analytes, the followingare resorted to: mass spectrometric confirmation, useof different detectors operating under different prin-ciples, chromatography using different systems, andchemical reactions (e.g., derivatization of a functionalgroup followed by analysis) (Conacher 1990).
In any method, it is absolutely necessary to runreagent and substrate blanks to ensure that interfer-ing compounds are not being measured together withthe analytes. Substrate blanks should be run for eachcommodity examined.
Because carotenoids are measured by light ab-sorption in the visible region, few noncarotenoid in-terferences occur. Anthocyanins are soluble in wa-ter and are either not coextracted with carotenoidsor are removed during partition. Chlorophylls areeliminated by saponification; if saponification is notcarried out, the chromatographic step must be ableto separate chlorophylls from carotenoids. More com-mon problems are the interference of one carotenoidwith another during measurement or the erroneousidentification of one carotenoid as another.
The limit of detection is the lowest concentra-tion of an analyte that the analytic process can reli-ably differentiate from background levels. It has beengiven somewhat different definitions but in general isdefined as the (background) level measured in thesubstrate blank plus 3 standard deviations of thisbaseline level. The limit of determination is the lowestconcentration of an analyte that can be measuredwith a stated degree of confidence. It has been de-fined as the level measured in the substrate blankplus 10 standard deviations. Notwithstanding the defi-nitions, it is recommended that limits of detection anddetermination be established in practice from the re-sults of repeated analyses of spiked or endogenoussamples.
For analysis of major carotenoids, the limits ofdetection and determination do not have much use.These limits become important when the whole rangeof carotenoids in a sample is determined, particularlyfor the minor or trace carotenoids.
Method sensitivity is defined as the ratio of thechange in instrument signal to the change in analyteconcentration (i.e., the slope of the standard curve)and should not be confused with limit of detection.
The linear range is generally taken as the rangeover which the method has been demonstrated togive a linear detector or instrument response. Be-cause carotenoids are usually present in a specifiedfood at widely differing concentrations, the linearrange should be carefully assessed for the differentcarotenoids being quantified.
56 A Guide to Carotenoid Analysis in Foods
Scope refers to the number of different substratesto which the method can be successfully applied.Validated methods can be considered valid only forthe commodities that were successfully included inthe validation study. Applicability of the method toother foods should be demonstrated, both in terms ofthe matrix and the analyte concentration.
Horwitz (1982) insists that methods must beevaluated with their purpose in mind and that evalua-tion must balance between the level of scientific re-quirements and practical considerations of cost, time,and level of training required. Analysts must alwaysstrive to achieve the best accuracy and precisionpossible but must not lose sight of the fact that nor-mal (natural) variability of the commodity and theinherent limitations of bulk sampling may render avery high degree of accuracy and precision in themethod meaningless.
In carotenoid analysis, validation of methods hasnot been strongly advocated, even with the introduc-tion of high-performance liquid chromatography(HPLC), because the emphasis has been on chro-matographic separation. In the few papers involvingquantification, validation consisted mainly of recov-ery tests and determination of repeatability. Recov-ery of added carotenoids, however, should be con-sidered with caution. It indicates losses during thesteps after extraction but does not truly evaluate theextraction. Added carotenoids are more easily ex-tracted than endogenous carotenoids, which are pro-tected by the plant’s ultrastructure or are bound tothe matrix, and adsorption to the glass walls of thecontainer can occur. Internal standards (e.g., caro-tenoids not found in the sample, available in syntheticform) are sometimes used to correct for losses dur-ing analysis. It must be remembered, however, thatdifferent carotenoids have different stability, and therecovery percentage of the internal standard may notrepresent percentage retention of the sample’s caro-tenoids during analysis. In our laboratory, compari-son of the results obtained by open-column chroma-tography and HPLC methods gives a better appraisalof the reliability of the results. As with other types ofanalysis, repeatability results of various laboratoriesdemonstrate that the CV increases as the carotenoidconcentration decreases.
Interlaboratory studies strengthens confidence ina method and laboratory and often pinpoint the criti-cal or error-prone steps in the analytic process. Twoapproaches can be discerned in the literature: 1) aninterlaboratory study in which the participating labo-ratories analyze the same homogeneous sample, us-ing their own methods of choice, thus evaluating the
laboratories’ performance, including their ability tochoose the right method, and 2) a collaborativeinterlaboratory study, conducted according to theguidelines of AOAC, in which the same method isused by the participating laboratories, thus evaluatingthe method’s performance in an interlaboratory set-ting.
AOAC has set the following minimum require-ments for a collaborative study (Cunniff 1997): a mini-mum of five materials; a minimum of eight laborato-ries reporting valid data for each material; and a mini-mum of one replicate if within-laboratory repeatabil-ity parameters are not desired and two replicates ifthese parameters are required. Replication shouldordinarily be attained by blind replicates or split lev-els (Youden pairs).
Official AOAC methods are available only forcarotenes in fresh plant materials and silage and forcarotenes and xanthophylls in dried plant materialsand mixed feeds. Both methods are considered inad-equate to meet the current need for individual caro-tenoid determination.
The only published interlaboratory studies involv-ing individual carotenoid analysis were those con-ducted by Scott et al. (1996). Seventeen Europeanlaboratories assessed the accuracy of HPLC proce-dures for the determination of lutein, zeaxanthin, ly-copene, α-carotene, and β-carotene in a vegetablemix. Possible problem areas were investigated, in-cluding chromatographic systems, standardization ofcarotenoid stock solutions, extraction procedure, anddata handling. The results suggested that the effectof the chromatographic system is probably not amajor variable in measuring the carotenoid concen-tration. The standardization of the carotenoid stocksolution would not appear to be a significant problemin the more experienced laboratory, although therewere greater variations for lycopene calibration andmeasurement. Preliminary conclusions suggested thatthe preparation of the carotenoid extract may ac-count for about 13% of the overall variance of around23%.
Quality Assurance
Garfield (1991) defines quality control as plannedactivities to provide a quality product and qualityassurance as planned activities to ensure that thequality control activities are being properly imple-mented. The latter is the broad management conceptof maintaining the ability of a laboratory to furnishreliable information (Horwitz et al. 1980).
Quoting the U.S. Consumer Product Safety Com-mission, Garfield (1984) cites the following common
Method Validation and Quality Assurance 57
objectives of quality assurance programs:• to maintain a continuing assessment of the accu-
racy and precision of data generated by analystswithin the laboratory group,
• to provide a measure of the accuracy and preci-sion of analytic methods and to identify weak meth-odology,
• to detect training needs within the analytic group,• to provide a permanent record of instrument per-
formance as a basis for validating data and pro-jecting repair or replacement needs, and
• to upgrade overall quality of laboratory perfor-mance.
A quality assurance program should include,among other things, the following elements (Inhorn1978):• maintenance of skilled personnel, written and vali-
dated methods, and properly constructed, equipped,and maintained laboratory facilities;
• provision of representative samples and controls;• use of high-quality glassware, solvents, and other
testing materials;• calibration, adjustment, and maintenance of equip-
ment;• use of control samples and standard samples, with
proper records;• direct observation of the performance of certain
critical tests;• review and critique of results;
• tests of internal and external proficiency testing;• use of replicate samples;• comparison of replicate results with those of other
laboratories; and• monitoring of results.
The production of high-quality analytic data mustbe a commitment of any laboratory. However, thespecific objectives and application of a quality assur-ance program will vary from one laboratory to an-other and will depend on the laboratory’s size, com-plexity, purpose, and budget, although all programsshould incorporate some basic recognized practicesand procedures. Small laboratories can operate witha minimal but suitable program if supervisory per-sonnel are aware of what is necessary to achievequality results, staffing levels are adequate, and nec-essary expertise exists (Garfield 1984). The AOACLaboratory Quality Assurance Committee developeda quality assurance checklist to serve as a guide forsmall laboratories (AOAC 1992). The Food and Ag-riculture Organization of the United Nations publisheda manual on quality assurance in the food controlchemical laboratory (FAO 1993).
Quality assurance activities have associatedcosts, but the benefits of improved laboratory cred-ibility and staff moral and the savings in not having toreanalyze, correct, or even discard unreliable data ormisjudged product samples will justify the cost of theprogram (Garfield 1991).
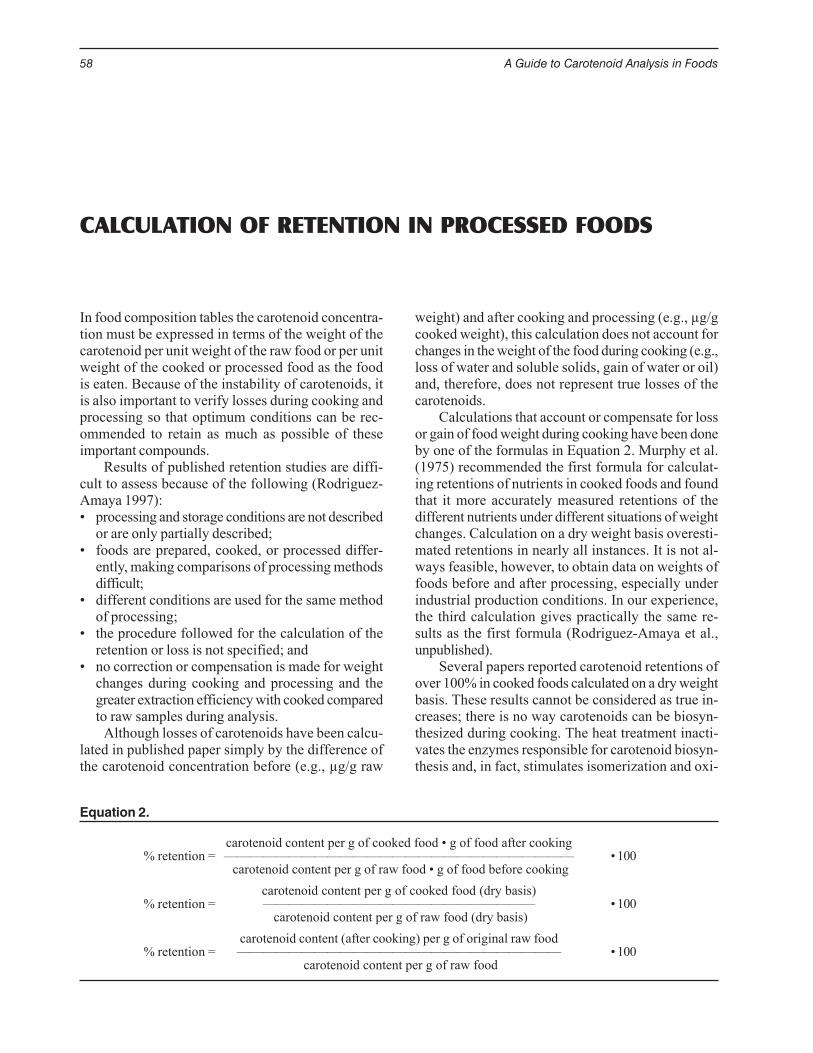
58 A Guide to Carotenoid Analysis in Foods
CALCULATION OF RETENTION IN PROCESSED FOODS
In food composition tables the carotenoid concentra-tion must be expressed in terms of the weight of thecarotenoid per unit weight of the raw food or per unitweight of the cooked or processed food as the foodis eaten. Because of the instability of carotenoids, itis also important to verify losses during cooking andprocessing so that optimum conditions can be rec-ommended to retain as much as possible of theseimportant compounds.
Results of published retention studies are diffi-cult to assess because of the following (Rodriguez-Amaya 1997):• processing and storage conditions are not described
or are only partially described;• foods are prepared, cooked, or processed differ-
ently, making comparisons of processing methodsdifficult;
• different conditions are used for the same methodof processing;
• the procedure followed for the calculation of theretention or loss is not specified; and
• no correction or compensation is made for weightchanges during cooking and processing and thegreater extraction efficiency with cooked comparedto raw samples during analysis.
Although losses of carotenoids have been calcu-lated in published paper simply by the difference ofthe carotenoid concentration before (e.g., µg/g raw
weight) and after cooking and processing (e.g., µg/gcooked weight), this calculation does not account forchanges in the weight of the food during cooking (e.g.,loss of water and soluble solids, gain of water or oil)and, therefore, does not represent true losses of thecarotenoids.
Calculations that account or compensate for lossor gain of food weight during cooking have been doneby one of the formulas in Equation 2. Murphy et al.(1975) recommended the first formula for calculat-ing retentions of nutrients in cooked foods and foundthat it more accurately measured retentions of thedifferent nutrients under different situations of weightchanges. Calculation on a dry weight basis overesti-mated retentions in nearly all instances. It is not al-ways feasible, however, to obtain data on weights offoods before and after processing, especially underindustrial production conditions. In our experience,the third calculation gives practically the same re-sults as the first formula (Rodriguez-Amaya et al.,unpublished).
Several papers reported carotenoid retentions ofover 100% in cooked foods calculated on a dry weightbasis. These results cannot be considered as true in-creases; there is no way carotenoids can be biosyn-thesized during cooking. The heat treatment inacti-vates the enzymes responsible for carotenoid biosyn-thesis and, in fact, stimulates isomerization and oxi-
Equation 2.
carotenoid content per g of cooked food • g of food after cooking% retention = ——————————————————————————— • 100
carotenoid content per g of raw food • g of food before cookingcarotenoid content per g of cooked food (dry basis)
% retention = ————————————————————— • 100 carotenoid content per g of raw food (dry basis)
carotenoid content (after cooking) per g of original raw food% retention = ————————————————————————— • 100
carotenoid content per g of raw food
Calculation of Retention in Processed Foods 59
dative degradation of carotenoids. These alleged in-creases could simply be due to the greater ease withwhich carotenoids are extracted from cooked or pro-cessed samples compared with carotenoids in freshfoods, where they are physically protected or com-bined with other food components. Extraction effi-ciency of fresh samples must be enhanced to make itas equivalent as possible to that of cooked samples(such as soaking the sample in water or extractingsolvent before extraction), and extraction must beexhaustive. Apparent increases may also be due toappreciable leaching of soluble solids, as in carrots,concentrating the carotenoids per unit weight of food.Calculating the retention on the insoluble solid basishas been proposed in this case. Moreover, enzymaticoxidation of carotenoids can substantially lower theirconcentrations in raw samples, especially when thesesamples are left standing for some time after beingcut or grated.
In studies on retention it is important to specifythe processing and storage conditions (time, tempera-ture, etc.). Paired samples (i.e., equivalent raw andcooked samples) must be used to offset variationsdue to varietal differences, seasonal or climatic ef-fects, degree of maturity, nonuniform distribution ofcarotenoid in the food or food lot, etc. Speek et al.(1988), for example, prepared samples of leafy veg-etables by systematically picking leaves off the stalkfrom the top to the roots, alternately dividing theminto two portions. One portion was analyzed raw andthe other after processing. In our laboratory, fruits orfruits vegetables are quartered longitudinally; twoopposite sections are taken for analysis of rawsamples and the other two opposite sections are sub-mitted to processing before analysis.
It is also recommended that results be analyzedstatistically so that the true meaning of the resultscan be appreciated.
60 A Guide to Carotenoid Analysis in Foods
REFERENCES
ACS Committee on Environmental Improvement (1980)Guidelines for data acquisition and data quality evalu-ation in environmental chemistry. Anal Chem52:2242-2249
AOAC International (1992) Quality assurance checklist forsmall laboratories. Referee 16(11):13
Adewusi SRA, Bradbury JH (1993) Carotenoids in cassava:comparison of open-column and HPLC methods ofanalysis. J Sci Food Agric 62:375-383
Aina JO (1990) Physico-chemical changes in African mango(Irvingia gabonensis) during normal storage ripen-ing. Food Chem 36:205-212
Arima HK, Rodriguez-Amaya DB (1988) Carotenoid com-position and vitamin A value of commercial Braziliansquashes and pumpkins. J Micronutr Anal 4:177-191
Arima HK, Rodriguez-Amaya DB (1990) Carotenoid com-position and vitamin A value of a squash and a pump-kin from Northeastern Brasil. Arch Latinoam Nutr40:284-292
Bickoff EM, Atkins ME, Bailey GF, Stitt F (1949) Stereoiso-meric analysis of β-carotene. J Assoc Off Anal Chem32:766-774
Britton G (1991) Carotenoids. Methods Plant Biochem7:473-518
Britton G (1995) UV/visible spectroscopy. In Britton G,Liaaen-Jensen S, Pfander H (eds), Carotenoids: spec-troscopy, vol 1B. Birkhäuser Verlag, Basel, pp 13-63
Bureau JL, Bushway RJ (1986) HPLC determination of caro-tenoids in fruits and vegetables in the United States.J Food Sci 51:128-130
Burton GW (1989) Antioxidant action of carotenoids. J Nutr119:109-111
Bushway RJ (1985) Separation of carotenoids in fruits andvegetables by high performance liquid chromatogra-phy. J Liquid Chromatogr 8:1527-1547
Bushway RJ, Wilson AM (1982) Determination of α- and β-carotene in fruits and vegetables by high-performanceliquid chromatography. Can Inst Food Sci Technol J15:165-169
Carvalho PRN, Collins CH, Rodriguez-Amaya DB (1992)Comparison of provitamin A determination by nor-mal-phase gravity-flow column chromatography andreversed-phase high performance liquid chromatog-raphy. Chromatographia 33:133-137
Cavalcante ML, Rodriguez-Amaya DB (1992) Carotenoidcomposition of the tropical fruits Eugenia uniflora andMalpighia glabra. In Charalambous G (ed), Food sci-ence and human nutrition. Elsevier Science Publish-
ers, Amsterdam, pp 643-650Chandler LA, Schwartz SJ (1987) HPLC separation of cis-
trans carotene isomers in fresh and processed fruitsand vegetables. J Food Sci 52:669-672
Chandler LA, Schwartz SJ (1988) Isomerization and lossesof trans-β-carotene in sweet potatoes as affected byprocessing treatments. J Agric Food Chem 36:129-133.
Chen BH, Chen YY (1992) Determination of carotenoidsand chlorophylls in water convolvulus (Ipomoeaaquatica) by liquid chromatography. Food Chem45:129-134
Chen BH, Peng HY, Chen HE (1995) Changes of caro-tenoids, color, and vitamin A contents during process-ing of carrot juice. J Agric Food Chem 43:1912-1918
Conacher HBS (1990) Validation of methods used in crisissituations: task force report. J Assoc Off Anal Chem73:332-334
Craft NE (1992) Carotenoid reversed-phase high perfor-mance liquid chromatography methods: referencecompendium. Methods Enzymol 213:185-205
Craft NE, Soares JH Jr (1992) Relative solubility, stability,and absorptivity of lutein and β-carotene in organicsolvents. J Agric Food Chem 40:431-434
Craft NE, Sander LC, Pierson HF (1990) Separation andrelative distribution of all-trans-β-carotene and its cisisomers in ß-carotene preparations. J Micronutr Anal8:209-221
Craft NE, Wise SA, Soares JH Jr (1992) Optimization of anisocratic high-performance liquid chromatographicseparation of carotenoids. J Chromatogr 589:171-176
Craft NE, Wise AS, Soares JH Jr (1993) Individual caro-tenoid content of SRM 1548 total diet and influence ofstorage temperature, lyophilization, and irradiationon dietary carotenoids. J Agric Food Chem 41:208-213
Cunniff P, ed (1997) Official methods of analysis of AOACinternational, 16th ed, vol 1. AOAC International,Gaithersburg, MD
Davies, BH (1976) Carotenoids. In Goodwin TW (ed), Chem-istry and biochemistry of plant pigments, 2nd ed, vol2, Academic Press, London, pp 38-165
Di Mascio P, Kaiser S, Sies H (1989) Lycopene as the mostefficient biological carotenoid singlet oxygenquencher. Arch Biochem Biophys 274:532-538
El-Tinay AH, Chichester CO (1970) Oxidation of ß-caro-tene. Site of initial attack. J Org Chem 35:2290-2293
References 61
Emenhiser C, Sander LC, Schwartz SJ (1995) Capability ofa polymeric C30 stationary phase to resolve cis-transcarotenoid isomers in reversed-phase liquid chro-matography. J Chromatogr A 707:205-216
Emenhiser C, Englert G, Sander LC, et al (1996a) Isolationand structural elucidation of the predominant geo-metrical isomers of α-carotene. J Chromatogr A719:333-343
Emenhiser C, Simunovic N, Sander LC, Schwartz SJ(1996b) Separation of geometrical carotenoid iso-mers in biological extracts using a polymeric C30 col-umn in reversed-phase liquid chromatography. J AgricFood Chem 44:3887-3893
Englert G (1995) NMR spectroscopy. In Britton G, Liaaen-Jensen S, Pfander H (eds), Carotenoids: spectros-copy, vol 1B. Birkhäuser Verlag, Basel, pp 147-260
Enzell CR, Back S (1995) Mass spectroscopy. In Britton G,Liaaen-Jensen S, Pfander H (eds), Carotenoids: spec-troscopy, vol 1B. Birkhäuser Verlag, Basel, pp 261-320
Epler KS, Sander LC, Ziegler RG, et al (1992) Evaluation ofreversed-phase liquid chromatographic columns forrecovery and selectivity of selected carotenoids. JChromatogr 595:89-101
Eugster CH (1995) Chemical derivatization: microscale testsfor the presence of common functional groups in caro-tenoids. In Britton G, Liaaen-Jensen S, Pfander H(eds), Carotenoids: isolation and analysis, vol 1A.Birkhäuser Verlag, Basel, pp 71-80
Ezell BD, Wilcox MS (1962) Loss of carotene in fresh veg-etables as related to wilting and temperature. J AgricFood Chem 10:124-126
FAO (1993) Manual of food quality control 14. Quality as-surance in the food control chemical laboratory. Foodand Agriculture Organization of the United Nations,Rome
Flügel M, Gross J (1982) Pigment and plastid changes inmesocarp and exocarp of ripening muskmelonCucumis melo cv. Galia. Angew Botanik 56:393-406
Foote CS, Chang YC, Denny RW (1970) Chemistry of sin-glet oxygen X. Carotenoid quenching parallels bio-logical protection. J Am Oil Chem Soc 92:5216-5218
Garfield FM (1984) Quality assurance principles for analyti-cal laboratories. Association of Official AnalyticalChemists, Arlington
Garfield FM (1991) Quality assurance principles for analyti-cal laboratories. AOAC International, Arlington
Godoy HT, Rodriguez-Amaya DB (1987) Changes in indi-vidual carotenoids on processing and storage ofmango (Mangifera indica) slices and puree. Int J FoodSci Technol 22:451-460
Godoy HT, Rodriguez-Amaya DB (1991) Comportamentodos carotenóides de purê de mamão (Carica papaya)sob processamento e estocagem. Cienc Tecnol Ali-ment 11:210-220
Godoy HT, Rodriguez-Amaya DB (1994) Occurrence of cis-isomers of provitamins A in Brazilian fruits. J AgricFood Chem 42:1306-1313
Godoy HT, Rodriguez-Amaya DB (1995a) Buriti (Mauritiavinifera Mart), uma fonte riquíssima de pró-vitaminaA. Arq Biol Tec 38:109-120
Godoy HT, Rodriguez-Amaya DB (1995b) Carotenoid com-position and vitamin A value of Brazilian loquat(Eriobotrya japonica Lindl.). Arch Latinoam Nutr
45:336-339Godoy HT, Rodriguez-Amaya DB (1998) Occurrence of cis-
isomers of provitamin A in Brazilian vegetables. JAgric Food Chem 46:3081-3086
Godoy HT, Rodriguez-Amaya DB, Connor AE, Britton G(1990) Confirmation of the structure of papaya ß-cryp-toxanthin monoepoxide. Food Chem 36:281-286
Gross J (1982a) Changes of chlorophylls and carotenoidsin developing strawberry fruits (Fragaria anonassa) cv.Tenira. Gartenbauwiss 47:142-144
Gross J (1982b) Pigment changes in the pericarp of theChinese goosebery or kiwi fruit (Actinidia chinensis)cv. Bruno during ripening. Gartenbauwiss 47:162-167
Gross J (1982/83). Chlorophyll and carotenoid pigments inRibes fruits. Sci Hort 18:131-136
Gross J (1984) Carotenoid pigments in three plum culti-vars. Gartenbauwiss 49:18-21
Gross J (1985) Carotenoid pigments in the developing cherry(Prunus avium). cv. ‘Dönissen’s Gelbe’.Gartenbauwiss 50:88-90
Gross J (1987) Pigments in fruits. Academic Press, LondonGross J (1991) Pigments in vegetables. Chlorophylls and
carotenoids. Avi:Van Nostrand Reinhold CompanyInc, New York
Gross J, Ikan R, Eckhardt G (1983) Carotenoids of the fruit ofOverrhoa carambola. Phytochemistry 22:1479-1481
Hart DJ, Scott KJ (1995) Development and evaluation of anHPLC method for the analysis of carotenoids in foods,and the measurement of the carotenoid content ofvegetables and fruits commonly consumed in the UK.Food Chem 54:101-111
Heinonen MI (1990) Carotenoids and provitamin A activityof carrot (Daucus carota L.) cultivars. J Agric FoodChem 38:609-612
Heinonen MI, Ollilainen V, Linkola EK, et al (1989) Caro-tenoids in Finnish foods: vegetables, fruits, and ber-ries. J Agric Food Chem 37:655-659
Horwitz W (1982) Evaluation of analytical methods used forregulation. J Assoc Off Anal Chem 65:525-530
Horwitz W (1988) Sampling and preparation of sample forchemical examination. J Assoc Off Anal Chem71:241-245
Horwitz W, Kamps LR, Boyer KW (1980) Quality assurancein the analysis of foods for trace constituents. J AssocOff Anal Chem 63:1344-1354
Hulshof PJM, Xu C, van de Bovenkamp P, et al (1997) Appli-cation of a validated method for the determination ofprovitamin A carotenoids in Indonesian foods of dif-ferent maturity and origin. J Agric Food Chem45:1174-1179
Huyskens S, Timberg R, Gross J (1985) Pigment and plas-tid ultra-structural changes in kumquat (Fortunellamargarita) “Nagami” during ripening. J Plant Physiol118:61-72
Inhorn SL, ed (1978) Quality assurance practices for healthlaboratories. American Public Health Service, NewYork
John J, Subbarayan C, Cama HR (1970) Carotenoids in 3stages of ripening of mango. J Food Sci 35:262-265
Keith LH, Crummet W, Deegan J Jr, et al (1983) Principles ofenvironmental analysis. Anal Chem 55:2210-2218
Khachik F, Beecher GR, Whitaker NF (1986) Separation,identification, and quantification of the major caro-
62 A Guide to Carotenoid Analysis in Foods
tenoid and chlorophyll constituents in extracts of sev-eral green vegetables by liquid chromatography. JAgric Food Chem 34:603-616
Khachik F, Beecher GR, Vanderslice JT, Furrow G (1988)Liquid chromatographic artifacts and peak distortion:sample-solvent interactions in the separation of caro-tenoids. Anal Chem 60:807-811
Khachik F, Beecher GR, Lusby WR (1989) Separation, iden-tification, and quantification of the major carotenoidsin extracts of apricots, peaches, cantaloupe, and pinkgrapefruit by liquid chromatography. J Agric FoodChem 37:1465-1473
Khachik F, Beecher GR, Goli MB, Lusby WR (1992a) Sepa-ration and quantification of carotenoids in foods. Meth-ods Enzymol 213:347-359
Khachik F, Goli MB, Beecher GR, et al (1992b) Effect of foodpreparation on qualitative and quantitative distribu-tion of major carotenoid constituents of tomatoes andseveral green vegetables. J Agric Food Chem 40:390-398
Kimura M, Rodriguez-Amaya DB, Godoy HT (1990) Assess-ment of the saponification step in the quantitativedetermination of carotenoids and provitamins A. FoodChem 35:187-195
Kimura M, Rodriguez-Amaya DB, Yokoyama SM (1991)Cultivar differences and geographic effects on thecarotenoid composition and vitamin A value of pa-paya. Lebens Wissen Technol 24:415-418
Konings EJM, Roomans HHS (1997) Evaluation and vali-dation of an LC method for the analysis of carotenoidsin vegetables and fruit. Food Chem 59:599-603.
Kopas-Lane LM, Warthesen JJ (1995) Carotenoid photo-stability in raw spinach and carrots during cold stor-age. J Food Sci 60:773-776
Koskitalo LN, Ormrod DP (1972) Effects of sub-optimal rip-ening temperatures on the color quality and pigmentcomposition of tomato fruit. J Food Sci 37:56-59
Kramer A, Twigg BA (1970) Fundamentals of quality controlfor the food industry, 3rd ed, vol 1, Avi Publishing Co,Westport, CT
Kratochvil B, Taylor JK (1981) Sampling for chemical analy-sis. Anal Chem 53:924A-926A, 928A, 930A, 932A,934A, 936A, 938A
Krinsky NI (1989) Antioxidant functions of carotenoids. FreeRadical Biol Med 7:617-635
Lesellier E, Marty C, Berset C, Tchapla A (1989) Optimiza-tion of the isocratic non-aqueous reverse phase(NARP) HPLC separation of trans/cis-α- and β-carotenes. J High Resolut Chromatogr 12:447-454
Lessin WJ, Catigani GL, Schwartz SJ (1997) Quantificationof cis-trans isomers of provitamin A carotenoids infresh and processed fruits and vegetables. J AgricFood Chem 45:3728-3732
Liaaen-Jensen S (1971) Isolation, reactions. In Isler O. (ed),Carotenoids. Birkhäuser Verlag, Basel, pp 61-188
Lietz G, Henry CJK (1997) A modified method to minimiselosses of carotenoids and tocopherols during HPLCanalysis of red palm oil. Food Chem 60:109-117
Lin SD, Chen AO (1995) Major carotenoids in juices ofponkan mandarin and liucheng orange. J FoodBiochem 18:273-283
Lynch JM (1998) Use of AOAC International method perfor-mance statistics in the laboratory. J AOAC Int 81:679-684
Mantoura RFC, Wright SW, Jeffrey SW, et al (1997) Filtrationand storage of pigments from microalgae. In JeffreySW, Mantoura RFC, Wright SW (eds), Phytoplanktonpigments in oceanography: guidelines to modernmethods. UNESCO Publishing, Paris, pp 283-305
Mercadante AZ, Rodriguez-Amaya DB (1990) Carotenoidcomposition and vitamin A value of some native Bra-zilian green leafy vegetables. Int J Food Sci Technol25:213-219
Mercadante AZ, Rodriguez-Amaya DB (1991) Carotenoidcomposition of a leafy vegetable in relation to someagricultural variables. J Agric Food Chem 39:1094-1097
Mercadante AZ, Rodriguez-Amaya DB (1998) Effects of rip-ening, cultivar differences, and processing on thecarotenoid composition of mango. J Agric Food Chem46:128-130
Mercadante AZ, Steck A, Rodriguez-Amaya DB, et al (1996)Isolation of methyl (9’Z)-apo-6'-lycopenoate from Bixaorellana. Phytochemistry 41:1201-1203
Mercadante AZ, Rodriguez-Amaya DB, Britton G (1997a)HPLC and mass spectrometric analysis of carotenoidsfrom mango. J Agric Food Chem 45:120-123
Mercadante AZ, Steck A, Pfander H (1997b) Isolation andidentification of new apocarotenoids from annatto(Bixa orellana) seeds. J Agric Food Chem 45:1050-1054
Mercadante AZ, Britton G, Rodriguez-Amaya DB (1998)Carotenoids from yellow passion fruit (Passifloraedulis). J Agric Food Chem 46:4102-4106
Mercadante AZ, Steck A, Pfander H (1999) Carotenoidsfrom guava (Psidium guajava L.): isolation and struc-ture elucidation. J Agric Food Chem 47:145-151
Mínguez-Mosquera MI, Garrido-Fernandez J (1989) Chlo-rophyll and carotenoid presence in olive fruit. J AgricFood Chem 37:1-7
Mínguez-Mosquera MI, Garrido-Fernández J, Gandul-RojasB (1989) Pigment changes in olives during fermenta-tion and brine storage. J Agric Food Chem 37:8-11
Murphy EW, Criner PE, Gray BC (1975) Comparisons ofmethods for calculating retentions of nutrients incooked foods. J Agric Food Chem 23:1153-1157
Nelis HJCF, Leenheer AP de (1983) Isocratic nonaqueousreversed-phase liquid chromatography of caro-tenoids. Anal Chem 55:270-275
O’Neil CA, Schwartz SJ (1992) Chromatographic analysisof cis-trans carotenoid isomers. J Chromatogr624:235-252
O’Neil CA, Schwartz SJ, Catignani GL (1991) Comparisonof liquid chromatographic methods for determinationof cis-trans isomers of β-carotene. J Assoc Off AnalChem 74:36-42
Padula M, Rodriguez-Amaya DB (1986) Characterizationof the carotenoids and assessment of the vitamin Avalue of Brazilian guavas (Psidium guajava L.). FoodChem 20:11-19
Padula M, Rodriguez-Amaya DB (1987) Changes in indi-vidual carotenoids and vitamin C on processing andstorage of guava juice. Acta Alimentaria 16:209-216
Palozza P, Krinsky NI (1992) Antioxidant effects of caro-tenoids in vivo and in vitro:An overview. MethodsEnzymol 213:403-420
Park YW (1987) Effect of freezing, thawing, drying, and cook-ing on carotene retention in carrots, broccoli, and
References 63
spinach. J Food Sci 52:1022-1025Pettersson A, Jonsson L (1990) Separation of cis-trans iso-
mers of alpha- and beta-carotene by adsorption HPLCand identification with diode array detection. JMicronutr Anal 8:23-41
Pfander H, Riesen R (1995) Chromatography: part IV high-performance liquid chromatography. In Britton G,Liaaen-Jensen S, Pfander H (eds), Carotenoids: iso-lation and analysis, vol 1A. Birkhäuser Verlag, Basel,pp 145-190
Pfander H, Riesen R, Niggli U (1994) HPLC and SFC ofcarotenoids scope and limitations. Pure Appl Chem66:947-954.
Pocklington WD (1990) Harmonized protocols for the adop-tion of standardized analytical methods and for thepresentation of their performance characteristics. PureAppl Chem 62:149-162.
Pomeranz Y, Meloan CE (1994) Food analysis: theory andpractice, 3rd ed. Chapman & Hall, New York
Porsch B (1993) Experimental consequences of differencesbetween composition of the sample solvent and ofthe mobile phase in HPLC. J Liquid Chromatogr16:3409-3421
Quackenbush FW, Smallidge RL (1986) Nonaqueous re-verse phase liquid chromatographic system forseparation and quantitation of provitamins A. J AssocOff Anal Chem 69:767-772
Rahman FMM, Buckle KA (1980) Pigment changes in cap-sicum cultivars during maturation and ripening. J FoodTechnol 15:241-249
Ramos DMR, Rodriguez-Amaya DB (1987) Determinationof the vitamin A value of common Brazilian leafy veg-etables. J Micronutr Anal 3:147-155
Ramos DMR, Rodriguez-Amaya DB (1993) Avaliação dasperdas de carotenóides e valor de vitamina A du-rante desidratação e liofilização industrial deespinafre. Arq Biol Tecnol 36:83-94
Raymundo LC, Griffiths AE, Simpson KL (1967) Effect ofdimethyl sulfoxide (DMSO) on the biosynthesis ofcarotenoids in detached tomatoes. Phytochemistry6:1527-1532
Riso P, Porrini M (1997) Determination of carotenoids invegetable foods and plasma. Int J Vitam Nutr Res67:47-54
Rodriguez-Amaya DB (1989) Critical review of provitamin Adetermination in plant foods. J Micronutr Anal 5:191-225
Rodriguez-Amaya DB (1990) Provitamin A determination—problems and possible solutions. Food Nutr Bull12:246-250
Rodriguez-Amaya DB (1993). Nature and distribution ofcarotenoids in foods. In Charalambous G (ed), Shelf-life studies of foods and beverages. Chemical, bio-logical, physical and nutritional aspects. Elsevier Sci-ence Publishers, Amsterdam, pp 547-589
Rodriguez-Amaya DB (1996) Assessment of the provitaminA contents of foods—the Brazilian experience. J FoodComp Anal 9:196-230
Rodriguez-Amaya DB (1997) Carotenoids and food prepa-ration: the retention of provitamin A carotenoids inprepared, processed, and stored foods. OMNI, Wash-ington DC.
Rodriguez-Amaya DB, Kimura M (1989) Carotenóides evalor de vitamina A em cajá (Spondias lutea). Cienc
Tecnol Aliment 9:148-162Rodriguez-Amaya DB, Amaya-Farfan J (1992) Estado ac-
tual de los metodos analiticos para determinarprovitamina A. Arch Latinoam Nutr 42:180-191
Rodriguez-Amaya DB, Tavares CA (1992) Importance ofcis-isomer separation in determining provitamin A intomato and tomato products. Food Chem 45:297-302
Rodriguez-Amaya DB, Simpson KL, Chichester CO (1973)The biosynthesis of astaxanthin XVII. Intermediatesin the conversion of β-carotene. Int J Biochem 4:213-222
Rodriguez-Amaya DB, Lee TC, Chichester CO (1975) Com-parative study of the carotenoid composition of theseeds of ripening Momordica charantia and toma-toes. Plant Physiol 56:626-629.
Rodriguez-Amaya DB, Raymundo LC, Lee TC, et al (1976a)Carotenoid pigment changes in ripening Momordicacharantia fruits. Ann Bot 40:615-624
Rodriguez-Amaya DB, Tanaka Y, Katayama T, et al (1976b)Hydroxylation of β-carotene on micro-cel C. J AgricFood Chem 24:819-822
Rodriguez-Amaya DB, Bobbio PA, Bobbio FO (1983) Caro-tenoid composition and vitamin A value of the Brazil-ian fruit Cyphomandra betacea. Food Chem 12:61-65
Rodriguez-Amaya DB, Kimura M, Godoy HT, Arima HK(1988) Assessment of provitamin A determination byopen column chromatography/visible absorptionspectrophotometry. J Chromatogr Sci 26:624-629
Rouchaud J, Moons C, Meyer JA (1984) Effects of pesticidetreatments on the carotenoid pigments of lettuce. JAgric Food Chem 32:1241-1245
Rouseff RL, Sadler GD, Putnam TJ, Davis JE (1992) Deter-mination of β-carotene and other hydrocarbon caro-tenoids in red grapefruit cultivars. J Agric Food Chem40:47-51
Sander LC, Craft NE (1990) Device for subambient tem-perature control in liquid chromatography. Anal Chem62:1545-1547
Sander LC, Sharpless KE, Craft NE, Wise SA (1994) Devel-opment of engineered stationary phases for the sepa-ration of carotenoid isomers. Anal Chem 66:1667-1674
Schiedt K, Liaaen-Jensen S (1995) Isolation and analysis.In Britton G, Liaaen-Jensen S, Pfander H. (eds),Carotenoids:isolation and analysis, vol 1A.Birkhäuser Verlag, Basel, pp 81-108
Schmitz HH, van Breemen RB, Schwartz SJ (1992) Fast-atom bombardment and continuous-flow fast-atombombardment mass spectrometry in carotenoidanalysis. Methods Enzymol 213:322-336
Schmitz HH, Emenhiser C, Schwartz SJ (1995) HPLC sepa-ration of geometric carotene isomers using a calciumhydroxide stationary phase. J Agric Food Chem43:1212-1218
Scott KJ (1992) Observations on some of the problems as-sociated with the analysis of carotenoids in foods byHPLC. Food Chem 45:357-364
Scott KJ, Hart DJ (1993) Further observations on problemsassociated with the analysis of carotenoids by HPLC—2: Column temperature. Food Chem 47:403-405
Scott KJ, Finglass PM, Seale R, et al (1996) Interlaboratorystudies of HPLC procedures for the analysis of caro-
64 A Guide to Carotenoid Analysis in Foods
tenoids in foods. Food Chem 57:85-90Simonetti, P, Porrini M, Testolin G (1991) Effect of environ-
mental factors and storage on vitamin content of Pisumsativum and Spinacea oleracea. Italian J Food Sci3:187-196
Speek AJS, Speek-Saichua S, Schreurs WHP (1988) Totalcarotenoid and β-carotene contents of Thai veg-etables and the effect of processing. Food Chem27:245-257
Sweeney JP, Marsh AC (1971) Effect of processing on pro-vitamin A in vegetables. J Am Diet Assoc 59:238-243.
Takama F, Saito S (1974) Studies on the storage of veg-etables and fruits II. Total carotene content of sweetpepper, carrot, leek and parsley during storage. J AgricSci (Japan) 19:11
Tanaka Y, KatayamaT, Simpson KL, Chichester CO (1981)Stability of carotenoids on silica gel and other adsor-bent. Bull Jpn Soc Fish 46:799
Tavares CA, Rodriguez-Amaya DB (1994) Carotenoid com-position of Brazilian tomatoes and tomato products.Lebens Wiss Technol 27:219-224
Terão J (1989) Antioxidant activity of β-carotene-relatedcarotenoids in solution. Lipids 24:659-661
Taylor RF (1983) Chromatography of carotenoids andretinoids. Adv Chromatogr 22:157-213
Thomas P, Janave MT (1975) Effects of gamma irradiationand storage temperature on carotenoids and ascor-bic acid content of mangoes on ripening. J Sci FoodAgric 26:1503-1512
Tonucci LH, Holden JM, Beecher GR, et al (1995) Caro-tenoid content of thermally processed tomato-basedfood products. J Agric Food Chem 43:579-586
Tsukida K (1992) Separation of isomers of cis-β-carotenes.Methods Enzymol 213:291-305
Tsukida K, Saiki K, Sugiura M (1981) Structural elucidationof the main cis-β-carotenes. J Nutr Sci Vitaminol27:551-561
Tsukida K, Saiki K, Takii T, Koyama Y (1982) Separation and
determination of cis/trans-β-carotenes by high per-formance liquid chromatography. J Chromatogr245:359-364
Van Breemen RB (1996) Innovations in carotenoid analysisusing LC/MS. Anal Chem 68:299A-304A
Van Breemen RB (1997) Liquid chromatography/mass spec-trometry of carotenoids. Pure Appl Chem 69:2061-2066
Van Breemen RB, Schmitz HH, Schwartz SJ (1995) Fastatom bombardment tandem mass spectrometry ofcarotenoids. J Agric Food Chem 43:384-389
Van Calsteren MR, Bissonnette MC, Cormier F, et al (1997)Spectroscopic characterization of crocetin derivativesfrom Crocus sativus and Gardenia jasminoides. J AgricFood Chem 45:1055-1061.
Walpole RE, Myers R (1972) Probability and statistics forengineers and scientists. Macmillan, New York
Wilberg VC, Rodriguez-Amaya DB (1995) HPLC quantitationof major carotenoids of fresh and processed guava,mango and papaya. Lebensm Wiss Technol 28:474-480
Wills RBH, Rangga A (1996) Determination of carotenoidsin Chinese vegetables. Food Chem 56:451-455
Wu Y, Perry AK, Klein BP (1992) Vitamin C and β-carotenein fresh and frozen green beans and broccoli in asimulated system. J Food Qual 15:87-96
Young A, Britton G (1990) Carotenoids and stress. In AlscherRG, Cumming JR (eds), Stress responses in plants:adaptation and acclimation mechanisms. Plant Biol-ogy, vol 12. Wiley-Liss Inc, New York
Zapata M, Garrido JL (1991) Influence of injection condi-tions in reversed-phase high-performance liquid chro-matography of chlorophylls and carotenoids.Chromatographia 31:589-594
Zapata M, Ayala AM, Franco JM, Garrido JL (1987) Separa-tion of chlorophylls and degradation products in ma-rine phytoplankton by reversed-phase high-perfor-mance liquid chromatography. Chromatographia23:26-30
A GUIDE TOCAROTENOIDANALYSIS INFOODS
Delia B. Rodriguez-Amaya, Ph.D.
This publication is made possible bysupport from Opportunities for Micronutri-ent Interventions (OMNI) Research, a projectof the Office of Health and Nutrition, Bureauof Global Programs, Field Support and Re-search, the U.S. Agency for InternationalDevelopment (USAID) under cooperativeagreement HRN-5122-A-00-3046-00 with theInternational Life Sciences Institute (ILSI)Research Foundation.
The information presented herein doesnot necessarily reflect the scientific recom-mendations or views of OMNI Research,USAID, or ILSI.
Additional copies of this and otherOMNI Research publications are availablefree of charge to developing countries andfor US$3.50 to developed countries. Copiescan be ordered from OMNI Research at:
OMNI ResearchILSI Human Nutrition InstituteOne Thomas Circle, NWWashington, DC 20005-5802, USAEmail: [email protected]: hni.ilsi.org/publications
A G
UID
E TO C
ARO
TENO
ID A
NALYSIS IN
FOO
DS
RO
DRIG
UEZ-A
MAYA