Embed Size (px)
Citation preview

WORLD LEADER INAA, ICP-OESAND ICP-MS
For a complete listing of our global offices, visit www.perkinelmer.com/ContactUs
Copyright ©2008-2013, PerkinElmer, Inc. All rights reserved. PerkinElmer® is a registered trademark of PerkinElmer, Inc. All other trademarks are the property of their respective owners. 008044D_01
PerkinElmer, Inc. 940 Winter Street Waltham, MA 02451 USA P: (800) 762-4000 or (+1) 203-925-4602www.perkinelmer.com
PerkinElmer has been at the forefront of inorganic analytical technology for over 50 years. With a comprehensive product line that includes Flame AA systems, high-performance Graphite Furnace AA systems, flexible ICP-OES systems and the most powerful ICP-MS systems, we can provide the ideal solution no matter what the specifics of your application.
We understand the unique and varied needs of the customers and markets we serve. And we provide integrated solutions that streamline and simplify the entire process from sample handling and analysis to the communication of test results.
With tens of thousands of installations worldwide, PerkinElmer systems are performing inorganic analyses every hour of every day. Behind that extensive network of products stands the industry’s largest and most-responsive technical service and support staff. Factory-trained and located in 150 countries, they have earned a reputation for consistently delivering the highest levels of personalized, responsive service in the industry.
The Most Trusted Name in Elemental Analysis
Atomic SpectroscopyA Guide to Selecting the Appropriate Technique and System
For more product information, visit:www.perkinelmer.com/atomicspectroscopy

Titan MPS™ Microwave Sample Preparation System
• Flexible, cost-effective solution for pressure digestion of a broad range of samples
• Connection-free and contact-free temperature/pressure sensing for ultimate ease-of-use
• Strong and durable digestion vessels are easy to use and warrantied for one year
Autosamplers
• Flexible rack configurations
• Fast, accurate random access
• Corrosion-resistant sampling components
• Flow-through rinse station to minimize sample-to-sample contamination
Mercury Hydride System
• Highly sensitive determination of Mercury or hydride-forming elements
FIAS
Fully automated flow-injection system
• Simplifies and speeds up analyses requiring complex sample preparation such as Mercury and other hydride-forming elements
High-Throughput Sample- Introduction System
• Minimizes sample uptake and washout time
• Throughput increased up to 2-3 fold
• Eliminates sample contact with peristaltic pump tubing
Graphite Furnace (for AAnalyst 400)
• Quick, easy interchange between flame and furnace
• Low sample consumption (as low as a few µL)
• Exceptional detection limits, down to the pg range
Specialized Software
• QC charting
• Tools for 21 CFR Part 11 compliance
• Speciation software
AA Consumables
• HCL and EDL lamps
• Graphite tubes
• Standards
ICP-OES and ICP-MS Consumables
• Cones
• Torches
• Nebulizers
• Standards
ATOMIC SPECTROSCOPY
ACCESSORIES
For more information on any of the products shown here, or for a complete listing of all atomic spectroscopy accessories available, please visit www.perkinelmer.com
Instrument Capability
PinAAcle/AAnalyst
Optima
NexION
Table of ConTenTs
Atomic Spectroscopy - A Guide to Selecting the Appropriate Technique and System
What is Atomic Spectroscopy 3
Primary Industries 3
Commonly Used Atomic Spectroscopy Techniques 4
Flame Atomic Absorption Spectroscopy 4
Graphite Furnace Atomic Absorption Spectroscopy 5
Inductively Coupled Plasma Optical Emission Spectroscopy 6
Inductively Coupled Plasma Mass Spectrometry 7
Selecting a Technique For Your Analysis 8
Detection Limits 8
Analytical Working Range 9
Sample Throughput 9
Costs 9
Selecting a System For Your Analysis 10
AAnalyst 200/400 Atomic Absorption Spectrometers 11
PinAAcle 900 Atomic Absorption Spectrometers 11
Optima 8x00 ICP-OES Spectrometers 11
NexION 300 ICP-MS Spectrometers 12
Importance of Atomic Spectroscopy To Specific Markets 13
Atomic Spectroscopy Detection Limits 14
Atomic Spectroscopy Accessories 15
2

3
Atomic spectroscopy is the technique for determining the elemental composition of an analyte by its electromagnetic or mass spectrum. Several analytical techniques are available, and selecting the most appropriate one is the key to achieving accurate, reliable, real-world results.
Proper selection requires a basic understanding of each technique since each has its individual strengths and limitations. It also requires a clear understanding of your laboratory’s analytical requirements.
The following pages will give you a basic overview of the most commonly used techniques and provide the information necessary to help you select the one that best suits your specific needs and applications.
Primary Industries
Many industries require a variety of elemental determinations on a diverse array of samples. Key markets include:
• Environmental
• Food
• Pharmaceutical
• Petrochemical
• Chemical/Industrial
• Geochemical/Mining
For more details, see Page 13.
WHAT IS ATOMICSPECTROSCOPY?
• Biomonitoring
• Agriculture
• Semiconductor
• Nuclear Energy
• Renewable Energy
• Nanomaterials
www.perkinelmer.com/atomicspectroscopy

There are three widely accepted analytical methods – atomic absorption, atomic emission and mass spectrometry – which will form the focus of our discussion, allowing us to go into greater depth on the most common techniques in use today:
• Flame Atomic Absorption Spectroscopy
• Graphite Furnace Atomic Absorption Spectroscopy
• Inductively Coupled Plasma Optical Emission Spectroscopy (ICP-OES)
• Inductively Coupled Plasma Mass Spectrometry (ICP-MS)
Flame Atomic Absorption Spectroscopy
Atomic Absorption (AA) occurs when a ground state atom absorbs energy in the form of light of a specific wavelength and is elevated to an excited state. The amount of light energy absorbed at this wavelength will increase as the number of atoms of the selected element in the light path increases. The relationship between the amount of light absorbed and the concentration of analytes present in known standards can be used to determine unknown sample concentrations by measuring the amount of light they absorb.
Performing atomic absorption spectroscopy requires a primary light source, an atom source, a monochromator to isolate the specific wavelength of light to be measured, a detector to measure the light accurately, electronics to process the data signal and a data display or reporting system to show the results. (See Figure 1.) The light source normally used is a hollow cathode lamp (HCL) or an electrodeless discharge lamp (EDL). In general, a different lamp is used for each element to be determined, although in some cases, a few ele-
HCL or EDLLamp
Flame Monochromator Detector
Figure 1. Simplified drawing of a Flame AA system.
4
ments may be combined in a multi-element lamp. In the past, photomultiplier tubes have been used as the detector. However, in most modern instruments, solid-state detectors are now used. Flow Injection Mercury Systems (FIMS) are specialized, easy-to-operate atomic absorption spectrometers for the determination of mercury. These instruments use a high-performance single-beam optical system with a low-pressure mercury lamp and solar-blind detector for maximum performance.
Whatever the system, the atom source used must produce free analyte atoms from the sample. The source of energy for free-atom production is heat, most commonly in the form of an air/acetylene or nitrous-oxide/acetylene flame. The sample is introduced as an aerosol into the flame by the sample- introduction system consisting of a nebulizer and spray chamber. The burner head is aligned so that the light beam passes through the flame, where the light is absorbed.
The major limitation of Flame AA is that the burner-nebulizer system is a relatively inefficient sampling device. Only a small fraction of the sample reaches the flame, and the atomized sample passes quickly through the light path. An improved sampling device would atomize the entire sample and retain the atomized sample in the light path for an extended period of time, enhancing the sensitivity of the technique. Which leads us to the next option – electrothermal vaporization using a graphite furnace.
COMMONLY USED
ATOMICSPECTROSCOPYTECHNIQUES

5www.perkinelmer.com/atomicspectroscopy
Graphite Furnace Atomic Absorption Spectroscopy
With Graphite Furnace Atomic Absorption (GFAA), the sample is introduced directly into a graphite tube, which is then heated in a programmed series of steps to remove the solvent and major matrix components and to atomize the remaining sample. All of the analyte is atomized, and the atoms are retained within the tube (and the light path, which passes through the tube) for an extended period of time. As a result, sensitivity and detection limits are significantly improved over Flame AA.
Graphite Furnace analysis times are longer than those for Flame sampling, and fewer elements can be determined using GFAA. However, the enhanced sensitivity of GFAA, and its ability to analyze very small samples, significantly expands the capabilities of atomic absorption.
GFAA allows the determination of over 40 elements in microliter sample volumes with detection limits typically 100 to 1000 times better than those of Flame AA systems.
HCL or EDLLamp
GraphiteTube
Monochromator Detector
Figure 2. Simplified drawing of a Graphite Furnace AA system.
The Periodic Table of the Elements1
HHydrogen1.00794
2
HeHelium4.003
3
LiLithium6.941
4
BeBeryllium
9.012182
5
BBoron
10.811
6
CCarbon
12.0107
7
NNitrogen
14.00674
8
OOxygen
15.9994
9
FFluorine
18.9984032
10
NeNeon
20.1797
11
NaSodium
22.989770
12
MgMagnesium24.3050
13
AlAluminum
26.981538
14
SiSilicon
28.0855
15
PPhosphorus
30.973761
16
SSulfur
32.066
17
ClChlorine
35.4527
18
ArArgon
39.948
19
KPotassium39.0983
20
CaCalcium40.078
21
ScScandium
44.955910
22
TiTitanium47.867
23
VVanadium50.9415
24
CrChromium51.9961
25
MnManganese
54.938049
26
FeIron
55.845
27
CoCobalt
58.933200
28
NiNickel
58.6934
29
CuCopper
63.546
30
ZnZinc
65.39
31
GaGallium69.723
32
GeGermanium
72.61
33
AsArsenic
74.92160
34
SeSelenium78.96
35
BrBromine79.904
36
KrKrypton83.80
37
RbRubidium85.4678
38
SrStrontium87.62
39
YYttrium
88.90585
40
ZrZirconium91.224
41
NbNiobium
92.90638
42
MoMolybdenum
95.94
43
TcTechnetium
(98)
44
RuRuthenium101.07
45
RhRhodium
102.90550
46
PdPalladium106.42
47
AgSilver
107.8682
48
CdCadmium112.411
49
InIndium
114.818
50
SnTin
118.710
51
SbAntimony121.760
52
TeTellurium127.60
53
IIodine
126.90447
54
XeXenon
131.29
55
CsCesium
132.90545
56
BaBarium
137.327
57
LaLanthanum138.9055
72
HfHafnium178.49
73
TaTantalum
180.9479
74
WTungsten183.84
75
ReRhenium186.207
76
OsOsmium190.23
77
IrIridium
192.217
78
PtPlatinum
195.078
79
AuGold
196.96655
80
HgMercury200.59
81
TlThallium
204.3833
82
PbLead
207.2
83
BiBismuth
208.98038
84
PoPolonium(209)
85
AtAstatine(210)
86
RnRadon(222)
87
FrFrancium(223)
88
RaRadium(226)
89
AcActinium(227)
104
RfRutherfordium
(261)
105
DbDubnium(262)
106
SgSeaborgium
(263)
107
BhBohrium(262)
108
HsHassium(265)
109
MtMeitnerium
(266)
110
(269)
111
(272)
58
CeCerium
140.116
59
PrPraseodymium140.90765
60
NdNeodymium
144.24
61
PmPromethium
(145)
62
SmSamarium150.36
63
EuEuropium151.964
64
GdGadolinium157.25
65
TbTerbium
158.92534
66
DyDysprosium162.50
67
HoHolmium
164.93032
68
ErErbium
167.26
69
TmThulium
168.93421
70
YbYtterbium173.04
71
LuLutetium174.967
90
ThThorium
232.0381
91
PaProtactinium231.03588
92
UUranium
238.0289
93
NpNeptunium
(237)
94
PuPlutonium(244)
95
AmAmericium
(243)
96
CmCurium(247)
97
BkBerkelium
(247)
98
CfCalifornium
(251)
99
EsEinsteinium
(252)
100
FmFermium(257)
101
MdMendelevium
(258)
102
NoNobelium(259)
103
LrLawrencium
(262)
1H
Hydrogen1.00794
Atomic number
Element NameAtomic Mass
Element Symbol
DsDarmstadtium
RgRoentgenium
The Periodic Table of Elements – See page 14 for a listing of detection limits for all elements using the different atomic spectroscopy methods.

Inductively Coupled Plasma Optical Emission Spectroscopy
ICP is an argon plasma maintained by the interaction of an RF field and ionized argon gas. The plasma can reach temperatures as high as 10,000 ˚K, allowing the complete atomization of the elements in a sample and minimizing potential chemical inter-ferences.
Inductively Coupled Plasma Optical Emission Spectroscopy (ICP-OES) is the measurement of the light emitted by the elements in a sample introduced into an ICP source. The measured emission intensities are then compared to the intensities of standards of known concentration to obtain the elemental concentrations in the unknown sample.
There are two ways of viewing the light emitted from an ICP. In the classical ICP-OES configuration, the light across the plasma is viewed radially (Figure 3a), resulting in the highest upper linear ranges. By viewing the light emitted by the sample looking down the center of the torch (Figure 3b) or axially, the continuum background from the ICP itself is reduced and the sample path is maximized. Axial viewing provides better detec-tion limits than those obtained via radial viewing by as much as a factor of 10. The most effective systems allow the plasma to be viewed in either orientation in a single analysis, providing the best detection capabilities and widest working ranges.
The optical system used for ICP-OES consists of a spectrometer that is used to separate the individual wavelengths of light and focus the desired wavelengths onto the detector (Figure 4). Older, “direct reader” types of ICP-OES systems used a series of photomultiplier tubes to determine pre-selected wavelengths. This limited the number of elements that could be determined as the wavelengths were generally fixed once the instrument was manufactured. Sequential-type systems can select any wave-length and focus it on a single detector. However, this is done one element at a time, which can lead to longer analysis times.
In today’s modern ICP-OES systems, solid-state detectors based on charge-coupled devices (CCD) are used, providing very flexible systems and eliminating the need for large numbers of single photomultiplier detectors.
Plasma Spectrometer Detector
Figure 4. Simplified drawing of a basic ICP system.
Figure 3a. Radially viewed plasma with a vertical slit image in the plasma.
Figure 3b. Axially viewed plasma with an axial slit image in the plasma.
6

7www.perkinelmer.com/atomicspectroscopy
Inductively Coupled Plasma Mass Spectrometry
With Inductively Coupled Plasma Mass Spectrometry (ICP-MS), the argon ICP gener ates singly charged ions from the elemental species within a sample that are directed into a mass spectrometer and separated according to their mass-to-charge ratio. Ions of the selected mass-to-charge ratio are then directed to a detector that determines the number of ions present (Figure 5). Typically, a quadrupole mass spectrometer is used for its ease-of-use, robustness and speed. Due to the similarity of the sample-introduction and data-handling techniques, using an ICP-MS is very much like using an ICP-OES system.
ICP-MS combines the multi-element capabilities of ICP techniques with exceptional detection limits equivalent to or below those of GFAA. It is also one of the few analytical techniques that allows the quantification of elemental isotopic concentrations and ratios, as well as precise speciation capabilities when used in conjunction with HPLC or GC interfaces. This feature enables the analytical chemist to determine the exact form of a species present – not just the total concentration.
Figure 5. Simplified drawing of ICP-MS system with Universal Cell Technology (UCT).
However, due to the fact that the sample components are actually introduced into the instrument, there are some limitations as to how much sample matrix can be introduced into the ICP-MS. In addition, there are also increased maintenance requirements as compared to ICP-OES systems. Generally, ICP-MS systems require that the total dissolved solids content of a sample be below 0.2% for routine operation and maximum stability. There are several items, such as the interface cones and ion lens, located between the ICP torch and the mass spectro meter, that need to be cleaned on a periodic basis to maintain acceptable instrument performance.
Recent developments have led to new technologies to increase the robustness and stability of ICP-MS. Orthogonal ion lens systems increase the ability of the ICP-MS to handle higher total dissolved solids content and dramatically improve long-term stability for high matrix solutions. Interference control has been made even easier by using universal cell technologies that include both collision (using Kinetic Energy Discrimination KED) and Dynamic Reaction Cell (DRC) in a single instrument allowing the analyst to choose the best technique for their samples.
Detector Quadrupole Mass Filter Universal Cell
Quadrupole Ion Deflector
Triple Cone Interface
8
SELECTING A TECHNIQUE FOR YOUR ANALYSIS
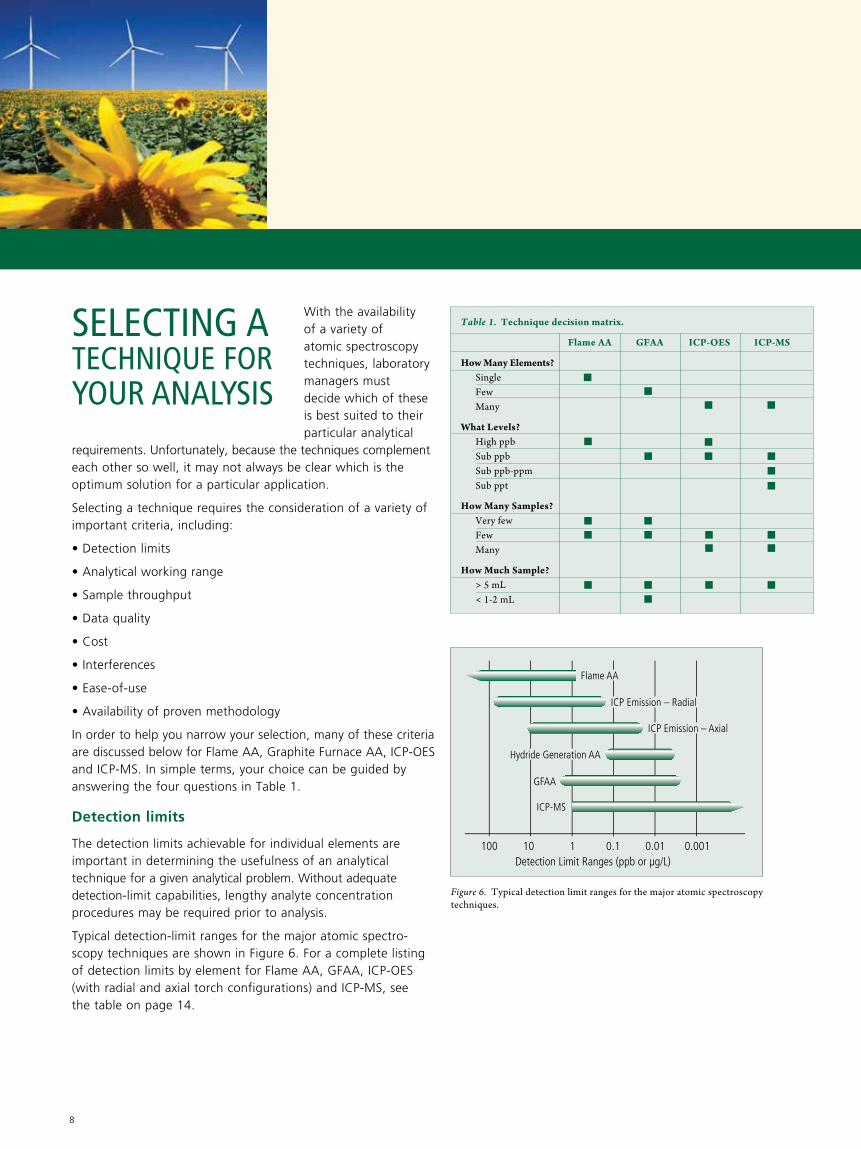
With the availability of a variety of atomic spectroscopy techniques, laboratory managers must decide which of these is best suited to their particular analytical
requirements. Unfortunately, because the techniques complement each other so well, it may not always be clear which is the optimum solution for a particular application.
Selecting a technique requires the consideration of a variety of important criteria, including:
• Detection limits
• Analytical working range
• Sample throughput
• Data quality
• Cost
• Interferences
• Ease-of-use
• Availability of proven methodology
In order to help you narrow your selection, many of these criteria are discussed below for Flame AA, Graphite Furnace AA, ICP-OES and ICP-MS. In simple terms, your choice can be guided by answering the four questions in Table 1.
Detection limits
The detection limits achievable for individual elements are important in determining the usefulness of an analytical technique for a given analytical problem. Without adequate detection-limit capabilities, lengthy analyte concentration procedures may be required prior to analysis.
Typical detection-limit ranges for the major atomic spectro- scopy techniques are shown in Figure 6. For a complete listing of detection limits by element for Flame AA, GFAA, ICP-OES (with radial and axial torch configurations) and ICP-MS, see the table on page 14.
100 10 1 0.1 0.01 0.001Detection Limit Ranges (ppb or µg/L)
Flame AA
ICP Emission – Radial
ICP Emission – Axial
Hydride Generation AA
GFAA
ICP-MS
Figure 6. Typical detection limit ranges for the major atomic spectroscopy techniques.
Table 1. Technique decision matrix.
Flame AA GFAA ICP-OES ICP-MS
How Many Elements? Single Few Many
What Levels? High ppb Sub ppb Sub ppb-ppm Sub ppt
How Many Samples? Very few Few Many
How Much Sample? > 5 mL < 1-2 mL

9
Analytical working range
The analytical working range can be viewed as the concentration range over which quantitative results can be obtained without having to recalibrate the system. Selecting a technique with an analytical working range (and detection limits) based on the expected analyte concentrations minimizes analysis times by allowing samples with varying analyte concentrations to be analyzed together. A wide analytical working range can also reduce sample-handling requirements, minimizing potential errors.
Sample throughput
Sample throughput is the number of samples that can be analyzed or elements that can be determined per unit of time. For most techniques, analyses performed at the limits of detection or where the best precision is required will be more time-consuming than less demanding analyses. Where these factors are not limiting, the number of elements to be determined per sample and the analytical technique will determine the sample throughput.
• Flame AA – Provides relatively high sample throughput when analyzing a large number of samples for a limited number of elements. A typical determination of a single element requires only 3-10 seconds. However, Flame AA requires specific light sources and optical parameters for each element to be determined and may require different flame gases for different elements. As a result, even though it is frequently used for multi-element analysis, Flame AA is generally considered to be a single-element technique.
1 2 3 4 5 6 7 8 9 10Orders of Magnitude of Signal Intensity
ICP-OES – Dual View
ICP-MS
ICP-OES – Radial View
ICP-OES – Axial View
Flame AA
Hydride Generation AA
GFAA
Figure 7. Typical analytical working ranges for the major atomic spectroscopy techniques.
$0K $50K $100K $150K $200KTypical complete system cost ($US)
ICP-OES
ICP-MS
Flame AA
GFAA
Figure 8. Typical relative purchase prices for atomic spectroscopy systems.
• Graphite Furnace AA – As with Flame AA, GFAA is basically a single-element technique. Because of the need to thermally program the system to remove solvent and matrix components prior to atomization, GFAA has a relatively low sample through-put. A typical graphite-furnace determination normally requires 2-3 minutes per element for each sample.
• ICP-OES – A true multi-element technique with exceptional sample throughput. ICP-OES systems typically can determine more than 73 elements per minute in individual samples. Where only a few elements are to be determined, however, ICP is limited by the time required for equilibration of the plasma with each new sample, typically about 15-30 seconds.
• ICP-MS – Also a true multi-element technique with the same advantages and limitations of ICP-OES. ICP-MS can typically determine more than 73 elements per minute in an individual sample, depending on such factors as the concentration levels and required precision. Although ICP-MS has a wide working range, the upper linear concentration range is generally less than that of ICP-OES systems and may require that some samples be diluted.
Costs
As they are less complex systems, instrumentation for single- element atomic spectroscopy (Flame AA and GFAA) is generally less costly than that for the multi-element techniques (ICP-OES and ICP-MS). There can also be a considerable variation in cost among instrumentation for the same technique. Instruments offering only basic features are generally less expensive than more versatile systems, which frequently also offer a greater degree of automation. Figure 8 provides a comparison of typical instrument price ranges for the major atomic spectroscopy techniques.

10
SELECTING A SYSTEM FORYOUR ANALYSIS
Flame AA – Flame Atomic Absorption Spectroscopy
GFAA – Graphite Furnace Atomic Absorption Spectroscopy
ICP-OES – Inductively Coupled Plasma Optical Emission Spectroscopy
ICP-MS – Inductively Coupled Plasma Mass Spectrometry
• Veryeasy-to-use
• Widelyaccepted
• Extensiveapplication information available
• Relativelyinexpensive
• Exceptionaldetectionlimits
• Well-documented applications
• Maybeleftunatteneded
• Bestoverallmulti-elementatomic spectroscopy technique
• Excellentsamplethroughput
• Verywideanalyticalrange
• Gooddocumentation available for applications
• Maybeleftunatteneded
• Easy-to-use
• Exceptionalmulti-elementcapabilities
• Abilitytoperformisotopicanalyses
• Well-documented interferences and compensation methods
• Rapidlygrowingapplicationinformation
• Detectionlimitsequaltoor better than GFAA with much higher productivity
• Maybeleftunattended
• Lowsensitivity
• Single-elementanalyticalcapability
• Cannotbeleftunattended(flammable gas)
• Limitedanalyticalworkingrange
• Samplethroughput somewhat less than other techniques
• Higherinitialinvestment
• Highestinitialinvestment
• Methoddevelopment more difficult than other techniques
• Limitedsolidsinsample
Ideal for laboratories analyzing large numbers of samples for a limited number of elements and for the determination of major constituents and higher concentration analytes.
Ideal for laboratories analyzing a limited number of elements and requiring excellent detec-tion limits.
Ideal for laboratories analyzing multiple elements in a moderate or large number of samples.
Ideal for laboratories analyzing multiple elements in a large number of samples and requiring a system capable of determining trace and ultra-trace analyte concentrations.
AAnalyst 200/400 AA Spectrometers
PinAAcle AA Spectrometers
Optima ICP-OES Spectrometers
NexION ICP-MS Spectrometers
TECHNIquE STrENGTHS LIMITATIONS APPLICATIONS SySTEM
Once you have identified the best solution for your particular application, read on for more in-depth product details.

AAnalyst 200/400 Atomic Absorption Spectrometers
Whether you choose the AAnalyst™ 200 or AAnalyst 400, you’ll discover an easy, affordable and reliable flame atomic absorption (AA) solution. We’ve simplified the process of AA analysis, from sample introduction to results. We’ve made it easy for anyone with a basic understanding of AA to get fast, reliable results every time, and we’ve made the quality and reliability of PerkinElmer available to everyone with these affordable systems.
Easy to use, easy to own, and featuring many of the advances that have made PerkinElmer the market leader, the AAnalyst 200 and 400 are the perfect choice for any laboratory needing a reliable, trouble-free solution for flame AA analysis.
PinAAcle 900 Atomic Absorption Spectrometers
The PinAAcle™ series of atomic absorption (AA) spectrometers brings AA performance to new heights. Engineered with an array of exciting technological advances, it offers a variety of configurations and capabilities to deliver exactly the level of performance you need:
• Flame only, furnace only, or space-saving stacked designs featuring both
• Flame, furnace, flow injection, FIAS-furnace and mercury/hydride capabilities on a single instrument
• Choice of Deuterium or longitudinal Zeeman background correction
• TubeView™ color furnace camera simplifies autosampler tip alignment and sample dispensing
• Proven WinLab32™ software offering both ease-of-use and exceptional flexibility
And no matter which model you select (900F, 900Z, 900H, 900T), you’ll discover an intuitive, highly efficient system capable of simplifying your journey from sample to results – even with the most difficult matrices.
Optima 8x00 ICP-OES Spectrometers
With its groundbreaking features and expanded capabilities, the Optima™ 8x00 series is more than just an evolution of the world’s most popular ICP-OES… it’s a revolution. Built around the proven design of the Optima platform, the 8x00 series delivers breakthrough performance through a series of cutting-edge technologies that enhance plasma stability, simplify method development and dramatically reduce operating costs:
• Flat Plate™ Plasma Technology – with a patented, maintenance-free RF generator uses half the argon of traditional systems dramatically reducing operating costs.
• Patented Dual View – offers radial and axial viewing of the plasma for effective measurement of elements with high and low concentrations in the same method.
• PlasmaCam™ Viewing Camera – offers continuous viewing of the plasma, simplifying method development and enabling remote diagnostic capabilities for maximum uptime.
11

12
NexION 300 ICP-MS Spectrometers
To leverage the true power of ICP-MS in your lab, you need a solution that lets any scientist analyze any sample at any time. All while generating clear, reliable, informative results. It requires an instrument that offers a unique level of simplicity, flexibility and sensitivity – exactly what you get with the NexION® 300 series ICP-MS.
Engineered with an array of ground-breaking technologies to optimize performance and productivity, the NexION 300 has changed the face of ICP-MS by being the first instrument to offer:
• Three cones (sampler, skimmer, and hyper skimmer) to eliminate internal maintenance and provide unrivaled STABILITY
• Three quadrupoles to maximize SENSITIVITY for every element in a run
• Three modes of operation (Standard, Collision, and Reaction) for ultimate application FLEXIBILITY
Atomic Spectroscopy Applications by Market
TyPICAL COMMONLy uSEd TECHNIquES
MArkET APPLICATIONS AA ICP-OES ICP-MS
Environmental Water Soil Air
Food Food safety Nutritional labeling
Pharmaceutical Drug development Quality control
Petrochemical Petroleum refining Lubricants and oils
Chemical/Industrial Quality control/Product testing
Geochemical/Mining Exploration Research
Biomonitoring Biologicalfluids
Agriculture Soils
Semiconductor Wafers High-purity chemicals
Nuclear Energy Low-level waste Process water
RenewableEnergy Biofuels Solar panels
Nanomaterials Research
Frequency of Technique Used

13www.perkinelmer.com/atomicspectroscopy
EnvironmentalIn the environment we live in, understanding heavy-metal contamination is critical. The accurate measurement of concentrations of these metals is imperative to maintain clean air, water and soil for a safer world.
FoodAccurate analysis of food for nutritional content, contamination or authenticity – the exact geographic source of the product – is critical for regulatory and quality assurance.
PharmaceuticalDrug research, development and production is dependent on elemental analysis, starting with the testing of individual ingredients and continuing through production to final quality control, as impurities can affect drug efficacy and metabolism.
PetrochemicalFrom petroleum refining to a broad spectrum of applications using lubricants and oils, many industries require the determination of metals – particularly analytes that can lead to degradation and contamination – to ensure conformity as well as monitor and control processes.
Chemical/IndustrialFrom the analysis of raw materials and components to finished product testing and quality control, industrial and chemical manufacturers require accurate analytical techniques to ensure the safety and performance of their products.
Geochemical/MiningWith myriad applications from date stamping to precious metals testing, atomic spectroscopy offers a fast, accurate solution for broad geological surveys as well as an invaluable means of testing potential mining areas before incurring the high costs associated with digging.
BiomonitoringInstrumentation for accurate measurements of metals in biological matrices is vital when assessing human exposures to natural and synthetic chemicals. Speciation is also becoming increasingly important due to its ability to provide additional information on element valence state or molecular form.
AgricultureTrace metals are essential for plant growth. Atomic spectroscopy also facilitates precise soil analysis to ensure that metals are not at levels that could unduly affect the food source (livestock and/or crops).
SemiconductorDetermining lower and lower values in a variety of materials – rapidly and affordably – has become necessary in the increasingly competitive semiconductor industry.
Nuclear EnergyOperating under constant scrutiny, the nuclear field is required to monitor and measure the levels of a variety of elements to an exacting degree. Atomic spectroscopy is commonly used to determine trace elements in everything from process water to low-level waste.
Renewable EnergyAs the world continues to move toward eco-friendly technologies and energy sources, there’s an ever-increasing need for accurate elemental analysis. Applications include testing biofuels for batch consistency and quality control, as well as trace elemental analysis on solar panels to ensure optimum performance.
NanomaterialsAs research science defines more novel applications for nano- materials, the need to eliminate material uncertainty on a particle- by-particle basis continues to grow. Whether there is a need to solve an environmental issue or apply a manufacturing QA/QC solution to a synthesis or formulation process, there is a growing requirement for sensitivity to conduct accurate, precise work.
IMPORTANCE OFATOMIC SPECTROSCOPYTO SPECIFIC MARKETS

14
ATOMIC SPECTROSCOPYDETECTION LIMITS
Element Flame AA Hg/Hydride GFAA ICP-OES ICP-MS
Ag 1.5 0.005 0.6 0.00009 Al 45 0.1 1 0.0004 * As 150 0.03 0.05 1 0.0004 Au 9 0.15 1 0.0001B 1000 20 1 0.001Ba 15 0.35 0.03 0.00004Be 1.5 0.008 0.09 0.0003Bi 30 0.03 0.05 1 0.00002Br 0.04 C Ca 1.5 0.01 0.05 0.0003 *Cd 0.8 0.002 0.1 0.00007 Ce 1.5 0.00005 Cl 2 Co 9 0.15 0.2 0.00006 * Cr 3 0.004 0.2 0.0003 * Cs 15 0.00005 Cu 1.5 0.014 0.4 0.0002 * Dy 50 0.5 0.0002 Er 60 0.5 0.0001Eu 30 0.2 0.00007 F Fe 5 0.06 0.1 0.0005 *Ga 75 1.5 0.00008Gd 1800 0.9 0.0003 Ge 300 1 0.0006 * Hf 300 0.5 0.0003 Hg 300 0.009 0.6 1 0.001 Ho 60 0.4 0.00004 I 0.003In 30 1 0.00008 Ir 900 3.0 1 0.00009 K 3 0.005 1 0.001 La 3000 0.4 0.00004Li 0.8 0.06 0.3 0.00005 Lu 1000 0.1 0.00004 Mg 0.15 0.004 0.04 0.0001 Mn 1.5 0.005 0.1 0.0001 *
Element Flame AA Hg/Hydride GFAA ICP-OES ICP-MS
Mo 45 0.03 0.5 0.00008Na 0.3 0.005 0.5 0.0003Nb 1500 1 0.00004Nd 1500 2 0.0003Ni 6 0.07 0.5 0.0002*Os 6 0.00006P 75000 130 4 0.04*Pb 15 0.05 1 0.00004 *Pd 30 0.09 2 0.00003Pr 7500 2 0.00003Pt 60 2.0 1 0.0001Rb 3 0.03 5 0.0002Re 750 0.5 0.0003Rh 6 5 0.00004Ru 100 1.0 1 0.0001S 10 0.9 *Sb 45 0.15 0.05 2 0.0002Sc 30 0.1 0.001Se 100 0.03 0.05 2 0.0003 *Si 90 1.0 10 0.09Sm 3000 2 0.0002Sn 150 0.1 2 0.0002Sr 3 0.025 0.05 0.00007Ta 1500 1 0.00001Tb 900 2 0.00003Te 30 0.03 0.1 2 0.0003 *Th 2 0.00005Ti 75 0.35 0.4 0.0002*Tl 15 0.1 2 0.00001Tm 15 0.6 0.00003U 15000 10 0.00002V 60 0.1 0.5 0.00007*W 1500 1 0.00003Y 75 0.2 0.00002Yb 8 0.1 0.0001Zn 1.5 0.02 0.2 0.0007*Zr 450 0.5 0.00007
All detection limits are given in micrograms per liter and were determined using elemental standards in dilute aqueous solution. All detection limits are based on a 98% confidence level (3 standard deviations).
All atomic absorption detection limits were determined using instrumental parameters optimized for the individual element, including the use of System 2 electrodeless discharge lamps where available. Data shown were determined on a PerkinElmer AA.
All Optima ICP-OES detection limits were obtained under simultaneous multi-element conditions with the axial view of a dual-view plasma using a cyclonic spray chamber and a concentric nebulizer.
Cold-vapor mercury detection limits were determined with a FIAS-100 or FIAS-400 flow injection system with amalgamation accessory.
The detection limit without an amalgamation accessory is 0.2 µg/L with a hollow cathode lamp, 0.05 µg/L with a System 2 electrodeless discharge lamp. (The Hg detection limit with the dedicated FIMS-100 or FIMS-400 mercury analyzers is < 0.005 µg/L without an amalgamation accessory and < 0.0002 µg/L with an amalgamation accessory.) Hydride detection limits shown were determined using an MHS-15 Mercury/Hydride system.
GFAA detection limits were determined on a PerkinElmer AA using 50 µL sample volumes, an integrated platform and full STPF conditions. Graphite-furnace detection limits can be further enhanced by the use of replicate injections.
All ICP-MS measurements were performed on a NexION ICP-MS with a quartz sample introduction system using a 3-second integration time and ten replicates in de-ionized water. Detection limits were measured under multi-element conditions in Standard mode, except where denoted by an asterisk (*). Detection limits denoted by * were performed in a Class-100 Clean Room using Reaction mode with the most appropriate cell gas and conditions for that element in de-ionized water.

Titan MPS™ Microwave Sample Preparation System
• Flexible, cost-effective solution for pressure digestion of a broad range of samples
• Connection-free and contact-free temperature/pressure sensing for ultimate ease-of-use
• Strong and durable digestion vessels are easy to use and warrantied for one year
Autosamplers
• Flexible rack configurations
• Fast, accurate random access
• Corrosion-resistant sampling components
• Flow-through rinse station to minimize sample-to-sample contamination
Mercury Hydride System
• Highly sensitive determination of Mercury or hydride-forming elements
FIAS
Fully automated flow-injection system
• Simplifies and speeds up analyses requiring complex sample preparation such as Mercury and other hydride-forming elements
High-Throughput Sample- Introduction System
• Minimizes sample uptake and washout time
• Throughput increased up to 2-3 fold
• Eliminates sample contact with peristaltic pump tubing
Graphite Furnace (for AAnalyst 400)
• Quick, easy interchange between flame and furnace
• Low sample consumption (as low as a few µL)
• Exceptional detection limits, down to the pg range
Specialized Software
• QC charting
• Tools for 21 CFR Part 11 compliance
• Speciation software
AA Consumables
• HCL and EDL lamps
• Graphite tubes
• Standards
ICP-OES and ICP-MS Consumables
• Cones
• Torches
• Nebulizers
• Standards
ATOMIC SPECTROSCOPY
ACCESSORIES
For more information on any of the products shown here, or for a complete listing of all atomic spectroscopy accessories available, please visit www.perkinelmer.com
Instrument Capability
PinAAcle/AAnalyst
Optima
NexION
Table of ConTenTs
Atomic Spectroscopy - A Guide to Selecting the Appropriate Technique and System
What is Atomic Spectroscopy 3
Primary Industries 3
Commonly Used Atomic Spectroscopy Techniques 4
Flame Atomic Absorption Spectroscopy 4
Graphite Furnace Atomic Absorption Spectroscopy 5
Inductively Coupled Plasma Optical Emission Spectroscopy 6
Inductively Coupled Plasma Mass Spectrometry 7
Selecting a Technique For Your Analysis 8
Detection Limits 8
Analytical Working Range 9
Sample Throughput 9
Costs 9
Selecting a System For Your Analysis 10
AAnalyst 200/400 Atomic Absorption Spectrometers 11
PinAAcle 900 Atomic Absorption Spectrometers 11
Optima 8x00 ICP-OES Spectrometers 11
NexION 300 ICP-MS Spectrometers 12
Importance of Atomic Spectroscopy To Specific Markets 13
Atomic Spectroscopy Detection Limits 14
Atomic Spectroscopy Accessories 15
2

WORLD LEADER INAA, ICP-OESAND ICP-MS
For a complete listing of our global offices, visit www.perkinelmer.com/ContactUs
Copyright ©2008-2013, PerkinElmer, Inc. All rights reserved. PerkinElmer® is a registered trademark of PerkinElmer, Inc. All other trademarks are the property of their respective owners. 008044D_01
PerkinElmer, Inc. 940 Winter Street Waltham, MA 02451 USA P: (800) 762-4000 or (+1) 203-925-4602www.perkinelmer.com
PerkinElmer has been at the forefront of inorganic analytical technology for over 50 years. With a comprehensive product line that includes Flame AA systems, high-performance Graphite Furnace AA systems, flexible ICP-OES systems and the most powerful ICP-MS systems, we can provide the ideal solution no matter what the specifics of your application.
We understand the unique and varied needs of the customers and markets we serve. And we provide integrated solutions that streamline and simplify the entire process from sample handling and analysis to the communication of test results.
With tens of thousands of installations worldwide, PerkinElmer systems are performing inorganic analyses every hour of every day. Behind that extensive network of products stands the industry’s largest and most-responsive technical service and support staff. Factory-trained and located in 150 countries, they have earned a reputation for consistently delivering the highest levels of personalized, responsive service in the industry.
The Most Trusted Name in Elemental Analysis
Atomic SpectroscopyA Guide to Selecting the Appropriate Technique and System
For more product information, visit:www.perkinelmer.com/atomicspectroscopy