Embed Size (px)
Citation preview
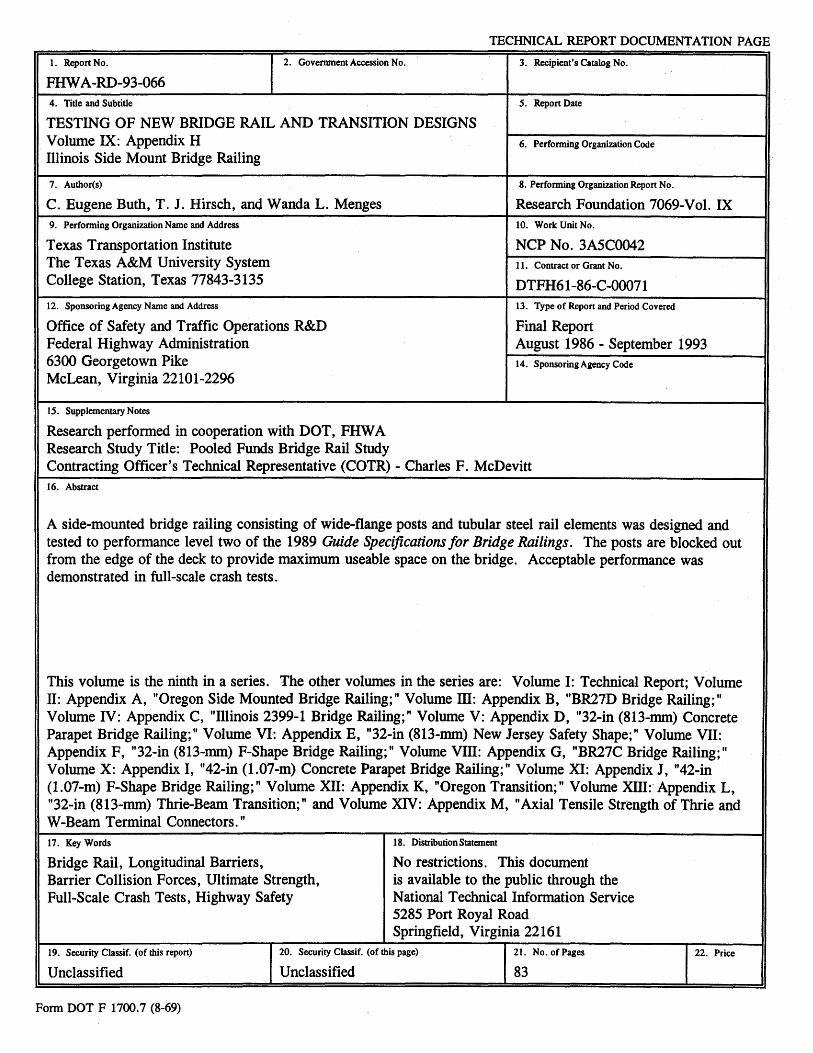
TECHNICAL REPORT DOCUMENTATION PAGE
1. Report No. 2. Goverrunent Accession No.
FHW A-RD-93-066 4. Title and Subtitle
TESTING OF NEW BRIDGE RAIL AND TRANSITION DESIGNS Volume IX: Appendix H Illinois Side Mount Bridge Railing
7. Author(s)
3. Recipient's Catalog No.
5. Report Date
6. Performing Organization Code
8. Performing Organization Report No.
C. Eugene Buth, T. J. Hirsch, and Wanda L. Menges Research Foundation 7069-Vol. IX 9. Performing Organization Name and Address
Texas Transportation Institute The Texas A&M University System College Station, Texas 77843-3135
12. Sponsoring Agency Name and Address
10. Work Unit No.
NCP No. 3A5C0042 11. Contract or Grant No.
DTFH61-86-C-00071 13. Type of Report and Period Covered
Final Report Office of Safety and Traffic Operations R&D Federal Highway Administration August 1986 - September 1993 6300 Georgetown Pike McLean, Virginia 22101-2296
15. Supplementary Notes
Research performed in cooperation with DOT, FHW A Research Study Title: Pooled Funds Bridge Rail Study
14. Sponsoring Agency Code
Contracting Officer's Technical Representative (COTR)- Charles F. McDevitt 16. Abstract
A side-mounted bridge railing consisting of wide-flange posts and tubular steel rail elements was designed and tested to performance level two of the 1989 Guide Specifications for Bridge Railings. The posts are blocked out from the edge of the deck to provide maximum useable space on the bridge. Acceptable performance was demonstrated in full-scale crash tests.
This volume is the ninth in a series. The other volumes in the series are: Volume 1: Technical Report; Volume II: Appendix A, "Oregon Side Mounted Bridge Railing;" Volume III: Appendix B, "BR27D Bridge Railing;" Volume IV: Appendix C, "Illinois 2399-1 Bridge Railing;" Volume V: Appendix D, "32-in (813-mm) Concrete Parapet Bridge Railing;" Volume VI: Appendix E, "32-in (813-mm) New Jersey Safety Shape;" Volume VII: Appendix F, "32-in (813-mm) F-Shape Bridge Railing;" Volume VIII: Appendix G, "BR27C Bridge Railing;" Volume X: Appendix I, "42-in (1.07-m) Concrete Parapet Bridge Railing;" Volume XI: Appendix J, "42-in (1.07-m) F-Shape Bridge Railing;" Volume XII: Appendix K, "Oregon Transition;" Volume XIII: Appendix L, "32-in (813-mm) Thrie-Beam Transition;" and Volume XIV: Appendix M, "Axial Tensile Strength of Thrie and W-Beam Terminal Connectors." 17. Key Words
Bridge Rail, Longitudinal Barriers, Barrier Collision Forces, Ultimate Strength, Full-Scale Crash Tests, Highway Safety
18. DistributionStatement
No restrictions. This document is available to the public through the National Technical Information Service 5285 Port Royal Road Springfield, Virginia 22161
19. Security Classif. (of this report)
Unclassified
20. Security Classif. (of this page)
Unclassified
21. No. of Pages
83
Form DOT F 1700.7 (8-69)
22. Price

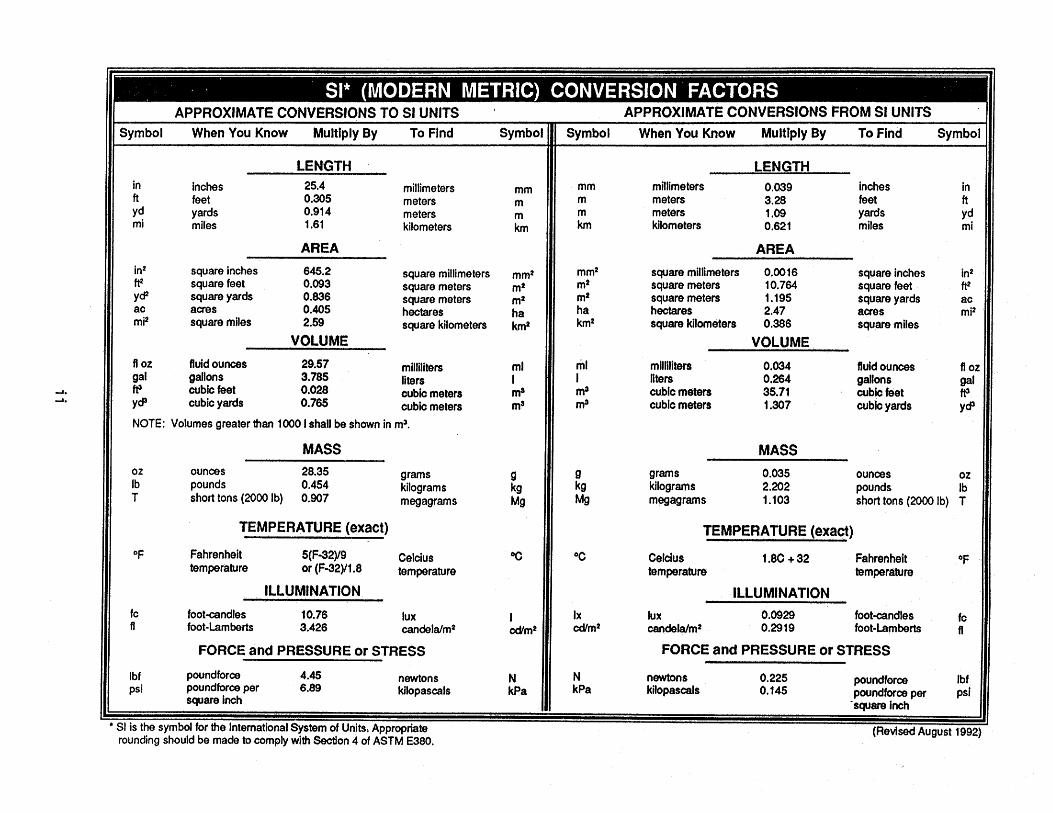
APPROXIMATE CONVERSIONS FROM Sl UNITS
Symbol When You Know Multiply By To Find Symbol Symbol When You Know Multiply By To Find Symbol
LEN,GTH LENGTH in Inches 25.4 millimeters mm mm millimeters 0.039 Inches in ft feet 0.305 meters m m meters 3.28 feet ft yd yards 0.914 meters m m meters 1.09 yards yd mi miles 1.61 kilometers km km kilometers 0.621 miles mi
AREA AREA
in2 square inches 645.2 square millimeters mm2 mm2 square millimeters 0.0016 square inches in2
ft2 square feet 0.093 square meters m:t m2 square meters 10.764 square feet ft2 yr:P square yards 0.836 square meters m2 m2 square meters 1.195 square yards ac ac acres 0.405 hectares ha ha hectares 2.47 acres mi2 mi2 square miles 2.59 square kilometers km2 km2 square kilometers 0.386 square miles
VOLUME VOLUME
fl oz fluidounces 29.57 milfiliters ml ml milliliters 0.034 fluidounces fl oz gal gallons 3.785 liters I I liters 0.264 gallons gal ..... Ill ft3 cubic feet 0.028 cubic meters m:t rna cubic meters 35.71 cubic teet ft3 ..... ydl cubic yards 0.765 cubic meters m:t m:t cubic meters 1.307 cubic yards ydl NOTE: Volumes greater than 1000 I shall be shown in m3•
MASS MASS
oz ounces 28.35 grams g g grams 0.035 ounces oz lb pounds 0.454 kilograms kg kg kilograms 2.202 pounds lb T short tons (2000 lb) 0.907 megagrams Mg Mg megagrams 1.103 short tons (2000 lb) T
TEMPERATURE (exact) TEMPERATURE (exact)
OF Fahrenheit 5{F-32)19 Celcius oc oc Celcius 1.8C +32 Fahrenheit OF temperature or (F-32}/1.8 temperature temperature temperature
ILLUMINATION ILLUMINATION
fc foot-candles 10.76 lux I lx lux 0.0929 foot-candles fc fl foot-Lamberts 3.426 candela/m2 cdlm2 cd/m2 candelalm2 0.2919 foot-Lamberts fl
FORCE and PRESSURE or STRESS FORCE and PRESSURE or STRESS
lbf poundforce 4.45 newtons N
Ill N newtons 0.225 poundforce lbf
psi poundforce per 6.89 kilo pascals kPa kPa kilo pascals 0.145 poundforce per psi square inch ·square inch
• Sl is the symbol for the International System of Units. Appropriate (Revised August 1992) rounding should be made to comply with Section 4 of ASTM E380.

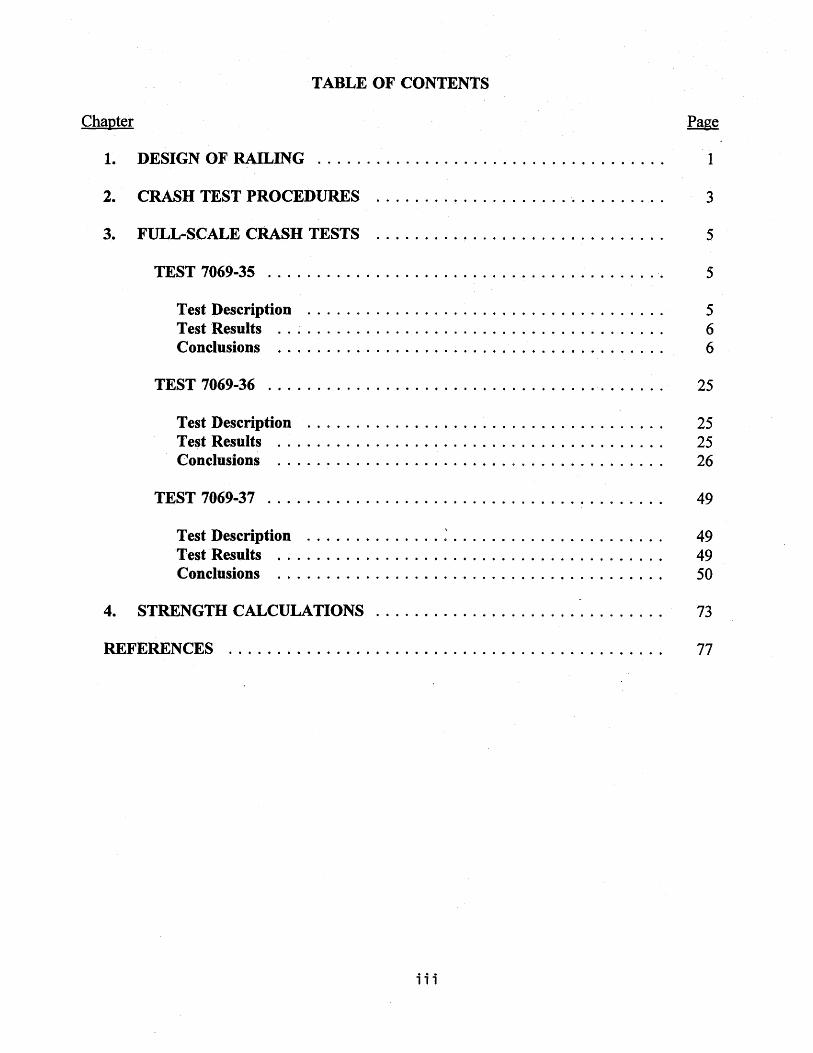
TABLE OF CONTENTS
Chapter
1. DESIGN OF RAILING I
2. CRASH TEST PROCEDURES 3
3. FULL-SCALE CRASH TESTS 5
TEST 7069-35 . . . . . . . . . . . . . . . . . . . . . . . . . . . . . . . . . . . . . . . . ·. 5
Test Description . . . . . . . . . . . . . . . . . . . . . . . . . . . . . . . . . . . . . 5 Test Results . . . . . . . . . . . . . . . . . . . . . . . . . . . . . . . . . . . . . . . . 6 Conclusions . . . . . . . . . . . . . . . . . . . . . . . . . . . . . . . . . . . . . . . . 6
TEST 7069-36 . . . . . . . . . . . . . . . . . . . . . . . . . . . . . . . . . . . . . . . . . 25
Test Description . . . . . . . . . . . . . . . . . . . . . . . . . . . . . . . . . . . . . 25 Test Results . . . . . . . . . . . . . . . . . . . . . . . . . . . . . . . . . . . . . . . . 25 Conclusions . . . . . . . . . . . . . . . . . . . . . . . . . . . . . . . . . . . . . . . . 26
TEST 7069-37 . . . . . . . . . . . . . . . . . . . . . . . . . . . . . . . . . . . . . . . . . 49
Test Description . . . . . . . . . . . . . . : . . . . . . . . . . . . . . . . . . . . . . 49 Test Results . . . . . . . . . . . . . . . . . . . . . . . . . . . . . . . . . . . . . . . . 49 Conclusions . . . . . . . . . . . . . . . . . . . . . . . . . . . . . . . . . . . . . . . . 50
4. STRENGTH CALCULATIONS . . . . . . . . . . . . . . . . . . . . . . . . . . . . . . 73
REFERENCES • • • • • • • • • • • • • • • • • • • • • • • • • • • • • • • • • • • • • • • • • • Cl • • 77
iii

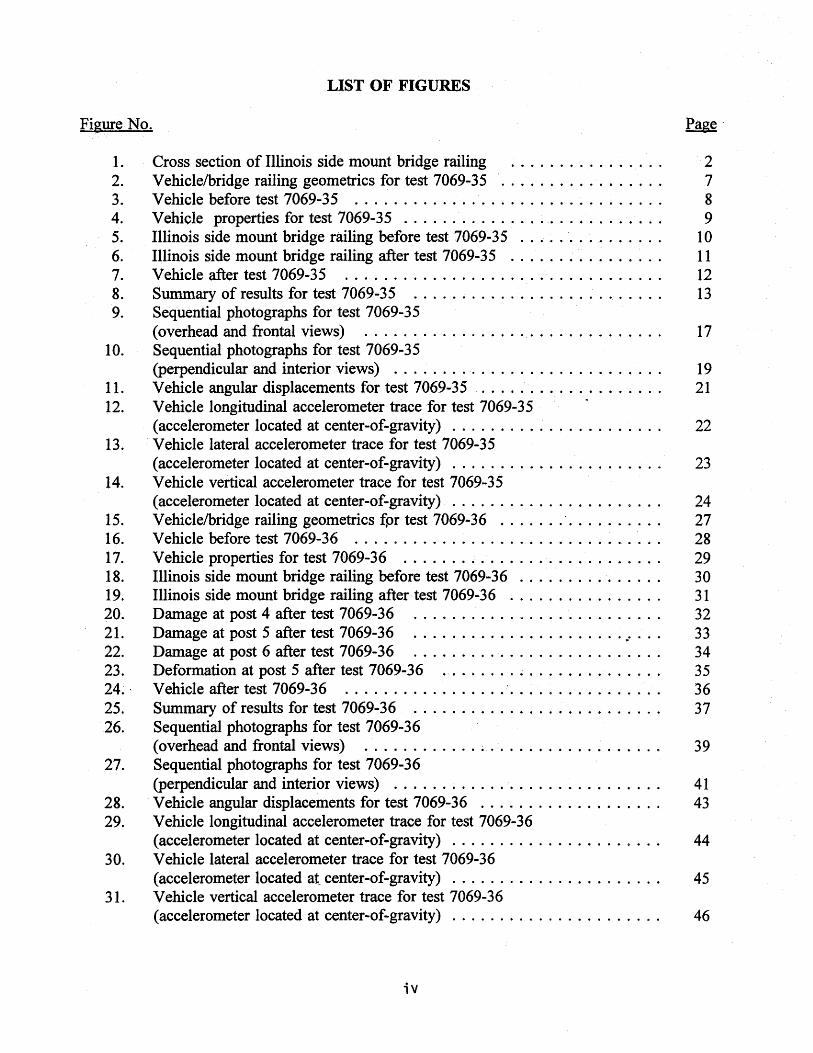
LIST OF FIGURES
Figure No.
1. Cross section of Illinois side mount bridge railing . . . . . . . . . . . . . . . . 2 2. Vehicle/bridge railing geometries for test 7069-35 . . . . . . . . . . . . . . . . . 7 3. Vehicle before test 7069-35 . . . . . . . . . . . . . . . . . . . . . . . . . . . . . . . . 8 4. Vehicle properties for test 7069-35 . . . . . . . . . . . . . . . . . . . . . . . . . . . 9 5. Illinois side mount bridge railing before test 7069-35 . . . . . . . . . . . . . . . 10 6. Illinois side mount bridge railing after test 7069-35 . . . . . . . . . . . . . . . . 11 7. Vehicle after test 7069-35 . . . . . . . . . . . . . . . . . . . . . . . . . . . . . . . . . 12 8. Summary of results for test 7069-35 . . . . . . . . . . . . . . . . . . . . . . . . . . 13 9. Sequential photographs for test 7069-35
(overhead and frontal views) . . . . . . . . . . . . . . . . . . . . . . . . . . . . . . . 17 I 0. Sequential photographs for test 7069-35
(perpendicular and interior views) . . . . . . . . . . . . . . . . . . . . . . . . . . . . 19 II. Vehicle angular displacements for test 7069-35 . . . . . . . . . . . . . . . . . . . 21 12. Vehicle longitudinal accelerometer trace for test 7069-35
(accelerometer located at center-of-gravity) . . . . . . . . . . . . . . . . . . . . . . 22 13. Vehicle lateral accelerometer trace for test 7069-35
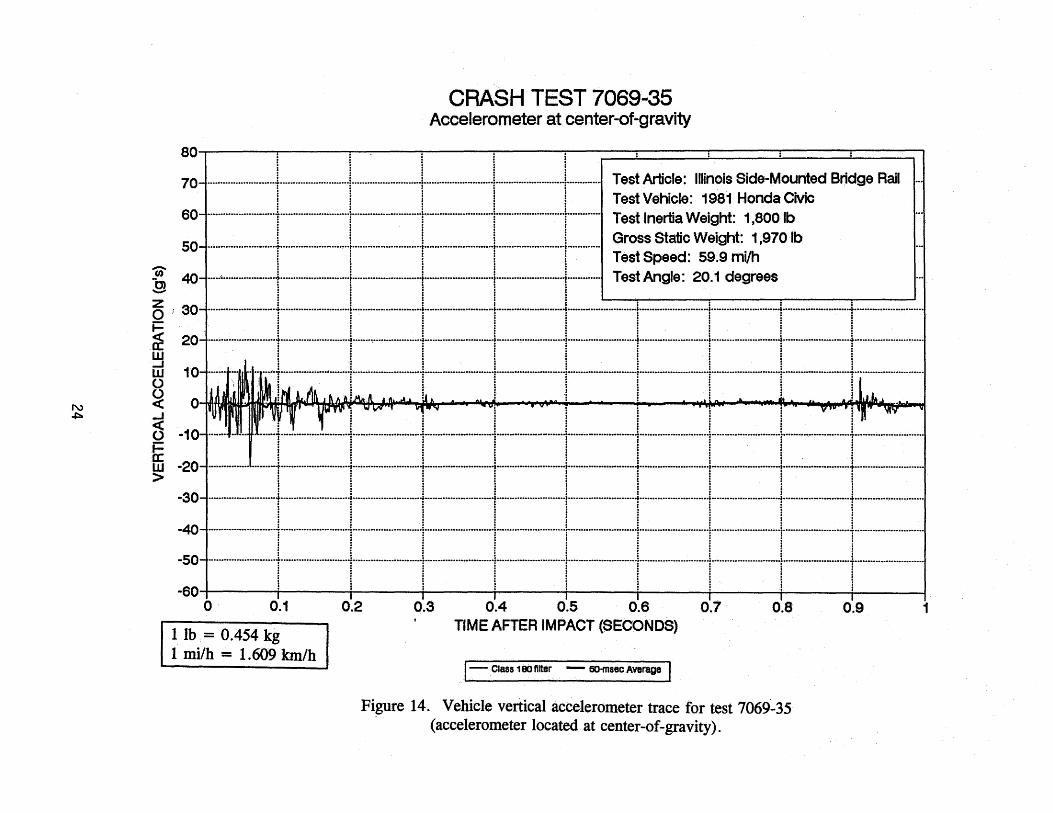
(accelerometer located at center-of-gravity) . . . . . . . . . . . . . . . . . . . . . . 23 14. Vehicle vertical accelerometer trace for test 7069-35
(accelerometer located at center-of-gravity) . . . . . . . . . . . . . . . . . . . . . . 24 15. Vehicle/bridge railing geometries f.or test 7069-36 ....... ·. . . . . . . . . . 27 16. Vehicle before test 7069-36 . . . . . . . . . . . . . . . . . . . . . . . . . . . . . . . . 28 17. Vehicle properties for test 7069-36 . . . . . . . . . . . . . . . . . . . . . . . . . . . 29 18. Illinois side mount bridge railing before test 7069-36 . . . . . . . . . . . . . . . 30 19. Illinois side mount bridge railing after test 7069-36 . . . . . . . . . . . . . . . . 31 20. Damage at post 4 after test 7069-36 . . . . . . . . . . . . . . . . . . . . . . . . . . 32 21. Damage at post 5 after test 7069-36 . . . . . . . . . . . . . . . . . . . . . . . . . . 33 22. Damage at post 6 after test 7069-36 . . . . . . . . . . . . . . . . . . . . . . . . . . 34 23. Deformation at post 5 after test 7069-36 . . . . . . . . . . . . . . . . . . . . . . . 35 24. · Vehicle after test 7069-36 ................. ·. . . . . . . . . . . . . . . . 36 25. Summary of results for test 7069-36 . . . . . . . . . . . . . . . . . . . . . . . . . . 37 26. Sequential photographs for test 7069-36
(overhead- and frontal views) . . . . . . . . . . . . . . . . . . . . . . . . . . . . . . . 39 27. Sequential photographs for test 7069-36
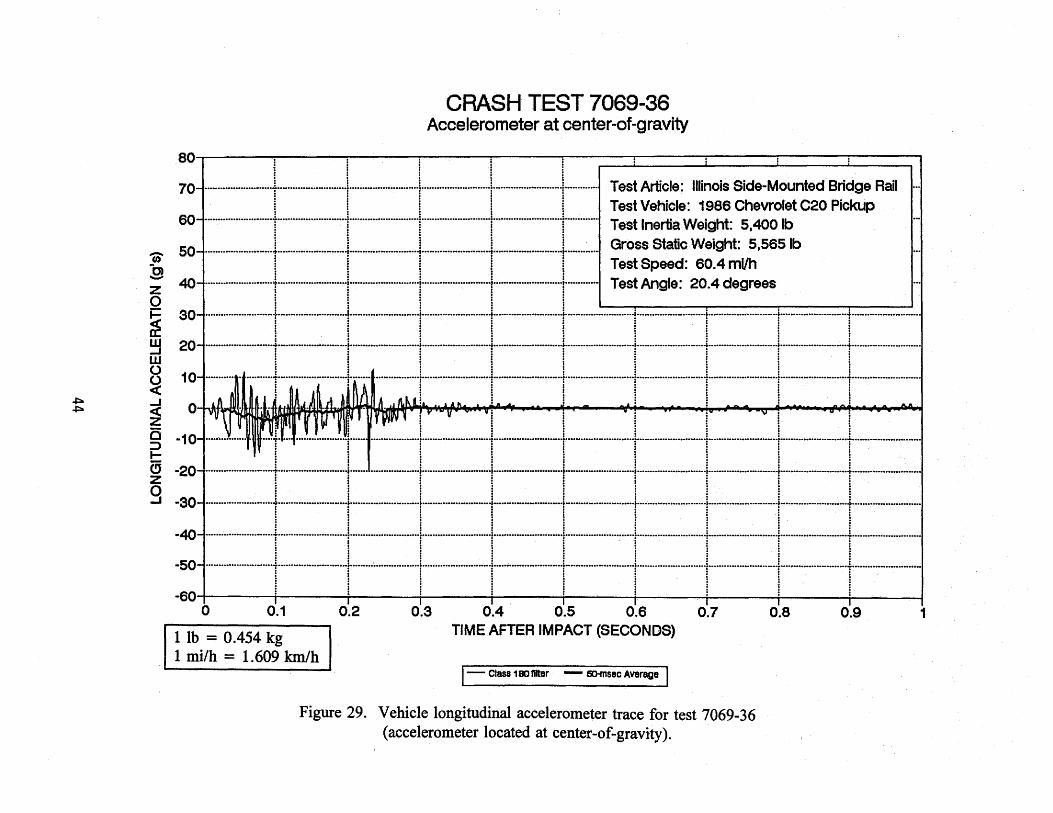
(perpendicular and interior views) . . . . . . . . . . . . . . . . . . . . . . . . . . . . 41 28. Vehicle angular displacements for test 7069-36 . . . . . . . . . . . . . . . . . . . 43 29. Vehicle longitudinal accelerometer trace for test 7069-36
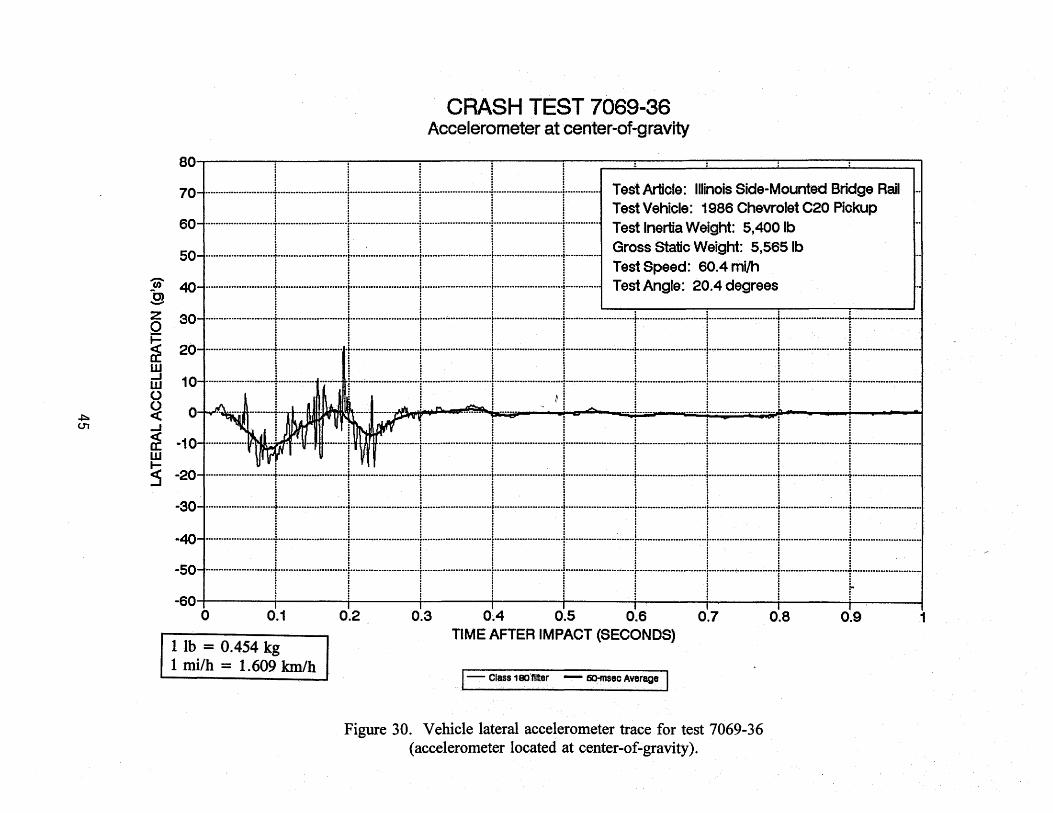
(accelerometer located at center-of-gravity) . . . . . . . . . . . . . . . . . . . . . . 44 30. Vehicle lateral accelerometer trace for test 7069-36
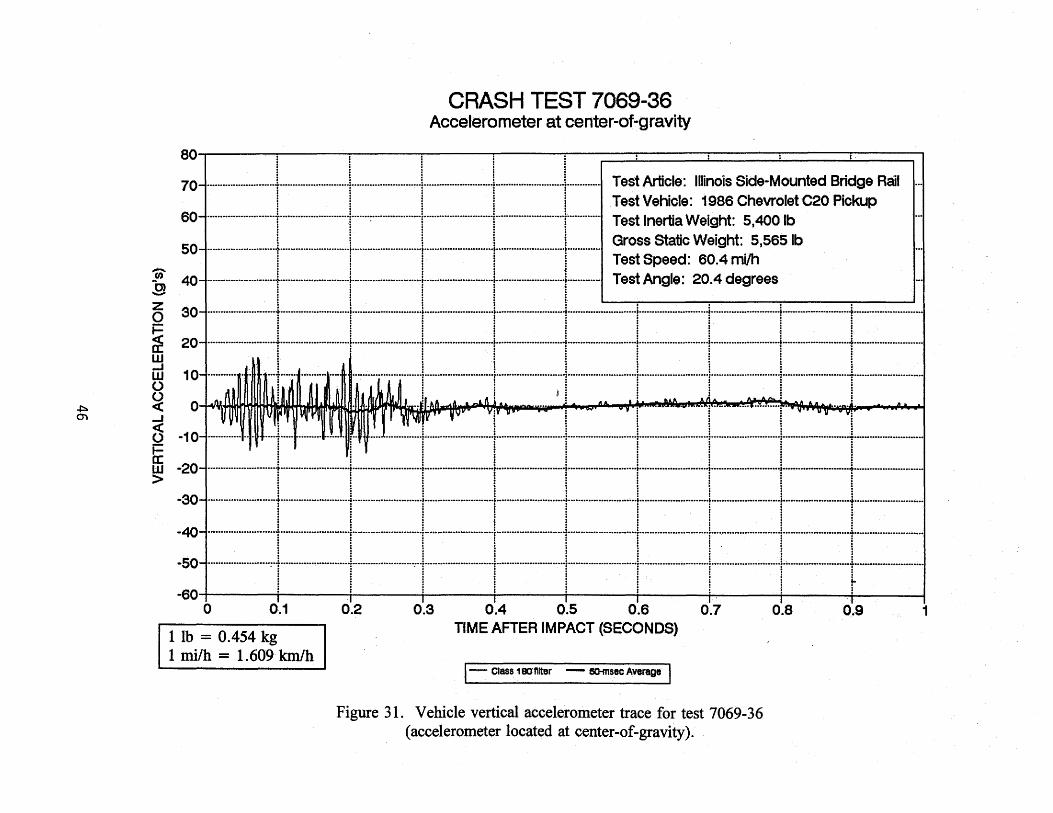
(accelerometer located at center-of-gravity) . . . . . . . . . . . . . . . . . . . . . . 45 31. Vehicle vertical accelerometer trace for test 7069-36
(accelerometer located at center-of-gravity) . . . . . . . . . . . . . . . . . . . . . . 46
iv
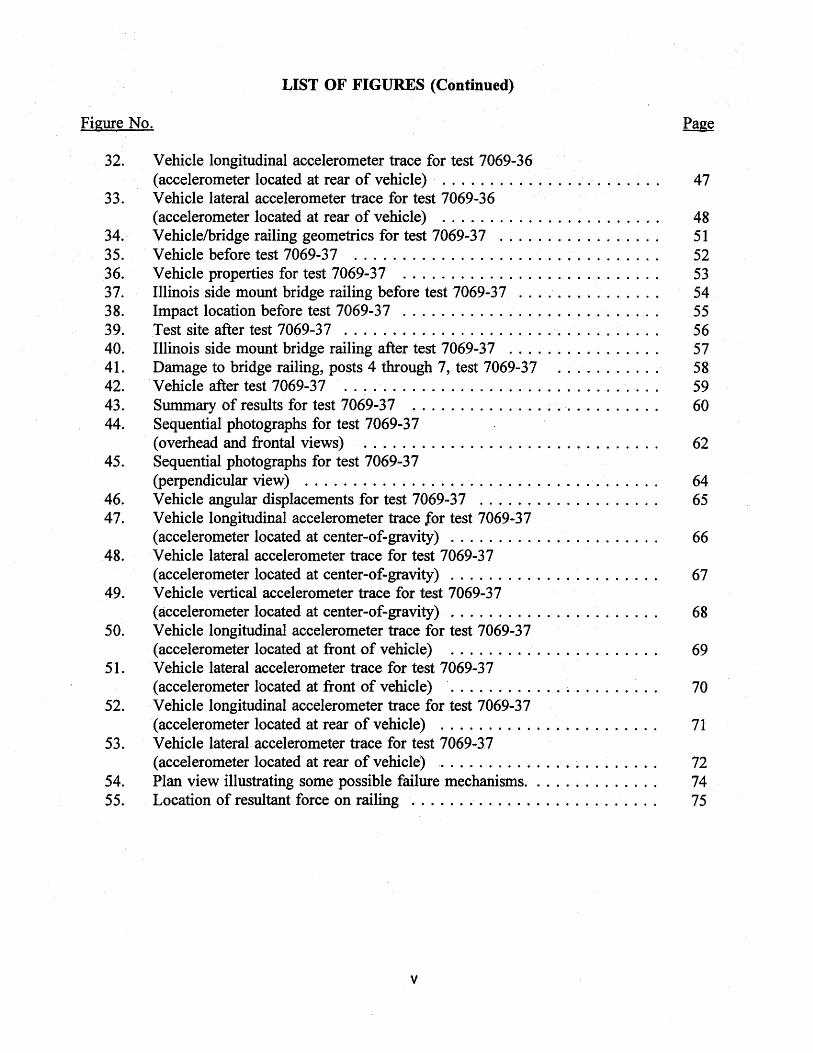
LIST OF FIGURES (Continued)
Figure No.
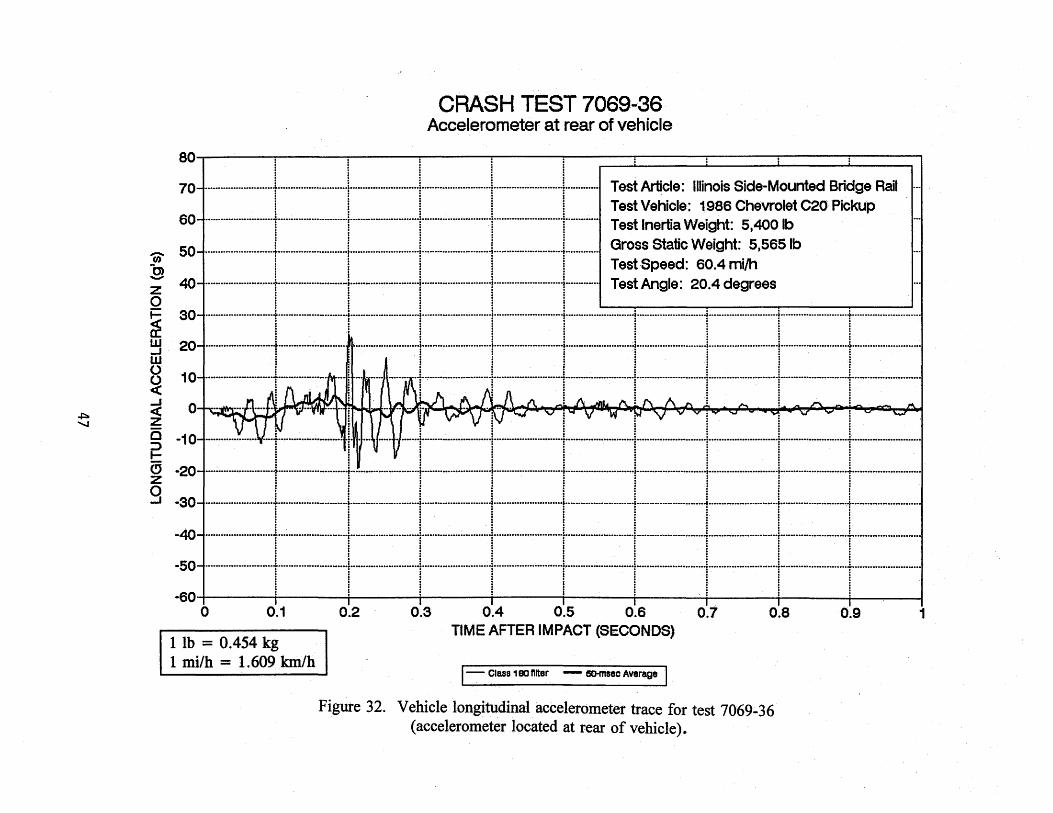
32. Vehicle longitudinal accelerometer trace for test 7069-36 (accelerometer located at rear of vehicle) . . . . . . . . . . . . . . . . . . . . . . . 4 7
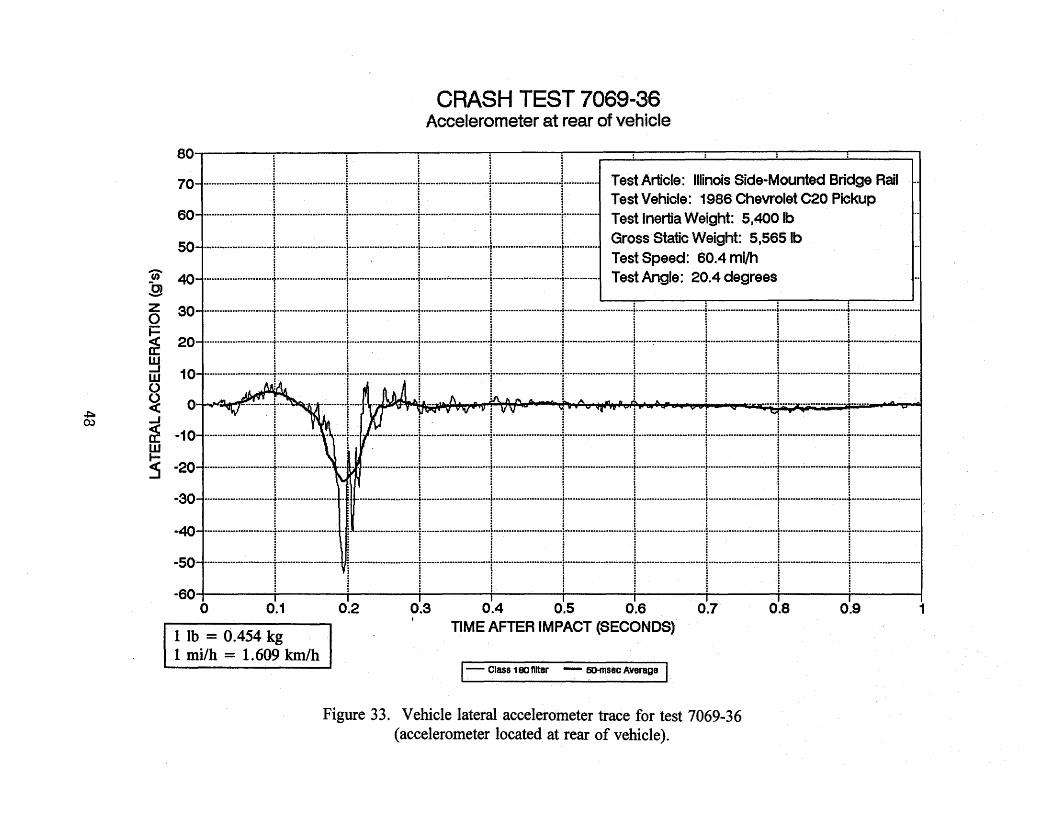
33. Vehicle lateral accelerometer trace for test 7069-36 (accelerometer located at rear of vehicle) . . . . . . . . . . . . . . . . . . . . . . . 48
34. Vehicle/bridge railing geometries for test 7069-37 . . . . . . . . . . . . . . . . . 51 35. Vehicle before test 7069-37 . . . . . . . . . . . . . . . . . . . . . . . . . . . . . . . . 52 36. Vehicle properties for test 7069-37 . . . . . . . . . . . . . . . . . . . . . . . . . . . 53 37. Illinois side mount bridge railing before test 7069-37 . . . . . . . . . . . . . . . 54 38. Impact location before test 7069-37 . . . . . . . . . . . . . . . . . . . . . . . . . . . 55 39. Test site after test 7069-37 . . . . . . . . . . . . . . . . . . . . . . . . . . . . . . . . . 56 40. Illinois side mount bridge railing after test 7069-37 . . . . . . . . . . . . . . . . 57 41. Damage to bridge railing, posts 4 through 7, test 7069-37 . . . . . . . . . . . 58 42. Vehicle after test 7069-37 . . . . . . . . . . . . . . . . . . . . . . . . . . . . . . . . . 59 43. Summary of results for test 7069-37 . . . . . . . . . . . . . . . . . . . . . . . . . . 60 44. Sequential photographs for test 7069-37
(overhead and frontal views) . . . . . . . . . . . . . . . . . . . . . . . . . . . . . . . 62 45. Sequential photographs for test 7069-37
(perpendicular view) . . . . . . . . . . . . . . . . . . . . . . . . . . . . . . . . . . . . . 64 46. Vehicle angular displacements for test 7069-37 . . . . . . . . . . . . . . . . . . . 65 47. Vehicle longitudinal accelerometer trace for test 7069-37
(accelerometer located at center-of-gravity) . . . . . . . . . . . . . . . . . . . . . . 66 48. Vehicle lateral accelerometer trace for test 7069-37
(accelerometer located at center-of-gravity) . . . . . . . . . . . . . . . . . . . . . . 67 49. Vehicle vertical accelerometer trace for test 7069-37
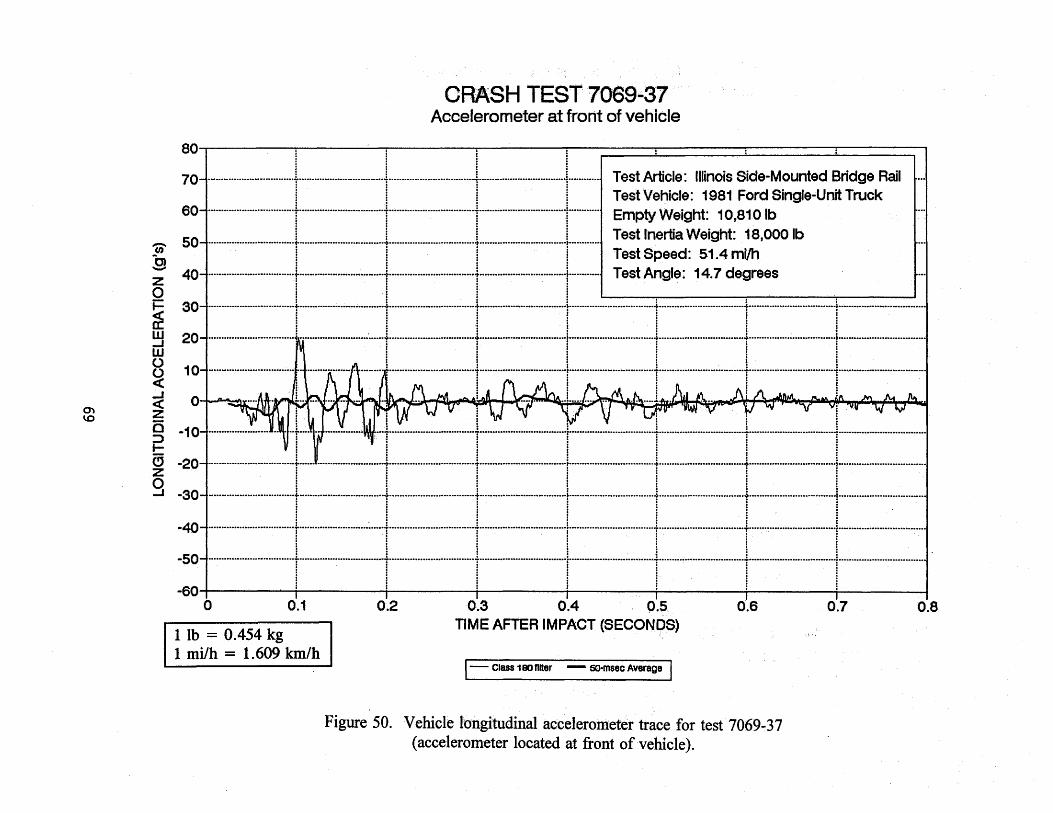
(accelerometer located at center-of-gravity) . . . . . . . . . . . . . . . . . . . . . . 68 50. Vehicle longitudinal accelerometer trace for test 7069-37
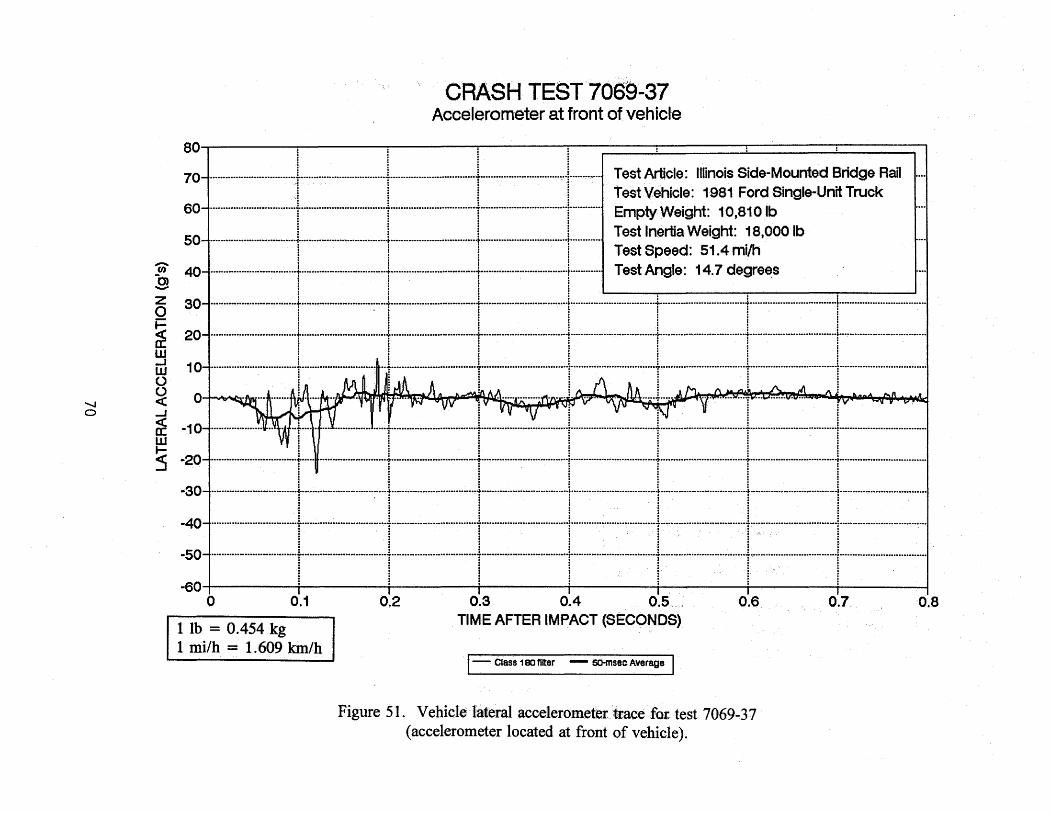
(accelerometer located at front of vehicle) . . . . . . . . . . . . . . . . . . . . . . 69 51. Vehicle lateral accelerometer trace for test 7069-37
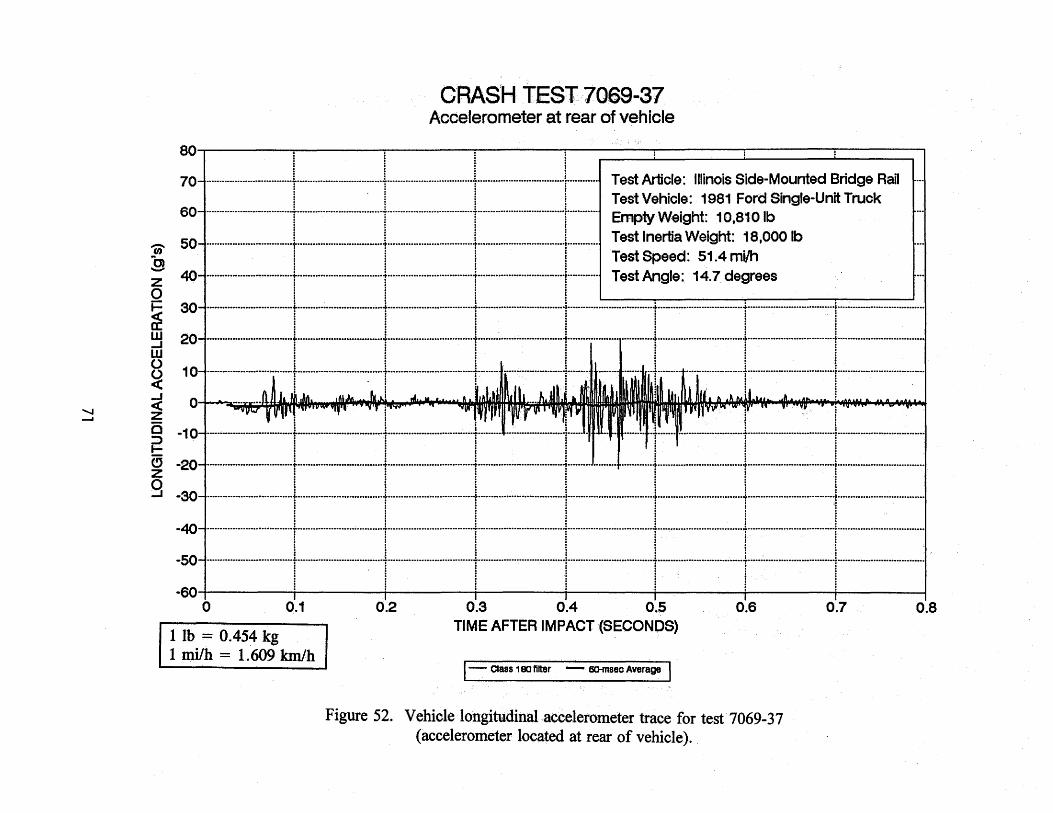
(accelerometer located at front of vehicle) · . . . . . . . . . . . . ~ . . . . . . ~ . . 70 52. Vehicle longitudinal accelerometer trace for test 7069-37
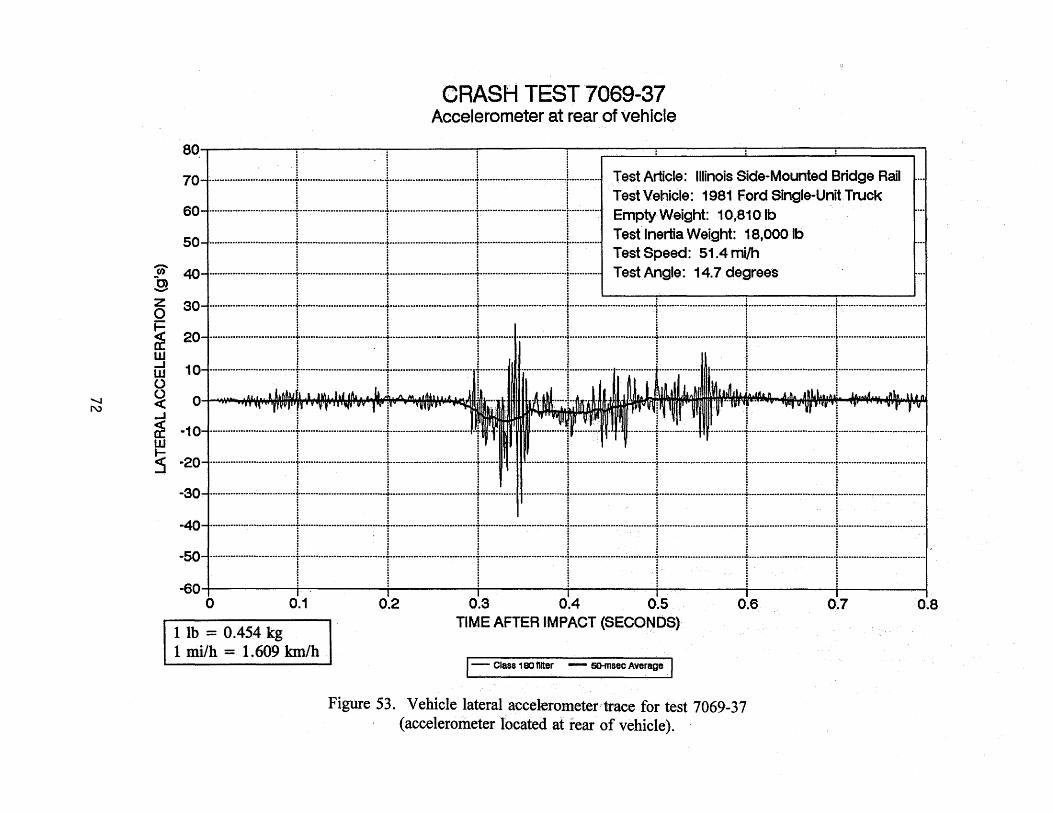
(accelerometer located at rear of vehicle) . . . . . . . . . . . . . . . . . . . . . . . 71 53. Vehicle lateral accelerometer trace for test 7069-37
(accelerometer located at rear of vehicle) . . . . . . . . . . . . . . . . . . . . . . . 72 54. Plan view illustrating some possible failure mechanisms. . . . . . . . . . . . . . 74 55. Location of resultant force on railing . . . . . . . . . . . . . . . . . . . . . . . . . . 7 5
v
LIST OF TABLES
Table No.
I. Evaluation of crash test no. 7069-35 . . . . . . . . . . . . . . . . . . . . . . . . . . 14 2~ Bridge railing performance levels and crash test criteria . . . . . . . . . . . . . 15 3. Evaluation of crash test no. 7069-36 . . . . . . . . . . . . . . . . . . . . . . . . . . 38 4. Evaluation of crash test no. 7069-37 . . . . . . . . . . . . . . . . . . . . . . . . . . 61
vi

CHAPTER 1. DESIGN OF RAILING
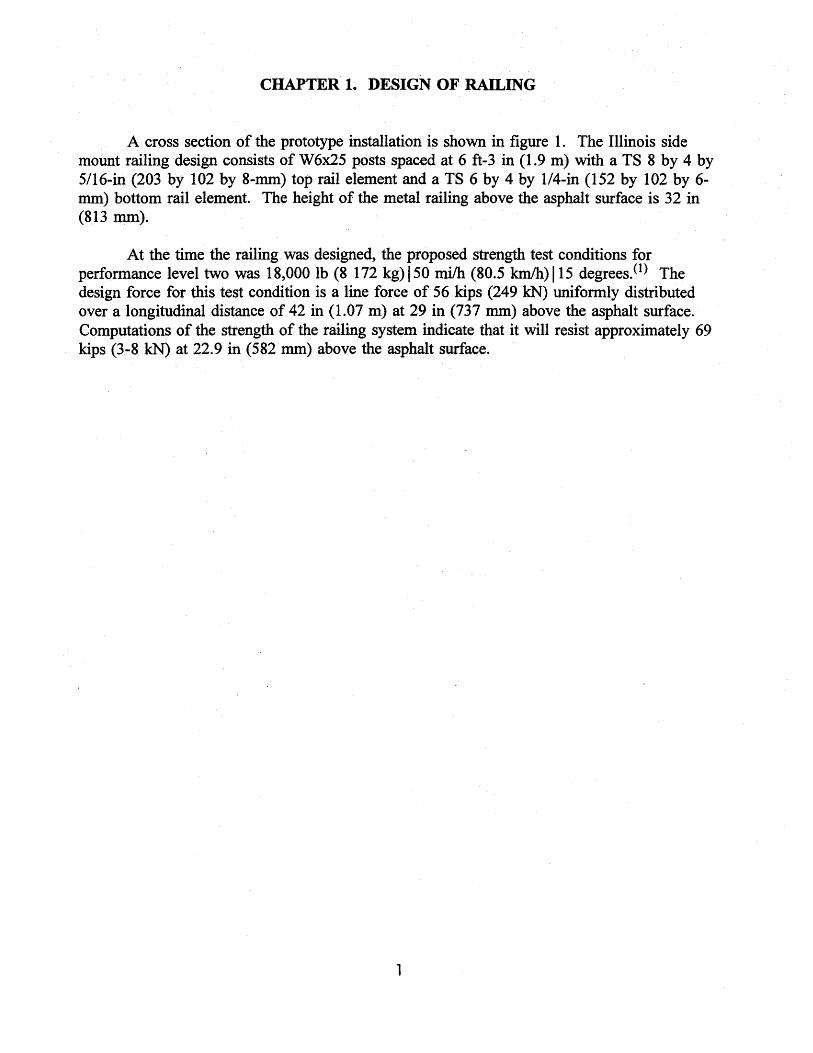
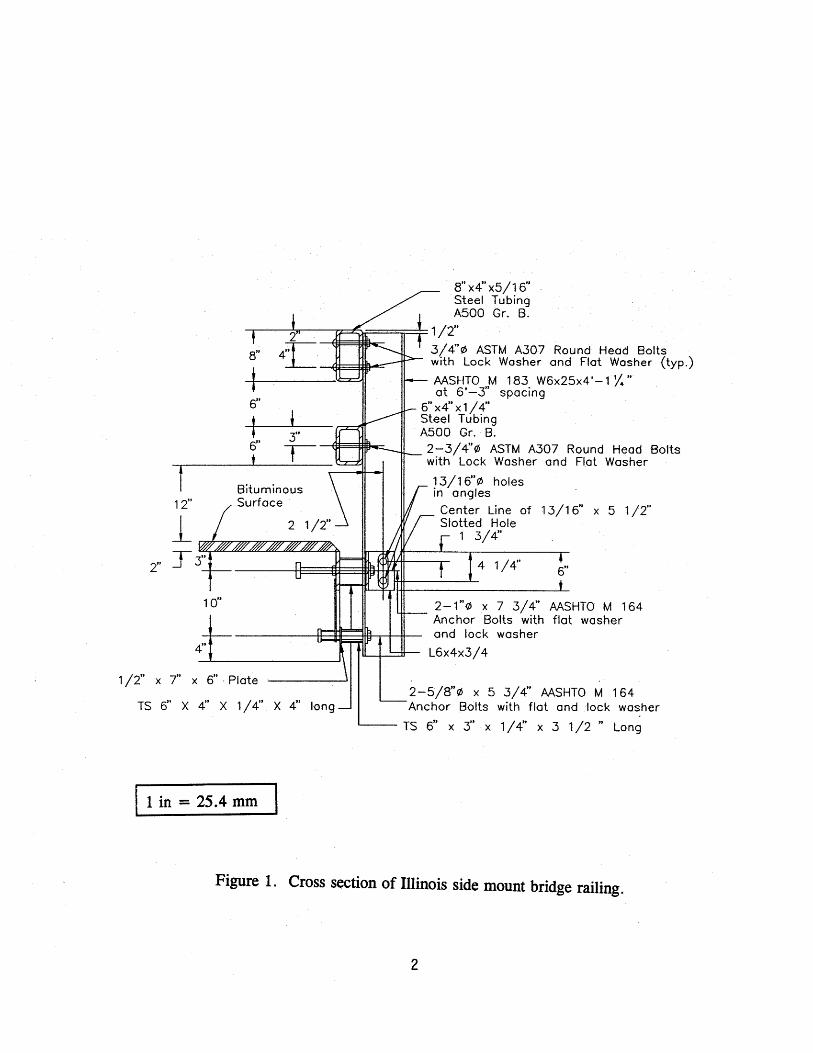
A cross section of the prototype installation is shown in figure 1. The Illinois side mount railing design consists of W6x25 posts spaced at 6 ft-3 in (1.9 m) with a TS 8 by 4 by 5/16-in (203 by 102 by 8-mm) top rail element and a TS 6 by 4 by 1/4-in (152 by 102 by 6-mm) bottom rail element. The height ofthe metal railing above the asphalt surface is 32 in (813 mm).
At the time the railing was designed, the proposed strength test conditions for performance level two was 18,000 lb (8 172 kg) ISO milh (80.5 km/h) liS degrees. (1) The design force for this test condition is a line force of 56 kips (249 kN) uniformly distributed over a longitudinal distance of 42 in (1.07 m) at 29 in (737 mm) above the asphalt surface. Computations of the strength of the railing system indicate that it will resist approximately 69 kips (3-8 kN) at 22.9 in (582 nun) above the asphalt surface.
1
8"x4"x5/16" Steel Tubing
1 ASOO Gr. B. ~-~-~~;::::====;;:::::::t=! 1 /2"
'3/4"¢ ASTM A307 Round Head Bolts
6"
6" 3"
I Bituminous Surface
2"
1 /2" x 7" x 6" . Plate
TS 6" X 4" X 1 I 4"
1 in = 25.4 mm
with Lock Washer and Flat Washer (typ.) AASHTO M 183 W6x25x4' -1 %" at 6'-3" spacing
6"x4"x1/4" Steel Tubing A500 Gr. B. 2-3/4"¢ ASTM A307 Round Head Bolts with Lock Washer and Flat Washer
13/16"¢ holes in angles
Center Line of 13/16" x 5 1 /2" Slotted Hole
1 3/4''
4 1/4" 6"
2-1''¢ x 7 3/ 4" AASHTO M 164 Anchor Bolts with flat washer and lock washer
L6x4x3/4
2-5/8"¢ x 5 3/4" AASHTO M 164 Anchor Bolts with flat and lock washer
.____ TS 6" x 3" x 1/4" x 3 1/2 " Long
Figure 1. Cross section of Illinois side mount bridge railing.
2
CHAPTER 2. CRASH TEST PROCEDURES
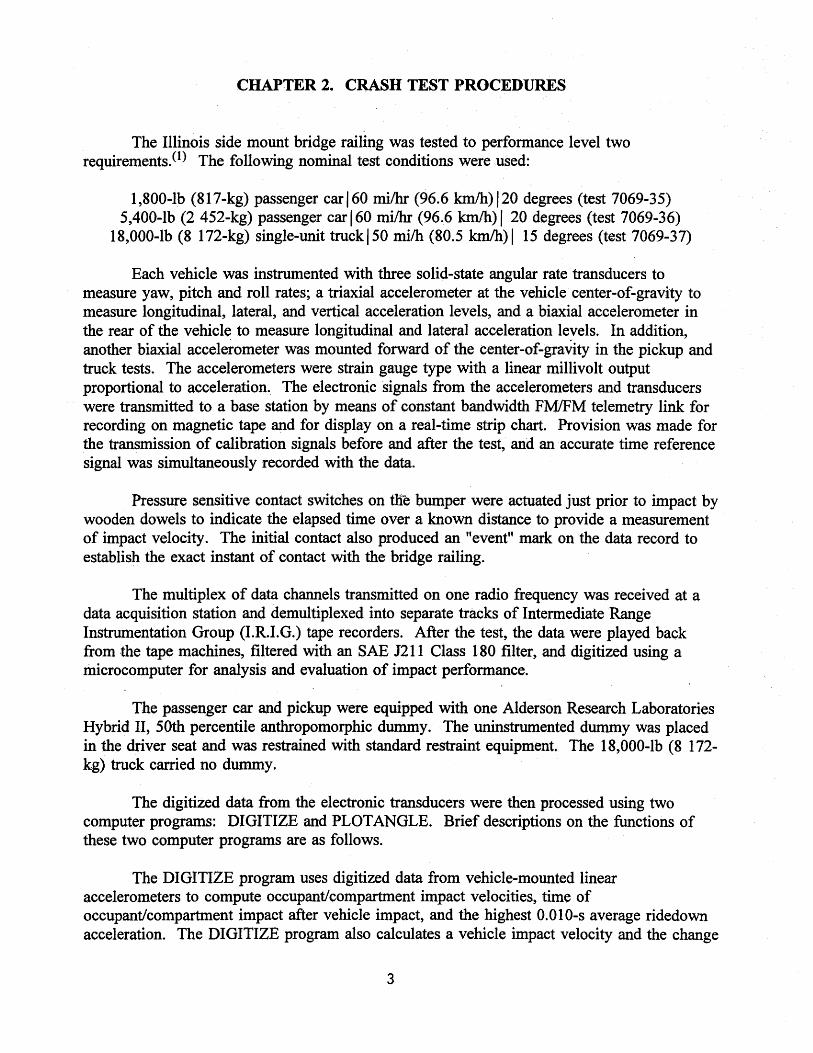
The Illinois side mount bridge railing was tested to performance level two requirements. (I) The following nominal test conditions were used:
1 ,800-lb {817-kg) passenger car 160 milhr (96.6 km/h) 120 degrees (test 7069-35) 5,400-lb (2 452-kg) passenger car 160 milhr (96.6 km/h) I 20 degrees (test 7069-36)
18,000-lb (8 172-kg) single-unit truck ISO milh {80.5 km/h) I 15 degrees (test 7069-37)
Each vehicle was instrumented with three solid-state angular rate transducers to measure yaw, pitch and roll rates; a triaxial accelerometer at the vehicle center-of-gravity to measure longitudinal, lateral, and vertical acceleration levels, and a biaxial accelerometer in the rear of the vehicle to measure longitudinal and lateral acceleration levels. In addition, another biaxial accelerometer was mounted forward of the center-of-gravity in the pickup and truck tests. The accelerometers were strain gauge type with a linear millivolt output proportional to acceleration. The electronic signals from the accelerometers and transducers were transmitted to a base station by means of constant bandwidth FM/FM telemetry link for recording on magnetic tape and for display on a real-time strip chart. Provision was made for the transmission of calibration signals before and after the test, and an accurate time reference signal was simultaneously recorded with the data.
Pressure sensitive contact switches on the bumper were actuated just prior to impact by wooden dowels to indicate the elapsed time over a known distance to provide a measurement of impact velocity. The initial contact also produced an "event" mark on the data record to establish the exact instant of contact with the bridge railing.
The multiplex of data channels transmitted on one radio frequency was received at a data acquisition station and demultiplexed into separate tracks of Intermediate Range Instrumentation Group (I. R.I. G.) tape recorders. After the test, the data were played back from the tape machines, filtered with an SAE J211 Class 180 filter, and digitized using a microcomputer for analysis and evaluation of impact performance.
The passenger car and pickup were equipped with one Alderson Research Laboratories Hybrid II, 50th percentile anthropomorphic dummy. The uninstrumented dummy was placed in the driver seat and was restrained with standard restraint equipment. The 18,000-lb (8 172-kg) truck carried no dummy.
The digitized data from the electronic transducers were then processed using two computer programs: DIGITIZE and PLOT ANGLE. Brief descriptions on the functions of these two computer programs are as follows.
The DIGITIZE program uses digitized data from vehicle-mounted linear accelerometers to compute occupant/compartment impact velocities, time of occupant/compartment impact after vehicle impact, and the highest 0.010-s average ridedown acceleration. The DIGITIZE program also calculates a vehicle impact velocity and the change
3
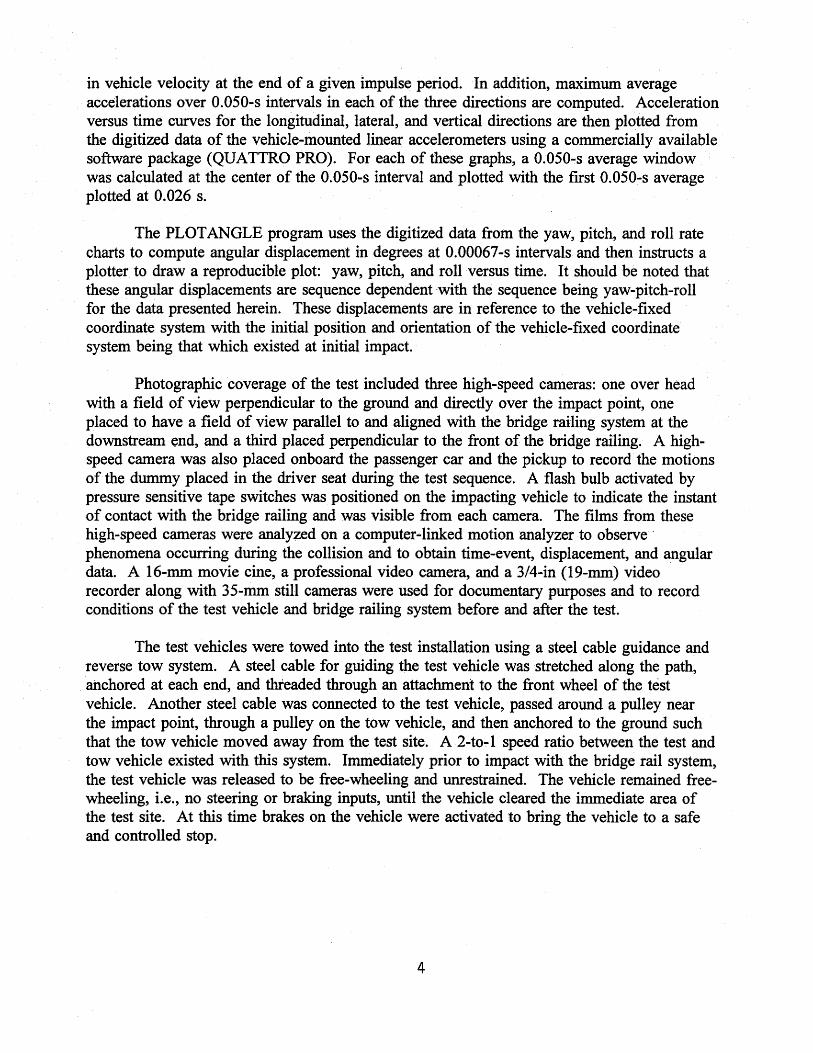
in vehicle velocity at the end of a given impulse period. In addition, maximum average accelerations over 0.050-s intervals in each of the three directions are computed. Acceleration versus time curves for the longitudinal, lateral, and vertical directions are then plotted from the digitized data of the vehicle-mounted linear accelerometers using a commercially available software package (QUATTRO PRO). For each of these graphs, a 0.050-s average window was calculated at the center of the 0.050-s interval and plotted with the first 0.050-s average plotted at 0. 026 s.
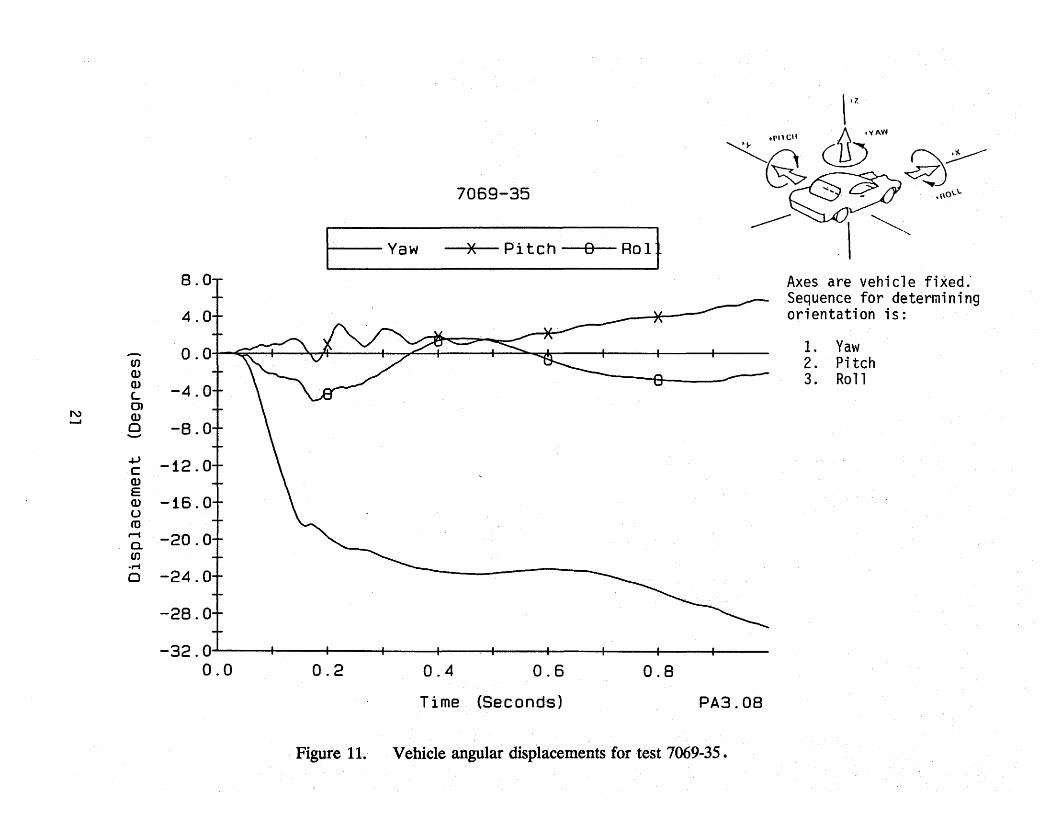
The PLOT ANGLE program uses the digitized data from the yaw, pitch, and roll rate charts to compute angular displacement in degrees at 0.00067-s intervals and then instructs a plotter to draw a reproducible plot: yaw, pitch, and roll versus time. It should be noted that these angular displacements are sequence dependent ·with the sequence being yaw-pitch-roll for the data presented herein. These displacements are in reference to the vehicle-fixed coordinate system with the initial position and orientation of the vehicle-fixed coordinate system being that which existed at initial impact.
Photographic coverage of the test included three high-speed cameras: one over head with a field of view perpendicular to the ground and directly over the impact point, one placed to have a field of view parallel to and aligned with the bridge railing system at the downstream end, and a third placed perpendicular to the front· of the bridge railing. A highspeed camera was also placed onboard the passenger car and the pickup to record· the motions of the dummy placed in the driver seat during the test sequence. A flash bulb activated by pressure sensitive tape switches was positioned on the impacting vehicle to indicate the instant of contact with the bridge railing and was visible from each camera. The films from these high-speed cameras were analyzed on a computer-linked motion analyzer to observe · phenomena occurring during the collision and to obtain time-event, displacement, and angular data. A 16-mm movie cine, a professional video camera, and a 3/4-in (19-mm) video recorder along with 35-mm still cameras were used for documentary purposes and to record conditions of the test vehicle and bridge railing system before and after the test.
The test vehicles were towed into the test installation using a steel cable guidance and reverse tow system. A steel cable for guiding the test vehicle was stretched along the path, anchored at each end, and threaded through an attachment to the front wheel of the test vehicle. Another steel cable was connected to the test vehicle, passed around a pulley near the impact point, through a pulley on the tow vehicle, and then anchored to the ground such that the tow vehicle moved away from the test site. A 2-to-1 speed ratio between the test and tow vehicle existed with this system. Immediately prior to impact with the bridge rail system, the test vehicle was released to be free-wheeling and unrestrained. The vehicle remained freewheeling, i.e., no steering or braking inputs, until the vehicle cleared the immediate area of the test site. At this time brakes on the vehicle were activated to bring the vehicle to a safe and controlled stop.
4
CHAPTER 3. FULL-SCALE CRASH TESTS
TEST 7069-35
Test Description
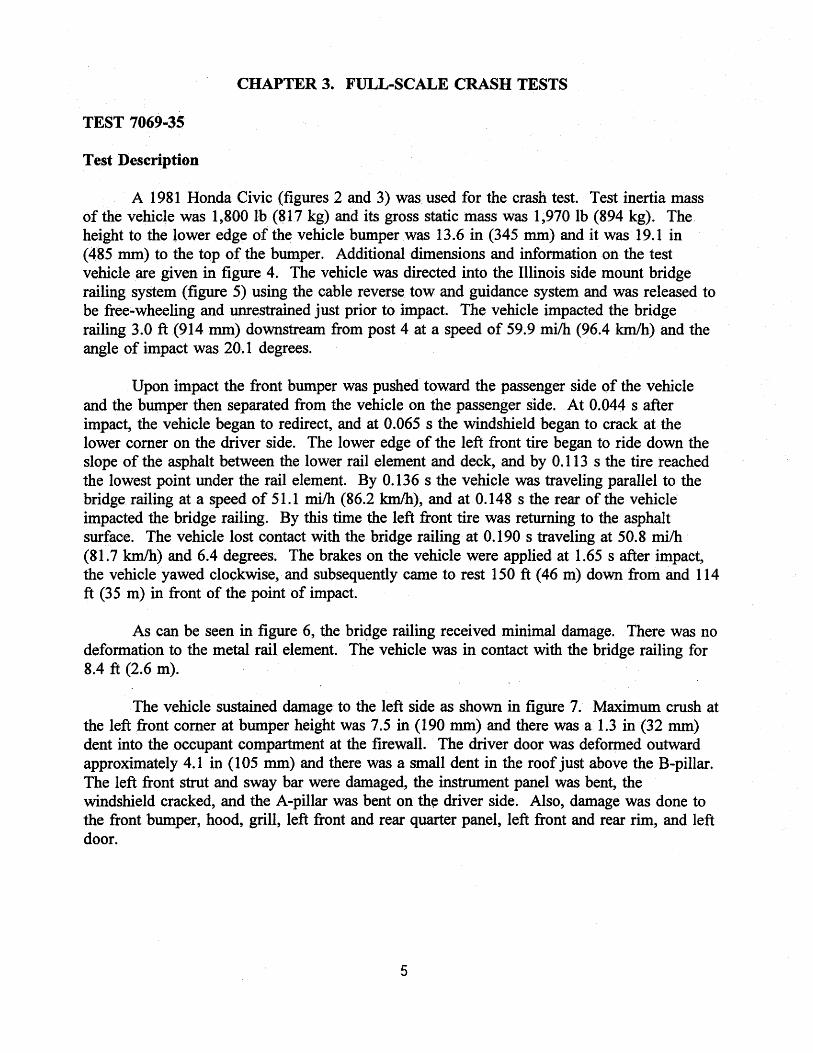
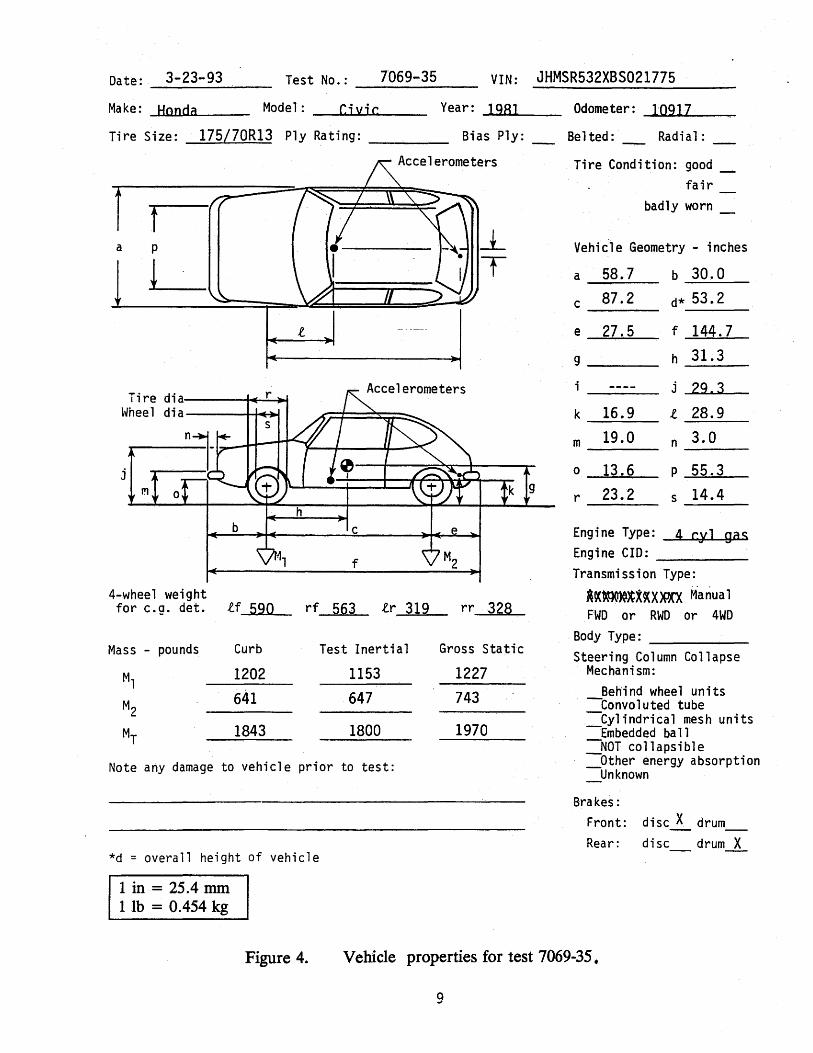
A 1981 Honda Civic (figures 2 and 3) was used for the crash test. Test inertia mass of the vehicle was 1,800 lb (817 kg) and its gross static mass was 1,970 lb (894 kg). The height to the lower edge of the vehicle bumper was 13.6 in (345 mm) and it was 19.1 in (485 mm) to the top of the bumper. Additional dimensions and information on the test vehicle are given in figure 4. The vehicle was directed into the Illinois side mount bridge railing system (figure 5) using the cable reverse tow and guidance system and was released to be free-wheeling and unrestrained just prior to impact. The vehicle impacted the bridge railing 3.0 ft (914 mm) downstream from post 4 at a speed of 59.9 mi/h (96.4 kmlh) and the angle of impact was 20.1 degrees.
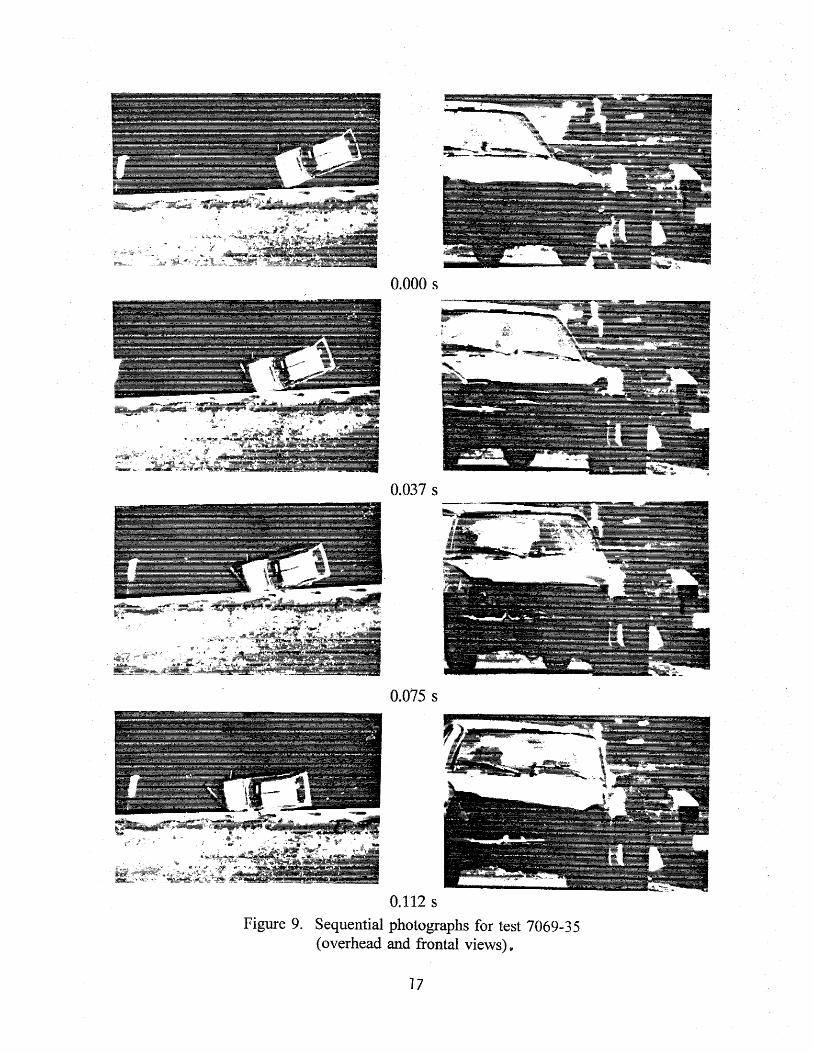
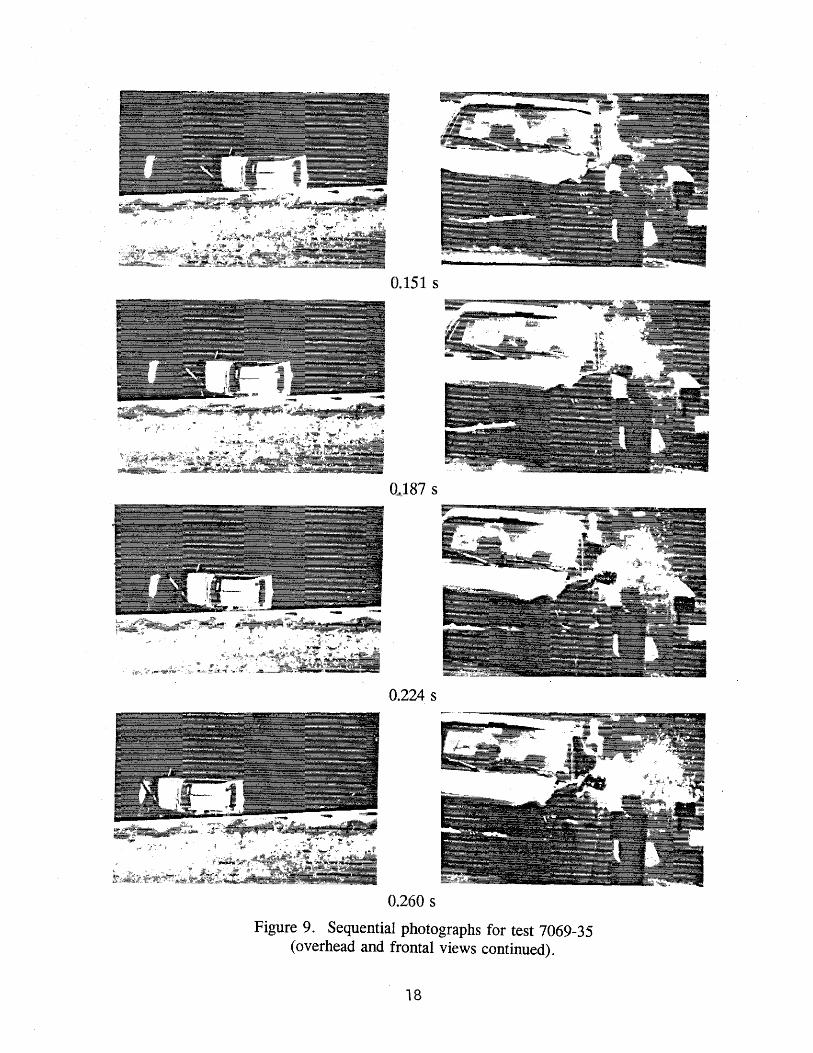
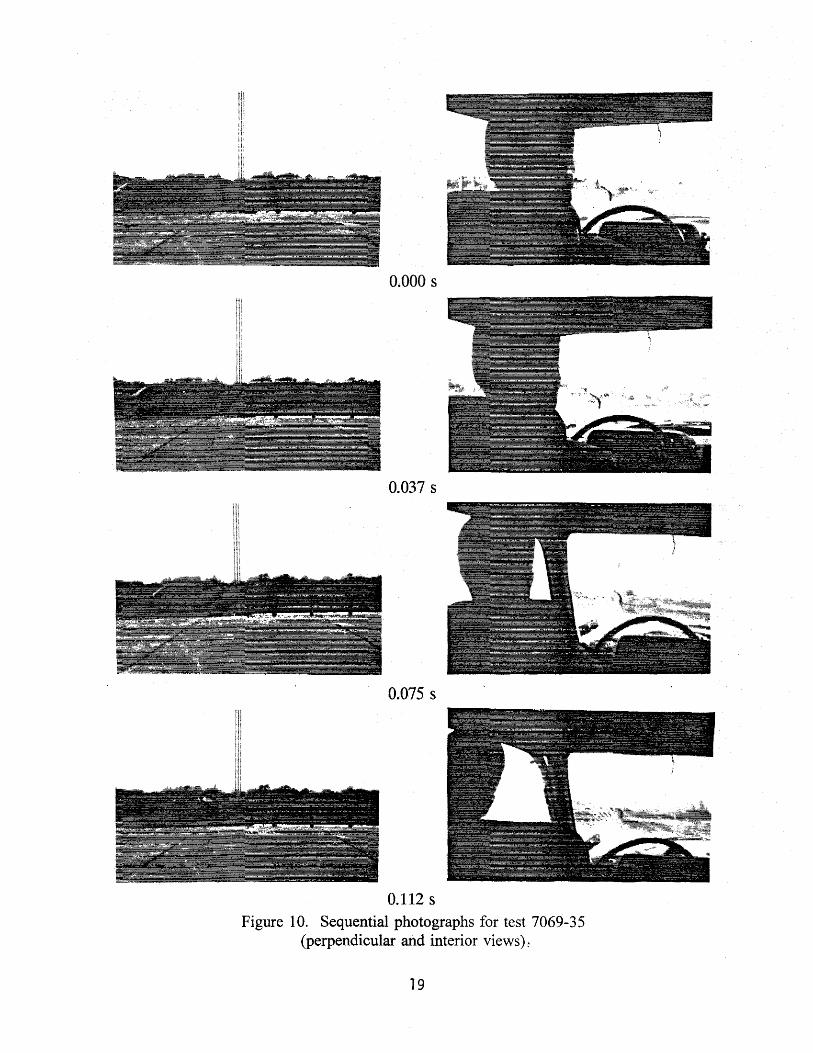
Upon impact the front bumper was pushed toward the passenger side of the vehicle and the bumper then separated from the vehicle on the passenger side. At 0.044 s after impact, the vehicle began to redirect, and at 0.065 s the windshield began to crack at the lower corner on the driver side. The lower edge of the left front tire began to ride down the slope of the asphalt between the lower rail element and deck, and by 0.113 s the tire reached the lowest point under the rail element. By 0.136 s the vehicle was traveling parallel to the bridge railing at a speed of 51.1 milh (86.2 kmlh), and at. 0.148 s the rear of the vehicle impacted the bridge railing. By this time the left front tire was returning to the asphalt surface. The vehicle lost contact with the bridge railing at 0.190 s traveling at 50.8 milh (81. 7 kmlh) and 6.4 degrees~ The brakes on the vehicle were applied at 1.65 s after impact, the vehicle yawed clockwise, and subsequently came to rest 150ft (46 m) down from and 114 ft (35 m) in front of the point of impact.
As can be seen in figure 6, the bri~ge railing received minimal damage. There was no deformation to the metal rail element. The vehicle was in contact with the bridge railing for 8.4 ft (2.6 m).
The vehicle sustained damage to the left side as shown in figure 7. Maximum crush at the left frontcorner at bumper height was 7.5 in (190 mm) and there was a 1.3 in (32 nun) dent into the occupant compartment at the firewall. The driver door was deformed outward approximately 4.1 in (105 mm) and there was a small dent in the roof just above the B-pillar. The left front strut and sway bar were damaged, the instrument panel was bent, the windshield cracked, and the A-pillar was bent on th~ driver side. Also, damage was done to the front bumper, hood, grill, left front and rear quarter panel, left front and rear rim, and left door.
5
Test Results
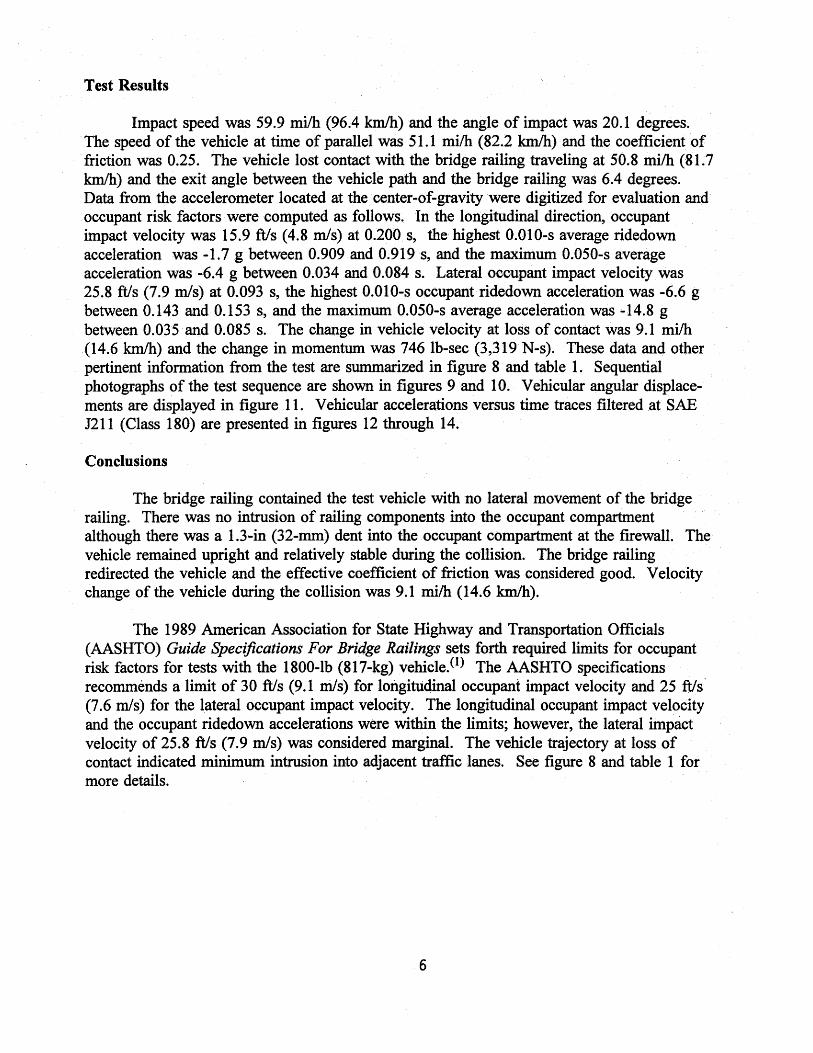
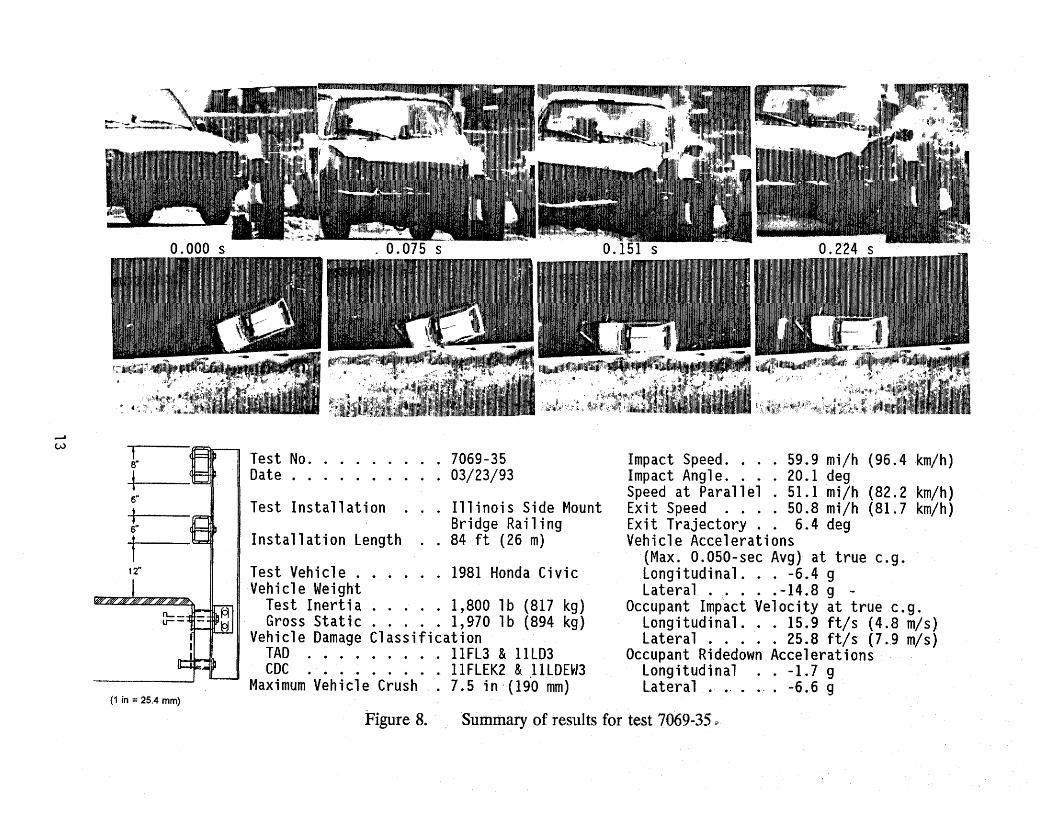
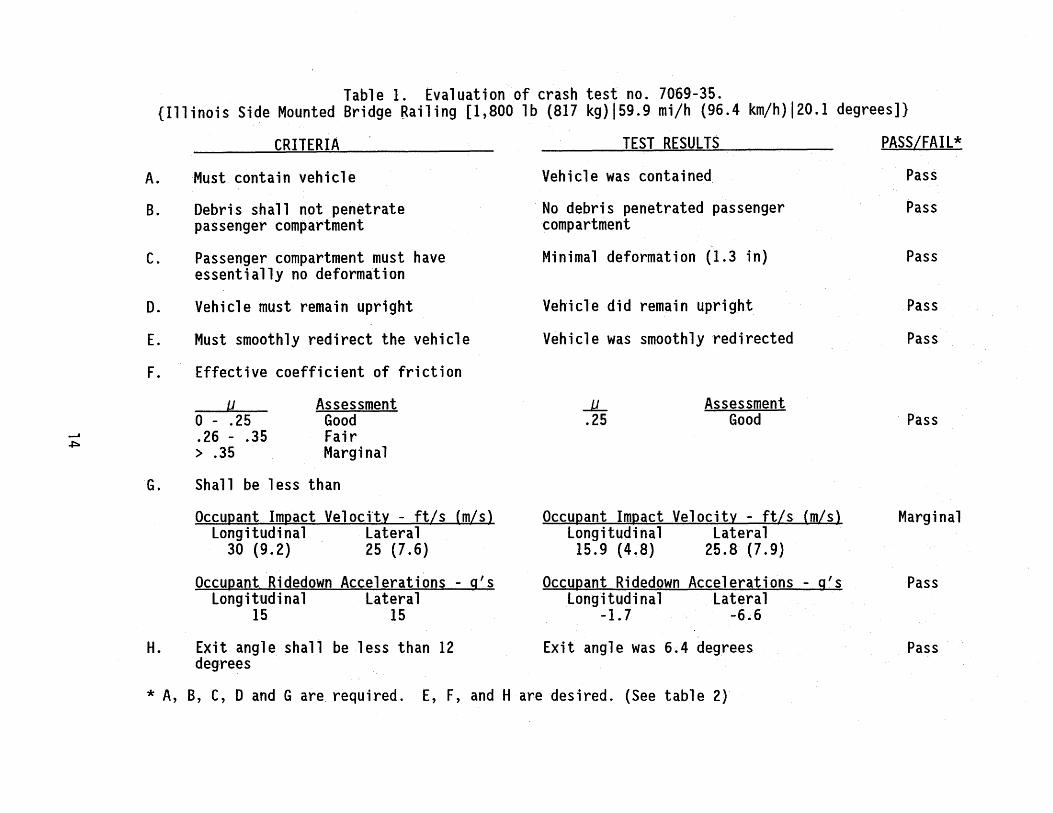
Impact speed was 59.9 milh (96.4 kmlh) and the angle of impact was 20.1 degrees. The speed of the vehicle at time of parallel was 51.1 milh (82.2 km/h) and the coefficient of friction was 0.25. The vehicle lost contact with the bridge railing traveling at 50.8 milh (81.7 km/h) and the exit angle between the vehicle path and the bridge railing was 6.4 degrees. Data from the accelerometer located at the center-of-gravity were digitized for evaluation and occupant risk factors were computed as follows. In the longitudinal direction, occupant impact velocity was 15.9 ft/s (4.8 m/s) at 0.200 s, the highest 0.010-s average ridedown acceleration was -1.7 g between 0.909 and 0.919 s, and the maximum 0.050-s average acceleration was -6.4 g between 0.034 and 0.084 s. Lateral occupant impact velocity was 25.8 ft/s (7.9 m/s) at 0.093 s, the highest 0.010-s occupant ridedown acceleration was -6.6 g between 0.143 and 0.153 s, and the maximum 0.050-s average acceleration was -14.8 g between 0.035 and 0.085 s. The change in vehicle velocity at loss of contact was 9.1 mi/h (14.6 km/h) and the change in momentum was 746 lb-sec (3,319 N-s). These data and other pertinent information from the test are summarized in figure 8 and table 1. Sequential photographs of the test sequence are shown in figures 9 and 10. Vehicular angular displacements are displayed in figure 11. Vehicular accelerations versus time traces filtered at SAE J211 (Class 180) are presented in figures 12 through 14.
Conclusions
The bridge railing contained the test vehicle with no lateral movement of the bridge railing. There was no intrusion of railing components into the occupant compartment although there was a 1.3-in (32-mm) dent into the occupant compartment at the firewall. The vehicle remained upright and relatively stable during the collision. The bridge railing redirected the vehicle and the effective coefficient of friction was considered good. Velocity change of the vehicle during the collision was 9.1 mi/h (14.6 kmlh).
The 1989 American Association for State Highway and Transportation Officials (AASHTO) Guide Specifications For Bridge Railings sets forth required limits for occupant risk factors for tests with the 1800-lb (817 -kg) vehicle. (I) The AASHTO specifications recommends a limit of 30 ft/s (9.1 nils) for longitudinal occupant impact velocity and 25 ft/s· (7.6 m/s) for the lateral occupant impact velocity. The longitudinal occupant impact velocity and the occupant ridedown accelerations were within the limits; however, the lateral impact velocity of 25.8 ft/s (7.9 m/s) was considered marginal. The vehicle trajectory at loss of contact indicated minimum intrusion into adjacent traffic lanes. See figure 8 and table 1 for more details.
6
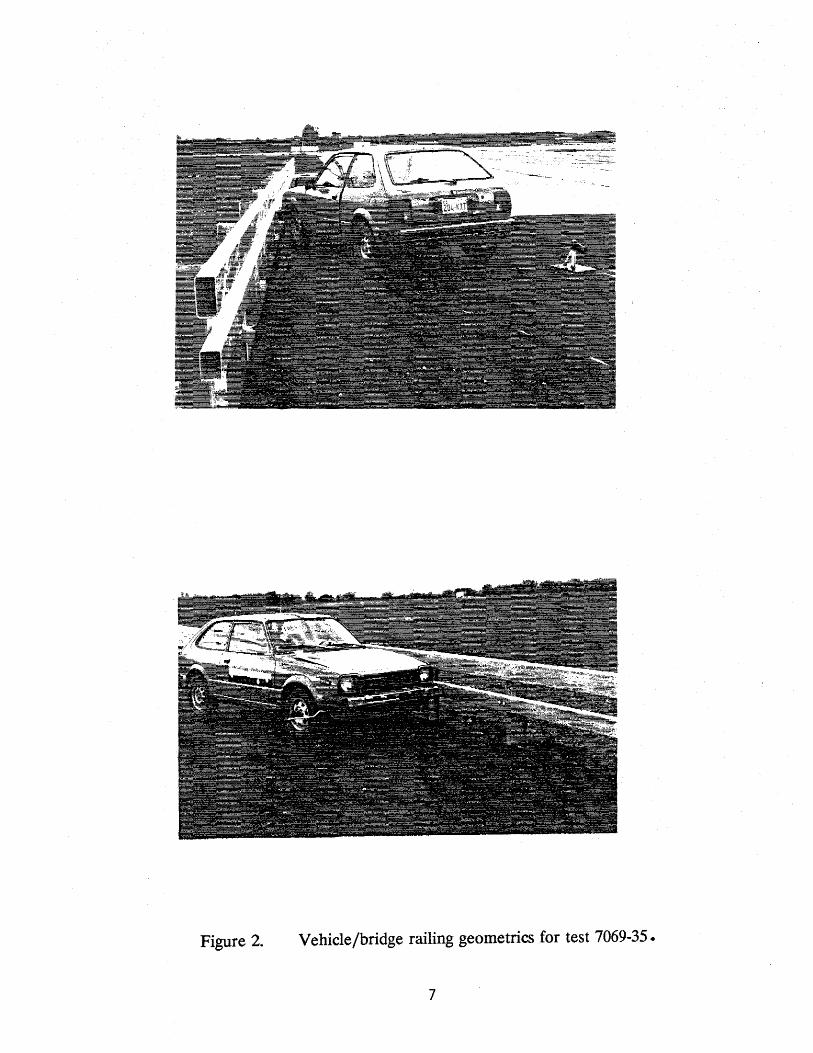
Figure 2. Vehicle/bridge railing geometries for test 7069-35.
7
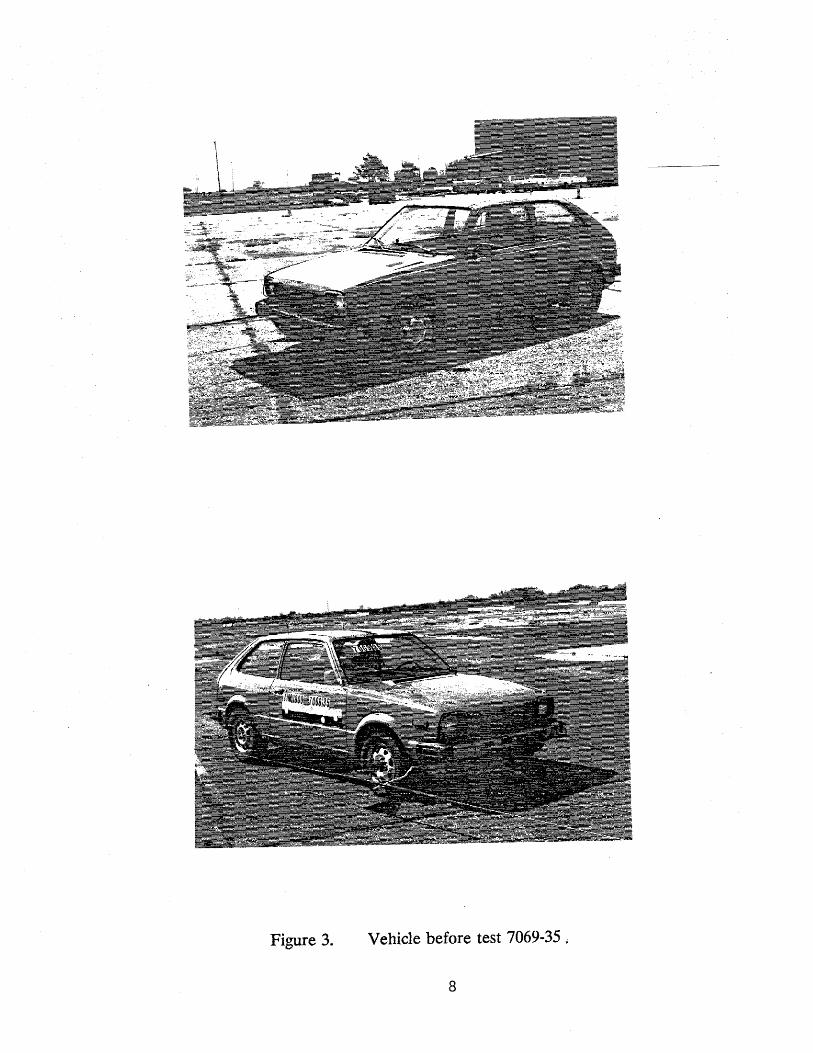
Figure 3. Vehicle before test 7069-35 •
8
Date: 3-23-93 · Test No.: __ 7_"0_69_-_3_5 __ VIN: JHMSR532XBS021775
Make: Honda Mode 1 : _ __.C ...... i ...... v_..i ..... c __ _ Year: _l_q....,B..._J __
Bias Ply: Tire Size: 175/70R13 Ply Rating: ___ _
f f a p
L
Tire dia---~-:......j.,. \vhee 1 di a----+-+-~
j
4-wheel weight for e.g. det. if 590
Mass - pounds Curb
Ml 1202
M2 641
MT 1843
Accelerometers
Accelerometers
f
rf 563 tr 319 rr 328
Test Inertial Gross Static
1153 1227
647 743
1800 1970
Note any damage to vehicle prior to test:
*d = overall height of vehicle
1 in= 25.4 mm llb = 0.454 kg
Odometer: 10917
Belted: Radial:
Tire Condition: good __ . fair
badly worn _
Vehicle Geometry - inches
a 58.7 b 30.0
c _8_7_.2 __
e --=2::.:,..7..:...;. 5:::.....__
d* 53.2
f 144.7 g ___ _ h 31~3
j 29 3
k 16.9 l 28.9
m 19.0 n 3.0
0 13.6 p 55.3
r 23.2 s 14.4
Engine Type: 4 cyl gas Engine CID: ----Transmission Type:
A9C)OO»:lt~9tXX'lX M-anu a 1
FWD or RWD or 4WD Body Type: ____ _
Steering Column Collapse Mechanism:
Behind wheel units · --Convoluted tube
--Cylindrical mesh units -Embedded ba 11 -NOT collapsible
Other energy absorption Unknown
Brakes: Front: disc X drum Rear: disc drum X
Figure 4. Vehicle properties for test 7069-35.
9
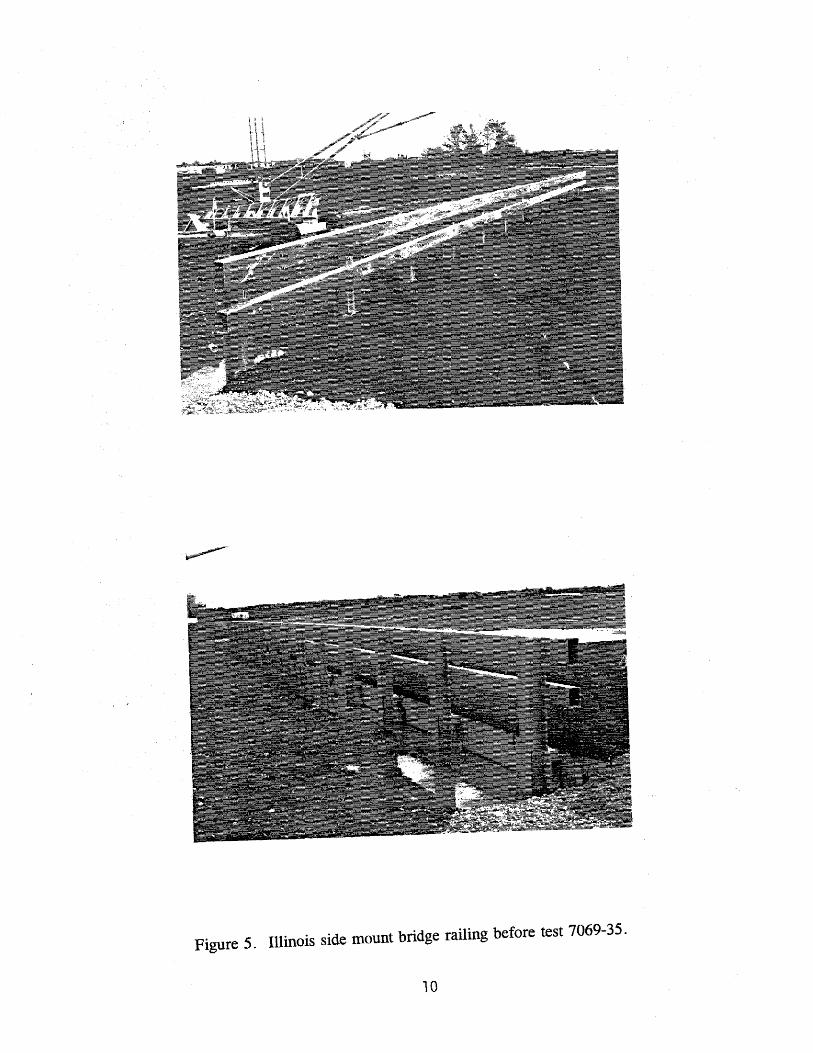
Figure 5. Illinois side mount bridge railing before test 7069-35.
10
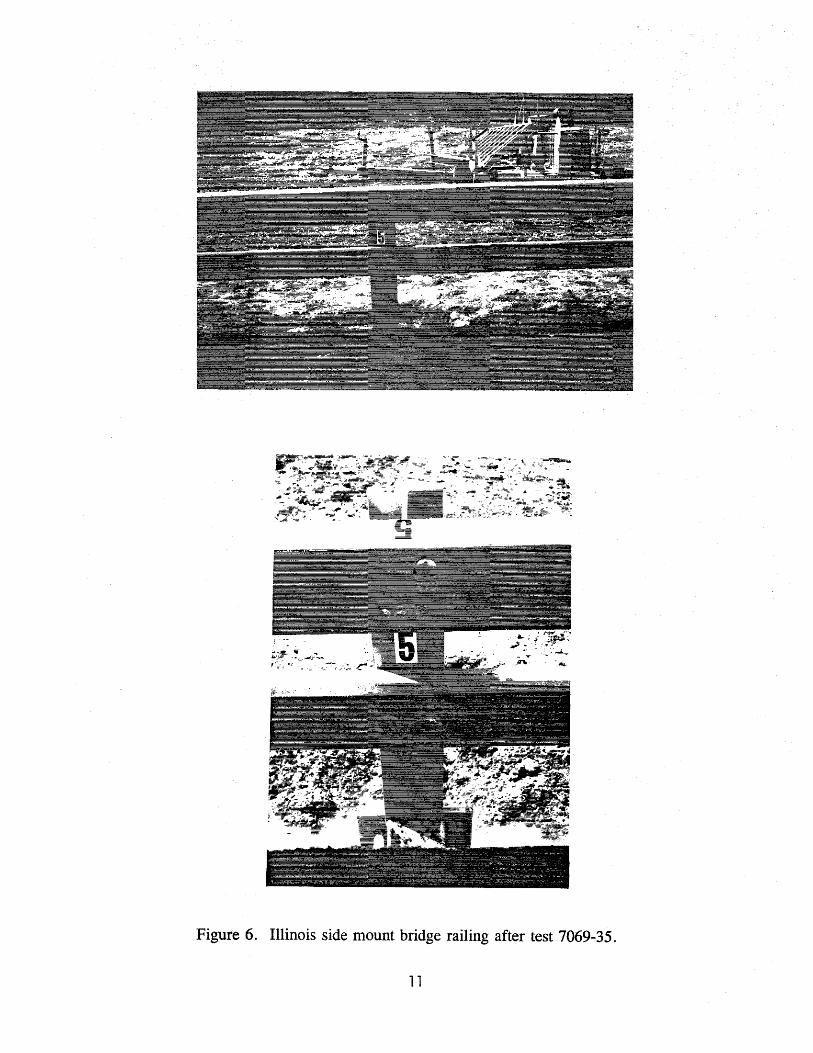
Figure 6. Illinois side mount bridge railing after test 7069-35.
11
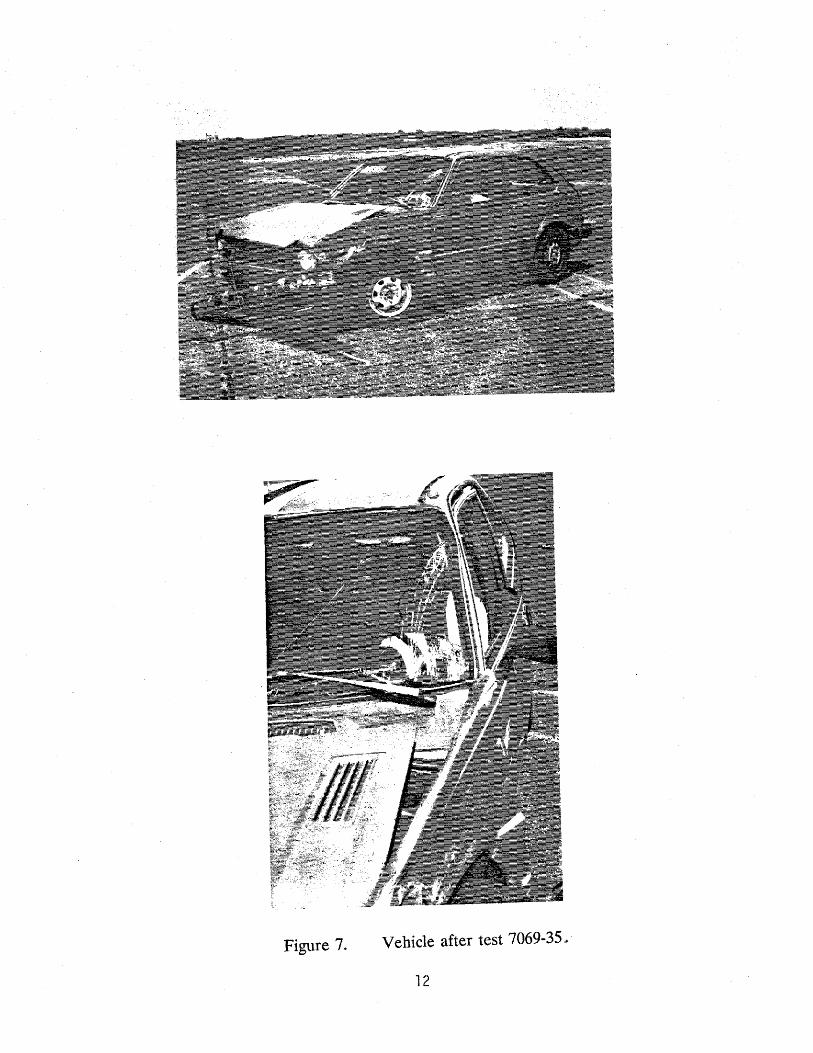
Figure 7. Vehicle after test 7069-35 ~ ·
12
__, w t
8"
' • 6" t l 6" t
{1 in = 25.4 mm)
Test No ......... 7069-35 Date . . . . . . . . . . 03/23/93
Test Installation ... Illinois Side Mount Bridge Railing
Installation Length .. 84 ft (26m)
Test Vehicle ...... 1981 Honda Civic Vehicle Weight
Test Inertia ..... 1,800 lb (817 kg) Gross Static ..... 1,970 lb (894 kg)
Vehicle Damage Classification TAD ......... 11FL3 & 11LD3 CDC . . . •..... 11FLEK2 & 11LDEW3
Maximum Vehicle Crush .. 7.5 in· (19.0 mm)
Impact Speed .... 59.9 mi/h (96.4 km/h) Impact Angle .... 20.1 deg Speed at Parallel . 51.1 mi/h (82.2 km/h) Exit Speed .... 50.8 mi/h (81.7 km/h) Exit Trajectory . . 6.4 deg Vehicle Accelerations
(Max. 0.050-sec Avg) at true e.g. Longitudinal ... -6.4 g Lateral ..... -14.8 g -
Occupant Impact Velocity at true e.g. Long i t u d i n a 1 . . . 15 . 9 ft/ s ( 4 . 8 m/ s) Lateral ..... 25.8 ft/s (7 .9 m/s)
Occupant Ridedown Accelerations Longitudinal .. -1.7 g L.a t era 1 . . • . . • . . -6 . 6 g
Figure 8. Summary of results for test 7069-35 G•
__, -l==o
Table 1. Evaluation of crash test no. 7069-35. {Illinois Side Mounted Bridge Railing [1,800 lb (817 kg)l59.9 mi/h (96.4 km/h)l20.1 degrees]}
A.
B.
c.
D.
E.
F.
CRITERIA
Must contain vehicle
Debris shall not penetrate passenger compartment
Passenger compartment must have essentially no deformati-on
Vehicle must remain upright
Must smoothly redirect the vehicle
Effective coefficient of friction
u 0 - .25 .26 - .35 > .35
Assessment Good Fair Marginal
G. Shall be less than
Occupant Impact Velocity - ft/s (m/s) Longitudinal Lateral
30 (9.2) 25 (7.6)
Occupant Ridedown Accelerations - g's Longitudinal Lateral
15 15
H. Exit angle shall be less than 12 degrees
TEST RESULTS
Vehicle was contained
No debris penetrated passenger compartment
Minimal deformation (1.3 in)
Vehicle did remain upright
Vehicle was smoothly redirected
_lL .25
Assessment Good
Occupant Impact Velocity - ft/s (m/s) Longitudinal Lateral 15.9 (4.8) 25.8 (7.9)
Occupant Ridedown Accelerations - g's Longitudinal Lateral
-1.7 -6.6
Exit angle was 6.4 degrees
* A, B, C, D and G are. required. E, F, and H are desired. (See table 2)
PASS/FAIL*
Pass
Pass
Pass
Pass
Pass
Pass
Marginal
Pass
Pass
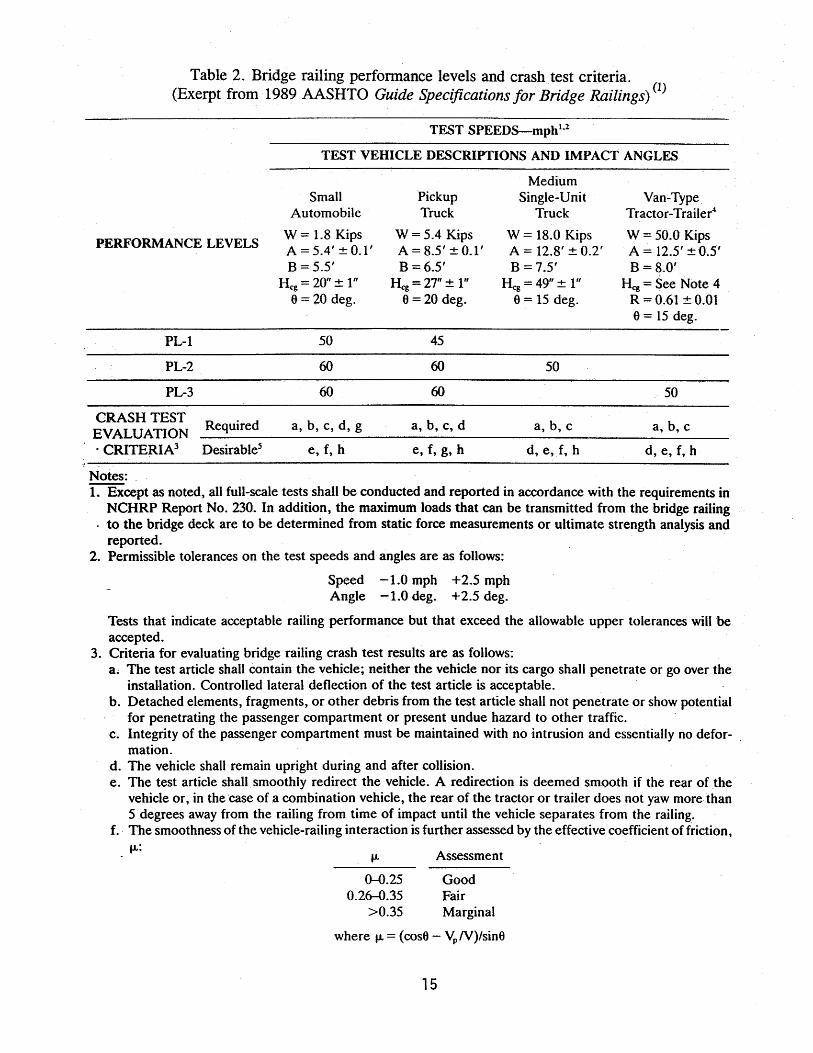
Table 2. Bridge railing performance levels and crash .test criteria. (Exerpt from 1989 AASHTO Guide Specifications for Bridge Railings) (1)
TEST SPEEDS-mph1•2
TEST VEHICLE DESCRIPTIONS AND IMPACT ANGLES
Medium Small Pickup Single-Unit Van-Type
Automobile Truck Truck Tractor-Trailer4
PERFORMANCE LEVELS W= 1.8 Kips W = 5.4 Kips W = 18.0 Kips W=50.0 Kips A= 5.4' ± 0.1 I A= 8.5' ± 0.1' A= 12.8' ± 0.2' A~ 12.5' ±0.5' B=5.5' B=6.5' B=7.5' B=8.0'
Hcg=20"± 1" Hcg=27"± 1" Hcg = 49" ± 1" Hcg =See Note 4 6=20 deg. e = 20 deg. e = 15 deg. R = 0.61 ± 0.01
e = 15 deg.
PL-1 50 45
PL-2 60 60 50
PL-3 60 60 50
CRASH TEST Required a, b, c, d, g a, b, c, d a, b, c a, b, c
EVALUATION · CRITERIA3 Desirable5 e, f, h e, f, g, h d, e,f, h d, e, f, h
Notes: 1. Except as noted, all full-scale tests shall be conducted and reported in accordance with the requirements in
NCHRP Report No. 230. In addition, the maximum loads that can be transmitted from the bridge railing . to the bridge deck are to be determined from static force measurements or ultimate strength analysis and
reported. 2. Permissible tolerances on the test speeds and angles are as follows:
Speed -1.0 mph + 2.5 mph Angle -1.0 deg. +2.5 deg.
Tests that indicate acceptable railing performance but that exceed the allowable upper tolerances will be accepted.
3. Criteria for evaluating bridge railing crash test results are as follows: a. The test article shall contain the vehicle; neither the vehicle nor its cargo shall penetrate or go over the
installation. Controlled lateral deflection of the test article is acceptable. b. Detached elements, fragments, or other debris from the test article shall not penetrate or show potential
for penetrating the passenger compartment or present undue hazard to other traffic. c. Integrity of the passenger compartment must be maintained with no intrusion and essentially no defor
mation. d. The vehicle shall remain upright during and after collision. e. The test article shall smoothly redirect the vehicle. A redirection is deemed smooth if the rear of the
vehicle or, in the ·case of a combination vehicle, the rear of the tractor or trailer does not yaw more than 5 degrees away from the railing from time of impact until the vehicle separates from the railing.
f. The smoothness of the vehicle-railing interaction is further assessed by the effective coefficient of friction, JJ.:
Assessment
0-{).25 Good 0.26-0.35 Fair
>0.35 Marginal
where JJ. = ( cos6 - VP N)/sine
15
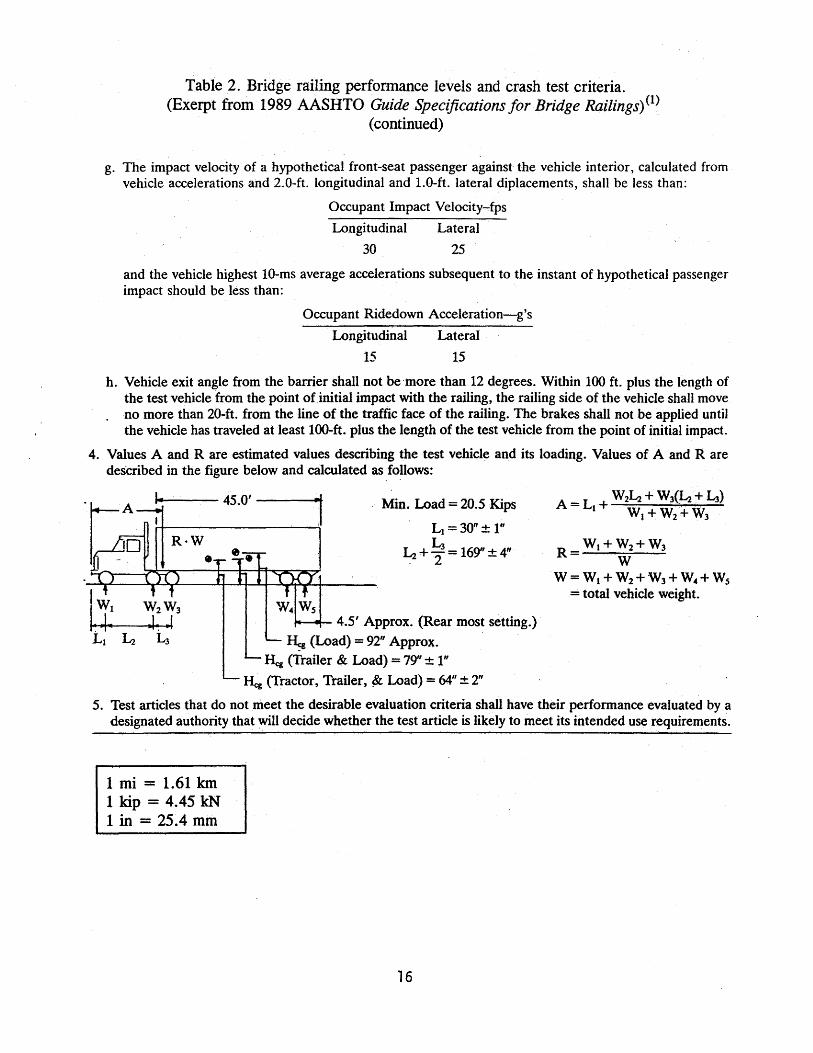
Table 2. Bridge railing performance levels and crash test criteria. (Exerpt from 1989 AASHTO Guide Specifications for Bridge Railings)(!)
(continued)
g. The impact velocity of a hypothetical front-seat passenger against the vehicle interior, calculated from vehicle accelerations and 2.0-ft. longitudinal and 1.0-ft. lateral diplacements, shall be less than:
Occupant Impact Velocity~fps
Longitudinal
30
Lateral
25
and the vehicle highest 10-ms average accelerations subsequent to the instant of hypothetical passenger impact should be less than:
Occupant Ridedown Acceleration-g's
Longitudinal Lateral
15 15
h. Vehicle exit angle from the barrier shall not be ·more than 12 degrees. Within 100 ft. plus the length of the test vehicle from the point of initial impact with the railing, the railing side of the vehicle shall move
. no more than 20-ft. from the line of the traffic face of the railing. The brakes shall not be applied until the vehicle has traveled at least 100-ft. plus the length of the test vehicle from the point of initial impact.
4. Values A and R are estimated values describing the test vehicle and its loading. Values of A and R are described in the figure below and calculated as follows:
,__ __ 45.0' __ __.,.1 Min. Load = 20.5 Kips
Lt =30"± 1"
~+ i= 169"±4"
4.5' Approx. (Rear most setting.)
~ (Load) = 92" Approx. Reg (Trailer & Load) = 79" ± 1"
Hcg (Tractor, Trailer, !k Load) = 64" ± 2"
R= W1+W2+W3 w
W= W1 + W2+W3+ W.+ W5
== total vehicle weight.
5. Test articles that do not meet the desirable evaluation criteria shall have their performance evaluated by a designated authority that will decide whether the test article is likely to meet its intended use requirements.
1 mi = 1.61 km 1 kip = 4.45 kN 1 in = 25.4 mm
16
0.000 s
0.037 s
0.075 s
0.112 s Figure 9. Sequential photographs for test 7069-35
(overhead and frontal views)»
17
0.151 s
Q_.J87 s
0.224 s
0.260 s
Figure 9. Sequential photographs for test 7069-35 (overhead and frontal views continued).
18
0.000 s
0.037 s
0.075 s
0.112 s
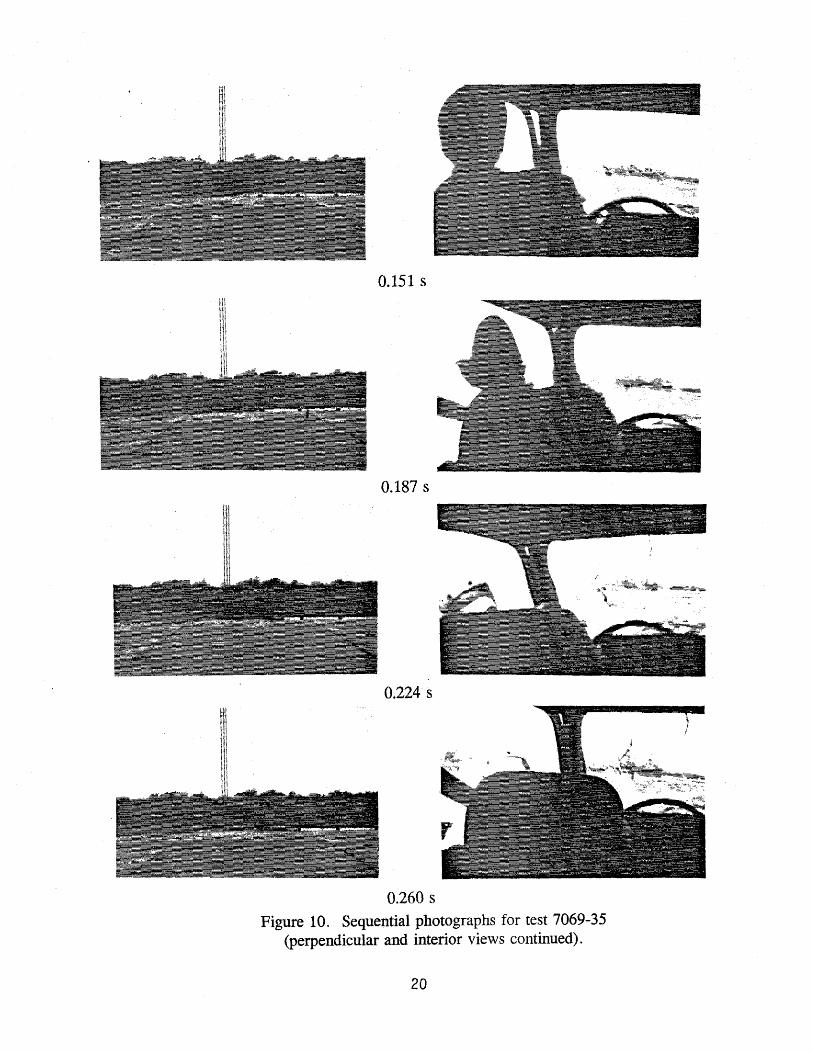
Figure 10. Sequential photographs for test 7069-35 (perpendicular and interior views).,
19
0.151 s
0.187 s
0.224 s
0.260 s Figure 10. Sequential photographs for test 7069-35
(perpendicular and interior views continued).
20
8.0
4.0
(fJ 0.0
Q) Q) -4.0 '-
N Ol Q) __, 0 -8.0 -..&J -12.0 c Q)
E Q) -16.0 u co r-i -20.0 Cl (fJ .,.... 0 -24.0
-28.0
-32.0 0.0
7069-35
r Yaw X Pitch 0 Rolt
0.2 0.4 0.6 0.8
Time (Seconds)
I. z
1\ oVI\W
~db~ ~. ,,.o''
-- I~
PA3.08
Axes are vehicle fijed: Sequence for determining orientation is:
1. Yaw 2. Pitch 3. Ro 11
Figure 11. Vehicle angular displacements for test 7069-35 •
N N
CRASH T-EST 7069-35 Accelerometer at center-of-gravity
80 l l 1 l ! : : : : 70 ··························~···························~···························~·-·························~···························!············· Test Article: Illinois Side-Mounted Bridge Rail
l I I I ! Test Vehicle: 19-81 Honda CMc 60-f··························t···························t···························t···························i···························t············· Test h1ertia Weight: 1 ,800 lb
_ so .......................... L ...................... .J ......................... J ........................ J ........................ J............ Gross stati~ Weight: 1 ,970 lb b i } i j i Test Speed: 59.9 mi/h i' 40 ··························+···························!···························!···························!···························!············· Test Angle: 20.1 -degrees
<( :M!A·~---····d:·~r.ueJlAvr u OS • • 4 ' ! 6 .. t, a¢' 0 • lwv,., '0 ·, ' •
z c :::> ... CJ z 9
0 0.1
lib = 0.454 kg 1 mi/h = 1.609 km/h
:
0.2 0.3 0.4 0.5 0.6 0.7 0.8 TIME AFTER IMPACT (SECONDS)
1- Class 1ao filter - 50-msec Average J
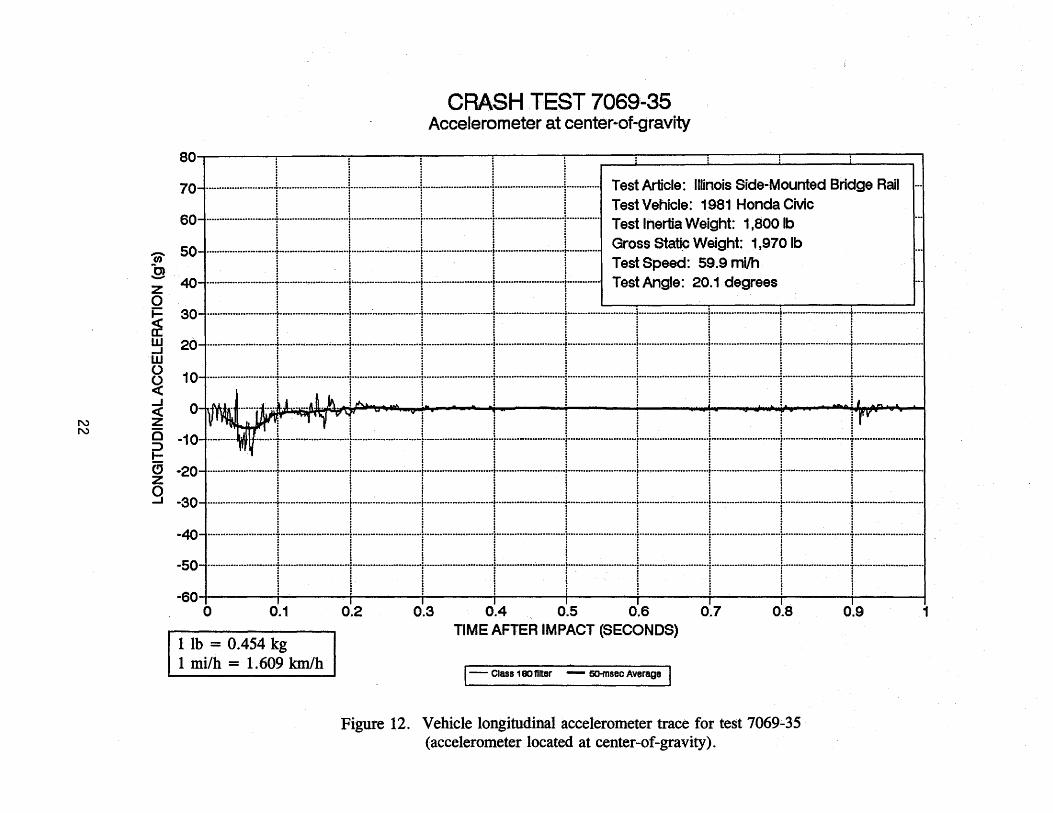
Figure 12. Vehicle longitudinal accelerometer trace for test 7069~35 (accelerometer located at center-of-gravity).
0.9 1
N w
CRASH TEST 7069-35 Accelerometer at center-of-gravity
80 ! ! ! i . . . • •
70
60
50
I Test Article: Illinois Side-Mounted Bridge Rail Test Vehicle: 1981 Honda Civic Test Inertia Weight: 1 ,800 lb Gross static Weight: 1 ,970 lb Test Speed: 59.9 mi/h
'0' 40 ~
Test Angle: 20.1 degrees
z 0
i ~ w 0
~ ~ w
~
30
20
!
- I I I I I I I I I 0 0.1 0.2
lib = 0.454 kg 1 mi/h = 1. 609 km/h
Figure 13.
0.3 0.4 0.5 0.6 0.7 0.8 TIME AFTER IMPACT (SECONDS)
J -.- Class 1 so ntter - so-msec Average j
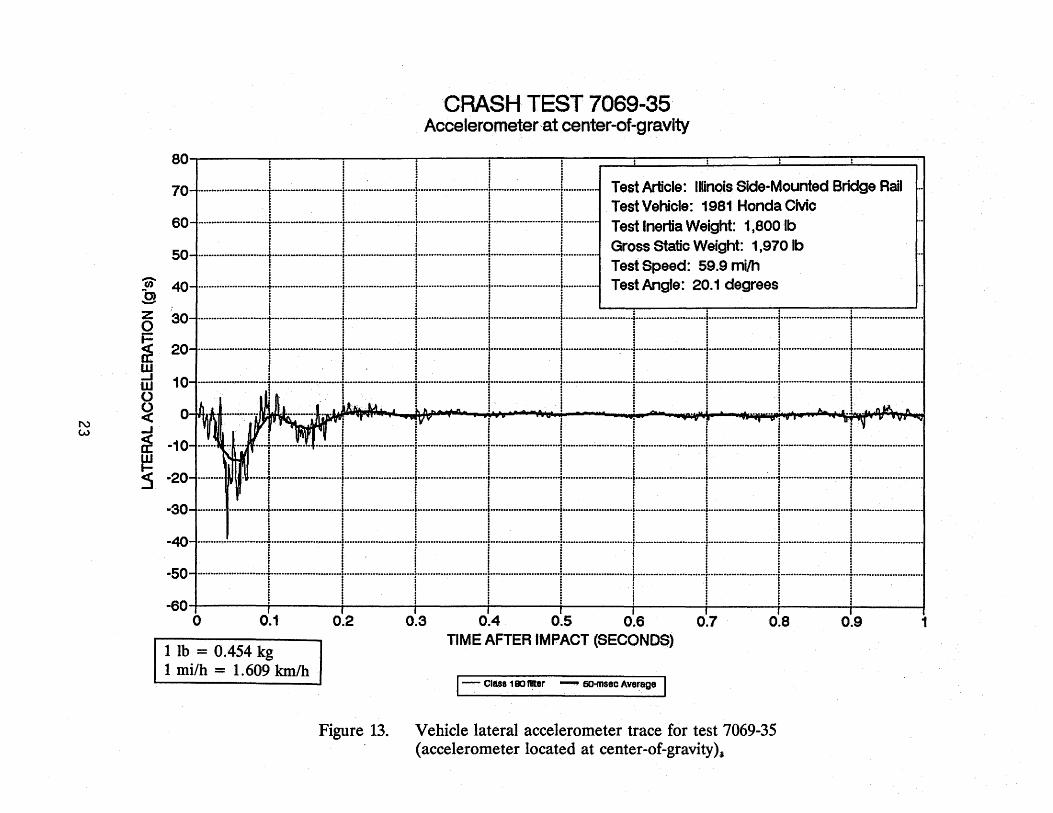
Vehicle lateral accelerometer trace ·for test 7069-35 (accelerometer located at center-of-gravity),
0.9 1
N ~
CRASH TEST 7069-35 Accelerometer at center-of-gravity
80 1 l I I l . . . . 70-f·························-t-·························+························+··························f···························!············· Test Article: Illinois Side-Mounted Bridge Rail
! ! ! ! ! Test Vehicle: 1981 Honda CMc 60-f····················-·····t······················· ... ·i···························i···························i··························+············ Test Inertia Weight: 1· ,aoo. ·lb
50-l .......................... l. ......................... J ........................... L ......................... L ....................... J............. Gross Static Weight: . 1 ,970 lb · · · · · T. ts d ·ilh I I i I 1 es pee : 59.9 m
~ : : : : : -~ 40 ..... ~ .................... t ........................... f ........................... f···· ....................... f ........................... i··· .. ········ TestAngle: 20.·1 degrees
..J
~ ~ w -20 >
-30
-40
-so
-60 . . . . . 0 0.1 0.2 0.3 0.4 0.5 0.6 0.7 0.8
1 lb = 0.454 kg TIME AFTER IMPACT (SECONDS)
1 milh = 1.609 km/h 1-.. -· Class 1 eo niter - 50insec Average I
Figure 14. Vehicle vertical accelerometer trace for test 7069-35 · (accelerometer located at center-of-gravity).
0.9 1
TEST 7069-36
Test Description
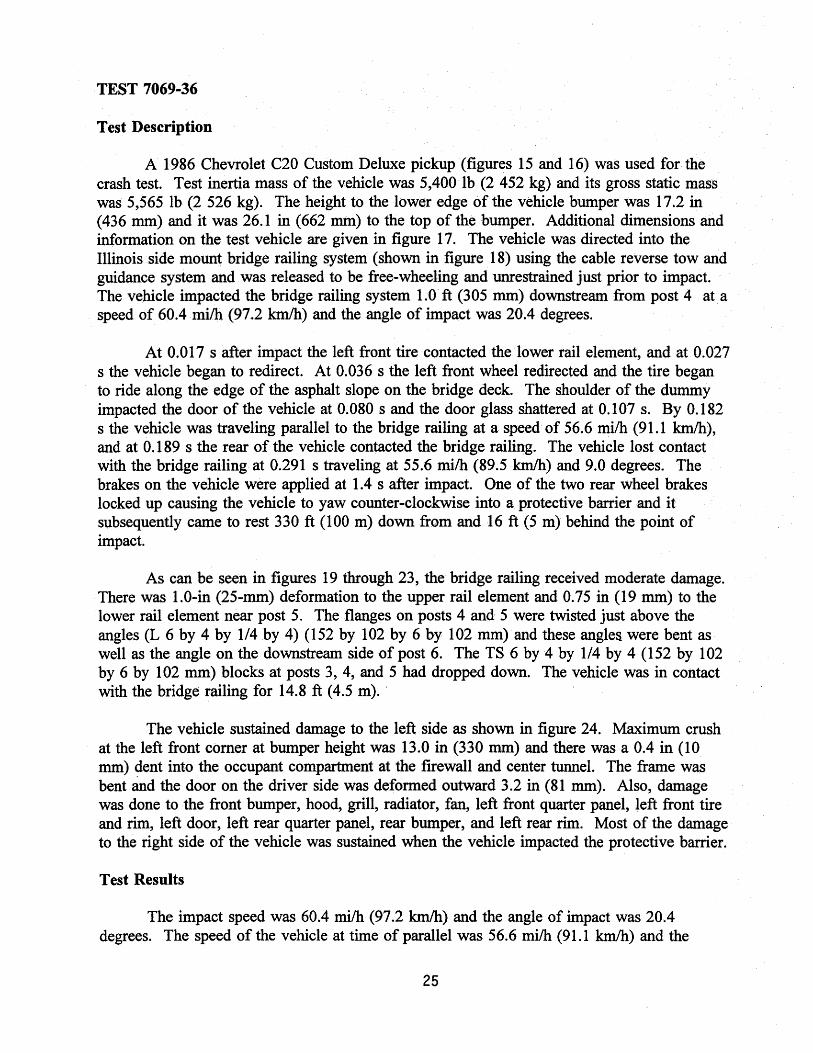
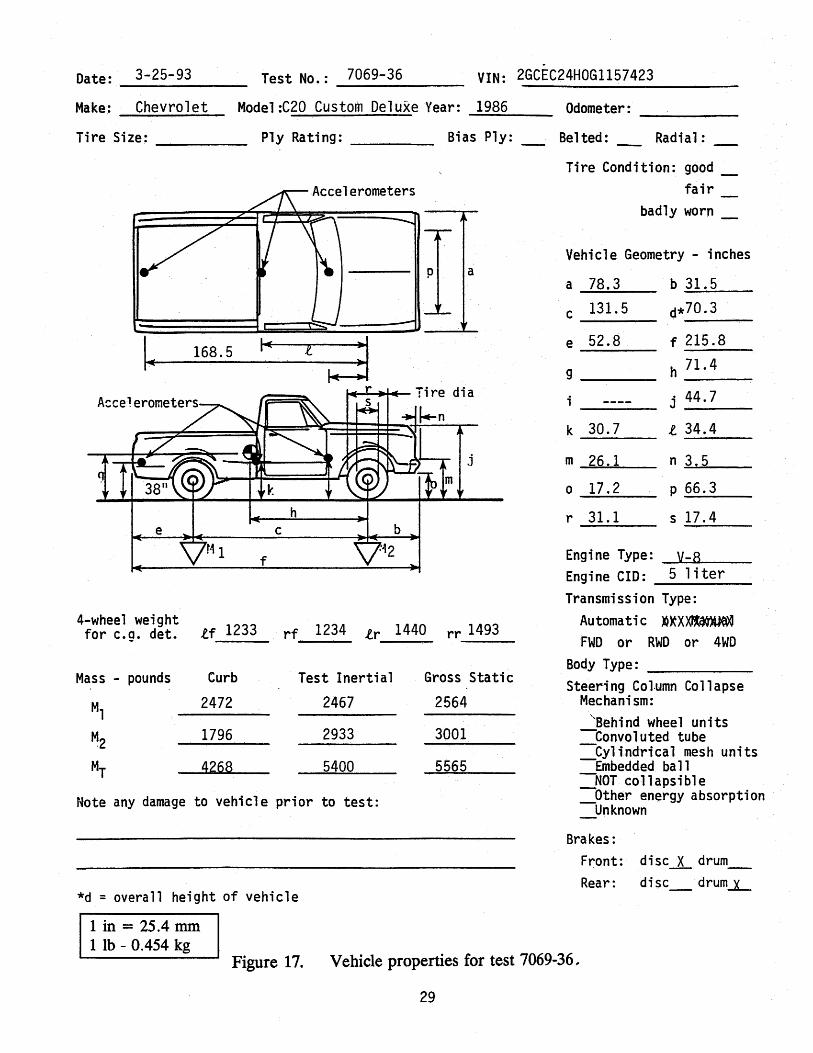
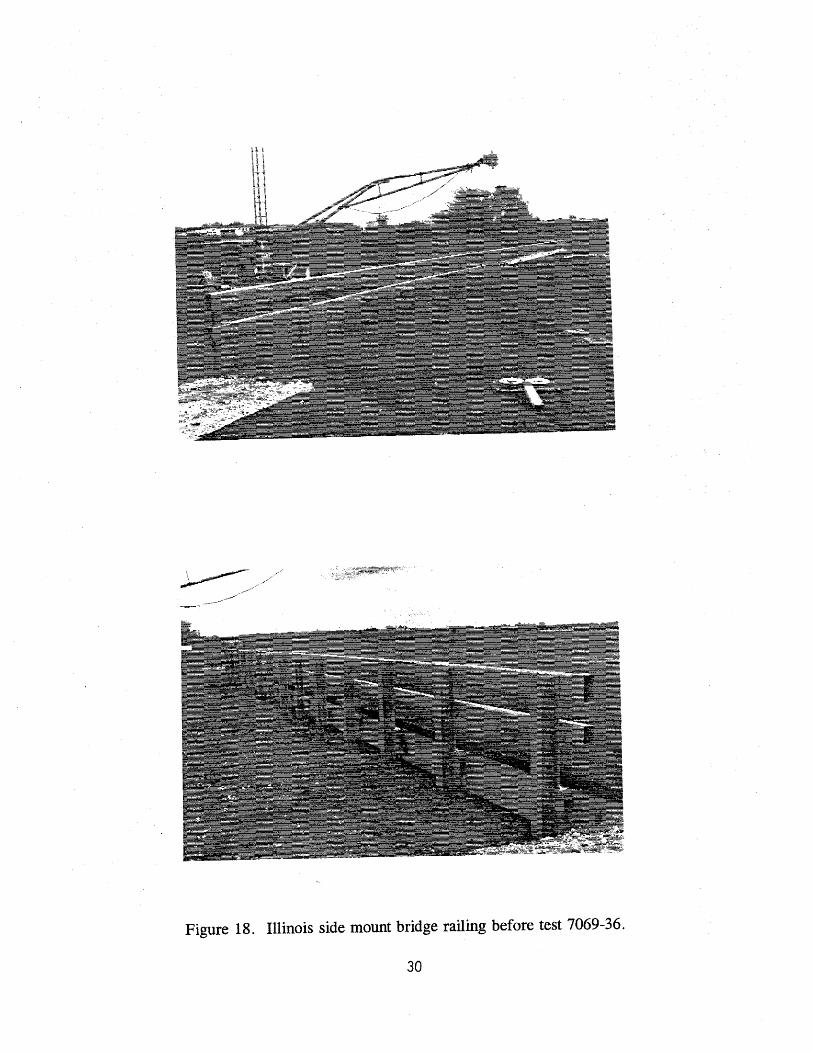
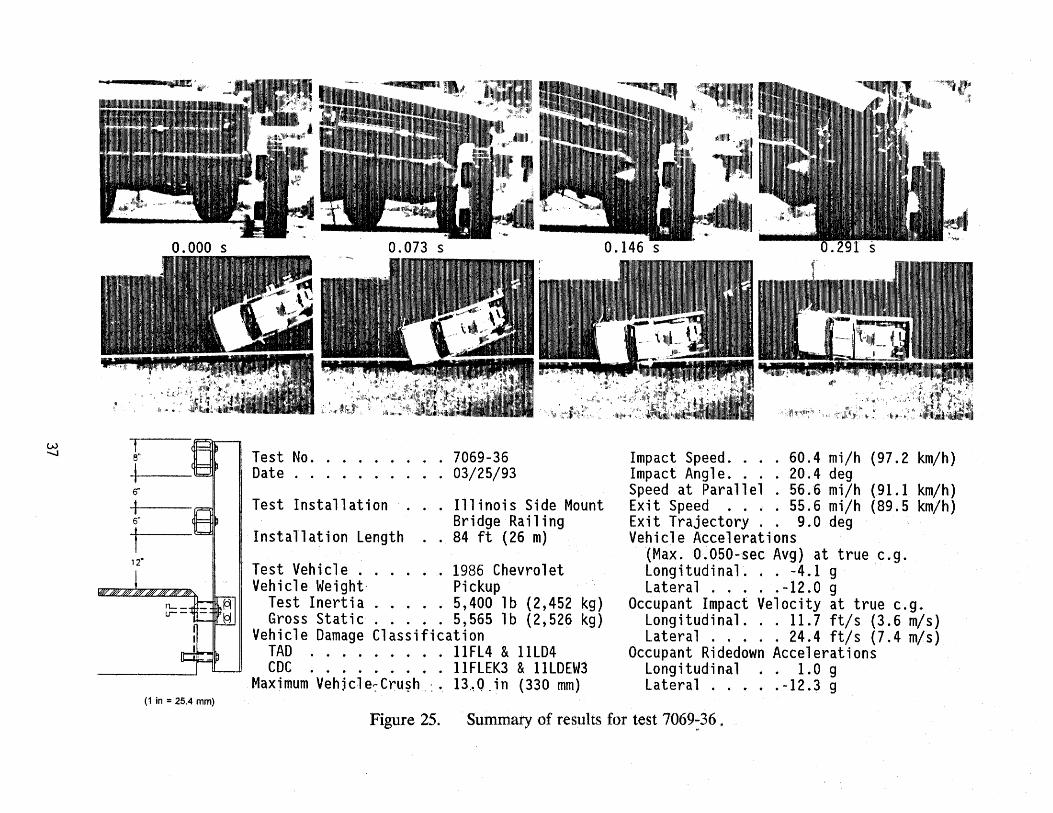
A 1986 Chevrolet C20 Custom Deluxe pickup · (figures 15 and 16) was used for the crash test. Test inertia mass of the vehicle was 5,400 lb (2 452 kg) and its gross static mass was 5,565 lb (2 526 kg). The height to the lower edge of the vehicle bumper was 17.2 in (436 mm) and it was 26.1 in (662 mm) to the top of the bumper. Additional dimensions and information on the test vehicle are given in figure 17. The vehicle was directed into the Illinois side mount bridge railing system (shown in figure 18) using the cable reverse tow and guidance system and was released to be free-wheeling and unrestrained just prior to impact. The vehicle impacted the bridge railing system 1.0- ft (305 mm) downstream from post 4 at a speed of 60.4 milh (97.2 km/h) and the angle of impact was 20.4 degrees.
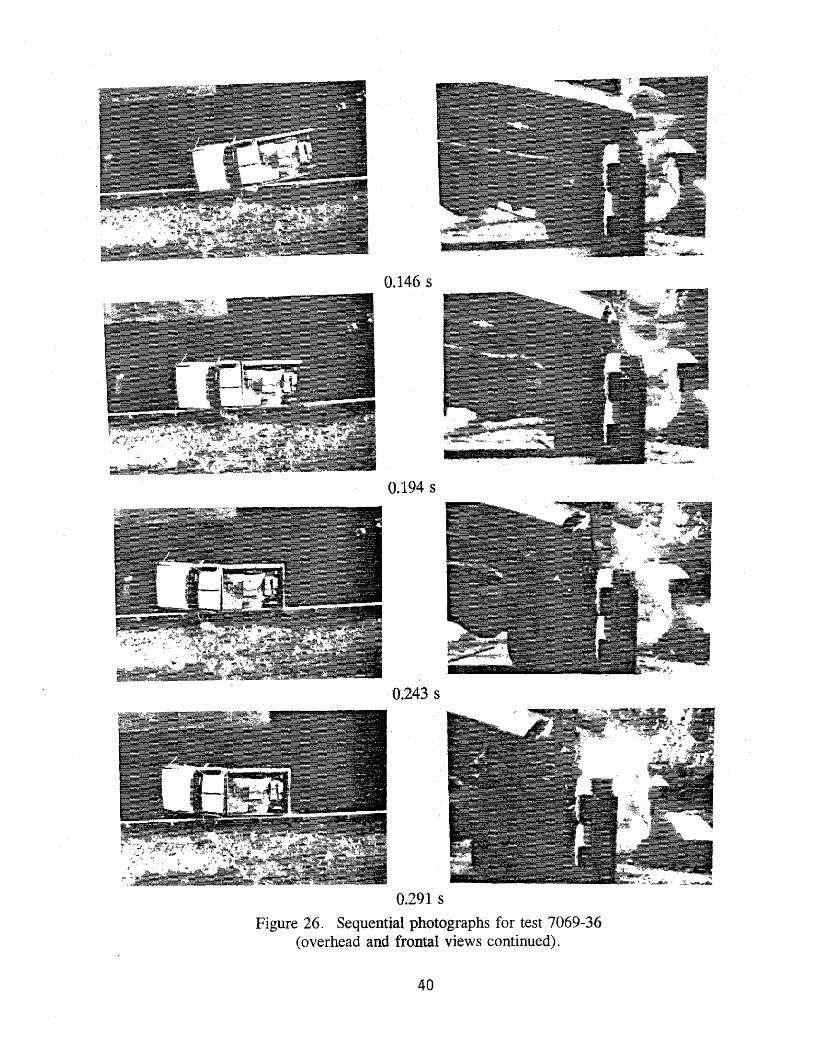
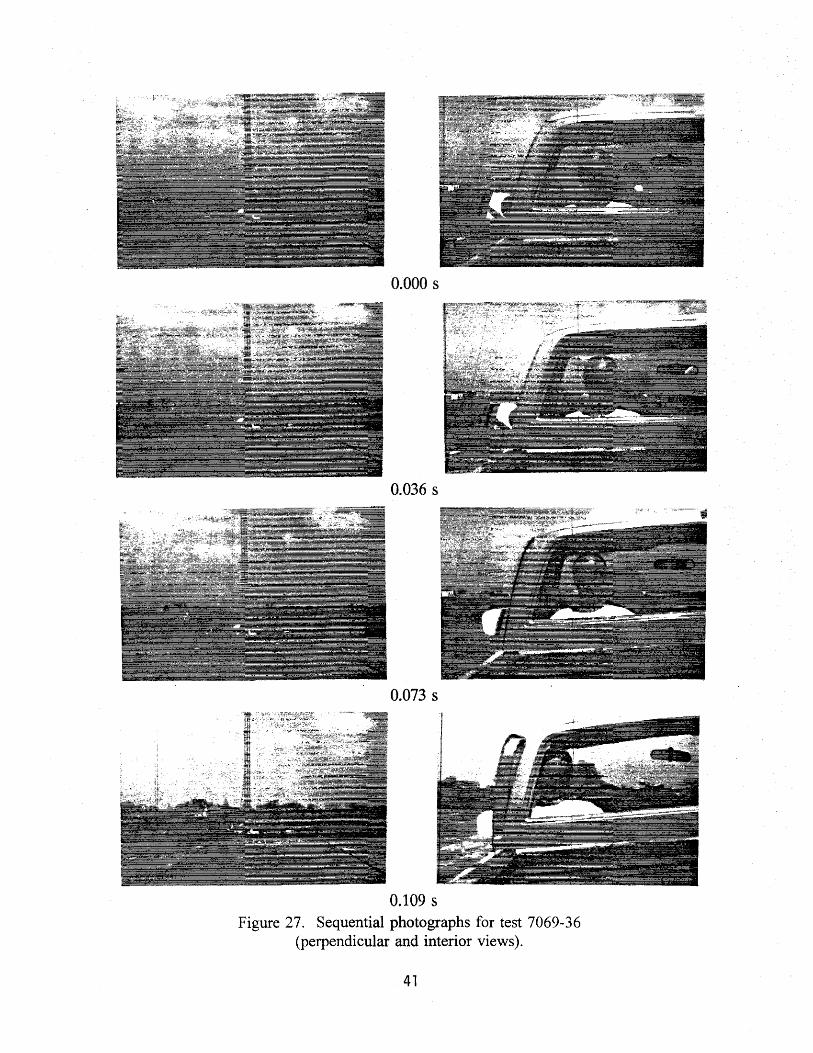
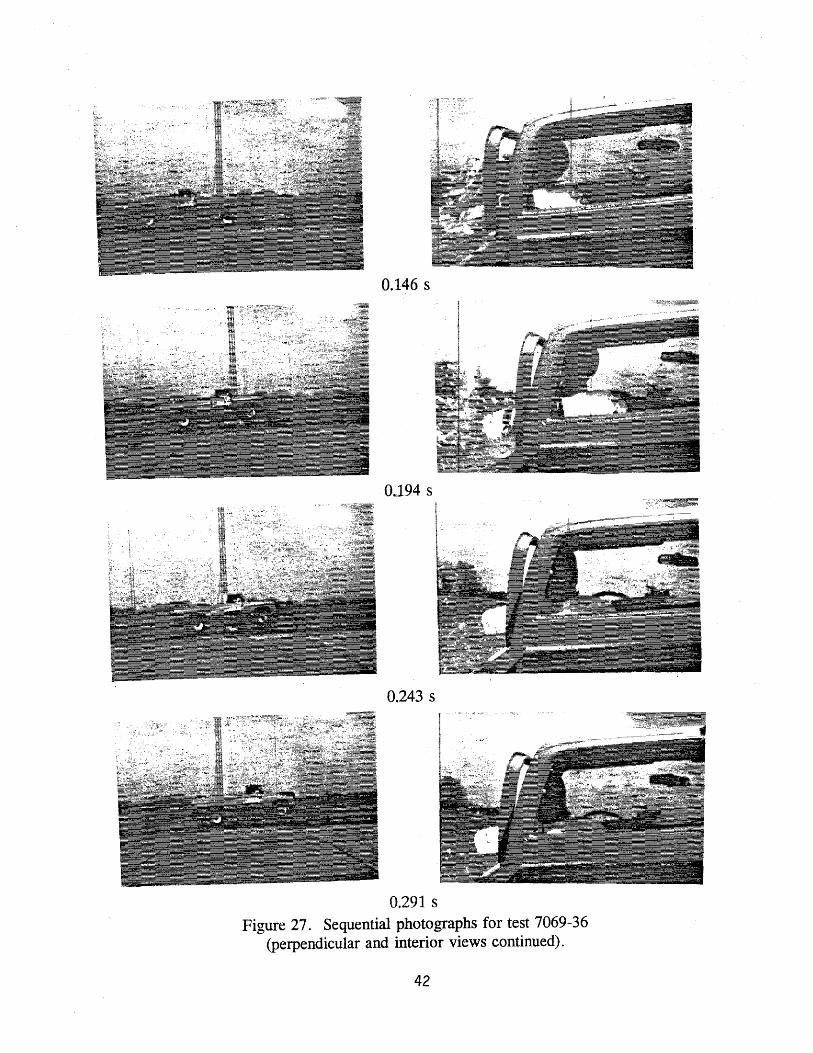
At 0.017 s after impact the left front tire contacted the lower rail element, and at 0.027 s the vehicle began to redirect. At 0.036 s the left front wheel redirected and the tire began to ride along the edge of the asphalt slope on the bridge deck. The shoulder of the dummy impacted the door of the vehicle at 0.080 sand the door glass shattered at 0.107 s. By 0.182 s the vehicle was traveling parallel to the bridge railing at a speed of 56.6 milh (91.1 kmlh), and at 0.189 s the rear of the vehicle contacted the bridge railing. The vehicle lost contact with the bridge railing at 0.291 s traveling at 55.6 milh (89.5 km/h) and 9.0 degrees. The brakes on the vehicle were applied at 1.4 s after impact. One of the two rear wheel brakes locked up causing the vehicle to yaw counter-clockwise into a protective barrier and it subsequently came to rest 330ft (100m) down from and 16ft (5 m) behind the point of impact.
As can be seen in figures 19 through 23, the bridge railing received moderate damage. There was 1.0-in (25-mm) deformation to the upper rail element and 0. 75 in (19 mm) to the lower rail element near post 5. The flanges on posts 4 and 5 were twisted just above the angles (L 6 by 4 by 1/4 by 4) (152 by 102 by 6 by 102 mm) and these angles were bent as well as the angle on the downstream side of post 6. The TS 6 by 4 by 1/4 by 4 (152 by 102 by 6 by 102 mm) blocks at posts 3, 4, and 5 had dropped down. The vehicle was in contact with the bridge railing for 14.8 ft ( 4.5 m). ·
The vehicle sustained damage to the left side as shown in figure 24. Maximum crush at the left front comer at bumper height was 13.0 in (330 mm) and there was a 0.4 in (10 mm) dent into the occupant compartment at the firewall and center tunnel. The frame was bent and the door on the driver side was deformed outward 3.2 in (81 mm). Also, damage was done to the front bumper, hood, grill, radiator, fan, left front quarter panel, left front tire and rim, left door, left rear quarter panel, rear bumper, and left rear rim. Most of the damage to the right side of the vehicle was sustained when the vehicle impacted the protective barrier.
Test Results
The impact speed was 60.4 milh (97.2 km/h) and the angle of impact was 20.4 degrees. The speed of the vehicle at time of parallel was 56.6 mi/h (91.1 km/h) and the
25
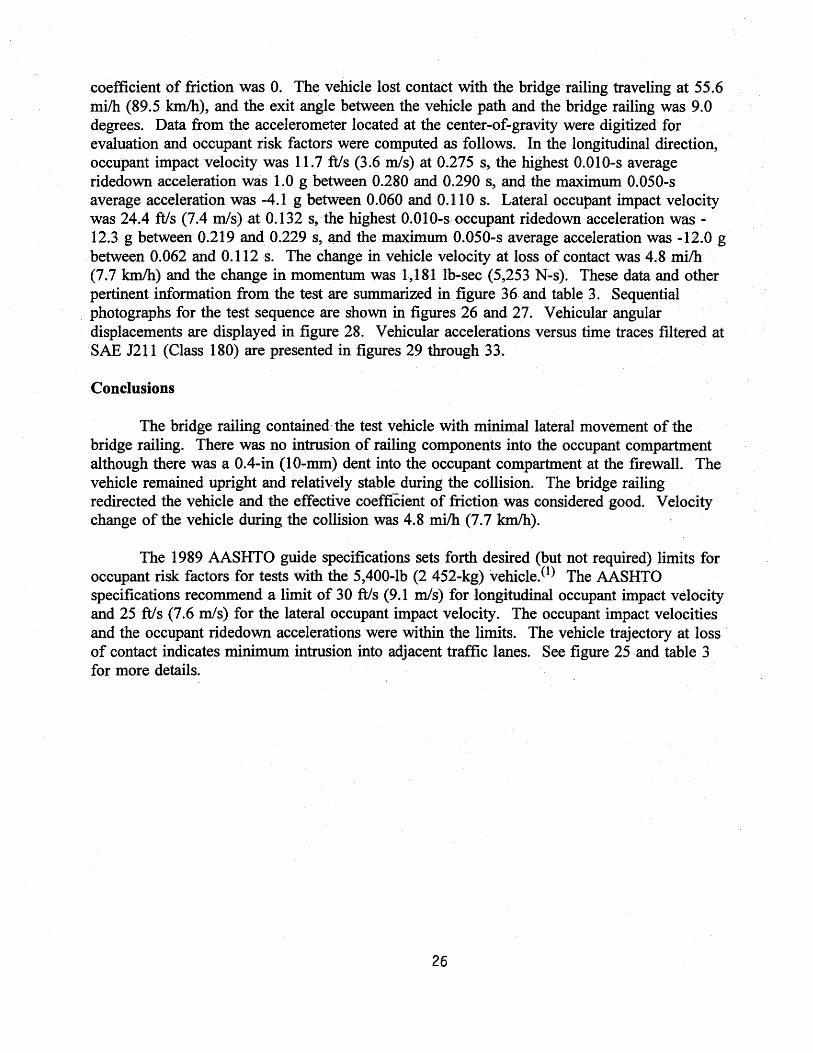
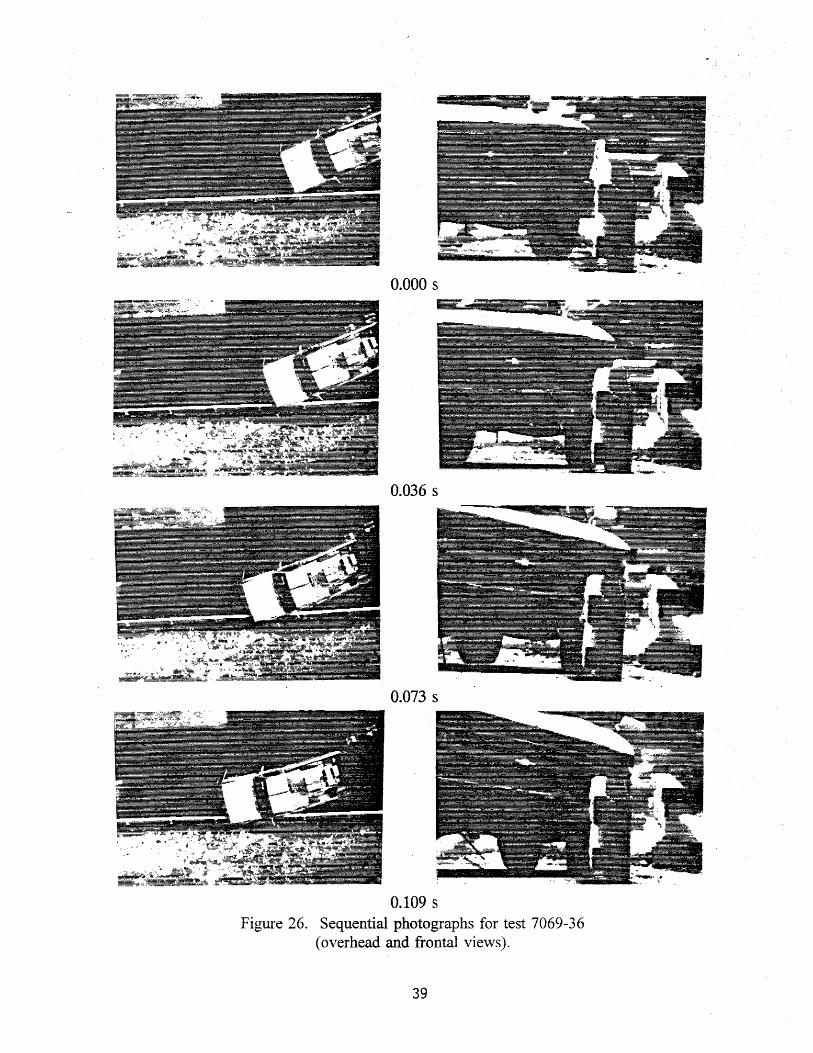
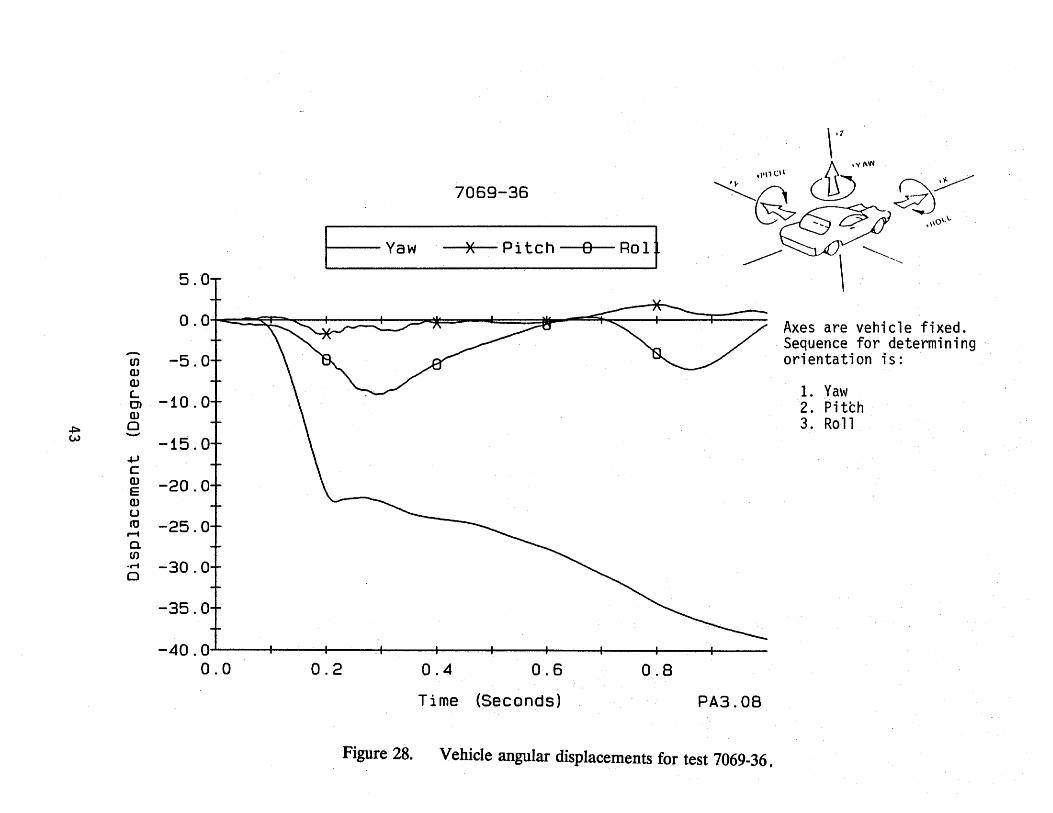
coefficient of friction was 0. The vehicle lost contact with the bridge railing traveling at 55.6 milh (89.5 kmlh), and the exit angle between the vehicle path and the bridge railing was 9.0 degrees. Data from the accelerometer located at the center-of-gravity were digitized for evaluation and occupant risk factors were computed as follows. In the longitudinal direction, occupant impact velocity was 11.7 ft/s (3.6 m/s) at 0.275 s, the highest 0.010-s average ridedown acceleration was 1.0 g between 0.280 and 0.290 s, and the maximum 0.050-s average acceleration was -4.1 g between 0.060 and 0.110 s. Lateral occupant impact velocity was 24.4 ft/s (7.4 m/s) at 0.132 s, the highest 0.010-s occupant ridedown acceleration was -12.3 g between 0.219 and 0.229 s, and the maximum 0.050-s average acceleration was -12.0 g between 0.062 and 0.112 s. The change in vehicle velocity at loss of contact was 4.8 mi/h (7.7 km/h) and the change in momentum was 1,181 lb•sec (5,253 N-s). These data and other pertinent information from the test are summarized in ·figure 36 and table 3. Sequential photographs for the test sequence are shown in figures 26 and 27. Vehicular angular displacements are displayed in figure 28. Vehicular accelerations versus time traces filtered at SAE J211 (Class 180) are presented in figures 29 through 33.
Conclusions
The bridge railing contained· the test vehicle with minimal lateral movement of the bridge railing. There was no intrusion of railing components into the occupant compartment although there was a 0.4-in·(IO-mm) dent into the occupant compartment at the firewall. The vehicle remained upright and relatively stable during the collision. The bridge railing redirected the vehicle and the effective coefficient of friction was considered good. Velocity change of the vehicle during the collision was 4.8 milh (7.7 km/h).
The 1989 AASHTO guide specifications sets forth desired (but not required) limits for occupant risk factors for tests with the 5,400-lb (2 452-kg) vehicle.<I) The AASHTO specifications recommend a limit of 30 ft/s (9.1 m/s) for longitudinal occupant impact velocity and 25 ft/s (7.6 m/s) for the lateral occupant impact velocity. The occupant impact velocities and the occupant ridedown accelerations were within the limits. The vehicle trajectory at loss of contact indicates minimum intrusion into adjacent traffic lanes. See figure 25 and table . 3 for more details.
26
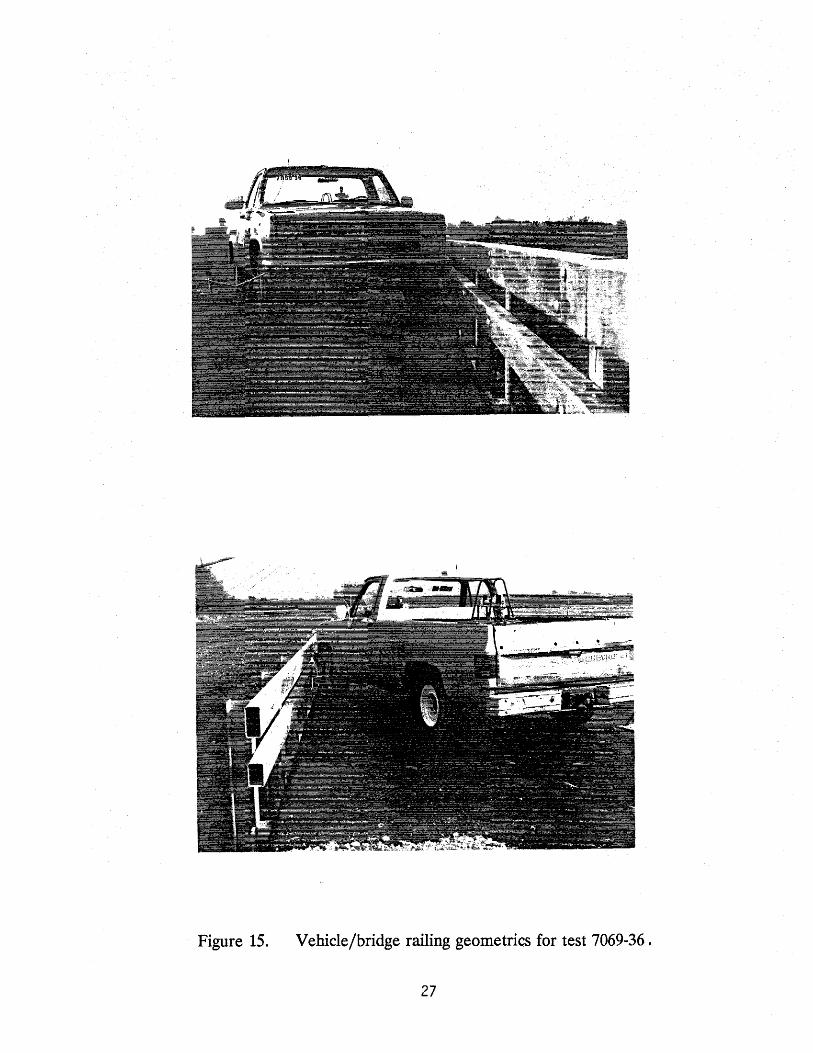
· Figure 15. Vehicle/bridge railing geometries for test 7069-36.
27
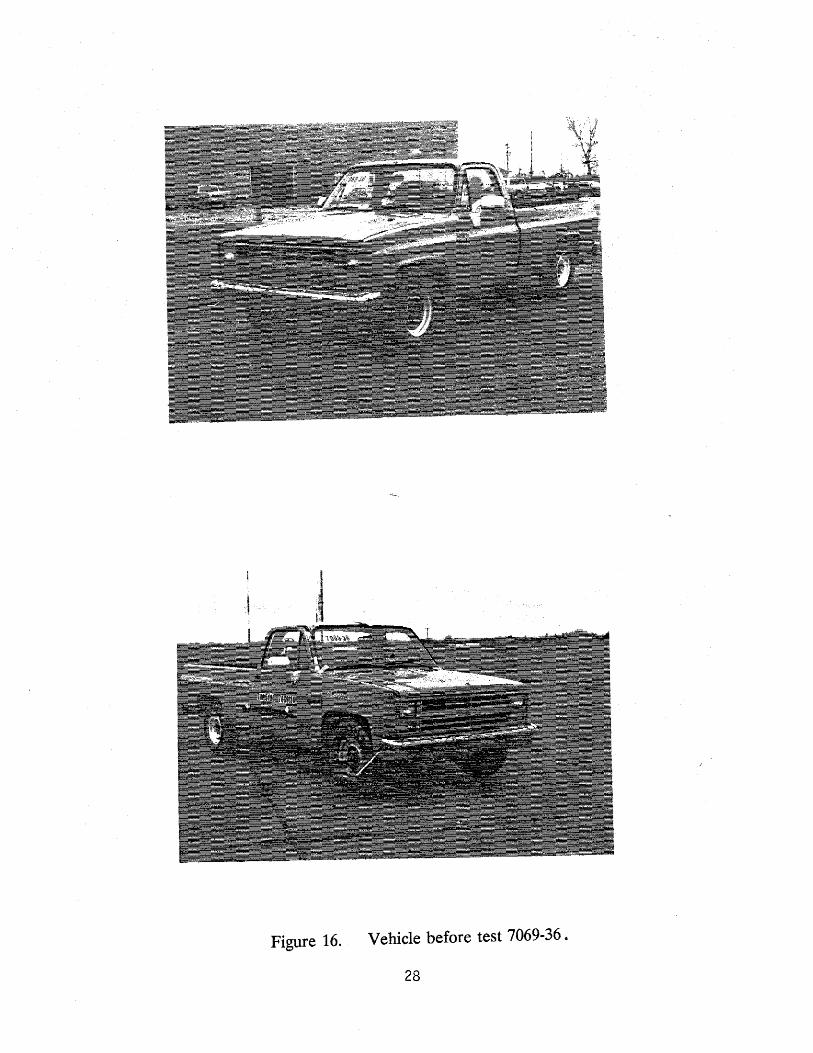
Figure 16. Vehicle before test 7069-36 •
28
. Date: 3-25-93
Make: Chevrolet
T t N 7069-36 es o.: ------------- YIN: 2GCEC24HOG1157423
Model:C20 Custom Deluxe Year: 1986 _...;;...;;_ __ Odometer: --------Tire Size: ----- Ply Rating: ___ _ Bias Ply: _ Be 1 ted: Radial:
Accelerometers
a
I~ 168.5
j
c
f
4-wheel weight for e.g. det. tf 1233 rf 1234 lr 1440 rr 1493
Mass - pounds Curb Test Inertial Gross Static
Ml 2472 2467 2564
~2 1796 2933 3001
MT 4268 5400 5565
Note any damage to vehicle prior to test:
*d = overall height of vehicle
Tire Condition: good ___ fair
badly worn ___
Vehicle Geometry - inches
a 78.3 b 31.5
c 131.5 d*70.3
e 52.8 f 215.8
g h 71.4
i j 44.7
k 30.7 l 34.4
m 26.1 n 3.5
0 17.2 p 66.3
r 31.1 s 17.4
Engine Type: __.V~.--..u.B __ _
Engine CID: 5 1 iter Transmission Type:
Automatic »~X~~ FWD or RWD or 4WD
Body Type: -----Steering Column Collapse
Mechanism: 'Behind wheel units
---Convoluted tube -. Cylindrical mesh units -Embedded ba 11
NOT collapsible __ Other energy absorption
Unknown
Brakes: F~ont: disc_L drum_ Rear: disc_· drum_x_
1 in= 25.4 mm 1 lb- 0.454 kg
Figure 17. Vehicle properties for test 7069-36~
29
~---------······· __ _...---
Figure 18. Illinois side mount bridge railing before test 7069-36.
30
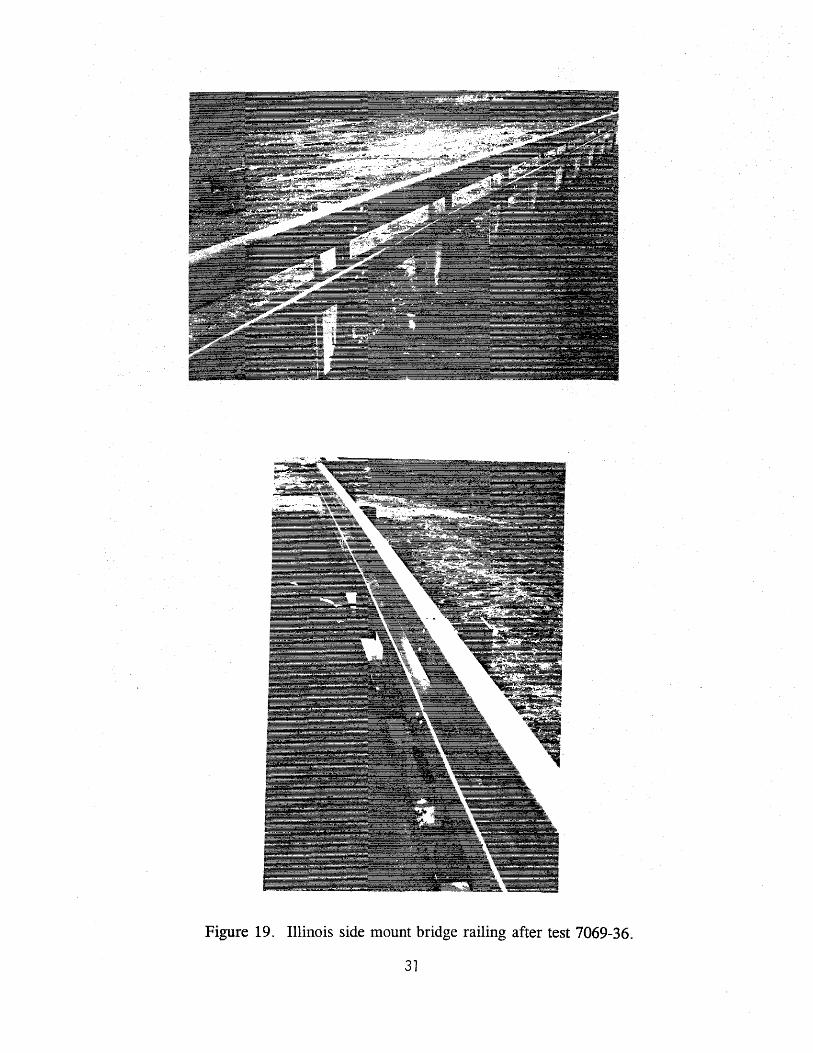
Figure 19. Illinois side mount bridge railing after test 7069-36.
31
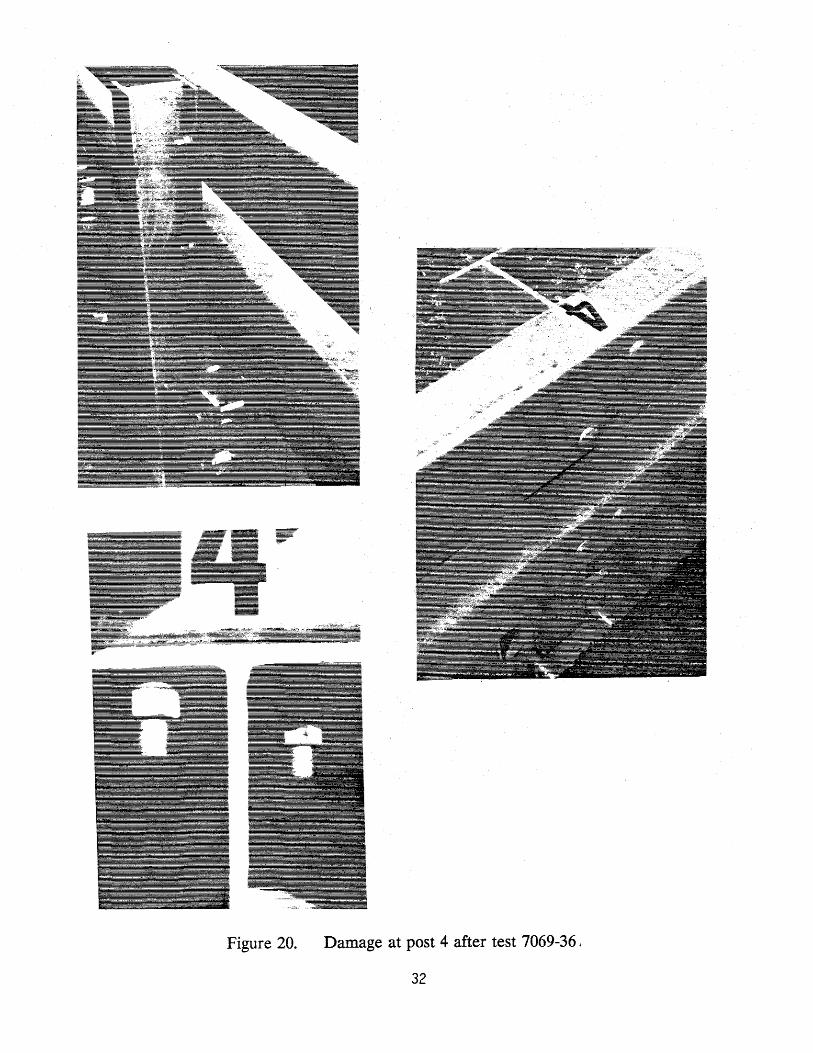
Figure 20. Damage at post 4 after test 7069-36 ,
32
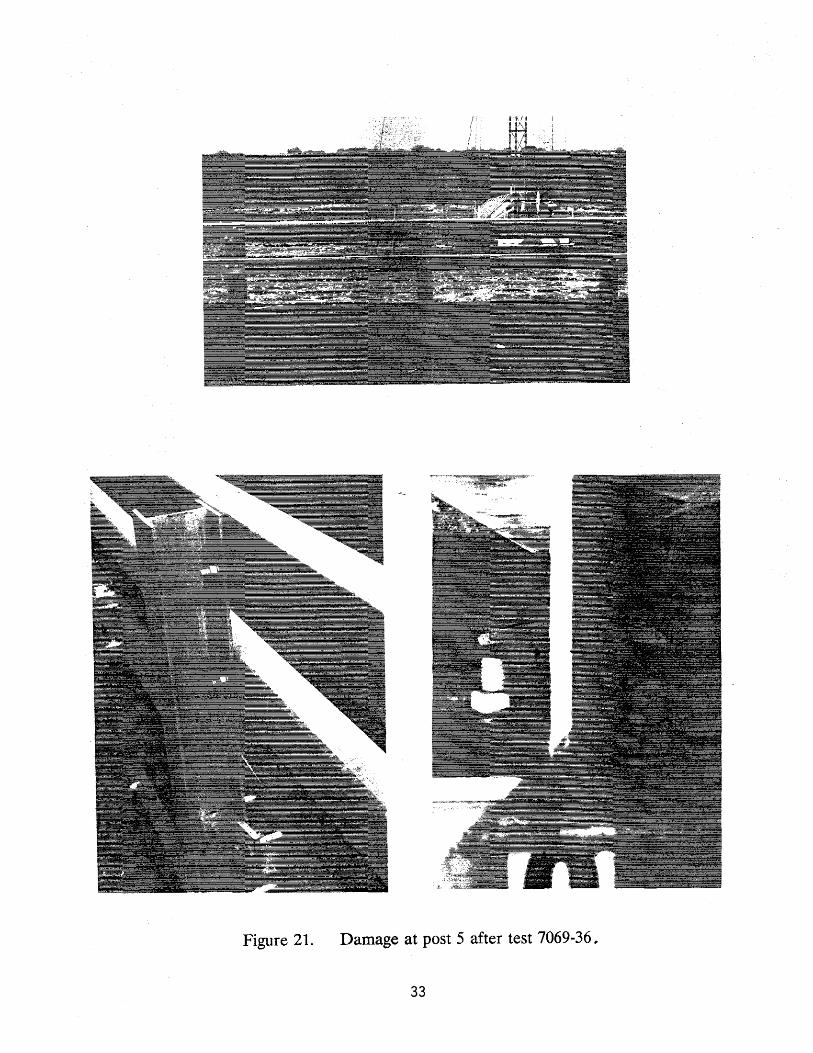
Figure 21. Damage at post 5 after test 7069-36 ..
33
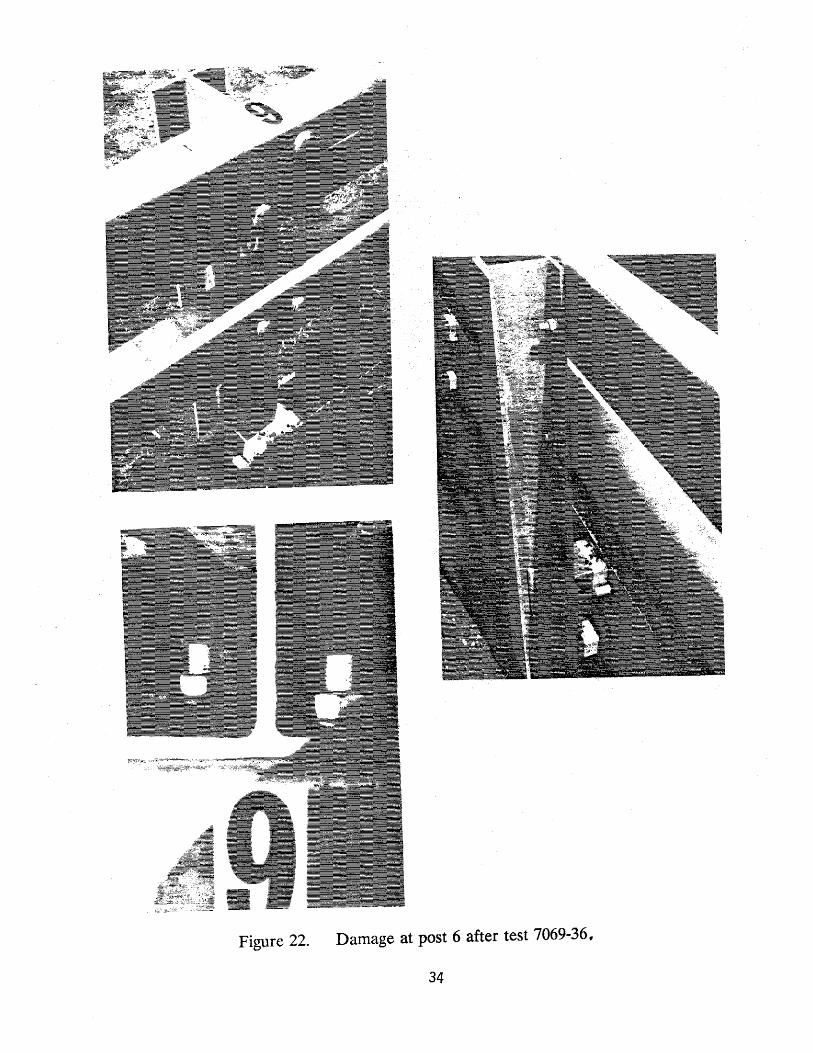
Figure 22. Damage at post 6 after test 7069-36,
34
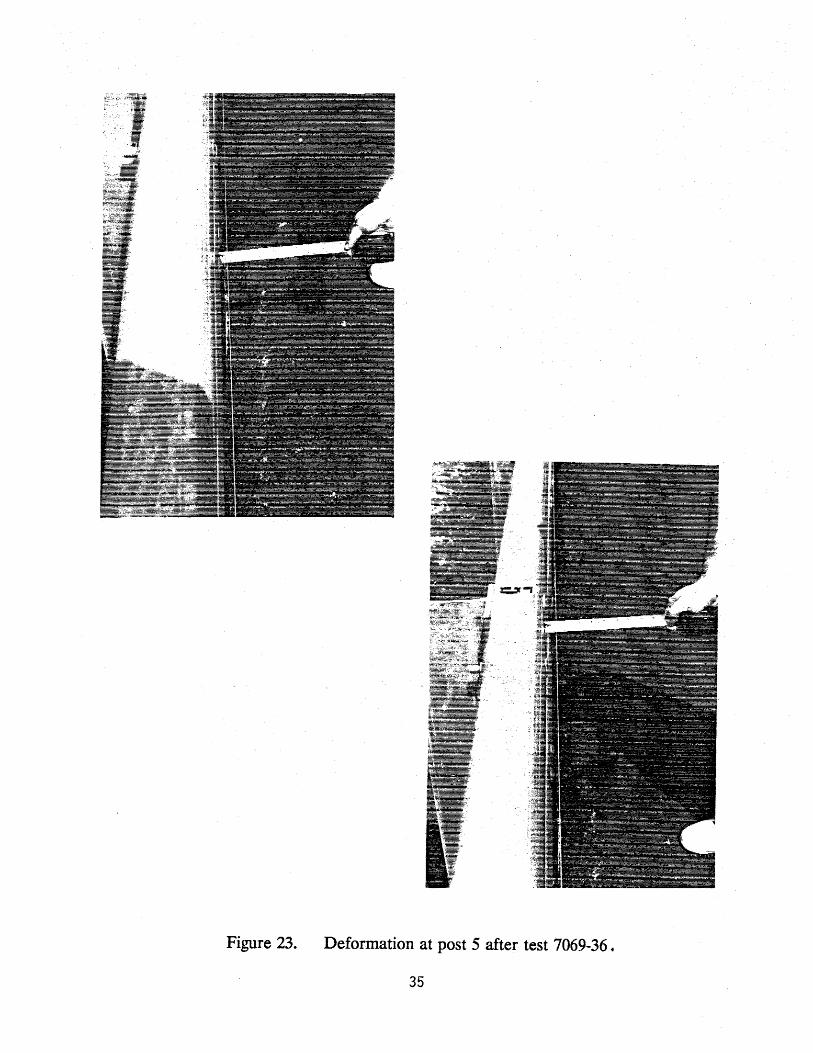
Figure 23. Deformation at post 5 after test 7069-36 •
35
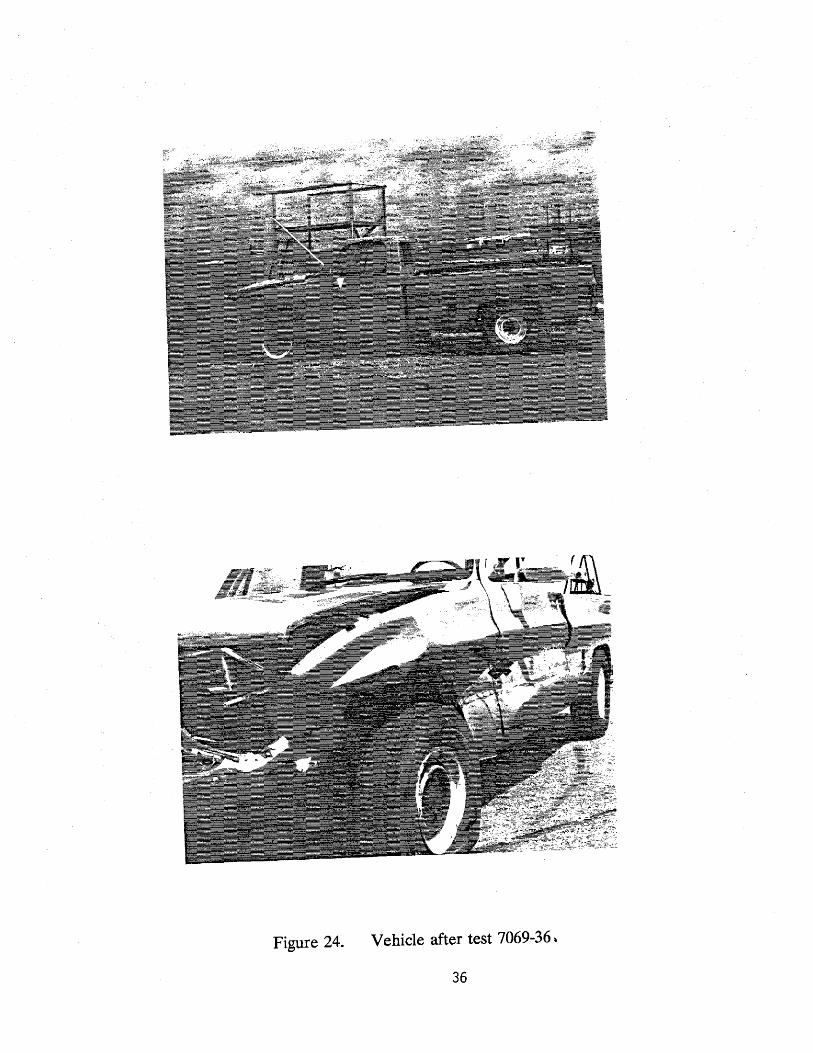
Figure 24. Vehicle after test 7069-36 ,
36
w '-I
~··~'''
f 8"
' • 6"
t • 6" t
(1 in = 25.4 mm)
Test No ......... 7069-36 Date . . . . . . . . . . 03/25/93
Test Installation ... Illinois Side Mount Bridge Railing
Installation Length .. 84 ft (26 m)
Test Vehicle ...... 1986 Chevrolet Vehicle Weight· Pickup
Test Inertia ..... 5,400 lb {2,452 kg) Gross Static ..... 5,565 lb (2,526 kg)
Vehicle Damage Classification TAD ......... 11FL4 & 11LD4 CDC ......... 11FLEK3 & 11LDEW3
Maximum Vehjcle~Cru$h.:. 13~0.in (330 mm)
Impact Speed .... 60.4 mi/h Impact Angle .... 20.4 deg Speed at Parallel . 56.6 mi/h Exit Speed .... 55.6 mi/h Exit Trajectory . . 9.0 deg Vehicle Accelerations
1h·
(97.2 km/h)
(91.1 km/h) (89.5 km/h)
(Max. 0.050-sec Avg) at true e.g. Longitudinal ... -4.1 g Lateral ...•. -12.0 g
Occupant Impact Velocity at true e.g. Longitudinal ... 11.7 ft/s (3.6 m/s) Later a 1 . . . . . 2 4 . 4 f tIs ( 7 . 4 m/s )
Occupant Ridedown Accelerations Longitudinal . . 1.0 g Lateral ..... -12.3 g
Figure 25. Summary of results for test 7069:36 .
w co
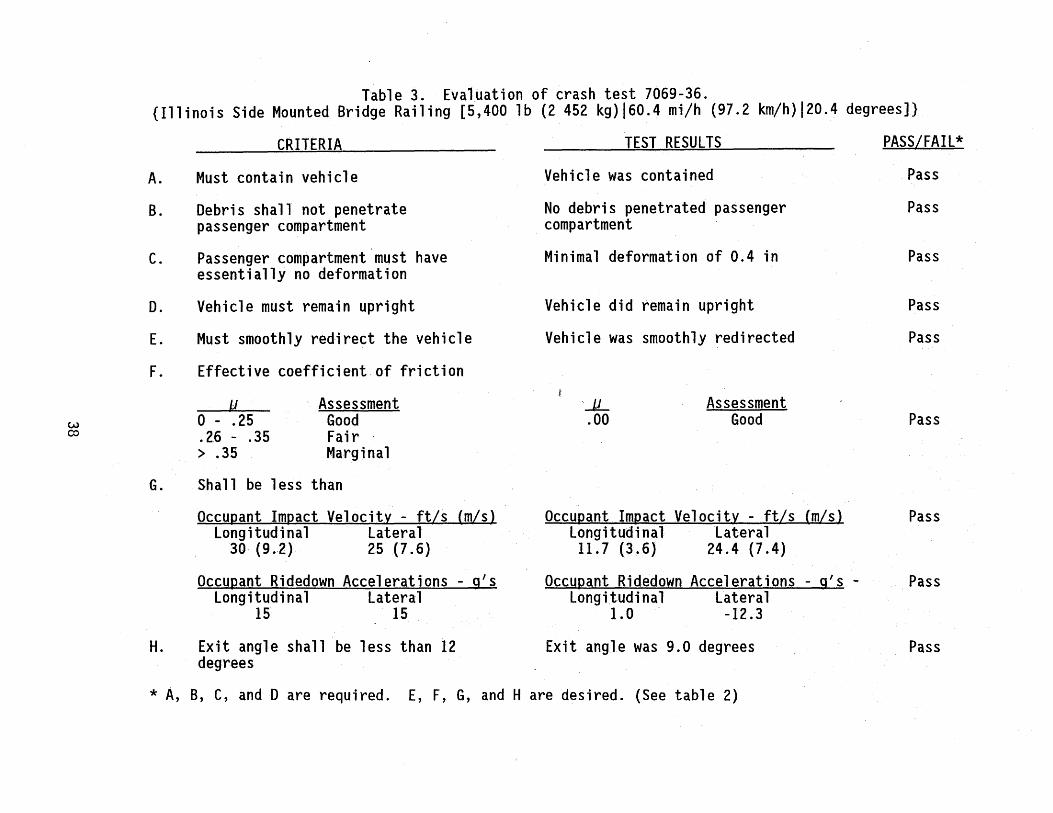
Table 3. Evaluation of crash test 7069-36. {Illinois Side Mounted Bridge Railing [5,400 lb (2 452 kg)l60.4 mi/h (97.2 km/h)j20.4 degrees]}
A.
B.
c.
D.
E.
F.
CRITERIA
Must contain vehicle
Debris shall not penetrate passenger compartment
Passenger compartment.must have essentially no deformation
Vehicle must remain upright
Must smoothly redirect the vehicle
Effective coefficient of friction
u 0 - • 25 . 26 - .35 > .35
Assessment Good Fair · Marginal
G. Shall be less than
H.
Occupant Impact Velocity - ft/s {m/s) Longitudinal Lateral
30 (9.2) 25 (7.6)
Occupant Ridedown Accelerations - q's Longi tudi na 1 Latera 1
15 15
Exit angle shall be less than 12 degrees
TEST RESULTS
Vehicle was contained
No debris penetrated passenger compartment
Minimal deformation of 0.4 in
Vehicle did remain upright
Vehicle was smoothly redirected
_jJ_ .00
Assessment Good
Occupant Impact Velocity - ft/s (m/s) Longitudinal Lateral 11.7 (3.6) 24.4 (7.4)
Occupant Ridedown Accelerations - g's -Longitudi na 1 Latera 1
1.0 -12.3
Exit angle was 9.0 degrees
* A, 8, C, and 0 are required. E, F, G, and H are desired. (See table 2)
PASS/FAIL*
Pass
Pass
Pass
Pass
Pass
Pass
Pass
Pass
Pass
0.000 s
0.036 s
0.073 s
0.109 s Figure 26. Sequential photographs for test 7069-36
(overhead and frontal views).
39
0.146 s
0.194 s
0.243 s
0.291 s Figure 26. Sequential photographs for test 7069-36
(overhead and frontal views continued).
40
0.000 s
0.036 s
0.073 s
0.109 s Figure 27. Sequential photographs for test 7069-36
(perpendicular and interior views).
41
0.146 s
O.J94 s
0.243 s
0.291 s Figure 27. Sequential photographs for test 7069-36
(perpendicular and interior views continued).
42
-(/) OJ OJ L Ol OJ
~ 0 w -
+J c OJ E OJ u ro
r-1
Ct (/) ·r-i
0
7069-36
I Yaw >E Pitch 0 Rolf
5.0
0.0
-
\ •7
h. ,y/I.W
~®¥ . ~', -,1
,
0
cc
Axes are vehicle fixed. Sequence for determining orientation is:
1. Yaw 2. Pitch 3. Roll
-40 . o_.__--+------t---+-----+--____,t----+----+--....._--4--o.o 0.2 0.4 0.6 0.8
Time (8econds) PA3.08
Figure 28. Vehicle angular displacements for test 7069-36 .
~ ~
CRASH TEST 7069-36 Accelerometer at center-of-gravity
80 : : : : i . . ! !
701········ .. ··········-·····+··· .. ······················i·······-· ... ··············~, .......................... i········ .. ···············.J............ Test Article: Illinois Side-Mounted Bridge Rail I I I I I Test Vehicle: 1986 Chevrolet C20 Pickup
601-......................... T ........................... l ........................... t ........................... f ........................... l ............. Test Inertia Weight: 5,40·o lb
....... so ........................ J ........................... L. ........................ L ......................... L. ...................... J............ Gross Static Weight: 5,565 lb -~ ! i ! I I Test Speed: 60.4 mi/h ~ i : i ! : z 40 .......................... 1 ........................... f ........................... ! ........................... i ........................... !............. Test Angle: 20.4 degrees
....1 0 . II ·~Al . ~Ljo ,., .. . !, • : - : . l 'a • : ' u: <C · ftifill' . . · . · 1i1 41? v st ll v~;;zu 0; 9 4 FA ' , 1 1' l " 4 !U v 1 6 1 1 z 0 :;) I(!} z g
j :• . ' • . 'v: : j
•60 b 0.1 0.2 0.3 0.4 0.5 0.6 0.7
lib = 0.454 kg TIME AFTER IMPACT (SECONDS)
1 mi/h = 1. 609 km/h ,~ class 180 niter - so-msec Average I
Figure 29. Vehicle longitudinal accelerometer trace for test 7069-36 (accelerometer located at center-of-gravity).
0.8 0.9 1
.,J::::. 01
w
~
CRASH TEST 7069-36 Accelerometer at center-of-gravity
80 ! ; ; ! . . . .
70+-·-·--·-·-·-·-+---·-·-·--·-·+---·-·-·-·-+-·--·-·-·-·----l·-··--·---·-·-+·-··--· Test Article: Illinois Side-Mounted Bridge Rail ! l l l ! Test Vehicle: 1986 Chevrolet C20 Pickup
60-f··············· ........... f .......................... + .......................... ! ......................... + ........................ +............ Test Inertia Weight: 5,400 lb
I l · i I I Gross static Weight: 5,565 lb 50-1·· .. ······ ................ .,. ........................................................................................................................... .. ! I ! I ! TestSpeed: 60.4mi/h
-20
-30
-40
-50
-60~----~------;-----~------;-----~------+------+------+------+----~ 0 0.1
lib = 0.454 kg 1 mi/h = 1. 609 km/h
0.2 0.3 0.4 0.5 0.6 0.7 TIME AFTER IMPACT (SECONDS)
l-. Class 1ac:l'n1ter - so-msec Average J
Figure 30. Vehicle lateral accelerometer trace for test 7069-36 (accelerometer located at center-of-gravity).
0.8 0.9 1
-~=:=> 0"1
CRASH TEST 7069-36 Accelerometer at center-of-gravity
80 : : : : : . . . .
70+------------r------------t·--------------j---------------1-------------~------ Test Article: IIHnois Side-Mounted Bridge Rail I I I I ! Test Vehicle: 1986 Chevrolet C20 Pickup
60-t··························f·· ......................... !·······:··· ............... +···· ...................... i············· .............. t··· .......... Test Inertia Weight: 5,400 lb
50 .......................... ! .......................... J .......................... l ........................... l ........................... l............. Gross static Weight:. 5,565 lb j 1 j j ! Test Speed: 60.4 mi/h
-30
-40
-50
-60 0 0.1
1 lb = 0.454 kg 1 mi/h = 1.609·kmlh
0.2 0.3 0.4 0.5 0.6 0.7 TIME AFTER IMPACT (SECONDS)
~-.-. Class 1 aantter - 50-nlsac AveraQB]
Figure 31. Vehicle vertical accelerometer trace for test 7069-36 (accelerometer located at center-of-gravity).
0.8 0.9 1
.,::::.. ""'-J
'(j)
s z 0
i w ..J w 0
~ ..J <( z c ~ (!) z g
CRASH TEST 7069-36 Accelerometer at rear of vehicle
80 : : ! ! . . . ! ; ! i
Test Article: Illinois Side-Mounted Bridge Rail ···· Test Vehicle: 1986 Chevrolet C20 Pickup Test Inertia Weight: 5,400 lb Gross Static Weight: 5,5651b TestSpeed: 60.4mi/h Test Angle: 20.4 degrees
-60 . j • • • j ; ;
0 0.1
1 lb = 0.454 kg 1 mi/h = 1. 609 km/h
0.2 0.3 0.4 0.5 0.6 0.7 0.8 TIME AFTER IMPACT (SECONDS)
1-. Class tao niter - 50-msecA~
Figure 32. Vehicle longitudinal accelerometer trace for test 7069-36 (accelerometer located at rear of vehicle).
0.9 1
~ 00
CRASH TEST 7069-36 Accelerometer at rear of vehicle
80 ! ! ! ! ' ' !
70+-·-····-·····-·-·l-·-···-······-·-·-···!-····-··-··-·---·-··t·-·-·-····-·-··--··1·-·-·-·-·-·-·-·-·--r"-····-·
~ :~:::::=:-::1:::::::~:-:r~-~:==:-:r~:-~=~:=~I:~-=::::l-~::= Test Article:· Illinois Side-Mounted Bridge Rail Test Vehicle: 1986 Chevrolet C20 Pickup Test Inertia Weight: 5,400 fb Gross static Weight: 5,565 lb Test Speed: 60.4 mi/h Test Angle: 20.4 degrees
s z 0
i w ....J w 0
~ ....J
~ w
5
o~
-60 . . . . . 0 0.1
llb = 0.454 kg 1 mi/h = 1.609 km/h
0.2 0.3 0.4 0.5 0.6 0.7 I
TIME AFTER IMPACT (SECONDS)
1-. c1ass 1aontter ......,-~sec Average--]
Figure 33. Vehicle lateral accelerometer trace for test 7069-36 (accelerometer located at rear of vehicle).
0.8 0.9 1
TEST 7069-37
Test Description
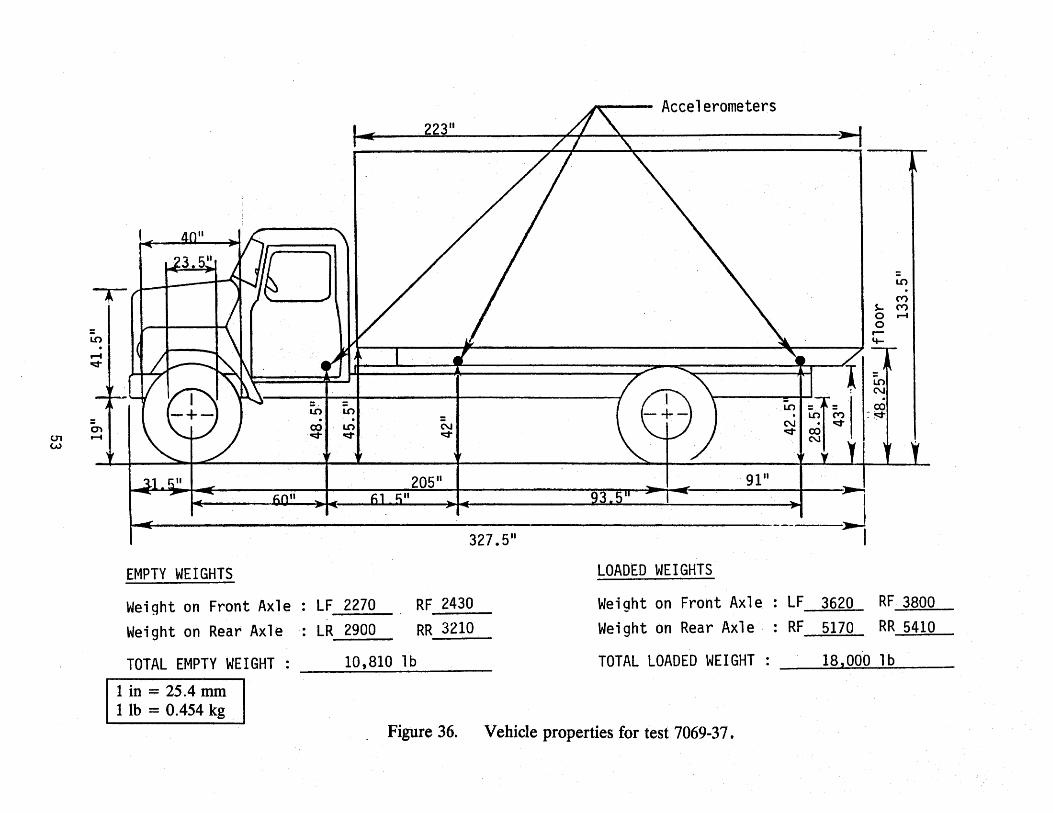
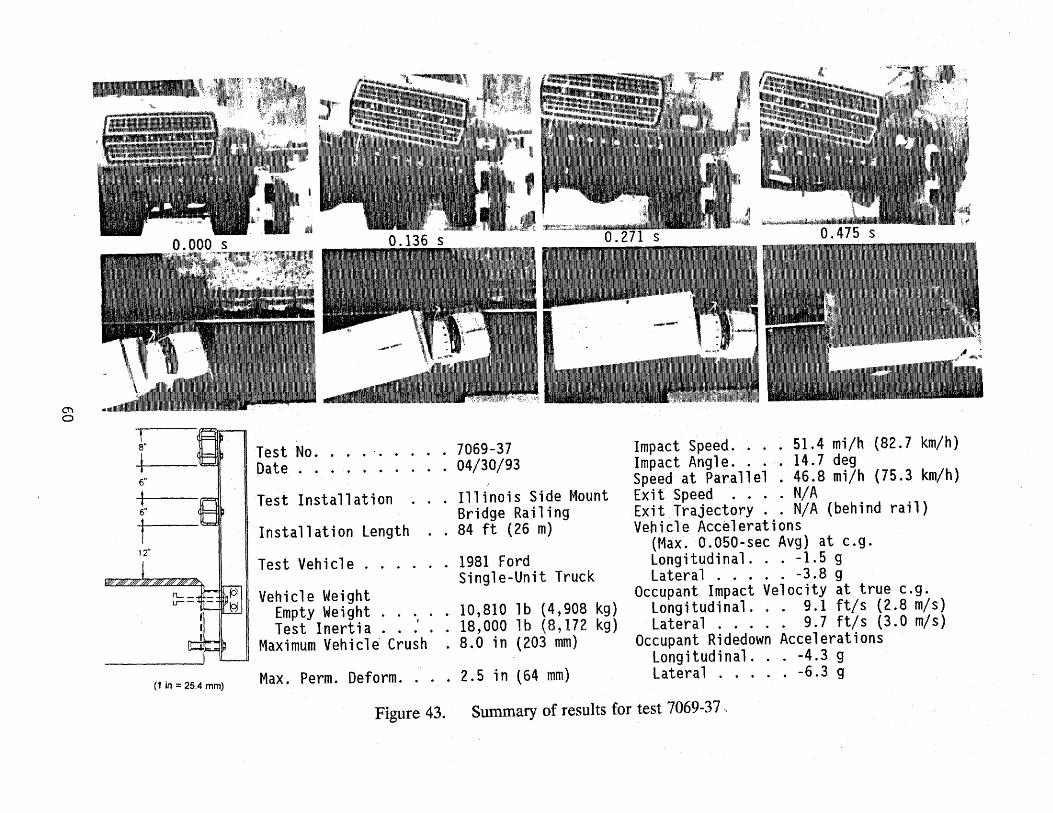
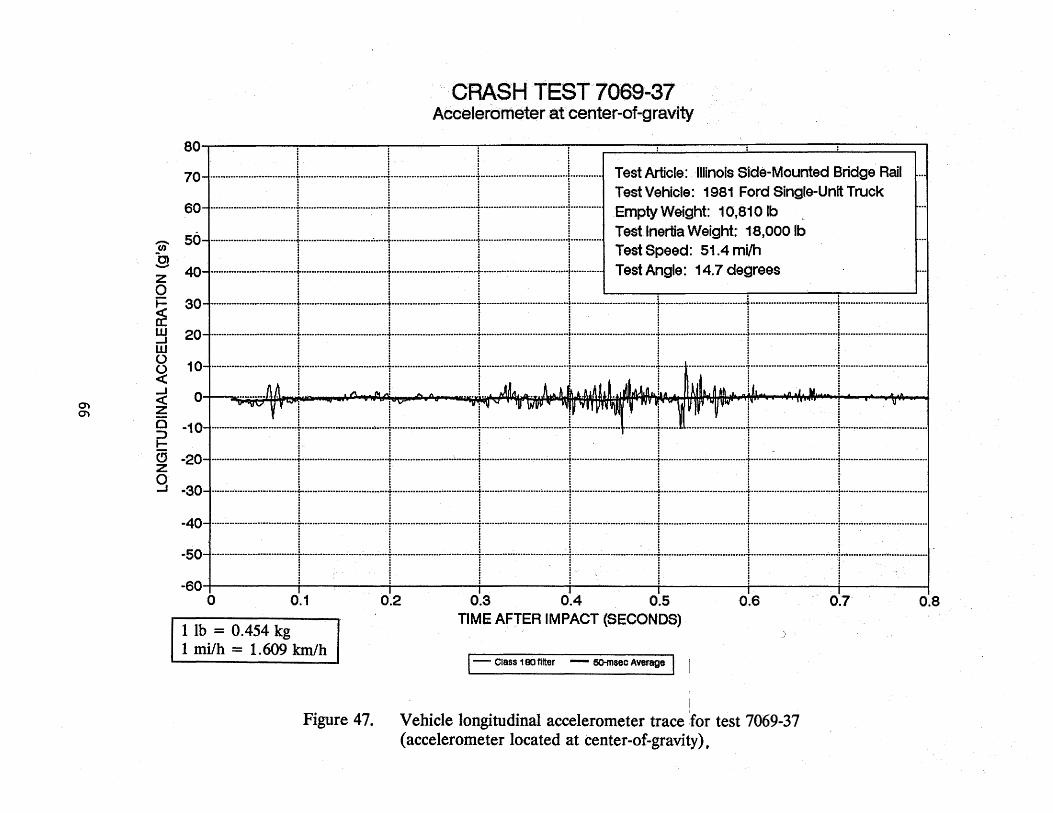
A 1981 Ford single-unit truck (figures 34 and 35) was used for the crash test. Empty weight of the vehicle was 10,810 lb (4 908 kg) and its test inertia and gross static mass was 18,000 lb (8 172 kg). The height to the lower edge of the vehicle bumper was 19.0 in ( 483 nun) and it was 31.0 in (787 nun) to the top of the bumper. Additional dimensions and information on the test vehicle are given in figure 36. The vehicle was directed into the Illinois side mount bridge railing system (shown in figures 3 7 and 3 8) using the cable reverse tow and guidance system and was released to be free-wheeling and unrestrained just prior to impact. The vehicle impacted the bridge railing 2.3 ft (70 1 mm) downstream from post 4 at a speed of 51.4 milh (82.7 km/h) and the angle of impact was 14.7 degrees.
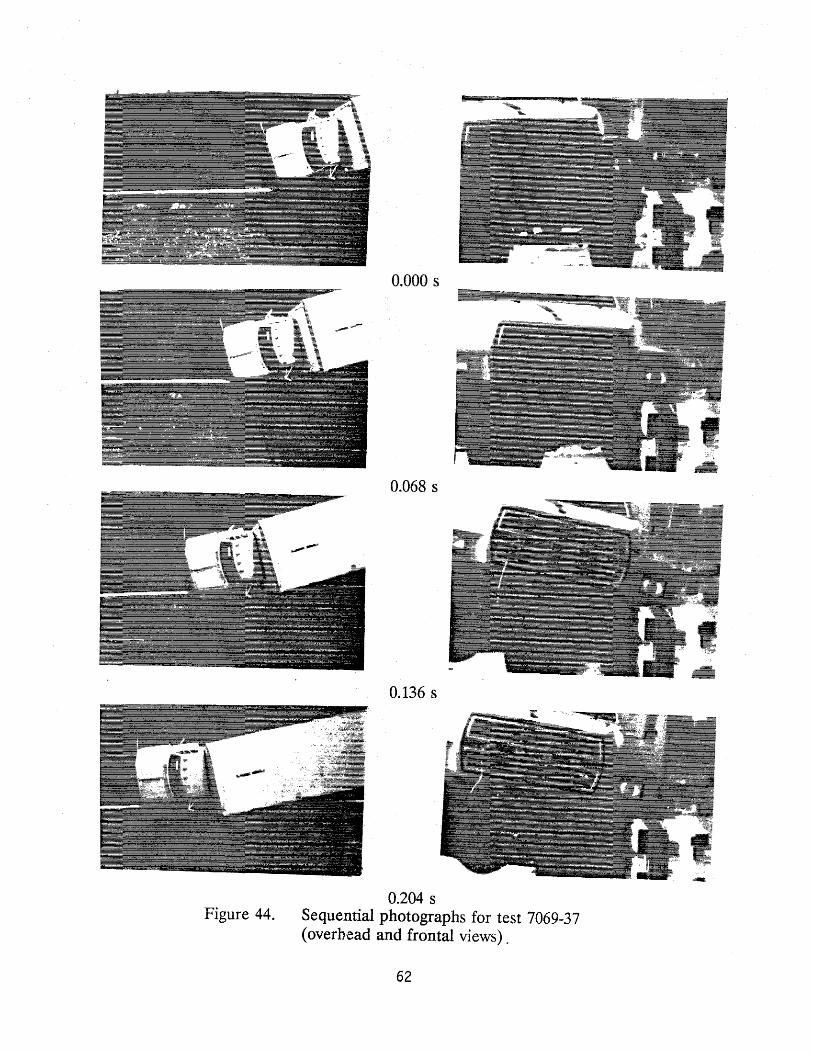
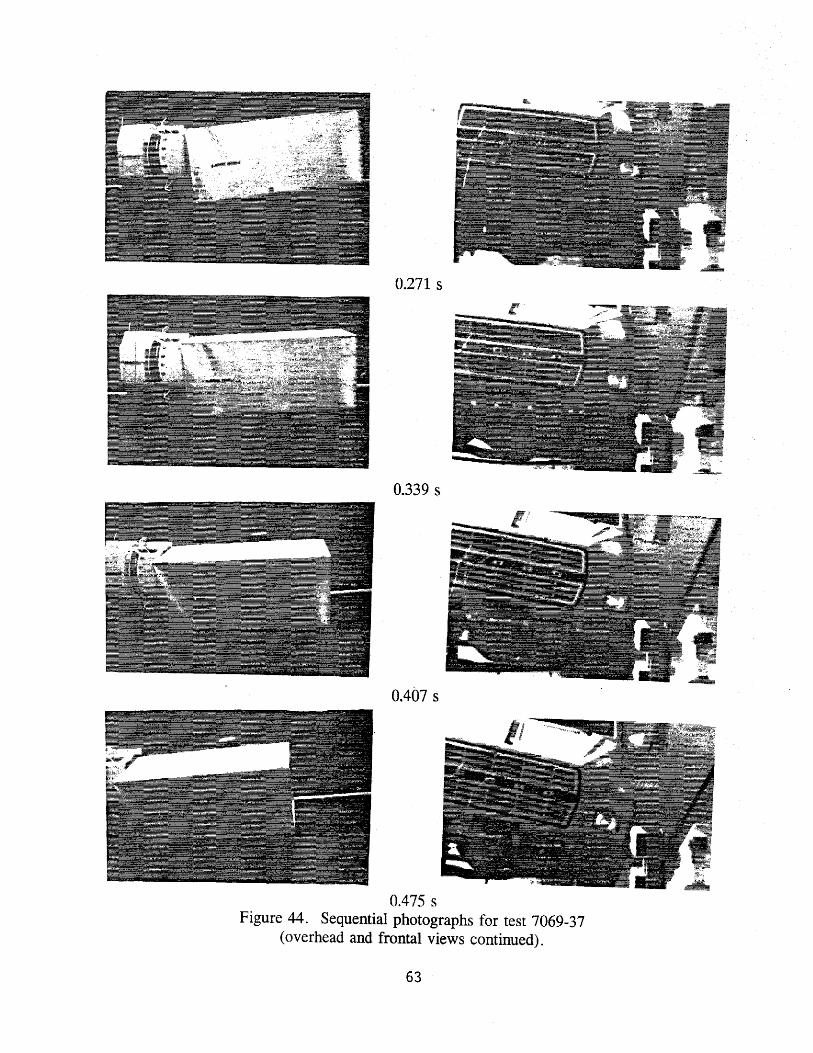
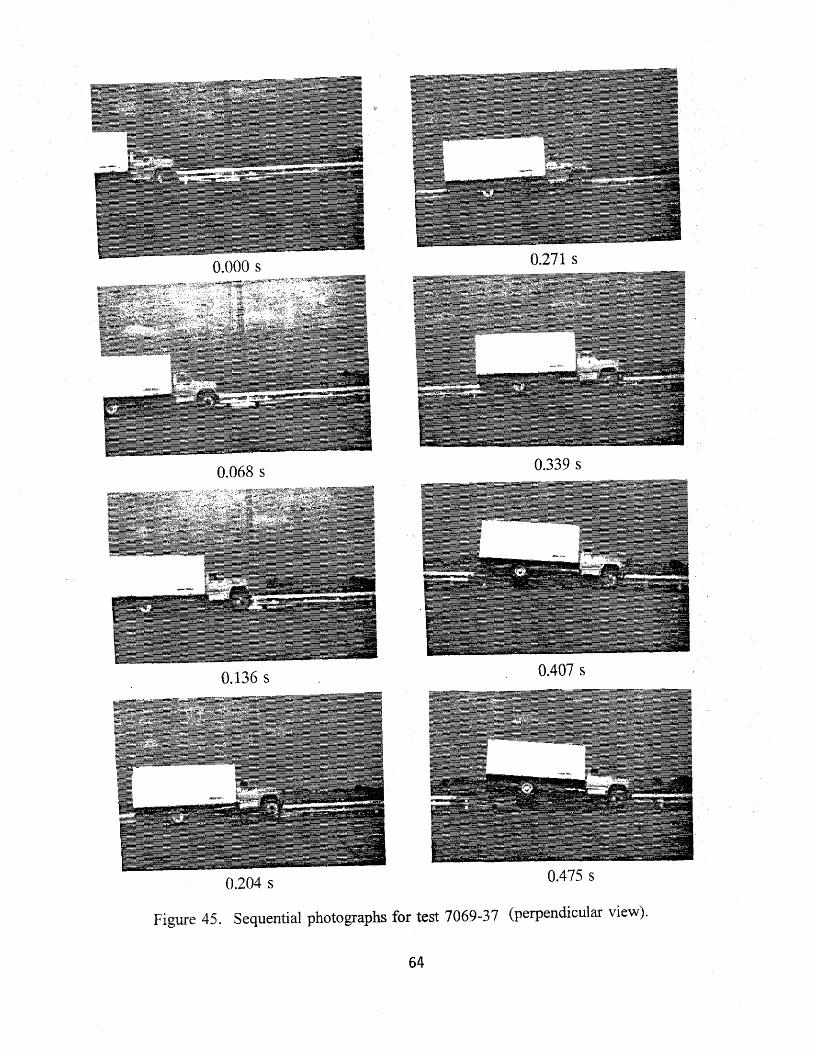
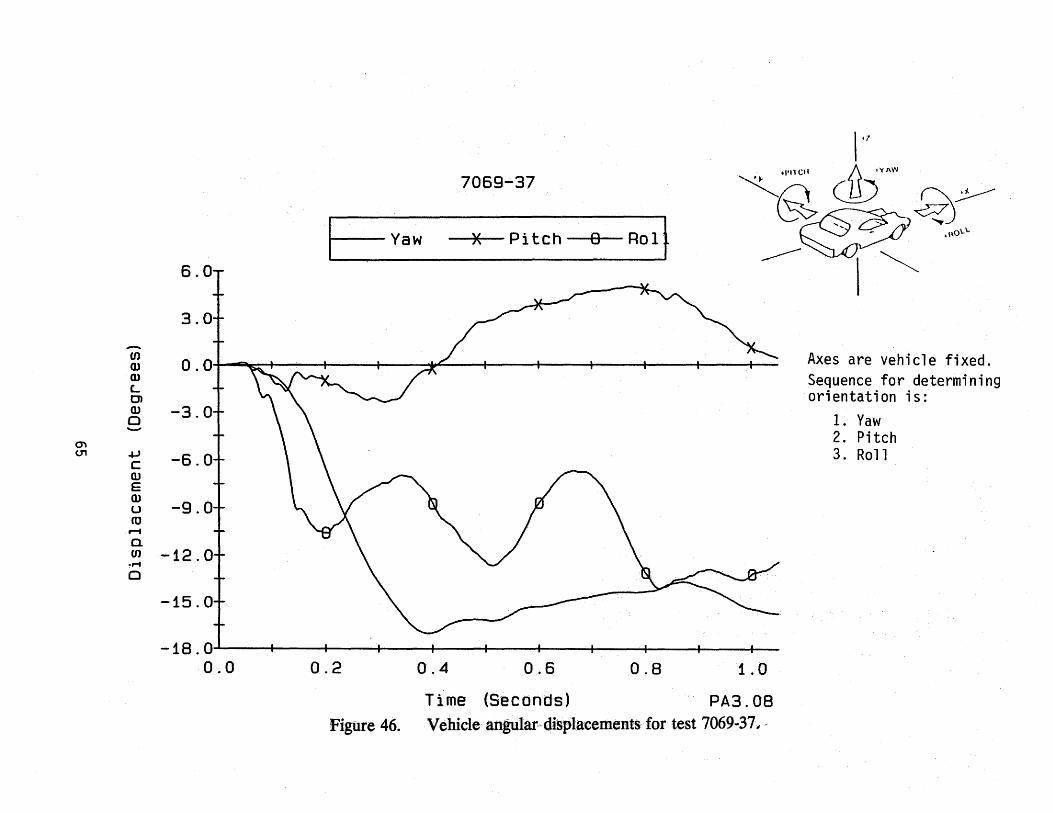
Approximately 0.022 s after impact, the left front tire of the vehicle impacted the bridge railing and then rode up and steered into the rail. The vehicle began to redirect at 0.061 s, and by 0.261 s the vehicle was traveling parallel to the bridge railing at a speed of 46.8 milh (75.3 km/h). The rear of the vehicle contacted the bridge railing at approximately 0.283 s and the lower edge of the box-van set down on top of the rail at 0.331 s and rode along in this manner until the vehicle exited the rail. The cab of the vehicle reached a maximum roll angle of about 12 degrees at 0.469 s. At 0.725 s the box-van had rolled to a maximum of about 53 degrees, and at 0.822 s began to right itself. The vehicle rode off the end of the bridge railing and the vehicle subsequently came to rest 165 ft (50 m) down from and 9 ft (3 m) behind the point of impact.
As can be seen in figures 3 9 through 41, the bridge railing received moderate damage with most being contained within the area between posts 4 through 7. The upper and lower rails sustained gouges between posts 4 and 5 from the lug nuts of the wheel of the vehicle. The head of the lower bolt on the top rail at post 5 was tom off and the bolts on the lower element were loose. The angles at post 4 were slightly bent and those at posts 5 and 6 were deformed. The spacers at posts 4 and 5 were knocked loose and down. There was 2.5-in (64-mm) deformation to the upper rail element at post 5. The vehicle was in contact with the bridge railing for 69 ft (21 m). · ·
The vehicle sustained damage mostly to the left side as shown in figure 42. Maximum crush at the left front comer at bumper height was 8.0 in (203 nun). The front springs, shackles, and U-bolt were damaged and the box-van shifted off the frame approximately 6 in (150 nun). Also, damage was done to the front bumper, left front quarter panel, left front tire and rim, left rear outside tire and rim, and lower edge of the box-van.
Test Results
The impact speed was 51.4 milh (82.7 kmlh) and the angle of impact was 14.7 degrees. The speed of the vehicle at time of parallel was 46.8 milh (75.9 km/h) and the coefficient of friction was 0.22. The vehicle remained in contact with the bridge railing and rode off the end subsequently coming to rest behind the installation. Data from the
49
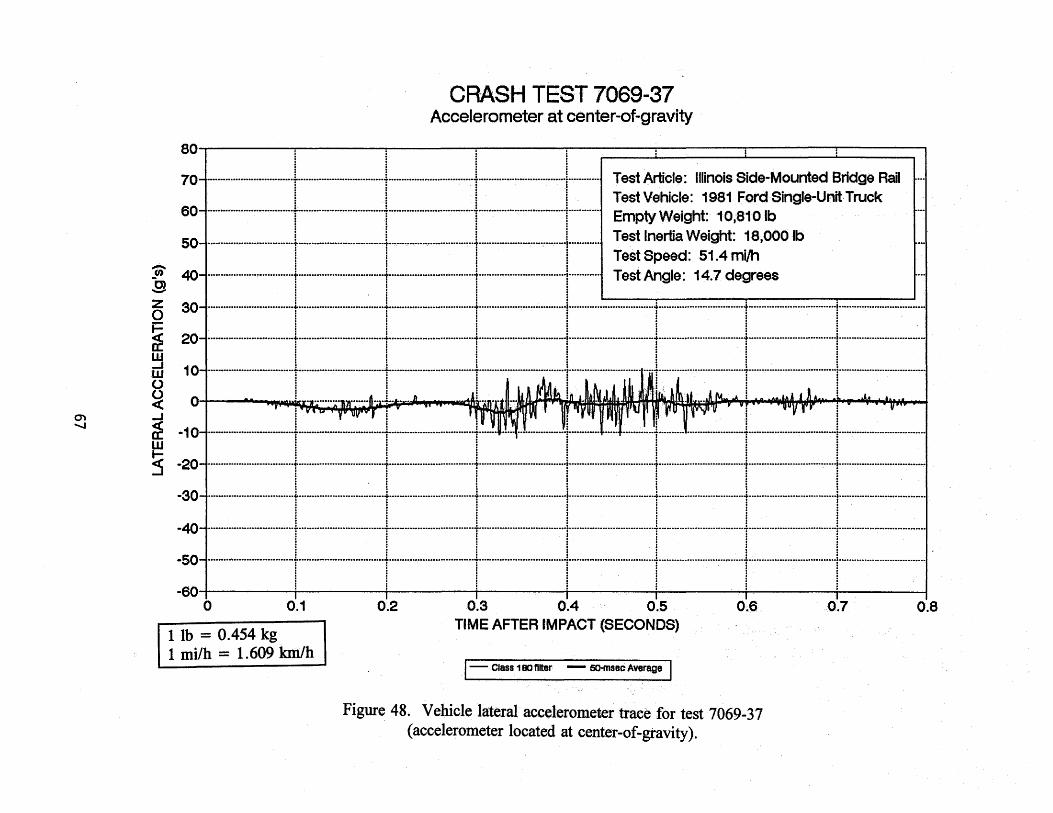
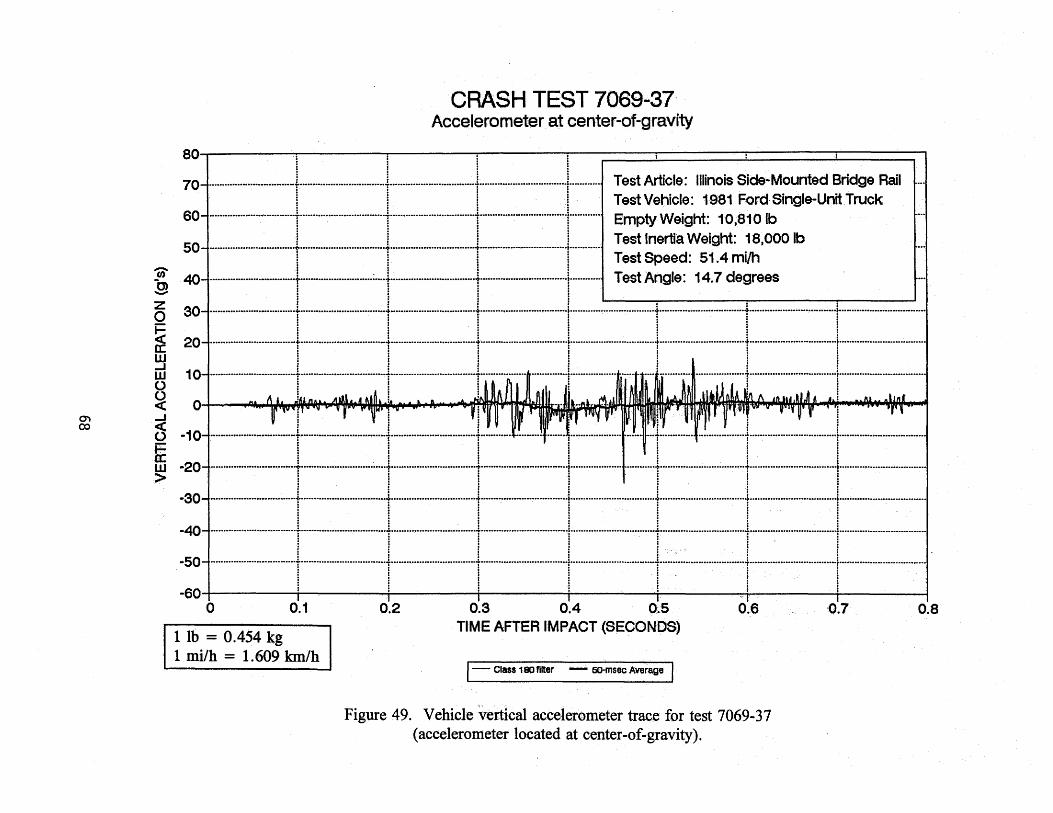
accelerometer located at the center..;of-gravity were digitized for evaluation and occupant tisk factors were computed as follows. In the longitudinal direction, occupant impact velocity was 9.1 ft/s (2.8 m/s) at 0.446 s, the highest 0.010-s average ridedown acceleration was -4.3 g between 0.518 and 0.528 s, and the maximum 0.050-s average acceleration was -1.5 g between 0.410 and 0.460 s. Lateral occupant impact velocity was 9.7 ft/s (3.0 m/s) at 0.259 s, the highest 0.010-s occupant ridedown acceleration was -6.3 g between 0.335 and 0.345 s, and the maximum 0.050-s average acceleration was -3.8 g between 0.296 and 0.346 s. These data and other pertinent information from the test are summarized in figure 43 and table 4. Sequential photographs for the test sequence are shown· in figures 44 and 45. Vehicular angular displacements are displayed in figure 46. Vehicular accelerations versus time traces filtered at SAE J211 (Class 180) are presented in figures 47 through 53.
Conclusions
The bridge railing contained the test vehicle with minimal lateral movement of the bridge railing. There was no intrusion of railing components into the occupant compartment. The vehicle remained upright and relatively stable during the collision. The bridge railing redirected the vehicle and the effective coefficient of friction was considered good. The vehicle trajectory at loss of contact indicates no intrusion into adjacent traffic lanes. See figure 43 and table 4 for more details~
50
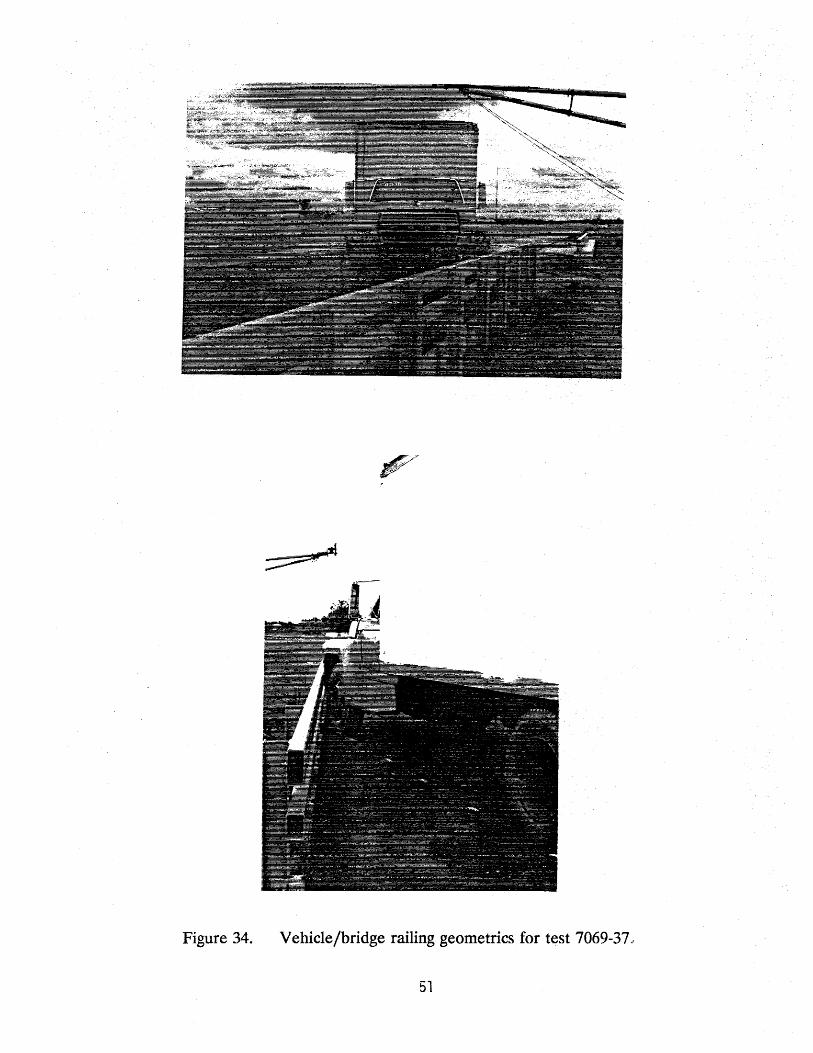
Figure 34. Vehicle/bridge railing geometries for test 7069-37 ..
51
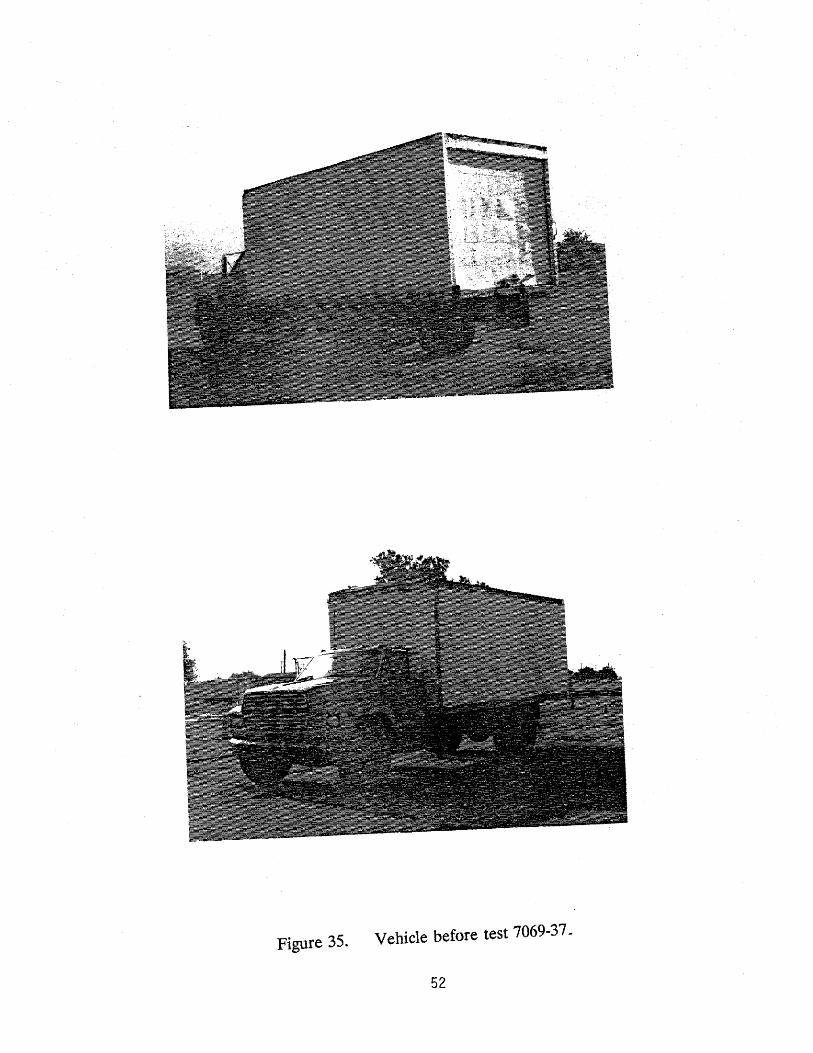
Figure 35. Vehicle before test 7069-37.
52
01 w
LO . _. -=:::t
., Accelerometers
1 22311
Lt " ~ LilliE 7J < ------,
91 11
327.5 11
EMPTY WEIGHTS LOADED WEIGHTS
-LO . M
S- M 0 _. 0
Weight on Front Axle : LF 2270 Weight on Rear Axle : LR 2900
RF 2430 RR 3210
Weight on Front Axle : LF 3620 RF3800 Weight on Rear Axle : RF 5170 RR 5410
TOTAL EMPTY WEIGHT
1 in= 25.4 mm 1 lb = 0.454 kg
10,810 lb TOTAL LOADED WEIGHT 18,000 lb
. Figure 36. Vehicle properties for test 7069-37.
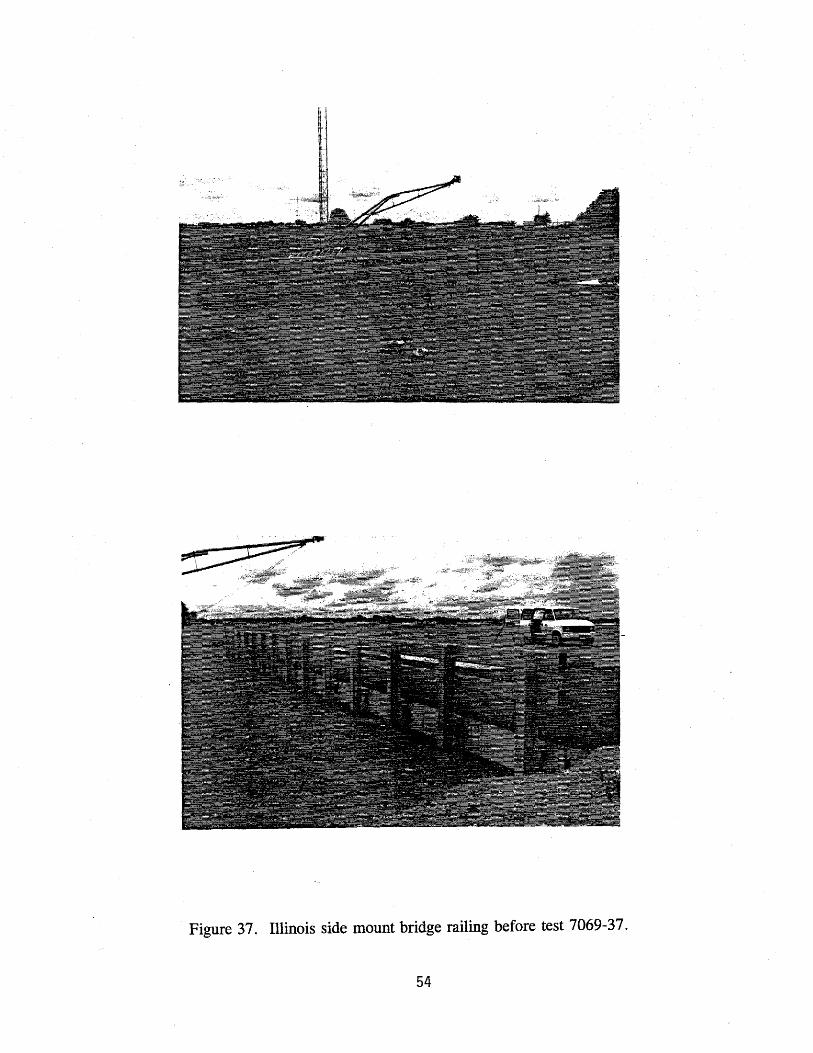
Figure 37. Illinois side mount bridge railing before test 7069-37.
54
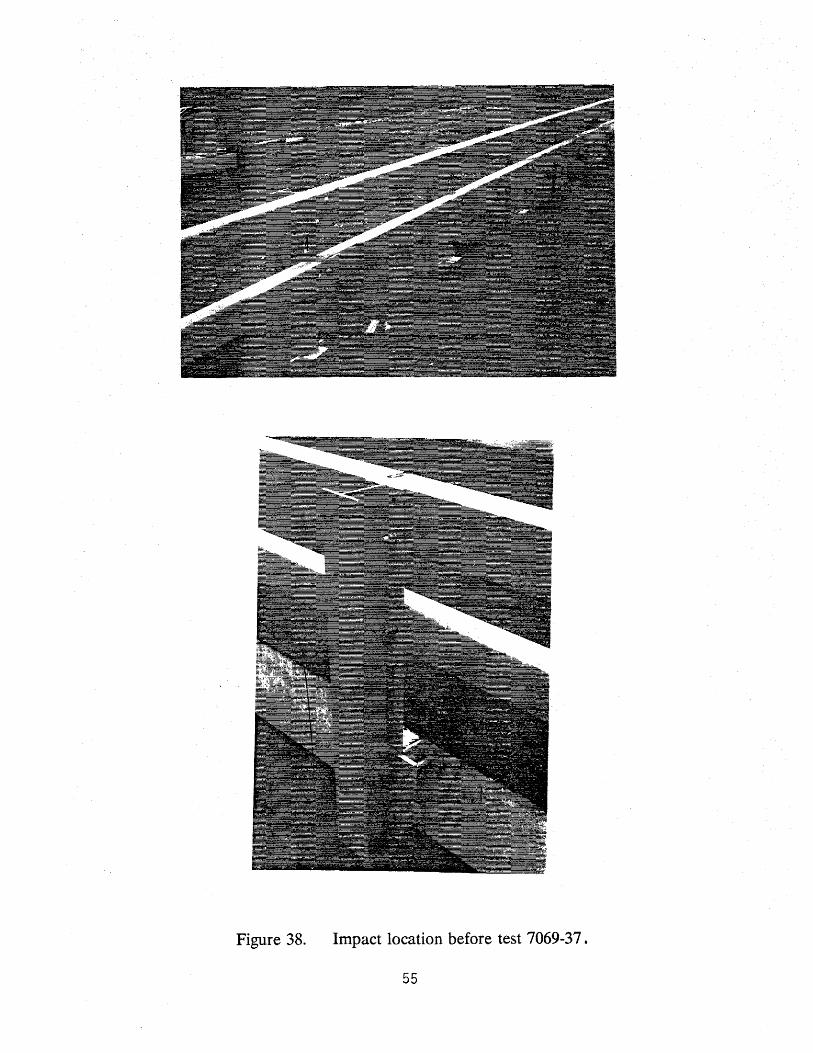
Figure 38. Impact location before test 7069-37 .
55

Figure 39. Test site after test 7069-37 4
56
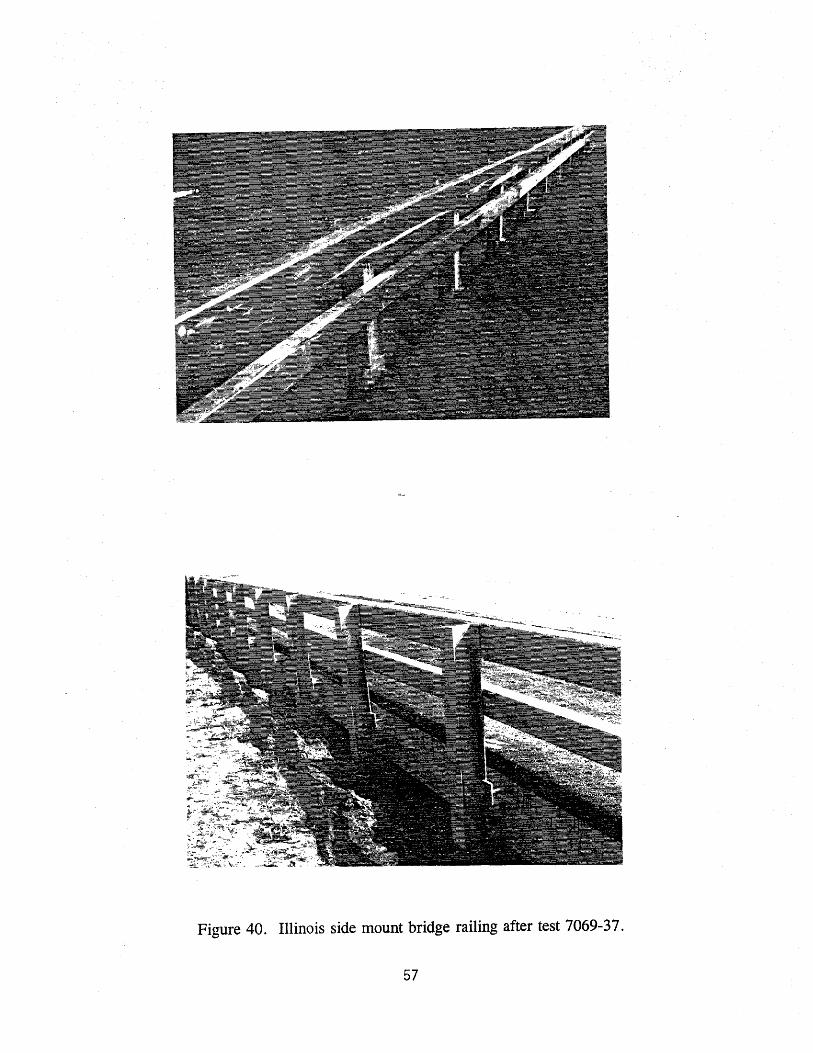
Figure 40. Illinois side mount bridge railing after test 7069-37.
57
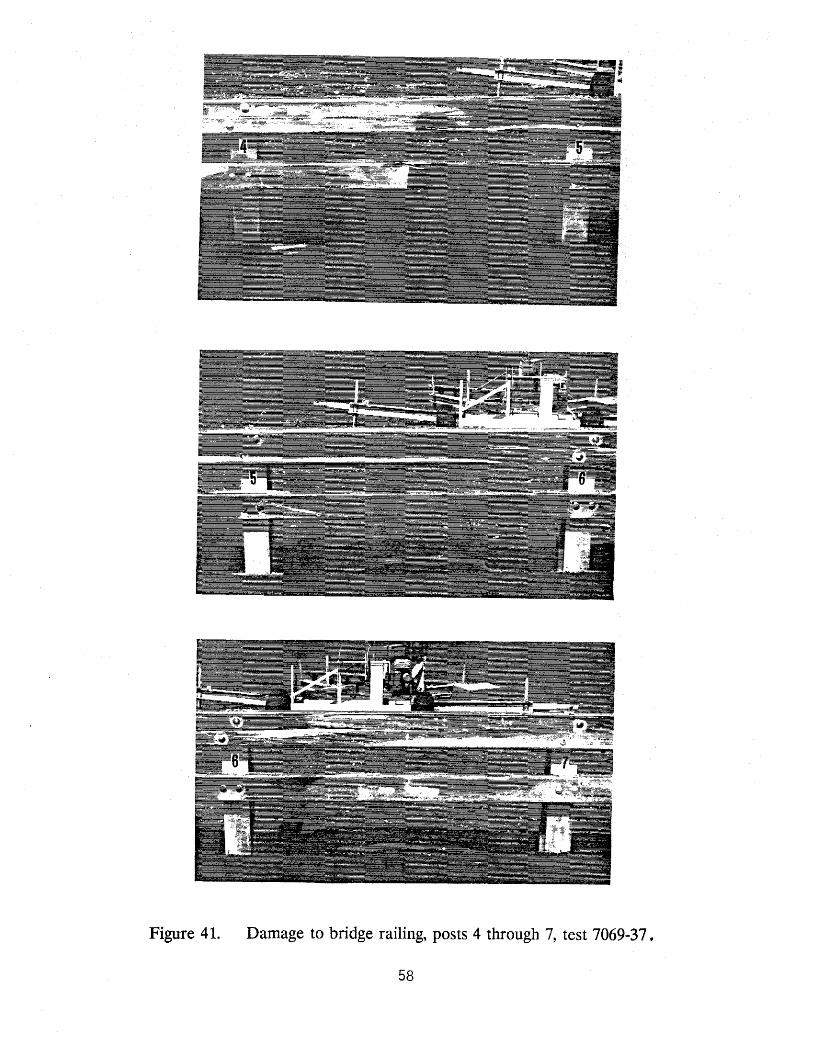
Figure 41. Damage to bridge railing, posts 4 through 7, test 7069-37 •
58
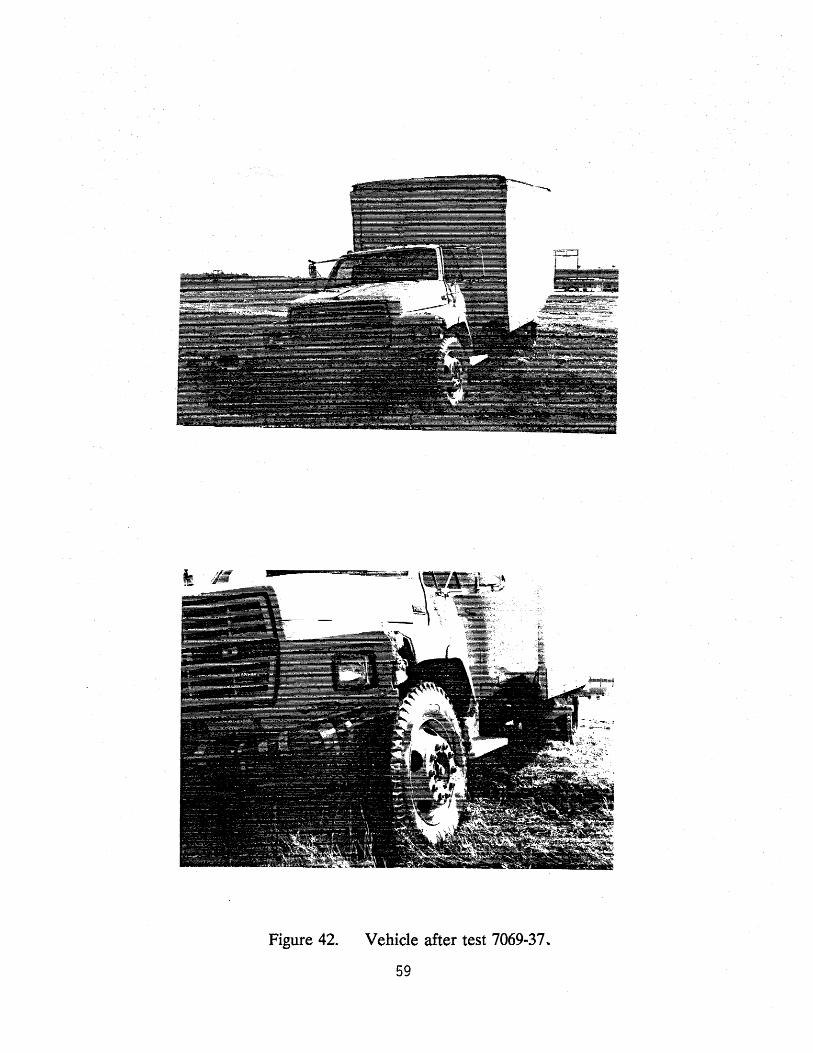
Figure 42. Vehicle after test 7069-37 ..
59
C"'' 0
' 8"
~ l 6" t ~ 6" t
(1 in = 25.4 mm)
Test No ... Date . . . .
. . . 7069-37 04/30/93
Test Installation ... Illinois Side Mount Bridge Railing
Installation Length .. 84 ft {26 m)
Test Vehicle ...... 1981 Ford Single-Unit Truck
Vehicle Weight Empty Weight ..... 10,810 lb (4,908 kg) Test Inertia .. .' .. 18,000 lb (8,172 kg)
Maximum Vehicl~ Crush . 8.0 in (203 mm)
Max. Perm. Deform .... 2.5 in (64 mm)
Impact Speed .... 51.4 mi/h (82.7 km/h) Impact Angle .... 14.7 deg Speed at Parallel . 46.8 mi/h (75.3 km/h) Exit Speed . ~ .. N/A Exit Trajectory .. N/A (behind rail) Vehicle Accelerations
(Max. 0.050-sec Avg) at e.g. Longitudinal ... -1.5 g Lateral ..... -3.8 g
Occupant Impact Velocity at true e.g. Longitudinal ... 9.1 ft/s (2.8 m/s) Lateral . . . . . 9.7 ft/s (3.0 m/s)
Occupant Ridedown Accelerations Longitudinal ... -4.3 g Lateral ..... -6.3 g
Figure 43. Summary of results for test 7069-37 ·:·
m __,
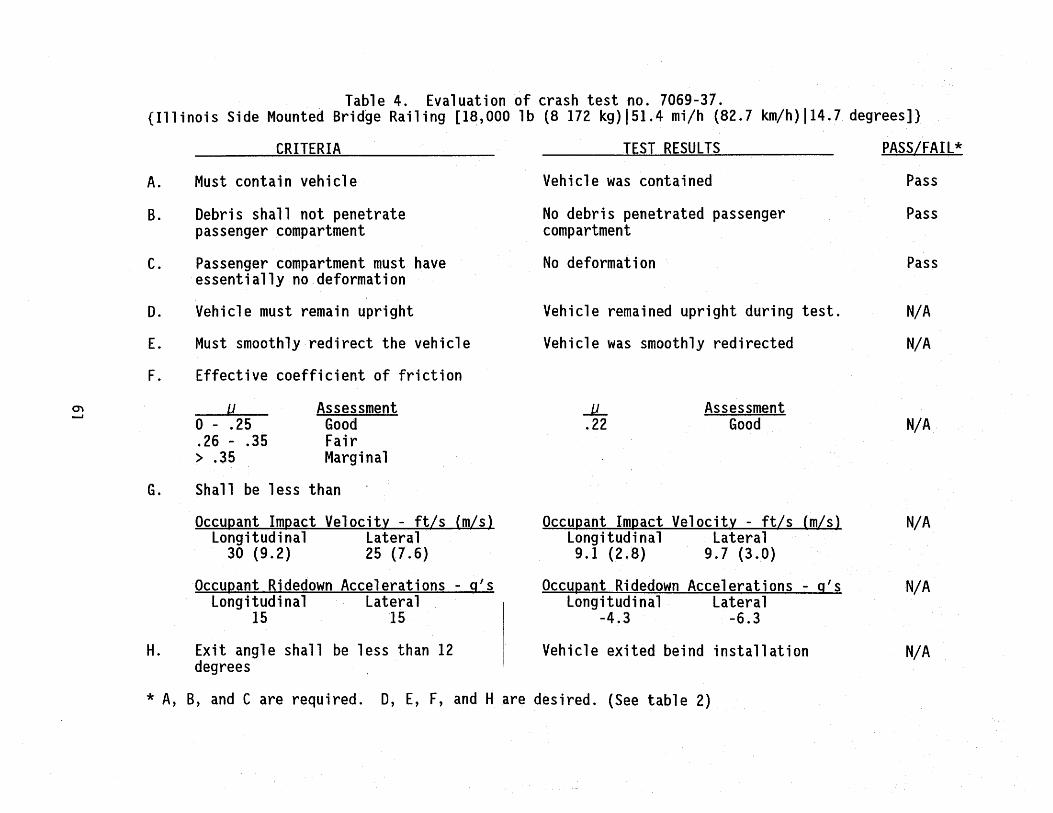
Table 4. Evaluation of crash test no. 7069-37. {Illinois Side Mounted Bridge Railing [18,000 lb (8 172 kg)l51.4 mi/h (82.7 km/h)l14.7 degrees]}
CRITERIA
A. Must contain vehicle
B. Debris shall not penetrate passenger compartment
c. Passenger compartment must have essentially no deformation
D. Vehicle must remain upright
E. Must smoothly redirect the vehicle
F. Effective coefficient of friction
u Assessment 0 - . 25 Good .26 - .35 Fair > .35 Marginal
G. Shall be less than
Occupant Impact Velocity - ft/s (m/s) Longitudinal Lateral
30 (9.2) 25 (7.6)
Occupant Ridedown Accelerations - g's Longitudinal Lateral
15 15
H. Exit angle shall be less than 12 degrees
TEST RESULTS
Vehicle was contained
No debris penetrated passenger compartment
No deformation
Vehicle remained upright during test.
Vehicle was smoothly redirected
.JL .22
Assessment Good
Occupant Impact Velocity - ft/s (m/s) Longitudinal Lateral 9.1 (2.8) 9.7 (3.0)
Occupant Ridedown Accelerations - g's Longitudinal Lateral
-4.3 -6.3
Vehicle exited beind installation
* A, B, and C are required. D, E, F, and H are desired. (See table 2)
PASS/FAIL*
Pass
Pass
Pass
N/A
N/A
N/A
N/A
N/A
N/A
0.000 s
0.068 s
0.136 s
0.204 s Figure 44. Sequential photographs for test 7069-37
(overhead and frontal views) .
62
0.271 s
0.339 s
0.407 s
0.475 s Figure 44. Sequential photographs for test 7069-37
(overhead and frontal views continued).
63
0.000 s 0.271 s
0.068 s 0.339 s
0.136 s 0.407 s
0.204 s 0.475 s
Figure 45. Sequential photographs for test 7069-37 (perpendicular view).
64
(/)
OJ OJ L tJ)
OJ 0 -
m ()"1 +J
c: OJ E OJ u fO ,...... a (/)
~r-i
0
7069-37
I Yaw >< Pitch -0- R~-lJ
1'7 ~ •YAW
~® s-~ GS~, ~J ', ~~
--- 1-~ •"0
0 . 0 I &: I I I =i'c I I I I I I - Axes are vehicle fixed. Sequence for determining orientation is:
-3.0 1. Yaw 2. Pitch 3. Ro 11
-9.0
-12.0
-15.0
-18.0~--~---+--~----r---~--~---+----~--+---~
o.o 0.2 0.4 0.6 0.8 1.0
Time (Seconds) PA3. 08 Figure 46. Vehicle angular, displacements for test 7069-37, .
0'\ 0'\
CRASH TEST.·7069-37 Accelerometer.atcenter-of-gravity
80 : : : ! . . .
70
60
y; 56 .9 z 0 i 30
~ 20 w (.)
~ ...J <(
: • Test Article: Illinois Side-Mounted Bridge Rail Test Vehicle: 1981 Ford Single-Unit Truck Empty Weight: 10,810 lb Test klertia Weight: 18,000 lb TestSpeed: 51.4mi/h Test Angle: 14.7 degrees
z 0 :::> I-C) z g ~::::::_~::l:::::::::~I::::::_::I:~_:::::::::::::l::::::~-~--:~:l:~:~:::~:::::l:::::::::::~::i::_::::::::~::
::::~:~~~~~:=~~~~l~~~~:~:::~:~~~~~f:~::~~~~:~:~:~:~~f:~~:~~::~~:~~:~~:::j:-:::~:~~~~=:=~:t~:~~~:~~:~~:~:::~:t~~:::~::~:~~:==j~:~:~:=~:~:~:~:~=:. 0 0.1 0.2 0.3 0.4 0.5 0.6
TIME AFTER IMPACT (SECONDS) 1 lb = 0.454 kg )
1 mi/h = 1. 609 km/h ,_. _ .... class 180 ntter - 50-msec Average I
i
Figure 47. Vehicle longitudinal accelerometer trace 'for test 7069-37 (accelerometer located at center-of-gravi~),
I
0.7 0.8
m ........
CRASH TEST 7069-37 Accelerometer at center-of-gravity
80 ; ; i i . .
70-1····················-···········+·······························+································t··································l············ Test Article: Illinois Side-Mounted Bridge Rail ! I I I Test Vehicle: 1981 Ford Single-Unit Truck
60-1····················-············f···················--············t·································t··································J············ Empty Weight:· ·1·0,-8·1·0 lb
50-t·······························J ................................. L ............................... L .................. ~ .. -~~--------L......... Test Inertia Weight: 18,000 lb ! ! ! ! TestSpeed: 51.4 mi/h
~ : : = :
_0 40 ................................. + ................................. +··--····------·--·--···--········+··--·--··----···--·----------·--··i·----····--· Test Angle: 14.7 degre.es
-J : !
-60 : : : : : : : 0 0.1 0.2 0.3 0.4 0.5 0.6 0.7 0.8
lib = 0.454 kg 1 mi/h = 1. 609 km/h
TIME AFTER IMPACT (SECONDS)
j--· Class '180tiii8r .;;,;;;.;;,;;- 60-msec Average 1
Figure 48. Vehicle lateral· accelerometer trace for test 7069-37 (accelerometer located at center-of-gravity).
0'\ co
CRASH TEST 7069-37 Accelerometer. at center-of-gravity
80 I I : ' ! !
i Test Article: Illinois Side-Mounted Bridge Rail TestVehicle: 1981 FordSingle-UnitTruck Empty Weight: 10,810 lb Test Inertia Weight: 18,000 lb Test Speed: 51.4 mi/h Test Ang.le: 14.7 degrees
................................. .c-........................................................................................................ , ........... .
~:~~~:~~:~~~~:~:~J~~~:~~~:~~:~~:~:~J~~:~::~:~~:~~:~:~~r:~:~~~=t:~~::~l~:~:~~. z 0 30 t= ~ 20 w .....1 w 0
~ .....1
(S t= a: w >
•• o •• -~···· •• ~.~, ,ld· • -.- . . ~-N ~ ~. '\1; ~ 1 4 IA'iO fr1114\f P1)14 fVf WI 4 if I ' • D b.,S~ri[·t.~ •· 4t : . :
0 0.1
1 lb = 0.454 kg 1 mi/h = 1.609 km/h
0.2 0.3 0.4 0.5 0.6 TIME AFTER IMPACT (SECONDS)
j- Class 18o ntter - 50-msec Average j
Figure 49. Vehicle ·vertical accelerometer trace for test 7069-37 (accelerometer located at center-of-gravity).
0.7 0.8
m
""
CRASH TEST 7069~37 Accelerometer at front of vehicle
80 , , . ! ! ! !
70
60
p; 50 a z 40 0
~ ~ 20 w 0
~ _J c( z
Test Article: Illinois Side-Mounted Bridge Rail Test Vehicle: 1981 Ford Single-Unit Truck Empty Weight: 10,810 lb Test Inertia Weight: 18,000 lb Test Speed: 51.4 mi/h Test Angle: 14.7 degrees
0
~ ~ z ------------------------~--'-------------1~~~~~~:~~~-~~~[~~~~~==t~~~:~~~=~~t:~~~~~~~~~~~t~~~~~~:=~~t~~~~~~~~~~~~: g
-60 0 0.1
1 lb = 0.454 kg 1 mi/h = 1. 609 km/h
0.2 0.3 0.4 0.5 0.6 TIME AFTER IMPACT (SECONDS)
1-c18ss 1ao niter -~ ;,..;,;;;;;so:msec-.A~
Figure 50. Vehicle longitudinal accelerometer trace for test 7069-37 (accelerometer located at front of vehicle).
0.7 0.8
......... 0
(i)
s z 0
~ ~ w ()
CRASH TEST 7'069-37 Accelerometer at front of vehicle
80 ! = : I · · !
Test Article: Illinois Side-Mounted Bridge Rail Test Vehicle: 1981 Ford Single-Unit Truck Empty Weight: 10,810 lb
70
60
0 0.1
1 lb = 0.454 kg 1 mi/h = 1. 609 km/h
Test Inertia Weight: 18,000 lb Test Speed: 51.4 mi/h Test Angle: 14.7 degrees
0.2 0.3 0.4 0.5 0.6 TIME AFTER IMPACT (SECONDS)
1-·· -·· -· · -cfas8180fitter -- 50-msec Average 1
Figure 51. Vehicle' lateral accelerometer :trace for test 7069-37 (accelerometer located at front of vehicle).
0.7 ·0.8
"0' g z 0
~ UJ __. w 0
~ __. ....... c( __, z
c :::> ~
CJ z g
CRASIH IEST-7069-37 Accelerometer at rear of vehicle
tsU I I I I : : : 10 ····················-············~·································+·································+··································i············ Test Article: Illinois Side-Mounted Bridge Rail ···
i I I I Test Vehicle: 1981 Ford Single-Unit Truck 60 ····················-············t·································t·································t··································f······· .. ··· Empty·Weight: 10,810 lb ···
50 ................................. l ................................. l ................................. l .................................. l............ Test Inertia Weight: 18,000 lb .. . l i i I Test Speed: 51.4 mi/h
·60 : : : : : : : 0 0.1 0.2 0.3 0.4 0.5 0.6 0.7 0
1 lb :::: 0.454 kg 1 mi/h = 1.609 km/h
TIME AFTER IMPACT (SECONDS)
1-- c1ass 1 ao niter ·· ...;;,;,.-oo:.msec Averag&J
Figure 52. Vehicle longitudinal accelerometer trace for test 7069-37 (accelerometer located at rear of vehicle).
8
"""-J 1'\)
CRASH TEST 7069-37 Accelerometer at rear of vehicle
80 ! ! : ! . .
70-l~·-··················· .. ~········.:. ................................. .l ................................. J ............•.................... .L.......... Test Article: Illinois Side-Mounted Bridge Rail ! ! ! ! Test Vehicle: 1981 Ford Single-UnitTruck
60-l·································t································+·······························+ .. ·····························+··········· Empty Weight: 10,810 lb
50-f ................................. L ............................... L .............................. J. ............................... J........... Test Inertia Weight: 18,000 lb ! I I t Test Speed: 51.4 mi/h
(.) . . . . I ··J At . I . . •· . ~ 0 : ; ! . . . .... 1.. • .IU .. I :tl.l .LJI Mr.JJtJ .. ,Atll "· .au ... .J
0 0.1
1 lb = 0.454 kg 1 mi/h =. 1.609 km/h
0.2 0.3 0.4 0.5 0.6 TIME AFTER IMPACT (SECONDS)
1-. -Class180 n~er ~sec Average I
Figure 53. Vehicle lateral accel,erometer·trace for test 7069-37 (accelerometer located at rear of vehicle).
0.7 0.8
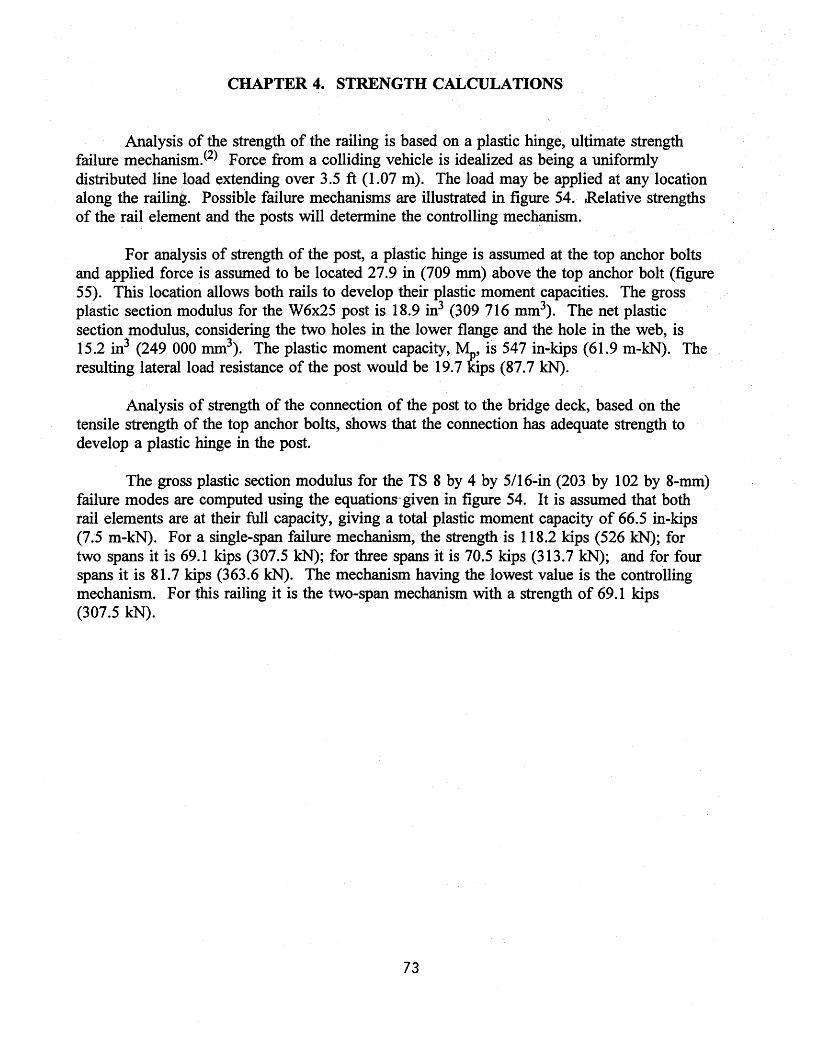
CHAPTER 4. STRENGTH CALCULATIONS
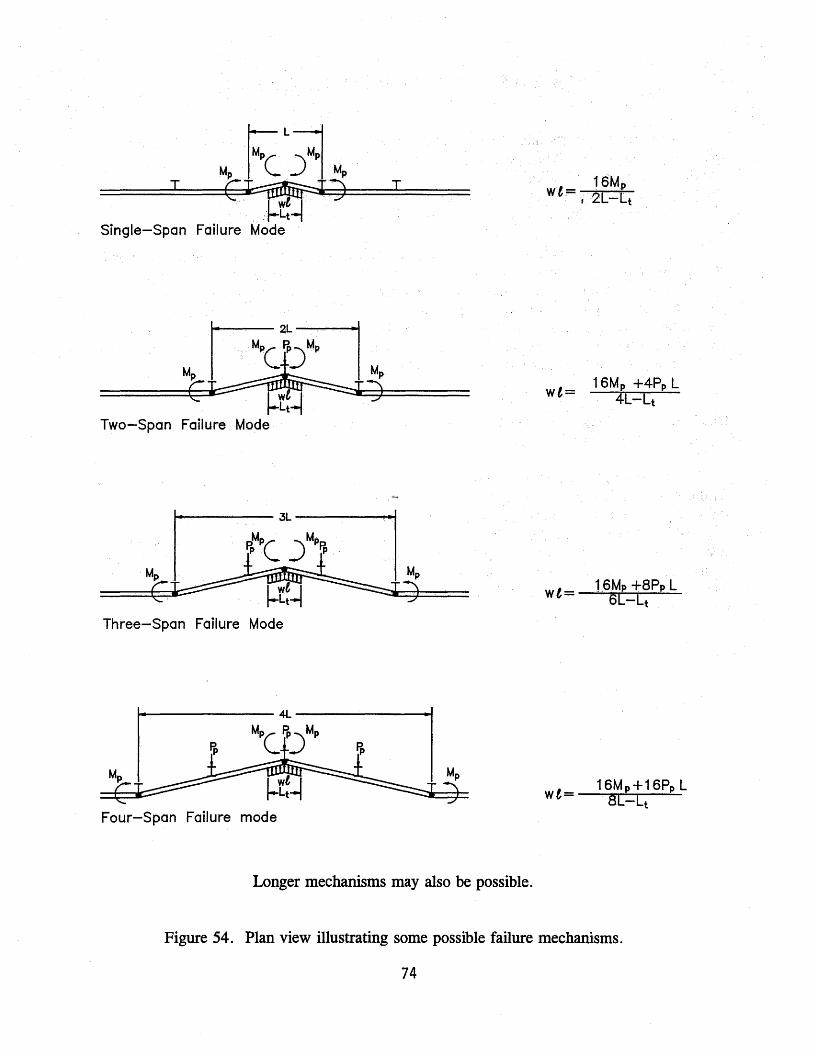
Analysis of the strength of the railing is based on a plastic hinge, ultimate strength failure mechanism.<2) Force from a colliding vehicle is idealized as being a uniformly distributed line load extending over 3.5 ft (1.07 m). The load may be applied at any location along the railing. Possible failure mechanisms are illustrated in figure 54. ,Relative strengths of the rail element and the posts will determine the controlling mechanism.
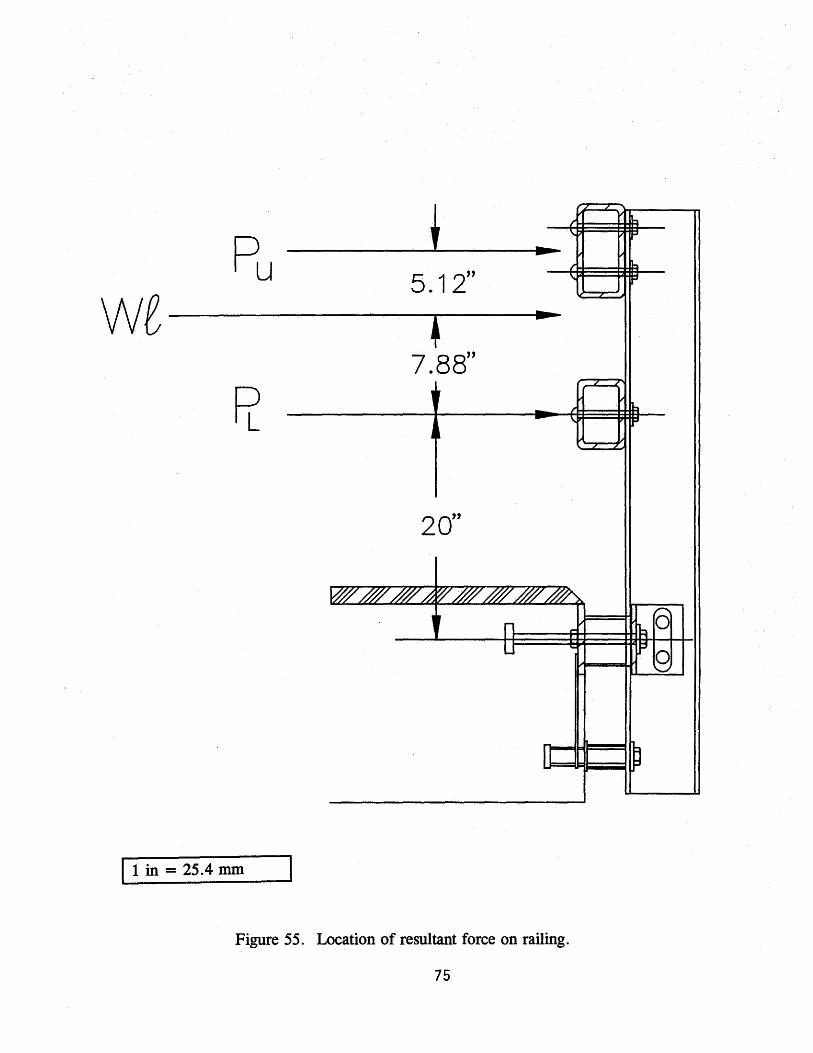
For analysis of strength of the post, a plastic hinge is assumed at the top anchor bolts and applied force is assumed to be located 27.9 in (709 mm) above the top anchor bolt (figure 55). This location allows both rails to develop their plastic moment capacities. The gross plastic section modulus for the W6x25 post is 18.9 in3 (309 716 mm3). The net plastic section modulus, considering the two holes in the lower flange and the hole in the web, is 15.2 in3 (249 000 mm3). The plastic moment capacity,~' is 547 in-kips (61.9 m-kN). The resulting lateral load resistance of the post would be 19.7 kips (87. 7 kN).
Analysis of strength of the connection of the post to the bridge deck, based on the tensile strength of the top anchor bolts, shows that the connection has adequate strength to develop a plastic hinge in the post.
The gross plastic section modulus for the TS 8 by 4 by 5/16-in (203 by 102 by 8-mm) failure modes are computed using the equations" given in figure 54. It is assumed that both rail elements are at their full capacity, giving a total plastic moment capacity of 66.5 in-kips (7.5 m-kN). For a single-span failure mechanism, the strength is 118.2 kips (526 kN); for two spans it is 69.1 kips (307.5 kN); for three spans it is 70.5 kips (313.7 kN); and for four spans it is 81.7 kips (363.6 kN). The mechanism having the lowest value is the controlling mechanism. For this railing it is the two-span mechanism with a strength of 69.1 kips (307.5 kN).
73
~ ~L]i ~ I G~:) I
Single-Span Failure Mode
Two-Span Failure
~~--~---3L----------~
Three-Span Failure Mode
Four-Span Failure mode
Longer mechanisms may also be possible.
16Mp wt= ,·2L-Lt
wt=
wt=
wt=
16Mp +4Pp L 4L-Lt
16Mp +8Pp L 6L-Lt
16Mp+16Pp L 8L-Lt
Figure 54. Plan view illustrating some possible failure mechanisms.
74
Pu t .. 5. 1 2" we +
.. 7.88"
F[
20''
lt in = 25.4 mm
Figure 55. Location of resultant force on railing.
75

REFERENCES
1. Guide Specifications For Bridge Railings, American Association of State Highway and Transportation Officials (AASHTO), Washington, DC, 1989.
2. Hirsch, T. J., "Analytical Evaluation of Texas Bridge Rails to Contain Buses and Trucks," Research Report 230-2, Texas Transportation Institute, Texas A&M University, C'ollege Station, TX, August 1978.
77