Embed Size (px)
Citation preview

photo
EPA/600/R-16/096 | June 2016 | www.epa.gov/research
Guidance on Data Quality Assessment for Life Cycle Inventory Data
National Risk Management Research Laboratory Office of Research and Development

EPA/600/R-16/096 June 2016
Guidance on Data Quality Assessment for Life Cycle Inventory Data
Version 1
by
Ashley Edelenǂ
Wesley Ingwersen Li fe Cycle Assessment Research Center
Systems Analysis Branch/ Sustainable Technology Division Nat ional Risk Management Research Laboratory
U.S. Environmental Protect ion Agency Cincinnat i , Ohio 45268
ǂ Oak R idge I ns t i t u t e f o r Sc ience and Ed uca t i on

Notice/Disclaimer Statement Disclaimer: The views expressed in this article are those of the authors and do not necessarily represent the views or policies of the U.S. Environmental Protection Agency.

Abstract Data quality within Life Cycle Assessment (LCA) is a significant issue for the future support and development of LCA as a decision support tool and its wider adoption within industry. In response to current data quality standards, such as the ISO 14000 series, various entities within the LCA community have developed different methodologies to address and communicate the data quality of Life Cycle Inventory (LCI) data. Despite advances in this field, the LCA community is still plagued by the lack of reproducible data quality results and documentation. To address these issues, US Environmental Protection Agency (EPA) has created this guidance in order to further support reproducible LCI data quality results and to inform users of the proper application of the US EPA supported data quality system (DQS). The work for this report began in December 2014 and completed May 2016.
The updated DQS includes a novel approach to the pedigree matrix by addressing data quality at the flow and the process level. Flow level indicators address source reliability, temporal, geographic, and technological correlation and data sampling methods. The process level indicators address the level of review the unit process has undergone and completeness of the unit process. This guidance is designed to be updatable as part of the LCA Research Center’s continuing commitment to data quality advancements.

Foreword The US Environmental Protection Agency (EPA) is charged by Congress with protecting the Nation's land, air, and water resources. Under a mandate of national environmental laws, the Agency strives to formulate and implement actions leading to a compatible balance between human activities and the ability of natural systems to support and nurture life. To meet this mandate, US EPA's research program is providing data and technical support for solving environmental problems today, and building a science knowledge base necessary to manage our ecological resources wisely, understand how pollutants affect our health, and prevent or reduce environmental risks in the future.
The National Risk Management Research Laboratory (NRMRL) within the Office of Research and Development (ORD) is the Agency's center for investigation of technological and management approaches for preventing and reducing risks from pollution that threaten human health and the environment. The focus of the Laboratory's research program is on methods and their cost-effectiveness for prevention and control of pollution to air, land, water, and subsurface resources; protection of water quality in public water systems; remediation of contaminated sites, sediments and ground water; prevention and control of indoor air pollution; and restoration of ecosystems. NRMRL collaborates with both public and private sector partners to foster technologies that reduce the cost of compliance and to anticipate emerging problems. NRMRL's research provides solutions to environmental problems by: developing and promoting technologies that protect and improve the environment; advancing scientific and engineering information to support regulatory and policy decisions; and providing the technical support and information transfer to ensure implementation of environmental regulations and strategies at the national, state, and community levels. Life Cycle Assessment (LCA) is increasingly being used as a tool to identify areas of potential environmental and human health impact of materials, technologies and policies. NRMRL scientists are working with others in the LCA community to improve the data, methods, and tools available to the LCA community. Understanding and communicating data quality is absolutely essential to the scientific integrity of LCA as it is to other fields. This report makes an important contribution to improving and standardizing the way in which data quality is described for life cycle inventory data. Cynthia Sonich-Mullin Director National Risk Management Research Laboratory Office of Research and Development

Table of Contents Abstract .................................................................................................................................... iv
Foreword ................................................................................................................................... v
Acronyms and Abbreviations ................................................................................................... ix
Acknowledgments ..................................................................................................................... x
1.0 Introduction ....................................................................................................................... 1
1.1 Background ................................................................................................................. 1
1.2 Purpose ....................................................................................................................... 2
1.3 Why Standardize Data Quality Assessment? .............................................................. 2
2.0 Standards .......................................................................................................................... 3
3.0 Elements of LCA Relevant to Data Quality Assessment ................................................... 4
3.1 Components of LCI Data Quality ................................................................................. 4
3.1.1 Flow ................................................................................................................ 4
3.1.2 Process ........................................................................................................... 5
3.1.3 Model .............................................................................................................. 5
3.2 Component Data Quality Indicators ............................................................................. 5
4.0 Establish Data Quality Goals............................................................................................. 5
4.1 Temporal Data Quality Goal ........................................................................................ 6
4.2 Geographical Data Quality Goal .................................................................................. 6
4.3 Technological Data Quality Goal ................................................................................. 7
4.4 Completeness Data Quality Goal ................................................................................ 7
5.0 Updated Data Quality Indicators ....................................................................................... 8
5.1 General Instructions .................................................................................................... 9
5.2 Updated Pedigree Matrix Flow Level Indicators ........................................................ 10
5.2.1 Flow Reliability .............................................................................................. 10
5.2.2 Flow Representativeness .............................................................................. 11

5.2.3 Data Collection Methods ............................................................................... 14
5.3 Updated Pedigree Matrix Unit Process Level Indicators ............................................ 15
5.3.1 Process Review ............................................................................................ 15
5.3.2 Process Completeness ................................................................................. 16
6.0 Application of the Updated Pedigree Matrix .................................................................... 20
6.1 Data Quality Goals .................................................................................................... 20
6.1.1 Temporal Data Quality Goal .......................................................................... 20
6.1.2 Geographical Data Quality Goal.................................................................... 20
6.1.3 Technological Data Quality Goal ................................................................... 20
6.1.4 Completeness Data Quality Goal .................................................................. 21
6.2 Scenario Background ................................................................................................ 21
6.3 Flow Reliability........................................................................................................... 24
6.4 Flow Temporal Representativeness .......................................................................... 24
6.5 Flow Geographical Representativeness .................................................................... 24
6.6 Flow Technological Representativeness ................................................................... 24
6.7 Flow Data Collection Methods ................................................................................... 25
6.8 Process Review ......................................................................................................... 25
6.9 Process Completeness .............................................................................................. 25
7.0 Relationship of Uncertainty and Variability to Data Quality Assessment ......................... 27
7.1 Uncertainty ................................................................................................................ 27
7.2 Variability ................................................................................................................... 27
8.0 Limitations and Future Work ........................................................................................... 28
9.0 Quality Assurance ........................................................................................................... 29
10.0 Glossary ........................................................................................................................ 30
11.0 References .................................................................................................................... 33
Appendix I. Data quality systems ........................................................................................... 35

A.1 Ecoinvent ............................................................................................................... 35
A.2 Institute for Environment and Sustainability (ILCD format)..................................... 35
A.3 National Energy Technology Laboratory (NETL) ................................................... 35
A.4 United States Department of Agriculture (USDA) .................................................. 36

Acronyms and Abbreviations Acronyms CBI Confidential Business information DQA Data Quality Assessment DQG Data Quality Goal DQI Data Quality Indicator DQS Data Quality System EOL End-of-life EPA Environmental Protection Agency GHG Greenhouse gases ILCD International Reference Life Cycle Data System ISO International Organization for Standardization JRC European Commission Joint Research Centre LCA Life Cycle Assessment LCD Land clearing debris LCI Life Cycle Inventory LCIA Life Cycle Impact Assessment SETAC Society of Environmental Toxicology and Chemistry UNEP United Nations Environmental Program USDA United Stated Department of Agriculture
Elements and Compounds CO2 Carbon dioxide CO Carbon monoxide CH4 Methane HCl Hydrogen Chloride N Nitrogen NH4 Ammonia N2O Nitrous oxide NOx Nitrogen oxides P Phosphorus PM Particulate matter PM2.5 Particulate matter < 2.5 µm PM10 Particulate matter < 10 µm TSP Total suspended particulate VOC Volatile Organic Compounds
Units bhp brake horse power ft feet hr hour lb pound kg kilogram m meter Mg megagram MT megaton yr year
Acknowledgments
This project was supported in part by an appointment of Ashley Edelen to the Research Participation Program at the National Risk Management Laboratory, U.S. Environmental Protection Agency, administered by the Oak Ridge Institute for Science and Education through an interagency agreement between the U.S. Department of Energy and EPA.
1
1.0 Introduction
1.1 Background
Describing and managing data quality is a critical aspect of any scientific endeavor. Managing data quality is an integral part of scientific protocol at the US EPA and a number of specifications are provided under the EPA Order CIO 2105.0 (US EPA, 2000). US EPA has issued guidance for data quality assessment (DQA), providing methods for establishing data quality project plans and some example methods for assessing data quality. However, due to the diversity of data, models, and studies performed across US EPA, there is no method for describing data quality that can be applied, at a high level of resolution, to all types of data being generated or used by the Agency.
At the same time, the fields of science and engineering have conventionalized and sometimes standardized practices for describing and managing data quality, within their respective fields, that are more specific to the data used in that field. Life Cycle Assessment (LCA) is a mature field with a number of international standards and other guidance documents that define practice, including assessment and management of data quality. But even these standards and guidance documents fall short of providing a detailed rubric for DQA, and as a result a number of institutions practicing or developing methods and data in the LCA field have developed their own data quality systems (DQSs) to build upon these standards and guidance documents.
LCA is a field in which data sharing and exchange are very common. LCA models are very commonly built with the aid of existing databases and datasets that provide background life cycle inventory (LCI) data that can be coupled with primary data collected by the study team. For data sharing and interoperability, significant efforts have been made to standardize both fields describing the data as well as accompanying metadata, or information that serves primarily to better describe the data itself. Data quality information is an established component of LCA metadata in some of the most widely used data exchange formats. Most commonly this is in the form of data quality indicators (DQIs). Many LCA software packages will help users to see and use data quality information associated with data. US EPA LCA activities include both the use of existing LCI data and the generation of LCI data that can be used by others, inside and outside the Agency. Therefore, the precedent for the conveyance of data quality information in metadata associated with LCI data should be continued, in order to assure data used and disseminated incorporates data quality information.
US EPA provided an earlier guidance document addressing data quality of life cycle inventory data (Bakst et al., 1995). That report provided valuable and novel guidance on assessing LCI data quality, including the establishment of data quality indicators. Since that time data quality practice has continued to developed and evolve, particularly with the use of the pedigree matrix approach that was introduced soon after by Weidema and Wesnaes (B. Weidema & Wesnaes, 1996), which is a tabular and consolidated form for application and use of data quality indicators. Furthermore, since the release of the earlier guidance document, international standards have been created and updated for LCA, a number of other guidance documents have been released, and as mentioned above, data exchange formats have been developed which embed data quality information.
Prior to this update of DQIs and the guidance given in this report, an internal experiment was conducted in which 12 US EPA LCA practitioners were asked to assess data quality of an LCI dataset using multiple existing pedigree matrix systems. The data quality scores provided by these practitioners were then evaluated for consistency in indicators scoring. Consistency was found to be very poor, even among the LCA practitioners with a similar level of experience. A multi-user test of the Weidema 1994 (B. Weidema & Wesnaes, 1996) pedigree matrix, shows that the cause for variation in pedigree matrix

2
scoring results can be categorized as simple mistakes which could be caught in completing a review (23%), mistakes due to inadequate explanation of the pedigree matrix (21%), mistakes caused by unclear information in the database (24%) and deviations due to difference in the interpretation (32%) (B. Weidema & Wesnaes, 1996). Poor training in methodology, incentives for making conclusive statements instead of presenting technical details and the lack of publications including basic elements of experimental design all contribute to lack of reproducibility (Collins & Tabak, 2014).
This report presents an updated pedigree matrix that is designed to better differentiate between data quality pedigree matrix scores and improve objectivity. Improved objectivity is accomplished through the application of a clearly defined terminology and by improving ambiguous language. The guidance is also designed to provide training to users of the LCA pedigree matrix approach through examples enhancing user background knowledge of the indicators and discussing the limitations of the indicators. This guidance assumes the user has basic knowledge of LCA and only provides training for the application of the pedigree matrix to LCI data.
1.2 Purpose
The intent of this guidance to provide collectors, practitioners and managers of LCI data with the necessary tools to accurately assess the functionality of data within the boundaries of a particular study or project goal and scope, in a qualitative manner using DQIs. DQAs in the LCA field have traditionally been viewed as subjective and heavily dependent on the practitioner’s personal knowledge. It is the purpose of the guidance to provide experienced and novice individuals a shared knowledge base for completing a pedigree matrix DQS in order to minimize confusion and increase reproducibility of data quality scores. Thus, included in this document is a brief history of the development of data quality tools within life cycle assessment LCA, the purpose and limitations of DQSs, the scope of individual data quality indicator categories and suggested best practice methods for applying DQIs. It is not within the scope of this guidance to address the many different DQSs available, however the guidance will reference the DQSs developed as part of the International Reference Life Cycle Data System (ILCD) developed by the European Commission Joint Research Centre (JRC), the system used by the Ecoinvent database developed by the Swiss Centre for Life Cycle Inventories, as well as the United States Department of Agriculture (USDA) DQS. If readers are unfamiliar with these systems, or are interested in learning more about these systems supplementary information and references are provided in Appendix I: Data Quality Systems.
1.3 Why Standardize Data Quality Assessment?
In the last decade, as the number of organizations using LCA studies has increased, it has become imperative that guidelines be developed to ensure consistency within the documentation and assessment of LCI data quality. But what is data quality? The International Organization for Standardization (ISO) 14040 document defines data quality as: characteristics of data that relate to their ability to satisfy stated requirements” (ISO, 2006a). Rarely, if ever is collected data a “perfect” match for representing the system being modeled. DQIs are structured to provide a qualitative analysis of data (using a semi-quantitative system) to compare data collected against the intended goal and scope of the project. Therefore, during completion of any data quality metrics, practitioners should ALWAYS keep in mind the goal and scope as a reference point for comparability.
When completing a DQA, the idea that data is either “good” or “bad” should be avoided. DQA using a quantitative system allows for scoring of data, based on fixed data quality properties which are recorded in the metadata, but only within the context of the goal and scope. Low ranking values (scores of “4” or “5”) do not necessarily indicate “bad” data, nor do high ranking values (scores of “1” or “2”) indicate

3
“good” data. Rather they qualitatively describe how the data relate to the goal and scope, and highlight potential areas of improvement in the data quality. Data quality goals (DQGs) are defined by the data developers during the goal and scope phase of the LCA. DQGs are used to describe the ideal representativeness and process completeness for the project and should describe date, location, and technology being modeled, system boundaries and depending on the technology sector what is considered an adequate time period for data collection to avoid normal fluctuations. DQA is the comparison of the data collected against the DQGs.
The use of a pedigree matrix is NEVER a substitute for practitioner logic and expertise when determining the proper use of data. Rather the goal of a pedigree matrix is to simplify the iterative review process associated with LCA, so that practitioners can see where potential data quality issues might exist within large datasets and/or models with multiple processes. Data quality scores from the pedigree matrix can also be used as criteria during the selection of data from a database.
2.0 Standards
ISO has been key in developing internationally recognized standards for LCA. ISO 14040 and 14044 documents are the international standards that define the practice of LCA. The LCA Code of Practice, published in 1993 by the Society of Environmental Toxicology and Chemistry (SETAC) was the first attempt at harmonizing LCA methods (de Beaufort-Langeveld et al., 2003).
The ISO 14044 series defines in section 4.2.3.6 Data Quality the ten key categories required for addressing data quality (ISO, 2006b). The definitions of the different categories can be found in Section 10. Glossary of this guidance. ISO requires LCA practitioners to address the following data quality areas if the “study is intended to be used in comparative assertions that are intended to be released to the public” (ISO, 2006b).
1) Time related coverage 2) Geographical coverage 3) Technology coverage 4) Precision 5) Completeness 6) Representativeness 7) Consistency 8) Reproducibility 9) Sources of the data 10) Uncertainty of the information
The ISO 14040 and 14044 documents do not further define how these areas are to be addressed, but rather leaves this task to the discretion of the individual. The ISO 14044 series does define the treatment of data gaps as resulting in either a “zero” or “non-zero” data value that is explained or a calculated value that is based on values from a unit process employing similar technology (ISO, 2006b).
The lack of a single DQS requirement from ISO has spawned a wide range of quantitative and/or qualitative approaches for capturing data quality. However, it is not the purpose of this guidance to provide an overview of the different DQSs, this is done briefly in Appendix 1. Rather this guidance addresses data quality with the use of a pedigree matrix approach. Not all data quality areas are addressed using a pedigree matrix.
4
Some areas can only be addressed qualitatively through a methodology description of the LCA study (e.g. consistency and reproducibility). The pedigree matrix is not designed to capture all areas of data quality, but to semi-quantitatively address certain key area to improve communication of data quality results. The updated pedigree matrix is the first time multi-level assessment has been attempted within a single pedigree matrix. The updated pedigree matrix captures representativeness at the flow level through the temporal, geographical, technological and data collection method indicators. Source of the data is assessed at the flow level with the reliability indicator, while completeness is addressed at the process level. Uncertainty is addressed through quantitative metadata and is not part of the pedigree matrix as an indicator. Uncertainty and its exclusion from the pedigree matrix are further discussed in Section 7. Consistency and reproducibility are data quality metrics which are currently not being captured in the updated pedigree matrix and are considered to be qualitative metrics that should be captured in the metadata.
3.0 Elements of LCA Relevant to Data Quality Assessment This document is not intended to provide background information on an LCA, but rather discuss components of LCA as they pertain to DQSs. Please refer to Table 1 for a list of documents and readings on the basic methods for creating an LCA.
Table 1. Resources for Background Information on LCA
Title Source Format Citation Year
Environmental Life Cycle Assessment: Measuring the Environmental Performance of Products
ACLCA Book (Schenck & White, 2014)
2015
Global Guidance Principles for Life Cycle Assessment Databases: A Basis for Greener Processes and Products
UNEP/SETAC
Book (UNEP & SETAC, 2011)
2011
Environmental Management-LCA – Principles and Framework (14040) & Requirements and Guidelines (14044)
ISO Standards (ISO, 2006a) & (ISO, 2006b)
2006
Life Cycle Assessment: Principles and Practice US EPA Book (Curran, 2006) 2006 Code of Life-Cycle Inventory Practice SETAC Book (de Beaufort-
Langeveld et al., 2003) 2003
3.1 Components of LCI Data Quality
Data quality should be addressed throughout the LCA modeling process. The first step in completing an LCA model is the goal and scope definition. All DQGs should be determined during the goal and scope phase of the project and should guide the data collection process. During the inventory analysis, data quality should be assessed based on how well the data collected compares with the established DQGs. Interpretation of LCA results should include the interpretation of the DQA.
3.1.1 Flow
Flows are the individual values associated with materials. There are several pieces of metadata associated with flows, which can include, but are not limited to the name of the material, the unit of measure, and the CAS number or molecular formula. Within LCA there are two different types of flows: elementary flows and technosphere flows. Elementary flows are exchanges with the environment,
5
whereas technosphere flows are exchanges within a system or exchanges between systems.
3.1.2 Process
Processes in life cycle inventory can describe one specific activity (a unit process) or aggregate multiple activities (an aggregate process). Per ISO standards, a unit process is the “smallest element considered in the life cycle inventory analysis for which input and output data are quantified” (ISO, 2006b). The level of a unit process varies according to the level of detail at which data can be collected. A process can be a single operation within a facility (e.g. generating steam from a boiler or stamping aluminum), an aggregation of processes located at one facility or an aggregation of processes and facilities. Decisions on the level of detail present in a process are related to the scope of the study and are at the discretion of the data collector. Transparency of data can heavily depend on the level of aggregation present within a process.
Aggregation is the action of combining together information from smaller units into a larger unit (e.g. from inventory indicator to subcategory) (UNEP, 2009). Aggregation can apply to the combining of data (e.g. summing individual emissions into an emissions category or combining processes into a black box unit process where only input and output flows are divulged). It is acceptable to use aggregation as a method when using confidential business (CBI) data without violating confidentiality. When using aggregated data or data from computational models, the user should not attempt to apply DQI scores to the data, unless supplementary documentation detailing the needed information about the data generation is included. If sufficient supplementary documentation is not present, the DQI should only be completed by the originator/aggregator of the data or the user must score the data as a default 5 (low) for all unknown categories.
3.1.3 Model
A life cycle inventory model is a group of linked processes. Model level data quality is not within the scope of this version of the data quality guidance. Future developments will focus on addressing data quality at the model level.
3.2 Component Data Quality Indicators
The ISO 14044 standard does not specify to which component, or level, data quality analysis should be applied. Flow level analysis permits a more detailed understanding of the data quality than can be provided at the process level, since the process level can be a combination of many different flows from many different sources. However, some data quality properties such as completeness and level of review can only be assessed at the process or model level. The updated pedigree matrix defines DQIs for application at the flow and the process level. The multi-level pedigree matrix is designed to capture detailed flow level information, while still addressing broader process level data quality information.
4.0 Establish Data Quality Goals
Before a data quality score can be applied, specific DQG should be clearly established. This process should take place during the goal and scope phase of any LCA project. The data quality goals should explicitly define needs for representativeness, including temporal, geographic, and technological aspects, and completeness. It is important to note that representativeness (temporal, geographic and technological) and completeness are dynamic indicators. Dynamic indicators are measuring properties of the data that change based on the DQGs of the project. Static indicators (e.g. reliability) are based on unchanging properties of the data, such as the data generation method. These indicators change only
6
with new data and are not situationally dependent.
4.1 Temporal Data Quality Goal
ISO 14044 standards define time-related coverage as the age of the data and the minimum length of time over which data should be collected. In order to establish a temporal correlation, a temporal DQG should be established (ISO, 2006b). This allows for a correlation to be established between the age of the data generation and the time period of interest in a study. The temporal DQG should reflect the time frame the data is intended to represent. Often this is for the current year. For example, the data collected for the LCD project was compiled to represent data for the year 2015. The temporal DQG should specify both a start date and an end date for all data collected. For projects that do primary data collection through measurements, the start and end date should reflect the period of data collection. For data collection using secondary data collection, (e.g. a literature review) the dates should reflect the dates the data is intended to represent.
It is recommended the default setting of the start and end date for a unit process generated from a literature review be at least one full year. Historically, within the LCA community, no standard recommendations for minimum length of time over which data should be collected have been established. This guidance recommends a default standard of 1 year of data collection. If the LCA is intended to evaluate seasonal or short-term effects, a shorter period would be acceptable. For agricultural processes, which have greater inter annual variation due to changes in weather and other natural factors, it is recommended to extend the minimum time period to three years. Further developments in recommendations are addressed in Section 8.
4.2 Geographical Data Quality Goal
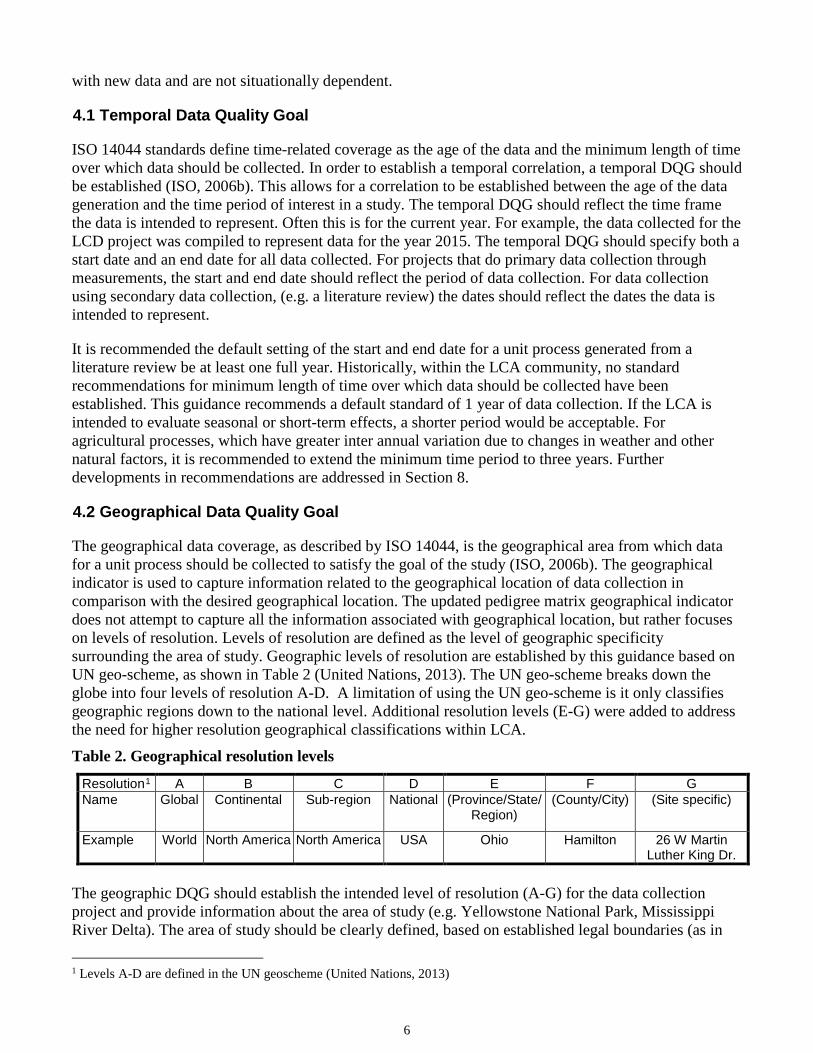
The geographical data coverage, as described by ISO 14044, is the geographical area from which data for a unit process should be collected to satisfy the goal of the study (ISO, 2006b). The geographical indicator is used to capture information related to the geographical location of data collection in comparison with the desired geographical location. The updated pedigree matrix geographical indicator does not attempt to capture all the information associated with geographical location, but rather focuses on levels of resolution. Levels of resolution are defined as the level of geographic specificity surrounding the area of study. Geographic levels of resolution are established by this guidance based on UN geo-scheme, as shown in Table 2 (United Nations, 2013). The UN geo-scheme breaks down the globe into four levels of resolution A-D. A limitation of using the UN geo-scheme is it only classifies geographic regions down to the national level. Additional resolution levels (E-G) were added to address the need for higher resolution geographical classifications within LCA.
Table 2. Geographical resolution levels
Resolution1 A B C D E F G Name Global Continental Sub-region National (Province/State/
Region) (County/City) (Site specific)
Example World North America North America USA Ohio Hamilton 26 W Martin Luther King Dr.
The geographic DQG should establish the intended level of resolution (A-G) for the data collection project and provide information about the area of study (e.g. Yellowstone National Park, Mississippi River Delta). The area of study should be clearly defined, based on established legal boundaries (as in
1 Levels A-D are defined in the UN geoscheme (United Nations, 2013)

7
the case of national borders) and concisely documented when deviating from clearly established boundaries. In the instance where a general area that fits no legal boundaries is desired, a precise definition of the area should be provided, such as latitude and longitude coordinates or linking of the area to an external definition of the area of study.
4.3 Technological Data Quality Goal
ISO standards define technology coverage as a specific technology or technology mix (ISO, 2006b). This guidance recommends a novel approach to technological representativeness by sub-dividing it into four categories: process design, operating conditions, material quality and process scale. The DQG for technological correlation is for the data to originate from a system where these four technological characteristics match the target system. This proposed criteria are an attempt to improve standardization for how technologies are compared. Further developments are planned for the technology representativeness and are discussed in Section 6.
The technology process design refers to set conditions of a process that have an effect on the final product. An example, would be the horsepower of an engine, or a screen diameter and mash on a separation process. These are fixed aspects of the process that influence the material pathway and/or product quality. Operational conditions are any varying parameters of a process (e.g. temperature and pressure). These are parameters which are varied based on quality output. The third category of technology representativeness is material quality. Material quality refers to the type and quality of the feedstock material (e.g. pulp for paper; crude oil for gasoline). The input and output materials should be clearly defined in terms of type and quality. Finally, the scale of the process, in terms of output per time, number of lines, and other such aspects should be described. Data collectors should try to capture as much information as possible about the technology process design, operational conditions and material quality so that future users of the data can understand should be mentioned in as much detail as possible.
4.4 Completeness Data Quality Goal
As part of the goal and scope definition phase of LCA, it is important to clearly define the system boundaries and all input and output flows across the system boundary. The process completeness data quality goal details the system boundary and all flows entering, exiting and within the system boundary. Data collection should only be started after all expected flows have been defined as this will inform the data collection process. Input flows to be considered include various resource inputs, such as water, land, raw fuels and minerals, product inputs including purchased material and energy, service inputs including transportation and waste management services, and capital inputs such as machinery and infrastructure. Output flows might include all products and wastes including direct emissions to air, water and soil/subsoil.

8
5.0 Updated Data Quality Indicators
This guidance will detail how to apply DQI indicators using the updated pedigree matrix, as shown in Tables 3 and 4. Application of this pedigree matrix is only discussed for unit processes, not aggregated or system processes as defined by UNEP (UNEP & SETAC, 2011).
Table 3. Updated Data Quality Pedigree Matrix – Flow Indicators
U
Indicator 1 2 3 4 5 (default)
Flow reliability
Verified1 data based on
measurements
Verified data based on a calculation Non-verified data
based on a calculation
Documented estimate
Undocumented estimate or non-verified data
based on measurements
Flow
Rep
rese
ntat
iven
ess
Temporal correlation
Less than 3 years of
difference2
Less than 6 years of difference
Less than 10 years of
difference
Less than 15 years of
difference
Age of data unknown or
more than 15 years
Geographical correlation
Data from same resolution
Within one level of resolution
Within two levels of resolution
Outside of two levels of resolution From a different
or unknown area of study and same area
of study and a related area of
study3 and a related area
of study but a related
area of study
Technological correlation
All technology categories4 are
equivalent
Three of the technology
categories are equivalent
Two of the technology
categories are equivalent
One of the technology
categories is equivalent
None of the technology
categories are equivalent
Data collection methods
Representative data from
>80% of the relevant
market5, over an adequate
period6
Representative data from 60-79% of the
relevant market , over an adequate
period
Representative data from 40-59% of the
relevant market, over an
adequate period
Representative data from <40% of the relevant
market, over an adequate period
of time
Unknown
or representative data from >80% of
the relevant market, over a shorter period of time
or representative data from 60-79%
of the relevant market, over a
shorter period of time
or representative data from 40-59%
of the relevant market, over a
shorter period of time
or data from a small number of sites and from shorter
periods
1 Verification may take place in several ways, e.g. by on-site checking, by recalculation, through mass balances or cross-checks with other sources. For values calculated from a mass-balance or another verification method, an independent verification method must be used in order to qualify the value as verified. 2 Temporal difference refers to the difference between date of data generation and the date of representativeness as defined by the scope of the project 3 A related area of study is defined by the user and should be documented in the geographical metadata. The relationship established in the metadata of the unit process should be consistently applied to all flows within the unit process. Default relationship is established as within the same hierarchy of political boundaries (e.g. Denver is within Colorado, is within the USA, is within North America) 4 Technology categories are process design, operating conditions, material quality, and process scale. 5 The relevant market should be documented in the DQG. The default relevant market is measured in production units. If the relevant market is determined using other units, this should be documented in the DQG. The relevant market established in the metadata should be consistently applied to all flows within the unit process. 6 Adequate time period can be evaluated as a time period long enough to even out normal fluctuations. The default time period is 1 year, except for emerging technologies (2-6 months) or agricultural projects >3 years.
Highest score Lowest score
9
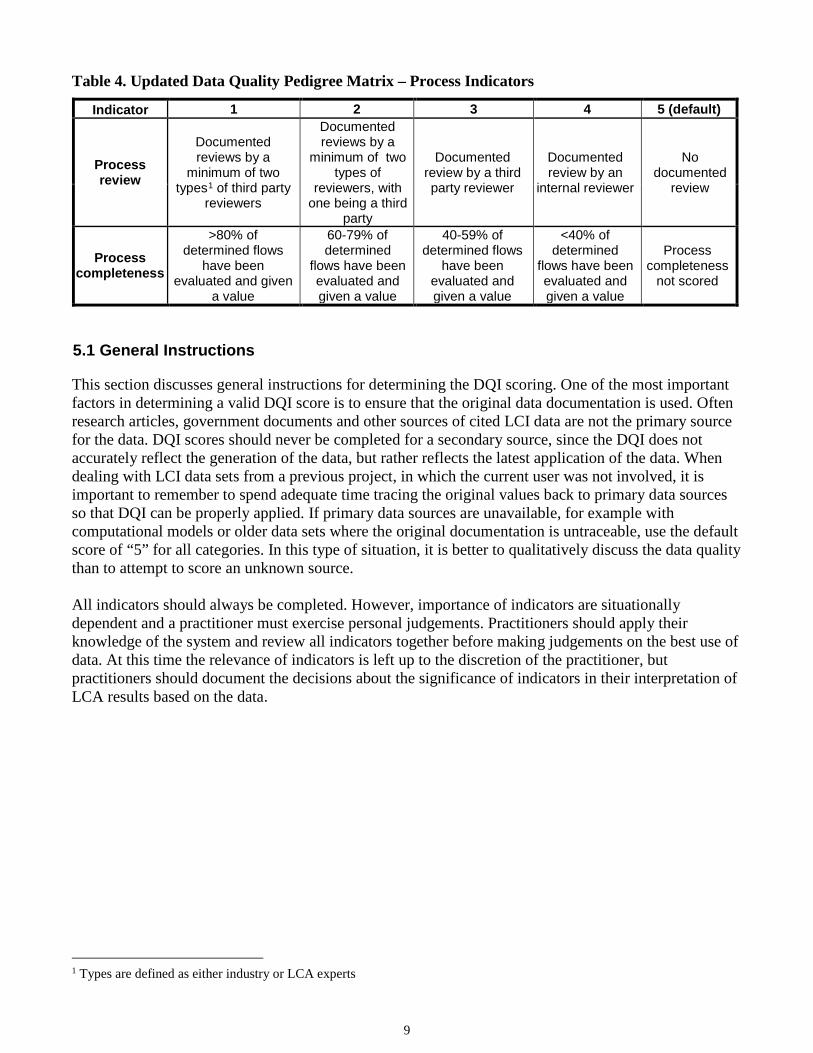
Table 4. Updated Data Quality Pedigree Matrix – Process Indicators
Indicator 1 2 3 4 5 (default)
Process review
Documented reviews by a
minimum of two types1 of third party
reviewers
Documented reviews by a
minimum of two types of
reviewers, with one being a third
party
Documented review by a third party reviewer
Documented review by an
internal reviewer
No documented
review
Process completeness
>80% of determined flows
have been evaluated and given
a value
60-79% of determined
flows have been evaluated and given a value
40-59% of determined flows
have been evaluated and given a value
<40% of determined
flows have been evaluated and given a value
Process completeness
not scored
5.1 General Instructions
This section discusses general instructions for determining the DQI scoring. One of the most important factors in determining a valid DQI score is to ensure that the original data documentation is used. Often research articles, government documents and other sources of cited LCI data are not the primary source for the data. DQI scores should never be completed for a secondary source, since the DQI does not accurately reflect the generation of the data, but rather reflects the latest application of the data. When dealing with LCI data sets from a previous project, in which the current user was not involved, it is important to remember to spend adequate time tracing the original values back to primary data sources so that DQI can be properly applied. If primary data sources are unavailable, for example with computational models or older data sets where the original documentation is untraceable, use the default score of “5” for all categories. In this type of situation, it is better to qualitatively discuss the data quality than to attempt to score an unknown source. All indicators should always be completed. However, importance of indicators are situationally dependent and a practitioner must exercise personal judgements. Practitioners should apply their knowledge of the system and review all indicators together before making judgements on the best use of data. At this time the relevance of indicators is left up to the discretion of the practitioner, but practitioners should document the decisions about the significance of indicators in their interpretation of LCA results based on the data.
1 Types are defined as either industry or LCA experts

10
5.2 Updated Pedigree Matrix Flow Level Indicators
5.2.1 Flow Reliability
Definition: the assessment of the data generation method and verification/validation of the data.
Table 5. DQI Pedigree Matrix - Flow Reliability
Indicator 1 2 3 4 5 (default)
Flow Reliability
Verified1 data based on
measurements
Verified data based on a calculation
Non-verified data based
on a calculation
Documented estimate
Undocumented estimate or non-verified data based
on measurements
At the flow level reliability indicates the quality of the data generation method and the verification/validation of the data collection methods used. This is done by assigning a quantitative value based on the method used (e.g. measurement, estimate or calculation) to determine the data value and the level of verification/validation the data has undergone. For definitions on the three data collection methodologies and verification and validation, please refer to Section 10. Glossary of this guidance. The Co-operation and Standards for Life Cycle Assessment Data in Europe (CASCADE) project, sponsored by the European Union, was conducted from 2001-2004 by LCA practitioners and experts with the objective of introducing environmental data in the design process and facilitating data exchange and independence from any computer systems. The CASCADE project identified three main methods of data generation: Estimation, Calculation, and Measurement (B. P. Weidema et al., 2001). For this guidance, computational modeling is considered a sub-category of calculation. Measurements are considered a more reliable source of data generation than calculations or estimations. Measurements that are derived from data collection projects for use in LCA are considered highly reliable data because the data user has input into the collection methods and scope. The most reliable measurements are data that have undergone a verification or validation process. Verification/validation methods can include, but are not limited to, cross-checks with other sources, mass/energy balances, on-site checking and/or recalculation. Further clarification on verification and validation as defined by the US EPA can be found in EPA QA/G-8 (US EPA, 2002).
When reviewing a measurement for reliability, a DQI score of “1” (highest score) should only be used if the verification/validation process is described (at minimum a brief overview of method used) in publically available supporting documentation. Otherwise, a DQI value no greater than “2” should be used. If any assumptions were involved in developing the value, a DQI value of “1” may NOT be used. Calculations, computational models and estimations may NOT be assigned a value of “1” under any circumstances.
Calculations and computational models present unique challenges in assigning DQI. Since calculations and computational models can be used as verification or validation methods it might seem that all calculations or models have been verified. This is not the case. Only calculations and computational models who have undergone a separate, documented verification and/or validation process may be assigned a DQI value of “2”. It is important to note that for all methods, proper documentation is required. Lack of background information being documented by the data collectors requires that all measurements or computational models without detailed documentation on validation procedures be
1 Verification may take place in several ways, e.g. by on-site checking, by recalculation, through mass balances or cross-checks with other sources. For values calculated from a mass-balance or another verification method, an independent verification method must be used in order to qualify the value as verified.

11
assigned a DQI value no higher than “3”. In an ideal situation the data collectors/computational model creator would assess the DQI of the data or provide all necessary documentation on the generation and validation of model results.
Estimations cannot be verified or validated, they can only be documented. Estimations are considered to have lower reliability than either a calculation or measurement. Estimations are defined as any generation method that includes assumptions. When quantifying the reliability of an estimation only DQI values between “4” and “5” should be used. To minimize user bias, this guide recommends that documented estimates be defined as estimates with supporting documentation that any third party can use to determine how the estimation was computed; this includes clear documentation of all related assumptions.
5.2.2 Flow Representativeness
Definition: A qualitative assessment of the degree to which the data set reflect the true population of interest.
As mentioned in Section 4, flow representativeness can be addressed by looking at three indicators, temporal, geographical, and technological correlation. These three indicators meet the ISO 14044 standards and are discussed separately in the following section.
5.2.2.1 Temporal Correlation
Definition: Indicates the correlation between the time period the data was collected and the year the model represents.
Table 6. DQI-Temporal Correlation Flow Representativeness
Indicator 1 2 3 4 5 (default)
Flow
Rep
rese
ntat
iven
ess
Temporal correlation
Less than 3 years of
difference1
Less than 6 years of
difference
Less than 10 years of
difference
Less than 15 years of
difference
Age of data unknown or
more than 15 years
At the flow level temporal correlation is used for assessing the age difference between the temporal DQG and the age of the data. Therefore, to properly assess the temporal correlation the date of data generation and the date of data representation need to be compared. The temporal indicator measures the difference between the temporal DQG and the data generation date.
In an optimum situation, the data will have a clearly defined start and end collection/generation date. The end date should be used when determining the temporal representativeness. When the date of generation is not available, a DQI value of “5” must be used since the date of generation is unknown, even if the date of publication is known. Journal or data publication dates are not acceptable substitutes
1 Difference refers to the difference between date of data generation and the temporal DQG of the project

12
for data generation dates.
For measurements, the data generation date is the end date for the time period over which the data was collected. For estimations and calculations, the generation date is the date the estimation or calculation was completed. An exemption from this rule is an estimation based on a measurement in which case the data generation date of the measurement is used. An example of an estimation based on a measurement is when additional assumptions are made about a measurement in order to achieve a final data value. Computational modeling presents a more difficult scenario, since it is difficult or impossible to find all necessary metadata in order to determine the original data generation date. Unless the original developer of the model completes the data quality and/or includes the original data generation date in supporting documentation, a DQI rating of “5” should be used.
The temporal DQG should have been determined during the goal and scope development phase of the LCA. If this was not done, stakeholders should be consulted and this information should be added into the metadata of the LCI. If this range covers multiple years, the most recent data should be used when calculating the difference.
5.2.2.2 Geographical Correlation
Definition: Indicates the appropriateness of the sample region in representing the model region.
Table 7. DQI Pedigree Matrix - Geographical Correlation Flow Representativeness
The flow geographical information is designed to capture differences in data quality related to differences in are of study and resolution between the geography DQGs and the data used for modeling. The geographic DQG should be documented during the goal and scope phase of the LCA project. The geographic DQG should include a geographic level of resolution and a description of the area of study.
If the DQG and the data level of resolution match and the exact same area of study is being analyzed a data quality score of “1” should be used. A step within the level of resolution refers to the level of resolution being either one level larger or smaller than the DQG. For example if the DQG is national data, one step of resolution would be either sub-region or province/state/region. The relationship between the area of study and the data collected should be documented (e.g. the data collected is from a state within the national area as defined by the geographic DQG). Data from a different or unknown area
1 A related area of study is defined by the user and should be documented in the geographical metadata. The relationship established in the metadata of the unit process should be consistently applied to all flows within the unit process. Default relationship is established as within the same hierarchy of political boundaries (e.g. Denver is within Colorado, is within the USA, is within North America).
Indicator 1 2 3 4 5 (default)
Flow
Rep
rese
ntat
iven
ess
Geographical correlation
Data from same resolution
Within one level of resolution
Within two levels of resolution
Outside of two levels of
resolution
From a different area of
study and same area of study
and a related area of study1
and a related area of study
and a related area of study
13
of study should always receive a data quality score of “5”.
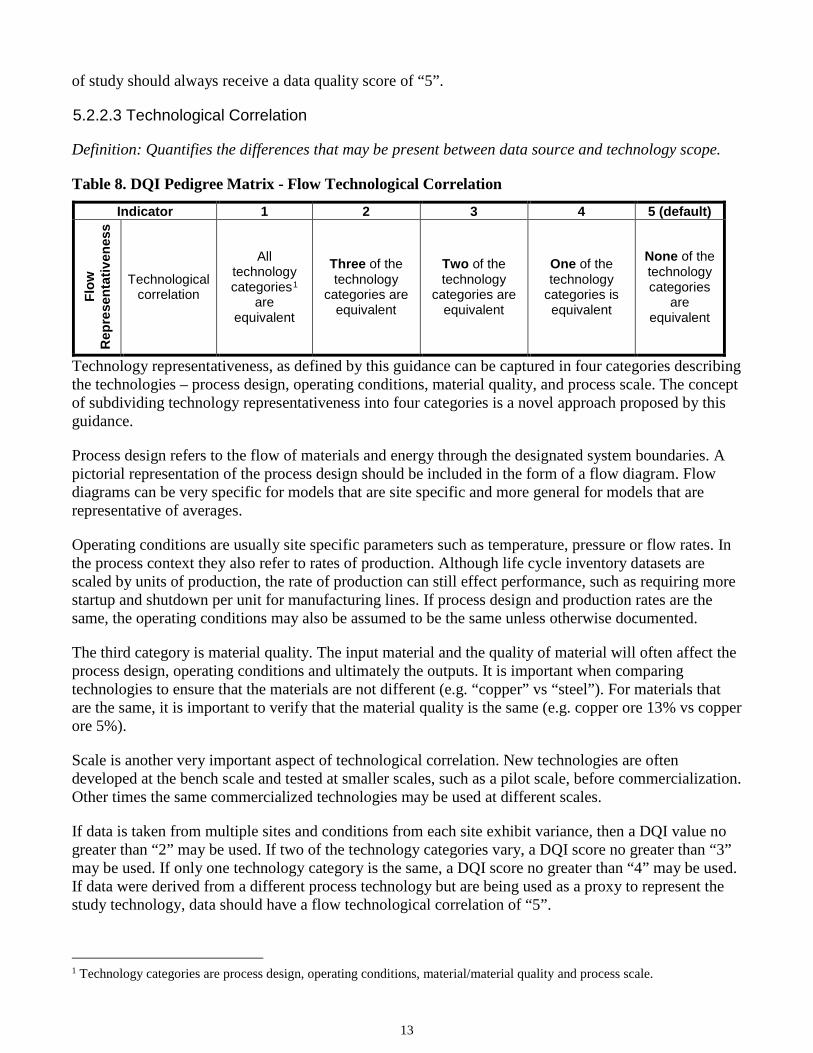
5.2.2.3 Technological Correlation
Definition: Quantifies the differences that may be present between data source and technology scope.
Table 8. DQI Pedigree Matrix - Flow Technological Correlation
Indicator 1 2 3 4 5 (default)
Flow
R
epre
sent
ativ
enes
s
Technological correlation
All technology categories1
are equivalent
Three of the technology
categories are equivalent
Two of the technology
categories are equivalent
One of the technology
categories is equivalent
None of the technology categories
are equivalent
Technology representativeness, as defined by this guidance can be captured in four categories describing the technologies – process design, operating conditions, material quality, and process scale. The concept of subdividing technology representativeness into four categories is a novel approach proposed by this guidance.
Process design refers to the flow of materials and energy through the designated system boundaries. A pictorial representation of the process design should be included in the form of a flow diagram. Flow diagrams can be very specific for models that are site specific and more general for models that are representative of averages.
Operating conditions are usually site specific parameters such as temperature, pressure or flow rates. In the process context they also refer to rates of production. Although life cycle inventory datasets are scaled by units of production, the rate of production can still effect performance, such as requiring more startup and shutdown per unit for manufacturing lines. If process design and production rates are the same, the operating conditions may also be assumed to be the same unless otherwise documented.
The third category is material quality. The input material and the quality of material will often affect the process design, operating conditions and ultimately the outputs. It is important when comparing technologies to ensure that the materials are not different (e.g. “copper” vs “steel”). For materials that are the same, it is important to verify that the material quality is the same (e.g. copper ore 13% vs copper ore 5%).
Scale is another very important aspect of technological correlation. New technologies are often developed at the bench scale and tested at smaller scales, such as a pilot scale, before commercialization. Other times the same commercialized technologies may be used at different scales.
If data is taken from multiple sites and conditions from each site exhibit variance, then a DQI value no greater than “2” may be used. If two of the technology categories vary, a DQI score no greater than “3” may be used. If only one technology category is the same, a DQI score no greater than “4” may be used. If data were derived from a different process technology but are being used as a proxy to represent the study technology, data should have a flow technological correlation of “5”.
1 Technology categories are process design, operating conditions, material/material quality and process scale.
14
5.2.2.4 Interpretation of Flow Representativeness DQI Scores
Interpretation of flow representativeness is dependent on the situation for which the data are intended. A score of “4” or “5” for a DQI does not mean unacceptable quality in all cases. An example would be modelling a process with data that is 15 years old in which the technology has not changed in 15 years. The temporal correlation score would be “5”. This score, in this case, does not mean the data is not representative. A more important reflection of correlation would be the technological correlation.
Instead practitioners should review all representative indicators together in order to make a judgement on the overall representativeness instead of attempting to understand representativeness based only on one or two DQIs.
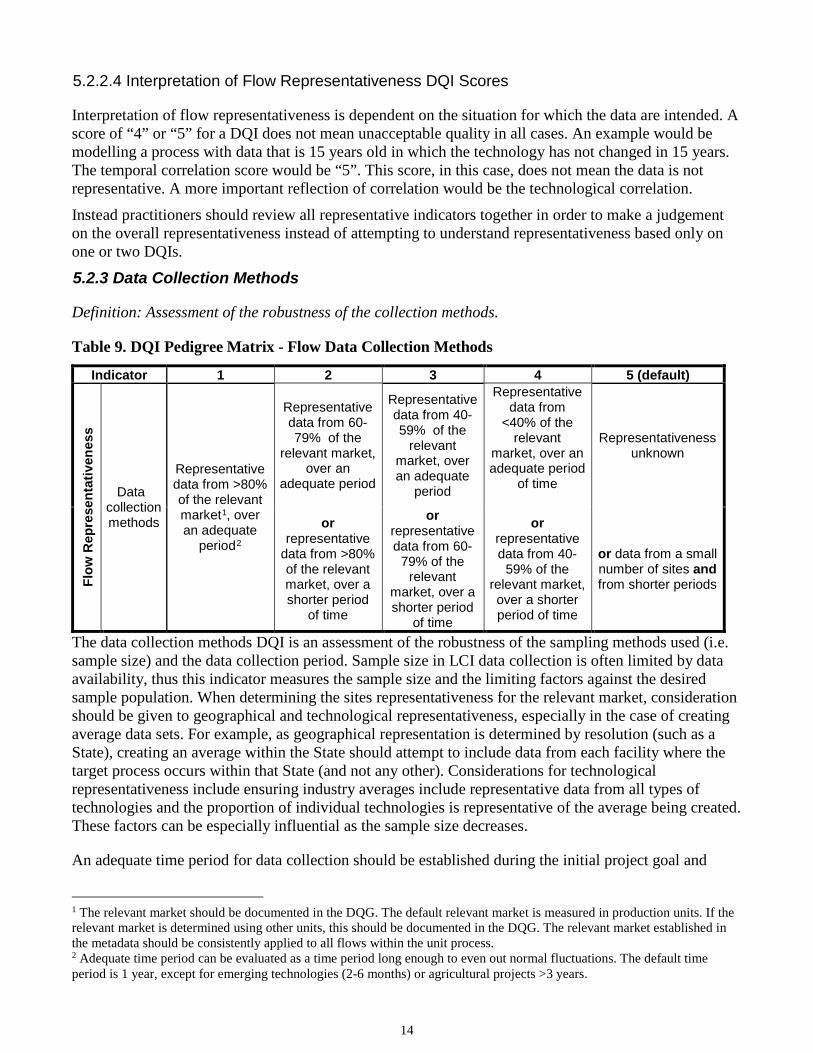
5.2.3 Data Collection Methods
Definition: Assessment of the robustness of the collection methods.
Table 9. DQI Pedigree Matrix - Flow Data Collection Methods
The data collection methods DQI is an assessment of the robustness of the sampling methods used (i.e. sample size) and the data collection period. Sample size in LCI data collection is often limited by data availability, thus this indicator measures the sample size and the limiting factors against the desired sample population. When determining the sites representativeness for the relevant market, consideration should be given to geographical and technological representativeness, especially in the case of creating average data sets. For example, as geographical representation is determined by resolution (such as a State), creating an average within the State should attempt to include data from each facility where the target process occurs within that State (and not any other). Considerations for technological representativeness include ensuring industry averages include representative data from all types of technologies and the proportion of individual technologies is representative of the average being created. These factors can be especially influential as the sample size decreases.
An adequate time period for data collection should be established during the initial project goal and
1 The relevant market should be documented in the DQG. The default relevant market is measured in production units. If the relevant market is determined using other units, this should be documented in the DQG. The relevant market established in the metadata should be consistently applied to all flows within the unit process. 2 Adequate time period can be evaluated as a time period long enough to even out normal fluctuations. The default time period is 1 year, except for emerging technologies (2-6 months) or agricultural projects >3 years.
Indicator 1 2 3 4 5 (default)
Flow
Rep
rese
ntat
iven
ess
Data collection methods
Representative data from >80% of the relevant market1, over an adequate
period2
Representative data from 60-79% of the
relevant market, over an
adequate period
Representative data from 40-59% of the
relevant market, over an adequate
period
Representative data from
<40% of the relevant
market, over an adequate period
of time
Representativeness unknown
or representative
data from >80% of the relevant market, over a shorter period
of time
or representative data from 60-
79% of the relevant
market, over a shorter period
of time
or representative data from 40-
59% of the relevant market, over a shorter period of time
or data from a small number of sites and from shorter periods

15
scope phase and should be justified and documented before beginning the data quality analysis. An adequate time period is defined as a time period which is long enough to account for normal variations in data values. This time period over which data are collected should match the temporal correlation DQG. In the initial stages of data collection, the time period over which data would be collected should have been determined and reasoning for this decision should be documented in the metadata.
5.3 Updated Pedigree Matrix Unit Process Level Indicators
The following indicators are to be applied at the process level, therefore the indicators are only filled out once for each unit process.
5.3.1 Process Review
Definition: Indicates the level of review the unit process has undergone.
Table 10. DQI Pedigree Matrix- Process Review
Indicator 1 2 3 4 5 (default)
Proc
ess
Rev
iew
Documented reviews by a minimum of two types1 of third party
reviewers
Documented reviews by a minimum of two types of reviewers, with one
being a third party
Documented review by a third party reviewer
Documented review by an
internal reviewer
No documented review
Process review is a new DQI proposed by the updated pedigree matrix. The process review indicator is designed to evaluate the level of review a dataset has undergone at the unit process level. Section 4.3 of the Guidance Principles for Life Cycle Assessment Databases (Shonan Guidance Principles) outlines the standards used for developing the process review indicator (UNEP & SETAC, 2011). The following section provides details on the review process and proper review documentation that aligns with the Shonan Guidance Principles recommendations (UNEP & SETAC, 2011). Reviewer’s qualifications are dependent on independence, expertise and experience. Level of experience in determining what establishes an expert is a subjective qualification, therefore this is not addressed in the process review indicator. However, independence and expertise of the reviewer are differentiated by the process review indicator scoring. Any publically available dataset should undergo at least one independent review (UNEP & SETAC, 2011). Therefore, to achieve a process review score of “2” or “3” at least one third party reviewer must be used and to achieve a score of “1”, a minimum of two third party experts, one an LCA expert and one an industry expert for the technology of study must review the dataset.
It is important to note the completion of a review without proper documentation lacks transparency and reliability. All reviews should be documented and documentation should be integrated into the permanent metadata associated with the dataset. In order to achieve a process review DQI score other than a “5”, proper documentation of the review must accompany the dataset. Proper documentation is defined as containing the following components: identity of the reviewer, type and scope of the review and review results (UNEP & SETAC, 2011).
The identity of the reviewer includes: name, affiliation and qualifications and role within the review process. The type of review is defined as internal or external (UNEP & SETAC, 2011). External reviewers should be external to the organization conducting the data collection and unit process dataset development. Individuals that are external to the project, but still internal to the organization developing the dataset are considered internal reviewers and do not meet the standards for an external or third party
1 Types are defined as either industry or LCA experts
16
reviewer.
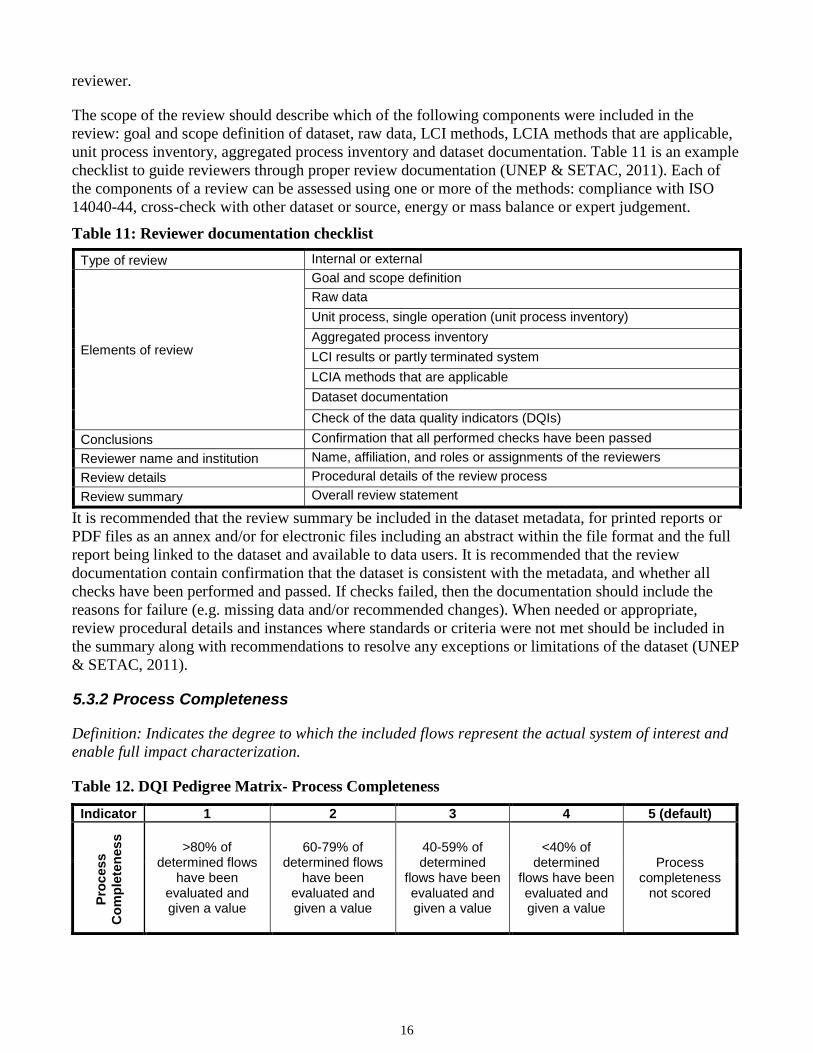
The scope of the review should describe which of the following components were included in the review: goal and scope definition of dataset, raw data, LCI methods, LCIA methods that are applicable, unit process inventory, aggregated process inventory and dataset documentation. Table 11 is an example checklist to guide reviewers through proper review documentation (UNEP & SETAC, 2011). Each of the components of a review can be assessed using one or more of the methods: compliance with ISO 14040-44, cross-check with other dataset or source, energy or mass balance or expert judgement.
Table 11: Reviewer documentation checklist
It is recommended that the review summary be included in the dataset metadata, for printed reports or PDF files as an annex and/or for electronic files including an abstract within the file format and the full report being linked to the dataset and available to data users. It is recommended that the review documentation contain confirmation that the dataset is consistent with the metadata, and whether all checks have been performed and passed. If checks failed, then the documentation should include the reasons for failure (e.g. missing data and/or recommended changes). When needed or appropriate, review procedural details and instances where standards or criteria were not met should be included in the summary along with recommendations to resolve any exceptions or limitations of the dataset (UNEP & SETAC, 2011).
5.3.2 Process Completeness
Definition: Indicates the degree to which the included flows represent the actual system of interest and enable full impact characterization.
Table 12. DQI Pedigree Matrix- Process Completeness
Indicator 1 2 3 4 5 (default)
Proc
ess
Com
plet
enes
s
>80% of determined flows
have been evaluated and given a value
60-79% of determined flows
have been evaluated and given a value
40-59% of determined
flows have been evaluated and given a value
<40% of determined
flows have been evaluated and given a value
Process completeness
not scored
Type of review Internal or external
Elements of review
Goal and scope definition Raw data Unit process, single operation (unit process inventory) Aggregated process inventory LCI results or partly terminated system LCIA methods that are applicable Dataset documentation Check of the data quality indicators (DQIs)
Conclusions Confirmation that all performed checks have been passed Reviewer name and institution Name, affiliation, and roles or assignments of the reviewers Review details Procedural details of the review process Review summary Overall review statement
17
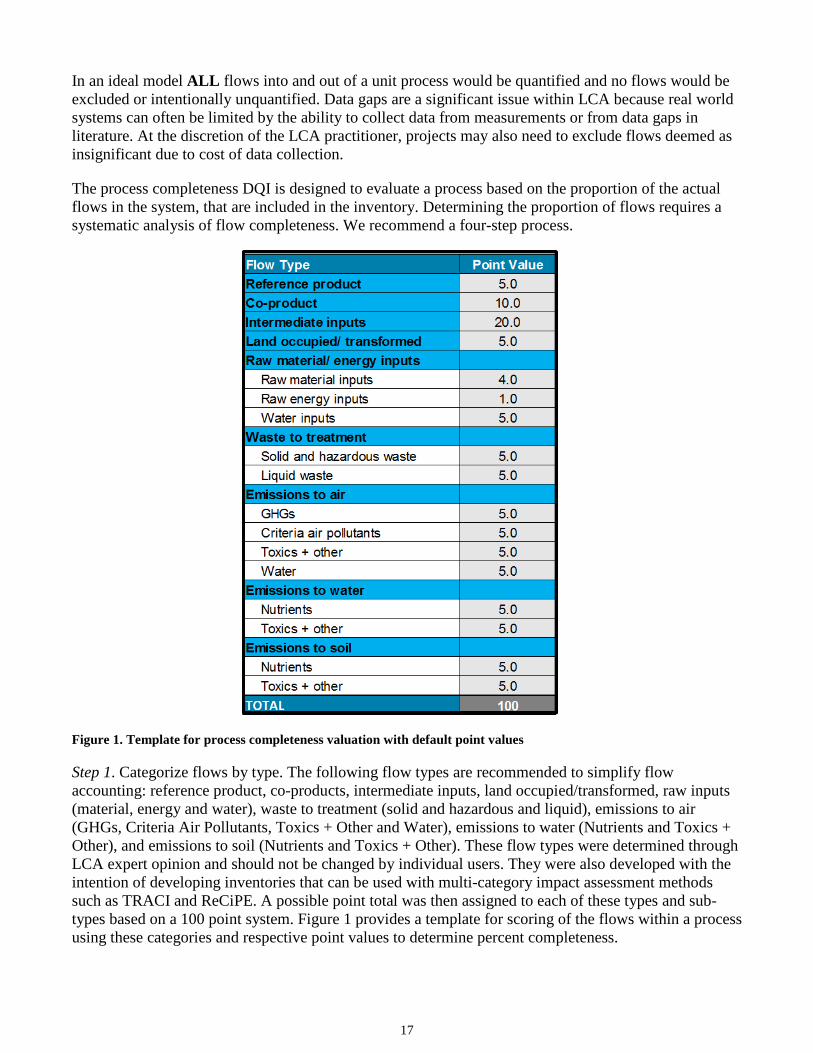
In an ideal model ALL flows into and out of a unit process would be quantified and no flows would be excluded or intentionally unquantified. Data gaps are a significant issue within LCA because real world systems can often be limited by the ability to collect data from measurements or from data gaps in literature. At the discretion of the LCA practitioner, projects may also need to exclude flows deemed as insignificant due to cost of data collection.
The process completeness DQI is designed to evaluate a process based on the proportion of the actual flows in the system, that are included in the inventory. Determining the proportion of flows requires a systematic analysis of flow completeness. We recommend a four-step process.
Figure 1. Template for process completeness valuation with default point values
Step 1. Categorize flows by type. The following flow types are recommended to simplify flow accounting: reference product, co-products, intermediate inputs, land occupied/transformed, raw inputs (material, energy and water), waste to treatment (solid and hazardous and liquid), emissions to air (GHGs, Criteria Air Pollutants, Toxics + Other and Water), emissions to water (Nutrients and Toxics + Other), and emissions to soil (Nutrients and Toxics + Other). These flow types were determined through LCA expert opinion and should not be changed by individual users. They were also developed with the intention of developing inventories that can be used with multi-category impact assessment methods such as TRACI and ReCiPE. A possible point total was then assigned to each of these types and sub-types based on a 100 point system. Figure 1 provides a template for scoring of the flows within a process using these categories and respective point values to determine percent completeness.
18
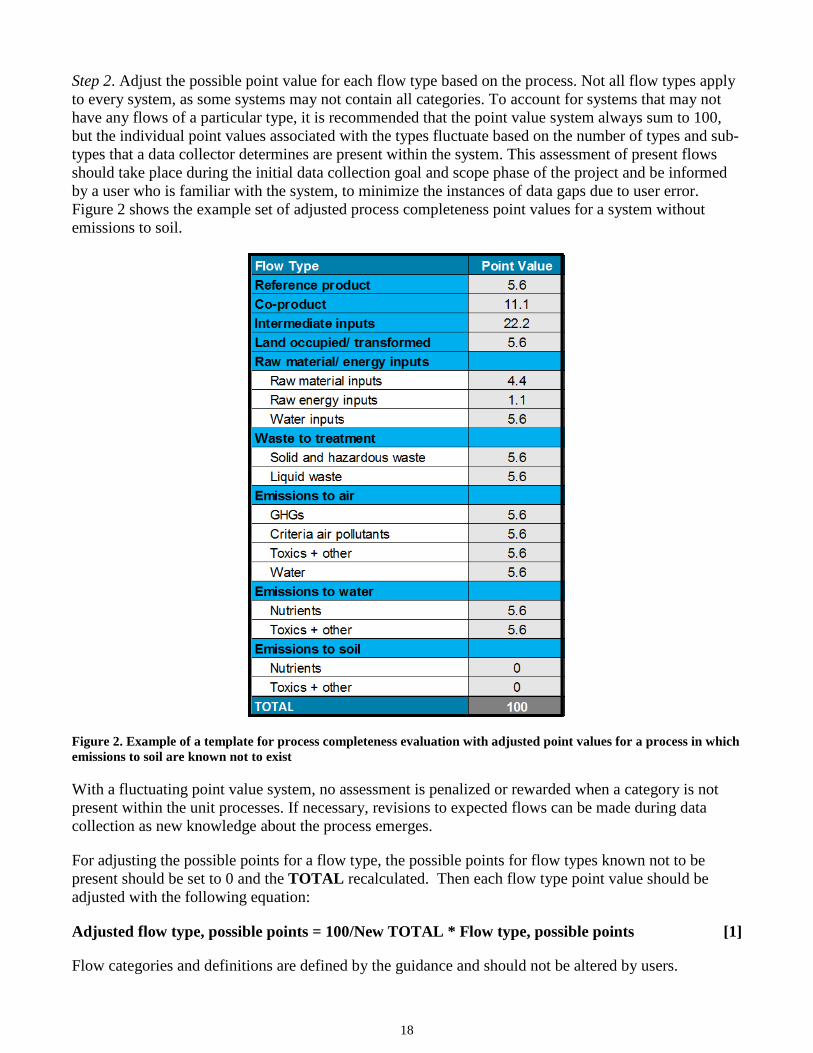
Step 2. Adjust the possible point value for each flow type based on the process. Not all flow types apply to every system, as some systems may not contain all categories. To account for systems that may not have any flows of a particular type, it is recommended that the point value system always sum to 100, but the individual point values associated with the types fluctuate based on the number of types and sub-types that a data collector determines are present within the system. This assessment of present flows should take place during the initial data collection goal and scope phase of the project and be informed by a user who is familiar with the system, to minimize the instances of data gaps due to user error. Figure 2 shows the example set of adjusted process completeness point values for a system without emissions to soil.
Figure 2. Example of a template for process completeness evaluation with adjusted point values for a process in which emissions to soil are known not to exist
With a fluctuating point value system, no assessment is penalized or rewarded when a category is not present within the unit processes. If necessary, revisions to expected flows can be made during data collection as new knowledge about the process emerges.
For adjusting the possible points for a flow type, the possible points for flow types known not to be present should be set to 0 and the TOTAL recalculated. Then each flow type point value should be adjusted with the following equation:
Adjusted flow type, possible points = 100/New TOTAL * Flow type, possible points [1]
Flow categories and definitions are defined by the guidance and should not be altered by users.
19
Step 3. Calculate completeness points for each flow type for a given unit process. Within each flow type, the total points is calculated using equation [2]:
Completeness points, type x = (Number of inventory flows of type x /Number of expected flows of type x) * Flow type x, possible points [2]
This method implicitly assumes all flows within a type are of equal importance.
An example completeness points calculation for a flow type:
If it is determined that 3 GHG flows are expected and only 2 GHG flows could be evaluated, then the percent complete is equal to 2/3 or 66.66% and the completeness score for the GHG category is equal to
5 (point value)*66.66% (% complete) = 3.3
Step 4. Sum the completeness points for all flow types, assign appropriate DQI.
The completeness score for each category present within the system is then summed to find the total completeness score for the unit process. The total completeness score is then used to with the updated pedigree matrix to determine a DQI score value for the unit process completeness. Calculations should be checked to ensure that flows evaluated never exceed flows expected, as this is creates an error when summing the completeness score for each category.

20
6.0 Application of the Updated Pedigree Matrix
The following sections provide an example on how to appropriately apply the guidance to establish DQGs relevant to data representativeness. To help clarify, the guidance will use a tub grinder unit process as an example. The tub grinder unit process was created as a part of an end-of-life (EOL) project for Construction and Demolition Debris data. The recycling of land-clearing debris (LCD) can be split into several different unit processes, one of which is the operation of a tub grinder to produce wood chips. The tub grinder recycles land clearing debris (LCD) into mulch.
6.1 Data Quality Goals
The following section describe the data quality goals for the tub grinder example.
6.1.1 Temporal Data Quality Goal
Figure 3. Land Clearing Debris – Temporal DQG Since the LCD project was not based on data collection measurements, but rather on a literature review, the start and end dates of one year for the process is intended to represent the temporal DQG. In Figure 3, the time comment provides information relative to the minimum length of time required to account for normal variations within the process. There are currently no set industry standards for determining the minimum length of time for data collection in order to account for process variations.
6.1.2 Geographical Data Quality Goal
The LCD project is to be representative of data from the USA. Since the USA is a nation, the resolution level is D and the area of study is listed as national data from the US, as shown in Figure 4.
6.1.3 Technological Data Quality Goal
Figure 4. Land Clearing Debris- Geographical DQG
Figure 5. Land Clearing Debris- Geographical DQG
21
The technological goal is stated in Figure 5 and includes the process design (tub grinder), operating conditions (950 bhp), material and material quality (3% leaves and grass, 7% bark, 10% pallets, 42% brush and mixed lumber and 38% logs under 20’ in diameter), and scale (63,080 kg/hr).
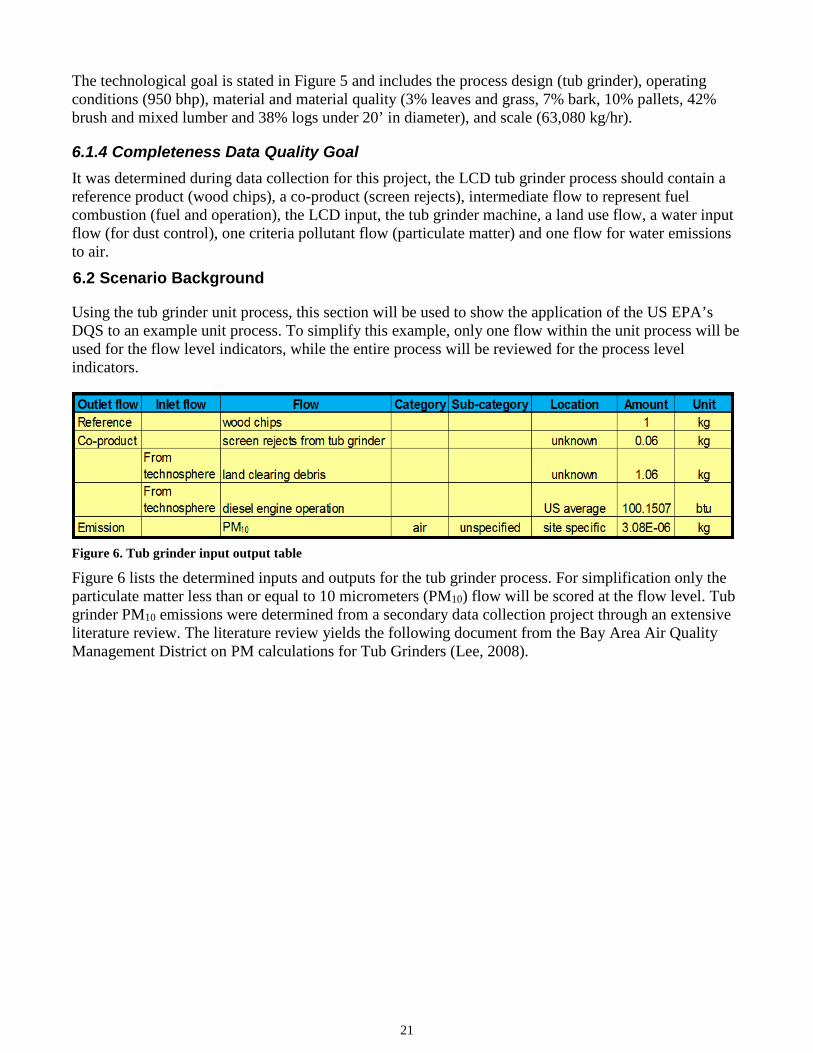
6.1.4 Completeness Data Quality Goal It was determined during data collection for this project, the LCD tub grinder process should contain a reference product (wood chips), a co-product (screen rejects), intermediate flow to represent fuel combustion (fuel and operation), the LCD input, the tub grinder machine, a land use flow, a water input flow (for dust control), one criteria pollutant flow (particulate matter) and one flow for water emissions to air.
6.2 Scenario Background
Using the tub grinder unit process, this section will be used to show the application of the US EPA’s DQS to an example unit process. To simplify this example, only one flow within the unit process will be used for the flow level indicators, while the entire process will be reviewed for the process level indicators.
Figure 6. Tub grinder input output table
Figure 6 lists the determined inputs and outputs for the tub grinder process. For simplification only the particulate matter less than or equal to 10 micrometers (PM10) flow will be scored at the flow level. Tub grinder PM10 emissions were determined from a secondary data collection project through an extensive literature review. The literature review yields the following document from the Bay Area Air Quality Management District on PM calculations for Tub Grinders (Lee, 2008).

22
The tub grinder document provides the information as a guide for calculating PM emissions see in Figure 7.
Figure 8. Table 10.3-1 Uncontrolled Fugitive Particulate Emission Factors for Plywood Veneer and layout Operations.
Before completing a DQA of this source, the original documentation of the data must be located. The original source of data is not available within this document. AP-42, Table 10.3-1 is a publically available document and included the following information presented in Figure 8 as found on page 10.3-3. In the table footnotes, the source shows that the value was originally taken from reference 7.
Figure 7. Bay Area Air Quality Management District on PM calculations for Tub Grinders
23
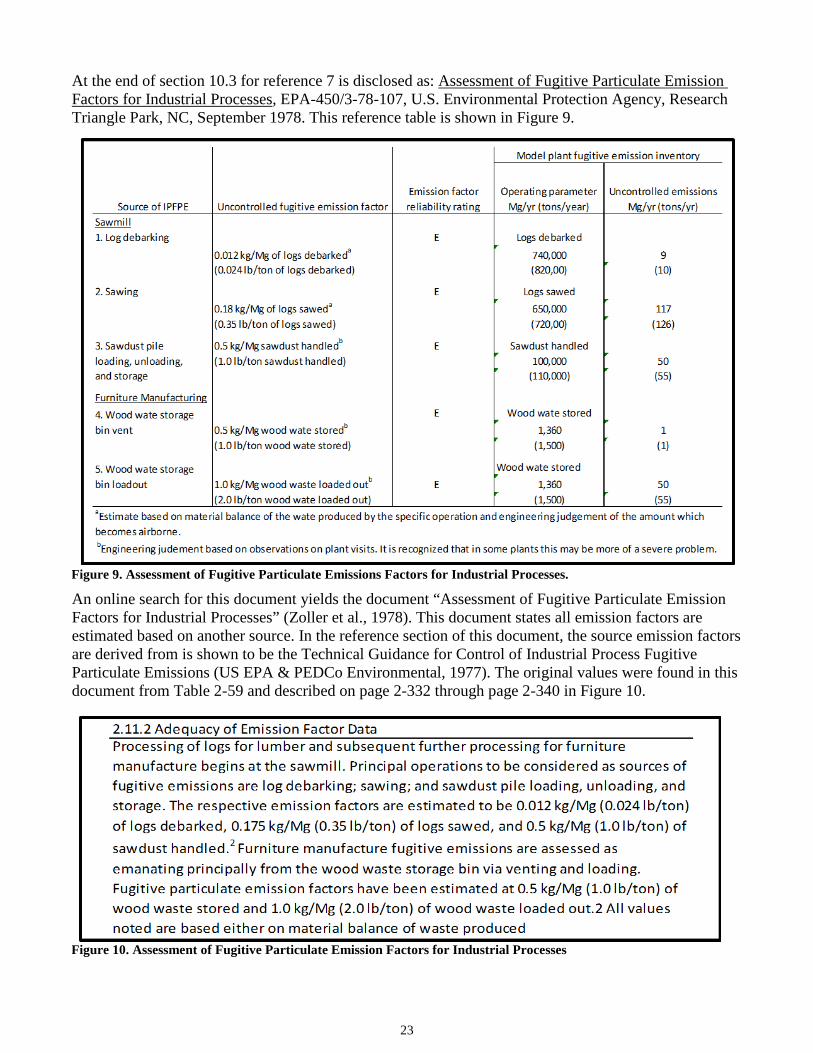
At the end of section 10.3 for reference 7 is disclosed as: Assessment of Fugitive Particulate Emission Factors for Industrial Processes, EPA-450/3-78-107, U.S. Environmental Protection Agency, Research Triangle Park, NC, September 1978. This reference table is shown in Figure 9.
An online search for this document yields the document “Assessment of Fugitive Particulate Emission Factors for Industrial Processes” (Zoller et al., 1978). This document states all emission factors are estimated based on another source. In the reference section of this document, the source emission factors are derived from is shown to be the Technical Guidance for Control of Industrial Process Fugitive Particulate Emissions (US EPA & PEDCo Environmental, 1977). The original values were found in this document from Table 2-59 and described on page 2-332 through page 2-340 in Figure 10.
Figure 10. Assessment of Fugitive Particulate Emission Factors for Industrial Processes
Figure 9. Assessment of Fugitive Particulate Emissions Factors for Industrial Processes.
24
6.3 Flow Reliability
The PM10 emission value is determined from a calculation based on AP 42. However, in this calculation several assumptions are made (1) the tub grinder process is similar to log debarking, (2) 60% of the particulate emissions are PM10, and (3) water suppression will also provide 50% abatement of particulate emissions. Therefore, from this information the PM10 flow DQI score should be no greater than “4” because this value is based on an estimation.
The emission factor (0.024 lb TSP/ton) is traced to its source in the Technical Guidance for Control of Industrial Process Fugitive Particulate Emissions (US EPA & PEDCo Environmental, 1977). In this document, it is stated all emission factors are estimates based on engineering judgment.
Therefore, following the definition provided in the terminology section of this guidance, the PM10 flow is really an estimation based on engineering judgment. Most assumptions were clearly documented at each stage of the estimation. However, the estimation is based on engineering judgement. Since engineering judgement is based on observations and no clear documented assumptions were included with the engineering judgement the PM10 flow cannot be considered a documented estimate. Therefore, the PM10 flow should be given a DQI score of “5” as an undocumented estimate.
6.4 Flow Temporal Representativeness
In the tub grinder scenario, the emission factor was based on an estimation from engineering judgment per the Technical Guidance for Control of Industrial Process Fugitive Particulate Emissions (US EPA & PEDCo Environmental, 1977). This document was published in 1977. However, publication dates are NOT to be used in determining temporal correlation. The reference section of this document refers to observations being made from a plant tour of a Broyhill Furniture manufacturing plant on September 3, 1976 and the material balances estimates being done based on waste produced from this specific operation. Therefore, the generation date for this data value is 1976. Per Figure 3 the defined temporal scope is 2015. The difference between 1976 and 2015 is >15 years, leading to a DQI score of “5” for temporal representativeness.
6.5 Flow Geographical Representativeness
The data in question was originally produced via engineering judgment based on a plant tour of a Broyhill Furniture manufacturing plant on September 3, 1976, as shown on page 2-340 of the Technical Guidance for Control of Industrial Process Fugitive Particulate Emissions (US EPA & PEDCo Environmental, 1977), and is therefore determined to be site specific. The location of this plant is undocumented and unknown, however it can assumed that the location of this plant is somewhere within the United States since this document was published by the US EPA. Since the data represents site specific data (resolution level G) and the geographical DQG is for national level data, or resolution level D. The data geographic level of resolution is outside of two steps, meaning the data cannot receive a data quality score above a “4”. Since the site is still located within the area of study the data quality score is a “4”.
6.6 Flow Technological Representativeness
Going back to the original data document (Technical Guidance for Control of Industrial Process Fugitive Particulate Emissions) (US EPA & PEDCo Environmental, 1977) as shown in Figure 10, the value corresponds to a log debarking process at a sawmill. The process design is similar but different since the goal is for a tub grinder process in which wood is ground to pulp, while the data comes from a log debarking process. The process operating conditions are unknown since there is no mention of the flow
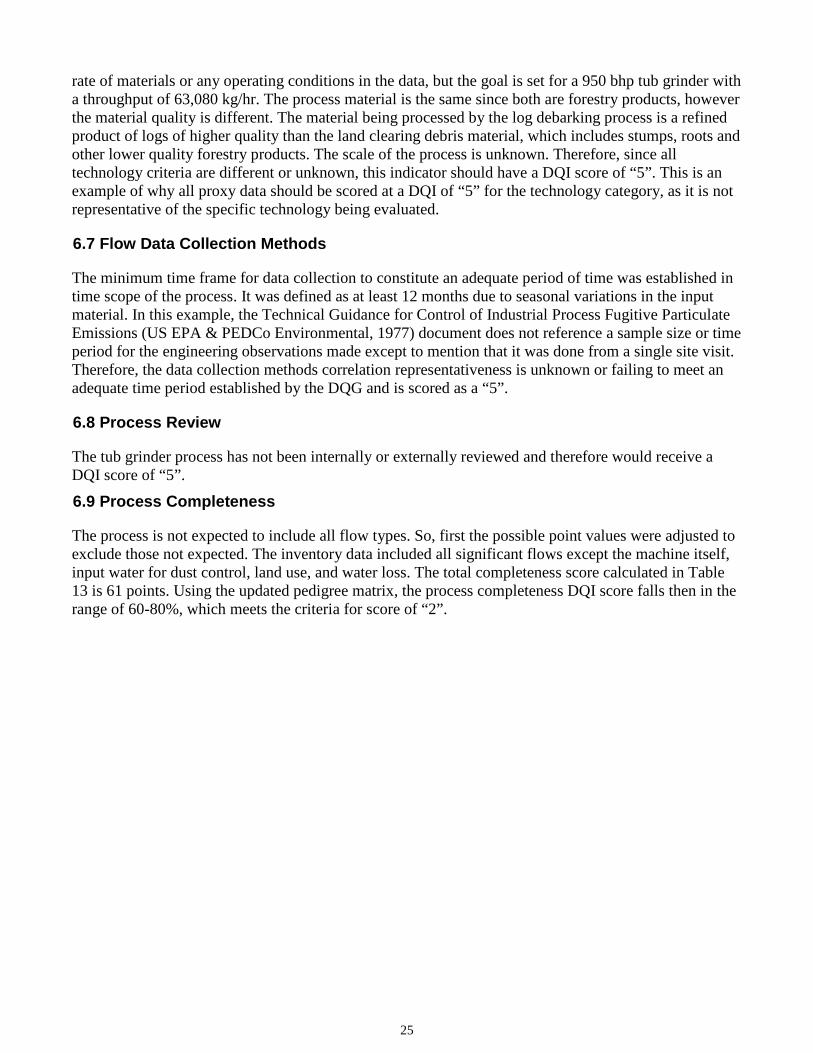
25
rate of materials or any operating conditions in the data, but the goal is set for a 950 bhp tub grinder with a throughput of 63,080 kg/hr. The process material is the same since both are forestry products, however the material quality is different. The material being processed by the log debarking process is a refined product of logs of higher quality than the land clearing debris material, which includes stumps, roots and other lower quality forestry products. The scale of the process is unknown. Therefore, since all technology criteria are different or unknown, this indicator should have a DQI score of “5”. This is an example of why all proxy data should be scored at a DQI of “5” for the technology category, as it is not representative of the specific technology being evaluated.
6.7 Flow Data Collection Methods
The minimum time frame for data collection to constitute an adequate period of time was established in time scope of the process. It was defined as at least 12 months due to seasonal variations in the input material. In this example, the Technical Guidance for Control of Industrial Process Fugitive Particulate Emissions (US EPA & PEDCo Environmental, 1977) document does not reference a sample size or time period for the engineering observations made except to mention that it was done from a single site visit. Therefore, the data collection methods correlation representativeness is unknown or failing to meet an adequate time period established by the DQG and is scored as a “5”.
6.8 Process Review
The tub grinder process has not been internally or externally reviewed and therefore would receive a DQI score of “5”.
6.9 Process Completeness
The process is not expected to include all flow types. So, first the possible point values were adjusted to exclude those not expected. The inventory data included all significant flows except the machine itself, input water for dust control, land use, and water loss. The total completeness score calculated in Table 13 is 61 points. Using the updated pedigree matrix, the process completeness DQI score falls then in the range of 60-80%, which meets the criteria for score of “2”.
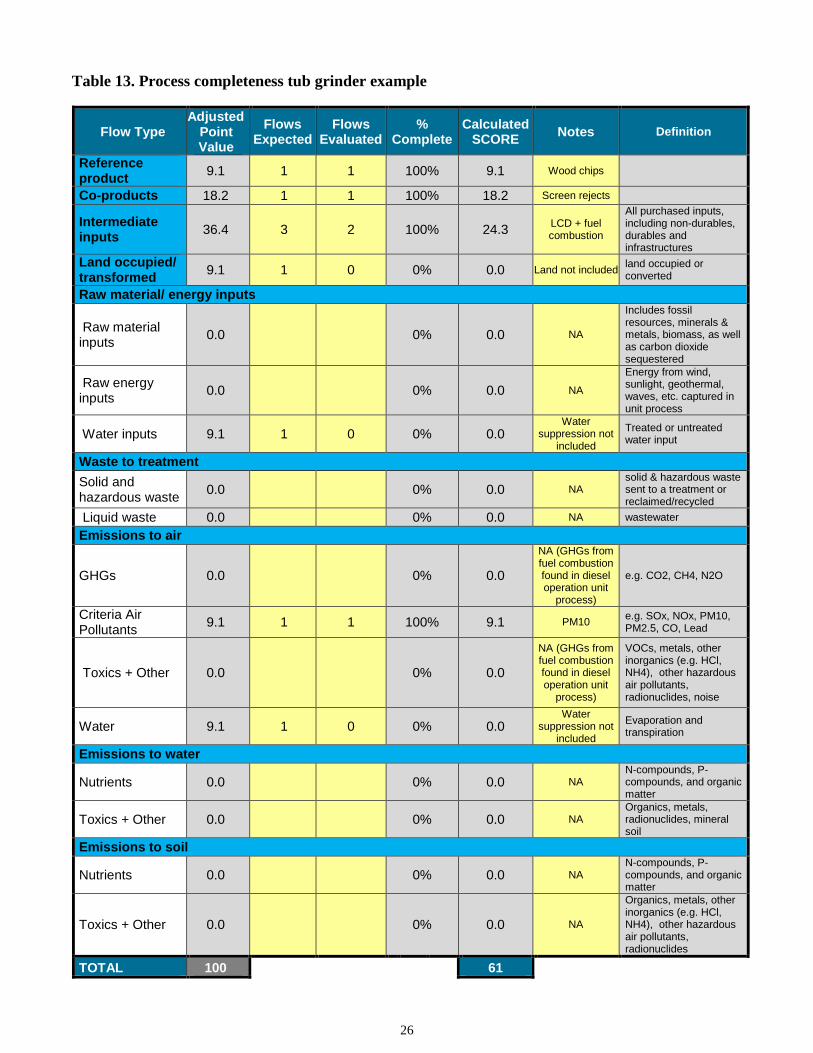
26
Table 13. Process completeness tub grinder example
Flow Type Adjusted
Point Value
Flows Expected
Flows Evaluated
% Complete
Calculated SCORE Notes Definition
Reference product 9.1 1 1 100% 9.1 Wood chips
Co-products 18.2 1 1 100% 18.2 Screen rejects
Intermediate inputs 36.4 3 2 100% 24.3 LCD + fuel
combustion
All purchased inputs, including non-durables, durables and infrastructures
Land occupied/ transformed 9.1 1 0 0% 0.0 Land not included land occupied or
converted
Raw material/ energy inputs
Raw material inputs 0.0 0% 0.0 NA
Includes fossil resources, minerals & metals, biomass, as well as carbon dioxide sequestered
Raw energy inputs 0.0 0% 0.0 NA
Energy from wind, sunlight, geothermal, waves, etc. captured in unit process
Water inputs 9.1 1 0 0% 0.0 Water
suppression not included
Treated or untreated water input
Waste to treatment Solid and hazardous waste 0.0 0% 0.0 NA
solid & hazardous waste sent to a treatment or reclaimed/recycled
Liquid waste 0.0 0% 0.0 NA wastewater
Emissions to air
GHGs 0.0 0% 0.0
NA (GHGs from fuel combustion found in diesel operation unit
process)
e.g. CO2, CH4, N2O
Criteria Air Pollutants 9.1 1 1 100% 9.1 PM10 e.g. SOx, NOx, PM10,
PM2.5, CO, Lead
Toxics + Other 0.0 0% 0.0
NA (GHGs from fuel combustion found in diesel operation unit
process)
VOCs, metals, other inorganics (e.g. HCl, NH4), other hazardous air pollutants, radionuclides, noise
Water 9.1 1 0 0% 0.0 Water
suppression not included
Evaporation and transpiration
Emissions to water
Nutrients 0.0 0% 0.0 NA N-compounds, P-compounds, and organic matter
Toxics + Other 0.0 0% 0.0 NA Organics, metals, radionuclides, mineral soil
Emissions to soil
Nutrients 0.0 0% 0.0 NA N-compounds, P-compounds, and organic matter
Toxics + Other 0.0 0% 0.0 NA
Organics, metals, other inorganics (e.g. HCl, NH4), other hazardous air pollutants, radionuclides
TOTAL 100 11 61
27
7.0 Relationship of Uncertainty and Variability to Data Quality Assessment
Variability and uncertainty are both types of variation that are often confused and/or misused within LCA. This section clarifies the difference between variability and uncertainty.
7.1 Uncertainty
Uncertainty is defined as a lack of knowledge, or the level of confidence in a value being true or false (US EPA, 2009). For uncertainty, the actual value of a quantity is unknown and described by a probability distribution. This distribution is based on the information or metadata about the value and can be reduced by improving the metadata. Per the definition on the US EPA website, uncertainty can be either quantitative or qualitative (US EPA, 2011). For quantitative uncertainty analysis this guidance recommends the use of Chapter 4 of the Procedural guideline for collection, treatment, and quality documentation of LCA data is an example of guidelines for quantitatively calculating uncertainty for LCA (B. P. Weidema et al., 2001). The updated pedigree matrix is capable of addressing qualitative uncertainty. Past pedigree matrices have used uncertainty as an indicator. The updated pedigree matrix has excluded uncertainty as an indicator, as the matrix is designed to provide users with information via metadata that qualitatively informs the user of the confidence level associated with the application of data within a specified scenario. Calculating a quantitative uncertainty value based on the updated pedigree matrix is NOT advised.
7.2 Variability
Variability refers to the observed differences due to diversity, and is represented with a frequency distribution derived from the observed data and can usually not be reduced with further measurement or study (US EPA, 2009). Both variability and uncertainty are represented with distributions can be a major source of confusion, leading to the erroneous adoption of frequency distributions to represent uncertainty (Begg et al., 2014). Variability is often interchanged with uncertainty in the field of LCA causing confusion and misrepresentation of results. It is important to distinguish differences between variability and uncertainty and if possible to capture both. Variability in LCA context is the natural fluctuation that occurs within a process or data set. The updated pedigree matrix partially accounts for variability with the data collection method indicator. It is important that during the designing of any primary data collection projects, the variability based on temporal, geographical and technological aspects of a process be considered and documented. It is also important for users to understand the effects variability may have on the outcome of the results and to qualitatively address these impacts within an LCA project. Further developments in standards for data collection and data reporting are needed to adequately clarify and address data variability and uncertainty as the use of LCA as a decision support tool continues to grow.
28
8.0 Limitations and Future Work
Assessing all aspects of LCI data quality is a challenging task. For the first time, data quality indicators are defined here for application to two levels of LCI data –flow and process level. Flow level indicators are the most well-established and currently used for LCI DQA. In this guidance these indicators have been restructured and more clearly defined. The process level indicators are novel with only two defined, thus far. The DQI criteria have been designed to the extent possible to enable scoring based on an objective evaluation of the data. Although there is still room for subjectivity in interpretation of some of the DQI criteria, use of this guidance should reduce potential bias in DQA.
The level of LCI data for which no indicators have yet been proposed is the model level. One aspect of model level data quality would describe how well a process used to represent a technosphere flow matches with what is intended. Another aspect of model level data quality would be how consistent modeling principles (e.g. allocation) are applied across the different unit processes that are combined to make an LCI model.
Another aspect of data quality is its expansion to incorporate life cycle impact assessment and how well the elementary flows in a life cycle inventory match what is intended in the life cycle impact method. Determining how to score these aspects of LCI data quality requires future research. In the meantime, it should be noted in the interpretation phase of an LCA study these aspects of data quality have not been assessed through a formal DQS.
Regarding temporal representativeness, a general recommendation of data collection over 1 year was assumed to be sufficient for most activities, with the exception of agriculture (3 year minimum). More detailed recommendations for time periods over which to collect data for specific sectors would need to be addressed in future work.
Some of the data quality indicators have multiple criteria within a single indicator. Geographical representativeness covers both resolution and relatedness of a study region and data. Technological representativeness covers four technology categories. Scoring these DQIs is more difficult because the user must balance consideration of multiple criteria. Additionally some information is lost when combined into a single indicator. Adding more indicators to score these unique aspects requires additional data entry and management and may also increase the challenge of interpretation. More testing is needed to determine if it is feasible and desirable to increase the number of DQIs to capture these unique data quality aspects, or if they are sufficient as compounded in existing DQIs.
Guidance has not yet been provided on aggregation of flow and process level data indicators in a complex product system for interpretation of data quality results. For instance, where multiple processes contribute to a flow (e.g. fuel combustion and landfilling processes in a product system both produce CO2 emissions) that appears as one results in the analysis, but data quality scores for CO2 are different in these processes, then some method of aggregation of these data quality scores is likely needed to support interpretation. Potential aggregation methods for flow and processes data quality scores needs to be addressed in future research.

29
9.0 Quality Assurance The data quality background and recommendations in this report were made subject to the quality assurance procedures described in the Quality Assurance Project Plan S-21355 “NRMRL QAPP REQUIREMENTS FOR SECONDARY DATA PROJECT: LIFE CYCLE ASSESSMENT DATA INFRASTRUCTURE”. The team verified that all relevant background sources were gathered and correctly interpreted, and that the new data quality guidelines were reviewed and revised by all team members before description herein. Furthermore, this report was reviewed by the NRMRL Sustainable Technology Division Quality Assurance Manager and cleared by NRMRL management.
30
10.0 Glossary
Approximation. An amount or figure that is almost correct and is not intended to be exact: a mathematical quantity that is close in value to but not the same as a desire quantity (Merriam-Webster, 2015).
Calculation. Obtaining values of a given property through mathematical operations involving already known data related to the desired property, such as using mass or energy balances. Computational modeling is considered a sub-set of calculations, adapted from (B. P. Weidema et al., 2001).
Computational Modeling. Application of algorithms to solve complex mathematical models, which characterize real world interactions and their dynamics. Computational Modeling is used to describe the relationship between the desired property and the data already known. Computational Modeling is a form of calculation, but is considered separate because original calculations and measurements unless properly documented can be indeterminable/inaccessible to user.
Life Cycle Database. A system intended to organize, store, and retrieve large amounts of digital LCI datasets easily. It consists of an organized collection of LCI datasets that completely or partially conforms to a common set of criteria, including methodology, format, review, and nomenclature, and that allows for interconnection of individual datasets that can be specified for use with identified impact assessment methods in application of life cycle assessments and life cycle impact assessments (UNEP & SETAC, 2011). Data Quality. A measure of the degree of acceptability or utility of data for a particular purpose (US EPA, 2000).
Data Quality Assessment (DQA). The scientific and statistical evaluation of data to determine if data obtained from environmental operations are of the right type, quality, and quantity to support their intended use (US EPA, 2000).
Data Quality Goal (DQG). Qualitative statement that defines specifications for the adequacy of data used in an LCI or for certain LCI parameters (Bakst et al., 1995).
Data Quality Indicator (DQI). Quantitative or qualitative terms for defining data characteristics that serve as benchmarks against which data quality can be assessed to determine whether DQGs have been met (Bakst et al., 1995). A standard quality category for evaluating a data quality property against a corresponding DQG for the purpose of so that users can make an informed decision as to the is comprised of one or more data which describes a characteristic
Data quality indicators determined by ISO 14044 (ISO, 2006b):
Time-related coverage (Temporal) – age of the data and the minimum length of time over which data should be collected
Geographic coverage – geographical area from which data for unit processes should be collected to satisfy the goal of the study
Technology coverage – specific technology or technology mix
Reproducibility – qualitative assessment of the extent to which information about the methodology and data values would allow an independent practitioner to reproduce the results reported in the study
Source of the data – reliability of the source
31
Consistency – qualitative assessment of whether the study methodology is applied uniformly to the various components of the analysis
Representativeness – qualitative assessment of the degree to which the data set reflect the true population of interest (geographic, temporal and geographic)
Precision – measure of the variability of the data values for each data expression (variance)
Uncertainty – uncertainty of the information
Data Quality Property. A property of data which provides information on the quality of the data. Data Quality Score. A quantitative or qualitative value assigned to a data quality indicator for a particular dataset.
Data Quality System (DQS). System which assesses the data quality of a dataset, either quantitatively or qualitatively (e.g. pedigree matrix).
Dataset (LCI dataset). A document or file with life cycle information of a specified product or other reference (e.g., site, process), covering descriptive metadata and quantitative life cycle inventory and/or life cycle impact assessment data, respectively (European Commission, 2010). Data Validation. An analytic- and sample-specific process that extends the evaluation of data beyond method, procedural, or contractual compliance (i.e., data verification) to determine the analytical quality of a specific data set (US EPA, 2002).
Data Verification. The process of evaluating the completeness, correctness, and conformance/compliance of a specific data set against the method, procedural, or contractual requirements (US EPA, 2002).
Dynamic Indicator. A data quality indicator that changes depending on the situation in which the data is being used, or each time the data quality goals are changed. These indicators should be completed each uses of the data (e.g. representativeness). Estimation. The act of determining the value of a given entity using scientific assumptions or approximation of a quantity, which is can be based on industry expertise/observations, calculations, measurements or qualified assumptions, adapted from (B. P. Weidema et al., 2001)& (Bakst et al., 1995).
Flows. In LCA, an input or output to a process (ISO, 2006b).
Life Cycle Assessment (LCA). Compilation and evaluation of the inputs, outputs and potential environmental impacts of a product system throughout its life cycle (ISO, 2006b).
Life Cycle Inventory (LCI).Phase of life cycle assessment involving the compilation and quantification of inputs and outputs for a product throughout its life cycle (ISO, 2006b).
Life Cycle Impact Assessment (LCIA). Phase of life cycle assessment aimed at understanding and evaluating the magnitude and significance of the potential environmental impacts for a product system throughout the life cycle of the product (ISO, 2006b).
Measured Data. Data generated using analytical or physical measurement procedures, including survey questionnaires, sampling, or monitoring (Bakst et al., 1995).
Measurement. A determination of the magnitude of a quantity associated with a standard unit for that quantity. Measurements can be either from a primary or secondary data source and can be generated using several analytical or physical methods, such as survey questionnaires, sampling or monitoring, adapted from (B. P. Weidema et al., 2001)& (Bakst et al., 1995).
32
Metadata. Structured data about an object that supports functions associated with the designated object. In LCI, the object is a combination of the name, value and unit and all other supporting information associated with the “data” is considered metadata, adapted from (Greenberg, 2003).
Pedigree Matrix. Ordinal evaluation rules combined with data quality assessment criteria used to manage uncertainty (UNEP, 2009)
Primary Data. Plant-specific, measured, modeled, or estimated data for conducting an LCI that the practitioner can directly access or for which the practitioner has input into the data collection process (Bakst et al., 1995).
Proxy Data. Data from a similar process or material, which is used because no data from the desired process or material is available.
Secondary Data. Data that have not been collected specifically for the purpose of conducting an LCI and for which the practitioner has no input into the data collection process (Bakst et al., 1995).
Static Indicator. A data quality indicator that is not situationally dependent. A property of the data that never changes (e.g. reliability because the data generation method will not change unless new data is used). Uncertainty. Lack of knowledge about models, parameters, constants, data, and beliefs. There are many sources of uncertainty, including the science underlying a model, uncertainty in model parameters and input data, observation error, and code uncertainty. Additional study and collecting more information allows error that stems from uncertainty to be minimized/reduced (or eliminated). In contrast, variability (see definition) is irreducible but can be better characterized or represented with further study (US EPA, 2009).
Uncertainty Analysis. Systematic procedure to quantify the uncertainty introduced in the results of a life cycle inventory analysis due to the cumulative effects of model imprecision, input uncertainty and data variability (ISO, 2006b).
Unit Process. Smallest element considered in the life cycle inventory analysis for which input and output data are quantified (ISO, 2006b).
Variability. Observed differences attributable to true heterogeneity or diversity. Variability is the result of natural random processes and is usually not reducible by further measurement or study (although it can be better characterized (US EPA, 2009).
33
11.0 References Bakst, J. S., Lacke, C. J., Weitz, K. A., & Warren, J. L. (1995). Guidelines for Assessing the Quality of
LCI Analysis. (EPA530-R-95-010). Washington, D.C.: U.S. Environmental Protection Agency. Ciroth, A. (2012). Refining the pedigree matrix approach in ecoinvent: Greendelta. Collins, F. S., & Tabak, L. A. (2014). Policy: NIH plans to enhance reproducibility. Nature, 505(7485),
612-613. doi: 10.1038/505612a Cooper, J., & Kahn, E. (2012). Commentary on issues in data quality analysis in life cycle assessment.
International Journal Life Cycle Assessment, 17, 499-503. doi: 10.1007/s11367-011-0371-x Curran, M. A. (2006). Life Cycle Assessment: Principles and Practice. (EPA/600/R-06/060). US EPA. de Beaufort-Langeveld, A. S. H., Bretz, R., Hischier, R., Huijbregts, M., Jean, P., Tanner, T., & van
Hoof, G. (2003). Code of Life-Cycle Inventory Practice. Pensacola, FL: SETAC Press. European Commission. (2010). ILCD handbook: General guide for Life cycle Assesment - Detailed
guidance. Italy: European Union. Greenberg, J. (2003). Metadata and the World Wide Web. In M. A. Drake (Ed.), Encyclopedia of
Library and Information Science (Vol. 3, pp. 1876). New York: Marcel Dekker, Inc. ISO. (2006a). Environmental management - Life cycle assessment - Principles and framework. Geneva,
Switzerland: International Standardization Organization. ISO. (2006b). Environmental management - Life cycle assessment - Requirements and guidelines.
Geneva, Switzerland: International Organization for Standardization. Lee, M. K. C. (2008). Permit Handbook. San Francisco, CA: Bay Area Air Quality managment District
Retrieved from http://www.baaqmd.gov/~/media/Files/Engineering/Permit%20Handbook/BAAQMD%20Permit%20Handbook.ashx?la=en.
Merriam-Webster. (2015). Judgment. from http://www.merriam-webster.com/dictionary/judgment Schenck, R., & White, P. (Eds.). (2014). Environmental Life Cycle Assessment: The Environmental
Performance of Products. Vasho Island Washington: American Center for Life Cycle Assessment.
UNEP. (2009). Guidelines for Social Life Cycle Assessment of Products. In United Nations Environment Programme (Ed.), Life Cycle Initiative: United Nations Environment Programme and Society of Environmental Toxicology and Chemistry.
UNEP, & SETAC (Producer). (2011). Global Guidance Principles for Life Cycle Assessment Databases: A Basis for Greener Processes and Products.
United Nations. (2013). Composition of macro geographical regions, geographical sub-regions, and selected economic and other groupings. 31 October 2013. from http://unstats.un.org/unsd/methods/m49/m49regin.htm
US EPA. (2000). Guidance for Data Quality Assessment: Practical Methods for Data Analysis. (EPA/600/R-96/084). Washington, DC United States Environmental Protection Agency.
US EPA. (2002). Guidance on Environmental Data Verification and Data Validation. (EPA QA/G-8). Washington, DC: United States Environmnetal Protection Agency.
US EPA. (2009). Guidance on the Development, Evaluation, and Application of Environmental Models. (EPA/100/K-09/003 ).
US EPA. (2011). Exposure Factors Handbook: 2011 Edition (Final). (EPA/600/R-090/052F). Washington, DC: United States Environmental Protection Agency, Office of Research and Development, National Center for Environmental Assessment Retrieved from http://cfpub.epa.gov/ncea/cfm/recordisplay.cfm?deid=236252

34
US EPA, & PEDCo Environmental. (1977). Technical Guidance for Control of Industrial Process Fugitive Particulate Emissions. (EPA-450/3-77-010). North Carolina: U.S. Environmental Protection Agency.
Weidema, B., & Wesnaes, M. (1996). Data quality management for life cycle inventories-an example for using data quality indicators. Journal of Cleaner Production, 4(3-4), 167-174.
Weidema, B. P., Bauer, C., Hischier, R., Mutel, C., Nemecek, T., Reinhard, J., . . . Wernet, G. (2013). Overview and methodology: Data quality guideline for the ecoinvent database verison 3 Ecoinvent Report 1(v3). St. Gallen: The econinvent Centre.
Weidema, B. P., Cappellaro, F., Carlson, R., Notten, P., Palsson, A.-C., Patyk, A., . . . Scalbi, S. (2001). Procedural guideline for collection, treatment, and quality documentation of LCA data. (LC-TG-23-001). CASCADE.
Zoller, J., Bertke, T., & Janszen, T. (1978). Assessment of Fugitive Particulate Emission Factors for Industrial Processes. (EPA-450/3-78-107). North Carolina: U.S. Environmental Protection Agency.
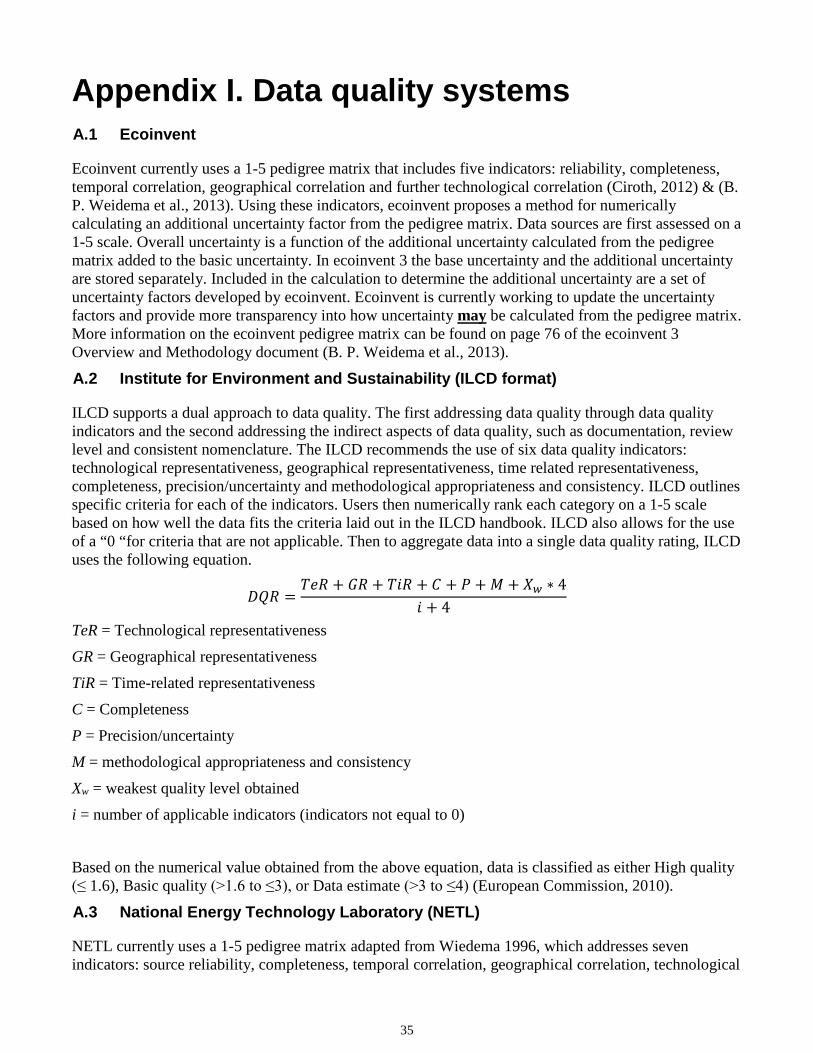
35
Appendix I. Data quality systems A.1 Ecoinvent
Ecoinvent currently uses a 1-5 pedigree matrix that includes five indicators: reliability, completeness, temporal correlation, geographical correlation and further technological correlation (Ciroth, 2012) & (B. P. Weidema et al., 2013). Using these indicators, ecoinvent proposes a method for numerically calculating an additional uncertainty factor from the pedigree matrix. Data sources are first assessed on a 1-5 scale. Overall uncertainty is a function of the additional uncertainty calculated from the pedigree matrix added to the basic uncertainty. In ecoinvent 3 the base uncertainty and the additional uncertainty are stored separately. Included in the calculation to determine the additional uncertainty are a set of uncertainty factors developed by ecoinvent. Ecoinvent is currently working to update the uncertainty factors and provide more transparency into how uncertainty may be calculated from the pedigree matrix. More information on the ecoinvent pedigree matrix can be found on page 76 of the ecoinvent 3 Overview and Methodology document (B. P. Weidema et al., 2013).
A.2 Institute for Environment and Sustainability (ILCD format)
ILCD supports a dual approach to data quality. The first addressing data quality through data quality indicators and the second addressing the indirect aspects of data quality, such as documentation, review level and consistent nomenclature. The ILCD recommends the use of six data quality indicators: technological representativeness, geographical representativeness, time related representativeness, completeness, precision/uncertainty and methodological appropriateness and consistency. ILCD outlines specific criteria for each of the indicators. Users then numerically rank each category on a 1-5 scale based on how well the data fits the criteria laid out in the ILCD handbook. ILCD also allows for the use of a “0 “for criteria that are not applicable. Then to aggregate data into a single data quality rating, ILCD uses the following equation.
𝐷𝐷𝐷𝐷𝐷𝐷 =𝑇𝑇𝑇𝑇𝐷𝐷 + 𝐺𝐺𝐷𝐷 + 𝑇𝑇𝑇𝑇𝐷𝐷 + 𝐶𝐶 + 𝑃𝑃 + 𝑀𝑀 + 𝑋𝑋𝑤𝑤 ∗ 4
𝑇𝑇 + 4
TeR = Technological representativeness
GR = Geographical representativeness
TiR = Time-related representativeness
C = Completeness
P = Precision/uncertainty
M = methodological appropriateness and consistency
Xw = weakest quality level obtained
i = number of applicable indicators (indicators not equal to 0)
Based on the numerical value obtained from the above equation, data is classified as either High quality (≤ 1.6), Basic quality (>1.6 to ≤3), or Data estimate (>3 to ≤4) (European Commission, 2010).
A.3 National Energy Technology Laboratory (NETL)
NETL currently uses a 1-5 pedigree matrix adapted from Wiedema 1996, which addresses seven indicators: source reliability, completeness, temporal correlation, geographical correlation, technological
36
correlation, uncertainty correlation and precision correlation (B. Weidema & Wesnaes, 1996). NETL also provides information on the completeness of unit processes in their documentation.
A.4 United States Department of Agriculture (USDA)
The USDA has developed and supported pass fail DQS that can be applied at the flow level. This DQS differs in that instead of a graded 1-5 scale there is a criteria statement for each of the seven indicators: reliability and reproducibility, flow data completeness, temporal coverage, geographical coverage, technological coverage, uncertainty and precision. If the indicators meet the criteria they receive an “A” and if they fail a “B”. The bases for this scale is to simplify data quality scoring and to improve reproducibility (Cooper & Kahn, 2012).

37
Office of Research and Development (8101R) Washington, DC 20460
Offal Business Penalty for Private Use $300
PRESORTED STANDARD POSTAGE
& FEES PAID EPA PERMIT NO. G-35