Embed Size (px)
Citation preview

Capacity assessment and planning guidance document
EUROCONTROL
Edition: 2.8Edition date: 09/04/2013
Network Managernominated by the European Commission

CAPACITY ASSESSMENT & PLANNING GUIDANCE DOCUMENT
Edition 2.8 09 April 2013 - ii –
INTENTIONALLY
LEFT BLANK

CAPACITY ASSESSMENT & PLANNING GUIDANCE DOCUMENT
Edition 2.8 09 April 2013 - iii –
DOCUMENT CHARACTERISTICS
TITLE
Capacity Assessment and Planning Guidance Document
Publications Reference:
Document Identifier Edition Number: 2.8
Edition Date: 09 April 2013
Abstract
This document describes the European Network Management capacity planning process that supports local and network ATC capacity planning for enroute airspace and identifies the tools and methodologies used.
Keywords
Capacity Planning Performance Traffic Demand Capacity plans
Contact Person(s) Tel
Division
Stéphanie Vincent
Christopher Brain
+ 32 2 729 34 07
+32 2 729 39 61
DNM / COO / NOM / OPL
DNM / COO / NOM / OPL
STATUS, AUDIENCE AND ACCESSIBILITY
Status Intended for Accessible via
Working Draft General Public Intranet
Draft Operational Stakeholders Extranet
Proposed Issue Restricted Audience Internet
(www.eurocontrol.int)
Released Issue

Document Control
AUTHORITY
DATE
SIGNATURE
Head DNM/NOS/OPL
R Bucuroiu
6 June 2013
Edition History
Edition No.
Issue Date
Author
1
September 2007
G Heath
2 April 2013 C. Brain S. Vincent
© 2013 European Organisation for the Safety of Air Navigation (EUROCONTROL). All rights reserved. No part of this publication may be reproduced, stored in a retrieval system, or transmitted in any form or by any means, electronic, mechanical, photocopying, recording or otherwise, without the prior written permission of EUROCONTROL.
CAPACITY ASSESSMENT & PLANNING GUIDANCE DOCUMENT
Edition 2.8 09 April 2013 - iv –
CAPACITY ASSESSMENT & PLANNING GUIDANCE DOCUMENT
Edition 2.8 09 April 2013 - v –
DOCUMENT CHANGE RECORD The following table records the complete history of the successive editions of the present
document.
EDITION
NUMBER
EDITION
DATE REASON FOR CHANGE
CHAPTERS
AFFECTED
2.1 14/01/2013 First working draft All
2.2 25/01/2013 Insertion of new performance scheme All
2.3 01/02/2013 Update of the capacity planning process All
2.4 15/02/2013 Inclusion of Annexes Annexes
2.5 22/02/2013 First unit review All
2.6 05/03/2013 Second unit review All
2.7 07/03/2013 Proposed version for CPSG All
2.8 09/04/2013 Update following CPSG review
Version approved by NMB 06/06/2013
Para 1.3 7.3 10
All
Publications
EUROCONTROL Headquarters
96 Rue de la Fusée
B-1130 BRUSSELS
Tel: +32 (0)2 729 1152
Fax: +32 (0)2 729 5149

CAPACITY ASSESSMENT & PLANNING GUIDANCE DOCUMENT
Edition 2.8 09 April 2013 - vi –
E-mail: [email protected]
CHECKLIST Paragraph Date Paragraph Date
Chapter 1 7.4 07 March 2013
1.1 07 March 2013 7.5 07 March 2013
1.2 07 March 2013
1.3 09 April 2013 Chapter 8
8.1 07 March 2013
Chapter 2 8.2 07 March 2013
07 March 2013 8.3 07 March 2013
8.4 07 March 2013
Chapter 3
3.1 07 March 2013 Chapter 9
3.2 07 March 2013 9.1 07 March 2013
3.3 07 March 2013 9.2 07 March 2013
3.4 07 March 2013 9.3 07 March 2013
Chapter 4 Chapter 10
4.1 07 March 2013 10.1 09 April 2013
4.2 07 March 2013 10.2 09 April 2013
Chapter 5 Annex A 07 March 2013
5.1 07 March 2013 Annex B 07 March 2013
5.2 07 March 2013 Annex C 07 March 2013
5.3 07 March 2013 Annex D 07 March 2013
Annex E 07 March 2013
Chapter 6 Annex F 07 March 2013
6.1 07 March 2013
6.2 07 March 2013
6.3 07 March 2013
6.4 07 March 2013
Chapter 7
7.1 07 March 2013
7.2 07 March 2013
7.3 09 April 2013

CAPACITY ASSESSMENT & PLANNING GUIDANCE DOCUMENT
Edition 2.8 09 April 2013 - vii –
Contents
1 INTRODUCTION.....................................................................................................1
1.1 Document Scope............................................................................................................1
1.2 History and Evolution ....................................................................................................1
1.3 Capacity Assessment and Planning Scope.................................................................2
2 PERFORMANCE DRIVEN PROCESS AT NETWORK LEVEL..............................4
3 SES II PERFORMANCE SCHEME.........................................................................5
3.1 Capacity Indicators and Target.....................................................................................5
3.2 NOP and SES II...............................................................................................................5
3.3 SES Performance Scheme and Network Manager Capacity Planning......................6
3.4 Effective Capacity ..........................................................................................................6
4 CAPACITY ASSESSMENT AND PLANNING PROCESS......................................7
4.1 Overview .........................................................................................................................7
4.2 Process ...........................................................................................................................7
5 ASSESSMENT OF CURRENT CAPACITY - ACC CAPACITY BASELINE...........9
5.1 Reverse CASA: for ACCs with a Capacity Shortfall ...................................................9
5.2 ACCESS: for ACCs with No Capacity Shortfall .........................................................11
5.3 Network Operations Report (NOR) .............................................................................13
6 FUTURE TRAFFIC DEMAND AND DISTRIBUTION............................................14
6.1 Forecast Traffic Demand per ACC..............................................................................14
6.2 Forecast Traffic Growth...............................................................................................15
6.3 Flight Increase Process (FIPS) and Airport Capacity Constraints ..........................15
CAPACITY ASSESSMENT & PLANNING GUIDANCE DOCUMENT
Edition 2.8 09 April 2013 - viii –
6.4 Future Route Network Evolution and Traffic Distribution........................................16
7 FUTURE CAPACITY REQUIREMENT PROFILES AND DELAY BREAKDOWN
PER ACC.....................................................................................................................18
7.1 Overview .......................................................................................................................18
7.2 System Wide Cost Optimum Capacity .......................................................................18
7.3 Cost of Delay and Cost of Capacity ...........................................................................20
7.4 Calculation of the Required Capacity Profiles and Delay Breakdown....................20
7.5 Impact of the Parameters ............................................................................................22
8 PLANS, FORECASTS AND IMPLEMENTATION ACTIONS ...............................24
8.1 Local Capacity Plans ...................................................................................................24
8.2 Performance Delay Forecast.......................................................................................25
8.3 Improvement Actions and Support ............................................................................25
8.4 Network Operations Plan ............................................................................................26
9 CAPACITY PLANNING SCHEDULE AND TOOLS..............................................27
9.1 Schedule and Work Programme.................................................................................27
9.2 Capacity Planning Sub Group ....................................................................................28
9.3 Tools..............................................................................................................................28
10 WAY FORWARD...............................................................................................31
10.1 Future Evolution of the Methodology.....................................................................31
10.2 Performance Scheme...............................................................................................31
ANNEX A. COMMONLY UNDERSTOOD DEFINITIONS.......................................32
ANNEX B. ADDITIONAL CAPACITY METHODOLOGY - FACET ...........................33

CAPACITY ASSESSMENT & PLANNING GUIDANCE DOCUMENT
Edition 2.8 09 April 2013 - ix –
ANNEX C. CAPACITY PLANNING PROCESS AT ACC LEVEL...........................34
ANNEX D. NOP CONTENT....................................................................................35
ANNEX E. CAPACITY DRIVERS...........................................................................37
ANNEX F. LIST OF ACRONYMS ..........................................................................38

CAPACITY ASSESSMENT & PLANNING GUIDANCE DOCUMENT
Edition 2.8 09 April 2013 - x –
Table of Figures
Figure 1Capacity Assessment and Planning Scope ...................................................................3
Figure 2 Annual Capacity Planning Process...............................................................................8
Figure 3 CASA Simulation Process ..........................................................................................10
Figure 4 Reverse CASA Iterative ATFM Simulation .................................................................10
Figure 5 Network effect.............................................................................................................11
Figure 6 ACCESS Process .......................................................................................................12
Figure 7 Example ACCESS Required Data..............................................................................12
Figure 8 Assessment of Forecast Demand per ACC- Process.................................................14
Figure 9 FIPS Process..............................................................................................................16
Figure 10 Capacity-related costs ..............................................................................................18
Figure 11 Operating Point vs Optimum.....................................................................................19
Figure 12 Capacity Requirements and Delay Breakdown Process ..........................................21
Figure 13 Iterative MECA Network Simulations........................................................................21
Figure 14 Current vs Target Capacity.......................................................................................22
Figure 15 CASA Process (Delay Forecast) ..............................................................................25
Figure 16 Cyclical Work Programme ........................................................................................28
CAPACITY ASSESSMENT & PLANNING GUIDANCE DOCUMENT
Edition 2.8 09 April 2013 - 1 –
1 Introduction
1.1 Document Scope This document describes the European Network Management capacity planning process that supports local and network ATC capacity planning for enroute airspace and identifies the tools and methodologies used. This document is an update of Edition 1 published in September 2007.
1.2 History and Evolution In the late nineties, the most pressing problem facing European Air Traffic Management (ATM) was to provide sufficient capacity to meet constantly growing air traffic demand whilst improving safety and containing costs. Capacity provision in Europe lagged behind the ever-increasing demand, causing excessive Air Traffic Flow Management (ATFM) delays.
This highlighted the need to improve capacity planning at European ATM network level, and led to the EUROCONTROL Provisional Council agreeing in 1999 to implement a capacity planning process at ECAC (European Civil Aviation Conference) network level, involving States, Air Navigation Service Providers (ANSPs), airspace users and military organisations. As a result the EUROCONTROL Capacity Enhancement Function (CEF) was created in 2000 to provide a single point of coordination for all Agency actions aimed at the timely delivery of sufficient ATM capacity to meet medium term air traffic demand in Europe. The CEF introduced a fully consultative, interactive and cohesive planning methodology, taking into account the whole European ATM network.
Between 1999 and 2012, traffic increased by 20%, while the effective capacity of the network increased by 59%. En-route delay per flight decreased from 4.51 minutes per flight in 1999 to 0.63 minutes per flight in 2012.
This achievement was due to the measures put in place by individual ANSPs and collectively at network level, under the coordination of EUROCONTROL. The coordinated approach to European-wide capacity planning has led to a focus on capacity enhancement across Europe, with active participation of all stakeholders and a performance-driven approach towards ATM planning.
The first part of the decade saw strong annual growth in demand, putting high pressure on the ATM system, but at the same time providing ANSPs with the incentive and the income to invest in and plan long-term capacity enhancement measures such as improved ATM systems and Air Traffic Controller training.
Unfortunately, the subsequent recession that began in 2008, which should have provided an opportunity to close the remaining capacity gap in some ACCs in Europe, resulted in a reduction in revenue for ANSPs leading to the postponement of some long-term capacity enhancement initiatives. At the same time the demands of airspace users moved from capacity to flight efficiency. However, the on-going shortage of available Air Traffic Controllers, severe weather and widespread social unrest towards the end of the decade, resulted in the operation of less-than-optimum sector configurations, together with an increase in ATFM delay in some areas.
In 2010 as part of the the EU/EC Single European Sky (SES) II initiave, EC Regulation (EU) No 691/2010 of 29 July, layed down a performance scheme for air navigation services and network functions, including the adoption of Key Performance Indicators (KPIs) which included capacity. The Commission Decision of 21 February 2011 set European Union-wide performance targets including a capacity target to be achieved by Member States by 2014. This target was also endorsed by the EUROCONTROL Provisional Council in May 2011 for application across Member States.

CAPACITY ASSESSMENT & PLANNING GUIDANCE DOCUMENT
Edition 2.8 09 April 2013 - 2 –
Within the framework of SES II the EUROCONTROL Agency is now conducting planning and management of the European ATM Network, following its designation by the EC as the Network Manager (NM). Commission Regulation (EU) No 677/2011 of 7 July 2011 lays down detailed rules for the implementation of ATM network functions, details the tasks of the Network Manager, describes the Network Operations Plan including what the Network Manager shall provide, inter alia, in the context of the Network Operations Plan:
Overall network capacity requirements;
Local capacity requirements;
Local capacity baselines;
Local delay targets.
All above are key elements of the capacity planning process of the Network Manager.
As a consequence the European capacity assessment and planning process, along with the necessary operational coordination is a key enabler for the achievement of the objectives set out in (EU) No 677/2011 and (EU) No 691/2010.
The Network Manager produces a Network Strategic Plan (NSP) and a Network Operations Plan (NOP) that is published annually. The European capacity planning process provides a major contribution to the content of the NOP. This contribution takes the form of future traffic demand at ACC level, individual ACC capacity requirement profiles, planned ACC capacity enhancement measures, ACC delay breakdown and a delay forecast. This input also takes into consideration the SES Performance Scheme and associated capacity targets. The NOP is approved by the Network Management Board.
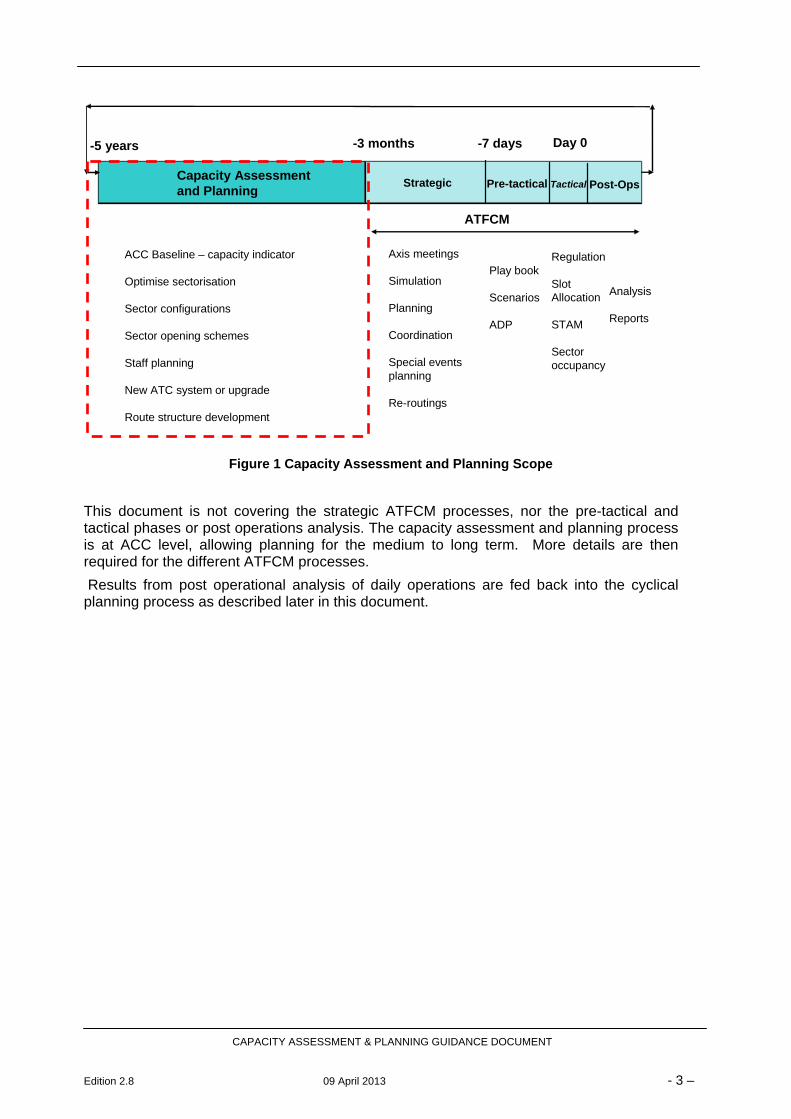
1.3 Capacity Assessment and Planning Scope This document is covering the capacity assessment and planning process. It is taking a medium to long term view of the capacities and capabilities of ACCs, typically from three months from the day of operation up to five years into the future. It enables the identification of capacity short falls or potential bottlenecks early on, allowing dialogue between the stakeholders concerned and from which ATFCM measures can be developed if required (see figure 1).
Day 0-7 days-3 months-5 years
ATFCM
Capacity Assessment and Planning
Play book
Scenarios
ADP
Axis meetings
Simulation
Planning
Coordination
Special eventsplanning
Re-routings
Regulation
SlotAllocation
STAM
Sectoroccupancy
ACC Baseline – capacity indicator
Optimise sectorisation
Sector configurations
Sector opening schemes
Staff planning
New ATC system or upgrade
Route structure development
Analysis
Reports
Post-OpsPre-tacticalStrategic Tactical
Figure 1 Capacity Assessment and Planning Scope
This document is not covering the strategic ATFCM processes, nor the pre-tactical and tactical phases or post operations analysis. The capacity assessment and planning process is at ACC level, allowing planning for the medium to long term. More details are then required for the different ATFCM processes.
Results from post operational analysis of daily operations are fed back into the cyclical planning process as described later in this document.
CAPACITY ASSESSMENT & PLANNING GUIDANCE DOCUMENT
Edition 2.8 09 April 2013 - 3 –

CAPACITY ASSESSMENT & PLANNING GUIDANCE DOCUMENT
Edition 2.8 09 April 2013 - 4 –
2 Performance Driven Process at Network Level In April 2001, the 10th meeting of the EUROCONTROL Provisional Council endorsed an overall ATM network target to reduce progressively to a cost-optimum average enroute ATFM delay target of one minute per flight by summer 2006, as a basis for the cooperative planning and capacity provision.
This European network capacity target was not achieved and it was re-affirmed in 2007 by the 27th meeting of the Provisional Council as the capacity target for the medium term. Meanwhile in order to assist the process the network capacity target was translated into local capacity requirements for Area Control Centres (ACCs).
From 2007 to 2010 the target was never reached. There were a number of factors for this level of delay including industrial action by controllers, short falls of controllers, social unrest, low sector capacities, not optimum sector configurations, airspace design and system issues.
In 2010 the EU/EC Single European Sky (SES) II initiave put priority on improving the overall network performance and highlighted the need for action. SES II provided a performance-based regulatory pillar comprising the EU-wide Performance Scheme with Key Performance Areas (KPA) one of which was capacity.
The Performance Scheme (Commission Regulation (EU) N° 691/2010) and the adoption by the European Commission of EU-wide performance targets for Reference Period 1 (RP1) 2012-2014 (Commission Decision of 22-02-2011), in areas of cost-efficiency, capacity and environment were key steps in the implementation of a performance-driven process.
In May 2011 the PC of EUROCONTROL agreed to align its capacity target for its Members States with those of the SES II performance scheme.
It is expected that the future Reference Period 2 (RP2) 2015 to 2019 will continue to maintain capacity targets for enroute operations and perhaps extend targets to airport operations based on ATFM delay. RP2 targets and indicators will be agreed during 2013.
CAPACITY ASSESSMENT & PLANNING GUIDANCE DOCUMENT
Edition 2.8 09 April 2013 - 5 –
3 SES II Performance Scheme
3.1 Capacity Indicators and Target The EC Regulation (EU) No 691/2010 of 29 July 2010 lays down a performance scheme for air navigation services and network functions and amends Regulation (EC) No 2096/2005 laying down common requirements. In addition Commission Decision of 21 February 2011 sets the European Union-wide performance targets.
For the first reference period from 2012 to 2014, the capacity indicator was set as follows:
The European Union-wide capacity KPI shall be the minutes of en route ATFM (Air Traffic Flow Management) delay per flight, defined as follows:
(a) the en route ATFM delay is the delay calculated by the central unit of ATFM as defined in Commission Regulation (EU) No 255/2010 of 25 March 2010 laying down common rules on air traffic flow management ( 1 ) and expressed as the difference between the take-off time requested by the aircraft operator in the last submitted flight plan and the calculated take-off time allocated by the central unit of ATFM
(b) the indicator includes all IFR flights within European airspace and covers ATFM delay causes
(c) the indicator is calculated for the whole calendar year
For the performance reference period starting on 1 January 2012 and ending on 31 December 2014, the European Union-wide performance target for capacity is as follows:
Capacity target: an improvement of the average en route Air Traffic Flow Management (ATFM) delay so as to reach a maximum of 0.5 minute per flight in 2014;
During the same reference period the following interim targets have been recommended by the PRB
For 2012 a maximum of 0.7 minutes per flight average annual enroute ATFM delay
For 2013 a maximum of 0.6 minutes per flight average annual enroute ATFM delay
3.2 NOP and SES II The NOP is developed by the Network Manager in the context of the Network Management Functions. The Plan covers the activities planned and required to enhance European network operational performance currently over a given period of time and is updated on a yearly basis or as deemed necessary. The NOP implements, at an operational level, the Network Strategy Plan and the Network Manager Performance Plan.
The document provides a short to medium-term outlook of how the ATM Network will operate, including expected performance at network and local level. It gives details of capacity and flight efficiency enhancement measures planned at network level and by each ACC, as well as a description of the airport performance assessment and improvement measures that are planned at those airports that generate a high level of delay.
It also addresses the operational performance indicators and targets resulting from the application of the EC Regulation (EU) No 691/2010 of 29 July 2010 laying down a performance scheme for air navigation services and network. It describes the operational actions to be taken by the Network Manager and other stakeholders, needed to respond to the performance targets set for the first Reference Period (RP1). The NOP also provides both a qualitative and quantitative assessment of the impact of these actions on the performance of the European

CAPACITY ASSESSMENT & PLANNING GUIDANCE DOCUMENT
Edition 2.8 09 April 2013 - 6 –
ATM network.
As a requirement of the Network Management Implementing Rule (Article 6 and Annex V), the development of the NOP, together with the implementation of cooperative decision making processes and improved information management, will ensure better use of the capacity available on the Network and improved management of both planned and unplanned events and constraints.
The scope of the NOP refers to the following main subjects:
o Airspace structure enhancement;
o ACC capacity enhancement;
o Air Traffic Flow and Capacity Management;
o Airport efficiency enhancement.
3.3 SES Performance Scheme and Network Manager Capacity Planning
The Network Manager capacity assessment and planning process takes into consideration the actions to be taken by the Network Manager and other operational stakeholders needed to respond to the performance targets set. The delay breakdown per ACC resulting from the application of the annual targets has been provided to ANSPs and NSAs as a reference value in the preparation of performance plans required for the Performance Scheme. It should also be noted that in order to assess the consistency between EU wide and National or Functional Airspace Block performance capacity targets the EC uses the following assessment criteria as stated in EC Regulation (EU) No 691/2010 Annex III
At Delay level: Comparison of the expected level of en route ATFM delay used in the performance plans with a reference value provided by the capacity planning process of Eurocontrol
3.4 Effective Capacity The Performance Review Commission (PRC) in its annual Performance Review Reports (PRRs) uses the term effective capacity when quantifying capacity at European level. “Effective capacity” is defined as the traffic volume that the ATM system could handle with a certain level of average enroute ATFM delay. This capacity indicator is derived from a linear relationship between delay variation and traffic variation (see PRR 5 2001, Annex 6).The indicator is used in comparing the evolution of effective capacity and air traffic demand over periods of time.

CAPACITY ASSESSMENT & PLANNING GUIDANCE DOCUMENT
Edition 2.8 09 April 2013 - 7 –
4 Capacity Assessment and Planning Process
4.1 Overview To support ANSPs in their local capacity planning, the Network Manager makes an annual assessment of the capacity delivered and of the capacity required in the medium term (the coming five years) at network level and individually for ACCs within the ECAC area, taking into account the agreed European delay target, the traffic forecast, the expected traffic distribution over the route network and the balance between cost of delay and cost of air navigation service provision.
A range of five-year enroute capacity requirement profiles for ACCs are calculated, following the update of the EUROCONTROL Statistical Forecasting service (STATFOR) 7-year medium-term traffic forecast. These profiles are used by ANSPs as a basis for cooperative planning and provision of capacity into the medium-term, and are based on the following planning assumptions:
Achieving and maintaining the SES II Performance Scheme and Provisional council annual capacity targets
Accommodating future traffic growth as forecasted in the most recent STATFOR medium-term forecast
Traffic routeing via the shortest routes available on the future Air Traffic Services (ATS) route network, with generally unconstrained vertical profiles
4.2 Process The annual capacity planning process of the Network Manager, starting in summer and terminating the following spring, comprises a number of steps, based on a collaborative process with ANSPs (see figure 2) and is described in the following chapters of this document :
Step 1 – Evaluate performance for the summer season – establish a capacity baseline for each ACC – Details in Chapter 5
Step 2 – Provide future traffic demand and distribution - Details in Chapter 6
Step 3 – Provide future capacity requirement profiles and delay breakdown per ACC (according to European targets) – Details in Chapter 7
Step 4 – Provide support to ANSPs to develop local capacity plans – Details in Chapter 8
Step 5 – Consolidate the capacity plans in the NOP – Details in Chapter 8
Step 6 – Provide a network and local delay forecast, summer and year – Details in Chapter 8
Step 7 – Identify capacity bottlenecks and propose improvement actions/support - Details in Chapter 8
Step 8 – Revise capacity plans and update the network and local delay forecast if necessary - Details in Chapter 8

Traffic & Delay statisticsSector capacity,
configuration and opening scheme data
STATFOR ForecastUser Demand
Airport CapacityPlans
Current Situation Analysis
Assessment of Future ACC Capacity Requirement
Profiles & Delay breakdown
Implementation Actions
Capacity PlanningMeetings
ANSP Plans
ACC Capacity Baselines
SES Performance Capacity TargetACC Capacity Baselines o
Forecast Traffic Demand and
Distribution per ACC
Traffic Forecast
NEST/SAAM+NEVAC Assessment
NetworkOperations Plan
(The NOP)
PAST PERFORMANCE
FUTURE OUTLOOK
EuropeanRoute Network Improvement Plan (output from Route Network Development Sub-Group - RNDSG)Airport Capacities
Network Operations (end of year)Report
Transition Plan
LSSIP: Local 5 year ANSP
Capacity Plans
Network Delay
Forecast
(the NOR)
Figure 2 Annual Capacity Planning Process
A reference capacity requirement profile (linked to the baseline STATFOR medium-term traffic forecast and the shortest routes available on the network) is established for each ACC. Alternative scenarios based on high and low traffic growth on shortest routes and baseline traffic growth distributed on the current route network is provided to support ANSPs in an interactive and flexible planning of ATM capacity and to better reflect local conditions. Support is given, from a network perspective, to enable ANSPs to determine which scenario would best match their local conditions.
The inter-dependencies at network level are extremely high in Europe and the capacity planning process helps to ensure that integrated plans are developed locally and at network level. This enhances and makes the best use of the European ATM capacity, in a cost-effective manner.
Capacity requirements, annual and forthcoming summer delay breakdown, forecasts and plans are published in the Network Operations Plan at the start of each year and updated as required. The five year capacity plans published in the framework of the Local Single Sky Implementation Plan (LSSIP) are also derived from this process and are consistent with those of the NOP.
Capacity plans mainly focus on the summer season as it is the busiest period in Europe with more delays. For Winter, individual ANSP transition plans are analysed and coordinated to ensure minimum effect on Network operations from temporary capacity reductions due to implementation of changes to airspace, routes, sectorisation and ATC systems, which frequently occur during the winter period. An annual Transition Plan is published to highlight where capacity may be reduced according to ANSP transition plans or where there may be a resultant effect on the Network.
CAPACITY ASSESSMENT & PLANNING GUIDANCE DOCUMENT
Edition 2.8 09 April 2013 - 8 –

CAPACITY ASSESSMENT & PLANNING GUIDANCE DOCUMENT
Edition 2.8 09 April 2013 - 9 –
5 Assessment of Current Capacity - ACC Capacity Baseline
There are two ways to consider ACC measured capacity as follows:
- Offered capacity is the capacity that was actually delivered during the measured period; it is not possible to determine whether any spare capacity was available.
- Potential capacity is the maximum capacity that could have been delivered during the measured period, considering the number and capacity of operational ATC sectors, maximum controller availability and the ATM system and infrastructure capability.
For an ACC that generates a significant amount of ATFM delay, the offered and potential capacity will be the same – i.e. the capacity offered is the maximum capacity that is available. However, for an ACC that does not generate delay, the potential capacity may be significantly higher than the offered capacity e.g. when demand is low.
For capacity planning purposes, it is always the offered capacity which is measured. This ensures consistency with future capacity requirements, addressing the level of capacity which actually needs to be delivered. The method to calculate potential capacity, FACET, is presented in Annex B.
For delay producing ACCs, the most accurate capacity baseline measurement is made using Reverse CASA (Computer Assisted Slot Algorithm) methodology. ACCESS plus Reverse CASA methodology enables the capacity of non delay-producing ACCs to be measured using the same methodology, ensuring consistency year after year.
5.1 Reverse CASA: for ACCs with a Capacity Shortfall The estimation of ACC capacity with Reverse CASA is based on an analysis of the ATFM delays observed during the analysis period.
The capacity measurement is made on a daily basis over two AIRAC cycles during the Summer season, excluding delays for weather, disruptions, special events etc. The aim is to estimate capacity based on delays representative of the Summer period, excluding any exceptional circumstances. The result is not presented as the maximum capacity, but as the average capacity which can be delivered on a regular basis.
Reverse CASA: The process
For any given day, the Network Manager Operations Centre (NMOC) archive data includes the filed flight plans used by NMOC, the regulations in force and the resulting ATFM delays.
The objective is to determine the equivalent ACC ‘observed’ capacity i.e. the number of aircraft that would need to pass through the ACC to generate the same ATFM delay as was actually observed. In flow management terms it is as if the ACC is regulated by a single regulation over the whole ACC.
Delays can be calculated with a CASA simulation, building a slot list for each regulation, placing the flights on the slots, attributing delays on flights when necessary, including network effects.

Build the slot lists for each regulation
Placement of the flights on the slots
Traffic
Build slot list for each regulationPlacement of the flights on the slotsDelay flights in case of capacity overload
CASAslots allocated
to flights(CTOTs)
Actual delay observedper ACC
Figure 3 CASA Simulation Process
This algorithm cannot simply be employed using an inverse function i.e. given delay figures it cannot provide capacity values. Hence for each ACC it is necessary to have an iterative process, considering the delay which would have been observed for a hypothetical estimate of capacity.
The calculated delay is compared to that which was observed and an iterative modification cycle commences until the CASA determined delay within a particular ACC for an estimated value of capacity converges to that observed for the day in question. This methodology is referred to as Reverse CASA.
Estimate and re-estimateACC Capacity
Build the slot lists for each regulation
Placement of the flights on the slots
Traffic
CalculatedACC Delay
CAPACITY ASSESSMENT & PLANNING GUIDANCE DOCUMENT
Edition 2.8 09 April 2013 - 10 –
ObservedACC Capacity
Calculated delay =actual delay?
Build slot list for each regulationPlacement of the flights on the slotsDelay flights in case of capacity overload
CASA
Reverse CASA
No
Yes
Figure 4 Reverse CASA Iterative ATFM Simulation

When performing this iterative analysis, it is necessary to consider the ATM system as a network. The process recognises the interaction between the capacity and demand for each ACC and the observed delay in other ACCs. When the correct delay has been found for a given ACC, the process of changing the estimated capacity in another ACC may affect the newly observed delay in the previously correct ACC – the so-called network effect (See Figure 4). Hence the iteration is performed simultaneously for all ACCs and only when each ACC gives the same calculated delay as that observed, is the process terminated.
CAPACITY ASSESSMENT & PLANNING GUIDANCE DOCUMENT
Edition 2.8 09 April 2013 - 11 –
capacities
155
75
delays
800
700
capacities
155
75
delays
800
700
capacities
150
75
delays
1000mins
600mins
ACC1
ACC2
capacities
150
75
delays
1000mins
600mins
ACC1
ACC2
ACC2 was protected byACC1
Figure 5 Network effect
This iterative convergence process within the network can typically be in the order of several hundred ATFM simulations.
The Reverse CASA method provides an accurate estimate of ACC capacity only for ACCs generating a certain level of delay during the reference period. However, for the medium term planning exercise, it is necessary to assess the baseline capacity of all ACCs.
5.2 ACCESS: for ACCs with No Capacity Shortfall The ACCESS methodology was developed to enable the capacity baseline of non-delay-producing ACCs to be measured using Reverse CASA, allowing for more consistency between the ACCs and the different measured periods.
To use Reverse CASA a non delay-producing ACC must be placed in traffic conditions where it produces delay. Therefore to determine the ACCESS capacity indicator for each ACC on a daily basis, traffic is homogenously increased over the whole ECAC area until the delay threshold is reached in the studied ACC.
At each step of the traffic increases, ACCESS creates a new regulation scheme for the studied ACC. This is done using actual traffic volume capacities and configuration data (sector opening schemes) provided by ANSPs for an agreed period, normally for the last two weeks of July. Every time an open sector is reaching its capacity limits for a period of time, a regulation is created (regulation scheme builder).
The ACCESS delay threshold for the studied ACC is set at 0.2 minutes of average delay per flight - a value which through experience has provided stable results, and is sufficient to launch Reverse CASA. When this value is exceeded the process of traffic increase and building of regulations is stopped. The corresponding delay for the ACC, and the level of traffic after increase are used for the Reverse CASA Process to calculate the ACC capacity baseline indicator.
Please note that if the traffic increase exceeds 30% without causing delay at the ACC then the process is stopped without giving any result. In this case, the capacity available in the ACC is

at least 30% higher than the current demand and there is no capacity issue in the ACC.
Original Traffic + Opening scheme + TV capacities
CAPACITY ASSESSMENT & PLANNING GUIDANCE DOCUMENT
Edition 2.8 09 April 2013 - 12 –
AC
CE
SS
Original Traffic + Opening scheme + TV capacities
Regulation Scheme Builder
Traffic increase
CASA
ACC Delay > 0.2NO
YES
ACC capacity baseline
REVERSE CASA
Increased traffic + Delays
AC
CE
SS
AC
CE
SS
Regulation Scheme Builder
Traffic increase
CASA
ACC Delay > 0.2NO
YES
ACC capacity baseline
REVERSE CASA
Increased traffic + Delays
ACC capacity baseline
REVERSE CASA
Increased traffic + Delays
Figure 6 ACCESS Process
It is important to note that ACCESS gives good results only when the input data (declared sector capacities and configuration opening schemes) are accurate and
complete.
The achievement of reliable results using the ACCESS methodology requires high quality input data on actual opening schemes and sector capacities during the stated period. It is essential that the ANSPs ensure that a process is in place at the ACC, to collect data of the required standard for each day of the reference period.
These scenarios can then be exported in an Excel file and sent to the team by email. Preferred formats are either NEST import/export format, or an Excel spreadsheet giving all details of sectors open (see the example below).
Date ACC Description TV NAME OPEN CLOSE CAPACITY14-Jul-12 ACC1 Conf1 TV1 00:00 09:59 4014-Jul-12 ACC1 Conf2 TV2 10:00 13:59 4214-Jul-12 ACC1 Conf2 TV3 10:00 13:59 4514-Jul-12 ACC1 Conf1 TV1 14:00 23:59 4015-Jul-12 ACC1 Conf1 TV1 00:00 09:59 4015-Jul-12 ACC1 Conf2 TV2 10:00 13:59 4215-Jul-12 ACC1 Conf2 TV3 10:00 13:59 4515-Jul-12 ACC1 Conf1 TV1 14:00 23:59 40
Figure 7 Example ACCESS Required Data

CAPACITY ASSESSMENT & PLANNING GUIDANCE DOCUMENT
Edition 2.8 09 April 2013 - 13 –
5.3 Network Operations Report (NOR) The annual NOR, published in March each year and produced by the Network Manager provides a detailed overview and analysis of the performance of the European ATM network from the previous calendar year. The report contains the following:
a network overview,
a performance analysis,
an airspace users view and
ATFM IR compliance overview and
conclusions.
An assessment is made for each ACC individually, and the ACC capacity baselines are published in the NOR, providing important input to the performance analysis.
The Network Manager also provides data on the sectors causing most delay and makes an assessment of bottleneck areas. The Network Strategic Tool (NEST) can be used to identify the most saturated sector and quantify the shortfall.

6 Future Traffic Demand and Distribution
6.1 Forecast Traffic Demand per ACC Medium term capacity requirements at ACC level can only be assessed once a picture of the expected traffic volume and distribution over the future route network is established.
The expected forecast traffic demand at an ACC is based on the following:
The forecast traffic growth, established by the STATFOR process - at Origin/Destination Zone (ODZ) level
The traffic distribution on routes : either the shortest routes available on the future route network or keeping the current traffic distribution
Airport capacity constraints, based on current and planned airport capacities
The expected traffic demand per ACC can be simulated by the Network Strategic Tool (NEST) supported by the Demand Data Depository 2 (DDR2).
current route
Future trafficdemand
Future trafficdemand
Forecast traffic demand per ACC
Current traffic demandCurrent traffic demand
Flight Increase Process (FIPS)Airport
capacities current/future
STATFOR forecasts
shortestroute
Future routes&
airspace environments
NEST+DDR2
Figure 8 Assessment of Forecast Demand per ACC- Process
CAPACITY ASSESSMENT & PLANNING GUIDANCE DOCUMENT
Edition 2.8 09 April 2013 - 14 –
CAPACITY ASSESSMENT & PLANNING GUIDANCE DOCUMENT
Edition 2.8 09 April 2013 - 15 –
6.2 Forecast Traffic Growth The EUROCONTROL Statistical Forecasting service (STATFOR) processes air traffic statistics at European and regional level, from NMOC and EUROCONTROL’s Central Route Charges Office (CRCO) data, and produces traffic forecasts. These forecasts take into account different sets of assumptions, e.g. economic growth, airline productivity, competition from other means of transport, as well as the ‘maximum aircraft movements per year’ at congested airports.
The STATFOR medium term traffic forecasts are based on “traffic flows” between numbers of Origin/Destination Zones (ODZ). An ODZ corresponds to a major airport or group of airports. STATFOR provides traffic growth forecasts between all ODZ pairs (approximately 100 individual ODZ pairs giving around 9000 individual flows).
The 7-year Medium Term Forecast (MTF) produced by STATFOR is used for capacity planning purposes.
6.3 Flight Increase Process (FIPS) and Airport Capacity Constraints The traffic increase is made by FIPS according to the STATFOR MTF at ODZ level, by “cloning” existing flights in such a way as to preserve the daily demand distribution. This is based on the hypothesis that the existing demand distribution represents the desired exploitation (in time) of the various markets served by the airspace users. New flights are added based on each individual ODZ pair growth that is expected.
STATFOR takes into account the most congested airports in its forecast at yearly level, through the ‘maximum aircraft movements per year’. It is also important to take hourly airport constraints into account, to ensure that the future traffic sample will stay realistic.
Valid information on airport capacity, current and planned, is essential for planning the development of the European Network. This data is derived from the EUROCONTROL’s Directorate of Network Management (DNM) Airports Unit following consultation with ANSPs, airport operators and users.
When faced with demand which is exceeding the airport capacity constraints, the new flight can not be added during the overloaded period at the airport. FIPS will then process the data as follows:
spread peak traffic demand by shifting the creation of new flights, by up to one hour, to a non-saturated period
displace further new demand to the nearest non-saturated airport available in the same ODZ, that has been identified by the ANSP as a suitable alternative
not accommodate further new demand when no alternative airport can be identified in the same ODZ

Current Traffic Demand
STATFOR % increase per ODZ
Random Selection of a Flight to clone
Airport Hourly Capacity
Constraints
Clone the flightwithin ± 15 min
time window
Cloned Flights Future Traffic
Demand
Clone the flightwithin ± 1 hour time window
Clone another flight on the
same city pair
Clone another flight in the same ODZ
Unaccommodated Demand
Current Traffic Demand
NO
NO
NO
NO
YES
YES
YES
YES
Figure 9 FIPS Process
6.4 Future Route Network Evolution and Traffic Distribution The capacity requirement for an ACC is clearly dependent on the distribution of traffic over the European Network, horizontally and vertically. The demand to be accommodated in the future is determined, taking into account the desire of users to fly the most direct routes and optimum vertical profiles, in the context of the anticipated evolution of the route network.
Changes to the route network and traffic distribution can induce significant changes in terms of the demand (and therefore the required capacity) at individual ACCs, even during periods of limited traffic growth.
It is assumed that aircraft will follow the shortest routes available on the network between city pairs according to the future route network, on essentially unconstrained vertical profiles. Nevertheless, some existing structural traffic distribution scenarios are retained. There is no ‘dispersion’ of flights between equivalent routes between city pairs.
Traffic flows respecting these assumptions are simulated by the NEST tool, and serve as final step in the forecast demand process. The result of the NEST simulation is a horizontal and
CAPACITY ASSESSMENT & PLANNING GUIDANCE DOCUMENT
Edition 2.8 09 April 2013 - 16 –

CAPACITY ASSESSMENT & PLANNING GUIDANCE DOCUMENT
Edition 2.8 09 April 2013 - 17 –
vertical traffic distribution over the future route Network, allowing the determination of the unconstrained demand in each ACC.
NEST can also simulate the effect of aircraft operators choosing to fly the cheapest available routes, but although this information can be provided to ANSPs, it is not used in the capacity profile calculation because of the unpredictability of service provision costs beyond the short term. The transition of future demand towards shorter and cheaper routes is likely to have a significant impact in several ACCs and increased interaction with airspace users will allow a better reflection of the expected distribution of the traffic demand on the network.
7 Future Capacity Requirement Profiles and Delay Breakdown per ACC
7.1 Overview The Network Manager makes an assessment of the delay breakdown and capacity required in the medium term, individually for ACCs within the ECAC area, taking into account:
- The European delay target
- The capacity baselines per ACC
- The forecasted demand per ACC
- The balance between cost of delay and cost of air navigation service provision
The Model for Economical Evaluation of Capacities in the ATM system (MECA) is used for this purpose.
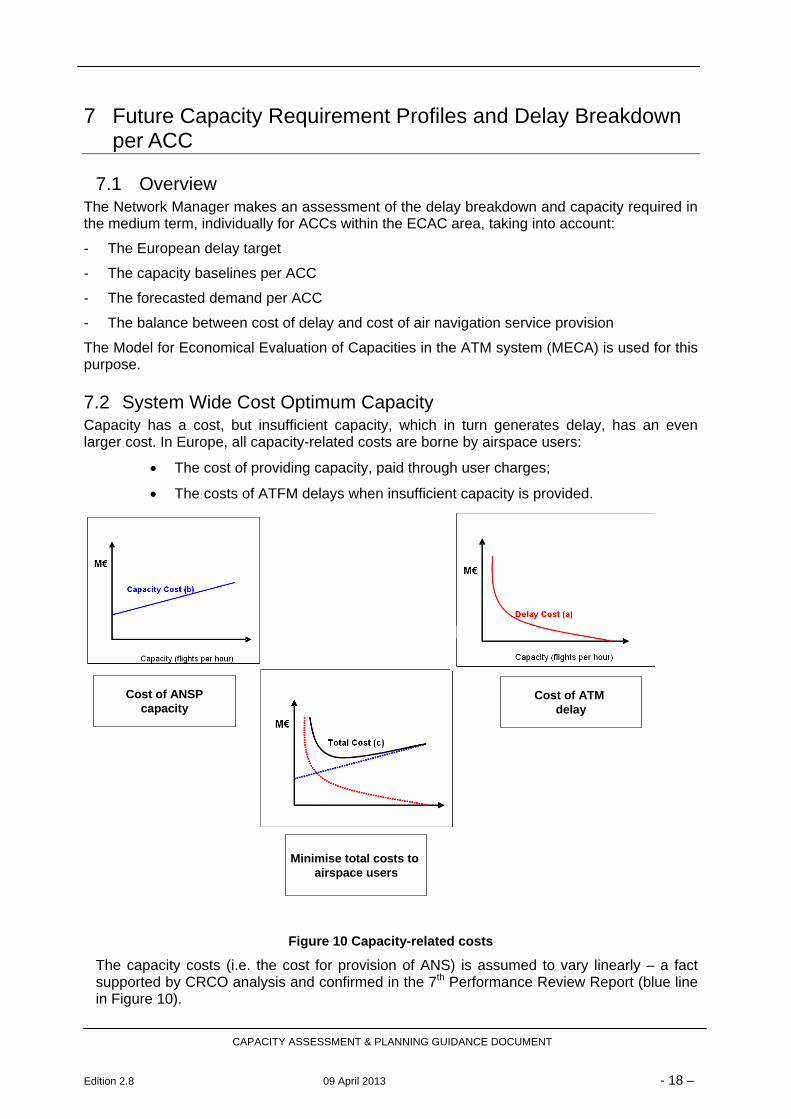
7.2 System Wide Cost Optimum Capacity Capacity has a cost, but insufficient capacity, which in turn generates delay, has an even larger cost. In Europe, all capacity-related costs are borne by airspace users:
The cost of providing capacity, paid through user charges;
The costs of ATFM delays when insufficient capacity is provided.
Cost of ANSPcapacity
Minimise total costs to airspace users
Cost of ATM delay
Figure 10 Capacity-related costs
The capacity costs (i.e. the cost for provision of ANS) is assumed to vary linearly – a fact supported by CRCO analysis and confirmed in the 7th Performance Review Report (blue line in Figure 10).
CAPACITY ASSESSMENT & PLANNING GUIDANCE DOCUMENT
Edition 2.8 09 April 2013 - 18 –

The relationship between capacity and delay is not linear. When the demand is above available capacity, there is a saturation of the ACC leading to a very sharp increase in delay. (red line in Figure 10).
Figure 11 Operating Point vs Optimum
The cost optimum is the point at which the sum of the cost of ANS capacity and the cost of delay is minimised, i.e. an increase in either element of cost will result in an overall increase in the cost of capacity. ACCs with a capacity surplus have an extra cost in capacity, whereas ACCs with capacity shortfall have an extra cost in delays (See Figure 11).
This methodology was developed in late 1990s by the Performance Review Commission.
The following parameters influence the level of the system-wide modelled cost optimum capacity:
Currently available level of capacity and traffic evolution: the system-wide modelled cost optimum delays depend on the level of capacity already available versus the traffic evolution that is expected in the future. Some ACCs in Europe currently have sufficient capacity to cover the future traffic demand, with no delays. These areas in Europe with no delay, even with future traffic demand, are lowering the system-wide modelled cost optimum delays.
Cost of capacity: The system-wide modelled cost optimum depends on the unit cost of capacity. The higher the cost of capacity, the higher the system-wide modelled cost optimum delays, as it would cost more to invest in capacity.
Cost of delays: The system-wide modelled cost optimum depends on the cost of delays. The higher the cost of delays, the lower the system-wide modelled cost optimum delays, as it would cost more to have higher levels of delays.
It has to be noted that the system-wide modelled cost optimum delays are quite stable. The three parameters influencing it are evolving towards a reduction of the system-wide modelled cost optimum delays. Studies performed in the late 1990s and in 2012 by the
CAPACITY ASSESSMENT & PLANNING GUIDANCE DOCUMENT
Edition 2.8 09 April 2013 - 19 –
CAPACITY ASSESSMENT & PLANNING GUIDANCE DOCUMENT
Edition 2.8 09 April 2013 - 20 –
PRC indicated that annual value for the system-wide modelled cost optimum delays was in 1997 around 0.3 minutes per flight going down to 0.2 minutes per flight in 2012 as a result of traffic growth, capacity increase actions, increase in cost of delay and reduction of unit costs.
7.3 Cost of Delay and Cost of Capacity Cost of delay:
The cost of delay is estimated based on a study commissioned by the EUROCONTROL PRU by the University of Westminster, UK, entitled “European airline delay cost reference values”. There are regular updates to the study. The last one, from March 2011, is giving a cost of 81 euros per minute of delay, an average estimate taking into account all delays (including reactionary delays).
Cost of capacity: The cost of capacity is based on the cost base of each ANSP (source: EUROCONTROL Central Route Charges Office). Where an ANSP is responsible for the operation of more than one ACC, either a distribution of costs between ACCs is directly provided by the ANSP, or the capacity cost is divided proportionately per ACC according to the number of sectors in each ACC.
7.4 Calculation of the Required Capacity Profiles and Delay Breakdown For each ACC a range of 5 year capacity requirement profiles are produced, along with the corresponding delay breakdown. They are calculated to ensure that the European delay target is reached, at the minimum global cost, avoiding the cost of a capacity surplus or the cost of a capacity shortfall.
MECA is calculating the capacity requirements and the delay breakdown, based on the following inputs:
- Capacity baseline: used as a starting point.
- Future traffic demand: a range of scenarios is proposed, from the low to the high STATFOR traffic forecast, with flights routed either on current routes, or on the shortest routes available on the future route network.
- European delay target: The level of delay which needs to be achieved at network level will have an impact on the capacity requirements and delay breakdown.
- Cost of capacity and cost of delays: As seen in 7.2, it is important to balance the cost of delay and the cost of capacity.
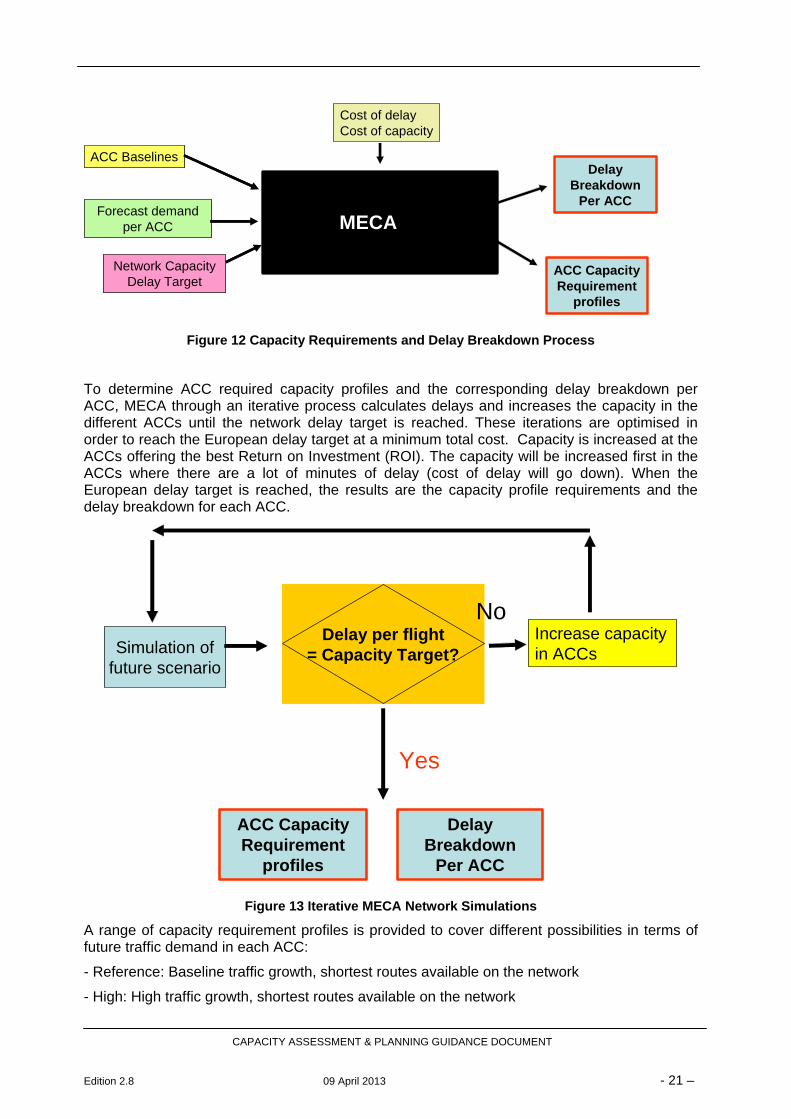
Delay Breakdown
Per ACC
ACC Capacity Requirement
profiles
MECA MECA
ACC BaselinesACC Baselines
Forecast demandper ACC
Forecast demandper ACC
Network Capacity Delay Target
Network Capacity Delay Target
Cost of delay Cost of capacity
Figure 12 Capacity Requirements and Delay Breakdown Process
To determine ACC required capacity profiles and the corresponding delay breakdown per ACC, MECA through an iterative process calculates delays and increases the capacity in the different ACCs until the network delay target is reached. These iterations are optimised in order to reach the European delay target at a minimum total cost. Capacity is increased at the ACCs offering the best Return on Investment (ROI). The capacity will be increased first in the ACCs where there are a lot of minutes of delay (cost of delay will go down). When the European delay target is reached, the results are the capacity profile requirements and the delay breakdown for each ACC.
Simulation offuture scenario
Delay per flight= Capacity Target?
Increase capacity in ACCs
No
Yes
ACC Capacity Requirement
profiles
Delay Breakdown
Per ACC
Figure 13 Iterative MECA Network Simulations
A range of capacity requirement profiles is provided to cover different possibilities in terms of future traffic demand in each ACC:
- Reference: Baseline traffic growth, shortest routes available on the network
- High: High traffic growth, shortest routes available on the network
CAPACITY ASSESSMENT & PLANNING GUIDANCE DOCUMENT
Edition 2.8 09 April 2013 - 21 –

- Low: Low traffic growth, shortest routes available on the network
- Current: Baseline traffic growth, current routes
7.5 Impact of the Parameters Capacity already available (capacity baseline) vs expected traffic demand:
- If sufficient capacity is already available to cover future traffic demand without any delay, the capacity profile requirement will be flat (no need to increase capacity), and the delay breakdown will be very close to zero - with the existing capacity, no delays should be generated, even with future traffic demand. (See blue line Figure 14)
- If sufficient capacity is available today, but not for future levels of traffic, there will be a need to increase the capacity to follow the traffic growth (See green line Figure 14)
- If there is a capacity gap today, there will be a need to increase the capacity, both to close the capacity gap and to follow the traffic growth (See red line Figure 14)
Figure 14 Current vs Target Capacity
European delay target:
The European delay target will have a high impact on the capacity requirement profiles and on the delay breakdown. The lower the European delay target, the higher the capacity requirement profiles and the lower the delay breakdown per ACC.
Cost of delay and cost of capacity:
The cost of delays and cost of capacity do not have a big impact on the capacity requirement profiles and on the delay breakdown per ACC, when reaching a European target. A sensibility analysis was conducted and the results per ACC are very stable1. These cost parameters are used to choose in which ACC it is more efficient to increase capacity for each of the different
1 Detailed results from sensibility analysis can be found in the reports from the Capacity Planning Sub-Group 10 and 15
CAPACITY ASSESSMENT & PLANNING GUIDANCE DOCUMENT
Edition 2.8 09 April 2013 - 22 –

CAPACITY ASSESSMENT & PLANNING GUIDANCE DOCUMENT
Edition 2.8 09 April 2013 - 23 –
iterations. As the cost of delay is growing very sharply when there is a capacity gap, the level of delays is the main factor influencing the results.

CAPACITY ASSESSMENT & PLANNING GUIDANCE DOCUMENT
Edition 2.8 09 April 2013 - 24 –
8 Plans, Forecasts and Implementation Actions
8.1 Local Capacity Plans The Network Manager is providing support to the ANSPs to develop local capacity plans based on the capacity profile requirements. Bilateral interactive coordination takes place every year with all ANSPs .
The Network Manager is providing the ANSP with a set of data to enable them to prepare their local capacity plan. The data set includes the following for each ACC:
A report and analysis of capacity delivered during the previous Summer season, including the capacity baseline
The STATFOR Medium Term traffic forecast
The delay breakdown and capacity requirement profiles for high, low and medium traffic growth (shortest available routes over the future route network) and for the current route network
Other relevant capacity information
The local capacity plan should enable the ANSP to plan measures to cope with the foreseen traffic demand, reduce current capacity shortfalls and resulting ATFM delays, and manage available capacity more efficiently.
If there is a current shortfall, particular effort should be made to include short term actions (even of a temporary nature) to improve capacity of the bottleneck sectors, until longer term solutions can be implemented.
The local capacity plan should:
Identify, analyse and quantify capacity drivers, as well as capacity constraints
Describe planned capacity enhancing initiatives and quantify benefits
Assess the expected future capacity situation
More details about the main capacity drivers can be found in Annex E.
The local capacity plan should quantify the overall capacity gain each year resulting from the local capacity enhancement actions planned. Benefits should be calculated over the project lifetime, and may not be realised until after completion. The same capacity initiative may bring different benefits for different ANSPs, depending on the extent of capacity pressure facing the ANSP and the relationship with other capacity-enhancement projects.
NEST can be used to assess the effect of the capacity enhancement measures and test alternatives. This is based on the ACCESS methodology (see Paragraph 5.2), taking as input possible opening scheme and sector capacities. This is ensuring consistency throughout the full process.
The implementation of new airspace structures or changes in the mode of operations might require an analysis of the controller’s workload. One method is an operational estimate of capacity potential by experts; others require the use of analytical and fast time simulation models. The results of this analysis could be increased sector capacity values.
Real time simulation offers an important opportunity for operational controllers to interact with the ideas modelled and confirm the validity of the approach chosen. Usually 2 or 3 options from the fast-time simulation are tested in a real-time simulation and it is here that the clearest indication of the possibility to realise the expected capacity is seen.
The ANSPs, with the assistance of NM are detailing their capacity enhancement actions planned each year of the capacity planning cycle, with more details for the first years. These measures take into account any capacity initiatives, also including staffing and system issues. Based on these measures, an assessment of the overall capacity increase is estimated. All the local capacity plans are consolidated in the Network Operations Report (NOP).
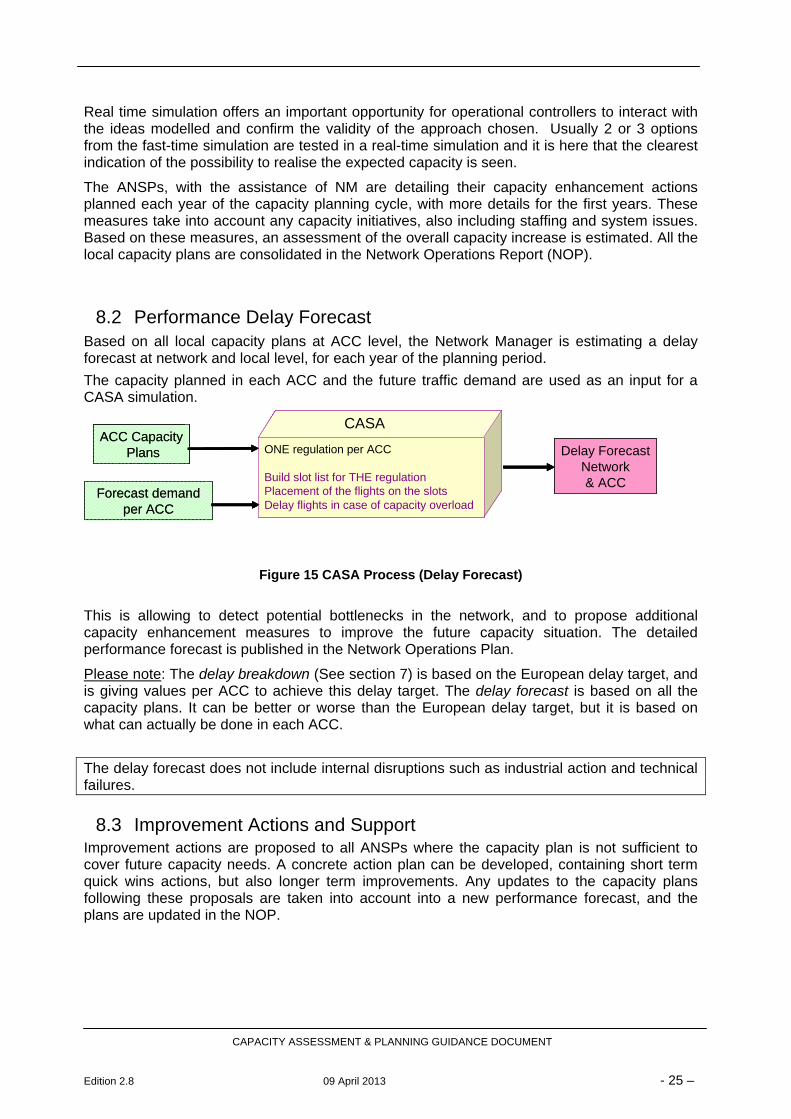
8.2 Performance Delay Forecast Based on all local capacity plans at ACC level, the Network Manager is estimating a delay forecast at network and local level, for each year of the planning period.
The capacity planned in each ACC and the future traffic demand are used as an input for a CASA simulation.
ONE regulation per ACC
Build slot list for THE regulation Placement of the flights on the slotsDelay flights in case of capacity overload
ACC CapacityPlans
Forecast demandper ACC
Delay ForecastNetwork& ACC
CASA
ONE regulation per ACC
Build slot list for THE regulation Placement of the flights on the slotsDelay flights in case of capacity overload
ACC CapacityPlans
Forecast demandper ACC
Delay ForecastNetwork& ACC
ONE regulation per ACC
Build slot list for THE regulation Placement of the flights on the slotsDelay flights in case of capacity overload
ONE regulation per ACC
Build slot list for THE regulation Placement of the flights on the slotsDelay flights in case of capacity overload
ACC CapacityPlans
Forecast demandper ACC
Delay ForecastNetwork& ACC
CASA
Figure 15 CASA Process (Delay Forecast)
This is allowing to detect potential bottlenecks in the network, and to propose additional capacity enhancement measures to improve the future capacity situation. The detailed performance forecast is published in the Network Operations Plan.
Please note: The delay breakdown (See section 7) is based on the European delay target, and is giving values per ACC to achieve this delay target. The delay forecast is based on all the capacity plans. It can be better or worse than the European delay target, but it is based on what can actually be done in each ACC.
The delay forecast does not include internal disruptions such as industrial action and technical failures.
8.3 Improvement Actions and Support Improvement actions are proposed to all ANSPs where the capacity plan is not sufficient to cover future capacity needs. A concrete action plan can be developed, containing short term quick wins actions, but also longer term improvements. Any updates to the capacity plans following these proposals are taken into account into a new performance forecast, and the plans are updated in the NOP.
CAPACITY ASSESSMENT & PLANNING GUIDANCE DOCUMENT
Edition 2.8 09 April 2013 - 25 –

CAPACITY ASSESSMENT & PLANNING GUIDANCE DOCUMENT
Edition 2.8 09 April 2013 - 26 –
8.4 Network Operations Plan The Network Operations Plan is a living document, providing a medium-term outlook of the capacity situation. It contains information, both at local and network level, about
- the traffic forecast
- the capacity requirements,
- the capacity plans,
- the special events,
- the forecast of operational performance,
- the detection of bottlenecks
- mitigation solutions.
The full structure of the NOP was defined in the Commission Regulation N°677/2011, Annex 5 and is presented in Annex D.
It is released following approval by the Network management Board (NMB) in March and updated during the season as necessary.

CAPACITY ASSESSMENT & PLANNING GUIDANCE DOCUMENT
Edition 2.8 09 April 2013 - 27 –
9 Capacity Planning Schedule and Tools
9.1 Schedule and Work Programme The table below describes the annual capacity planning schedule and associated work programme.
DATE MAIN EVENT
January - March
Publication of end of year Network Operations Report
European ATM Network Operations Plan finalised and presented to the NDOP, NETOPS, and the Network Management Board (NMB) in March
ACC strategic plans, traffic forecast and delay forecast displayed on the NOP Portal (strategic tab)
February/March New STATFOR Medium Term Forecast per State released
Derivation of new demand forecast per ACC
March - April
Update of Summer delay forecast according to new demand forecast and any updates to the strategic capacity plan
Evaluation of ACC demand forecast - significant differences will be coordinated bilaterally with ANSPs to facilitate flexible local planning
Annual meeting of Capacity Planning Sub-Group (CPSG) of Network Operations Team
Following NMB endorsement, release of strategic European ATM Network Operations Plan including updated delay forecast per ACC;
May - Sept Preparation of Winter special events – Transition Plan
Updates of NOP as required
June - August Capacity baseline assessment period for ACCs using both ACCESS and Reverse
CASA methodologies
September - Oct
ACC capacity baselines distributed and agreed bilaterally with the ANSPs
Updated STATFOR MTF released
Derivation of new demand forecast per ACC
Assessment of medium-term ACC capacity requirement profiles according to the new demand forecast and linked to the agreed capacity baseline
November -
January
Support to the development of local capacity plans, including meetings with ANSPs, interactive capacity evaluation and finalisation of the ACC capacity plans for the planning period
Insertion of the local capacity plans in the NOP

Figure 16 shows the cyclical nature of the work and shows the link with use of NEST and DDR2 as essential tools used to achieve the necessary results.
Spring
Traffic Forecast Network Forecast
Update NOP
CAPACITY ASSESSMENT & PLANNING GUIDANCE DOCUMENT
Edition 2.8 09 April 2013 - 28 –
Autumn
Traffic Forecast update
Capacity Requirements and Delay
Interactive Capacity Planning meetings with ANSPs
Mid-Summer
Evaluation of Summer
performance
ACC Capacity Baselines
Demand Data
Repository (DDR)
Common ToolsNEST
Winter
Consolidation of Annual Performance Analysis - Network Operations Report –(NOR)
Consolidation of Plans - Network Operations Plan (NOP)
Figure 16 Cyclical Work Programme
9.2 Capacity Planning Sub Group Within the framework provided by the SES regulations and the European ATM Master Plan, the CAPLANSG is the coordination forum for European capacity planning activities and ensures the continuous review and update of capacity planning processes, methodologies and tools and to adapt them to the emerging requirements linked to the evolution of the European ATM network and of its operational performance. It has to address the development and implementation of concepts currently under development within SESAR. It contributes to the fulfilment of the requirements of the European ATM Master Plan, of the EUROCONTROL Agency Objectives and of the requirements arising from the relevant Single European Sky Implementing Rules. The CAPLANSG carries out work mandated to it by the NETOPS Team and delivers the output of that work to the NETOPS Team for endorsement for the main purpose of enabling enhanced capacity planning methodologies and processes.
9.3 Tools The capacity planning process is based on a set of tools used for the different simulations. The main tools used are NEST and the DDR. This set of tools is constantly improving based on the requests from the users, allowing to match with the needs for data and simulation.

CAPACITY ASSESSMENT & PLANNING GUIDANCE DOCUMENT
Edition 2.8 09 April 2013 - 29 –
9.3.1 NEST NEST provides a single, integrated and user-friendly tool for airspace design and capacity planning that includes the full spectrum of capabilities of both SAAM and NEVAC in a common platform. The tool can be used by the EUROCONTROL Network Manager and national ANSPs for airspace structure design and development, capacity planning and post operational analysis, strategic traffic flow organisation, scenario preparation for simulations and studies at local or network level. The first version of NEST is available since the beginning of 2013.
Datasets for NEST are providing consolidated pan-European airspace and route network, traffic demand and distribution as well as STATFOR traffic forecasts, and are available at the end of each AIRAC cycle. All this data can be downloaded from the Demand Data Repository (DDR) web site.
The main functionalities of NEST include the following: o Visualisation of traffic demand and airspace in 3D o Evaluation of traffic loads o Identification of capacity bottlenecks o Simulation of future traffic demand o Simulation of different routing options o Optimisation of configurations and opening scheme o Edition of airspace and route network, including free route airspace o Delay simulation, including network effects o What if functionalities o Evaluation of flight efficiency indicators
9.3.2 DDR The Demand Data Repository (DDR) was created in response to planners who needed access to a consolidated and integrated pan-European strategic view of traffic demand and distribution. The DDR provides, through a web application, a simple and comprehensive interface allowing generation and download of future traffic for planning purposes and past traffic for post-ops analysis of traffic trends and statistics. Past traffic demand is available for any day, for all Europe, from January 2006. The DDR can generate a variety of traffic samples as follows:
o Future traffic samples according to the low, baseline or high STATFOR forecast, o Future traffic samples with current demand distribution (flight plan/flight plan enhanced with radar data), o Future traffic samples with new routeings calculated on future environment. o Past traffic samples with new routeings calculated on future environment Three options are available for the generation of new routeings: o Shortest path (minimum route length) o Cheapest path (minimum cost taking into account route length and route charges) o Optimal path (minimum cost taking into account route length, route charges and delays/overloads).
The first phase of the DDR (DDR1) produced future traffic samples using only STATFOR forecast data, and additional developments were required to cover very short-term and pre-tactical planning needs. The second phase of the DDR project (DDR2) was designed to meet this need, as well as improve the planning of special events.

CAPACITY ASSESSMENT & PLANNING GUIDANCE DOCUMENT
Edition 2.8 09 April 2013 - 30 –
The DDR2 was built based on the DDR1 functionalities, enhancing the future traffic samples by incorporating flight intention data, and is operational since the beginning of 2013. The DDR2 derives future traffic samples using STATFOR data, but also enriching the selected traffic sample with consolidated flight intention data gathered from various sources, including schedule information from scheduling companies, airport operators, and airport slot coordinators. Flight intentions are typically known 6 to 9 months before the day of operations, and are subsequently updated and refined up to the day before operations. The future traffic samples cover the whole of the European airspace geographically and are available from the strategic planning phase up to the pre-tactical phase. Continuous testing and refinement of the consolidation and enrichment processes will ensure that future traffic samples are as accurate as possible for all planning purposes. Access to DDR is restricted to ANSPs and Airline Operators within Europe.

CAPACITY ASSESSMENT & PLANNING GUIDANCE DOCUMENT
Edition 2.8 09 April 2013 - 31 –
10 Way Forward The capacity planning and assessment methodology has been validated and used for more than 10 years and proved to be very stable. However, it is important to propose enhancements to the methodology and adaptation to the performance scheme if required.
10.1 Future Evolution of the Methodology Any changes to the methodology will go through a validation phase before being presented to all ANSPs at the Capacity Planning Sub-Group. The implementation of changes in the methodology will be done only after the agreement of this forum. One of the areas of research for improving the overall process is linked to the ATFCM techniques used in the ACCs during the tactical phases. For example, sector occupancy, workload assessment or Short Term ATM measures (STAM) are put in place in more and more ACCs. An investigation will be made regarding the possibility to include some of these indicators in the capacity planning and assessment process, keeping in mind that the stability and accuracy of the methodology should be maintained. It also has to be noted that it might be difficult to transpose tactical measures into the planning phase, and that consistency between all ACCs will have to be ensured. As the ACCs are not all applying the same measures and processes, it is important that the current methodology will not disappear as such, but be adapted for the ACCs where it is required.
10.2 Performance Scheme At the time of writing the KPIs and Targets for the SES Performance Scheme Reference Period 2 are still under development and consultation. When this information becomes available the capacity planning methodology will be adapted to accommodate new targets if required. This is expected to take place during the second half of 2013.
CAPACITY ASSESSMENT & PLANNING GUIDANCE DOCUMENT
Edition 2.8 09 April 2013 - 32 –
ANNEX A. Commonly Understood Definitions
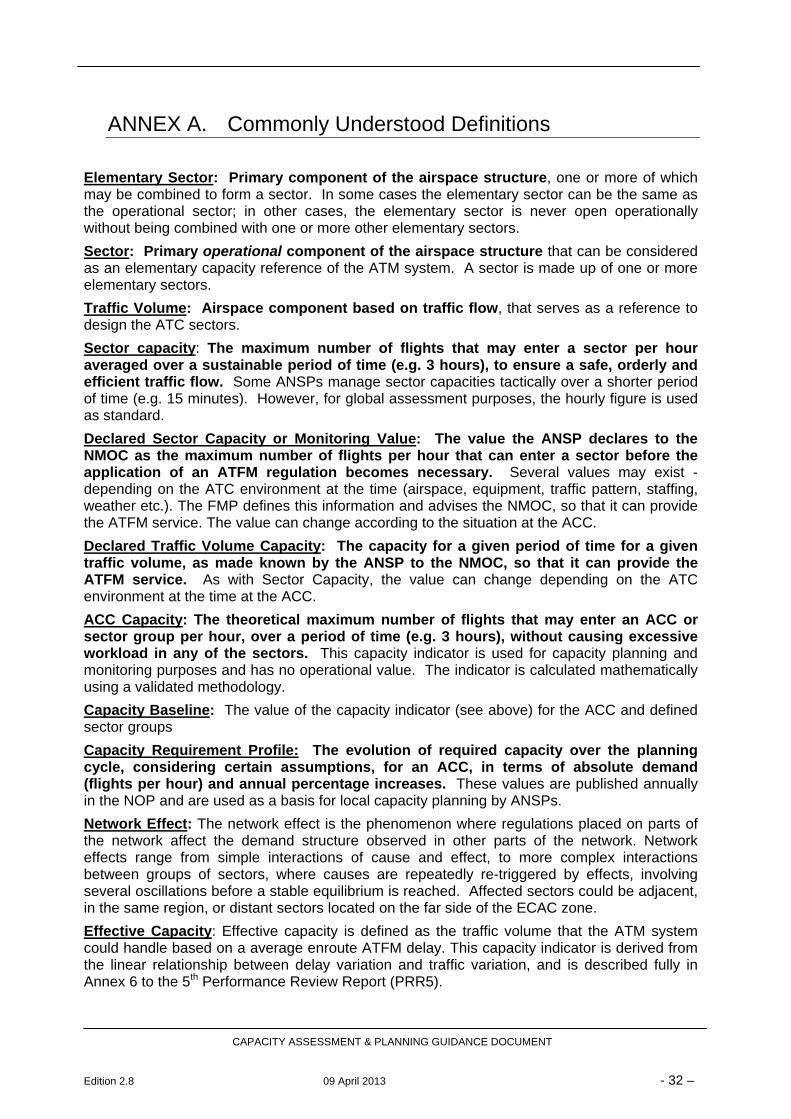
Elementary Sector: Primary component of the airspace structure, one or more of which may be combined to form a sector. In some cases the elementary sector can be the same as the operational sector; in other cases, the elementary sector is never open operationally without being combined with one or more other elementary sectors.
Sector: Primary operational component of the airspace structure that can be considered as an elementary capacity reference of the ATM system. A sector is made up of one or more elementary sectors.
Traffic Volume: Airspace component based on traffic flow, that serves as a reference to design the ATC sectors.
Sector capacity: The maximum number of flights that may enter a sector per hour averaged over a sustainable period of time (e.g. 3 hours), to ensure a safe, orderly and efficient traffic flow. Some ANSPs manage sector capacities tactically over a shorter period of time (e.g. 15 minutes). However, for global assessment purposes, the hourly figure is used as standard.
Declared Sector Capacity or Monitoring Value: The value the ANSP declares to the NMOC as the maximum number of flights per hour that can enter a sector before the application of an ATFM regulation becomes necessary. Several values may exist - depending on the ATC environment at the time (airspace, equipment, traffic pattern, staffing, weather etc.). The FMP defines this information and advises the NMOC, so that it can provide the ATFM service. The value can change according to the situation at the ACC.
Declared Traffic Volume Capacity: The capacity for a given period of time for a given traffic volume, as made known by the ANSP to the NMOC, so that it can provide the ATFM service. As with Sector Capacity, the value can change depending on the ATC environment at the time at the ACC.
ACC Capacity: The theoretical maximum number of flights that may enter an ACC or sector group per hour, over a period of time (e.g. 3 hours), without causing excessive workload in any of the sectors. This capacity indicator is used for capacity planning and monitoring purposes and has no operational value. The indicator is calculated mathematically using a validated methodology.
Capacity Baseline: The value of the capacity indicator (see above) for the ACC and defined sector groups
Capacity Requirement Profile: The evolution of required capacity over the planning cycle, considering certain assumptions, for an ACC, in terms of absolute demand (flights per hour) and annual percentage increases. These values are published annually in the NOP and are used as a basis for local capacity planning by ANSPs.
Network Effect: The network effect is the phenomenon where regulations placed on parts of the network affect the demand structure observed in other parts of the network. Network effects range from simple interactions of cause and effect, to more complex interactions between groups of sectors, where causes are repeatedly re-triggered by effects, involving several oscillations before a stable equilibrium is reached. Affected sectors could be adjacent, in the same region, or distant sectors located on the far side of the ECAC zone.
Effective Capacity: Effective capacity is defined as the traffic volume that the ATM system could handle based on a average enroute ATFM delay. This capacity indicator is derived from the linear relationship between delay variation and traffic variation, and is described fully in Annex 6 to the 5th Performance Review Report (PRR5).
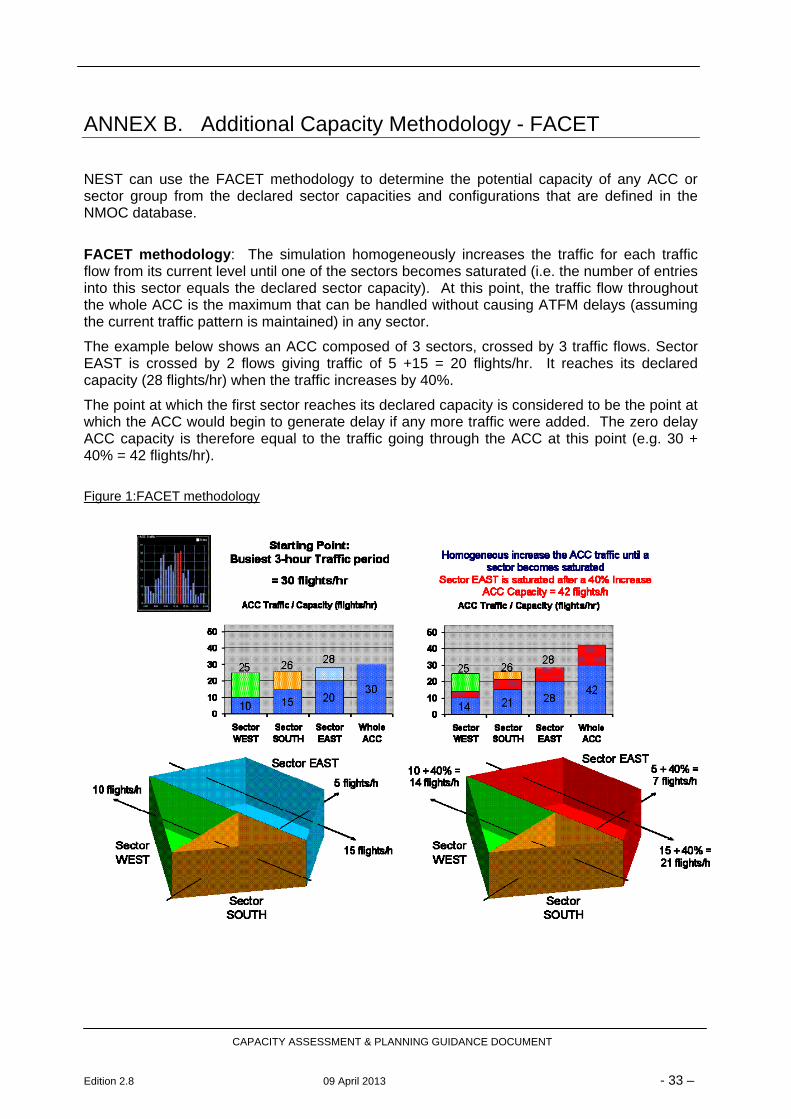
ANNEX B. Additional Capacity Methodology - FACET
NEST can use the FACET methodology to determine the potential capacity of any ACC or sector group from the declared sector capacities and configurations that are defined in the NMOC database.
FACET methodology: The simulation homogeneously increases the traffic for each traffic flow from its current level until one of the sectors becomes saturated (i.e. the number of entries into this sector equals the declared sector capacity). At this point, the traffic flow throughout the whole ACC is the maximum that can be handled without causing ATFM delays (assuming the current traffic pattern is maintained) in any sector.
The example below shows an ACC composed of 3 sectors, crossed by 3 traffic flows. Sector EAST is crossed by 2 flows giving traffic of 5 +15 = 20 flights/hr. It reaches its declared capacity (28 flights/hr) when the traffic increases by 40%.
The point at which the first sector reaches its declared capacity is considered to be the point at which the ACC would begin to generate delay if any more traffic were added. The zero delay ACC capacity is therefore equal to the traffic going through the ACC at this point (e.g. 30 + 40% = 42 flights/hr).
Figure 1:FACET methodology
CAPACITY ASSESSMENT & PLANNING GUIDANCE DOCUMENT
Edition 2.8 09 April 2013 - 33 –
CAPACITY ASSESSMENT & PLANNING GUIDANCE DOCUMENT
Edition 2.8 09 April 2013 - 34 –
ANNEX C. Capacity Planning Process at ACC level
When performing a performance prediction it is necessary to consider the evolution of both the information quality and the reactionary power within the planning time horizon.
In the short term, the potential for modification to the ATM system is usually limited to a better use of already existing resources using the current system configuration i.e. existing sector configurations and traffic flows (low reactionary power). Possible improvements can normally be predicted with a high level of confidence (high information quality).
As the planning time horizon extends to the medium term (typically 5 years), it is possible to consider more radical actions such as revised airspace structure, use of improved ATC system support and additional controllers. In this case, there is more scope for change (high reactionary power), although the information quality is necessarily lower, because of the uncertainty associated with the timing of the availability of additional resources and new systems.
Therefore, in the medium term, it may no longer be pertinent to report performance predictions at the level of the existing sector configuration. It may also be the case that certain airspace structures currently in force may not be appropriate for use in medium term.
The granularity of the analysis is reduced as the planning time horizon increases, so it becomes more logical to provide predictions at the level of the ACC level.
In the medium term it is necessary to explore a wider range of scenarios in terms of traffic growth rates and evolution of the ATM infrastructure. These different levels of analysis granularity have given rise to concepts such as ACC capacity and the capacity demand ratio.
The concept of monitoring ACC capacity was developed because the volume of airspace at ACC level was considered to be more stable than at sector level.
The notion of ACC capacity is not an operational one, but was developed to:
monitor ACC performance year on year (by comparing historical and current data);
measure ACC plans against future capacity requirements (ACC capacity profiles are assessed according to forecast demand and agreed parameters);
support local capacity planning
give a managerial review in terms of future expectations and associated resources.
The ACC capacity value is used by the Agency to monitor ACC plans against performance in the short term and to forecast ACC delay for the next summer season. It is also used for the consolidation of the NOP and to monitor local plans against the capacity requirement profiles.
.

CAPACITY ASSESSMENT & PLANNING GUIDANCE DOCUMENT
Edition 2.8 09 April 2013 - 35 –
ANNEX D. NOP content
As defined in Annex 5 of the COMMISSION REGULATION (EU) No 677/2011 of 7 July 2011 laying down detailed rules for the implementation of air traffic management (ATM) network functions and amending Regulation (EU) No 691/2010.
TEMPLATE FOR NETWORK OPERATIONS PLAN
The Network Operations Plan shall be based on the following general structure (that will be tailored to the various individual functions and to the time horizon of the Network Operations Plan to reflect its rolling nature and its 3 to 5 year, annual, seasonal, weekly and daily periods):
1. INTRODUCTION
1.1. Scope of the Network Operations Plan (geographical and time period)
1.2. Preparation of the plan and validation process
2. DESCRIPTION OF THE NETWORK OPERATIONS PLAN, OPERATIONAL TARGETS AND OBJECTIVES
— including the collaborative aspect of the participating operational stakeholders in terms of roles and responsibilities,
— indicating how the operational targets and objectives will be covered in the tactical, pre-tactical, short-term and medium-term phases of the Network Operations Plan and other performance targets set under the performance regulation,
— priorities set and resources needed for the planning period,
— indicating the impact on the ATM industry and other concerned areas.
3. OVERALL NETWORK OPERATIONS PLANNING PROCESS
— description of the overall network operations planning process,
— description of the strategic way the Network Operations Plan will evolve and progress to successfully respond to the operational performance requirements and other performance targets set under the performance Regulation,
— description of tools and data used.
4. OVERALL CONTEXT AND OPERATIONAL REQUIREMENTS
4.1. Summary description of the past network operational performance
4.2. Challenges and opportunities related to the time period of the plan
4.3. Network traffic forecast in accordance with Appendices 1 and 2, including:
— network forecast,
— air navigation service provider, functional airspace block and ACC forecast,
— main airports forecast,
— analysis of the traffic forecast, including a range of scenarios,
— analysis of special events impact.
4.4. Network operational performance requirements, including:
— overall network capacity requirements,
— air navigation service provider, functional airspace block and ACC capacity requirements,
— airport capacity,
— analysis of the capacity requirements,
— overall network environment/flight efficiency requirements,
— overall network safety requirements,
— contingency requirements and continuity of services affecting the network.
4.5. Operational needs as expressed by the different stakeholders, including military
5. NETWORK OPERATIONAL PERFORMANCE ENHANCEMENT PLANS AND ACTIONS AT NETWORK LEVEL
— description of the plans and actions expected to be implemented at network level, including airspace, scarce resources and ATFM,
— description of the operational performance contributions of each of the plans and actions.EN L 185/24 Official Journal of the European Union 15.7.2011 6. OPERATIONAL PERFORMANCE ENHANCEMENT PLANS AND ACTIONS AT LOCAL LEVEL
— including description of each of the plans and actions expected to be implemented at local level,
— description of the operational performance contributions of each of the plans and actions,
— description of relations with third countries and work related to ICAO.
7. SPECIAL EVENTS
— overview of special events with significant ATM impact,
— individual special events and their handling from an network perspective,

CAPACITY ASSESSMENT & PLANNING GUIDANCE DOCUMENT
Edition 2.8 09 April 2013 - 36 –
— major military exercises.
8. MILITARY AIRSPACE REQUIREMENTS
8.1. Military ATM service providers responsible for areas of reserved or segregated airspace shall exchange with the Network Manager, through the relevant Airspace Management Cell, the following information according to national rules:
— airspace availability: default days/times of availability of reserved airspace,
— ad hoc requests for unplanned use of reserved airspace,
— release of reserved airspace to civil use whenever not required, giving as much notice as possible.
9. CONSOLIDATED FORECAST AND ANALYSIS OF THE OPERATIONAL PERFORMANCE OF THE NETWORK
— network, air navigation service provider, functional airspace block and ACC ATM delay/capacity targets and forecast,
— airport operational performance,
— network environment/flight efficiency performance target and forecast,
— impact of special events,
— analysis of the operational performance targets and forecast.
10. IDENTIFICATION OF OPERATIONAL BOTTLENECK AREAS AND MITIGATION SOLUTIONS AT NETWORK AND LOCAL LEVEL
— identification of operational (safety, capacity, flight efficiency) bottlenecks and potential bottlenecks, their causes and agreed
solutions or mitigation actions, including options for demand capacity balancing (DCB).

CAPACITY ASSESSMENT & PLANNING GUIDANCE DOCUMENT
Edition 2.8 09 April 2013 - 37 –
ANNEX E. Capacity Drivers Taking into account the enroute phases of flight at ACCs, an increase in network capacity can be achieved by the following initiatives:
Optimise network utilisation Increase sector throughput Improve opening scheme flexibility Increase number of sectors open Restructure congested sectors, create additional sectors and configurations Work as part of the Network
Enablers for capacity enhancement: Staffing: - Additional controllers - Improved staff planning - Flexible rostering - Availability of controllers System: - ATM system upgrade - Mode S / Datalink - ATC tools - Safety nets - Available frequency with required coverage and protection Procedures: - ATC procedures - Reduced separation - ASM procedures - Coordination procedures - Implementation of best practice procedures - Change controller working methods and improve procedures - Revise LoAs Airspace and route design: - Route network improvements - Sectorisation optimisation - Free-route airspace - Night direct / Weekend routes - Terminal airspace improvement - Cross border improvements Civil/Military - Improved FUA - Improved civil/military coordination ATFCM - Improve ATFCM procedures, including sector occupancy - Improved traffic predictability (ETFMS, ATFCM) - Improved coordination and working relationship between, NM, FMP, supervisors and
sector controllers Capacity - Dynamic sectorisation - Create additional sector (Max. configuration) - Extended sector opening times - Dynamic sector configuration management - Sector capacity increase

CAPACITY ASSESSMENT & PLANNING GUIDANCE DOCUMENT
Edition 2.8 09 April 2013 - 38 –
ANNEX F. List of Acronyms ACC Area Control Centre AIRAC Aeronautical Information Regulation and Control ANS Air Navigation Services ANSP Air Navigation Service Provider ATC Air Traffic Control ATFM Air Traffic Flow Management ATM Air Traffic Management ATS Air Traffic Services CASA Computer Assisted Slot Allocation CPSG Capacity Planning Sub-Group CRCO Central Route Charges Office CTOT Calculated Take Off Time DDR Demand Data Repository ECAC European Civil Aviation Conference FAB Functional Airspace Block FIPS Flight Increase Process FMP Flow Management Position KPA Key Performance Area KPI Key Performance Indicator LSSIP Local Single Sky Implementation Plan MECA Model for Economical evaluation of Capacities in the ATM system MTF Medium Term Forecast NDOP Network Directors of Operations Forum NEST Network Strategic Tool NETOPS Network Operations Team NEVAC Network Estimation & Visualisation of ACC Capacity NM Network Manager NMB Network Management Board NMOC Network Management Operations Centre NOP Network Operations Plan NOR Network Operations Report NSA National Supervisory Authority NSP Network Strategic Plan ODZ Origin /Destination Zone (STATFOR) PC Provisional Council PRB Performance Review Body PRC Performance Review Commission PRU Performance Review Unit SAAM System for traffic Assignment and Analysis at Macroscopic Level SES Single European Sky STATFOR Statistics and Forecasting service UAC Upper Area Control Centre

© May 2013 – European Organisation for the Safety of Air Navigation (EUROCONTROL)
This document is published by EUROCONTROL for information purposes. It may be copied
in whole or in part, provided that EUROCONTROL is mentioned as the source and it is not used
for commercial purposes (i.e. for financial gain). The information in this document may not be
modified without prior written permission from EUROCONTROL.
www.eurocontrol.int
EUROCONTROL
For more info, please contact:ConDNM/COO/NOM/OPLRazvan [email protected]
DNM/COO/NOM/OPL/PLAStéphanie [email protected]