Embed Size (px)
Citation preview

People. Ideas. Success.
Guggenheim Securities, LLC Oilfield Services, Offshore Contract Drillers & Capital Equipment
June 2, 2014
“Second Derivative” Leads Drivers, Despite Near-Term Dayrate Headwinds
Darren Gacicia
(212) 293-3054
GUGGENHEIM SECURITIES, LLC See pages 58 - 59 for analyst certification and important disclosures.
This report is intended for Darren.G
acicia@guggenheim
partners.com at G
uggenheim. U
nauthorized distribution of this report is prohibited.
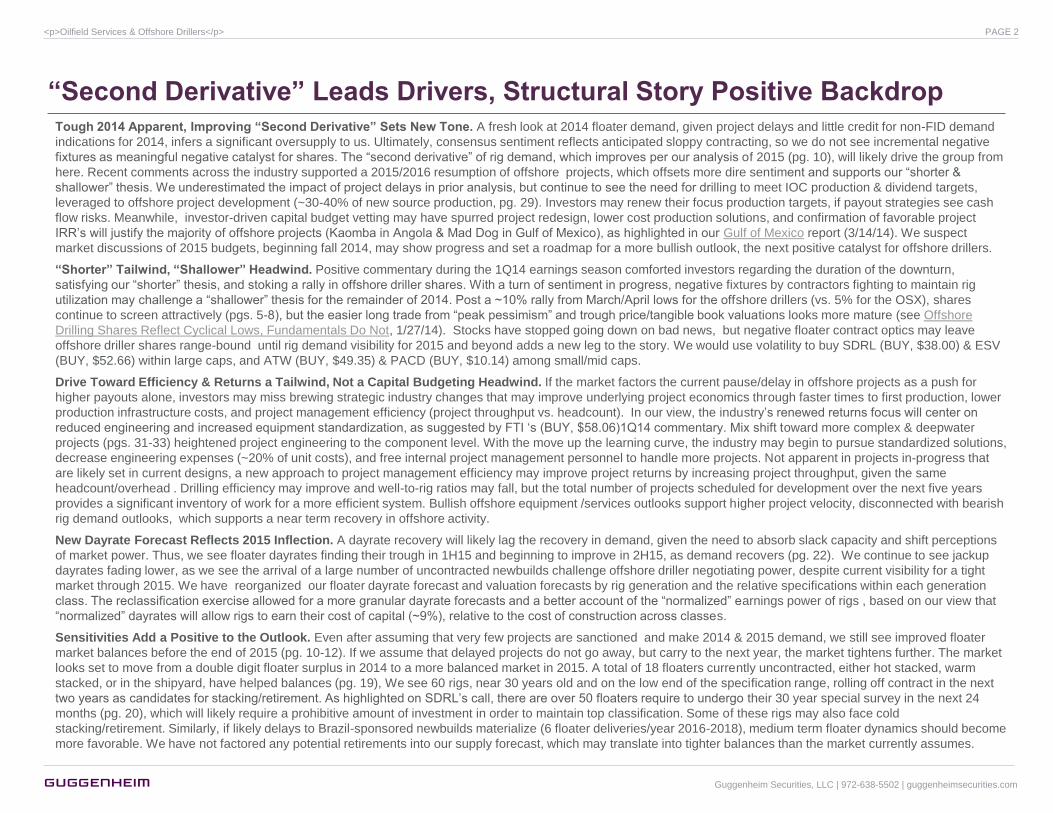
“Second Derivative” Leads Drivers, Structural Story Positive Backdrop Tough 2014 Apparent, Improving “Second Derivative” Sets New Tone. A fresh look at 2014 floater demand, given project delays and little credit for non-FID demand
indications for 2014, infers a significant oversupply to us. Ultimately, consensus sentiment reflects anticipated sloppy contracting, so we do not see incremental negative
fixtures as meaningful negative catalyst for shares. The ―second derivative‖ of rig demand, which improves per our analysis of 2015 (pg. 10), will likely drive the group from
here. Recent comments across the industry supported a 2015/2016 resumption of offshore projects, which offsets more dire sentiment and supports our ―shorter &
shallower‖ thesis. We underestimated the impact of project delays in prior analysis, but continue to see the need for drilling to meet IOC production & dividend targets,
leveraged to offshore project development (~30-40% of new source production, pg. 29). Investors may renew their focus production targets, if payout strategies see cash
flow risks. Meanwhile, investor-driven capital budget vetting may have spurred project redesign, lower cost production solutions, and confirmation of favorable project
IRR‘s will justify the majority of offshore projects (Kaomba in Angola & Mad Dog in Gulf of Mexico), as highlighted in our Gulf of Mexico report (3/14/14). We suspect
market discussions of 2015 budgets, beginning fall 2014, may show progress and set a roadmap for a more bullish outlook, the next positive catalyst for offshore drillers.
“Shorter” Tailwind, “Shallower” Headwind. Positive commentary during the 1Q14 earnings season comforted investors regarding the duration of the downturn,
satisfying our ―shorter‖ thesis, and stoking a rally in offshore driller shares. With a turn of sentiment in progress, negative fixtures by contractors fighting to maintain rig
utilization may challenge a ―shallower‖ thesis for the remainder of 2014. Post a ~10% rally from March/April lows for the offshore drillers (vs. 5% for the OSX), shares
continue to screen attractively (pgs. 5-8), but the easier long trade from ―peak pessimism‖ and trough price/tangible book valuations looks more mature (see Offshore
Drilling Shares Reflect Cyclical Lows, Fundamentals Do Not, 1/27/14). Stocks have stopped going down on bad news, but negative floater contract optics may leave
offshore driller shares range-bound until rig demand visibility for 2015 and beyond adds a new leg to the story. We would use volatility to buy SDRL (BUY, $38.00) & ESV
(BUY, $52.66) within large caps, and ATW (BUY, $49.35) & PACD (BUY, $10.14) among small/mid caps.
Drive Toward Efficiency & Returns a Tailwind, Not a Capital Budgeting Headwind. If the market factors the current pause/delay in offshore projects as a push for
higher payouts alone, investors may miss brewing strategic industry changes that may improve underlying project economics through faster times to first production, lower
production infrastructure costs, and project management efficiency (project throughput vs. headcount). In our view, the industry‘s renewed returns focus will center on
reduced engineering and increased equipment standardization, as suggested by FTI ‗s (BUY, $58.06)1Q14 commentary. Mix shift toward more complex & deepwater
projects (pgs. 31-33) heightened project engineering to the component level. With the move up the learning curve, the industry may begin to pursue standardized solutions,
decrease engineering expenses (~20% of unit costs), and free internal project management personnel to handle more projects. Not apparent in projects in-progress that
are likely set in current designs, a new approach to project management efficiency may improve project returns by increasing project throughput, given the same
headcount/overhead . Drilling efficiency may improve and well-to-rig ratios may fall, but the total number of projects scheduled for development over the next five years
provides a significant inventory of work for a more efficient system. Bullish offshore equipment /services outlooks support higher project velocity, disconnected with bearish
rig demand outlooks, which supports a near term recovery in offshore activity.
New Dayrate Forecast Reflects 2015 Inflection. A dayrate recovery will likely lag the recovery in demand, given the need to absorb slack capacity and shift perceptions
of market power. Thus, we see floater dayrates finding their trough in 1H15 and beginning to improve in 2H15, as demand recovers (pg. 22). We continue to see jackup
dayrates fading lower, as we see the arrival of a large number of uncontracted newbuilds challenge offshore driller negotiating power, despite current visibility for a tight
market through 2015. We have reorganized our floater dayrate forecast and valuation forecasts by rig generation and the relative specifications within each generation
class. The reclassification exercise allowed for a more granular dayrate forecasts and a better account of the ―normalized‖ earnings power of rigs , based on our view that
―normalized‖ dayrates will allow rigs to earn their cost of capital (~9%), relative to the cost of construction across classes.
Sensitivities Add a Positive to the Outlook. Even after assuming that very few projects are sanctioned and make 2014 & 2015 demand, we still see improved floater
market balances before the end of 2015 (pg. 10-12). If we assume that delayed projects do not go away, but carry to the next year, the market tightens further. The market
looks set to move from a double digit floater surplus in 2014 to a more balanced market in 2015. A total of 18 floaters currently uncontracted, either hot stacked, warm
stacked, or in the shipyard, have helped balances (pg. 19), We see 60 rigs, near 30 years old and on the low end of the specification range, rolling off contract in the next
two years as candidates for stacking/retirement. As highlighted on SDRL‘s call, there are over 50 floaters require to undergo their 30 year special survey in the next 24
months (pg. 20), which will likely require a prohibitive amount of investment in order to maintain top classification. Some of these rigs may also face cold
stacking/retirement. Similarly, if likely delays to Brazil-sponsored newbuilds materialize (6 floater deliveries/year 2016-2018), medium term floater dynamics should become
more favorable. We have not factored any potential retirements into our supply forecast, which may translate into tighter balances than the market currently assumes.
Guggenheim Securities, LLC | 972-638-5502 | guggenheimsecurities.com
<p>Oilfield Services & Offshore Drillers</p> PAGE 2
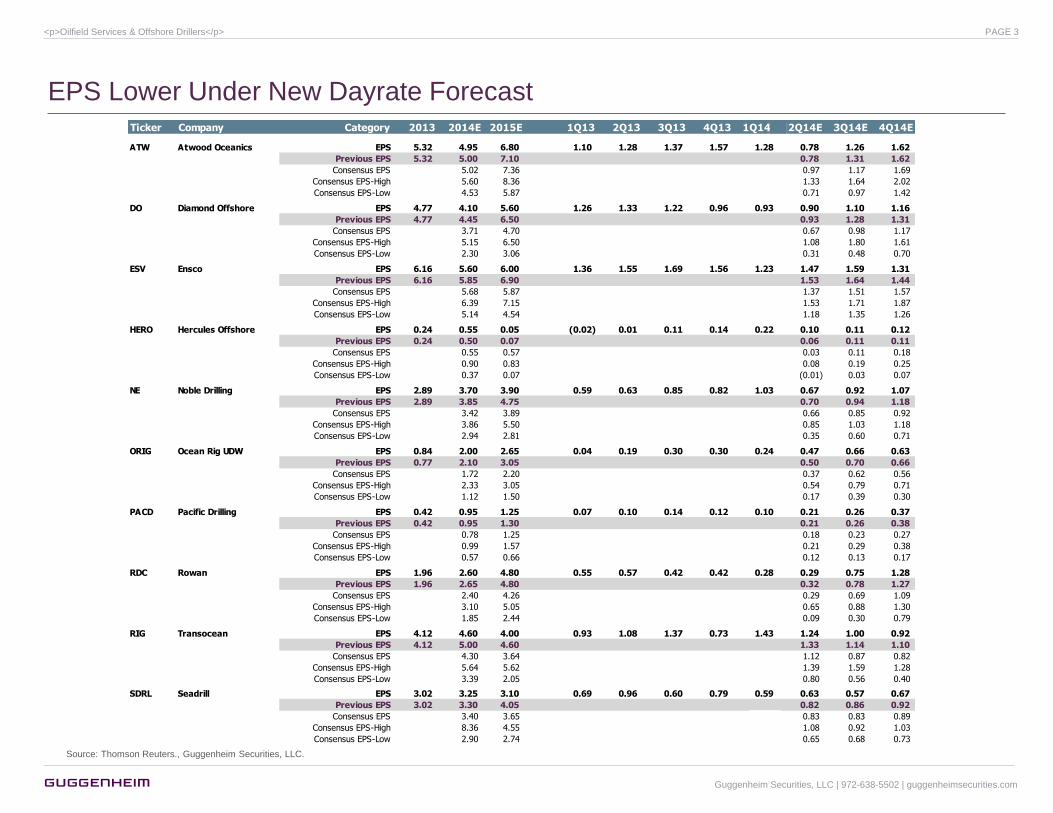
EPS Lower Under New Dayrate Forecast Ticker Company Category 2013 2014E 2015E 1Q13 2Q13 3Q13 4Q13 1Q14E 2Q14E 3Q14E 4Q14E
ATW Atwood Oceanics EPS 5.32 4.95 6.80 1.10 1.28 1.37 1.57 1.28 0.78 1.26 1.62
Previous EPS 5.32 5.00 7.10 0.78 1.31 1.62
Consensus EPS 5.02 7.36 0.97 1.17 1.69
Consensus EPS-High 5.60 8.36 1.33 1.64 2.02
Consensus EPS-Low 4.53 5.87 0.71 0.97 1.42
DO Diamond Offshore EPS 4.77 4.10 5.60 1.26 1.33 1.22 0.96 0.93 0.90 1.10 1.16
Previous EPS 4.77 4.45 6.50 0.93 1.28 1.31
Consensus EPS 3.71 4.70 0.67 0.98 1.17
Consensus EPS-High 5.15 6.50 1.08 1.80 1.61
Consensus EPS-Low 2.30 3.06 0.31 0.48 0.70
ESV Ensco EPS 6.16 5.60 6.00 1.36 1.55 1.69 1.56 1.23 1.47 1.59 1.31
Previous EPS 6.16 5.85 6.90 1.53 1.64 1.44
Consensus EPS 5.68 5.87 1.37 1.51 1.57
Consensus EPS-High 6.39 7.15 1.53 1.71 1.87
Consensus EPS-Low 5.14 4.54 1.18 1.35 1.26
HERO Hercules Offshore EPS 0.24 0.55 0.05 (0.02) 0.01 0.11 0.14 0.22 0.10 0.11 0.12
Previous EPS 0.24 0.50 0.07 0.06 0.11 0.11
Consensus EPS 0.55 0.57 0.03 0.11 0.18
Consensus EPS-High 0.90 0.83 0.08 0.19 0.25
Consensus EPS-Low 0.37 0.07 (0.01) 0.03 0.07
NE Noble Drilling EPS 2.89 3.70 3.90 0.59 0.63 0.85 0.82 1.03 0.67 0.92 1.07
Previous EPS 2.89 3.85 4.75 0.70 0.94 1.18
Consensus EPS 3.42 3.89 0.66 0.85 0.92
Consensus EPS-High 3.86 5.50 0.85 1.03 1.18
Consensus EPS-Low 2.94 2.81 0.35 0.60 0.71
ORIG Ocean Rig UDW EPS 0.84 2.00 2.65 0.04 0.19 0.30 0.30 0.24 0.47 0.66 0.63
Previous EPS 0.77 2.10 3.05 0.50 0.70 0.66
Consensus EPS 1.72 2.20 0.37 0.62 0.56
Consensus EPS-High 2.33 3.05 0.54 0.79 0.71
Consensus EPS-Low 1.12 1.50 0.17 0.39 0.30
PACD Pacific Drilling EPS 0.42 0.95 1.25 0.07 0.10 0.14 0.12 0.10 0.21 0.26 0.37
Previous EPS 0.42 0.95 1.30 0.21 0.26 0.38
Consensus EPS 0.78 1.25 0.18 0.23 0.27
Consensus EPS-High 0.99 1.57 0.21 0.29 0.38
Consensus EPS-Low 0.57 0.66 0.12 0.13 0.17
RDC Rowan EPS 1.96 2.60 4.80 0.55 0.57 0.42 0.42 0.28 0.29 0.75 1.28
Previous EPS 1.96 2.65 4.80 0.32 0.78 1.27
Consensus EPS 2.40 4.26 0.29 0.69 1.09
Consensus EPS-High 3.10 5.05 0.65 0.88 1.30
Consensus EPS-Low 1.85 2.44 0.09 0.30 0.79
RIG Transocean EPS 4.12 4.60 4.00 0.93 1.08 1.37 0.73 1.43 1.24 1.00 0.92
Previous EPS 4.12 5.00 4.60 1.33 1.14 1.10
Consensus EPS 4.30 3.64 1.12 0.87 0.82
Consensus EPS-High 5.64 5.62 1.39 1.59 1.28
Consensus EPS-Low 3.39 2.05 0.80 0.56 0.40
SDRL Seadrill EPS 3.02 3.25 3.10 0.69 0.96 0.60 0.79 0.59 0.63 0.57 0.67
Previous EPS 3.02 3.30 4.05 0.82 0.86 0.92
Consensus EPS 3.40 3.65 0.68 0.83 0.83 0.89
Consensus EPS-High 8.36 4.55 0.74 1.08 0.92 1.03
Consensus EPS-Low 2.90 2.74 0.56 0.65 0.68 0.73
Source: Thomson Reuters., Guggenheim Securities, LLC.
Guggenheim Securities, LLC | 972-638-5502 | guggenheimsecurities.com
<p>Oilfield Services & Offshore Drillers</p> PAGE 3
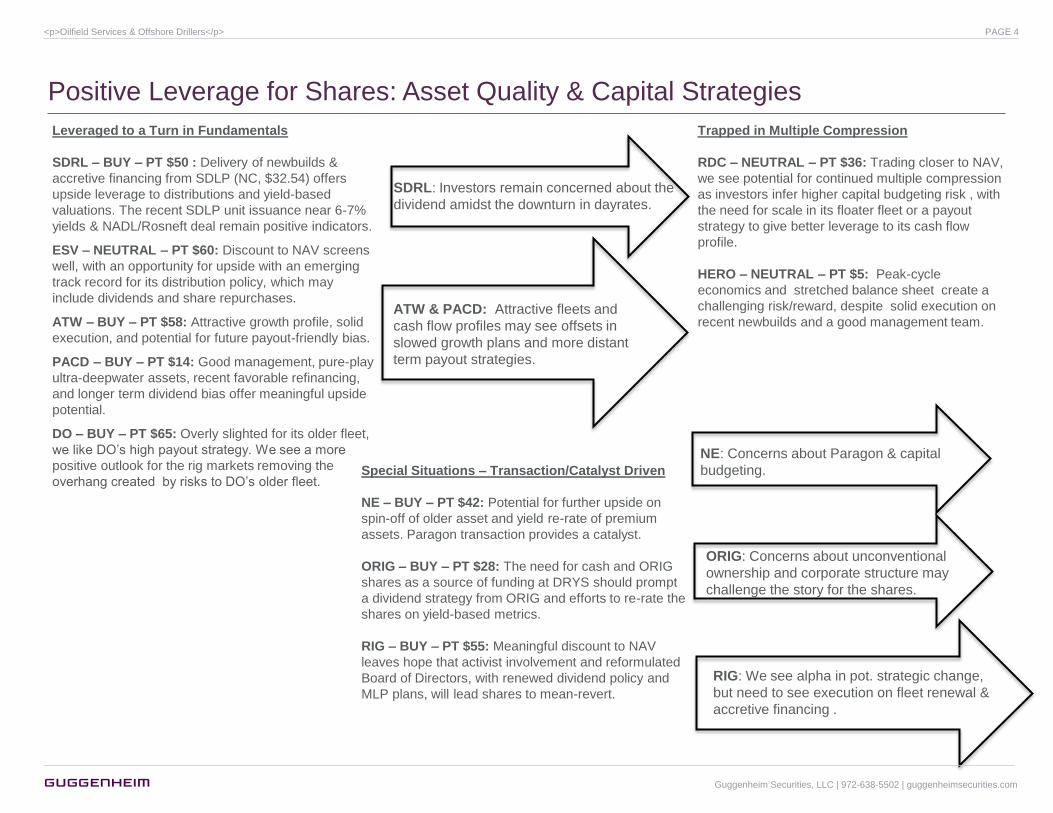
Positive Leverage for Shares: Asset Quality & Capital Strategies
Leveraged to a Turn in Fundamentals
SDRL – BUY – PT $50 : Delivery of newbuilds &
accretive financing from SDLP (NC, $32.54) offers
upside leverage to distributions and yield-based
valuations. The recent SDLP unit issuance near 6-7%
yields & NADL/Rosneft deal remain positive indicators.
ESV – NEUTRAL – PT $60: Discount to NAV screens
well, with an opportunity for upside with an emerging
track record for its distribution policy, which may
include dividends and share repurchases.
ATW – BUY – PT $58: Attractive growth profile, solid
execution, and potential for future payout-friendly bias.
PACD – BUY – PT $14: Good management, pure-play
ultra-deepwater assets, recent favorable refinancing,
and longer term dividend bias offer meaningful upside
potential.
DO – BUY – PT $65: Overly slighted for its older fleet,
we like DO‘s high payout strategy. We see a more
positive outlook for the rig markets removing the
overhang created by risks to DO‘s older fleet.
Trapped in Multiple Compression
RDC – NEUTRAL – PT $36: Trading closer to NAV,
we see potential for continued multiple compression
as investors infer higher capital budgeting risk , with
the need for scale in its floater fleet or a payout
strategy to give better leverage to its cash flow
profile.
HERO – NEUTRAL – PT $5: Peak-cycle
economics and stretched balance sheet create a
challenging risk/reward, despite solid execution on
recent newbuilds and a good management team.
ATW & PACD: Attractive fleets and
cash flow profiles may see offsets in
slowed growth plans and more distant
term payout strategies.
NE: Concerns about Paragon & capital
budgeting.
ORIG: Concerns about unconventional
ownership and corporate structure may
challenge the story for the shares.
RIG: We see alpha in pot. strategic change,
but need to see execution on fleet renewal &
accretive financing .
SDRL: Investors remain concerned about the
dividend amidst the downturn in dayrates.
Special Situations – Transaction/Catalyst Driven
NE – BUY – PT $42: Potential for further upside on
spin-off of older asset and yield re-rate of premium
assets. Paragon transaction provides a catalyst.
ORIG – BUY – PT $28: The need for cash and ORIG
shares as a source of funding at DRYS should prompt
a dividend strategy from ORIG and efforts to re-rate the
shares on yield-based metrics.
RIG – BUY – PT $55: Meaningful discount to NAV
leaves hope that activist involvement and reformulated
Board of Directors, with renewed dividend policy and
MLP plans, will lead shares to mean-revert.
Guggenheim Securities, LLC | 972-638-5502 | guggenheimsecurities.com
<p>Oilfield Services & Offshore Drillers</p> PAGE 4

Large Cap Services 8.4 x
Large Cap Equipment 9.6 x
Small/Mid Cap Svcs &
Equipment 10.3 x
Offshore Drilling 7.2 xOnshore Drilling
6.5 x
Engineering & Construction 8.1x
5.0 x
6.0 x
7.0 x
8.0 x
9.0 x
10.0 x
11.0 x
0% 5% 10% 15% 20% 25%E
V/E
BIT
DA
'14E
EBITDA Growth, '14E vs. '13E
Large Cap Services 8.4 x
Large Cap Equipment 9.6 x
Small/Mid Cap Svcs &
Equipment 10.3 x
Offshore Drilling 7.2 x Onshore Drilling
6.5 x
Engineering & Construction 8.7
x
5.5 x
6.5 x
7.5 x
8.5 x
9.5 x
10.5 x
11.5 x
10.0 x 12.0 x 14.0 x 16.0 x 18.0 x 20.0 x 22.0 x
EV
/EB
ITD
A '14E
Price/Earnings '14E
Offshore Drillers Continue to Screen Well Against Other OFS Segments
Source: Thomson Reuters., Guggenheim Securities, LLC.
2014E P/E vs. 2014E EV/EBITDA- Sub Sectors ‟14E Y/Y EBITDA Growth vs. 2014E EV/EBITDA- Sub Sectors
The mix of low valuations, high
cash flow, and overblown
negative sentiment about rig
supply/demand balances leave
offshore drillers screening
attractively within the group.
We see a potential for rotation out of high
multiple/high growth expectation stocks
with North American leverage into lower
multiple stocks with more visible earnings
growth that screen more attractively, like
the offshore drillers.
Guggenheim Securities, LLC | 972-638-5502 | guggenheimsecurities.com
<p>Oilfield Services & Offshore Drillers</p> PAGE 5
ATW
DO
ESV
NE
PACD
RDC
RIG
SDRL
HERO
ORIG
4.00
5.00
6.00
7.00
8.00
9.00
10.00
5% 7% 9% 11% 13% 15% 17%
2014E E
V/E
BIT
DA
2015E EBITDA/Gross Fleet Value
ATW
DO
ESV
NE
PACD
RDC
RIG
SDRL
HERO
ORIG
3.00
4.00
5.00
6.00
7.00
8.00
9.00
10.00
-3.50 -3.00 -2.50 -2.00 -1.50 -1.00 -0.50 0.00 0.50 1.00
2014E E
V/E
BIT
DA
Total FCF ($B) 2Q13E-4Q15E
ATW
DO
ESV
NE
PACD
RDC
RIG
SDRL
HERO
ORIG
4.00
5.00
6.00
7.00
8.00
9.00
10.00
0% 10% 20% 30% 40% 50% 60%
2014E E
V/E
BIT
DA
Net Debt/Gross Fleet Value
ATW
DO
ESV
NE
PACD
RDC
RIG
SDRL
ORIG
4.00
4.50
5.00
5.50
6.00
6.50
7.00
7.50
8.00
8.50
9.00
9.50
10.00
0 5 10 15 20 25 30
2014E E
V/E
BIT
DA
Average Fleet Age (years)
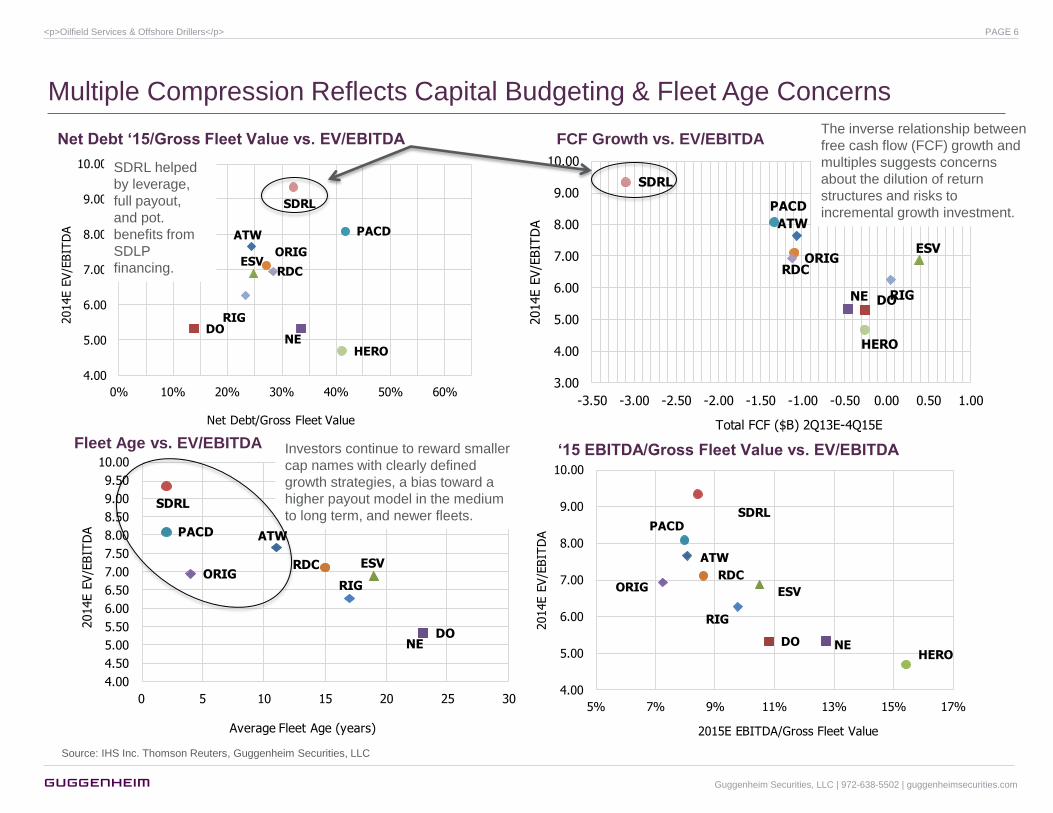
Investors continue to reward smaller
cap names with clearly defined
growth strategies, a bias toward a
higher payout model in the medium
to long term, and newer fleets.
Multiple Compression Reflects Capital Budgeting & Fleet Age Concerns
Net Debt „15/Gross Fleet Value vs. EV/EBITDA FCF Growth vs. EV/EBITDA
SDRL helped
by leverage,
full payout,
and pot.
benefits from
SDLP
financing.
The inverse relationship between
free cash flow (FCF) growth and
multiples suggests concerns
about the dilution of return
structures and risks to
incremental growth investment.
„15 EBITDA/Gross Fleet Value vs. EV/EBITDA Fleet Age vs. EV/EBITDA
Source: IHS Inc. Thomson Reuters, Guggenheim Securities, LLC
Guggenheim Securities, LLC | 972-638-5502 | guggenheimsecurities.com
<p>Oilfield Services & Offshore Drillers</p> PAGE 6
PX NAV-B/U NAV-R P/NAV-B/U P/NAV-R
Company Rating 5/30 Target PX
Rtn to
Target
2014
PE
2015
PE
2014
EV/EBITDA
2015
EV/EBITDA
EV/EBITDA
'14
EV/EBITDA
'15 2014E 2014E 2014E 2014E
ATW Buy 49$ $58 18% 11.7x 8.5x 10.0x 7.3x 7.7x 5.7x 58 66 85% 75%
DO Buy 51$ $65 27% 15.9x 11.6x 12.5x 9.1x 5.3x 4.0x 59 61 87% 84%
ESV Buy 53$ $60 14% 10.7x 10.0x 9.4x 8.8x 6.9x 6.2x 60 60 88% 88%
HERO Neutral 5$ $5 10% 9.1x 100.0x 8.3x 90.8x 4.7x 6.3x 5 5 91% 91%
NE Buy 31$ $42 34% 11.4x 10.8x 8.5x 8.1x 5.4x 5.0x 42 42 75% 75%
ORIG Buy 18$ $28 54% 14.0x 10.6x 9.1x 6.8x 7.0x 6.2x 28 28 65% 65%
PACD Buy 10$ $14 34% 14.7x 11.2x 11.0x 8.3x 8.1x 5.9x 14 14 74% 74%
RDC Neutral 31$ $36 16% 13.8x 7.5x 11.9x 6.4x 7.1x 4.7x 36 43 86% 72%
RIG Buy 42$ $55 29% 12.0x 13.8x 9.2x 10.6x 6.3x 6.8x 55 55 77% 77%
SDRL Buy 38$ $50 32% 15.4x 16.1x 11.7x 12.3x 9.4x 9.1x 29 34 131% 112%
Averages 10.1x 16.9x 6.8x 6.0x 86% 81%
Target Current
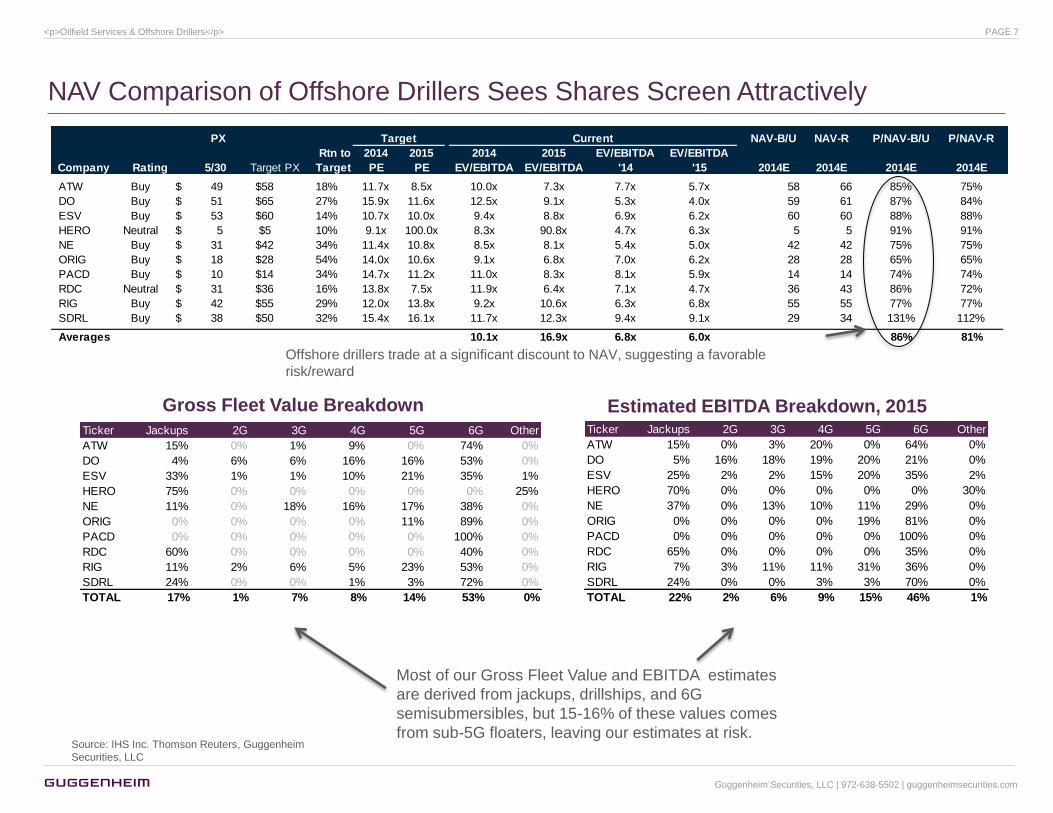
NAV Comparison of Offshore Drillers Sees Shares Screen Attractively
Source: IHS Inc. Thomson Reuters, Guggenheim
Securities, LLC
Offshore drillers trade at a significant discount to NAV, suggesting a favorable
risk/reward
Gross Fleet Value Breakdown Estimated EBITDA Breakdown, 2015
Most of our Gross Fleet Value and EBITDA estimates
are derived from jackups, drillships, and 6G
semisubmersibles, but 15-16% of these values comes
from sub-5G floaters, leaving our estimates at risk.
Ticker Jackups 2G 3G 4G 5G 6G Other
ATW 15% 0% 3% 20% 0% 64% 0%
DO 5% 16% 18% 19% 20% 21% 0%
ESV 25% 2% 2% 15% 20% 35% 2%
HERO 70% 0% 0% 0% 0% 0% 30%
NE 37% 0% 13% 10% 11% 29% 0%
ORIG 0% 0% 0% 0% 19% 81% 0%
PACD 0% 0% 0% 0% 0% 100% 0%
RDC 65% 0% 0% 0% 0% 35% 0%
RIG 7% 3% 11% 11% 31% 36% 0%
SDRL 24% 0% 0% 3% 3% 70% 0%
TOTAL 22% 2% 6% 9% 15% 46% 1%
Ticker Jackups 2G 3G 4G 5G 6G Other
ATW 15% 0% 1% 9% 0% 74% 0%
DO 4% 6% 6% 16% 16% 53% 0%
ESV 33% 1% 1% 10% 21% 35% 1%
HERO 75% 0% 0% 0% 0% 0% 25%
NE 11% 0% 18% 16% 17% 38% 0%
ORIG 0% 0% 0% 0% 11% 89% 0%
PACD 0% 0% 0% 0% 0% 100% 0%
RDC 60% 0% 0% 0% 0% 40% 0%
RIG 11% 2% 6% 5% 23% 53% 0%
SDRL 24% 0% 0% 1% 3% 72% 0%
TOTAL 17% 1% 7% 8% 14% 53% 0%
Guggenheim Securities, LLC | 972-638-5502 | guggenheimsecurities.com
<p>Oilfield Services & Offshore Drillers</p> PAGE 7
65
75
85
95
105
115
125
135
1.0X
1.1X
1.2X
1.3X
1.4X
1.5X
1.6X
1.7X
1.8X
1.9X
Jan-09 Jan-10 Jan-11 Jan-12 Jan-13 Jan-14
Dayra
te I
nd
ex
Pri
ce/T
an
gib
le B
oo
k V
alu
e
P/TBV Average P/TBV Dayrate Index
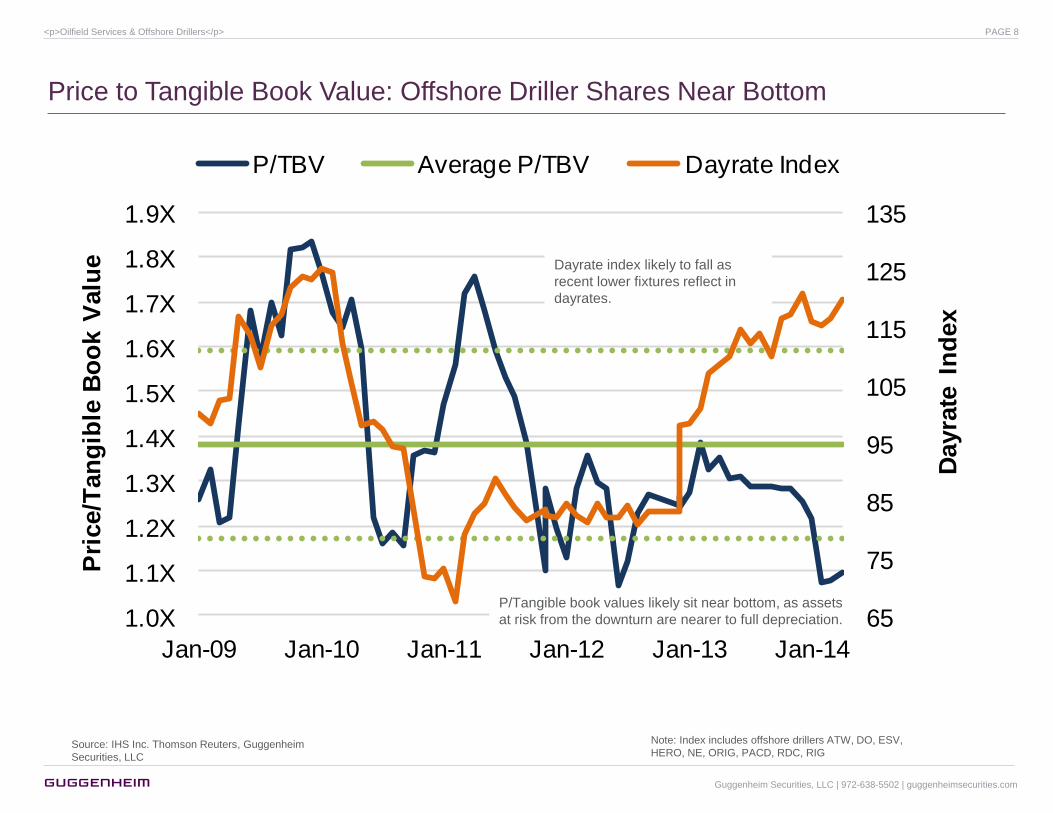
Price to Tangible Book Value: Offshore Driller Shares Near Bottom
Dayrate index likely to fall as
recent lower fixtures reflect in
dayrates.
P/Tangible book values likely sit near bottom, as assets
at risk from the downturn are nearer to full depreciation.
Source: IHS Inc. Thomson Reuters, Guggenheim
Securities, LLC
Note: Index includes offshore drillers ATW, DO, ESV,
HERO, NE, ORIG, PACD, RDC, RIG
Guggenheim Securities, LLC | 972-638-5502 | guggenheimsecurities.com
<p>Oilfield Services & Offshore Drillers</p> PAGE 8
Bottoms Up Analysis Sees Stronger 2015
Guggenheim Securities, LLC | 972-638-5502 | guggenheimsecurities.com
<p>Oilfield Services & Offshore Drillers</p> PAGE 9
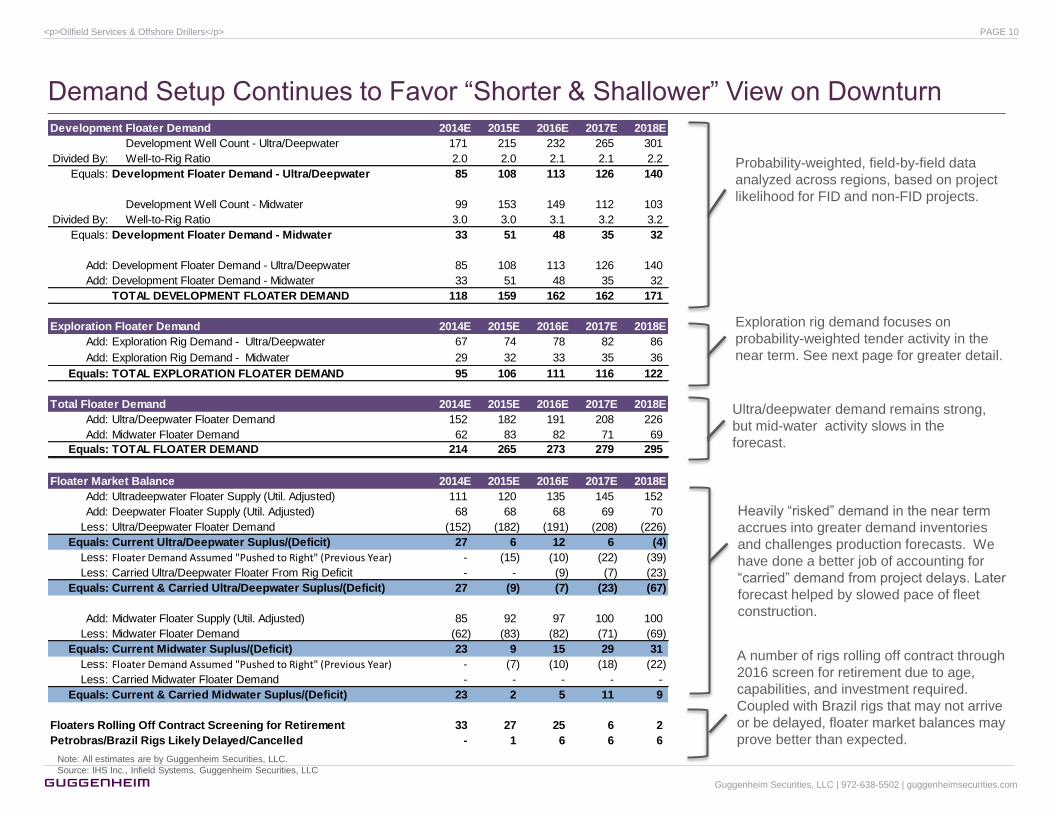
Demand Setup Continues to Favor ―Shorter & Shallower‖ View on Downturn
Note: All estimates are by Guggenheim Securities, LLC.
Source: IHS Inc., Infield Systems, Guggenheim Securities, LLC
Probability-weighted, field-by-field data
analyzed across regions, based on project
likelihood for FID and non-FID projects.
Exploration rig demand focuses on
probability-weighted tender activity in the
near term. See next page for greater detail.
Heavily ―risked‖ demand in the near term
accrues into greater demand inventories
and challenges production forecasts. We
have done a better job of accounting for
―carried‖ demand from project delays. Later
forecast helped by slowed pace of fleet
construction.
A number of rigs rolling off contract through
2016 screen for retirement due to age,
capabilities, and investment required.
Coupled with Brazil rigs that may not arrive
or be delayed, floater market balances may
prove better than expected.
Development Floater Demand 2014E 2015E 2016E 2017E 2018E
Development Well Count - Ultra/Deepwater 171 215 232 265 301
Divided By: Well-to-Rig Ratio 2.0 2.0 2.1 2.1 2.2
Equals: Development Floater Demand - Ultra/Deepwater 85 108 113 126 140
Development Well Count - Midwater 99 153 149 112 103
Divided By: Well-to-Rig Ratio 3.0 3.0 3.1 3.2 3.2
Equals: Development Floater Demand - Midwater 33 51 48 35 32
Add: Development Floater Demand - Ultra/Deepwater 85 108 113 126 140
Add: Development Floater Demand - Midwater 33 51 48 35 32
TOTAL DEVELOPMENT FLOATER DEMAND 118 159 162 162 171
Exploration Floater Demand 2014E 2015E 2016E 2017E 2018E
Add: Exploration Rig Demand - Ultra/Deepwater 67 74 78 82 86
Add: Exploration Rig Demand - Midwater 29 32 33 35 36
Equals: TOTAL EXPLORATION FLOATER DEMAND 95 106 111 116 122
Total Floater Demand 2014E 2015E 2016E 2017E 2018E
Add: Ultra/Deepwater Floater Demand 152 182 191 208 226
Add: Midwater Floater Demand 62 83 82 71 69
Equals: TOTAL FLOATER DEMAND 214 265 273 279 295
Floater Market Balance 2014E 2015E 2016E 2017E 2018E
Add: Ultradeepwater Floater Supply (Util. Adjusted) 111 120 135 145 152
Add: Deepwater Floater Supply (Util. Adjusted) 68 68 68 69 70
Less: Ultra/Deepwater Floater Demand (152) (182) (191) (208) (226)
Equals: Current Ultra/Deepwater Suplus/(Deficit) 27 6 12 6 (4)
Less: Floater Demand Assumed "Pushed to Right" (Previous Year) - (15) (10) (22) (39)
Less: Carried Ultra/Deepwater Floater From Rig Deficit - - (9) (7) (23)
Equals: Current & Carried Ultra/Deepwater Suplus/(Deficit) 27 (9) (7) (23) (67)
Add: Midwater Floater Supply (Util. Adjusted) 85 92 97 100 100
Less: Midwater Floater Demand (62) (83) (82) (71) (69)
Equals: Current Midwater Suplus/(Deficit) 23 9 15 29 31
Less: Floater Demand Assumed "Pushed to Right" (Previous Year) - (7) (10) (18) (22)
Less: Carried Midwater Floater Demand - - - - -
Equals: Current & Carried Midwater Suplus/(Deficit) 23 2 5 11 9
Floaters Rolling Off Contract Screening for Retirement 33 27 25 6 2
Petrobras/Brazil Rigs Likely Delayed/Cancelled - 1 6 6 6
Ultra/deepwater demand remains strong,
but mid-water activity slows in the
forecast.
Guggenheim Securities, LLC | 972-638-5502 | guggenheimsecurities.com
<p>Oilfield Services & Offshore Drillers</p> PAGE 10
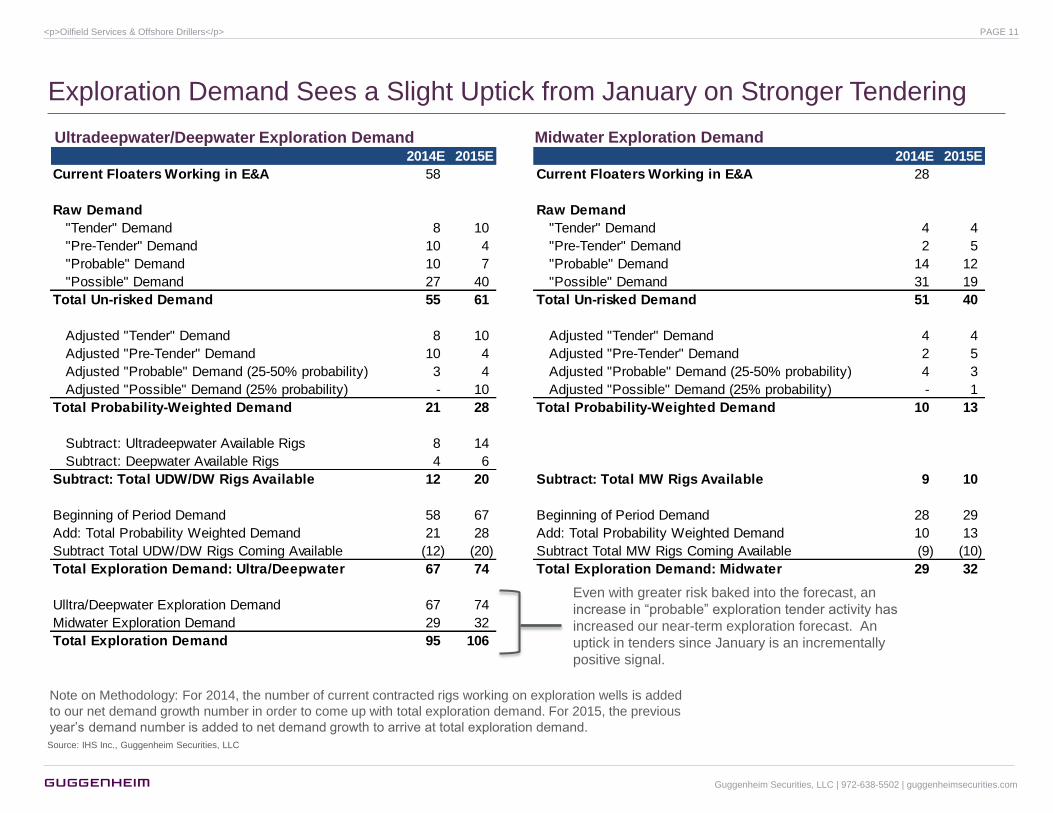
Exploration Demand Sees a Slight Uptick from January on Stronger Tendering
Source: IHS Inc., Guggenheim Securities, LLC
Ultradeepwater/Deepwater Exploration Demand Midwater Exploration Demand
Note on Methodology: For 2014, the number of current contracted rigs working on exploration wells is added
to our net demand growth number in order to come up with total exploration demand. For 2015, the previous
year‘s demand number is added to net demand growth to arrive at total exploration demand.
2014E 2015E 2014E 2015E
Current Floaters Working in E&A 58 Current Floaters Working in E&A 28
Raw Demand Raw Demand
"Tender" Demand 8 10 "Tender" Demand 4 4
"Pre-Tender" Demand 10 4 "Pre-Tender" Demand 2 5
"Probable" Demand 10 7 "Probable" Demand 14 12
"Possible" Demand 27 40 "Possible" Demand 31 19
Total Un-risked Demand 55 61 Total Un-risked Demand 51 40
Adjusted "Tender" Demand 8 10 Adjusted "Tender" Demand 4 4
Adjusted "Pre-Tender" Demand 10 4 Adjusted "Pre-Tender" Demand 2 5
Adjusted "Probable" Demand (25-50% probability) 3 4 Adjusted "Probable" Demand (25-50% probability) 4 3
Adjusted "Possible" Demand (25% probability) - 10 Adjusted "Possible" Demand (25% probability) - 1
Total Probability-Weighted Demand 21 28 Total Probability-Weighted Demand 10 13
Subtract: Ultradeepwater Available Rigs 8 14
Subtract: Deepwater Available Rigs 4 6
Subtract: Total UDW/DW Rigs Available 12 20 Subtract: Total MW Rigs Available 9 10
Beginning of Period Demand 58 67 Beginning of Period Demand 28 29
Add: Total Probability Weighted Demand 21 28 Add: Total Probability Weighted Demand 10 13
Subtract Total UDW/DW Rigs Coming Available (12) (20) Subtract Total MW Rigs Coming Available (9) (10)
Total Exploration Demand: Ultra/Deepwater 67 74 Total Exploration Demand: Midwater 29 32
Ulltra/Deepwater Exploration Demand 67 74
Midwater Exploration Demand 29 32
Total Exploration Demand 95 106
Even with greater risk baked into the forecast, an
increase in ―probable‖ exploration tender activity has
increased our near-term exploration forecast. An
uptick in tenders since January is an incrementally
positive signal.
Guggenheim Securities, LLC | 972-638-5502 | guggenheimsecurities.com
<p>Oilfield Services & Offshore Drillers</p> PAGE 11
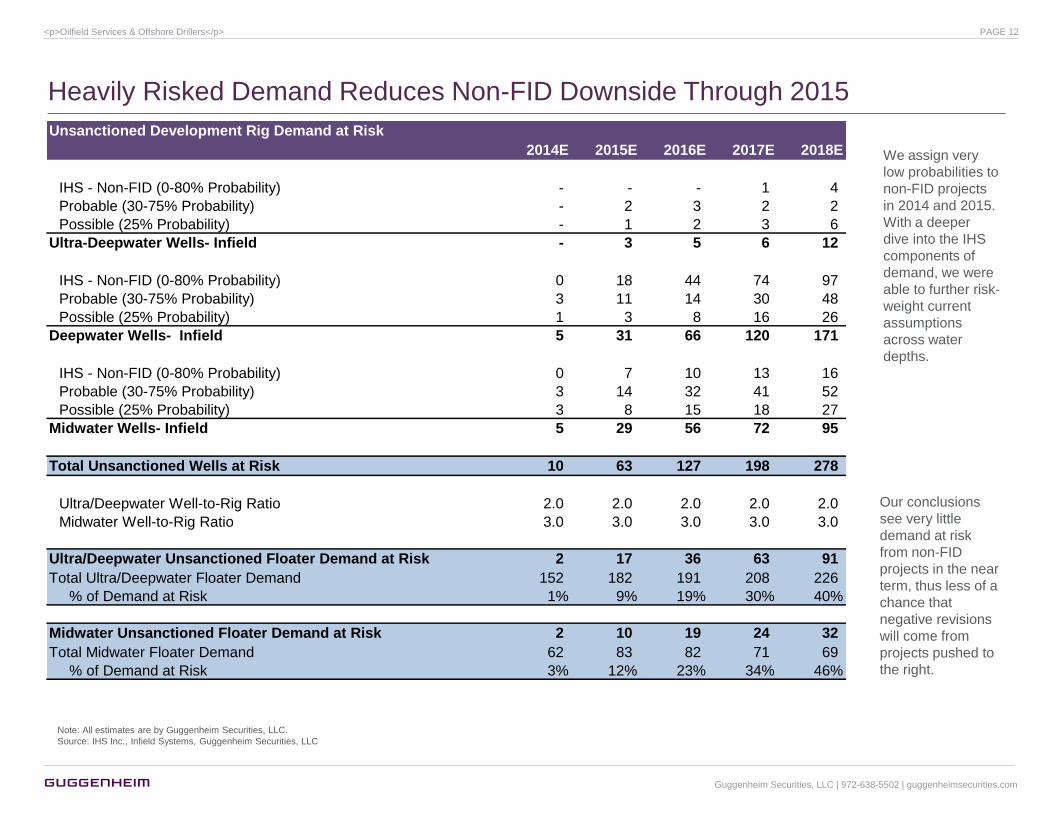
Unsanctioned Development Rig Demand at Risk
2014E 2015E 2016E 2017E 2018E
IHS - Non-FID (0-80% Probability) - - - 1 4
Probable (30-75% Probability) - 2 3 2 2
Possible (25% Probability) - 1 2 3 6
Ultra-Deepwater Wells- Infield - 3 5 6 12
IHS - Non-FID (0-80% Probability) 0 18 44 74 97
Probable (30-75% Probability) 3 11 14 30 48
Possible (25% Probability) 1 3 8 16 26
Deepwater Wells- Infield 5 31 66 120 171
IHS - Non-FID (0-80% Probability) 0 7 10 13 16
Probable (30-75% Probability) 3 14 32 41 52
Possible (25% Probability) 3 8 15 18 27
Midwater Wells- Infield 5 29 56 72 95
Total Unsanctioned Wells at Risk 10 63 127 198 278
Ultra/Deepwater Well-to-Rig Ratio 2.0 2.0 2.0 2.0 2.0
Midwater Well-to-Rig Ratio 3.0 3.0 3.0 3.0 3.0
Ultra/Deepwater Unsanctioned Floater Demand at Risk 2 17 36 63 91
Total Ultra/Deepwater Floater Demand 152 182 191 208 226
% of Demand at Risk 1% 9% 19% 30% 40%
Midwater Unsanctioned Floater Demand at Risk 2 10 19 24 32
Total Midwater Floater Demand 62 83 82 71 69
% of Demand at Risk 3% 12% 23% 34% 46%
Heavily Risked Demand Reduces Non-FID Downside Through 2015
We assign very
low probabilities to
non-FID projects
in 2014 and 2015.
With a deeper
dive into the IHS
components of
demand, we were
able to further risk-
weight current
assumptions
across water
depths.
Our conclusions
see very little
demand at risk
from non-FID
projects in the near
term, thus less of a
chance that
negative revisions
will come from
projects pushed to
the right.
Note: All estimates are by Guggenheim Securities, LLC.
Source: IHS Inc., Infield Systems, Guggenheim Securities, LLC
Guggenheim Securities, LLC | 972-638-5502 | guggenheimsecurities.com
<p>Oilfield Services & Offshore Drillers</p> PAGE 12
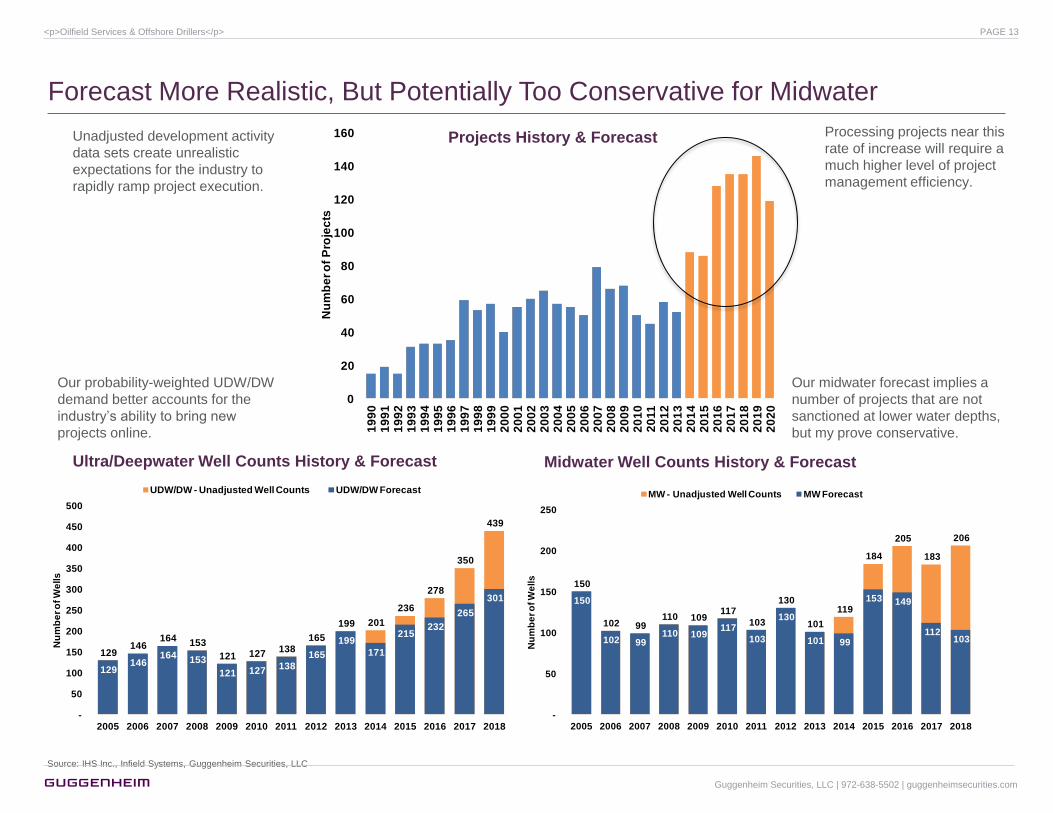
Forecast More Realistic, But Potentially Too Conservative for Midwater
Unadjusted development activity
data sets create unrealistic
expectations for the industry to
rapidly ramp project execution.
0
20
40
60
80
100
120
140
160
19
90
19
91
19
92
19
93
19
94
19
95
19
96
19
97
19
98
19
99
20
00
20
01
20
02
20
03
20
04
20
05
20
06
20
07
20
08
20
09
20
10
20
11
20
12
20
13
20
14
20
15
20
16
20
17
20
18
20
19
20
20
Nu
mb
er o
f P
roje
cts
Source: IHS Inc., Infield Systems, Guggenheim Securities, LLC
Projects History & Forecast
Ultra/Deepwater Well Counts History & Forecast Midwater Well Counts History & Forecast
Our probability-weighted UDW/DW
demand better accounts for the
industry‘s ability to bring new
projects online.
Our midwater forecast implies a
number of projects that are not
sanctioned at lower water depths,
but my prove conservative.
Processing projects near this
rate of increase will require a
much higher level of project
management efficiency.
150
102 99 110 109
117
103
130
101
119
184
205
183
206
150
102 99 110 109
117
103
130
101 99
153 149
112 103
-
50
100
150
200
250
2005 2006 2007 2008 2009 2010 2011 2012 2013 2014 2015 2016 2017 2018
Nu
mb
er o
f W
ells
MW - Unadjusted Well Counts MW Forecast
129 146
164 153
121 127 138
165
199 201
236
278
350
439
129 146
164 153
121 127 138
165
199
171
215 232
265
301
-
50
100
150
200
250
300
350
400
450
500
2005 2006 2007 2008 2009 2010 2011 2012 2013 2014 2015 2016 2017 2018
Nu
mb
er o
f W
ells
UDW/DW - Unadjusted Well Counts UDW/DW Forecast
Guggenheim Securities, LLC | 972-638-5502 | guggenheimsecurities.com
<p>Oilfield Services & Offshore Drillers</p> PAGE 13
60
65
70
75
80
85
90
95
100
105
110
115
120
125
130
1Q
04
3Q
04
1Q
05
3Q
05
1Q
06
3Q
06
1Q
07
3Q
07
1Q
08
3Q
08
1Q
09
3Q
09
1Q
10
3Q
10
1Q
11
3Q
11
1Q
12
3Q
12
1Q
13
3Q
13
1Q
14
3Q
14
1Q
15
3Q
15
1Q
16
3Q
16
1Q
17
3Q
17
1Q
18
3Q
18
40
50
60
70
80
90
100
110
120
130
140
150
160
170
180
1Q
04
3Q
04
1Q
05
3Q
05
1Q
06
3Q
06
1Q
07
3Q
07
1Q
08
3Q
08
1Q
09
3Q
09
1Q
10
3Q
10
1Q
11
3Q
11
1Q
12
3Q
12
1Q
13
3Q
13
1Q
14
3Q
14
1Q
15
3Q
15
1Q
16
3Q
16
1Q
17
3Q
17
1Q
18
3Q
18
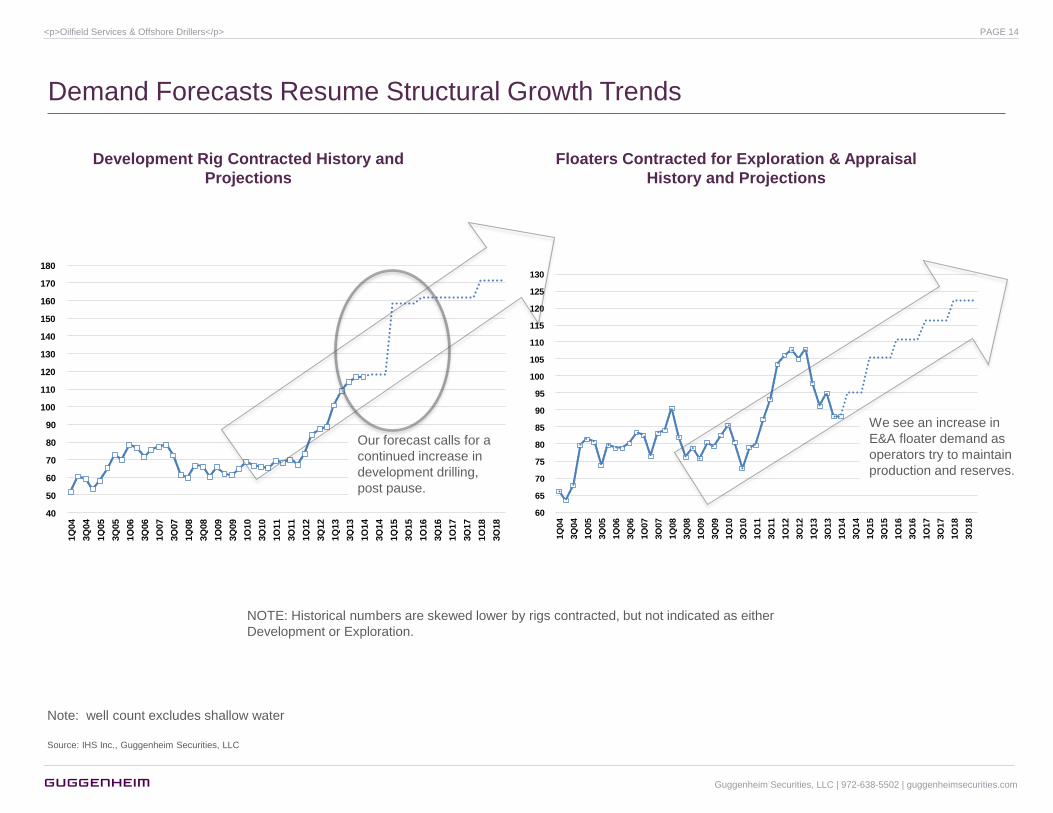
Demand Forecasts Resume Structural Growth Trends
We see an increase in
E&A floater demand as
operators try to maintain
production and reserves.
Development Rig Contracted History and
Projections
Floaters Contracted for Exploration & Appraisal
History and Projections
Our forecast calls for a
continued increase in
development drilling,
post pause.
Source: IHS Inc., Guggenheim Securities, LLC
Note: well count excludes shallow water
NOTE: Historical numbers are skewed lower by rigs contracted, but not indicated as either
Development or Exploration.
Guggenheim Securities, LLC | 972-638-5502 | guggenheimsecurities.com
<p>Oilfield Services & Offshore Drillers</p> PAGE 14
70%
75%
80%
85%
90%
95%
110 120 130 140 150 160 170 180 190 200 210 220 230 240 250 260 270 280 290 300 310 320 330 340 350 360
1Q
04
3Q
04
1Q
05
3Q
05
1Q
06
3Q
06
1Q
07
3Q
07
1Q
08
3Q
08
1Q
09
3Q
09
1Q
10
3Q
10
1Q
11
3Q
11
1Q
12
3Q
12
1Q
13
3Q
13
1Q
14
3Q
14
1Q
15
3Q
15
1Q
16
3Q
16
1Q
17
3Q
17
1Q
18
3Q
18
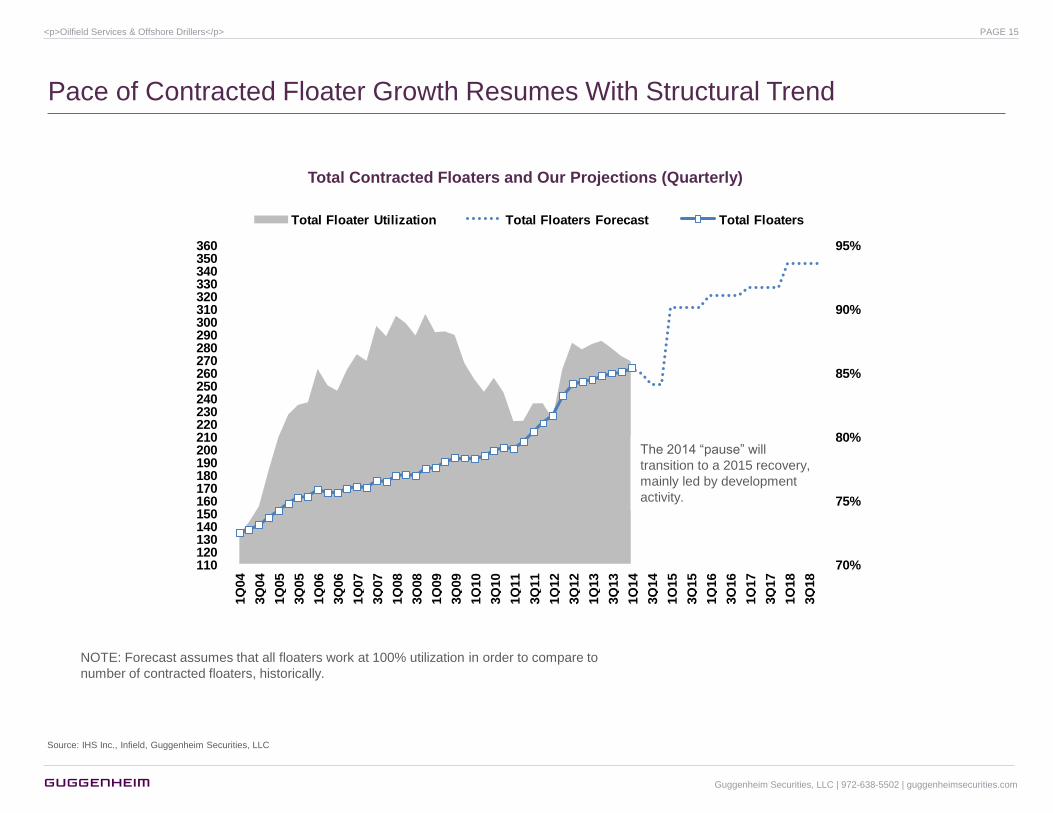
Total Floater Utilization Total Floaters Forecast Total Floaters
Pace of Contracted Floater Growth Resumes With Structural Trend
Total Contracted Floaters and Our Projections (Quarterly)
Source: IHS Inc., Infield, Guggenheim Securities, LLC
The 2014 ―pause‖ will
transition to a 2015 recovery,
mainly led by development
activity.
NOTE: Forecast assumes that all floaters work at 100% utilization in order to compare to
number of contracted floaters, historically.
Guggenheim Securities, LLC | 972-638-5502 | guggenheimsecurities.com
<p>Oilfield Services & Offshore Drillers</p> PAGE 15
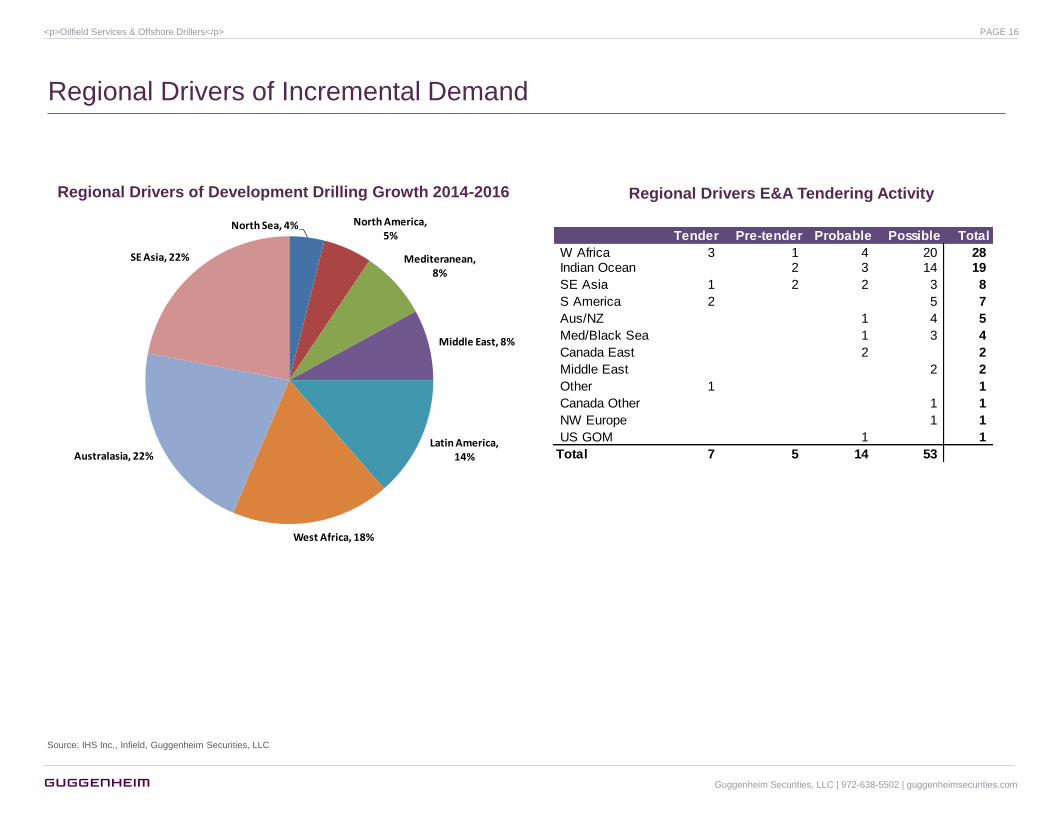
Regional Drivers of Incremental Demand
Regional Drivers of Development Drilling Growth 2014-2016
Source: IHS Inc., Infield, Guggenheim Securities, LLC
North Sea, 4% North America, 5%
Mediteranean, 8%
Middle East, 8%
Latin America, 14%
West Africa, 18%
Australasia, 22%
SE Asia, 22%
Regional Drivers E&A Tendering Activity
Tender Pre-tender Probable Possible Total
W Africa 3 1 4 20 28 Indian Ocean 2 3 14 19
SE Asia 1 2 2 3 8
S America 2 5 7
Aus/NZ 1 4 5
Med/Black Sea 1 3 4
Canada East 2 2
Middle East 2 2
Other 1 1
Canada Other 1 1
NW Europe 1 1
US GOM 1 1
Total 7 5 14 53
Guggenheim Securities, LLC | 972-638-5502 | guggenheimsecurities.com
<p>Oilfield Services & Offshore Drillers</p> PAGE 16
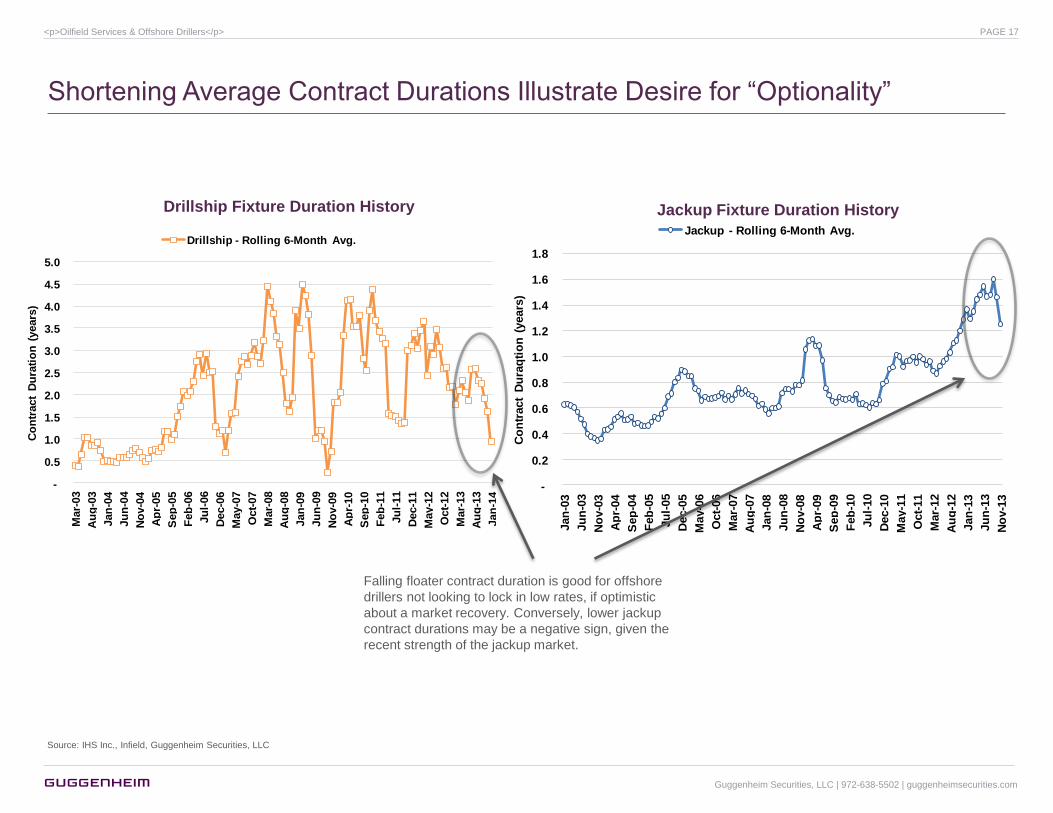
Shortening Average Contract Durations Illustrate Desire for ―Optionality‖
-
0.5
1.0
1.5
2.0
2.5
3.0
3.5
4.0
4.5
5.0
Mar-
03
Au
g-0
3
Jan
-04
Ju
n-0
4
No
v-0
4
Ap
r-05
Sep
-05
Feb
-06
Ju
l-06
Dec-0
6
May-0
7
Oct-
07
Mar-
08
Au
g-0
8
Jan
-09
Ju
n-0
9
No
v-0
9
Ap
r-10
Sep
-10
Feb
-11
Ju
l-11
Dec-1
1
May-1
2
Oct-
12
Mar-
13
Au
g-1
3
Jan
-14
Co
ntr
act
Du
rati
on
(years
)
Drillship - Rolling 6-Month Avg.
-
0.2
0.4
0.6
0.8
1.0
1.2
1.4
1.6
1.8
Jan
-03
Ju
n-0
3
No
v-0
3
Ap
r-04
Sep
-04
Feb
-05
Ju
l-05
Dec-0
5
May-0
6
Oct-
06
Mar-
07
Au
g-0
7
Jan
-08
Ju
n-0
8
No
v-0
8
Ap
r-09
Sep
-09
Feb
-10
Ju
l-10
Dec-1
0
May-1
1
Oct-
11
Mar-
12
Au
g-1
2
Jan
-13
Ju
n-1
3
No
v-1
3
Co
ntr
act
Du
raq
tio
n (
years
)
Jackup - Rolling 6-Month Avg.
Drillship Fixture Duration History Jackup Fixture Duration History
Falling floater contract duration is good for offshore
drillers not looking to lock in low rates, if optimistic
about a market recovery. Conversely, lower jackup
contract durations may be a negative sign, given the
recent strength of the jackup market.
Source: IHS Inc., Infield, Guggenheim Securities, LLC
Guggenheim Securities, LLC | 972-638-5502 | guggenheimsecurities.com
<p>Oilfield Services & Offshore Drillers</p> PAGE 17
Ma
y-14
Au
g-14
No
v-14
Feb-15
Jun
-15
Sep-15
Dec-15
Bredford Dolphin
Noble Therald Martin
Nanhai VI
GSF Grand Banks
GSF Rig 135
Ocean Nomad
Actinia
Ocean Guardian
Transocean Searcher
Noble Ton van Langeveld
Ocean Concord
Transocean Prospect
Noble Phoenix
Ocean Winner
Ocean Worker
Ocean Vanguard
ENSCO 5001
Stena Clyde
Atwood Hunter
Kan Tan III
Ocean Quest
Peregrine I
Sedco 707
Transocean Legend
Kan Tan IV
Songa Mercur
GSF Rig 140
Ocean Yatzy
Olinda Star
GSF Arctic III
ENSCO 6000
Ocean Princess
Ocean Yorktown
Songa Venus
M.G. Hulme, Jr.
Ocean General
Noble Driller
Borgny Dolphin
ENSCO 5005
Ocean Lexington
Ocean Saratoga
ENSCO 5002
Transocean Amirante
Ocean Star
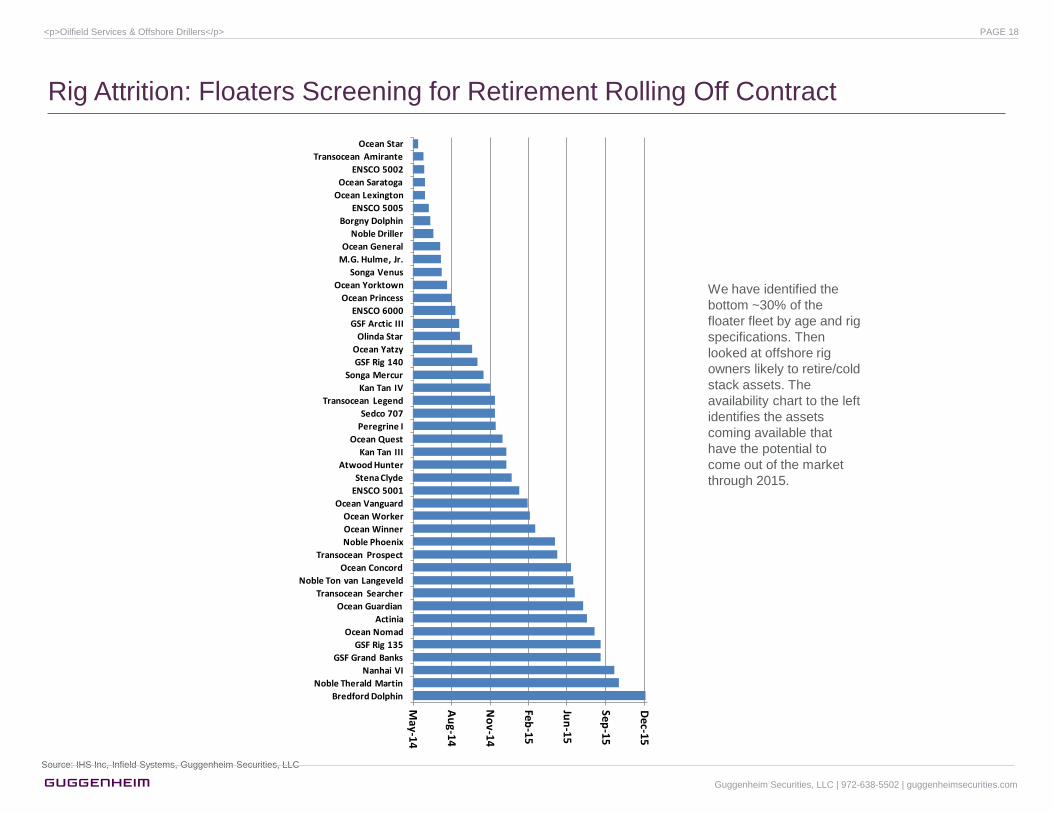
Rig Attrition: Floaters Screening for Retirement Rolling Off Contract
Source: IHS Inc, Infield Systems, Guggenheim Securities, LLC
We have identified the
bottom ~30% of the
floater fleet by age and rig
specifications. Then
looked at offshore rig
owners likely to retire/cold
stack assets. The
availability chart to the left
identifies the assets
coming available that
have the potential to
come out of the market
through 2015.
Guggenheim Securities, LLC | 972-638-5502 | guggenheimsecurities.com
<p>Oilfield Services & Offshore Drillers</p> PAGE 18
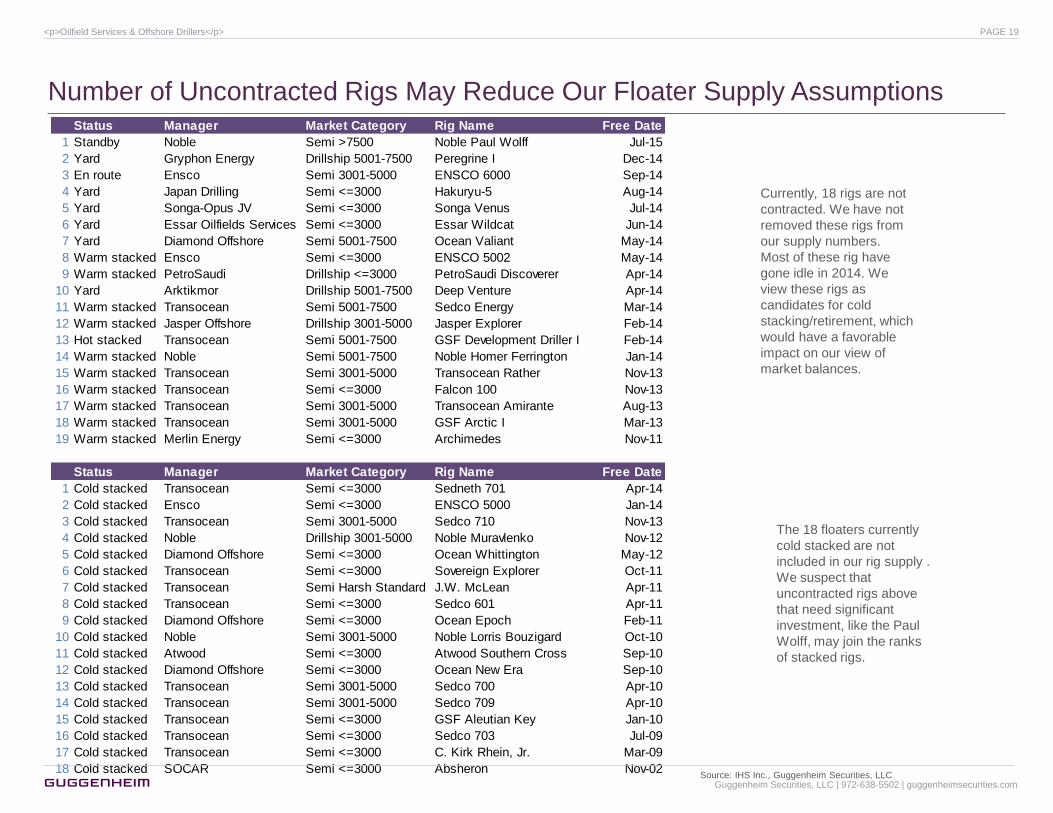
Number of Uncontracted Rigs May Reduce Our Floater Supply Assumptions Status Manager Market Category Rig Name Free Date
1 Standby Noble Semi >7500 Noble Paul Wolff Jul-15
2 Yard Gryphon Energy Drillship 5001-7500 Peregrine I Dec-14
3 En route Ensco Semi 3001-5000 ENSCO 6000 Sep-14
4 Yard Japan Drilling Semi <=3000 Hakuryu-5 Aug-14
5 Yard Songa-Opus JV Semi <=3000 Songa Venus Jul-14
6 Yard Essar Oilfields Services Semi <=3000 Essar Wildcat Jun-14
7 Yard Diamond Offshore Semi 5001-7500 Ocean Valiant May-14
8 Warm stacked Ensco Semi <=3000 ENSCO 5002 May-14
9 Warm stacked PetroSaudi Drillship <=3000 PetroSaudi Discoverer Apr-14
10 Yard Arktikmor Drillship 5001-7500 Deep Venture Apr-14
11 Warm stacked Transocean Semi 5001-7500 Sedco Energy Mar-14
12 Warm stacked Jasper Offshore Drillship 3001-5000 Jasper Explorer Feb-14
13 Hot stacked Transocean Semi 5001-7500 GSF Development Driller I Feb-14
14 Warm stacked Noble Semi 5001-7500 Noble Homer Ferrington Jan-14
15 Warm stacked Transocean Semi 3001-5000 Transocean Rather Nov-13
16 Warm stacked Transocean Semi <=3000 Falcon 100 Nov-13
17 Warm stacked Transocean Semi 3001-5000 Transocean Amirante Aug-13
18 Warm stacked Transocean Semi 3001-5000 GSF Arctic I Mar-13
19 Warm stacked Merlin Energy Semi <=3000 Archimedes Nov-11
Status Manager Market Category Rig Name Free Date
1 Cold stacked Transocean Semi <=3000 Sedneth 701 Apr-14
2 Cold stacked Ensco Semi <=3000 ENSCO 5000 Jan-14
3 Cold stacked Transocean Semi 3001-5000 Sedco 710 Nov-13
4 Cold stacked Noble Drillship 3001-5000 Noble Muravlenko Nov-12
5 Cold stacked Diamond Offshore Semi <=3000 Ocean Whittington May-12
6 Cold stacked Transocean Semi <=3000 Sovereign Explorer Oct-11
7 Cold stacked Transocean Semi Harsh Standard J.W. McLean Apr-11
8 Cold stacked Transocean Semi <=3000 Sedco 601 Apr-11
9 Cold stacked Diamond Offshore Semi <=3000 Ocean Epoch Feb-11
10 Cold stacked Noble Semi 3001-5000 Noble Lorris Bouzigard Oct-10
11 Cold stacked Atwood Semi <=3000 Atwood Southern Cross Sep-10
12 Cold stacked Diamond Offshore Semi <=3000 Ocean New Era Sep-10
13 Cold stacked Transocean Semi 3001-5000 Sedco 700 Apr-10
14 Cold stacked Transocean Semi 3001-5000 Sedco 709 Apr-10
15 Cold stacked Transocean Semi <=3000 GSF Aleutian Key Jan-10
16 Cold stacked Transocean Semi <=3000 Sedco 703 Jul-09
17 Cold stacked Transocean Semi <=3000 C. Kirk Rhein, Jr. Mar-09
18 Cold stacked SOCAR Semi <=3000 Absheron Nov-02
Currently, 18 rigs are not
contracted. We have not
removed these rigs from
our supply numbers.
Most of these rig have
gone idle in 2014. We
view these rigs as
candidates for cold
stacking/retirement, which
would have a favorable
impact on our view of
market balances.
The 18 floaters currently
cold stacked are not
included in our rig supply .
We suspect that
uncontracted rigs above
that need significant
investment, like the Paul
Wolff, may join the ranks
of stacked rigs.
Source: IHS Inc., Guggenheim Securities, LLC Guggenheim Securities, LLC | 972-638-5502 | guggenheimsecurities.com
<p>Oilfield Services & Offshore Drillers</p> PAGE 19
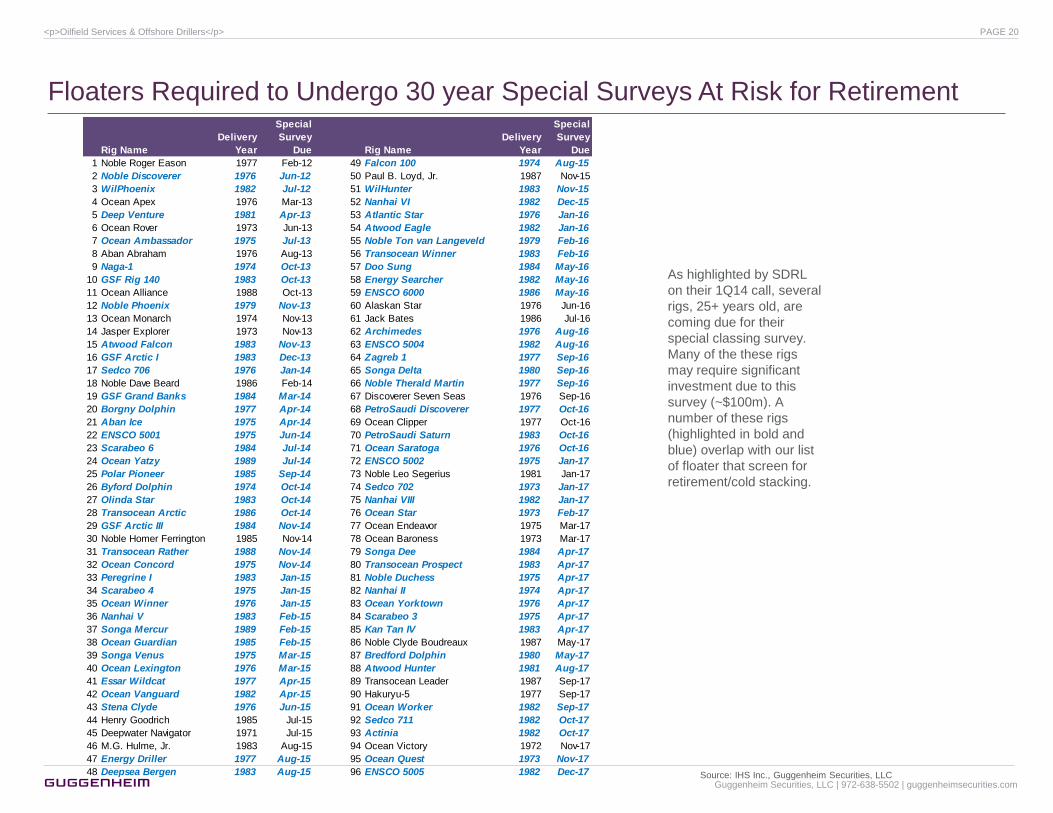
Floaters Required to Undergo 30 year Special Surveys At Risk for Retirement
As highlighted by SDRL
on their 1Q14 call, several
rigs, 25+ years old, are
coming due for their
special classing survey.
Many of the these rigs
may require significant
investment due to this
survey (~$100m). A
number of these rigs
(highlighted in bold and
blue) overlap with our list
of floater that screen for
retirement/cold stacking.
Source: IHS Inc., Guggenheim Securities, LLC
Rig Name
Delivery
Year
Special
Survey
Due Rig Name
Delivery
Year
Special
Survey
Due
1 Noble Roger Eason 1977 Feb-12 49 Falcon 100 1974 Aug-15
2 Noble Discoverer 1976 Jun-12 50 Paul B. Loyd, Jr. 1987 Nov-15
3 WilPhoenix 1982 Jul-12 51 WilHunter 1983 Nov-15
4 Ocean Apex 1976 Mar-13 52 Nanhai VI 1982 Dec-15
5 Deep Venture 1981 Apr-13 53 Atlantic Star 1976 Jan-16
6 Ocean Rover 1973 Jun-13 54 Atwood Eagle 1982 Jan-16
7 Ocean Ambassador 1975 Jul-13 55 Noble Ton van Langeveld 1979 Feb-16
8 Aban Abraham 1976 Aug-13 56 Transocean Winner 1983 Feb-16
9 Naga-1 1974 Oct-13 57 Doo Sung 1984 May-16
10 GSF Rig 140 1983 Oct-13 58 Energy Searcher 1982 May-16
11 Ocean Alliance 1988 Oct-13 59 ENSCO 6000 1986 May-16
12 Noble Phoenix 1979 Nov-13 60 Alaskan Star 1976 Jun-16
13 Ocean Monarch 1974 Nov-13 61 Jack Bates 1986 Jul-16
14 Jasper Explorer 1973 Nov-13 62 Archimedes 1976 Aug-16
15 Atwood Falcon 1983 Nov-13 63 ENSCO 5004 1982 Aug-16
16 GSF Arctic I 1983 Dec-13 64 Zagreb 1 1977 Sep-16
17 Sedco 706 1976 Jan-14 65 Songa Delta 1980 Sep-16
18 Noble Dave Beard 1986 Feb-14 66 Noble Therald Martin 1977 Sep-16
19 GSF Grand Banks 1984 Mar-14 67 Discoverer Seven Seas 1976 Sep-16
20 Borgny Dolphin 1977 Apr-14 68 PetroSaudi Discoverer 1977 Oct-16
21 Aban Ice 1975 Apr-14 69 Ocean Clipper 1977 Oct-16
22 ENSCO 5001 1975 Jun-14 70 PetroSaudi Saturn 1983 Oct-16
23 Scarabeo 6 1984 Jul-14 71 Ocean Saratoga 1976 Oct-16
24 Ocean Yatzy 1989 Jul-14 72 ENSCO 5002 1975 Jan-17
25 Polar Pioneer 1985 Sep-14 73 Noble Leo Segerius 1981 Jan-17
26 Byford Dolphin 1974 Oct-14 74 Sedco 702 1973 Jan-17
27 Olinda Star 1983 Oct-14 75 Nanhai VIII 1982 Jan-17
28 Transocean Arctic 1986 Oct-14 76 Ocean Star 1973 Feb-17
29 GSF Arctic III 1984 Nov-14 77 Ocean Endeavor 1975 Mar-17
30 Noble Homer Ferrington 1985 Nov-14 78 Ocean Baroness 1973 Mar-17
31 Transocean Rather 1988 Nov-14 79 Songa Dee 1984 Apr-17
32 Ocean Concord 1975 Nov-14 80 Transocean Prospect 1983 Apr-17
33 Peregrine I 1983 Jan-15 81 Noble Duchess 1975 Apr-17
34 Scarabeo 4 1975 Jan-15 82 Nanhai II 1974 Apr-17
35 Ocean Winner 1976 Jan-15 83 Ocean Yorktown 1976 Apr-17
36 Nanhai V 1983 Feb-15 84 Scarabeo 3 1975 Apr-17
37 Songa Mercur 1989 Feb-15 85 Kan Tan IV 1983 Apr-17
38 Ocean Guardian 1985 Feb-15 86 Noble Clyde Boudreaux 1987 May-17
39 Songa Venus 1975 Mar-15 87 Bredford Dolphin 1980 May-17
40 Ocean Lexington 1976 Mar-15 88 Atwood Hunter 1981 Aug-17
41 Essar Wildcat 1977 Apr-15 89 Transocean Leader 1987 Sep-17
42 Ocean Vanguard 1982 Apr-15 90 Hakuryu-5 1977 Sep-17
43 Stena Clyde 1976 Jun-15 91 Ocean Worker 1982 Sep-17
44 Henry Goodrich 1985 Jul-15 92 Sedco 711 1982 Oct-17
45 Deepwater Navigator 1971 Jul-15 93 Actinia 1982 Oct-17
46 M.G. Hulme, Jr. 1983 Aug-15 94 Ocean Victory 1972 Nov-17
47 Energy Driller 1977 Aug-15 95 Ocean Quest 1973 Nov-17
48 Deepsea Bergen 1983 Aug-15 96 ENSCO 5005 1982 Dec-17
Guggenheim Securities, LLC | 972-638-5502 | guggenheimsecurities.com
<p>Oilfield Services & Offshore Drillers</p> PAGE 20
Dayrate Forecast: Trough & Recovery
Guggenheim Securities, LLC | 972-638-5502 | guggenheimsecurities.com
<p>Oilfield Services & Offshore Drillers</p> PAGE 21
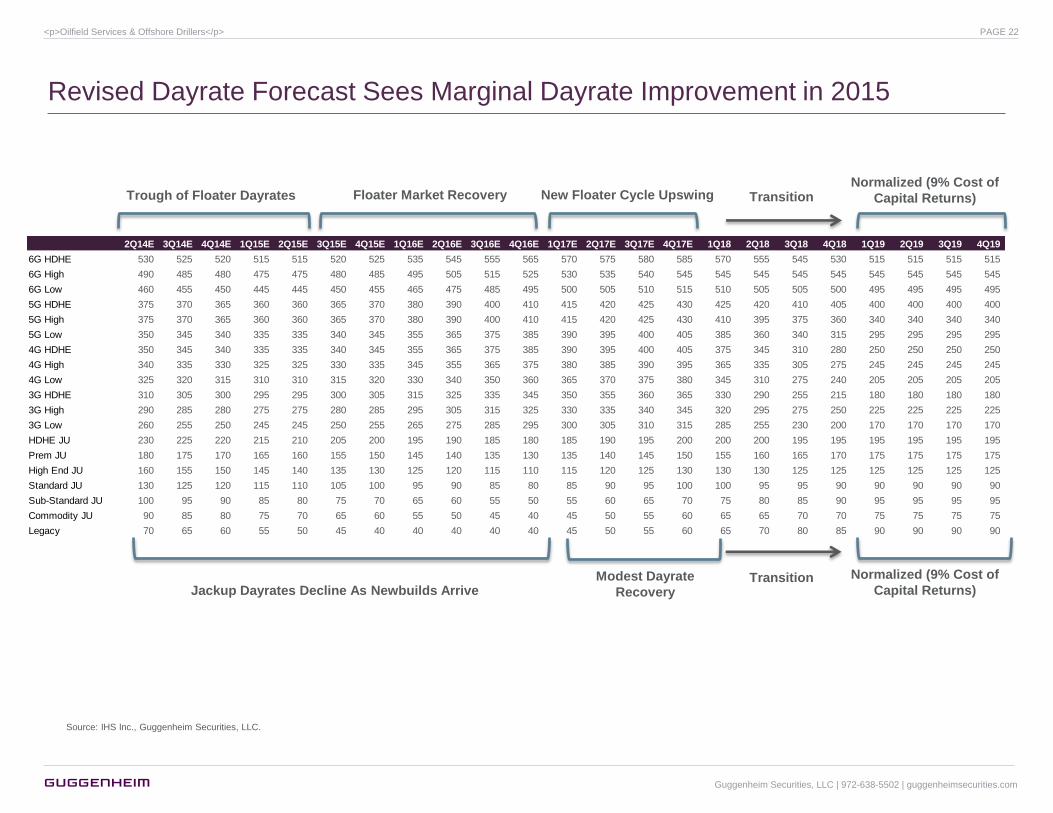
Revised Dayrate Forecast Sees Marginal Dayrate Improvement in 2015
Source: IHS Inc., Guggenheim Securities, LLC.
2Q14E 3Q14E 4Q14E 1Q15E 2Q15E 3Q15E 4Q15E 1Q16E 2Q16E 3Q16E 4Q16E 1Q17E 2Q17E 3Q17E 4Q17E 1Q18 2Q18 3Q18 4Q18 1Q19 2Q19 3Q19 4Q19
6G HDHE 530 525 520 515 515 520 525 535 545 555 565 570 575 580 585 570 555 545 530 515 515 515 515
6G High 490 485 480 475 475 480 485 495 505 515 525 530 535 540 545 545 545 545 545 545 545 545 545
6G Low 460 455 450 445 445 450 455 465 475 485 495 500 505 510 515 510 505 505 500 495 495 495 495
5G HDHE 375 370 365 360 360 365 370 380 390 400 410 415 420 425 430 425 420 410 405 400 400 400 400
5G High 375 370 365 360 360 365 370 380 390 400 410 415 420 425 430 410 395 375 360 340 340 340 340
5G Low 350 345 340 335 335 340 345 355 365 375 385 390 395 400 405 385 360 340 315 295 295 295 295
4G HDHE 350 345 340 335 335 340 345 355 365 375 385 390 395 400 405 375 345 310 280 250 250 250 250
4G High 340 335 330 325 325 330 335 345 355 365 375 380 385 390 395 365 335 305 275 245 245 245 245
4G Low 325 320 315 310 310 315 320 330 340 350 360 365 370 375 380 345 310 275 240 205 205 205 205
3G HDHE 310 305 300 295 295 300 305 315 325 335 345 350 355 360 365 330 290 255 215 180 180 180 180
3G High 290 285 280 275 275 280 285 295 305 315 325 330 335 340 345 320 295 275 250 225 225 225 225
3G Low 260 255 250 245 245 250 255 265 275 285 295 300 305 310 315 285 255 230 200 170 170 170 170
HDHE JU 230 225 220 215 210 205 200 195 190 185 180 185 190 195 200 200 200 195 195 195 195 195 195
Prem JU 180 175 170 165 160 155 150 145 140 135 130 135 140 145 150 155 160 165 170 175 175 175 175
High End JU 160 155 150 145 140 135 130 125 120 115 110 115 120 125 130 130 130 125 125 125 125 125 125
Standard JU 130 125 120 115 110 105 100 95 90 85 80 85 90 95 100 100 95 95 90 90 90 90 90
Sub-Standard JU 100 95 90 85 80 75 70 65 60 55 50 55 60 65 70 75 80 85 90 95 95 95 95
Commodity JU 90 85 80 75 70 65 60 55 50 45 40 45 50 55 60 65 65 70 70 75 75 75 75
Legacy 70 65 60 55 50 45 40 40 40 40 40 45 50 55 60 65 70 80 85 90 90 90 90
Trough of Floater Dayrates Floater Market Recovery New Floater Cycle Upswing Normalized (9% Cost of
Capital Returns) Transition
Jackup Dayrates Decline As Newbuilds Arrive
Normalized (9% Cost of
Capital Returns) Transition Modest Dayrate
Recovery
Guggenheim Securities, LLC | 972-638-5502 | guggenheimsecurities.com
<p>Oilfield Services & Offshore Drillers</p> PAGE 22
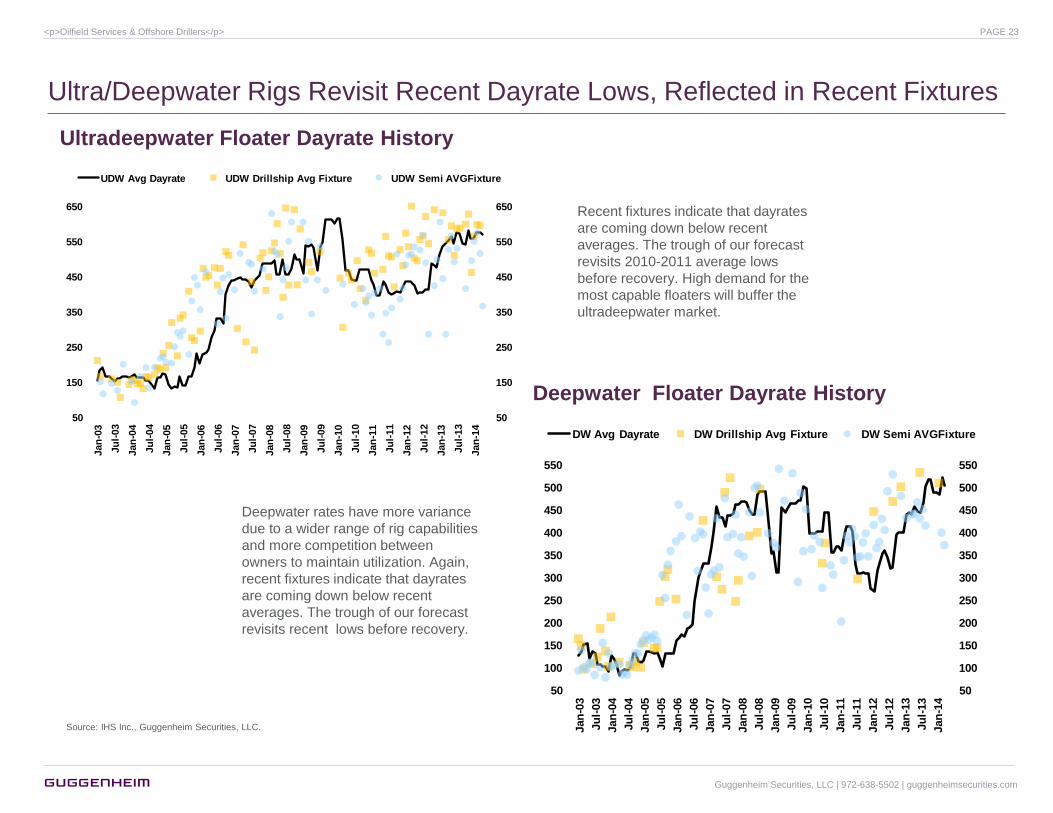
Ultra/Deepwater Rigs Revisit Recent Dayrate Lows, Reflected in Recent Fixtures
Source: IHS Inc., Guggenheim Securities, LLC.
Ultradeepwater Floater Dayrate History
Deepwater Floater Dayrate History
Recent fixtures indicate that dayrates
are coming down below recent
averages. The trough of our forecast
revisits 2010-2011 average lows
before recovery. High demand for the
most capable floaters will buffer the
ultradeepwater market.
Deepwater rates have more variance
due to a wider range of rig capabilities
and more competition between
owners to maintain utilization. Again,
recent fixtures indicate that dayrates
are coming down below recent
averages. The trough of our forecast
revisits recent lows before recovery.
50
100
150
200
250
300
350
400
450
500
550
50
100
150
200
250
300
350
400
450
500
550
Jan
-03
Ju
l-03
Jan
-04
Ju
l-04
Jan
-05
Ju
l-05
Jan
-06
Ju
l-06
Jan
-07
Ju
l-07
Jan
-08
Ju
l-08
Jan
-09
Ju
l-09
Jan
-10
Ju
l-10
Jan
-11
Ju
l-11
Jan
-12
Ju
l-12
Jan
-13
Ju
l-13
Jan
-14
DW Avg Dayrate DW Drillship Avg Fixture DW Semi AVGFixture
50
150
250
350
450
550
650
50
150
250
350
450
550
650
Jan
-03
Ju
l-03
Jan
-04
Ju
l-04
Jan
-05
Ju
l-05
Jan
-06
Ju
l-06
Jan
-07
Ju
l-07
Jan
-08
Ju
l-08
Jan
-09
Ju
l-09
Jan
-10
Ju
l-10
Jan
-11
Ju
l-11
Jan
-12
Ju
l-12
Jan
-13
Ju
l-13
Jan
-14
UDW Avg Dayrate UDW Drillship Avg Fixture UDW Semi AVGFixture
Guggenheim Securities, LLC | 972-638-5502 | guggenheimsecurities.com
<p>Oilfield Services & Offshore Drillers</p> PAGE 23
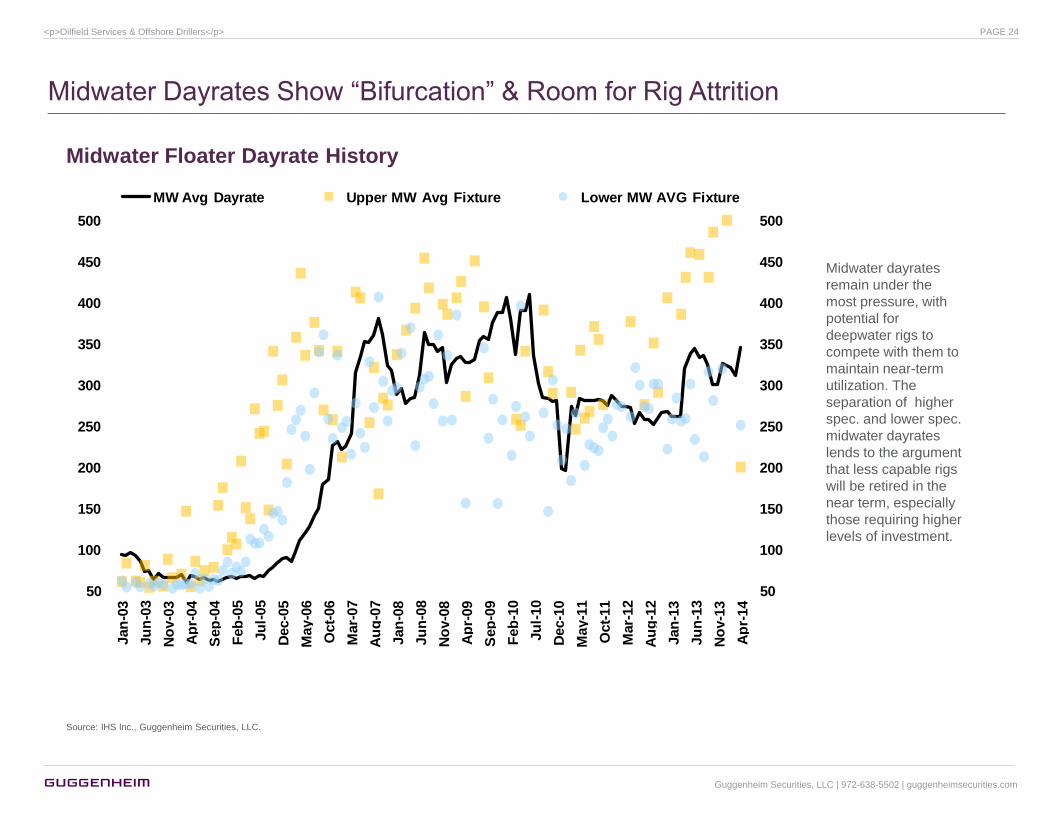
Midwater Dayrates Show ―Bifurcation‖ & Room for Rig Attrition
Source: IHS Inc., Guggenheim Securities, LLC.
Midwater Floater Dayrate History
Midwater dayrates
remain under the
most pressure, with
potential for
deepwater rigs to
compete with them to
maintain near-term
utilization. The
separation of higher
spec. and lower spec.
midwater dayrates
lends to the argument
that less capable rigs
will be retired in the
near term, especially
those requiring higher
levels of investment.
50
100
150
200
250
300
350
400
450
500
50
100
150
200
250
300
350
400
450
500
Jan
-03
Ju
n-0
3
No
v-0
3
Ap
r-04
Sep
-04
Feb
-05
Ju
l-05
Dec-0
5
May-0
6
Oct-
06
Mar-
07
Au
g-0
7
Jan
-08
Ju
n-0
8
No
v-0
8
Ap
r-09
Sep
-09
Feb
-10
Ju
l-10
Dec-1
0
May-1
1
Oct-
11
Mar-
12
Au
g-1
2
Jan
-13
Ju
n-1
3
No
v-1
3
Ap
r-14
MW Avg Dayrate Upper MW Avg Fixture Lower MW AVG Fixture
Guggenheim Securities, LLC | 972-638-5502 | guggenheimsecurities.com
<p>Oilfield Services & Offshore Drillers</p> PAGE 24
50
100
150
200
250
300
350
400
450
500
550
600
650
50
100
150
200
250
300
350
400
450
500
550
600
650
Jan
-03
Ju
n-0
3
No
v-0
3
Ap
r-04
Sep
-04
Feb
-05
Ju
l-05
Dec-0
5
May-0
6
Oct-
06
Mar-
07
Au
g-0
7
Jan
-08
Ju
n-0
8
No
v-0
8
Ap
r-09
Sep
-09
Feb
-10
Ju
l-10
Dec-1
0
May-1
1
Oct-
11
Mar-
12
Au
g-1
2
Jan
-13
Ju
n-1
3
No
v-1
3
Ap
r-14
Harsh Env. Avg Dayrate Harsh Deepwater Avg. Fixture
Harsh High Spec Avg. Fixture Harsh Standard Avg. Fixture
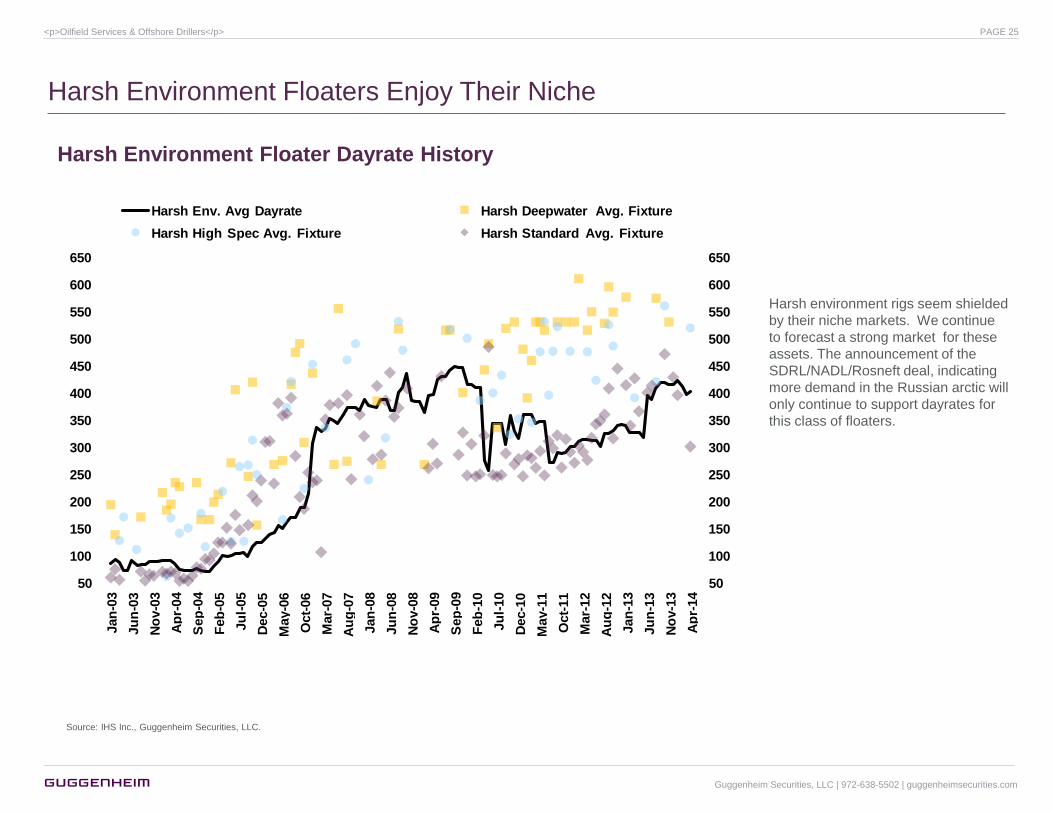
Harsh Environment Floaters Enjoy Their Niche
Source: IHS Inc., Guggenheim Securities, LLC.
Harsh Environment Floater Dayrate History
Harsh environment rigs seem shielded
by their niche markets. We continue
to forecast a strong market for these
assets. The announcement of the
SDRL/NADL/Rosneft deal, indicating
more demand in the Russian arctic will
only continue to support dayrates for
this class of floaters.
Guggenheim Securities, LLC | 972-638-5502 | guggenheimsecurities.com
<p>Oilfield Services & Offshore Drillers</p> PAGE 25
20
30
40
50
60
70
80
90
100
110
120
130
140
150
160
170
180
190
200
210
20
30
40
50
60
70
80
90
100
110
120
130
140
150
160
170
180
190
200
210
Jan
-03
Ju
n-0
3
No
v-0
3
Ap
r-04
Sep
-04
Feb
-05
Ju
l-05
Dec-0
5
May-0
6
Oct-
06
Mar-
07
Au
g-0
7
Jan
-08
Ju
n-0
8
No
v-0
8
Ap
r-09
Sep
-09
Feb
-10
Ju
l-10
Dec-1
0
May-1
1
Oct-
11
Mar-
12
Au
g-1
2
Jan
-13
Ju
n-1
3
No
v-1
3
Ap
r-14
JU >300ft Avg. Dayrate JU Premium Avg. Fixture JU High End Avg. Fixture
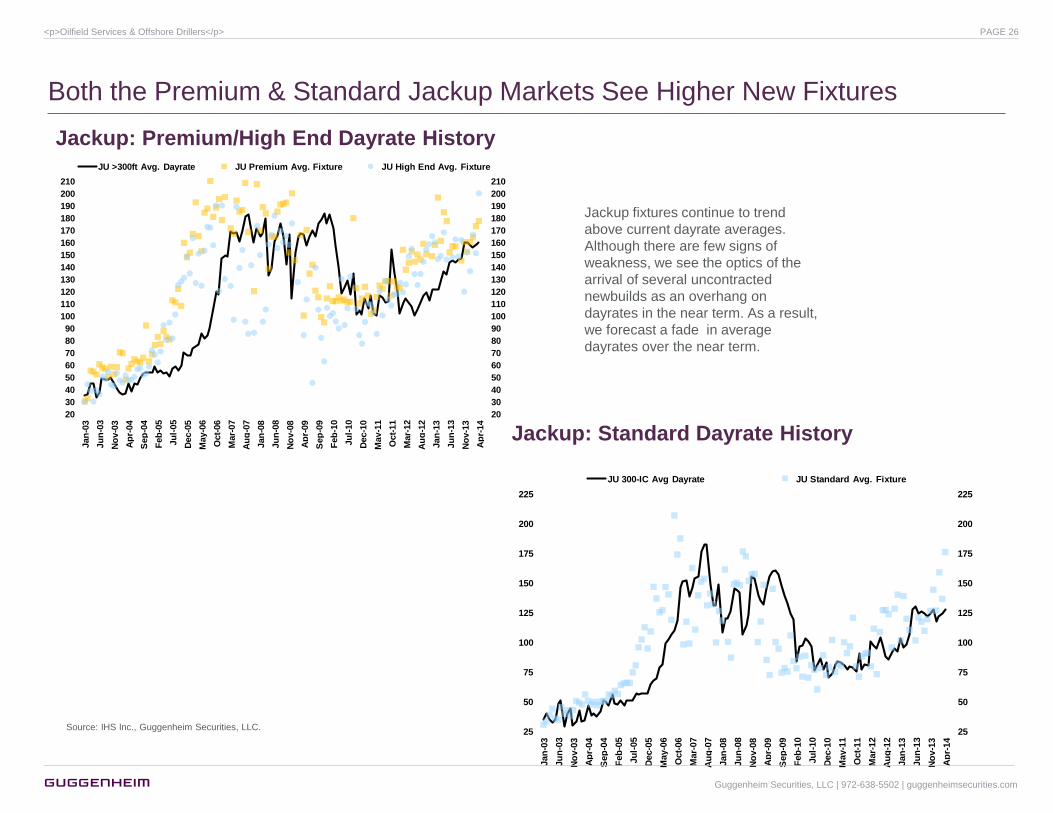
Both the Premium & Standard Jackup Markets See Higher New Fixtures
Source: IHS Inc., Guggenheim Securities, LLC.
Jackup: Premium/High End Dayrate History
Jackup: Standard Dayrate History
25
50
75
100
125
150
175
200
225
25
50
75
100
125
150
175
200
225
Jan
-03
Ju
n-0
3
No
v-0
3
Ap
r-04
Sep
-04
Feb
-05
Ju
l-05
Dec-0
5
May-0
6
Oct-
06
Mar-
07
Au
g-0
7
Jan
-08
Ju
n-0
8
No
v-0
8
Ap
r-09
Sep
-09
Feb
-10
Ju
l-10
Dec-1
0
May-1
1
Oct-
11
Mar-
12
Au
g-1
2
Jan
-13
Ju
n-1
3
No
v-1
3
Ap
r-14
JU 300-IC Avg Dayrate JU Standard Avg. Fixture
Jackup fixtures continue to trend
above current dayrate averages.
Although there are few signs of
weakness, we see the optics of the
arrival of several uncontracted
newbuilds as an overhang on
dayrates in the near term. As a result,
we forecast a fade in average
dayrates over the near term.
Guggenheim Securities, LLC | 972-638-5502 | guggenheimsecurities.com
<p>Oilfield Services & Offshore Drillers</p> PAGE 26
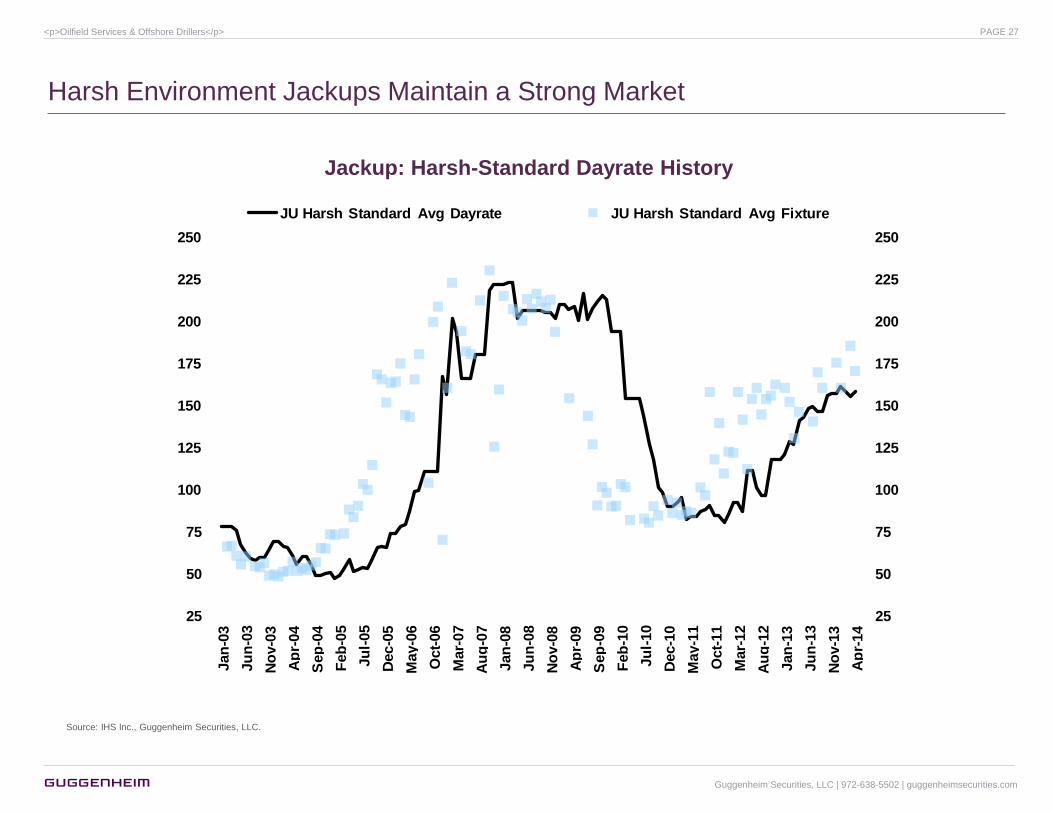
Harsh Environment Jackups Maintain a Strong Market
Source: IHS Inc., Guggenheim Securities, LLC.
Jackup: Harsh-Standard Dayrate History
25
50
75
100
125
150
175
200
225
250
25
50
75
100
125
150
175
200
225
250 Jan
-03
Ju
n-0
3
No
v-0
3
Ap
r-04
Sep
-04
Feb
-05
Ju
l-05
Dec-0
5
May-0
6
Oct-
06
Mar-
07
Au
g-0
7
Jan
-08
Ju
n-0
8
No
v-0
8
Ap
r-09
Sep
-09
Feb
-10
Ju
l-10
Dec-1
0
May-1
1
Oct-
11
Mar-
12
Au
g-1
2
Jan
-13
Ju
n-1
3
No
v-1
3
Ap
r-14
JU Harsh Standard Avg Dayrate JU Harsh Standard Avg Fixture
Guggenheim Securities, LLC | 972-638-5502 | guggenheimsecurities.com
<p>Oilfield Services & Offshore Drillers</p> PAGE 27
Market Dynamics Support Our Forecast
Guggenheim Securities, LLC | 972-638-5502 | guggenheimsecurities.com
<p>Oilfield Services & Offshore Drillers</p> PAGE 28
1%2%
5%
8%
14%
21%
27%
0%
5%
10%
15%
20%
25%
30%
-
1,000
2,000
3,000
4,000
5,000
6,000
7,000
2014 2015 2016 2017 2018 2019 2020
Pe
rce
nt U
ns
an
cti
on
ed
mb
oe
/d
New Source Incremental - SanctionedNew Source Incremental - UnsanctionedDeepwater - % New Source Unsanctioned
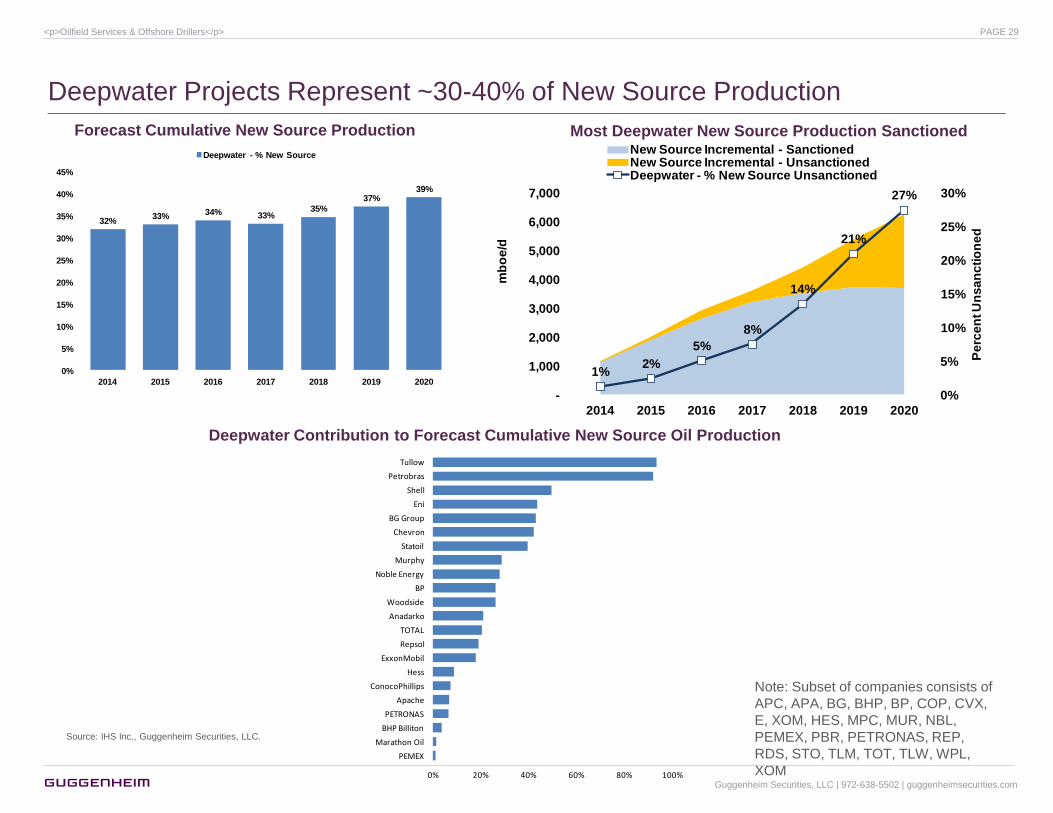
Deepwater Projects Represent ~30-40% of New Source Production
Source: IHS Inc., Guggenheim Securities, LLC.
Note: Subset of companies consists of
APC, APA, BG, BHP, BP, COP, CVX,
E, XOM, HES, MPC, MUR, NBL,
PEMEX, PBR, PETRONAS, REP,
RDS, STO, TLM, TOT, TLW, WPL,
XOM
Forecast Cumulative New Source Production
Deepwater Contribution to Forecast Cumulative New Source Oil Production
32%33%
34% 33%35%
37%39%
0%
5%
10%
15%
20%
25%
30%
35%
40%
45%
2014 2015 2016 2017 2018 2019 2020
Deepwater - % New Source
0% 20% 40% 60% 80% 100%
PEMEX
Marathon Oil
BHP Billiton
PETRONAS
Apache
ConocoPhillips
Hess
ExxonMobil
Repsol
TOTAL
Anadarko
Woodside
BP
Noble Energy
Murphy
Statoil
Chevron
BG Group
Eni
Shell
Petrobras
Tullow
Most Deepwater New Source Production Sanctioned
Guggenheim Securities, LLC | 972-638-5502 | guggenheimsecurities.com
<p>Oilfield Services & Offshore Drillers</p> PAGE 29
6.0
7.0
8.0
9.0
10.0
11.0
12.0
13.0
14.0
19
90
19
91
19
92
19
93
19
94
19
95
19
96
19
97
19
98
19
99
20
00
20
01
20
02
20
03
20
04
20
05
20
06
20
07
20
08
20
09
20
10
20
11
20
12
20
13
Ave
rag
e Y
ea
rs: D
isc
ove
ry to
De
ve
lop
me
nt
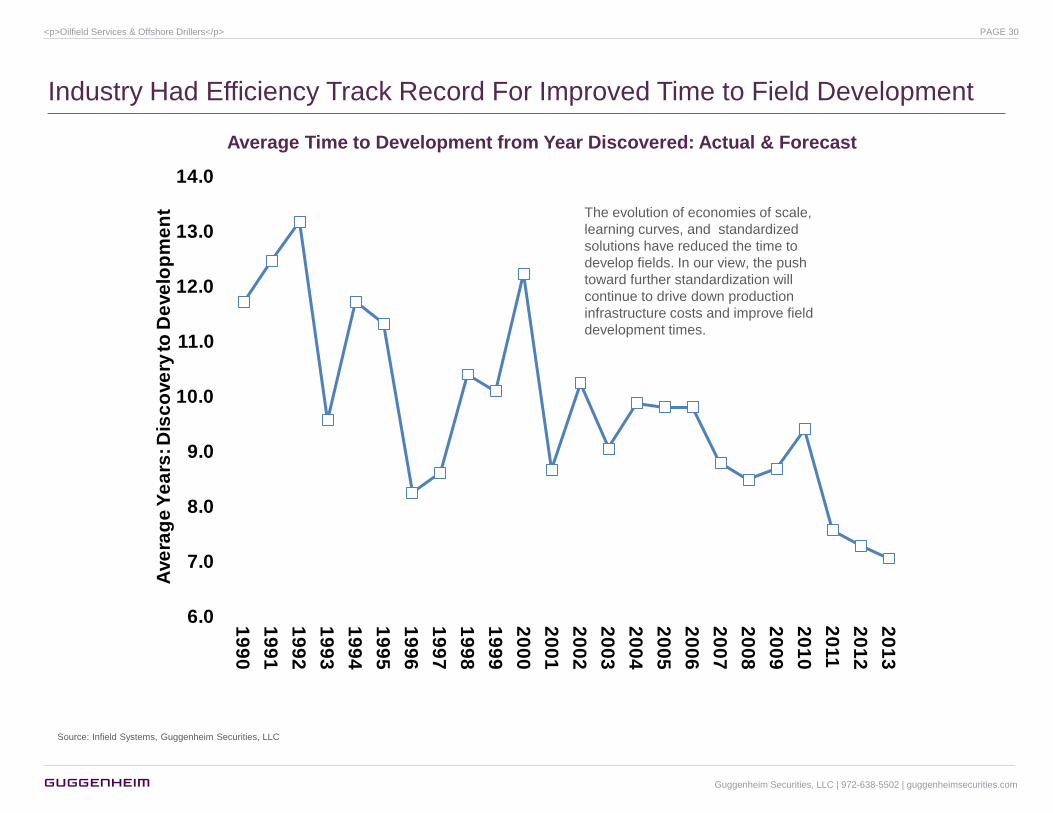
Industry Had Efficiency Track Record For Improved Time to Field Development
Average Time to Development from Year Discovered: Actual & Forecast
The evolution of economies of scale,
learning curves, and standardized
solutions have reduced the time to
develop fields. In our view, the push
toward further standardization will
continue to drive down production
infrastructure costs and improve field
development times.
Source: Infield Systems, Guggenheim Securities, LLC
Guggenheim Securities, LLC | 972-638-5502 | guggenheimsecurities.com
<p>Oilfield Services & Offshore Drillers</p> PAGE 30
02468
101214161820222426283032343638404244464850525456
19
90
19
91
19
92
19
93
19
94
19
95
19
96
19
97
19
98
19
99
20
00
20
01
20
02
20
03
20
04
20
05
20
06
20
07
20
08
20
09
20
10
20
11
20
12
20
13
20
14
20
15
20
16
20
17
20
18
20
19
20
20
20
21
Nu
mb
er o
f P
roje
cts
Midwater Deepwater Ultradeepwater
0
20
40
60
80
100
120
19
90
19
91
19
92
19
93
19
94
19
95
19
96
19
97
19
98
19
99
20
00
20
01
20
02
20
03
20
04
20
05
20
06
20
07
20
08
20
09
20
10
20
11
20
12
20
13
20
14
20
15
20
16
20
17
20
18
20
19
20
20
20
21
Nu
mb
er
of
Pro
jec
ts
Midwater Deepwater Ultradeepwater
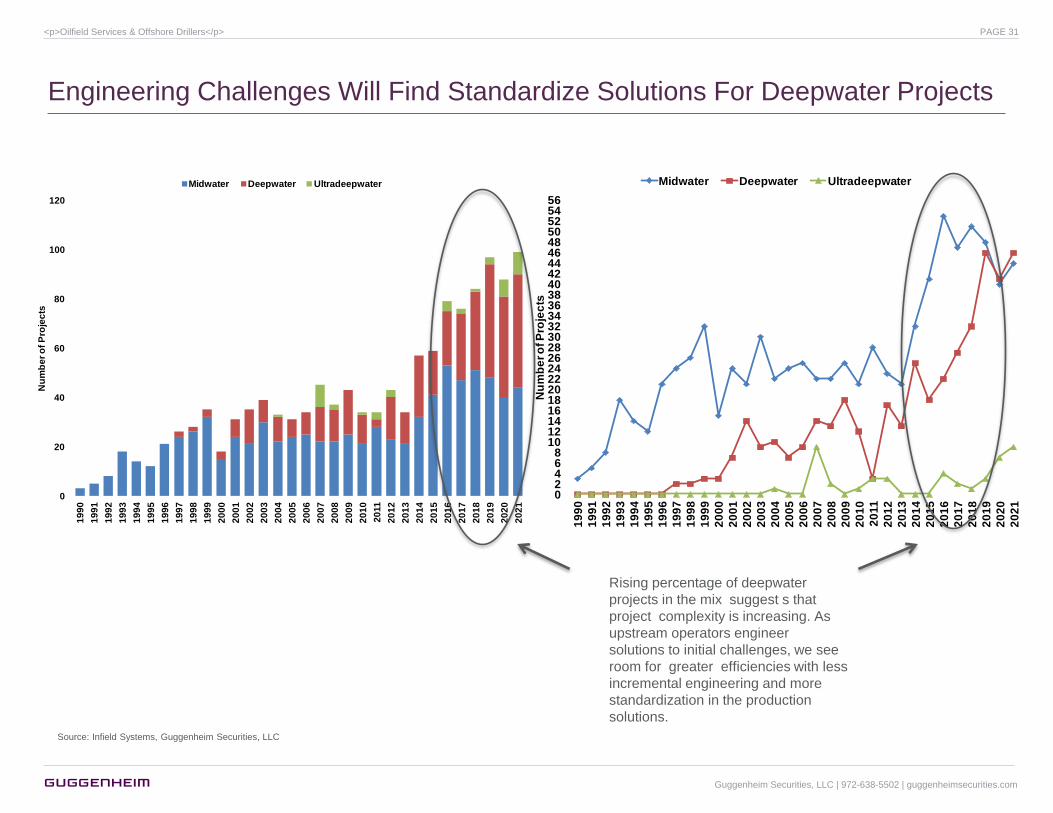
Engineering Challenges Will Find Standardize Solutions For Deepwater Projects
Rising percentage of deepwater
projects in the mix suggest s that
project complexity is increasing. As
upstream operators engineer
solutions to initial challenges, we see
room for greater efficiencies with less
incremental engineering and more
standardization in the production
solutions.
Source: Infield Systems, Guggenheim Securities, LLC
Guggenheim Securities, LLC | 972-638-5502 | guggenheimsecurities.com
<p>Oilfield Services & Offshore Drillers</p> PAGE 31
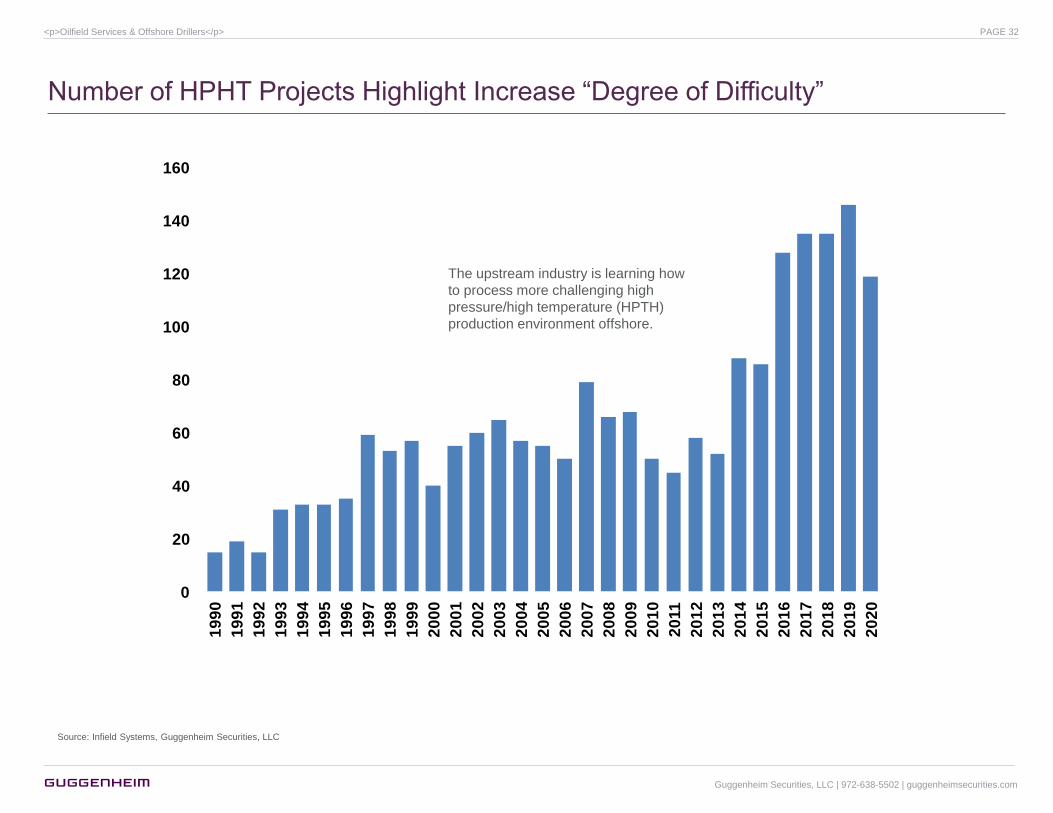
Number of HPHT Projects Highlight Increase ―Degree of Difficulty‖
0
20
40
60
80
100
120
140
160
19
90
19
91
19
92
19
93
19
94
19
95
19
96
19
97
19
98
19
99
20
00
20
01
20
02
20
03
20
04
20
05
20
06
20
07
20
08
20
09
20
10
20
11
20
12
20
13
20
14
20
15
20
16
20
17
20
18
20
19
20
20
The upstream industry is learning how
to process more challenging high
pressure/high temperature (HPTH)
production environment offshore.
Source: Infield Systems, Guggenheim Securities, LLC
Guggenheim Securities, LLC | 972-638-5502 | guggenheimsecurities.com
<p>Oilfield Services & Offshore Drillers</p> PAGE 32
-
1,000
2,000
3,000
4,000
5,000
6,000
7,000
8,000
- 1,000 2,000 3,000 4,000 5,000 6,000 7,000 8,000
De
vele
op
me
nt D
rilli
ng
Co
st E
st. (
$m
m)
CAPEX ($mm)
Non-FID FID
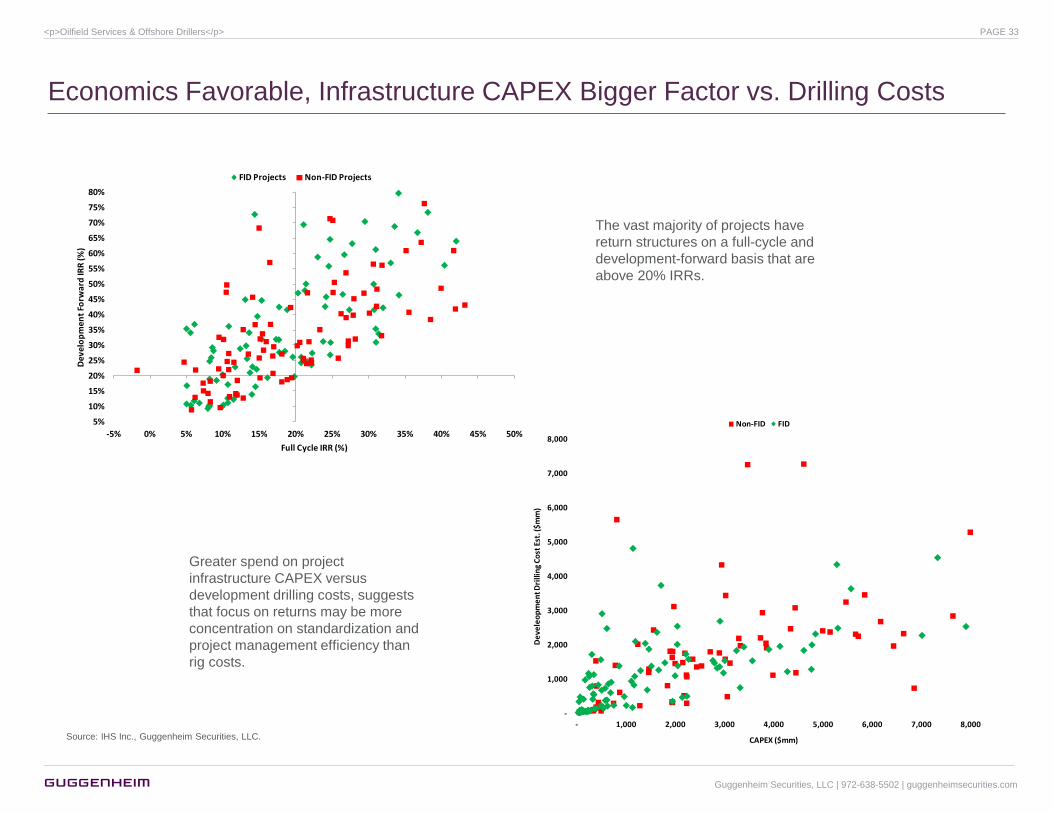
Economics Favorable, Infrastructure CAPEX Bigger Factor vs. Drilling Costs
5%
10%
15%
20%
25%
30%
35%
40%
45%
50%
55%
60%
65%
70%
75%
80%
-5% 0% 5% 10% 15% 20% 25% 30% 35% 40% 45% 50%
Dev
elo
pm
en
t Fo
rwa
rd IR
R (%
)
Full Cycle IRR (%)
FID Projects Non-FID Projects
Source: IHS Inc., Guggenheim Securities, LLC.
Greater spend on project
infrastructure CAPEX versus
development drilling costs, suggests
that focus on returns may be more
concentration on standardization and
project management efficiency than
rig costs.
The vast majority of projects have
return structures on a full-cycle and
development-forward basis that are
above 20% IRRs.
Guggenheim Securities, LLC | 972-638-5502 | guggenheimsecurities.com
<p>Oilfield Services & Offshore Drillers</p> PAGE 33
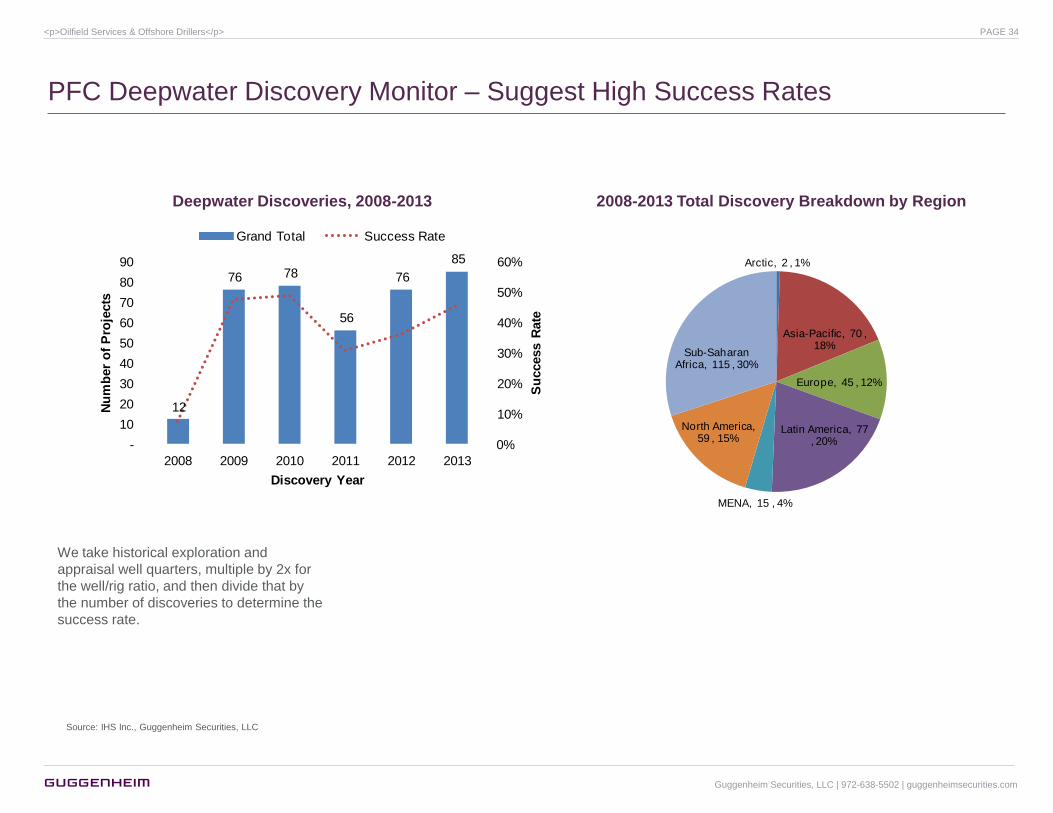
PFC Deepwater Discovery Monitor – Suggest High Success Rates
Source: IHS Inc., Guggenheim Securities, LLC
Deepwater Discoveries, 2008-2013
Arctic, 2 , 1%
Asia-Pacific, 70 , 18%
Europe, 45 , 12%
Latin America, 77 , 20%
MENA, 15 , 4%
North America, 59 , 15%
Sub-Saharan Africa, 115 , 30%
2008-2013 Total Discovery Breakdown by Region
12
76 78
56
76
85
0%
10%
20%
30%
40%
50%
60%
-
10
20
30
40
50
60
70
80
90
2008 2009 2010 2011 2012 2013
Su
ccess R
ate
Nu
mb
er
of
Pro
jects
Discovery Year
Grand Total Success Rate
We take historical exploration and
appraisal well quarters, multiple by 2x for
the well/rig ratio, and then divide that by
the number of discoveries to determine the
success rate.
Guggenheim Securities, LLC | 972-638-5502 | guggenheimsecurities.com
<p>Oilfield Services & Offshore Drillers</p> PAGE 34
Industry Maturity: Rig Supply & “Attrition” Thesis
Guggenheim Securities, LLC | 972-638-5502 | guggenheimsecurities.com
<p>Oilfield Services & Offshore Drillers</p> PAGE 35
100 108 114 118 118
80 80 80 82 83
131 142
160 171 179
311 330
354 371
380
-
50
100
150
200
250
300
350
400
2014E 2015E 2016E 2017E 2018E
Pro
jecte
d T
ota
l R
ig S
up
ply
Midwater Deepwater Ultradeepwater
4 3 2 1 4 - - - - 2 1 1 1
11 6 7
13
6 19 19 15
5 6 5 1
12
18
25
38
44
63
82
97 102
108 113
-
20
40
60
80
100
1Q
14
2Q
14
3Q
14
4Q
14
1Q
15
2Q
15
3Q
15
4Q
15
1Q
16
2Q
16
3Q
16
4Q
16
Nu
mb
er
of
Rig
s
Contracted Uncontracted Cumulative Uncontracted
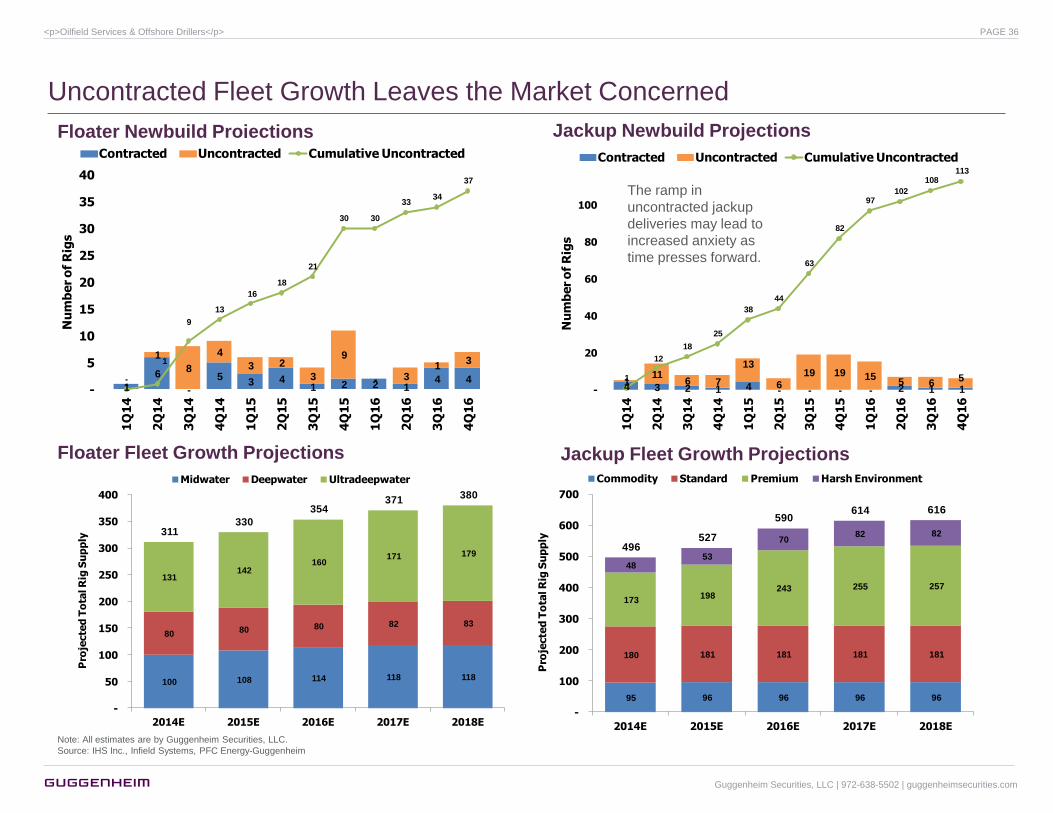
Uncontracted Fleet Growth Leaves the Market Concerned
Note: All estimates are by Guggenheim Securities, LLC.
Source: IHS Inc., Infield Systems, PFC Energy-Guggenheim
Jackup Newbuild Projections Floater Newbuild Projections
Floater Fleet Growth Projections Jackup Fleet Growth Projections
1
6
-
5 3 4
1 2 2 1 4 4
-
1
8
4
3 2
3
9
- 3 1
3
-
1
9
13
16
18
21
30 30
33 34
37
-
5
10
15
20
25
30
35
40
1Q
14
2Q
14
3Q
14
4Q
14
1Q
15
2Q
15
3Q
15
4Q
15
1Q
16
2Q
16
3Q
16
4Q
16
Nu
mb
er
of
Rig
s
Contracted Uncontracted Cumulative Uncontracted
95 96 96 96 96
180 181 181 181 181
173 198
243 255 257
48 53
70 82 82
496 527
590 614 616
-
100
200
300
400
500
600
700
2014E 2015E 2016E 2017E 2018E
Pro
jecte
d T
ota
l R
ig S
up
ply
Commodity Standard Premium Harsh Environment
The ramp in
uncontracted jackup
deliveries may lead to
increased anxiety as
time presses forward.
Guggenheim Securities, LLC | 972-638-5502 | guggenheimsecurities.com
<p>Oilfield Services & Offshore Drillers</p> PAGE 36
0
2
4
6
8
10
12
14
16
19
53
19
54
19
55
19
56
19
57
19
58
19
59
19
60
19
61
19
62
19
63
19
64
19
65
19
66
19
67
19
68
19
69
19
70
19
71
19
72
19
73
19
74
19
75
19
76
19
77
19
78
19
79
19
80
19
81
19
82
19
83
19
84
19
85
19
86
19
87
19
88
19
89
19
90
19
91
19
92
19
93
19
94
19
95
19
96
19
97
19
98
19
99
20
00
20
01
20
02
20
03
20
04
20
05
20
06
20
07
20
08
20
09
20
10
20
11
20
12
20
13
# o
f R
igs
Drillship Semisubmersible
-
5
10
15
20
25
30
35
19
58
19
59
19
60
19
61
19
62
19
63
19
64
19
65
19
66
19
67
19
68
19
69
19
70
19
71
19
72
19
73
19
74
19
75
19
76
19
77
19
78
19
79
19
80
19
81
19
82
19
83
19
84
19
85
19
86
19
87
19
88
19
89
19
90
19
91
19
92
19
93
19
94
19
95
19
96
19
97
19
98
19
99
20
00
20
01
20
02
20
03
20
04
20
05
20
06
20
07
20
08
20
09
20
10
20
11
20
12
20
13
20
14
20
15
20
16
20
17
20
18
20
19
20
20
# o
f R
igs
Drillship Semisubmersible
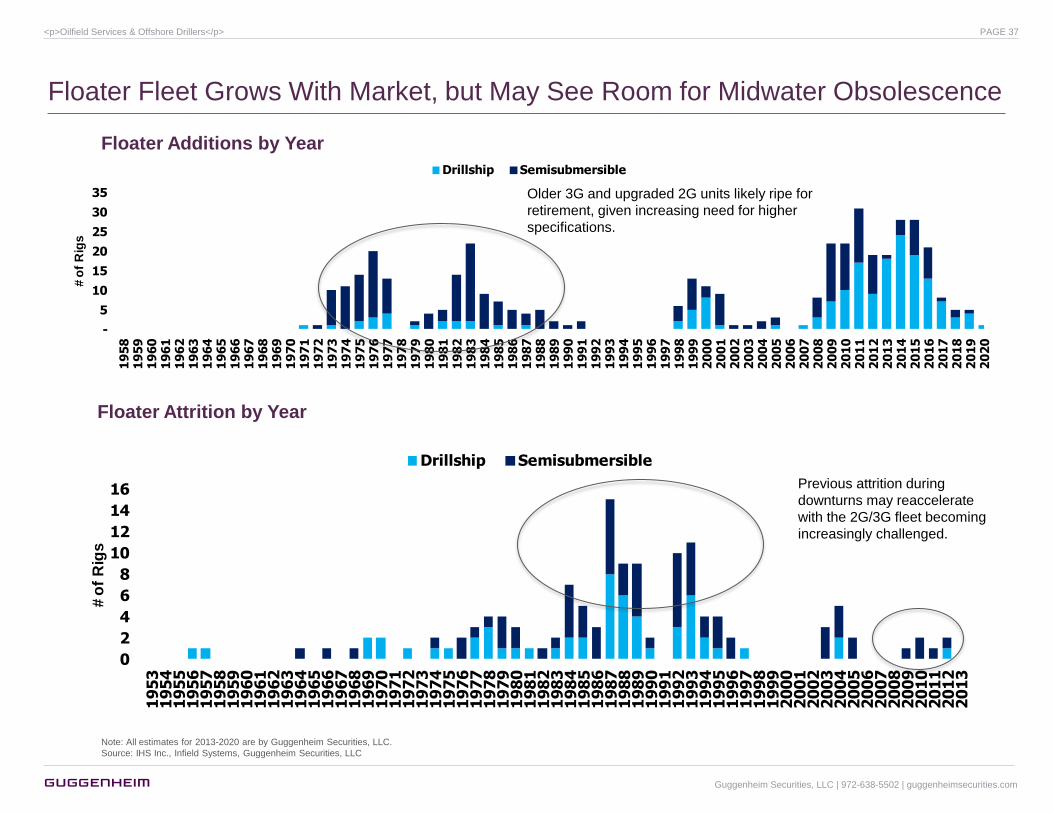
Floater Fleet Grows With Market, but May See Room for Midwater Obsolescence
Floater Additions by Year
Floater Attrition by Year
Older 3G and upgraded 2G units likely ripe for
retirement, given increasing need for higher
specifications.
Note: All estimates for 2013-2020 are by Guggenheim Securities, LLC.
Source: IHS Inc., Infield Systems, Guggenheim Securities, LLC
Previous attrition during
downturns may reaccelerate
with the 2G/3G fleet becoming
increasingly challenged.
Guggenheim Securities, LLC | 972-638-5502 | guggenheimsecurities.com
<p>Oilfield Services & Offshore Drillers</p> PAGE 37

0
2
4
6
8
10
12
14
16
19
53
19
54
19
55
19
56
19
57
19
58
19
59
19
60
19
61
19
62
19
63
19
64
19
65
19
66
19
67
19
68
19
69
19
70
19
71
19
72
19
73
19
74
19
75
19
76
19
77
19
78
19
79
19
80
19
81
19
82
19
83
19
84
19
85
19
86
19
87
19
88
19
89
19
90
19
91
19
92
19
93
19
94
19
95
19
96
19
97
19
98
19
99
20
00
20
01
20
02
20
03
20
04
20
05
20
06
20
07
20
08
20
09
20
10
20
11
20
12
20
13
# o
f R
igs
-
10
20
30
40
50
60
70
80
90
19
58
19
59
19
60
19
61
19
62
19
63
19
64
19
65
19
66
19
67
19
68
19
69
19
70
19
71
19
72
19
73
19
74
19
75
19
76
19
77
19
78
19
79
19
80
19
81
19
82
19
83
19
84
19
85
19
86
19
87
19
88
19
89
19
90
19
91
19
92
19
93
19
94
19
95
19
96
19
97
19
98
19
99
20
00
20
01
20
02
20
03
20
04
20
05
20
06
20
07
20
08
20
09
20
10
20
11
20
12
20
13
20
14
20
15
20
16
20
17
20
18
20
19
20
20
Jackup Additions/Attrition Cycle Independent of Strong Market
Jackup Additions by Year
Jackup Attrition by Year
Fleet replacement cycle
currently underway
Historically, rigs retired
during downturns, but the
past two years have seen
retirement of obsolete rigs
contract drillers are not
willing to upgrade. Thus, we
see potential for a super
spike in retirements in the
next downturn.
Note: All estimates for 2013-202 are by Guggenheim Securities, LLC.
Source: IHS Inc., Infield Systems, Guggenheim Securities, LLC
Guggenheim Securities, LLC | 972-638-5502 | guggenheimsecurities.com
<p>Oilfield Services & Offshore Drillers</p> PAGE 38
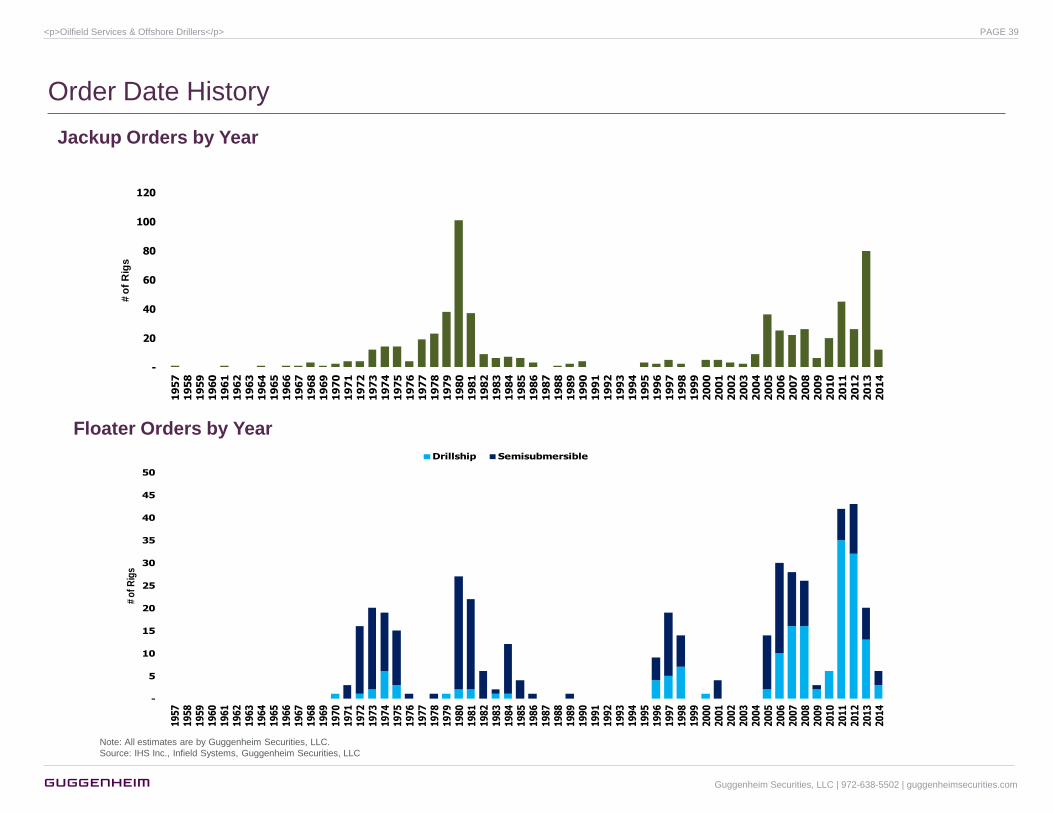
Order Date History
Jackup Orders by Year
Floater Orders by Year
Note: All estimates are by Guggenheim Securities, LLC.
Source: IHS Inc., Infield Systems, Guggenheim Securities, LLC
-
20
40
60
80
100
120
19
57
19
58
19
59
19
60
19
61
19
62
19
63
19
64
19
65
19
66
19
67
19
68
19
69
19
70
19
71
19
72
19
73
19
74
19
75
19
76
19
77
19
78
19
79
19
80
19
81
19
82
19
83
19
84
19
85
19
86
19
87
19
88
19
89
19
90
19
91
19
92
19
93
19
94
19
95
19
96
19
97
19
98
19
99
20
00
20
01
20
02
20
03
20
04
20
05
20
06
20
07
20
08
20
09
20
10
20
11
20
12
20
13
20
14
# o
f R
igs
-
5
10
15
20
25
30
35
40
45
50
19
57
19
58
19
59
19
60
19
61
19
62
19
63
19
64
19
65
19
66
19
67
19
68
19
69
19
70
19
71
19
72
19
73
19
74
19
75
19
76
19
77
19
78
19
79
19
80
19
81
19
82
19
83
19
84
19
85
19
86
19
87
19
88
19
89
19
90
19
91
19
92
19
93
19
94
19
95
19
96
19
97
19
98
19
99
20
00
20
01
20
02
20
03
20
04
20
05
20
06
20
07
20
08
20
09
20
10
20
11
20
12
20
13
20
14
# o
f R
igs
Drillship Semisubmersible
Guggenheim Securities, LLC | 972-638-5502 | guggenheimsecurities.com
<p>Oilfield Services & Offshore Drillers</p> PAGE 39

Tender Demand Visibility Explains Outlook
Guggenheim Securities, LLC | 972-638-5502 | guggenheimsecurities.com
<p>Oilfield Services & Offshore Drillers</p> PAGE 40
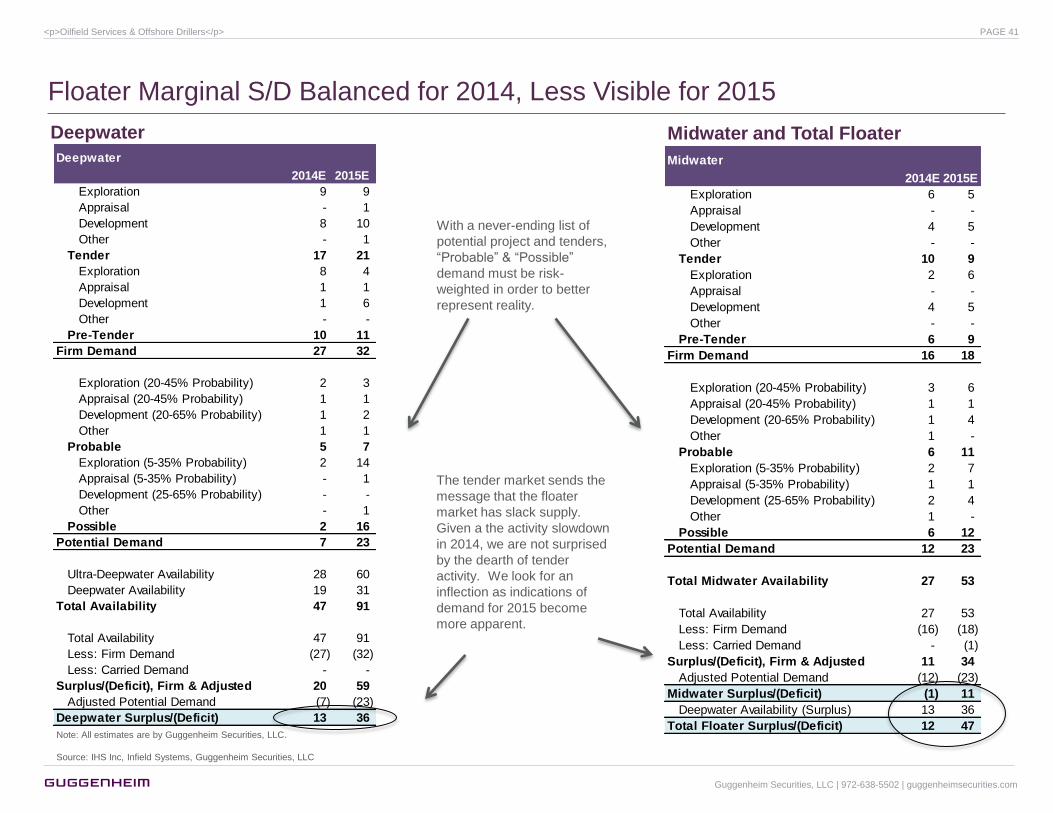
Midwater
2014E 2015E
Exploration 6 5
Appraisal - -
Development 4 5
Other - -
Tender 10 9
Exploration 2 6
Appraisal - -
Development 4 5
Other - -
Pre-Tender 6 9
Firm Demand 16 18
Exploration (20-45% Probability) 3 6
Appraisal (20-45% Probability) 1 1
Development (20-65% Probability) 1 4
Other 1 -
Probable 6 11
Exploration (5-35% Probability) 2 7
Appraisal (5-35% Probability) 1 1
Development (25-65% Probability) 2 4
Other 1 -
Possible 6 12
Potential Demand 12 23
Total Midwater Availability 27 53
Total Availability 27 53
Less: Firm Demand (16) (18)
Less: Carried Demand - (1)
Surplus/(Deficit), Firm & Adjusted 11 34
Adjusted Potential Demand (12) (23)
Midwater Surplus/(Deficit) (1) 11
Deepwater Availability (Surplus) 13 36
Total Floater Surplus/(Deficit) 12 47
Deepwater
2014E 2015E
Exploration 9 9
Appraisal - 1
Development 8 10
Other - 1
Tender 17 21
Exploration 8 4
Appraisal 1 1
Development 1 6
Other - -
Pre-Tender 10 11
Firm Demand 27 32
Exploration (20-45% Probability) 2 3
Appraisal (20-45% Probability) 1 1
Development (20-65% Probability) 1 2
Other 1 1
Probable 5 7
Exploration (5-35% Probability) 2 14
Appraisal (5-35% Probability) - 1
Development (25-65% Probability) - -
Other - 1
Possible 2 16
Potential Demand 7 23
Ultra-Deepwater Availability 28 60
Deepwater Availability 19 31
Total Availability 47 91
Total Availability 47 91
Less: Firm Demand (27) (32)
Less: Carried Demand - -
Surplus/(Deficit), Firm & Adjusted 20 59
Adjusted Potential Demand (7) (23)
Deepwater Surplus/(Deficit) 13 36
Floater Marginal S/D Balanced for 2014, Less Visible for 2015
Deepwater Midwater and Total Floater
The tender market sends the
message that the floater
market has slack supply.
Given a the activity slowdown
in 2014, we are not surprised
by the dearth of tender
activity. We look for an
inflection as indications of
demand for 2015 become
more apparent.
With a never-ending list of
potential project and tenders,
―Probable‖ & ―Possible‖
demand must be risk-
weighted in order to better
represent reality.
Note: All estimates are by Guggenheim Securities, LLC.
Source: IHS Inc, Infield Systems, Guggenheim Securities, LLC
Guggenheim Securities, LLC | 972-638-5502 | guggenheimsecurities.com
<p>Oilfield Services & Offshore Drillers</p> PAGE 41
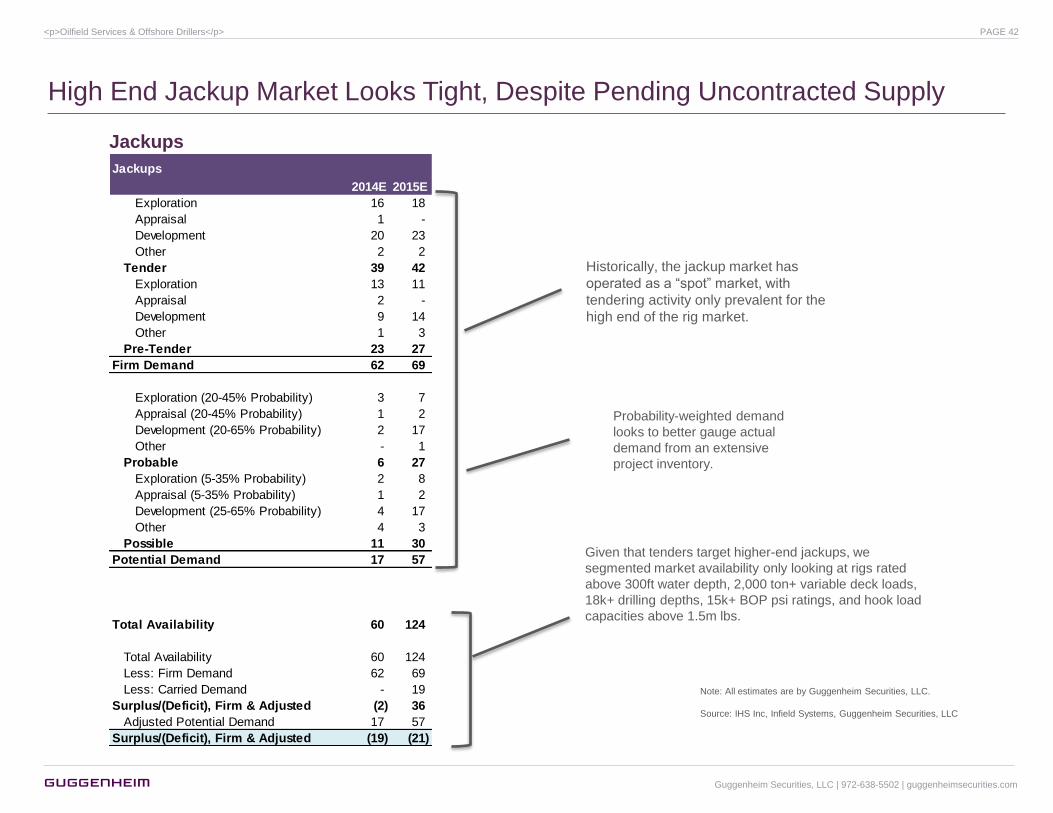
High End Jackup Market Looks Tight, Despite Pending Uncontracted Supply
Jackups
Given that tenders target higher-end jackups, we
segmented market availability only looking at rigs rated
above 300ft water depth, 2,000 ton+ variable deck loads,
18k+ drilling depths, 15k+ BOP psi ratings, and hook load
capacities above 1.5m lbs.
Historically, the jackup market has
operated as a ―spot‖ market, with
tendering activity only prevalent for the
high end of the rig market.
Probability-weighted demand
looks to better gauge actual
demand from an extensive
project inventory.
Note: All estimates are by Guggenheim Securities, LLC.
Source: IHS Inc, Infield Systems, Guggenheim Securities, LLC
Jackups
2014E 2015E
Exploration 16 18
Appraisal 1 -
Development 20 23
Other 2 2
Tender 39 42
Exploration 13 11
Appraisal 2 -
Development 9 14
Other 1 3
Pre-Tender 23 27
Firm Demand 62 69
Exploration (20-45% Probability) 3 7
Appraisal (20-45% Probability) 1 2
Development (20-65% Probability) 2 17
Other - 1
Probable 6 27
Exploration (5-35% Probability) 2 8
Appraisal (5-35% Probability) 1 2
Development (25-65% Probability) 4 17
Other 4 3
Possible 11 30
Potential Demand 17 57
Total Availability 60 124
Total Availability 60 124
Less: Firm Demand 62 69
Less: Carried Demand - 19
Surplus/(Deficit), Firm & Adjusted (2) 36
Adjusted Potential Demand 17 57
Surplus/(Deficit), Firm & Adjusted (19) (21)
Guggenheim Securities, LLC | 972-638-5502 | guggenheimsecurities.com
<p>Oilfield Services & Offshore Drillers</p> PAGE 42
Key Assumptions
Guggenheim Securities, LLC | 972-638-5502 | guggenheimsecurities.com
<p>Oilfield Services & Offshore Drillers</p> PAGE 43
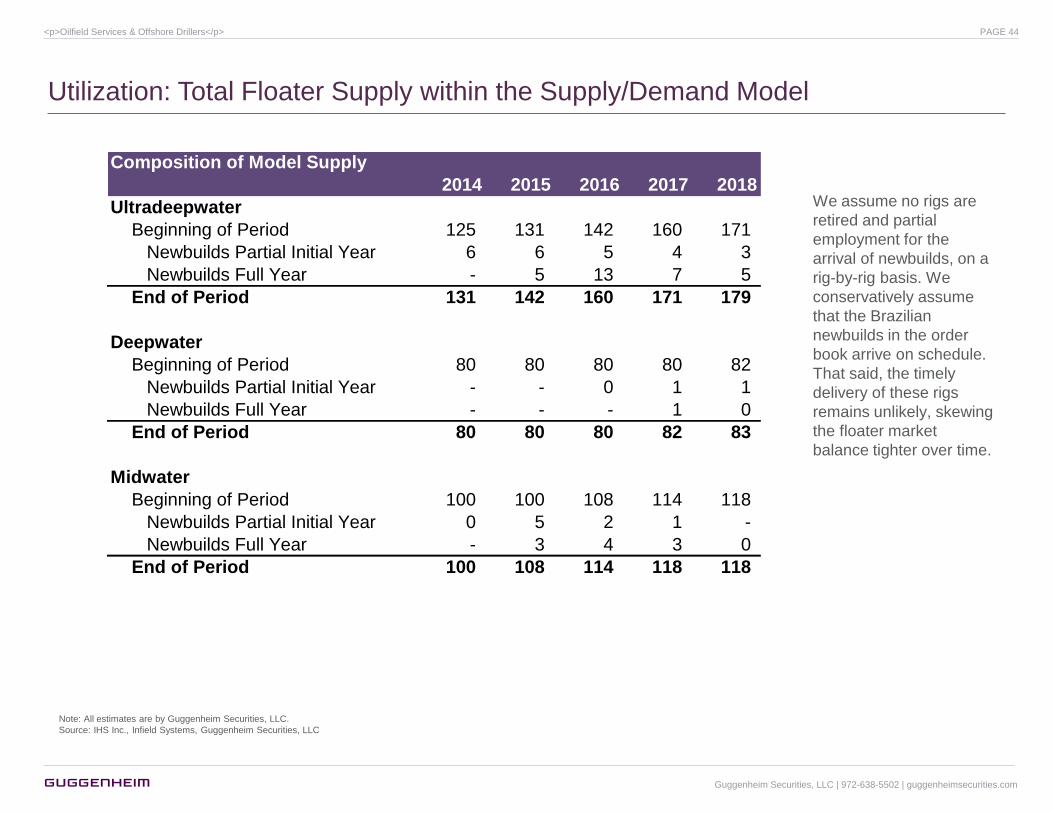
Composition of Model Supply
2014 2015 2016 2017 2018
Ultradeepwater
Beginning of Period 125 131 142 160 171
Newbuilds Partial Initial Year 6 6 5 4 3
Newbuilds Full Year - 5 13 7 5
End of Period 131 142 160 171 179
Deepwater
Beginning of Period 80 80 80 80 82
Newbuilds Partial Initial Year - - 0 1 1
Newbuilds Full Year - - - 1 0
End of Period 80 80 80 82 83
Midwater
Beginning of Period 100 100 108 114 118
Newbuilds Partial Initial Year 0 5 2 1 -
Newbuilds Full Year - 3 4 3 0
End of Period 100 108 114 118 118
Utilization: Total Floater Supply within the Supply/Demand Model
Note: All estimates are by Guggenheim Securities, LLC.
Source: IHS Inc., Infield Systems, Guggenheim Securities, LLC
We assume no rigs are
retired and partial
employment for the
arrival of newbuilds, on a
rig-by-rig basis. We
conservatively assume
that the Brazilian
newbuilds in the order
book arrive on schedule.
That said, the timely
delivery of these rigs
remains unlikely, skewing
the floater market
balance tighter over time.
Guggenheim Securities, LLC | 972-638-5502 | guggenheimsecurities.com
<p>Oilfield Services & Offshore Drillers</p> PAGE 44
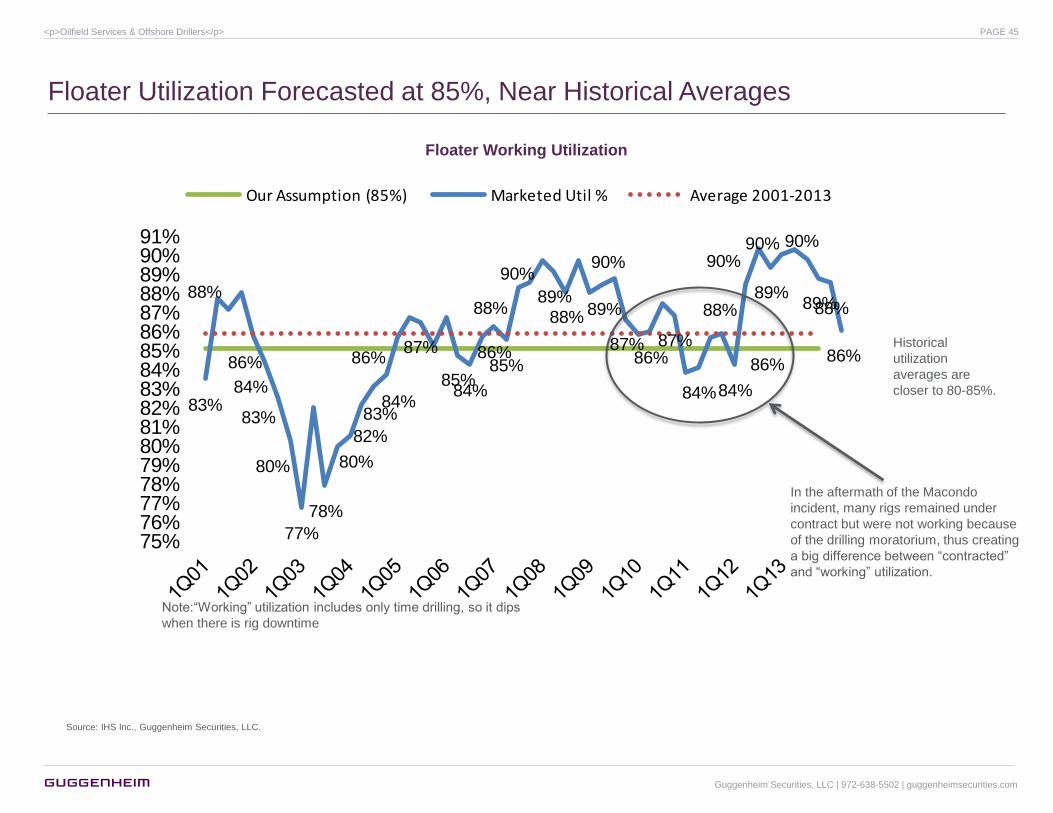
83%
88%
86%
84%
83%
80%
77%
78%
80%
82%
83%84%
86%87%
85%84%
86%85%
88%
90%
89%
88%
90%
89%
87%86%
87%
84%
86%
84%
88%
90%
89%
90% 90%
89%88%
86%
75%76%77%78%79%80%81%82%83%84%85%86%87%88%89%90%91%
Our Assumption (85%) Marketed Util % Average 2001-2013
Floater Utilization Forecasted at 85%, Near Historical Averages
Source: IHS Inc., Guggenheim Securities, LLC.
Floater Working Utilization
Note:―Working‖ utilization includes only time drilling, so it dips
when there is rig downtime
In the aftermath of the Macondo
incident, many rigs remained under
contract but were not working because
of the drilling moratorium, thus creating
a big difference between ―contracted‖
and ―working‖ utilization.
Historical
utilization
averages are
closer to 80-85%.
Guggenheim Securities, LLC | 972-638-5502 | guggenheimsecurities.com
<p>Oilfield Services & Offshore Drillers</p> PAGE 45
Valuation & EPS Comp Sheets
Guggenheim Securities, LLC | 972-638-5502 | guggenheimsecurities.com
<p>Oilfield Services & Offshore Drillers</p> PAGE 46
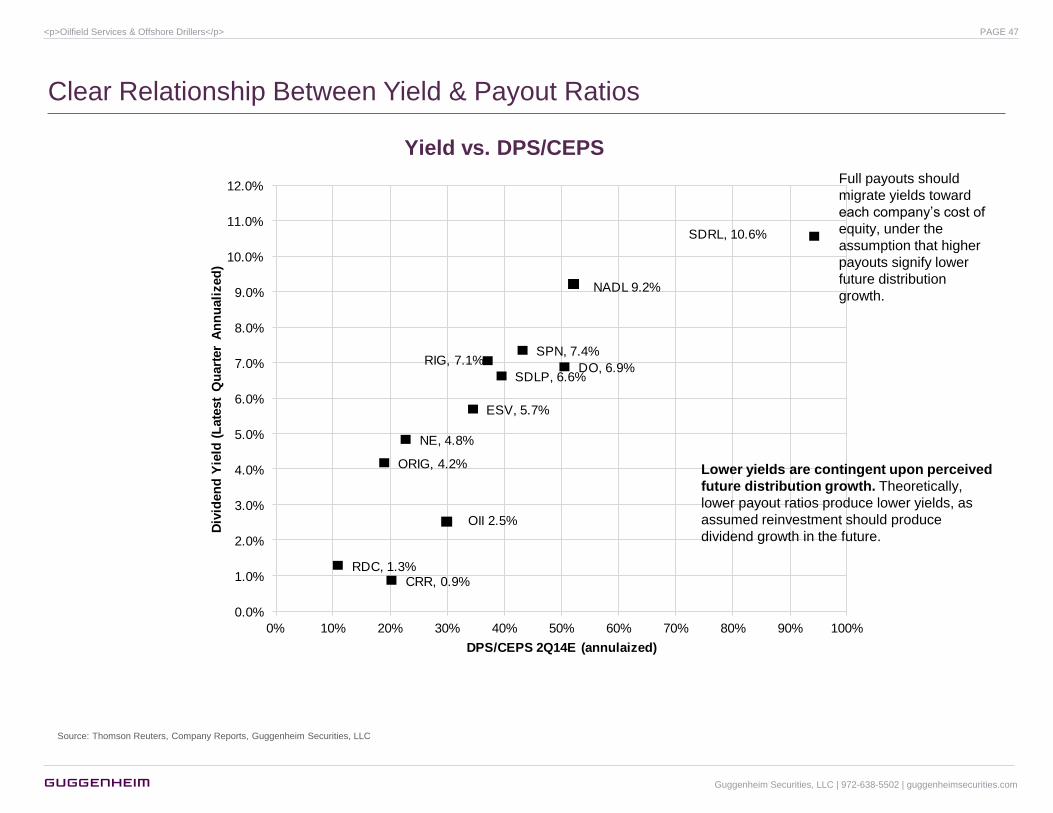
NADL 9.2%
OII 2.5%
SDLP, 6.6%DO, 6.9%
ESV, 5.7%
NE, 4.8%
ORIG, 4.2%
RDC, 1.3%
RIG, 7.1%
SDRL, 10.6%
CRR, 0.9%
SPN, 7.4%
0.0%
1.0%
2.0%
3.0%
4.0%
5.0%
6.0%
7.0%
8.0%
9.0%
10.0%
11.0%
12.0%
0% 10% 20% 30% 40% 50% 60% 70% 80% 90% 100%
Div
iden
d Y
ield
(L
ate
st
Qu
art
er
An
nu
ali
zed
)
DPS/CEPS 2Q14E (annulaized)
Clear Relationship Between Yield & Payout Ratios
Yield vs. DPS/CEPS
Source: Thomson Reuters, Company Reports, Guggenheim Securities, LLC
Full payouts should
migrate yields toward
each company‘s cost of
equity, under the
assumption that higher
payouts signify lower
future distribution
growth.
Lower yields are contingent upon perceived
future distribution growth. Theoretically,
lower payout ratios produce lower yields, as
assumed reinvestment should produce
dividend growth in the future.
Guggenheim Securities, LLC | 972-638-5502 | guggenheimsecurities.com
<p>Oilfield Services & Offshore Drillers</p> PAGE 47

DO, 6.9%
ESV, 5.7%
NE, 4.8%
ORIG, 4.2%
RDC, 1.3%
RIG, 7.1%
SDRL, 10.6%
NADL, 9.2%
SDLP, 6.6%
0.0%
1.0%
2.0%
3.0%
4.0%
5.0%
6.0%
7.0%
8.0%
9.0%
10.0%
11.0%
12.0%
60% 70% 80% 90% 100% 110% 120% 130% 140%
Div
iden
d Y
ield
(L
ate
st
Qu
art
er
An
nu
ali
zed
)
P/NAV - Break-up 2013E
Yield-Based Values Above NAV Offer Arbitrage Between Equity & Yield Capital Markets
Yield vs. P/NAV relationship
Source: Thomson Reuters, Company Reports, Guggenheim Securities, LLC
Guggenheim Securities, LLC | 972-638-5502 | guggenheimsecurities.com
<p>Oilfield Services & Offshore Drillers</p> PAGE 48
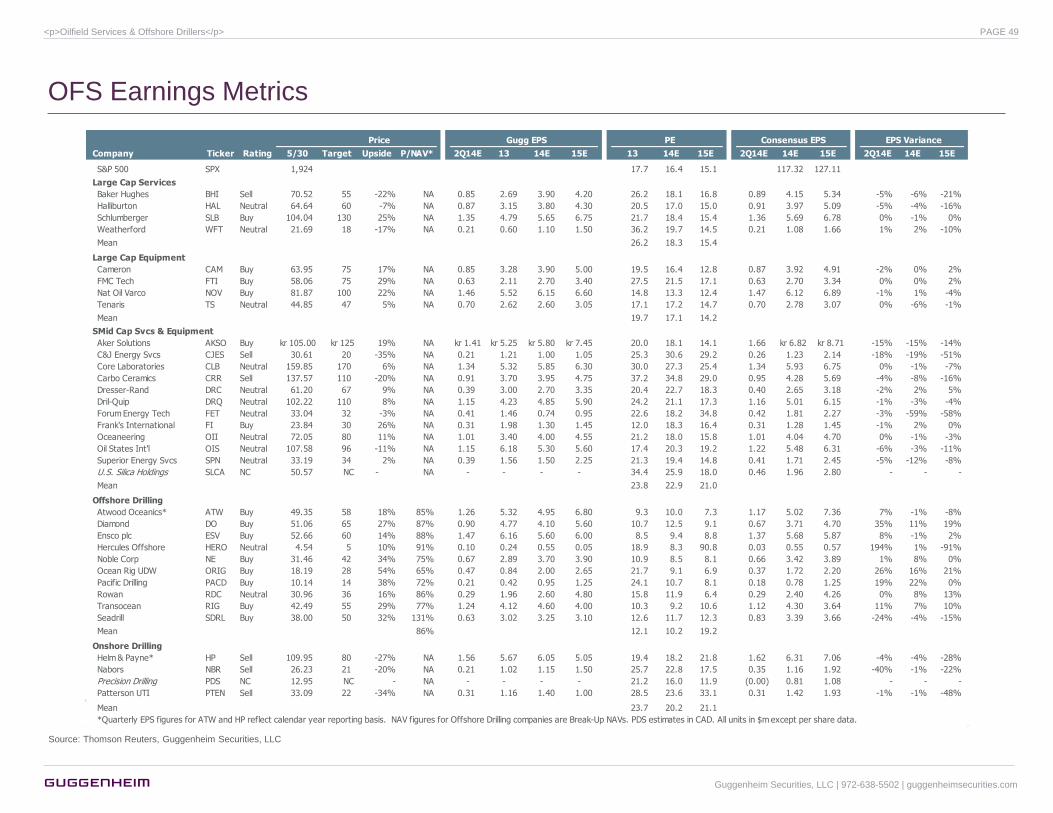
OFS Earnings Metrics
Source: Thomson Reuters, Guggenheim Securities, LLC
Price Gugg EPS PE Consensus EPS EPS Variance
Company Ticker Rating 5/30 Target Upside P/NAV* 2Q14E 13 14E 15E 13 14E 15E 2Q14E 14E 15E 2Q14E 14E 15E
S&P 500 SPX 1,924 17.7 16.4 15.1 117.32 127.11
Large Cap Services
Baker Hughes BHI Sell 70.52 55 -22% NA 0.85 2.69 3.90 4.20 26.2 18.1 16.8 0.89 4.15 5.34 -5% -6% -21%
Halliburton HAL Neutral 64.64 60 -7% NA 0.87 3.15 3.80 4.30 20.5 17.0 15.0 0.91 3.97 5.09 -5% -4% -16%
Schlumberger SLB Buy 104.04 130 25% NA 1.35 4.79 5.65 6.75 21.7 18.4 15.4 1.36 5.69 6.78 0% -1% 0%
Weatherford WFT Neutral 21.69 18 -17% NA 0.21 0.60 1.10 1.50 36.2 19.7 14.5 0.21 1.08 1.66 1% 2% -10%8.54
Mean 26.2 18.3 15.4
Large Cap Equipment
Cameron CAM Buy 63.95 75 17% NA 0.85 3.28 3.90 5.00 19.5 16.4 12.8 0.87 3.92 4.91 -2% 0% 2%
FMC Tech FTI Buy 58.06 75 29% NA 0.63 2.11 2.70 3.40 27.5 21.5 17.1 0.63 2.70 3.34 0% 0% 2%
Nat Oil Varco NOV Buy 81.87 100 22% NA 1.46 5.52 6.15 6.60 14.8 13.3 12.4 1.47 6.12 6.89 -1% 1% -4%
Tenaris TS Neutral 44.85 47 5% NA 0.70 2.62 2.60 3.05 17.1 17.2 14.7 0.70 2.78 3.07 0% -6% -1%
Mean 19.7 17.1 14.2
SMid Cap Svcs & Equipment
Aker Solutions AKSO Buy kr 105.00 kr 125 19% NA kr 1.41 kr 5.25 kr 5.80 kr 7.45 20.0 18.1 14.1 1.66 kr 6.82 kr 8.71 -15% -15% -14%
C&J Energy Svcs CJES Sell 30.61 20 -35% NA 0.21 1.21 1.00 1.05 25.3 30.6 29.2 0.26 1.23 2.14 -18% -19% -51%
Core Laboratories CLB Neutral 159.85 170 6% NA 1.34 5.32 5.85 6.30 30.0 27.3 25.4 1.34 5.93 6.75 0% -1% -7%
Carbo Ceramics CRR Sell 137.57 110 -20% NA 0.91 3.70 3.95 4.75 37.2 34.8 29.0 0.95 4.28 5.69 -4% -8% -16%
Dresser-Rand DRC Neutral 61.20 67 9% NA 0.39 3.00 2.70 3.35 20.4 22.7 18.3 0.40 2.65 3.18 -2% 2% 5%
Dril-Quip DRQ Neutral 102.22 110 8% NA 1.15 4.23 4.85 5.90 24.2 21.1 17.3 1.16 5.01 6.15 -1% -3% -4%
Forum Energy Tech FET Neutral 33.04 32 -3% NA 0.41 1.46 0.74 0.95 22.6 18.2 34.8 0.42 1.81 2.27 -3% -59% -58%
Frank's International FI Buy 23.84 30 26% NA 0.31 1.98 1.30 1.45 12.0 18.3 16.4 0.31 1.28 1.45 -1% 2% 0%
Oceaneering OII Neutral 72.05 80 11% NA 1.01 3.40 4.00 4.55 21.2 18.0 15.8 1.01 4.04 4.70 0% -1% -3%
Oil States Int'l OIS Neutral 107.58 96 -11% NA 1.15 6.18 5.30 5.60 17.4 20.3 19.2 1.22 5.48 6.31 -6% -3% -11%
Superior Energy Svcs SPN Neutral 33.19 34 2% NA 0.39 1.56 1.50 2.25 21.3 19.4 14.8 0.41 1.71 2.45 -5% -12% -8%
U.S. Silica Holdings SLCA NC 50.57 NC - NA - - - - 34.4 25.9 18.0 0.46 1.96 2.80 - - -18% 39.91
Mean 23.8 22.9 21.0
Offshore Drilling
Atwood Oceanics* ATW Buy 49.35 58 18% 85% 1.26 5.32 4.95 6.80 9.3 10.0 7.3 1.17 5.02 7.36 7% -1% -8%
Diamond DO Buy 51.06 65 27% 87% 0.90 4.77 4.10 5.60 10.7 12.5 9.1 0.67 3.71 4.70 35% 11% 19%
Ensco plc ESV Buy 52.66 60 14% 88% 1.47 6.16 5.60 6.00 8.5 9.4 8.8 1.37 5.68 5.87 8% -1% 2%
Hercules Offshore HERO Neutral 4.54 5 10% 91% 0.10 0.24 0.55 0.05 18.9 8.3 90.8 0.03 0.55 0.57 194% 1% -91%
Noble Corp NE Buy 31.46 42 34% 75% 0.67 2.89 3.70 3.90 10.9 8.5 8.1 0.66 3.42 3.89 1% 8% 0%
Ocean Rig UDW ORIG Buy 18.19 28 54% 65% 0.47 0.84 2.00 2.65 21.7 9.1 6.9 0.37 1.72 2.20 26% 16% 21%
Pacific Drilling PACD Buy 10.14 14 38% 72% 0.21 0.42 0.95 1.25 24.1 10.7 8.1 0.18 0.78 1.25 19% 22% 0%
Rowan RDC Neutral 30.96 36 16% 86% 0.29 1.96 2.60 4.80 15.8 11.9 6.4 0.29 2.40 4.26 0% 8% 13%
Transocean RIG Buy 42.49 55 29% 77% 1.24 4.12 4.60 4.00 10.3 9.2 10.6 1.12 4.30 3.64 11% 7% 10%
Seadrill SDRL Buy 38.00 50 32% 131% 0.63 3.02 3.25 3.10 12.6 11.7 12.3 0.83 3.39 3.66 -24% -4% -15%
Mean 86% 12.1 10.2 19.2
Onshore Drilling
Helm & Payne* HP Sell 109.95 80 -27% NA 1.56 5.67 6.05 5.05 19.4 18.2 21.8 1.62 6.31 7.06 -4% -4% -28%
Nabors NBR Sell 26.23 21 -20% NA 0.21 1.02 1.15 1.50 25.7 22.8 17.5 0.35 1.16 1.92 -40% -1% -22%
Precision Drilling PDS NC 12.95 NC - NA - - - - 21.2 16.0 11.9 (0.00) 0.81 1.08 - - -
Patterson UTI PTEN Sell 33.09 22 -34% NA 0.31 1.16 1.40 1.00 28.5 23.6 33.1 0.31 1.42 1.93 -1% -1% -48%
Mean 23.7 20.2 21.1
*Quarterly EPS figures for ATW and HP reflect calendar year reporting basis. NAV figures for Offshore Drilling companies are Break-Up NAVs. PDS estimates in CAD. All units in $m except per share data.
Guggenheim Securities, LLC | 972-638-5502 | guggenheimsecurities.com
<p>Oilfield Services & Offshore Drillers</p> PAGE 49
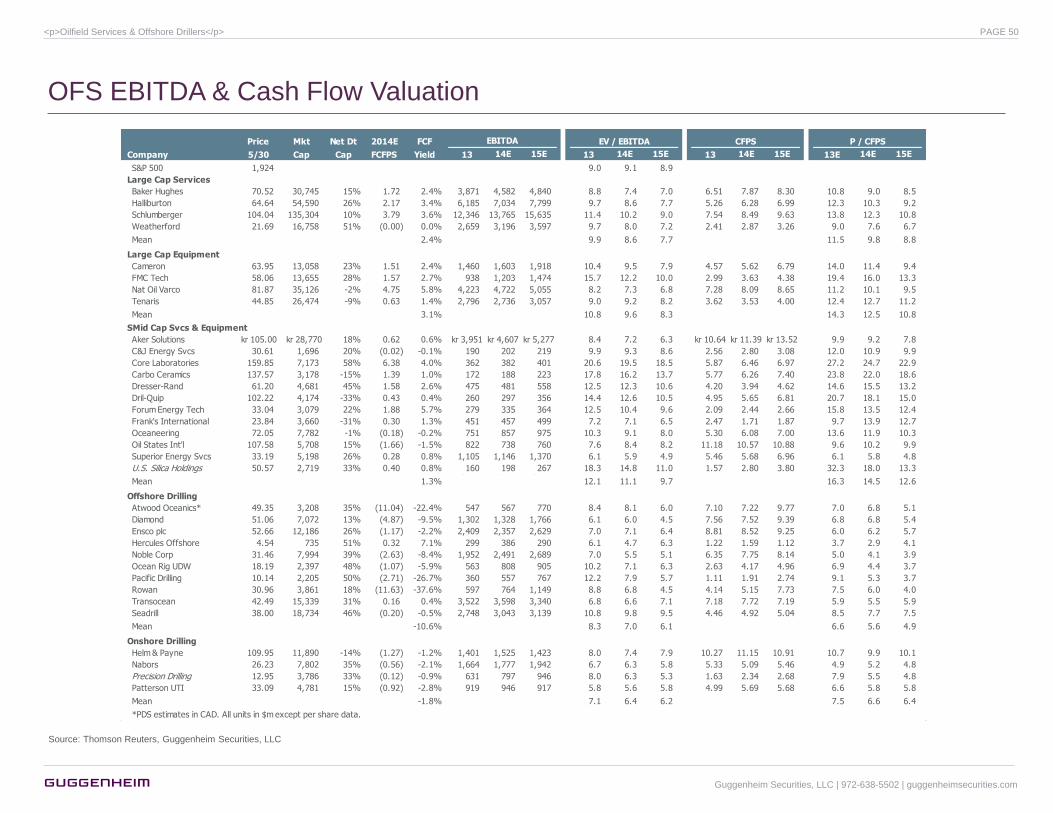
OFS EBITDA & Cash Flow Valuation
Source: Thomson Reuters, Guggenheim Securities, LLC
Price Mkt Net Dt 2014E FCF EBITDA EV / EBITDA CFPS P / CFPS
Company 5/30 Cap Cap FCFPS Yield 13 14E 15E 13 14E 15E 13 14E 15E 13E 14E 15E
S&P 500 1,924 9.0 9.1 8.9
Large Cap Services
Baker Hughes 70.52 30,745 15% 1.72 2.4% 3,871 4,582 4,840 8.8 7.4 7.0 6.51 7.87 8.30 10.8 9.0 8.5
Halliburton 64.64 54,590 26% 2.17 3.4% 6,185 7,034 7,799 9.7 8.6 7.7 5.26 6.28 6.99 12.3 10.3 9.2
Schlumberger 104.04 135,304 10% 3.79 3.6% 12,346 13,765 15,635 11.4 10.2 9.0 7.54 8.49 9.63 13.8 12.3 10.8
Weatherford 21.69 16,758 51% (0.00) 0.0% 2,659 3,196 3,597 9.7 8.0 7.2 2.41 2.87 3.26 9.0 7.6 6.7
Mean 2.4% 9.9 8.6 7.7 11.5 9.8 8.8
Large Cap Equipment
Cameron 63.95 13,058 23% 1.51 2.4% 1,460 1,603 1,918 10.4 9.5 7.9 4.57 5.62 6.79 14.0 11.4 9.4
FMC Tech 58.06 13,655 28% 1.57 2.7% 938 1,203 1,474 15.7 12.2 10.0 2.99 3.63 4.38 19.4 16.0 13.3
Nat Oil Varco 81.87 35,126 -2% 4.75 5.8% 4,223 4,722 5,055 8.2 7.3 6.8 7.28 8.09 8.65 11.2 10.1 9.5
Tenaris 44.85 26,474 -9% 0.63 1.4% 2,796 2,736 3,057 9.0 9.2 8.2 3.62 3.53 4.00 12.4 12.7 11.2
Mean 3.1% 10.8 9.6 8.3 14.3 12.5 10.8
SMid Cap Svcs & Equipment
Aker Solutions kr 105.00 kr 28,770 18% 0.62 0.6% kr 3,951 kr 4,607 kr 5,277 8.4 7.2 6.3 kr 10.64 kr 11.39 kr 13.52 9.9 9.2 7.8
C&J Energy Svcs 30.61 1,696 20% (0.02) -0.1% 190 202 219 9.9 9.3 8.6 2.56 2.80 3.08 12.0 10.9 9.9
Core Laboratories 159.85 7,173 58% 6.38 4.0% 362 382 401 20.6 19.5 18.5 5.87 6.46 6.97 27.2 24.7 22.9
Carbo Ceramics 137.57 3,178 -15% 1.39 1.0% 172 188 223 17.8 16.2 13.7 5.77 6.26 7.40 23.8 22.0 18.6
Dresser-Rand 61.20 4,681 45% 1.58 2.6% 475 481 558 12.5 12.3 10.6 4.20 3.94 4.62 14.6 15.5 13.2
Dril-Quip 102.22 4,174 -33% 0.43 0.4% 260 297 356 14.4 12.6 10.5 4.95 5.65 6.81 20.7 18.1 15.0
Forum Energy Tech 33.04 3,079 22% 1.88 5.7% 279 335 364 12.5 10.4 9.6 2.09 2.44 2.66 15.8 13.5 12.4
Frank's International 23.84 3,660 -31% 0.30 1.3% 451 457 499 7.2 7.1 6.5 2.47 1.71 1.87 9.7 13.9 12.7
Oceaneering 72.05 7,782 -1% (0.18) -0.2% 751 857 975 10.3 9.1 8.0 5.30 6.08 7.00 13.6 11.9 10.3
Oil States Int'l 107.58 5,708 15% (1.66) -1.5% 822 738 760 7.6 8.4 8.2 11.18 10.57 10.88 9.6 10.2 9.9
Superior Energy Svcs 33.19 5,198 26% 0.28 0.8% 1,105 1,146 1,370 6.1 5.9 4.9 5.46 5.68 6.96 6.1 5.8 4.8
U.S. Silica Holdings 50.57 2,719 33% 0.40 0.8% 160 198 267 18.3 14.8 11.0 1.57 2.80 3.80 32.3 18.0 13.316,936 18,550 20,854 76 81 93
Mean 1.3% 12.1 11.1 9.7 16.3 14.5 12.6
Offshore Drilling
Atwood Oceanics* 49.35 3,208 35% (11.04) -22.4% 547 567 770 8.4 8.1 6.0 7.10 7.22 9.77 7.0 6.8 5.1
Diamond 51.06 7,072 13% (4.87) -9.5% 1,302 1,328 1,766 6.1 6.0 4.5 7.56 7.52 9.39 6.8 6.8 5.4
Ensco plc 52.66 12,186 26% (1.17) -2.2% 2,409 2,357 2,629 7.0 7.1 6.4 8.81 8.52 9.25 6.0 6.2 5.7
Hercules Offshore 4.54 735 51% 0.32 7.1% 299 386 290 6.1 4.7 6.3 1.22 1.59 1.12 3.7 2.9 4.1
Noble Corp 31.46 7,994 39% (2.63) -8.4% 1,952 2,491 2,689 7.0 5.5 5.1 6.35 7.75 8.14 5.0 4.1 3.9
Ocean Rig UDW 18.19 2,397 48% (1.07) -5.9% 563 808 905 10.2 7.1 6.3 2.63 4.17 4.96 6.9 4.4 3.7
Pacific Drilling 10.14 2,205 50% (2.71) -26.7% 360 557 767 12.2 7.9 5.7 1.11 1.91 2.74 9.1 5.3 3.7
Rowan 30.96 3,861 18% (11.63) -37.6% 597 764 1,149 8.8 6.8 4.5 4.14 5.15 7.73 7.5 6.0 4.0
Transocean 42.49 15,339 31% 0.16 0.4% 3,522 3,598 3,340 6.8 6.6 7.1 7.18 7.72 7.19 5.9 5.5 5.9
Seadrill 38.00 18,734 46% (0.20) -0.5% 2,748 3,043 3,139 10.8 9.8 9.5 4.46 4.92 5.04 8.5 7.7 7.5
Mean -10.6% 8.3 7.0 6.1 6.6 5.6 4.9
Onshore Drilling
Helm & Payne 109.95 11,890 -14% (1.27) -1.2% 1,401 1,525 1,423 8.0 7.4 7.9 10.27 11.15 10.91 10.7 9.9 10.1
Nabors 26.23 7,802 35% (0.56) -2.1% 1,664 1,777 1,942 6.7 6.3 5.8 5.33 5.09 5.46 4.9 5.2 4.8
Precision Drilling 12.95 3,786 33% (0.12) -0.9% 631 797 946 8.0 6.3 5.3 1.63 2.34 2.68 7.9 5.5 4.8
Patterson UTI 33.09 4,781 15% (0.92) -2.8% 919 946 917 5.8 5.6 5.8 4.99 5.69 5.68 6.6 5.8 5.8
Mean -1.8% 7.1 6.4 6.2 7.5 6.6 6.4
*PDS estimates in CAD. All units in $m except per share data.
Guggenheim Securities, LLC | 972-638-5502 | guggenheimsecurities.com
<p>Oilfield Services & Offshore Drillers</p> PAGE 50
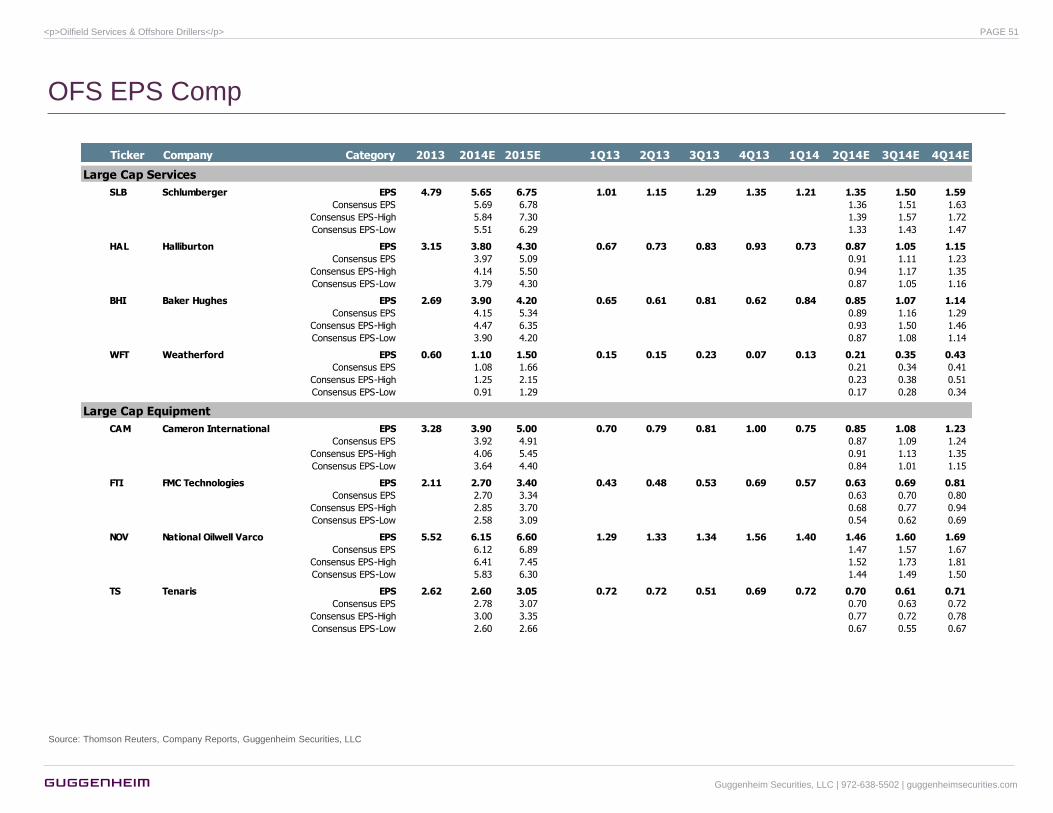
OFS EPS Comp
Source: Thomson Reuters, Company Reports, Guggenheim Securities, LLC
Ticker Company Category 2013 2014E 2015E 1Q13 2Q13 3Q13 4Q13 1Q14 2Q14E 3Q14E 4Q14E
Large Cap Services
SLB Schlumberger EPS 4.79 5.65 6.75 1.01 1.15 1.29 1.35 1.21 1.35 1.50 1.59
Consensus EPS 5.69 6.78 1.36 1.51 1.63
Consensus EPS-High 5.84 7.30 1.39 1.57 1.72
Consensus EPS-Low 5.51 6.29 1.33 1.43 1.47
HAL Halliburton EPS 3.15 3.80 4.30 0.67 0.73 0.83 0.93 0.73 0.87 1.05 1.15
Consensus EPS 3.97 5.09 0.91 1.11 1.23
Consensus EPS-High 4.14 5.50 0.94 1.17 1.35
Consensus EPS-Low 3.79 4.30 0.87 1.05 1.16
BHI Baker Hughes EPS 2.69 3.90 4.20 0.65 0.61 0.81 0.62 0.84 0.85 1.07 1.14
Consensus EPS 4.15 5.34 0.89 1.16 1.29
Consensus EPS-High 4.47 6.35 0.93 1.50 1.46
Consensus EPS-Low 3.90 4.20 0.87 1.08 1.14
WFT Weatherford EPS 0.60 1.10 1.50 0.15 0.15 0.23 0.07 0.13 0.21 0.35 0.43
Consensus EPS 1.08 1.66 0.21 0.34 0.41
Consensus EPS-High 1.25 2.15 0.23 0.38 0.51
Consensus EPS-Low 0.91 1.29 0.17 0.28 0.34
Large Cap Equipment
CAM Cameron International EPS 3.28 3.90 5.00 0.70 0.79 0.81 1.00 0.75 0.85 1.08 1.23
Consensus EPS 3.92 4.91 0.87 1.09 1.24
Consensus EPS-High 4.06 5.45 0.91 1.13 1.35
Consensus EPS-Low 3.64 4.40 0.84 1.01 1.15
FTI FMC Technologies EPS 2.11 2.70 3.40 0.43 0.48 0.53 0.69 0.57 0.63 0.69 0.81
Consensus EPS 2.70 3.34 0.63 0.70 0.80
Consensus EPS-High 2.85 3.70 0.68 0.77 0.94
Consensus EPS-Low 2.58 3.09 0.54 0.62 0.69
NOV National Oilwell Varco EPS 5.52 6.15 6.60 1.29 1.33 1.34 1.56 1.40 1.46 1.60 1.69
Consensus EPS 6.12 6.89 1.47 1.57 1.67
Consensus EPS-High 6.41 7.45 1.52 1.73 1.81
Consensus EPS-Low 5.83 6.30 1.44 1.49 1.50
TS Tenaris EPS 2.62 2.60 3.05 0.72 0.72 0.51 0.69 0.72 0.70 0.61 0.71
Consensus EPS 2.78 3.07 0.70 0.63 0.72
Consensus EPS-High 3.00 3.35 0.77 0.72 0.78
Consensus EPS-Low 2.60 2.66 0.67 0.55 0.67
Guggenheim Securities, LLC | 972-638-5502 | guggenheimsecurities.com
<p>Oilfield Services & Offshore Drillers</p> PAGE 51
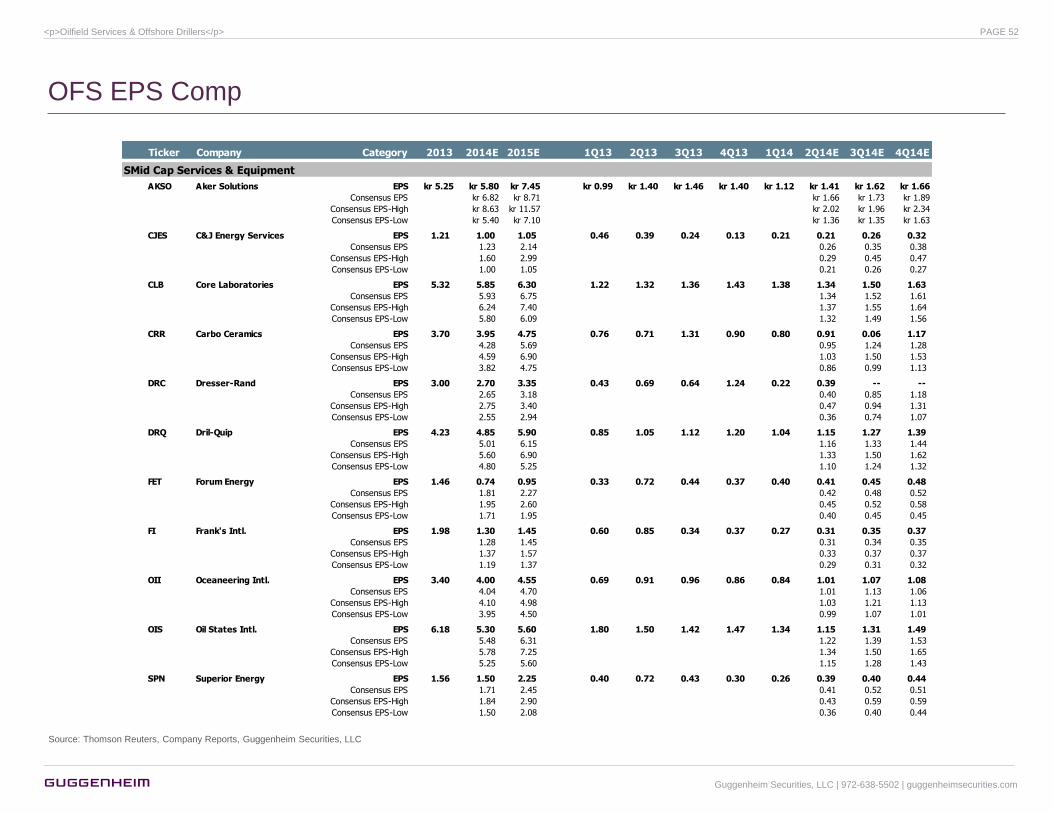
OFS EPS Comp
Source: Thomson Reuters, Company Reports, Guggenheim Securities, LLC
Ticker Company Category 2013 2014E 2015E 1Q13 2Q13 3Q13 4Q13 1Q14 2Q14E 3Q14E 4Q14E
SMid Cap Services & Equipment
AKSO-NOAKSO Aker Solutions EPS kr 5.25 kr 5.80 kr 7.45 kr 0.99 kr 1.40 kr 1.46 kr 1.40 kr 1.12 kr 1.41 kr 1.62 kr 1.66
Consensus EPS kr 6.82 kr 8.71 kr 1.66 kr 1.73 kr 1.89
Consensus EPS-High kr 8.63 kr 11.57 kr 2.02 kr 1.96 kr 2.34
Consensus EPS-Low kr 5.40 kr 7.10 kr 1.36 kr 1.35 kr 1.63
CJES C&J Energy Services EPS 1.21 1.00 1.05 0.46 0.39 0.24 0.13 0.21 0.21 0.26 0.32
Consensus EPS 1.23 2.14 0.26 0.35 0.38
Consensus EPS-High 1.60 2.99 0.29 0.45 0.47
Consensus EPS-Low 1.00 1.05 0.21 0.26 0.27
CLB Core Laboratories EPS 5.32 5.85 6.30 1.22 1.32 1.36 1.43 1.38 1.34 1.50 1.63
Consensus EPS 5.93 6.75 1.34 1.52 1.61
Consensus EPS-High 6.24 7.40 1.37 1.55 1.64
Consensus EPS-Low 5.80 6.09 1.32 1.49 1.56
CRR Carbo Ceramics EPS 3.70 3.95 4.75 0.76 0.71 1.31 0.90 0.80 0.91 0.06 1.17
Consensus EPS 4.28 5.69 0.95 1.24 1.28
Consensus EPS-High 4.59 6.90 1.03 1.50 1.53
Consensus EPS-Low 3.82 4.75 0.86 0.99 1.13
DRC Dresser-Rand EPS 3.00 2.70 3.35 0.43 0.69 0.64 1.24 0.22 0.39 -- --
Consensus EPS 2.65 3.18 0.40 0.85 1.18
Consensus EPS-High 2.75 3.40 0.47 0.94 1.31
Consensus EPS-Low 2.55 2.94 0.36 0.74 1.07
DRQ Dril-Quip EPS 4.23 4.85 5.90 0.85 1.05 1.12 1.20 1.04 1.15 1.27 1.39
Consensus EPS 5.01 6.15 1.16 1.33 1.44
Consensus EPS-High 5.60 6.90 1.33 1.50 1.62
Consensus EPS-Low 4.80 5.25 1.10 1.24 1.32
FET Forum Energy EPS 1.46 0.74 0.95 0.33 0.72 0.44 0.37 0.40 0.41 0.45 0.48
Consensus EPS 1.81 2.27 0.42 0.48 0.52
Consensus EPS-High 1.95 2.60 0.45 0.52 0.58
Consensus EPS-Low 1.71 1.95 0.40 0.45 0.45
FI Frank's Intl. EPS 1.98 1.30 1.45 0.60 0.85 0.34 0.37 0.27 0.31 0.35 0.37
Consensus EPS 1.28 1.45 0.31 0.34 0.35
Consensus EPS-High 1.37 1.57 0.33 0.37 0.37
Consensus EPS-Low 1.19 1.37 0.29 0.31 0.32
OII Oceaneering Intl. EPS 3.40 4.00 4.55 0.69 0.91 0.96 0.86 0.84 1.01 1.07 1.08
Consensus EPS 4.04 4.70 1.01 1.13 1.06
Consensus EPS-High 4.10 4.98 1.03 1.21 1.13
Consensus EPS-Low 3.95 4.50 0.99 1.07 1.01
OIS Oil States Intl. EPS 6.18 5.30 5.60 1.80 1.50 1.42 1.47 1.34 1.15 1.31 1.49
Consensus EPS 5.48 6.31 1.22 1.39 1.53
Consensus EPS-High 5.78 7.25 1.34 1.50 1.65
Consensus EPS-Low 5.25 5.60 1.15 1.28 1.43
SPN Superior Energy EPS 1.56 1.50 2.25 0.40 0.72 0.43 0.30 0.26 0.39 0.40 0.44
Consensus EPS 1.71 2.45 0.41 0.52 0.51
Consensus EPS-High 1.84 2.90 0.43 0.59 0.59
Consensus EPS-Low 1.50 2.08 0.36 0.40 0.44
Guggenheim Securities, LLC | 972-638-5502 | guggenheimsecurities.com
<p>Oilfield Services & Offshore Drillers</p> PAGE 52
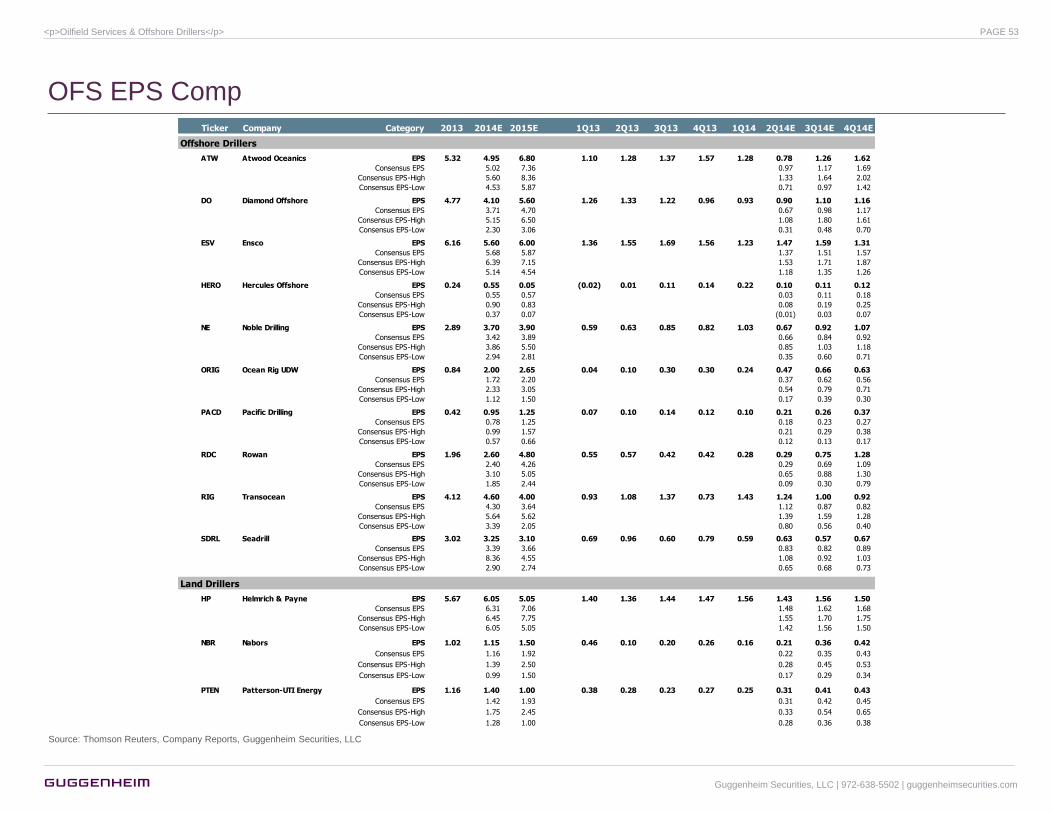
OFS EPS Comp
Source: Thomson Reuters, Company Reports, Guggenheim Securities, LLC
Ticker Company Category 2013 2014E 2015E 1Q13 2Q13 3Q13 4Q13 1Q14 2Q14E 3Q14E 4Q14E
Offshore Drillers
ATW Atwood Oceanics EPS 5.32 4.95 6.80 1.10 1.28 1.37 1.57 1.28 0.78 1.26 1.62
Consensus EPS 5.02 7.36 0.97 1.17 1.69
Consensus EPS-High 5.60 8.36 1.33 1.64 2.02
Consensus EPS-Low 4.53 5.87 0.71 0.97 1.42
DO Diamond Offshore EPS 4.77 4.10 5.60 1.26 1.33 1.22 0.96 0.93 0.90 1.10 1.16
Consensus EPS 3.71 4.70 0.67 0.98 1.17
Consensus EPS-High 5.15 6.50 1.08 1.80 1.61
Consensus EPS-Low 2.30 3.06 0.31 0.48 0.70
ESV Ensco EPS 6.16 5.60 6.00 1.36 1.55 1.69 1.56 1.23 1.47 1.59 1.31
Consensus EPS 5.68 5.87 1.37 1.51 1.57
Consensus EPS-High 6.39 7.15 1.53 1.71 1.87
Consensus EPS-Low 5.14 4.54 1.18 1.35 1.26
HERO Hercules Offshore EPS 0.24 0.55 0.05 (0.02) 0.01 0.11 0.14 0.22 0.10 0.11 0.12
Consensus EPS 0.55 0.57 0.03 0.11 0.18
Consensus EPS-High 0.90 0.83 0.08 0.19 0.25
Consensus EPS-Low 0.37 0.07 (0.01) 0.03 0.07
NE Noble Drilling EPS 2.89 3.70 3.90 0.59 0.63 0.85 0.82 1.03 0.67 0.92 1.07
Consensus EPS 3.42 3.89 0.66 0.84 0.92
Consensus EPS-High 3.86 5.50 0.85 1.03 1.18
Consensus EPS-Low 2.94 2.81 0.35 0.60 0.71
ORIG Ocean Rig UDW EPS 0.84 2.00 2.65 0.04 0.10 0.30 0.30 0.24 0.47 0.66 0.63
Consensus EPS 1.72 2.20 0.37 0.62 0.56
Consensus EPS-High 2.33 3.05 0.54 0.79 0.71
Consensus EPS-Low 1.12 1.50 0.17 0.39 0.30
PACD Pacific Drilling EPS 0.42 0.95 1.25 0.07 0.10 0.14 0.12 0.10 0.21 0.26 0.37
Consensus EPS 0.78 1.25 0.18 0.23 0.27
Consensus EPS-High 0.99 1.57 0.21 0.29 0.38
Consensus EPS-Low 0.57 0.66 0.12 0.13 0.17
RDC Rowan EPS 1.96 2.60 4.80 0.55 0.57 0.42 0.42 0.28 0.29 0.75 1.28
Consensus EPS 2.40 4.26 0.29 0.69 1.09
Consensus EPS-High 3.10 5.05 0.65 0.88 1.30
Consensus EPS-Low 1.85 2.44 0.09 0.30 0.79
RIG Transocean EPS 4.12 4.60 4.00 0.93 1.08 1.37 0.73 1.43 1.24 1.00 0.92
Consensus EPS 4.30 3.64 1.12 0.87 0.82
Consensus EPS-High 5.64 5.62 1.39 1.59 1.28
Consensus EPS-Low 3.39 2.05 0.80 0.56 0.40
SDRL Seadrill EPS 3.02 3.25 3.10 0.69 0.96 0.60 0.79 0.59 0.63 0.57 0.67
Consensus EPS 3.39 3.66 0.83 0.82 0.89
Consensus EPS-High 8.36 4.55 1.08 0.92 1.03
Consensus EPS-Low 2.90 2.74 0.65 0.68 0.73
Land Drillers
HP Helmrich & Payne EPS 5.67 6.05 5.05 1.40 1.36 1.44 1.47 1.56 1.43 1.56 1.50
Consensus EPS 6.31 7.06 1.48 1.62 1.68
Consensus EPS-High 6.45 7.75 1.55 1.70 1.75
Consensus EPS-Low 6.05 5.05 1.42 1.56 1.50
NBR Nabors EPS 1.02 1.15 1.50 0.46 0.10 0.20 0.26 0.16 0.21 0.36 0.42
Consensus EPS 1.16 1.92 0.22 0.35 0.43
Consensus EPS-High 1.39 2.50 0.28 0.45 0.53
Consensus EPS-Low 0.99 1.50 0.17 0.29 0.34
PTEN Patterson-UTI Energy EPS 1.16 1.40 1.00 0.38 0.28 0.23 0.27 0.25 0.31 0.41 0.43
Consensus EPS 1.42 1.93 0.31 0.42 0.45
Consensus EPS-High 1.75 2.45 0.33 0.54 0.65
Consensus EPS-Low 1.28 1.00 0.28 0.36 0.38
Guggenheim Securities, LLC | 972-638-5502 | guggenheimsecurities.com
<p>Oilfield Services & Offshore Drillers</p> PAGE 53
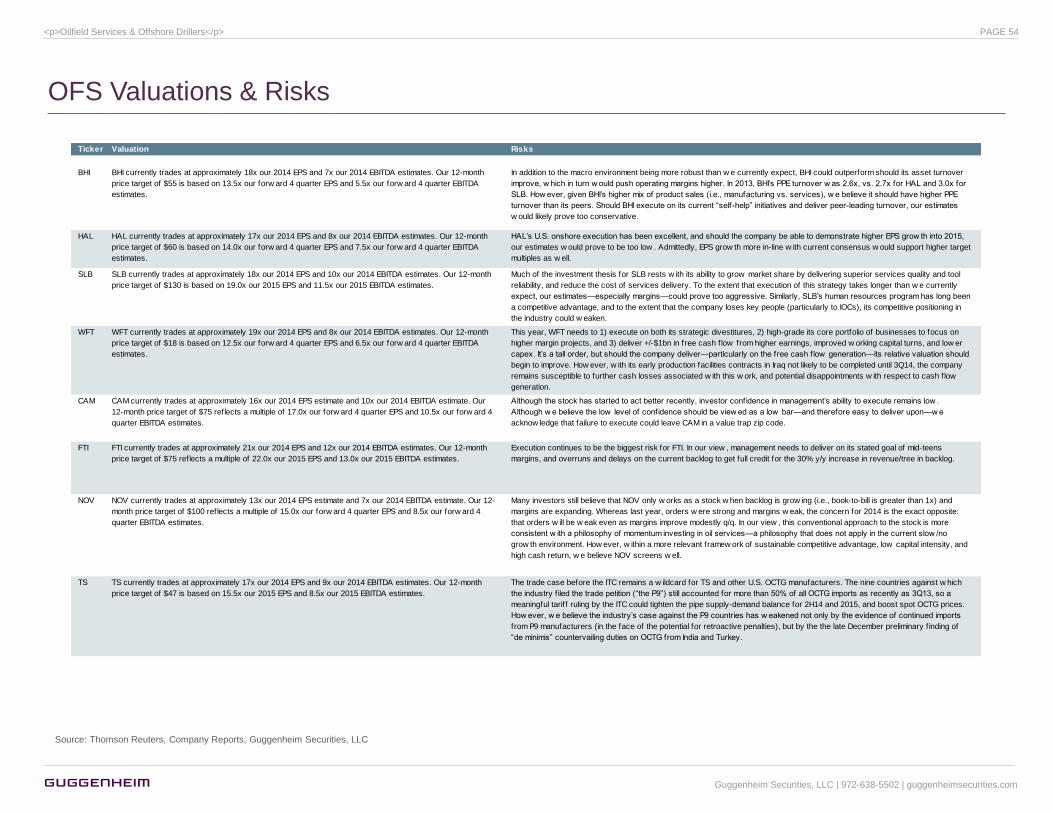
OFS Valuations & Risks
Source: Thomson Reuters, Company Reports, Guggenheim Securities, LLC
Ticker Valuation Risks
BHI BHI currently trades at approximately 18x our 2014 EPS and 7x our 2014 EBITDA estimates. Our 12-month
price target of $55 is based on 13.5x our forw ard 4 quarter EPS and 5.5x our forw ard 4 quarter EBITDA
estimates.
In addition to the macro environment being more robust than w e currently expect, BHI could outperform should its asset turnover
improve, w hich in turn w ould push operating margins higher. In 2013, BHI‘s PPE turnover w as 2.6x, vs. 2.7x for HAL and 3.0x for
SLB. How ever, given BHI‘s higher mix of product sales (i.e., manufacturing vs. services), w e believe it should have higher PPE
turnover than its peers. Should BHI execute on its current ―self-help‖ initiatives and deliver peer-leading turnover, our estimates
w ould likely prove too conservative.
HAL HAL currently trades at approximately 17x our 2014 EPS and 8x our 2014 EBITDA estimates. Our 12-month
price target of $60 is based on 14.0x our forw ard 4 quarter EPS and 7.5x our forw ard 4 quarter EBITDA
estimates.
HAL‘s U.S. onshore execution has been excellent, and should the company be able to demonstrate higher EPS grow th into 2015,
our estimates w ould prove to be too low . Admittedly, EPS grow th more in-line w ith current consensus w ould support higher target
multiples as w ell.
SLB SLB currently trades at approximately 18x our 2014 EPS and 10x our 2014 EBITDA estimates. Our 12-month
price target of $130 is based on 19.0x our 2015 EPS and 11.5x our 2015 EBITDA estimates.
Much of the investment thesis for SLB rests w ith its ability to grow market share by delivering superior services quality and tool
reliability, and reduce the cost of services delivery. To the extent that execution of this strategy takes longer than w e currently
expect, our estimates—especially margins—could prove too aggressive. Similarly, SLB‘s human resources program has long been
a competitive advantage, and to the extent that the company loses key people (particularly to IOCs), its competitive positioning in
the industry could w eaken.
WFT WFT currently trades at approximately 19x our 2014 EPS and 8x our 2014 EBITDA estimates. Our 12-month
price target of $18 is based on 12.5x our forw ard 4 quarter EPS and 6.5x our forw ard 4 quarter EBITDA
estimates.
This year, WFT needs to 1) execute on both its strategic divestitures, 2) high-grade its core portfolio of businesses to focus on
higher margin projects, and 3) deliver +/-$1bn in free cash f low from higher earnings, improved w orking capital turns, and low er
capex. It‘s a tall order, but should the company deliver—particularly on the free cash f low generation—its relative valuation should
begin to improve. How ever, w ith its early production facilities contracts in Iraq not likely to be completed until 3Q14, the company
remains susceptible to further cash losses associated w ith this w ork, and potential disappointments w ith respect to cash f low
generation.
CAM CAM currently trades at approximately 16x our 2014 EPS estimate and 10x our 2014 EBITDA estimate. Our
12-month price target of $75 reflects a multiple of 17.0x our forw ard 4 quarter EPS and 10.5x our forw ard 4
quarter EBITDA estimates.
Although the stock has started to act better recently, investor confidence in management‘s ability to execute remains low .
Although w e believe the low level of confidence should be view ed as a low bar—and therefore easy to deliver upon—w e
acknow ledge that failure to execute could leave CAM in a value trap zip code.
FTI FTI currently trades at approximately 21x our 2014 EPS and 12x our 2014 EBITDA estimates. Our 12-month
price target of $75 reflects a multiple of 22.0x our 2015 EPS and 13.0x our 2015 EBITDA estimates.
Execution continues to be the biggest risk for FTI. In our view , management needs to deliver on its stated goal of mid-teens
margins, and overruns and delays on the current backlog to get full credit for the 30% y/y increase in revenue/tree in backlog.
NOV NOV currently trades at approximately 13x our 2014 EPS estimate and 7x our 2014 EBITDA estimate. Our 12-
month price target of $100 reflects a multiple of 15.0x our forw ard 4 quarter EPS and 8.5x our forw ard 4
quarter EBITDA estimates.
Many investors still believe that NOV only w orks as a stock w hen backlog is grow ing (i.e., book-to-bill is greater than 1x) and
margins are expanding. Whereas last year, orders w ere strong and margins w eak, the concern for 2014 is the exact opposite:
that orders w ill be w eak even as margins improve modestly q/q. In our view , this conventional approach to the stock is more
consistent w ith a philosophy of momentum investing in oil services—a philosophy that does not apply in the current slow /no
grow th environment. How ever, w ithin a more relevant framew ork of sustainable competitive advantage, low capital intensity, and
high cash return, w e believe NOV screens w ell.
TS TS currently trades at approximately 17x our 2014 EPS and 9x our 2014 EBITDA estimates. Our 12-month
price target of $47 is based on 15.5x our 2015 EPS and 8.5x our 2015 EBITDA estimates.
The trade case before the ITC remains a w ildcard for TS and other U.S. OCTG manufacturers. The nine countries against w hich
the industry f iled the trade petition (―the P9‖) still accounted for more than 50% of all OCTG imports as recently as 3Q13, so a
meaningful tariff ruling by the ITC could tighten the pipe supply-demand balance for 2H14 and 2015, and boost spot OCTG prices.
How ever, w e believe the industry‘s case against the P9 countries has w eakened not only by the evidence of continued imports
from P9 manufacturers (in the face of the potential for retroactive penalties), but by the the late December preliminary f inding of
―de minimis‖ countervailing duties on OCTG from India and Turkey.
Guggenheim Securities, LLC | 972-638-5502 | guggenheimsecurities.com
<p>Oilfield Services & Offshore Drillers</p> PAGE 54
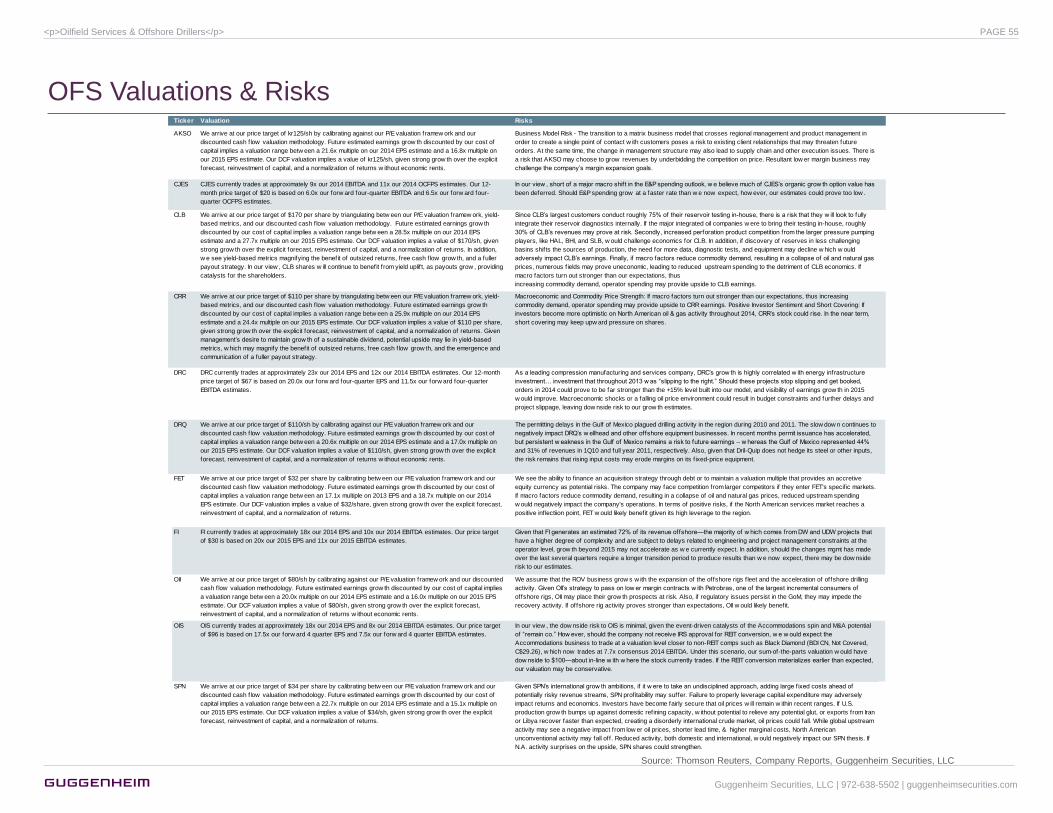
OFS Valuations & Risks
Source: Thomson Reuters, Company Reports, Guggenheim Securities, LLC
Ticker Valuation Risks
AKSO We arrive at our price target of kr125/sh by calibrating against our P/E valuation framew ork and our
discounted cash f low valuation methodology. Future estimated earnings grow th discounted by our cost of
capital implies a valuation range betw een a 21.6x multiple on our 2014 EPS estimate and a 16.8x multiple on
our 2015 EPS estimate. Our DCF valuation implies a value of kr125/sh, given strong grow th over the explicit
forecast, reinvestment of capital, and a normalization of returns w ithout economic rents.
Business Model Risk - The transition to a matrix business model that crosses regional management and product management in
order to create a single point of contact w ith customers poses a risk to existing client relationships that may threaten future
orders. At the same time, the change in management structure may also lead to supply chain and other execution issues. There is
a risk that AKSO may choose to grow revenues by underbidding the competition on price. Resultant low er margin business may
challenge the company‘s margin expansion goals.
CJES CJES currently trades at approximately 9x our 2014 EBITDA and 11x our 2014 OCFPS estimates. Our 12-
month price target of $20 is based on 6.0x our forw ard four-quarter EBITDA and 6.5x our forw ard four-
quarter OCFPS estimates.
In our view , short of a major macro shift in the E&P spending outlook, w e believe much of CJES‘s organic grow th option value has
been deferred. Should E&P spending grow at a faster rate than w e now expect, how ever, our estimates could prove too low .
CLB We arrive at our price target of $170 per share by triangulating betw een our P/E valuation framew ork, yield-
based metrics, and our discounted cash f low valuation methodology. Future estimated earnings grow th
discounted by our cost of capital implies a valuation range betw een a 28.5x multiple on our 2014 EPS
estimate and a 27.7x multiple on our 2015 EPS estimate. Our DCF valuation implies a value of $170/sh, given
strong grow th over the explicit forecast, reinvestment of capital, and a normalization of returns. In addition,
w e see yield-based metrics magnifying the benefit of outsized returns, free cash f low grow th, and a fuller
payout strategy. In our view , CLB shares w ill continue to benefit from yield uplif t, as payouts grow , providing
catalysts for the shareholders.
Since CLB‘s largest customers conduct roughly 75% of their reservoir testing in-house, there is a risk that they w ill look to fully
integrate their reservoir diagnostics internally. If the major integrated oil companies w ere to bring their testing in-house, roughly
30% of CLB‘s revenues may prove at risk. Secondly, increased perforation product competition from the larger pressure pumping
players, like HAL, BHI, and SLB, w ould challenge economics for CLB. In addition, if discovery of reserves in less challenging
basins shifts the sources of production, the need for more data, diagnostic tests, and equipment may decline w hich w ould
adversely impact CLB‘s earnings. Finally, if macro factors reduce commodity demand, resulting in a collapse of oil and natural gas
prices, numerous f ields may prove uneconomic, leading to reduced upstream spending to the detriment of CLB economics. If
macro factors turn out stronger than our expectations, thus
increasing commodity demand, operator spending may provide upside to CLB earnings.
CRR We arrive at our price target of $110 per share by triangulating betw een our P/E valuation framew ork, yield-
based metrics, and our discounted cash f low valuation methodology. Future estimated earnings grow th
discounted by our cost of capital implies a valuation range betw een a 25.9x multiple on our 2014 EPS
estimate and a 24.4x multiple on our 2015 EPS estimate. Our DCF valuation implies a value of $110 per share,
given strong grow th over the explicit forecast, reinvestment of capital, and a normalization of returns. Given
management‘s desire to maintain grow th of a sustainable dividend, potential upside may lie in yield-based
metrics, w hich may magnify the benefit of outsized returns, free cash f low grow th, and the emergence and
communication of a fuller payout strategy.
Macroeconomic and Commodity Price Strength: If macro factors turn out stronger than our expectations, thus increasing
commodity demand, operator spending may provide upside to CRR earnings. Positive Investor Sentiment and Short Covering: If
investors become more optimistic on North American oil & gas activity throughout 2014, CRR‘s stock could rise. In the near term,
short covering may keep upw ard pressure on shares.
DRC DRC currently trades at approximately 23x our 2014 EPS and 12x our 2014 EBITDA estimates. Our 12-month
price target of $67 is based on 20.0x our forw ard four-quarter EPS and 11.5x our forw ard four-quarter
EBITDA estimates.
As a leading compression manufacturing and services company, DRC‘s grow th is highly correlated w ith energy infrastructure
investment… investment that throughout 2013 w as ―slipping to the right.‖ Should these projects stop slipping and get booked,
orders in 2014 could prove to be far stronger than the +15% level built into our model, and visibility of earnings grow th in 2015
w ould improve. Macroeconomic shocks or a falling oil price environment could result in budget constraints and further delays and
project slippage, leaving dow nside risk to our grow th estimates.
DRQ We arrive at our price target of $110/sh by calibrating against our P/E valuation framew ork and our
discounted cash f low valuation methodology. Future estimated earnings grow th discounted by our cost of
capital implies a valuation range betw een a 20.6x multiple on our 2014 EPS estimate and a 17.0x multiple on
our 2015 EPS estimate. Our DCF valuation implies a value of $110/sh, given strong grow th over the explicit
forecast, reinvestment of capital, and a normalization of returns w ithout economic rents.
The permitting delays in the Gulf of Mexico plagued drilling activity in the region during 2010 and 2011. The slow dow n continues to
negatively impact DRQ‘s w ellhead and other offshore equipment businesses. In recent months permit issuance has accelerated,
but persistent w eakness in the Gulf of Mexico remains a risk to future earnings – w hereas the Gulf of Mexico represented 44%
and 31% of revenues in 1Q10 and full year 2011, respectively. Also, given that Dril-Quip does not hedge its steel or other inputs,
the risk remains that rising input costs may erode margins on its f ixed-price equipment.
FET We arrive at our price target of $32 per share by calibrating betw een our P/E valuation framew ork and our
discounted cash f low valuation methodology. Future estimated earnings grow th discounted by our cost of
capital implies a valuation range betw een an 17.1x multiple on 2013 EPS and a 18.7x multiple on our 2014
EPS estimate. Our DCF valuation implies a value of $32/share, given strong grow th over the explicit forecast,
reinvestment of capital, and a normalization of returns.
We see the ability to f inance an acquisition strategy through debt or to maintain a valuation multiple that provides an accretive
equity currency as potential risks. The company may face competition from larger competitors if they enter FET's specif ic markets.
If macro factors reduce commodity demand, resulting in a collapse of oil and natural gas prices, reduced upstream spending
w ould negatively impact the company's operations. In terms of positive risks, if the North American services market reaches a
positive inflectiion point, FET w ould likely benefit gtiven its high leverage to the region.
FI FI currently trades at approximately 18x our 2014 EPS and 10x our 2014 EBITDA estimates. Our price target
of $30 is based on 20x our 2015 EPS and 11x our 2015 EBITDA estimates.
Given that FI generates an estimated 72% of its revenue offshore—the majority of w hich comes from DW and UDW projects that
have a higher degree of complexity and are subject to delays related to engineering and project management constraints at the
operator level, grow th beyond 2015 may not accelerate as w e currently expect. In addition, should the changes mgmt has made
over the last several quarters require a longer transition period to produce results than w e now expect, there may be dow nside
risk to our estimates.
OII We arrive at our price target of $80/sh by calibrating against our P/E valuation framew ork and our discounted
cash f low valuation methodology. Future estimated earnings grow th discounted by our cost of capital implies
a valuation range betw een a 20.0x multiple on our 2014 EPS estimate and a 16.0x multiple on our 2015 EPS
estimate. Our DCF valuation implies a value of $80/sh, given strong grow th over the explicit forecast,
reinvestment of capital, and a normalization of returns w ithout economic rents.
We assume that the ROV business grow s w ith the expansion of the offshore rigs f leet and the acceleration of offshore drilling
activity. Given OII‘s strategy to pass on low er margin contracts w ith Petrobras, one of the largest incremental consumers of
offshore rigs, OII may place their grow th prospects at risk. Also, if regulatory issues persist in the GoM, they may impede the
recovery activity. If offshore rig activity proves stronger than expectations, OII w ould likely benefit.
OIS OIS currently trades at approximately 18x our 2014 EPS and 8x our 2014 EBITDA estimates. Our price target
of $96 is based on 17.5x our forw ard 4 quarter EPS and 7.5x our forw ard 4 quarter EBITDA estimates.
In our view , the dow nside risk to OIS is minimal, given the event-driven catalysts of the Accommodations spin and M&A potential
of ―remain co.‖ How ever, should the company not receive IRS approval for REIT conversion, w e w ould expect the
Accommodations business to trade at a valuation level closer to non-REIT comps such as Black Diamond (BDI CN, Not Covered,
C$29.26), w hich now trades at 7.7x consensus 2014 EBITDA. Under this scenario, our sum-of-the-parts valuation w ould have
dow nside to $100—about in-line w ith w here the stock currently trades. If the REIT conversion materializes earlier than expected,
our valuation may be conservative.
SPN We arrive at our price target of $34 per share by calibrating betw een our P/E valuation framew ork and our
discounted cash f low valuation methodology. Future estimated earnings grow th discounted by our cost of
capital implies a valuation range betw een a 22.7x multiple on our 2014 EPS estimate and a 15.1x multiple on
our 2015 EPS estimate. Our DCF valuation implies a value of $34/sh, given strong grow th over the explicit
forecast, reinvestment of capital, and a normalization of returns.
Given SPN‘s international grow th ambitions, if it w ere to take an undisciplined approach, adding large f ixed costs ahead of
potentially risky revenue streams, SPN profitability may suffer. Failure to properly leverage capital expenditure may adversely
impact returns and economics. Investors have become fairly secure that oil prices w ill remain w ithin recent ranges. If U.S.
production grow th bumps up against domestic refining capacity, w ithout potential to relieve any potential glut, or exports from Iran
or Libya recover faster than expected, creating a disorderly international crude market, oil prices could fall. While global upstream
activity may see a negative impact from low er oil prices, shorter lead time, & higher marginal costs, North American
unconventional activity may fall off. Reduced activity, both domestic and international, w ould negatively impact our SPN thesis. If
N.A. activity surprises on the upside, SPN shares could strengthen.
Guggenheim Securities, LLC | 972-638-5502 | guggenheimsecurities.com
<p>Oilfield Services & Offshore Drillers</p> PAGE 55

OFS Valuations & Risks
Source: Thomson Reuters, Company Reports, Guggenheim Securities, LLC
Ticker Valuation Risks
ATW We arrive at a price target of $58/sh. Our methodology w eighs our NAV - Break-Up, or liquidation value of
the company, and our NAV - Reinvestment Value, w hich discounts the value of assumed future investment
against our view of the company‘s capital budgeting strategy and our future forecast of the offshore rig
market across asset classes.
Risks include construction (4 new builds), BOP maintenance dow ntime & dayrate exposure. Rig construction programs run the risk
of costs and delivery overruns that may impact earnings. Operational execution risk leaves the chance for higher maintenance
costs and dow ntime that may impact earnings. In a higher scrutiny, post-Macondo w orld, the risk of higher maintenance is
prevalent. Economic cycles impact commodity prices, w hich in turn impact drilling activity and rig demand. Thus, an economic
dow nturn may negatively impact earnings pow er.
DO We arrive at a price target of $65/sh. Our methodology triangulates betw een NAV - Break-Up, NAV -
Reinvestment, and yield based valuation metrics. While NAV provides baseline support, w e derive our price
target against yield- based valuation metrics, w here w e probability w eight the timing and magnitude of future
dividends in relation to the current capital market for yield entities.
Should midw ater dayrates exceed expectations DO could outperform, dow nside risks include construction and strategy (favoring
dividends over more aggressive reinvestment). Operational execution risk leaves the chance for higher maintenance costs and
dow ntime that may impact earnings. In a higher scrutiny, post-Macondo w orld, the risk of higher maintenance is prevalent.
Economic cycles impact commodity prices, w hich in turn impact drilling activity and rig demand. Thus, an economic dow nturn may
negatively impact earnings pow er.
ESV We arrive at a price target of $60/sh. Our methodology triangulates betw een NAV - Break-Up, NAV -
Reinvestment, and yield based valuation metrics. While NAV provides baseline support, w e derive our price
target against yield- based valuation metrics, w here w e probability w eight the timing and magnitude of future
dividends in relation to the current capital market for yield entities.
Risks include construction and GOM exposure. Operational execution risk leaves the chance for higher maintenance costs and
dow ntime that may impact earnings. In a higher scrutiny, post-Macondo w orld, the risk of higher maintenance is prevalent. A
potential overbuild w ithin any segment of the rig market can depress dayrates and shorten contract durations to the detriment of
earnings. Economic cycles impact commodity prices, w hich in turn impact drilling activity and rig demand. Thus, an economic
dow nturn may negatively impact earnings pow er.
HERO We arrive at a price target of $5/sh. Our methodology triangulates betw een NAV - Break-Up, NAV -
Reinvestment, and yield based valuation metrics. While NAV provides baseline support, w e derive our price
target against yield- based valuation metrics, w here w e probability w eight the timing and magnitude of future
dividends in relation to the current capital market for yield entities.
Risks include construction (1 new build) and GOM exposure. Operational execution risk leaves the chance for higher maintenance
costs and dow ntime that may impact earnings. In a higher scrutiny, post-Macondo w orld, the risk of higher maintenance is
prevalent. A potential overbuild w ithin any segment of the rig market can depress dayrates and shorten contract durations to the
detriment of earnings. Economic cycles impact commodity prices, w hich in turn impact drilling activity and rig demand. Thus, an
economic dow nturn may negatively impact earnings pow er. Persistently high dayrates and favorable supply/demand dynamics
may benefit earnings.
NE We arrive at a price target of $42/sh. Our methodology triangulates betw een NAV - Break-Up, NAV -
Reinvestment, and yield based valuation metrics. While NAV provides baseline support, w e derive our price
target against yield- based valuation metrics, w here w e probability w eight the timing and magnitude of future
dividends in relation to the current capital market for yield entities.
Risks include construction (12 new builds), GOM and Mexico exposure, and RoF exposure. Given the volatility of contract
dayrates and contract terms, the company maintains a risk of low bids as the rig market improves as w ell as a false confidence in
bargaining pow er as the market declines. Rig construction programs run the risk of costs and delivery overruns that may impact
earnings. Operational execution risk leaves the chance for higher maintenance costs and dow ntime that may impact earnings.
ORIG We arrive at a price target of $28/sh. Our methodology triangulates betw een NAV - Break-Up, NAV -
Reinvestment, and yield based valuation metrics. While NAV provides baseline support, w e derive our price
target against yield- based valuation metrics, w here w e probability w eight the timing and magnitude of future
dividends in relation to the current capital market for yield entities.
Risks include construction (4 new builds). Given the volatility of contract dayrates and contract terms, the company maintains a
risk of low bids as the rig market improves as w ell as a false confidence in bargaining pow er as the market declines. Rig
construction programs run the risk of costs and delivery overruns that may impact earnings. Operational execution risk leaves the
chance for higher maintenance costs and dow ntime that may impact earnings.
PACD We arrive at a price target of $14/sh. Our methodology w eighs our NAV - Break-Up, or liquidation value of
the company, and our NAV - Reinvestment Value, w hich discounts the value of assumed future investment
against our view of the company‘s capital budgeting strategy and our future forecast of the offshore rig
market across asset classes.
Risks include construction (4 new builds) and BOP maintenance dow ntime. Rig construction programs run the risk of costs and
delivery overruns that may impact earnings. Operational execution risk leaves the chance for higher maintenance costs and
dow ntime that may impact earnings. In a higher scrutiny, post-Macondo w orld, the risk of higher maintenance is prevalent.
Economic cycles impact commodity prices, w hich in turn impact drilling activity and rig demand. Thus, an economic dow nturn may
negatively impact earnings pow er.
RDC We arrive at a price target of $36/sh. Our methodology w eighs our NAV - Break-Up, or liquidation value of
the company, and our NAV - Reinvestment Value, w hich discounts the value of assumed future investment
against our view of the company‘s capital budgeting strategy and our future forecast of the offshore rig
market across asset classes.
Risks include construction (4 new builds) and entry into new markets, w hich could potentially carry higher costs (UDW and SE
Asia). Given the volatility of contract dayrates and contract terms, the company maintains a risk of low bids as the rig market
improves as w ell as a false confidence in bargaining pow er as the market declines. Rig construction programs run the risk of
costs and delivery overruns that may impact earnings. A potential overbuild w ithin any segment of the rig market can depress
dayrates and shorten contract durations to the detriment of earnings. Persistently high dayrates and favorable supply/demand
dynamics may benefit earnings.
RIG We arrive at a price target of $55/sh. Our methodology triangulates betw een NAV - Break-Up, NAV -
Reinvestment, and yield-based valuation metrics. While NAV provides baseline support, w e derive our price
target against yield-based valuation metrics, w here w e probability-w eight the timing and magnitude of future
dividends in relation to the current capital market for yield entities.
Macondo involvement remains a risk to the dow nside. Given the volatility of contract dayrates and contract terms, the company
maintains a risk of low bids as the rig market improves as w ell as a false confidence in bargaining pow er as the market declines.
Operational execution risk leaves the chance for higher maintenance costs and dow ntime that may impact earnings. In a higher
scrutiny, post-Macondo w orld, the risk of higher maintenance is prevalent. Economic cycles impact commodity prices, w hich in
turn impact drilling activity and rig demand. Thus, an economic dow nturn may negatively impact earnings pow er.
SDRL We arrive at a price target of $50/sh. Our methodology triangulates betw een NAV - Break-Up, NAV -
Reinvestment, and yield-based valuation metrics. While NAV provides baseline support, w e derive our price
target against yield-based valuation metrics, w here w e probability-w eight the timing and magnitude of future
dividends in relation to the current capital market for yield entities.
Risks include construction (16 rig new builds) and f inancial leverage, SDRL is the most levererd name in our group. Rig
construction programs run the risk of costs and delivery overruns that may impact earnings. Operational execution risk leaves the
chance for higher maintenance costs and dow ntime that may impact earnings. In a higher scrutiny, post-Macondo w orld, the risk
of higher maintenance is prevalent. A potential overbuild w ithin any segment of the rig market can depress dayrates and shorten
contract durations to the detriment of earnings.
HP HP currently trades at approximately 7x our 2014 EBITDA and 9x our 2014 CFPS estimates. Our 12-month
price target of $80 is based on 17.0x our 2015 EPS estimate and 6.0x our 2015 EBITDA estimate.
Our investment thesis is predicated upon the idea that the rate of HP‘s market share gains remains relatively stable, and that
overall utilization suffers as a result of a market dow nturn in 2015. How ever, should HP‘s share gains accelerate into any potential
dow nturn next year, w e could be underestimating f leet utilization and earnings. Additionally, w e expect several large tenders this
year (for w ork in 2015-16) in countries like Saudi Arabia. Should HP w in any of these large international tenders, our estimates
w ould prove too conservative, as w e have assumed essentially f lat international revenue and operating income.
NBR NBR currently trades at approximately 6x our 2014 EBITDA and 5x our 2014 CFPS estimates. Our 12-month
price target of $21 is based on 15.0x our 2015 EPS estimate and 5.0x our 2015 EBITDA estimate.
The risk in being NEUTRAL a low multiple stock is that a re-rate event (e.g., management change, execution of meaningful non-
core asset divestiture, etc.) could occur at any point. We continue to believe the event risk in NBR is low , as the leverage,
challenged asset base, and shareholder rights plan create challenges for potential activists.
PTEN PTEN currently trades at approximately 5x our 2014 EBITDA and 6x our 2014 CFPS estimates. Our 12-month
price target of $22 is based on 4.0x our 2015 EBITDA and 4.0x our 2015 CFPS estimates.
We continue to believe that the market for AC-electric rigs remains under-supplied by +/-600 rigs, and that PTEN has emerged as a
real leader in the AC market as a result of the eff iciency of its APEX fleet and w orkforce. How ever, our expectations of a
commodity-price induced reduction in drilling activity in 2015 should create an air pocket in overall rig demand—including demand
for AC-electric rigs. Should the market hold up next year, our estimates for PTEN w ould very likely prove too conservative, and
much of the dow nside risk w ould be mitigated.
Guggenheim Securities, LLC | 972-638-5502 | guggenheimsecurities.com
<p>Oilfield Services & Offshore Drillers</p> PAGE 56
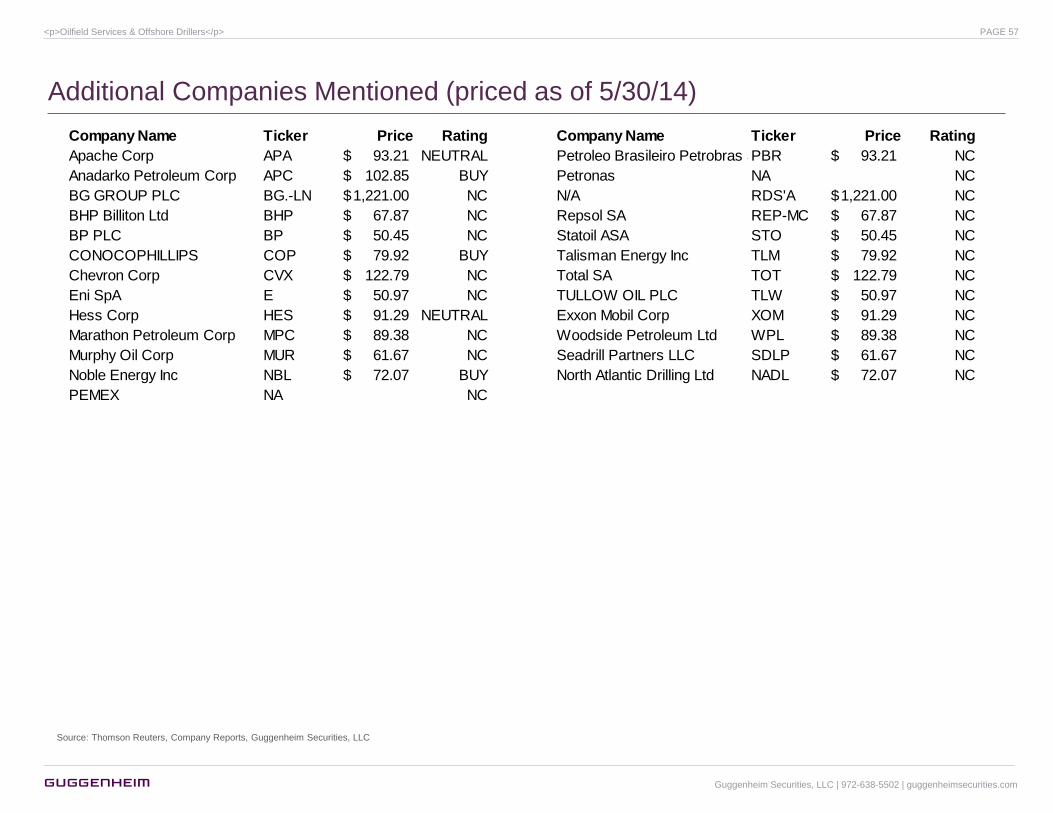
Additional Companies Mentioned (priced as of 5/30/14)
Source: Thomson Reuters, Company Reports, Guggenheim Securities, LLC
Company Name Ticker Price Rating Company Name Ticker Price Rating
Apache Corp APA 93.21$ NEUTRAL Petroleo Brasileiro Petrobras SAPBR 93.21$ NC
Anadarko Petroleum Corp APC 102.85$ BUY Petronas NA NC
BG GROUP PLC BG.-LN 1,221.00$ NC N/A RDS'A 1,221.00$ NC
BHP Billiton Ltd BHP 67.87$ NC Repsol SA REP-MC 67.87$ NC
BP PLC BP 50.45$ NC Statoil ASA STO 50.45$ NC
CONOCOPHILLIPS COP 79.92$ BUY Talisman Energy Inc TLM 79.92$ NC
Chevron Corp CVX 122.79$ NC Total SA TOT 122.79$ NC
Eni SpA E 50.97$ NC TULLOW OIL PLC TLW 50.97$ NC
Hess Corp HES 91.29$ NEUTRAL Exxon Mobil Corp XOM 91.29$ NC
Marathon Petroleum Corp MPC 89.38$ NC Woodside Petroleum Ltd WPL 89.38$ NC
Murphy Oil Corp MUR 61.67$ NC Seadrill Partners LLC SDLP 61.67$ NC
Noble Energy Inc NBL 72.07$ BUY North Atlantic Drilling Ltd NADL 72.07$ NC
PEMEX NA NC
Guggenheim Securities, LLC | 972-638-5502 | guggenheimsecurities.com
<p>Oilfield Services & Offshore Drillers</p> PAGE 57
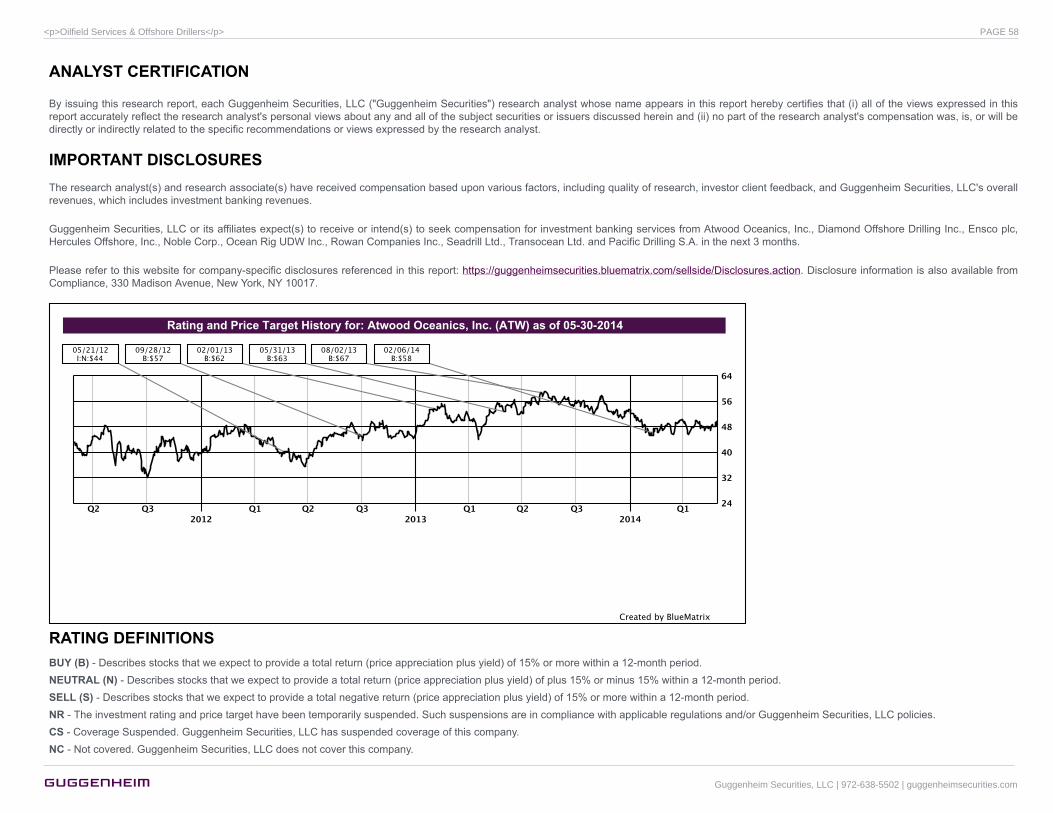
ANALYST CERTIFICATION
By issuing this research report, each Guggenheim Securities, LLC ("Guggenheim Securities") research analyst whose name appears in this report hereby certifies that (i) all of the views expressed in thisreport accurately reflect the research analyst's personal views about any and all of the subject securities or issuers discussed herein and (ii) no part of the research analyst's compensation was, is, or will bedirectly or indirectly related to the specific recommendations or views expressed by the research analyst.
IMPORTANT DISCLOSURESThe research analyst(s) and research associate(s) have received compensation based upon various factors, including quality of research, investor client feedback, and Guggenheim Securities, LLC's overallrevenues, which includes investment banking revenues.
Guggenheim Securities, LLC or its affiliates expect(s) to receive or intend(s) to seek compensation for investment banking services from Atwood Oceanics, Inc., Diamond Offshore Drilling Inc., Ensco plc,Hercules Offshore, Inc., Noble Corp., Ocean Rig UDW Inc., Rowan Companies Inc., Seadrill Ltd., Transocean Ltd. and Pacific Drilling S.A. in the next 3 months.
Please refer to this website for company-specific disclosures referenced in this report: https://guggenheimsecurities.bluematrix.com/sellside/Disclosures.action. Disclosure information is also available fromCompliance, 330 Madison Avenue, New York, NY 10017.
RATING DEFINITIONSBUY (B) - Describes stocks that we expect to provide a total return (price appreciation plus yield) of 15% or more within a 12-month period.NEUTRAL (N) - Describes stocks that we expect to provide a total return (price appreciation plus yield) of plus 15% or minus 15% within a 12-month period.SELL (S) - Describes stocks that we expect to provide a total negative return (price appreciation plus yield) of 15% or more within a 12-month period.NR - The investment rating and price target have been temporarily suspended. Such suspensions are in compliance with applicable regulations and/or Guggenheim Securities, LLC policies.CS - Coverage Suspended. Guggenheim Securities, LLC has suspended coverage of this company.NC - Not covered. Guggenheim Securities, LLC does not cover this company.
Guggenheim Securities, LLC | 972-638-5502 | guggenheimsecurities.com
<p>Oilfield Services & Offshore Drillers</p> PAGE 58
Restricted - Describes issuers where, in conjunction with Guggenheim Securities, LLC engagement in certain transactions, company policy or applicable securities regulations prohibit certain types ofcommunications, including investment recommendations.
Monitor - Describes stocks whose company fundamentals and financials are being monitored, and for which no financial projections or opinions on the investment merits of the company are provided.
Guggenheim Securities, LLC methodology for assigning ratings may include the following: market capitalization, maturity, growth/value, volatility and expected total return over the next 12 months. The pricetargets are based on several methodologies, which may include, but are not restricted to, analyses of market risk, growth rate, revenue stream, discounted cash flow (DCF), EBITDA, EPS, cash flow (CF),free cash flow (FCF), EV/EBITDA, P/E, PE/growth, P/CF, P/FCF, premium (discount)/average group EV/EBITDA, premium (discount)/average group P/E, sum of the parts, net asset value, dividend returns,and return on equity (ROE) over the next 12 months.
RATINGS DISTRIBUTIONS FOR GUGGENHEIM SECURITIES:IB Serv./ Past 12Mos.
Rating Category Count Percent Count Percent
Buy 101 55.19% 23 22.77%
Neutral 77 42.08% 5 6.49%
Sell 5 2.73% 0 0.00%
OTHER DISCLOSURES
This research is for our clients and prospective clients only. Other than disclosures relating to Guggenheim Securities and its affiliates, this research is based on current public information that we considerreliable, but we do not represent it is accurate or complete, and it should not be relied on as such. We seek to update our research as appropriate, but various regulations may prevent us from doing so.Other than certain industry reports published on a periodic basis, the large majority of reports are published at irregular intervals as appropriate in the research analyst's judgment. Guggenheim Securitiesconducts a full-service, integrated investment banking and brokerage business, and one or more of its affiliates conduct an investment management business. Guggenheim Securities is a member of SIPC(http://www.sipc.org). Our salespeople, traders, and other professionals may provide oral or written market commentary or trading strategies to our clients and our employees trading for our own account thatreflect opinions that are contrary to the opinions expressed in this research. Guggenheim Securities or certain of its affiliates conducts an investment management business, trades for its own account, andconducts an investment business, and may make investment decisions that are inconsistent with the recommendations or views expressed in this research.
We and our affiliates, officers, directors, and employees, excluding equity and credit analysts, will from time to time have long or short positions in, act as principal in, and buy or sell, the securities or derivatives,if any, referred to in this research. We and our affiliates also may sell to or buy from customers on a principal basis the securities described herein. We and our affiliates also do business with, or that relatesto, companies covered in Guggenheim Securities’ research, and may have a position in the debt of the company or companies discussed herein.
This research is not an offer to sell or the solicitation of an offer to buy any security. It does not constitute a personal recommendation or take into account the particular investment objectives, financial situations,or needs of individual clients. Clients should consider whether any advice or recommendation in this research is suitable for their particular circumstances and, if appropriate, seek professional advice, includingtax advice. The price and value of investments referred to in this research and the income from them may fluctuate. Past performance is not a guide to future performance, future returns are not guaranteed,and a loss of original capital may occur. Fluctuations in exchange rates could have adverse effects on the value or price of, or income derived from, certain investments.
TACTICAL TRADING IDEA DISCLAIMERGuggenheim Securities, LLC produces "Tactical Trade Ideas" that identify short-term, catalyst-driven trading opportunities impacting companies within the Firm’s coverage universe. Tactical Trade Ideas mayexist on companies in this report and may be contrary to the analyst’s published rating.
Copyright © 2014 by Guggenheim Securities, LLC, ("Guggenheim") a FINRA registered broker-dealer. All rights reserved. The contents of this report are based upon information or are obtained from sourcesthat Guggenheim generally considers reliable, but Guggenheim makes no representations or warranties with respect to their accuracy, completeness, timeliness, suitability or otherwise, and assumes noresponsibility to update them for subsequent events or knowledge. Guggenheim is not responsible for your use of this information.
Guggenheim Securities, LLC | 972-638-5502 | guggenheimsecurities.com
<p>Oilfield Services & Offshore Drillers</p> PAGE 59