Embed Size (px)
Citation preview

Copyright is owned by the Author of the thesis. Permission is given for a copy to be downloaded by an individual for the purpose of research and private study only. The thesis may not be reproduced elsewhere without the permission of the Author.

GROWTH OF PASTURE SPECIES IN THE SHADE
IN RELATION TO ALDER SILVO-PASTORAL
SYSTEMS
A thesis presented in partial fulfilment of the requirements for the
degree of Doctor of Philosophy (Ph.D.) in Pastoral Science, Institute of
Natural Resources at Massey University,
New Zealand
NABA RAJj>EVKOTA
2000

11
ABSTRACT
An increased understanding of the competitive interactions between tree species and
understorey pastures is required for the development of deciduous tree based silvo
pastoral systems. In particular, the shade tolerance of pasture species likely to be used
under trees in New Zealand needs to be determined. This thesis examines the effects of
light intensity and quality on the growth of pasture species in a series of glasshouse
experiments, and under the shade of alder trees pruned to different heights.
The shoot dry weight per plant of all grass and legume species examined showed a
linear increase (P<O.OOOI) with % ambient photosynthetically active radiation (PAR).
Highest shoot dry weight was at 73% and lowest was at 14% PAR (heavy shade).
Shade also affected the tillering ability of pasture species. Under heavy shade, cocksfoot
(Dactylis glomerata L.) produced more tillers per plant than the other grass species
examined. Perennial ryegrass (Lolium perenne L.) had the lowest tillering in heavy
shade. Under medium shade (43 % ambient PAR), tiller number per plant for browntop
(Agrostis capillaris L.) and Poa trivialis (Poa trivialis L.) was higher than other species.
Lotus (Lotus uliginosus L.) produced a higher (P<O.OOOI) number of branches under
heavy shade than white clover (Trifolium repens L.) and subterranean clover (Trifolium
subterraneum L.).
Shade affected perennial ryegrass more than cocksfoot selections, especially at the
lowest PAR level both in the glasshouse and the field experiment. For example, tillers
per plant under tree shade, and also at the low PAR level in the glasshouse for perennial
ryegrass were 1 8 compared with 28-29 (P<O.OOOI) for Wana cocksfoot and 24-27 for
PG 74 cocksfoot. Leaf area per plant for perennial ryegrass was also significantly
(P<O.OOOI) lower than for Wana cocksfoot. Cocks foot selections were more tolerant of
heavy shade than perennial ryegrass, and Wana was the most tolerant of the cocks foot
selections of heavy shade.
There were no effects of R:FR ratio (P>O.05) on the shoot dry weight production of the
pasture species examined. Similarly, the interaction between PAR x R:FR and species

iii
was not significant (P>0.05) for most morphological characteristics when plants were
not defoliated. Perennial ryegrass, Wana cocks foot and Yorkshire fog (Holcus lanatus
L.) at low PAR had similar yields, that higher than white clover and lotus, which were
similar. However, when plants were defoliated weekly or three-weekly, Wana cocksfoot
out produced Nui perennial ryegrass at low P AR/R:FR due to its ability to maintain
higher leaf area and higher leaf dry weight, higher SLA, and more tillers per plant.
Herbage mass of swards in heavy and medium shade created by pruning alder trees was
about 50% and 70%, respectively, of that of light shade (P<O.OOOl). Herbage mass was
highest for cocksfoot either with lotus or white clover (P<O.ooOl), whereas values for
perennial ryegrass and Yorkshire fog were lower and similar. Shade affected perennial
ryegrass more than cocksfoot and Yorkshire fog, especially at the lowest PAR level.
Cocksfoot in mixture with either white clover or lotus had the highest leaf expansion
per tiller, which was in the order cocksfoot> Yorkshire fog>perennial ryegrass. There
was no significant difference (P>0.05) between the pasture species in the total number
of sheep grazing observations in 2 hours, but more sheep grazed in light shade than in
heavy shade (P<O.OS).
The research highlighted the importance of measuring shade tolerance of pasture
species in terms of attributes that determined growth and persistence. As perennial
pasture species are regularly defoliated they must be able to vegetatively reproduce in
the shade as well as be productive. Shade tolerance of the pasture species examined
varied greatly, but their relative shade tolerance was also sensitive to the level of shade.
Although, cocks foot was the most shade tolerant species in heavy shade (PAR level
<200 J.lmoles photons m-2 S-I) it was similar to other species in medium shade (PAR
level � 400 J.lmoles photons m-2 S-1 or more).
Light intensity was more important for growth and vegetative reproduction than light
quality for pasture species under shade. Likewise, pruning trees was more important for
pasture production under tree shade. The morphological attributes related to shade
tolerance of New Zealand hill country pastoral plants were identified in this thesis as
tiller number per plant, leaf area, specific leaf area (SLA), and leaf appearance interval.

IV
For alder silvo-pastoral systems with high tree density and heavy shade (PAR level
<200 Ilmoles photons m-2 S-I) cocksfoot in combination with either lotus or white clover
was the most productive pasture, while perennial ryegrass, or browntop, with white
clover was as productive as cocks foot if shade was maintained at a PAR level >200
Ilmoles photons m-2 S-I). Additionally, cocks foot and lotus are both tolerant of the low
to medium soil fertility and seasonal dry periods likely to be encountered on the hill
country where deciduous trees are also used to control soil erosion.
Shade had a marked effect on tillering as well as on shoot dry weight, and is the most
significant factor detennining the understorey pasture production. However, the
decrease in pasture production due to shading can be managed by appropriate pruning
practices and choice of appropriate pasture species.

v
GLOSSARY AND ABREVIATIONS OF TERMS USED
Agroforestry: it refers to silvo-pastoral systems oriented to timber production or soil
erosion control. Agroforestry in New Zealand is often used synonymously with "farm
forestry" i.e. farmers managing forest plantation on the farmland. Here, agroforestry is
taken as an intensive land management practice using trees, pastures, and livestock on
the same area of land at the same time.
AGR: absolute growth rate.
Agrosilviculture: a combination of crops plus trees.
Agrosilvopastoral: covers crops, pasture/animal and trees.
Breast height: breast height in New Zealand is 1.4 m above ground on the uphill side
of the tree. Many other countries including Australia, use 1.3 m as breast height.
°C: degree Celsius.
C: carbon.
C3: photosynthetic pathway of carbon assimilation for most of the temperate pasture
species.
C4: photosynthetic pathway of carbon assimilation for most of the tropical pasture
species.
Canopy: the part of a tree consisting of branches and foliage. " Canopy closure" is the
stand age when the branches at neighbouring trees touch, or nearly so, thereby
restricting light to the forest floor.

vi
CP: crude protein.
Cultivar name: all species and cultivars are fully named in the materials and methods
section of each chapter. Elsewhere they are presented in an abbreviated fonn e.g.
' Grasslands Wana' has been referred to as Wana.
DBH: tree diameter at breast height.
Deciduous tree: broad-leaved hardwood tree that sheds its leaves during autumn/winter
and develops new leaves the following spring. Some deciduous trees like alder can also
fix atmospheric nitrogen.
Defoliation: practice of clipping or removing aerial plant parts. Here, defoliation means
cutting pasture plants at a specific height at specific intervals.
GLM: general linear model of SAS.
HH: herbage harvested. The mass of herbage per unit area removed by mechanical
means, usually expressed as g/m2.
Hill country: all the land with slopes between 1 2 and 28°, but low relief; typically 1 00
to 300m difference in elevation. Valley bottoms are usually narrow.
HM: herbage mass. The total dry weight of herbage per unit area of land, usually above
ground level and at a defined reference level. Commonly expressed as glm2.
Intercepted PAR: is the difference between global PAR above a canopy and PAR transmitted through a canopy.
J: joule, unit of measurement.
K: potassium.

vii
kg: kilogram, l000gram .
LAI: leaf area index , leaf area per unit ground area.
LAR: leaf area ratio , ratio of leaf area to whole plant dry weight .
LPC: light compensation point for photosynthesis.
Lopping: cutting one or more bran ches off a woody plant; synonym to pruning.
nm: nanometer .
NZMF: New Zealand Ministry of Forestry .
PB: polythene bag used as a pot to grow pasture species in glasshouse conditions .
PGU: plant growth unit.
Shelterbelt: a long narrow strip of trees and/or s hrubs intended to reduce wind flow ,
often for agri cultura l gain .
Silviculture: the procedure used in growing trees , especially pruning and thinning.
Silvo-pastoral system: which includes trees plus pasture/animals. Basically pasture
production is emphasised under tree shade. Generally the term agroforestry a lso
describes silvo-pastoral systems.
Stocking rate: the number of live trees per hectare , also known as "tree density".
TDR: ti me domain reflectometry.

viii
Tissue turnover: in a given period the net change in the weight of living shoot material
of a species brought about by the for mation of new tissue and the gross decrease caused
either by senes cence and decomposition of older tissue , or by herbage intake is
common ly known as tissue turnover . It is commonly expressed in gl m2/day.
Thinning: the removal of trees within a stand at some time before clear felling . If trees
are left lying in the forest , it is " waste thinning" . If trees are extracted , it is "production
thinning" .
Transmitted PAR: when shade IS created with shade cloth , transmitted PAR is
measured under the shade cloth . In the case of trees , transmitted PAR is measured
under the canopy .
Abbreviations related to experimental treatments
ANOV A: analysis of varian ce.
CL: cocks foot with lotus .
cm2: square centimetre.
cv: cultivar.
CV A: canonical variate analysis.
CV: canonical variate .
CW: cocksfoot with white clover .
d.f.: degrees of freedom .
DM: dry matter .

ix
Fig: figure.
g: gram.
GP: white clover growi ng poi nts.
ha: hectare .
h: hours .
HIN: high natural , here denotes high PAR with natural R:FR.
LIN: low natural , here denotes low PAR with natural R:FR.
UR: low redu ced , here denotes low PAR with redu ced R:FR.
LSD: least significa nt difference.
m2: metre square area.
mg: milligram.
mm: millimetre.
N: nitrogen.
n: number.
na: data not available.
NA: data not taken.
NS: non-significa nt at P=O.05.

x
P: phosphorus .
P: probability .
PAR: photosynthetically a ctive radiation . Measured in J.1moles photons m-2 S-I, 4 00-
700nm .
R:FR: red to far red ratio . Ratio of photon irradiance bet ween 655 and 665nm , and 725
and 735nm , respectively.
RGR: relative growth rate.
RW: perennial rye grass with white clover .
-1 d s : per secon .
SEM: standard error of the mean .
SLA: specific leaf area , the area of leaf displayed per unit of leaf wei ght .
SU: site usa ge , expressed as tillers per leaf.
vs: versus.
Wl: weekly defoliation .
W3: three - weekly defoliation .
YW : Yor kshire fog with white clover .
ex.: statisti cal si gnifica nce .

xi
ACKNOWLEDGEMENTS
I am highly grateful to all people and institutions who have contributed to my thesis
research. They are too many to mention here individually, though I wish I could express
my sincere gratitude to everyone.
My sincere thanks and gratitude goes to my supervisors Dr Peter David Kemp (Chief),
Professor John Hodgson, and Dr Ian Valentine for their support, help, advice, and
immense contribution in the preparation of this thesis. Dr Kemp provided the most
valuable advice, guidance, encouragement and great patience through out the study
period. I admire his free exchange of ideas, careful instructions, and helpful criticisms,
which made this experience worthwhile.
I would like to thank Dr Siva Ganesh and Dr Bruce Mackay, Massey University, for
their valuable help with the statistical analyses. Many thanks to Mr Ray Johnstone, Ms
Lesley Taylor and Mr Lee at PGU, Massey University, for their great help and support.
Help provided by Mr Ruwan Dissanayake, particularly to establish the field experiment
is highly appreciated. Many thanks to Mr Mark Osbome and Mr Roger Levey at PTC,
and Mr Philip Yalden of HortResearch, Aokautere for technical support in the field
experiments. Thanks to Mr Matt Alexander for providing help in word processing.
I would like to thank the Margot Forde Gennplasm Centre, AgResearch Grasslands,
Palmerston North for providing seeds of the pasture species, and Alan Stewart, Pyne
Gould Guiness Ltd. for providing seeds of cocksfoot PG lines, and also the related
infonnation.
I am grateful to the New Zealand Official Development Assistance (NZODA) of the
Ministry of Foreign Affairs and Trade for the scholarship that allowed me to pursue my
PhD study at Massey University. The moral support and encouragement provided by the
staff from International Students' office have been tremendous value in completing this

xii
study. I would also like to acknowledge the administrative authority, Tribhuvan
University, IAAS central campus Rampur, Nepal for granting me the study leave.
Many thanks and gratitude for the support and friendship provided by the staff of the
Pasture and Crops group, Massey University. Thanks to Dr Cory Matthew, for
providing valuable input during the research. I enjoyed help provided by Mrs Hera
Kennedy and all those post graduate students on level 2 that enabled me to successfully
complete my study. I would like to acknowledge the help provided by Tara Pande,
Aurelio Guevara, Andrew Wall, Wagner Beskow, Wendy Griffths, Mark Hyslop,
Philippa Nicholas, Passang Thinley, and others. Thank you for your friendship. I am
also grateful to Mrs Kathy Hamilton for her kind help at all times.
My immense appreciation goes to my wife, Durga Devkota for her tremendous support
while conducting glasshouse as well as field experiments. My thesis work would have
hardly come into this shape without her constant help in the field as well as in the lab
work. She is a huge source of inspiration and courage who helped me all the way in the
study as well as being my best friend. Thank you very much Durga. It is equally my
pleasure to acknowledge our son Pramukh for his great understanding, patience and
help to make my study successful. Our lovely daughter Pratibha who arrived in the
middle of my thesis work to join in the family, this was a wonderful and added
happiness to our home. I love you very much Pratibha. The support of all my relations
and friends in Nepal is gratefully acknowledged. Especially I am highly grateful to my
parents, uncle, grandmother, younger brothers Bharat and Jana, and sister Sakun for
their constant support, motivation and sacrifices while I am far away from the country.

TABLE OF CONTENTS
Abstra ct
Glossary and tenns of abbreviation used
A ckno wledgements
Table of Contents
List of Tables
List of Figures
List of Appendi ces
CHAPTER l
1 . General introduction and objectives
1. 1 Statement of the problem
1 .2 Broad objectives
1.3 Thesis organisation
CHAPTER 2
Literature revie w
CHAPTER 3
Screening pasture species for shade tolerance
CHAPTER 4
Perfonnance of perennial ryegrass and cocksfoot cultivars under glasshouse
xiii
Page
11
V
Xl
xiii
xiv
xxv
XXIX
1
1
3
4
5
7 1
conditions and alder shade 92
CHAPTERS
Effects of light intensity and quality on pasture species
CHAPTER 6
Effect of defoliation frequency on the perfonnance of Nui perennial ryegrass
and Wana cocksfoot under glasshouse conditions
CHAPTER 7
Perfonnance of pasture species under deciduous tree shade
CHAPTER S
Effect of tree shade on tissue turn over in perennial ryegrass/ white clover ,
Yorkshire fog/white clover and cocksfootl white clover pasture
CHAPTER 9
General dis cussion and conclusions
130
164
200
248
277

CHAPTER 2
Table 2.1
Table 2.2
CHAPTER 3
Table 3.1
Table 3.2
Table 3.3
CHAPTER 4
Table 4.1
Table 4.2
xiv
LIST OF TABLES
Page
Total photons ( 4 00-800 nm) and R:FR in nature .... . ...... ........... . .... 18
Characteristic differences between plants adapted or a cclimated
to sunny v. shady extremes in irradiance level ............... ............... 2 0
Pasture species and cultivars used in the experiment. ...... ........ .... .. 75
Effects of shade on pasture species tiller or branch numbers per
plant , their relative values (to that of 73% PAR), and leaf area
at final harvest under glasshouse conditions , 1996 ....... ........ ............ 82
Rank of pasture species for their shade tolerance on the basis of
relative tillerslbranches per plant (to that of 73% PAR),
and leaf area at 43% and 1 4% PAR at final harvest
under glasshouse conditions , 1996 . . . ... . .............. .................. .... 83
Pasture species and cultivars used in the Experiment 4.1.. .......... ... . . 98
Pasture species and cultivars used in the Experiment 4.2 . .............. . . 99

Table 4.3
Table 4.4
Table 4.5
Table 4.6
Table 4.7
Table 4.8
Table 4.9
Table 4.10
Effect s of level of tran smitted PAR on cumulative shoot
dry weight (g/plant) of cocksfoot selection s and perennial
xv
ryegra ss in glasshou se condition s, 1997 .................................... 103
Effect s of shade (different level s of PAR) on tiller s per plant
of cock sfoot selection s and perennial rye gra ss under
gla sshou se condition s, 1997 .................................................. 1 06
Effect s of shade (different level s of PAR) on per plant leaf
area (mm2 x100), leaf dry weight (mg), specific leaf area
(mm2/mg), and leaf stem ratio of cocksfoot selection s
and perennial ryegra ss under gla sshou se condition s
at final harve st , 1997 ......................................................... 107
Eigenvalue s and the proportion of variation a ccounted for by the
canonical variate analy si s under different PAR level s ................... 1 09
Information about pooled within canoni cal structure ,
and pooled within cla ss standardi zed coeffi cient s as
influenced by different PAR level s .... ........ ........................... ... 110
Light environment and shade level s of Experiment 4.2 .................. 114
Effect s of level of tran smitted PAR on cumulative shoot
dry weight (glplant) of cock sfoot selection s and perennial ryegra ss
under alder trees, 1997 ......................................................... 115
Effect s of level of tran smitted PAR on tiller s per plant
of cock s foot selection s and perennial ryegra ss at final harve st ,
under alder tree s, 1997 ......................................................... 116

xvi
Table 4.11 Effects of shade on leaf area per p lant (rnm2), leaf dry wei ght
(m g), specific leaf area ( S LA) (rnm2/m g), and root dry wei ght
(m g) per p lant of cocksfoot selections and perennial rye grass
under a lder trees , 1997 . . . . . . . . . . . . . . . . . . . . . . . . . . . . . . . . . . . . . . . . . . . . . . . . . . . . . .... 118
Table 4.12 Su mmary table of canonical variate analysis ( CV A)
CHAPTERS
Table 5.1
Table 5 .2
Table 5 .3
Table 5.4
Table 5 .5
Table 5.6
on glasshouse experiment. .. .............. ............... .................... 123
Pasture species and cultivars used in the Experiment. . . . . . . . . . . . . . . . . . . . . 136
Effect of level of PAR and R:FR on shoot dry weight ( g/plant)
of grass and le gume species at fina l harvest in
g lasshouse conditions , 1997 . . . . . . . . . . . . . . . . . . . . . . . . . . . . . . . . . . . . . . . . . . . . . . . . . 138
Effect of level of PAR and R:FR on leaf area (rnm2/p lant)
of grass and le gume species at fina l harvest in
glasshouse conditions , 1997 . . . . . . . . . . . . . . . . . .. . . . . . . . . . . . . . . . . . . . . . . . . . . . . . . 14 0
Effect of level of PAR and R:FR on leaf dry wei ght (m g/plant)
of grass and le gume species at fina l harvest in
glasshouse conditions , 199 7 . . . . . . . . . . . . . . . . . . . . . . . . . . . . . . . . . . . . . . . . . . . . . . . . . 1 4 0
Effect of level of PAR and R:FR on stem dry weight ( g/plant)
of grass and le gume species at final harvest in
glasshouse conditions , 1997 . . . . . . . . . . . . . . . . . . . . . . . . . . . . . . . . . . . . . . . . . . . . . . . . . 141
Effect of level of PAR a nd R:FR on lo� total tillers or
stolonslbranches per pla nt of grass and le gume species
at final harvest in glasshouse conditions , 199 7 . Values in
parentheses are back transformed . . . " ..... ................... .... ... .. . ... 142

Table 5 .7 Effect of level of PAR and R:FR on lo� net tillers or
stolonslbranches per plant of grass and legume species
developed in the shade at final harvest in glasshouse conditions,
xvii
1997. Values in parentheses are back transformed . . . . . . . . . . . . . . . . . . . . . . . . 143
Table 5 .8
Table 5 .9
Effect of level of PAR and R:FR on tiller weight per plant
(mg) of grass species at final harvest in
glasshouse conditions, 1997 . . . . . . . . . . . . . . . . . . . . . . . . . . . . . . . . . . . . . . . . . . . . . . . . . 1 4 4
Effect of level of PAR and R:FR o n total number of leaves per
plant of grass and legume species at final
harvest in glasshouse conditions, 1997 . . . . . . . . . . . . . . . . . . . . . . . . . . . . . . . . . . . . 145
Table 5 .1 0 Effect of level of PAR and R:FR on specific leaf area (mm2/mg)
of hill grass and legume species at final harvest in
glasshouse conditions, 1997 .. . .. .. .. . .. . . .. . .. . . . . . . . . . . . . . . . . . . . . . . . . . .. . .. 146
Table 5 .11 Effect of level of PAR and R:FR on leaf: stem ratio of grass
and legume species at final harvest in glasshouse
conditions, 1997 . . . . . . . . . . . . . . . . . . . . . . . . . . . . . . . . . . . . . . . . . . . . . . . . . . . . . . . . . . . . . . . . 14 7
Table 5 .12 Effect of level of PAR and R:FR on root dry weight (glplant)
of grass and legume species at final harvest in
glasshouse conditions, 1997 . . . . . . . . . . . . . . . . . . . . . . . . . . . . . . . . . . . . . . . . . . . . . . . . . . 148
Table 5 .13 Effect of level of PAR and R:FR on chlorophyll 'a' concentration
(mg/g) of grass and legume species in glasshouse
conditions, 1997 . . . . . . . . . . . . . . . . . . . . . . . . . . . . . . . . . . . . . . . . . . . . . . . . . . . . .. . . . . . . . . . . 149
Table 5 .14 Effect of level of PAR and R:FR on chlorophyll 'b ' concentration
(mg/g) of grass and legume species in glasshouse
conditions, 1997 . . . . . . . . . . . . . . . . . . . . . . . . . . . . . . . . . . . . . . . . . . . . . . . . . . . . . . . . . . . . . . . . 15 0

Table 5 .15 Effect of level of PAR and R:FR on chlorophyll a: b ratio
of grass and legume species in glasshouse
xviii
conditions, 1997 . . . . . . . . . . . . . .. . . . . . . . . . . . . . . . . . . . . . . . . . . . . . . . . . . . . . . . . . . . . . . . . . . 151
Table 5 .16 Summary table of the parameters measured: mean values
CHAPTER 6
Table 6.1
Table 6.2
Table 6.3
Table 6.4
Table 6.5
Table 6.6
of the PAR and R:FR and the differences . . . . . .. . . .. ... . . .. . . . . .. . . . .. . .. . . 153
Pasture species and cultivars used in the Experiment . ... . . . . . .. .. . . . , .. .. 171
Light environment and shade levels used in Experiment 6.1 .. . . . .. . . . . . 174
Above ground mass for Grasslands Nui perennial ryegrass and
Grasslands Wana cocks foot under different PAR
and R:FR levels .... . .. . . ... .. .... ... .. .. . . ....... . ... . ... ... . .. . ... ... ... . . ... 175
Below ground mass for Grasslands Nui perennial ryegrass and
Grasslands Wana cocks foot under different PAR
and R:FR levels . . . . . . . . . . . . . .... . . . . . . . . . . .. .. . . . .. . . . . .. . . . .. . . . . . . . . . . . ... . . . 176
Light environment and shade levels used in Experiment 6.2 . . . .. . .. . . .. 178
Effects of level of transmitted photosynthetically active radiation
(PAR) and Red to Far red (R:FR) ratio: 71 % PAR+natural R:FR,
1 .36 (HIN); 25%PAR + natural R:FR, 1 .34 (UN), and 24%
PAR + reduced R:FR, 0 .68 (UR) under weekly (Wl) and three
weekly (W3) defoliation frequencies on the cumulative herbage dry
mass (g/plant; In transformed) of cocks foot ( Grasslands Wana)
and perennial ryegrass ( Grasslands Nui) at final harvest in
glasshouse conditions , 1998 . .. ... ... ... . .. ..... . .... .. ...... ........ .. . .... 179

Table 6.7
Table 6.8
Table 6.9
Effects of level of transmitted photosynthetically active radiation
(PAR) and Red to Far red (R:FR) ratio: 71 % PAR+natural R:FR,
1.36 (HIN); 25%P AR + natural R:FR, 1.34 (UN), and 24%
PAR + reduced R:FR, 0.68 (UR) under weekly (Wl) and three
weekly (W3) defoliation frequencies on the % relative dry
mass/plant (compared to that of 71 % PAR + natural R:FR, 1.36) of
cocksfoot (Grasslands Wana) and perennial ryegrass
(Grasslands Nui) at final harvest in glasshouse
xix
conditions, 1998 . . . . . . . . . . . . . . . . . . . . . . . . . . . . . . . . . . . . . . . . . . . . . . . . . . . . . . . . . . . . . . . . 180
Effects of level of transmitted photosynthetically active
radiation (PAR) and Red to Far red (R:FR) ratio: 71 % PAR+
natural R:FR, 1.36 (HIN); 25%P AR + natural R:FR, 1.34
(lJN), and 24% PAR + reduced R:FR, 0.68 (UR) under weekly
(Wl) and three weekly (W3) defoliation frequencies on the
leaf area (mrn2/plant) of cocksfoot (Grasslands Wana) and
perennial ryegrass (Grasslands Nui) at final harvest in
glasshouse conditions, 1998 ................................................ 181
Effects of level of transmitted photosynthetically active radiation
(PAR) and Red to Far red (R:FR) ratio: 71 % PAR+natural R:FR,
1.36 (HIN); 25%P AR + natural R:FR, 1.34 (UN), and 24%
PAR + reduced R:FR, 0.68 (UR) under weekly (Wl) and three
weekly (W3) defoliation frequencies on the leaf dry weight (glplant)
of cocks foot (Grasslands Wana) and perennial ryegrass
(Grasslands Nui) at final harvest in glasshouse
conditions, 1998 ................................................................ 182

Table 6.10 Effects of level of transmitted photosynthetically active radiation
(PAR) and Red to Far red (R:FR) ratio: 71 % PAR+natural R:FR,
1.36 (HIN); 25%P AR + natural R:FR, 1.34 (UN), and 24%
PAR + reduced R:FR, 0.68 (UR) under weekly (W1) and three
weekly (W3) defoliation frequencies on the number of tillers/plant
of cocksfoot (Grasslands Wana) and perennial ryegrass
(Grasslands Nui) at final harvest in glasshouse
xx
conditions, 1998 . . . . . . . . . . . . . . . . . . . . . . . . . . . . . . . . . . . . . . . . . . . . . . . . . . . . . . . . . . . . . . . . 185
Table 6.11 Effects of level of transmitted photosynthetic ally active radiation
(PAR) and Red to Far red (R:FR) ratio: 71 % PAR+natural R:FR,
1.36 (HIN); 25%PAR + natural R:FR, 1.34 (UN), and 24% PAR
+ reduced R:FR, 0.68 (LiR) under weekly (W1) and three weekly
(W3) defoliation frequencies on root dry weight
(g/plant; In transformed) of cocksfoot (Grasslands Wana)
and perennial ryegrass (Grasslands Nui) at final harvest
in glasshouse conditions, 1998 .............. , .............................. 186
Table 6.12 Effects of level of transmitted photosynthetically active radiation
(PAR), and Red to Far red (R:FR) ratio under different
defoliation frequencies on the leaf appearance interval (in days)
of cocks foot (Grasslands Wana) and perennial ryegrass
CHAPTER 7
Table 7.1
Table 7.2
(Grasslands Nui) in glasshouse conditions, 1998 ......................... 189
Soil nutrient levels at Aokautere site, sampled to 75mm depth before
and at the end of the experiment. ............................................ 210
Pasture species and cultivars used in the Experiment 7.1. ............. 210
Table 7.3a Levels of transmitted PAR (photosynthetic ally active radiation),
and R:FR (red:far-red) ratios measured at various occasions under
xxi
tree canopies at Aokautere, February to April 1997 ..................... 212
Table 7.3b Levels of transmitted PAR (photosynthetic ally active
radiation) measured at various occasions under tree
canopies at Aokautere, November 1997 to May 1998 .................. 213
Table 7.3c R:FR (red:far-red) ratios measured at various occasions under
tree canopies with different shade levels at Aokautere, November
1997 to May 1998 ............................................................. 214
Table 7.4a Changes in % soil moisture to 200mm depth under different levels
of shade at Aokautere during February to May 1997 ............... '" ... 215
Table 7.4b Changes in % soil moisture to 200mm depth under different
levels of shade at Aokautere during October 1997 to
May 1998 . . . . . . . . . . . . . . . . . . . . . . . . . . . . . . . . . . . . . . . . . . . . . . . . . . . . . . . . . . . . . . . . . . . . . . 216
Table 7.5a Soil temperature at l 00mm depth under different levels of
shade at Aokautere from February to May 1997 .......................... 217
Table 7.5b Soil temperature at l 00mm depth under different levels of
shade at Aokautere from October 1997 to May 1998 ..................... 218
Table 7.6 Pre-mowing herbage mass (HM) (glm2) for March and
April 1997 under different levels of shade at Aokautere ................. 219
Table 7.7 Pre-mowing herbage mass (HM) (glm2) for November 1997
to May 1998 under different levels of shade at Aokautere . . . . . . . . . . . ... 220

Table 7.8 Herbage harvested above 50mm (re-growth)(glm2) at each month,
and total herbage harvested (glm2) over all months (October 28,1997
to May 28, 1998) (212 days) under different levels of shade
xxii
at Aokautere ..................................................................... 223
Table 7.9a Tiller density (numbers/m2) of the grass component in
grass-legume mixtures under three levels of tree shade at Aokautere
from November 1997 to February1998 .................................... 227
Table 7.9b Tiller density (numbers/m2) of the grass component in
grass-legume mixtures under three levels of tree shade at Aokautere
from March to May 1998 .................................................... 228
Table 7.10a Density of growing points or branches (number/m2) for white clover
and lotus in grass-legume mixtures under different levels of tree shade
at Aokautere from 24 November 1997 to 21 February 1998
(* In transformed, and value inside the parentheses are back
transformed) ................................................................... 230
Table 7.10b Density of growing points or branches (number/m2) for white clover
and lotus in grass-legume mixtures under different levels of tree shade
at Aokautere from 20 March to 20 May 1998 .............................. 231
Table 7.11 Total number of sheep grazing, total number of observations of
sheep grazing, grazed tillers and growing points/branches of
marked legumes, and the ratio of grazed tillers to legumes for
Yorkshire fog with white clover, cocksfoot with white clover
and cocksfoot with lotus components of pastures grown under
alder trees, at Aokautere, November 1998 ................................. 233

xxiii
CHAPTERS
Table 8.1
Table 8.2
Table 8.3
Table 8.4
Table 8.5
Pasture species and cultivars used in the Experiments ........ ... . ....... 254
Rates of net leaf expansion per tiller (mg/tiller/day) and net
leaf production (g/m2/day) of the grass components of ryegrass
white clover (RW), Yorkshire fog-white clover (YW), cocksfoot
white clover (CW) and cocksfoot-Iotus (CL) swards under
different levels of shade at Aokautere, 1997 ............................... 259
Rates of net production (stem+leaf) per tiller (mg/tiller/day) and
per unit area (g/m2 /day) of the grass components of ryegrass-white
clover (RW), Yorkshire fog-white clover (YW), cocksfoot-white
clover (CW) and cocksfoot-Iotus (CL) swards under different levels
of shade at Aokautere, 1997 ................................. ................. 261
Rates of net dry weight accumulation (net stolon+net petiole+net
leaf) per growing point (mg/growing point/day), and per unit
area (g/m2/day) of the white clover component of ryegrass-white
clover (RW), Yorkshire fog-white clover (YW), and cocks foot
white clover (CW) swards under different levels of shade at
Aokautere, 1997 ................................................................ 263
Rates of net leaf expansion per tiller (mg/tiller/day) and net
leaf production (g/m2/day) of the grass components of ryegrass
white clover (RW), Yorkshire fog-white clover (YW), cocksfoot
white clover (CW) and cocksfoot-Iotus (CL) swards under
different levels of shade at Aokautere, 1998 ............................... 265

Table 8.6
Table 8.7
Rates of net production (stem+leaf) per tiller (mg/tiller/day) and
per unit area (g/m2 /day) of the grass components of ryegrass-white
clover (RW), Yorkshire fog-white clover (YW), cocksfoot-white
clover (CW), and cocksfoot-Iotus (CL) swards under different levels
xxiv
of shade at Aokautere, 1998 .................................................. 267
Rates of net dry weight accumulation (net stolon+net petiole+net
leaf) per growing point (mg/growing point/day), and per unit
area (g/m2/day) of the white clover component of ryegrass-white
clover (RW), Yorkshire fog-white clover (YW), and cocks foot
white clover (CW) swards under different levels of shade at
Aokautere, 1998 ................................................................ 269
CHAPTER 9
Table 9.1
Table 9.2
Table 9.3
Summary of properties of cocksfoot and perennial ryegrass as
determined under heavy shade in a series of
experiments. . . . . . . . . . . . . . . . . . . . . . . . . . . . . . . . . . . . . . . . . . . . . . . . . . . . . . . . . . . . . . . . . . . 282
Tolerance index of perennial ryegrass and cocks foot as indicated
by cumulative shoot dry weight/plant at different PAR
levels . . . . . . . . . . . . . . . . . . . . . . . . . . . . . . . . . . . . . . . . . . . . . . . . . . . . . . . . . . . . . . . . . . . . . . . . . . . 283
Tolerance index of perennial ryegrass and cocksfoot as indicated by
tiller numbers/plant at different PAR levels ............................... 284

xxv
LIST OF FIGURES
Page
CHAPTER 3
Figure 3.1 Effects of different levels of % PAR transmitted on shoot
dry weight of (a) legumes, (b) hill grass species, and (c) other
species. Standard error of the mean (SEM) for species = 2.06 ............ 77
Figure 3.2 Effects of different levels of % PAR transmitted on relative
(to that of 73% PAR transmitted) shoot dry weight of
Figure 3.3
(a) legumes, (b) hill grass species, and (c) other species.
(b) Standard error of the mean (SEM) for species = 0.3 .................. 78
Specific leaf area (m2/kg) of (a) legumes, (b) hill grass species,
and (c) other species by repeated analysis. Vertical bar
represents standard error of the mean for species (0.29) .................. 80
Figure 3.4 Performance of (a) cocksfoot and (b) perennial ryegrass at
different PAR levels . . . . . . . . . . . . . . . . . . . . . . . . . . . . . . . . . . . . . . . . . . . . . . . . . . . . . . . . . . . . 85
CHAPTER 4
Figure 4.1 Linear regression between dry weight and specific leaf area
(SLA) for the cocksfoot selections and perennial ryegrass
(Grasslands Nui) under different levels of shade . . . . . . . . . . . . . . . . . . . . . . . . . 104
Figure 4.2 Linear relationship between SLA at low and high PAR for ten
cocksfoot selections and perennial ryegrass . . . . . . . . . . . . . . . . . . . . . . . . . . . . . . . 108

Figure 4.3 Plot of mean canonical variate scores (CAN 1 *CAN2) using leaf
area, leaf dry weight, SLA, leaf:stem, and final tillers as variables;
xxvi
(a) 73% PAR, and (b) 32% PAR ............................................ 112
Figure 4.4 Plot of mean canonical variate scores (CAN 1 *CAN2) using leaf
area, leaf dry weight, SLA, leaf:stem, and final tillers as variables;
CHAPTER 6
Figure 6.1
Figure 6.2
Figure 6.3
Figure 6.4
(c) 24% PAR, and (d) all PAR levels ....................................... 113
Experimental set-up showing one replication: 24% PAR plus
reduced R:FR with the use of filters, and 25% PAR plus natural
R:FR without filters......................................................... 172
RGR of Wana and Nui grown under varied PAR levels and
R:FR (P<O.OI) for PAR as well as species with NS for interaction
of P ARxspecies. SEM of PAR and of species ±O.OO 1 ................... 177
Specific leaf area (SLA) of Nui and Wana at different levels of
PAR under two defoliation regimes ofWl and W3. Vertical
bar represents standard error of the mean (SEM) for P ARIR:FR.
SEM for species and defoliation were 1.23 and 1.24,
respectively . . . . . . . . . . . . . . . . . . . . . . . . . . . . . . . . . . . . . . . . . . . . . . . . . . . . . . . . . . . . . . . . . . . . . 184
Site usage (tillers/leaf) of Nui and Wana under different PAR,
R:FR and defoliation frequency: (a) cycle I (8 June-28 June), (b)
Cycle IT (29 June-19 July), (c) cycle ITI (20 July-9 August), and
(d) cycle IV (for the whole period of 8 June-9 August, 1998).
Where, 24% PAR was with low R:FR, and 25% and 71 % PAR
were with natural R:FR light. ............................................... 187

Figure 6.5
CHAPTER 7
Figure 7.1
Figure 7.2
Figure 7.3
Figure 7.4
Figure 7.5
Figure 7.6
Figure 7.7
Effects of defoliation at weekly and three-weekly interval for
Wana cocksfoot and Nui perennial ryegrass (a) under 71 %
PAR, natural R:FR, and (b) 24% PAR with reduced R:FR
xxvii
by using filters. Wana in background .......... ..... ....... ................ 193
Monthly total global radiation (MJ/m2/s) during the experiment
period. Data from the nearest Meteorological Station
(AgResearch, Palmerston North) .......................................... . 206
Monthly total rainfall distribution (mm) during the experiment
period. Data from the nearest Meteorological Station
(AgResearch, Palmerston North) .............. ............... .... . .......... 207
Field preparation to establish pasture under alder trees at
Aokautere, September 1996 ................................................. 209
Establishment of experimental plots under light, medium and
heavy shade from front to back, respectively, at Aokautere,
February 1997 .................................................................. 213
Percent mean grass composition of three shade levels on different
grass-legumes combinations over selected months ....................... 224
Percent mean legume composition of three shade levels on different
grass-legume combinations over selected months ...... .................. 225
Percent mean other materials composition of three shade levels on
different grass-legume combinations over selected months ............. 226

xxviii
Figure 7.8 Sheep grazing under light shade . . . . . . . . . . . . . . . . . . . . . . . . . . . . . . . . . . . . . . . . . . .. 232
CHAPTER 9
Figure 9.1 Mechanism of leaf arealSLA maintenance of tillering
and shoot dry weight for shade tolerant grass species ................... 293

xxix
LIST OF APPENDICES
Page
Appendix 3.1 Effects of shade on pasture species tiller or branch number
per plant, and their relative values (to that of 73% ambient PAR)
at different harvest dates under glasshouse conditions, 1996 ............ 311
Appendix 3.2 Effects of shade on mean specific leaf area (SLA, m2/kg) of
the pasture species, and their relative values (to that of 73%
ambient PAR) at different harvest dates under glasshouse
conditions, 1996 ............................................................... 312
Appendix 3.3 Effects of shade on mean plant height (cm) of the pasture
species at different harvest dates under glasshouse conditions,
1996 ........................... '" ............................................... 313
Appendix 3.4 Effects of shade on mean leaf/petiole length (cm) of the pasture
species at different harvest dates under glasshouse conditions,
1996 ............................................................................. 314
Appendix 7.1 a Percent mean botanical composition under different levels of
shade at Aokautere, 25 March 1997 to 24 November 1997 ............ 315
Appendix 7.1 b Percent mean botanical composition under different levels of
shade at Aokautere, 23 December 1997 to 28 May 1998 ............... 316
Appendix Figure 7.1 Lay out of the field experiment. RW= perennial
ryegrass with white clover, YW=Yorkshire fog with white
clover, CW= cocksfoot with white clover, and
CL: cocksfoot with lotus ... ...... ........... ................................ .317

1. General Introduction and Objectives
1.1 Statement of the problem
1
Silvo-pastoral systems involve the use of timber or fodder trees with an understorey of
pasture or range lands. The trees in silvo-pastoral systems also provide microclimate
modification and soil protection or improvement (Gordon et al. 1997). Silvo-pastoral
systems are a means of diversification and developing sustainable agricultural systems.
An increase in tree cover would help to achieve more sustainable management systems
on many New Zealand farms (Thorrold et al. 1997). It is estimated that about 3.7
million ha or 33% of the North Island requires significant soil conservation measures in
order to be able to physically sustain pastoral land use (Wall et al. 1997). Broad-leaved
deciduous trees are preferred for silvo-pastoral systems due to their excellent root
development (Hicks 1995; Guevara et al. 1997) that helps preserve or improve land
quality, and due to their better understorey pasture production than under evergreen
trees (Hawke and Knowles 1997).
In New Zealand most silvo-pastoral research has been conducted under agroforestry
systems using Pinus radiata (Pollock et al. 1997; Wall et al. 1997; Hawke and Knowles
1997; Power et al. 1998) with little research involving the use of alternative tree species
(Power et al. 1998). Studies on Pinus radiata indicated that understorey herbage yield
decreases linearly as crown density increased (Anderson and Batini 1983; Pollock et al.
1994; Hawke and Knowles 1997). This same relationship does not appear to apply to
broad-leaved deciduous trees. Also, the productivity of the pasture understorey is
influenced by the species of the tree (Atta-Khrah 1993). Competitive interactions
between broad-leaved deciduous trees and the understorey hill pastures include changes
in microclimate, soil and water resources (Wall et al. 1997), but the impact of shading
by broad-leaved deciduous trees on the productivity and persistence of hill pasture
species has received little research attention (Hawke 1991; Knowles 1991; Pollock et al.
1994).

2
The development of a whole-farm package for the integration and management of
deciduous tree based silvo-pastoral systems should be the objective of research in this
area (Wall et al. 1997). An increased understanding of the competitive interactions
between tree species and the pastures will be required for the development of
appropriate management systems (Shelton et al. 1987; Wall et al. 1997). If land is to
remain under sustainable pastoral use, a compatible mixture of pasture and trees needs
to be identified (Clough and Hicks 1993).
This thesis is focused on determining which hill pasture species are the most productive
and persistent under deciduous tree shade. The approach is to examine the growth of
hill pasture species under a range of light intensities in the glasshouse and the field. The
effects of light quality and defoliation on pasture species growing in shade are also
examined. Finally, the preference for pasture species of sheep grazing under tree shade
is evaluated.

3
1.2 Broad objectives
The main objectives of the nine experiments reported in this thesis were to:
(a) Screen hill pasture species for their growth and morphological responses to levels of
shade.
(b) Evaluate the effect of the light intensity and quality, and selected defoliation
regimes on the growth and re-growth of pastures species.
(c) Identify shade tolerant pasture speCIes and understand their morphological
attributes.
(d) Evaluate grazing preference of sheep for selected pasture species in a deciduous
silvo-pastoral system.

4
1 .3 Thesis organisation
This thesis is divided into nine chapters. Following the introductory chapter, current
knowledge on growth of understorey pasture is reviewed in Chapter 2, mainly in terms
of morphological attributes of pasture species with respect to effects of light, fertility
and defoliation. Chapter 3 presents research on the screening of pasture species for
shade tolerance at a range of light intensities. Available cocksfoot selections were
compared with perennial rye grass under different light intensities in a glasshouse and
under tree shade in field conditions and the results are presented in Chapter 4. Chapter
5 describes the effects of intensity and quality of light on the commonly available
pasture species used in Chapter 3 in terms of shoot dry weight, tillering and other
morphological attributes. Chapter 6 presents the relative growth rate and also the
effects of defoliation frequencies on selected heavy shade tolerant and intolerant pasture
species. Chapters 7 and 8 present results of field experiments with selected grass and
legume species carried out under three levels of alder tree shade created by pruning
trees to different heights. In Chapter 7 cocksfoot, Yorkshire fog, and perennial ryegrass
were compared in mixtures with white clover, and for cocksfoot also with lotus. At the
end of the field experiment, diet selection by sheep was studied and presented in this
Chapter. Chapter 8 examines the effects of tree shade on tissue turnover in perennial
rye grass/white clover, Yorkshire fog/white clover and cocksfootlwhite clover pasture.
The research site described in Chapter 4 (Experiment 4.2), Chapter 7, and Chapter 8
was the same one. General discussion, conclusions and research needs in relation to the
shade tolerance attributes of pasture species are presented in Chapter 9.
Chapters 3-8 are presented as scientific papers but in thesis format. Except for Chapter
1 , in which references are merged into the references of Chapter 2, the references
related to individual chapters are included at the end of each Chapter. A Table of
contents for all Chapters except Chapter 1 is presented at the beginning of each Chapter.
Information about screening shade tolerant pasture species (Chapter 3) other than that
included in the main text is presented in Appendix Tables 3. 1 -3.4. Appendix Tables
7. 1 a and b cover information on botanical composition as described in Chapter 7.
Chapter 3, and part of Chapter 4 (Experiment 4.2) have been published in Proceedings
Agronomy Society of New Zealand, Volumes 27 and 28, respectively.

5
2. Literature review
Page
2.1 INTRODUCTION .............. ........ ... ...................... . . ........................................ ........... 7
2.2 AGROFORESTRY SYSTEMS ............................... ........................................... . ... 8
2.2. 1 Definition of agroforestry . . . . . . . . . . . . . . . . . . . . . . . . . . . . . . . . . . . . . . . . . . . . . . . . . . . . . . . . . . . . . . . . . . . . . . . . . . . . . . . . . . . . 8
2.2.2 Overview of silvo-pastoralism in New Zealand . . . . . . . . . . . . . . . . . . . . . . . . . . . . . . . . . . . . . . . . . . . . . . . . . 9
2.2.2. 1 Concept and current practices . . . . . . . . . . . . . . . . . . . . . . . . . . . . . . . . . . . . . . . . . . . . . . . . . . . . . . . . . . . . . . . . . . . . . . 9
2.2.3 Relationships between trees, pastures, and animal components . . . . . . . . . . . . . . . . . . . . . . 1 1
2.2.4 Tree pasture interactions . . . . . . . . . . . . . . . . . . . . . . . . . . . . . . . . . . . . . . . . . . . . . . . . . . . . . . . . . . . . . . . . . . . . . . . . . . . . . . . . . . . 1 3
2.3 PRODUCTION AND PERSISTENCE OF UNDERSTOREY PASTURE ..... 15
2.3 . 1 Pasture species and shade tolerance . . . . . . . . . . . . . . . . . . . . . . . . . . . . . . . . . . . . . . . . . . . . . . . . . . . . . . . . . . . . . . . . . 1 5
2.3 . 1 . 1 Intensity of light and pasture productivity . . . . . . . . . . . . . . . . . . . . . . . . . . . . . . . . . . . . . . . . . . . . . . . . . 1 7
2.3. 1 .2 Morphological adaptation of plants to shade (low light) . . . . . . . . . . . . . . . . . . . . . . . . . . 1 9
2.3. 1 .3 Persistency of pasture under shade . . . . . . . . . . . . . . . . . . . . . . . . . . . . . . . . . . . . . . . . . . . . . . . . . . . . . . . . . . . . 2 1
2.3. 1 .4 Light quality i n relation to survival and persistency of shaded plants . . . . . . . 2 1
2.3. 1 .5 Factors affecting persistence of pasture under shade . . . . . . . . . . . . . . . . . . . . . . . . . . . . . . . . 23
2.3. 1 .6 Positive effects of shade on the understorey pastures . . . . . . . . . . . . . . . . . . . . . . . . . . . . . . . . 24
2.3 . 1 . 7 Negative effects of shade on understorey pastures . . . . . . . . . . . . . . . . . . . . . . . . . . . . . . . . . . . . 25
2.3 . 1 .8 Pruning of trees in relation to pasture production . . . . . . . . . . . . . . . . . . . . . . . . . . . . . . . . . . . . . 26
2.3.2 Fertilizer . . . . . . . . . . . . . . . . . . . . . . . . . . . . . . . . . . . . . . . . . . . . . . . . . . . . . . . . . . . . . . . . . . . . . . . . . . . . . . . . . . . . . . . . . . . . . . . . . . . . . . . . . . . 27
2.3.2. 1 Fertilizer responses of pasture species . . . . . . . . . . . . . . . . . . . . . . . . . . . . . . . . . . . . . . . . . . . . . . . . . . . . . . . 28

6
Page
2.3.3 Defoliation . . . . . . . . . . . . . . . . . . . . . . . . . . . . . . . . . . . . . . . . . . . . . . . . . . . . . . . . . . . . . . . . . . . . . . . . . . . . . . . . . . . . . . . . . . . . . . . . . . . . . . . . 28
2.3.3. 1 Defoliation responses of pasture species . . . . . . . . . . . . . . . . . . . . . . . . . . . . . . . . . . . . . . . . . . . . . . . . . . . . 28
2.3.3.2 Defoliation and its effects on production . . . . . . . . . . . . . . . . . . . . . . . . . . . . . . . . . . . . . . . . . . . . . . . . . . . 29
2.3 .3.3 Physiological changes in plants due to defoliation . . . . . . .. . . . . . . . . . . . . . . . . . . . . . . . . . . . . 29
2.3.3.4 Defoliation and re growth . . . . . . . . . . . . . . . . . . . . . . . . . . . . . . . . . . . . . . . . . . . . . . . . . . . . . . . . . . . . . . . . . . . . . . . . . . . 30
2.4 BRIEF INTRODUCTION TO PASTURE SPECIES
USED IN THE THESIS ....................................................................................... 31
2.4. 1 Grasses . . . . . . . . . . . . . . . . . . . . . . . . . . . . . . . . . . . . . . . . . . . . . . . . . . . . . . . . . . . . . . . . . . . . . . . . . . . . . . . . . . . . . . . . . . . . . . . . . . . . . . . . . . . . . . 3 1
2.4. 1 . 1 Dactylis glomerata L. (Cocksfoot) ..... ........................... ....... . . .. . . ..... . ......... 3 1
2.4. 1 .2 Lolium perenne L. (Perennial ryegrass) . . . . . . . . . . . . . . . . . . . . . . . . . . . . . . . . . . . . . . . . . . . . . . . . . . . . . 3 1
2.4. 1 . 3 Poa trivialis L. ( Poa trivialis) . . . . . . . . . . . . . . . . . . . . . . . . . . . . . . . . . . . . . . . . . . . . . . . . . . . . . . . . . . . . . . . . . . . 32
2.4. 1 .4 Holcus lanatus L. (Yorkshire fog) . . . . . . . . . . . . . . . . . . . . . . . . . . . . . . . . . . . . . . . . . . . . . . . . . . . . . . . . . . . . . 33
2.4. 1 .5 Agrostis capillaris, syn. A. tenuis Sibth. (Browntop) . . . . . . . . . . . . . . . . . . . . . . . . . . . . . . 33
2.4. 1 .6 F estuca arundinacea Schreb. (Tall Fescue ) . . . . . . . .. . . . . . . . . . . . . . . . . .. . . . . . . . . . . . . .. . . . . . . 33
2.4.2 Herbs . . . . . . . . . . . . . . . . . . . . . . . . . . . . . . . . . . . . . . . . . . . . . . . . . . . . . . . . . . . . . . . . . . . . . . . . . . . . . . . . . . . . . . . . . . . . . . . . . . . . . . . . . . . . . . . . . 34
2.4.2. 1 Plantago lanceolata L. (Plantain) . . . . . . . . . . . . . . . . . . . . . .. . . . . . . . . . . . . . . . . . . . . . . . . . . . . . . . . . . . . . . . 34
2.4.3 I...egumes . . . . . . . . . . . . . . . . . . . . . . . . . . . . . . . . . . . . . . . . . . . . . . . . . . . . . . . . . . . . . . . . . . . . . . . . . . . . . . . . . . . . . . . . . . . . . . . . . . . . . . . . . . . . 35
2.4.3. 1 Trifolium repens L. (White clover) . . . . . . . . . . . . . . . . . . . . . . . . . . . . . . . . . . . . . . . . . . . . . . . . . . . . . . . . . . . . 35
2.4.3.2 Trifolium subterraneum L. (Subterranean clover) . . . . . . . . . . . . . . . . . . . . . . . . . . . . . . . . . . . . . 35
2.4.3.3 Lotus pedunculatus Cav. (Lotus) . . . . . . . . . . . . . . . . . . . . . . . . . . . . . . . . . . . . . . . . . . . . . . . . . . . . . . . . . . . . . . . 36
2.5 CONCLUSIONS ....................................................................... . . . ......................... 36
2.6 REFERENCES ....................................................................................................... 39

7
2.1 Introduction
The simultaneous increase in numbers of ruminant animals and the human population
has led to sharp competition between crops and animals, and has resulted in an
increasing demand for forage resources (Blair 199 1 ). Land management systems for
producing herbaceous plants along with woody perennials are the result of searching for
sound alternatives to grassland (Anderson 199 1 ; Connor 199 1 ; Bird et al. 1 995). These
systems have the potential to help check or reverse degradation of soil, forest, and
pasture resources (Young 1 989), and have a variety of other advantages, such as
provision of shelter and lowering of water tables (Anderson 1 99 1 ; McKenzie 1 996).
These systems are commonly termed agroforestry.
The interaction of trees, pastures and animals in agroforestry systems is complex (Bird
et al. 1 995), and there is a need for comprehensive knowledge about these components
and their interactions if they are to be managed in a sustainable way.
In this chapter, a definition of agroforestry in the broader sense, and silvo-pastoral
systems in the context of New Zealand are covered. The review also focuses on current
trends in agroforestry systems in New Zealand, with an emphasis on the role of broad
leaf trees in the silvo-pastoral system (section 2.2), together with the interrelationships
between trees, pasture and animal components.
The current knowledge on production and persistence of understorey pasture is reviewed
(Section 2.3) in relation to morphological adaptations and effects of light, fertilizer and
defoliation. The final section (2.4) reviews the pasture species that were used in the
thesis with emphasis on their characteristics, and their potential for growth in a shaded
environment.

8
2.2 Agroforestry systems
2.2.1 Def'mition of agroforestry
Agroforestry systems are described as the land use systems and technologies where
woody perennials are deliberately used on the same land management unit as
agricultural crops and/or animals, in either a spatial arrangement, or a temporal
sequence, there being both ecological and economic interactions between the different
components (Came and Prinsely 1 992). In this sense, agroforestry is the land-use
science which deals with the interactions between trees and crops, and of both with
animals in the same unit of land (Wood 1990). Agroforestry involves the coexistence of
trees with agriculture, both in time and space, and has been practised on an informal
basis ever since humans began to till the soil and herd animals (Churchill 1 993).
Agroforestry systems have been classified according to various criteria such as their
structure, function, socio-economic aspects and ecological spread. The primary
classification is on the basis of their structure. As Nair ( 1987) stated, this gives three
basic types: (a) agrosilvicultural, a combination of crops plus trees. (b) si/vo-pastoral,
which includes trees plus pasture/animals, and (c) agrosilvo-pastoral, which covers
crops, pasture/animals and trees. All these types of agroforestry systems are commonly
in practice (Nair 1987). Generally, the term agroforestry describes all three system types.
Agroforestry in New Zealand is, however, dominated by silvo-pastoralism (Hawke
1991 ).
Trees, as a component of pasture systems, can be seen from two perspectives. The first
involves the integration of pasture species (mainly grass and herbaceous legumes) into
tree crop plantations. Thus, pasture is introduced as an additional element into the tree
crop. The second perspective is where the tree is considered as an element of the pasture
(Atta-Krah 1993). In either case, it can be argued that the productivity of the understorey
is influenced by the species of the tree, as well as the tree population and canopy cover
(Atta-Krah 1 993). The tree can alter micro-climates and subsequently bring changes to
the environment (Costello et al. 1 996). Moreover, tree crops could play a role in

9
diversifying farm production, promoting soil stability and ameliorating the
microclimate, while maintaining an acceptable stock carrying capacity (Tustin et al.
1 979).
Research on agroforestry has increased since 1983, and a scientific framework for the
quantitative analysis of agroforestry systems is gradually developing (Ong 1996).
Agroforestry systems, which use trees in farming systems are in one sense ancient, but
in another, still at the stage of laying methodological foundations (Carruthers 1990).
2.2.2 Overview of silvo-pastoralism in New Zealand
2.2.2.1 Concept and current practices
The development of agroforestry in New Zealand commenced in the late 1960s, with
several co-operative studies involving the Ministry of Agriculture and Fisheries and the
Forest Research Institute (Hawke 1 99 1 ). Silvo-pastoral systems were first considered in
New Zealand in 1969, as a result of developments in plantation forestry, with 'direct
sawlog' regimes for radiata pine (Knowles 199 1 ). Broadleaved trees, however, have
been used (Thompson and Luckrnan 1993; Anonymous 1995; Wall et al. 1997) as an
important component in erosion prevention and control in New Zealand hill pastoral
systems since the beginning of the twentieth century (Miller et al. 1 996). Three distinct
types of agroforestry are being practised in New Zealand: (a) widely spaced trees
planted into permanent pastures, (b) grazing of forests under-sown with a leguminous
based sward, and (c) timber belts (Hawke 199 1 ).
The plantation forest estate in New Zealand covers more than 1 .2 million ha (4.4% of
the total land area), of which 88% is planted in Pinus radiata D. Don, commonly known
as Monterey or radiata pine (Knowles 1 99 1 ; Knowles et al. 1 99 1 ). Grazing in saw log
Pinus radiata plantation forests is common in New Zealand (Knowles 199 1 ), and many
such plantations have had a history of understorey grazing by cattle and sheep over the
last 20 years. Initially seen as a supplementary feed during winter or drought, grazing
has increasingly become accepted as a routine silvicultural tool (Knowles 199 1 ).

10
High or low density planting of trees by fanners has become a common land use
practice in recent years as a means of income diversification and/or erosion control
(Pollock et al. 1994). Planting widely spaced trees has led to the establishment of
several trials to evaluate the value of such silvo-pastoral systems (Yunusa et al. 1 995).
Forestry earnings have increased, with timber production predicted to reach 25 million
cubic metres by 201 5 (Pottinger 1993). Fann forestry in New Zealand is often more
profitable than farming or forestry alone (Knowles 1991).
There are several published reviews on agroforestry which provide an array of
information on tree-crop systems (Wolters 1982; Cameron et al. 1 989; Nair and Dagar
1 99 1 ; StUr and Shelton 1 99 1 ; Wilson and Ludlow 199 1 ; Bird et al. 1992; Atta-Krah
1 993 ; Ong 1996). However, very few studies have looked at overall pasture production
under tree plantations and in shelterbelts (Gregory 1995). Knowledge of interactions in
tree-pasture systems that may help to maintain sound and sustained pasture production
under trees is limited. Likewise, knowledge on the impact of land use changes from
pasture to exotic forest plantations on soil properties, fertility, and water quality is also
limited (Parfitt et al. 1997).
Most of the information in New Zealand is associated with Pinus radiata based systems
(Knowles et al. 1991). Studies on Pinus radiata indicated that understorey herbage yield
decreased as crown density increased (Anderson and Batini 1 983; Pollock et al. 1 994;
Hawke and Knowles 1997). Long-term research at Tikitere, New Zealand, about the
effect of Pinus radiata on pasture production also revealed an increased loss of pasture
production associated with increased density, age and slash of trees (Knowles et al.
1 995; Hawke and Knowles 1997).
Pasture production is also reduced under deciduous trees (Ditschal et al. 1997), but in
contrast to Pinus radiata plantations this can be improved by pruning trees, by
shortening rotations, and through coppice management (New 1 985). Pasture production
under deciduous tree is considerably higher than on equivalent spaced Pinus species
(Miller et al. 1996). Most importantly, deciduous trees have considerable potential for

1 1
use in agroforestry systems as they use growth resources for only part of the year, thus
reducing competition with pastures or crops (Newman 1 997). Moreover, deciduous trees
also provide pastoral farms with greater resilience to drought (Treeby 1978).
Soil erosion is common in New Zealand soils (Kelliher et al. 1995), mostly as a
consequence of forest clearing for agriculture (Trustrum and Blaschke 1 992). Besides
Pinus radiata, broadleaved tree species like poplars have been used in erosion control
(NZMF 1 995 ; Maclaren 1 993). Studies on broadleaved trees, (e.g. poplars) revealed
that they increased soil organic matter and nutrient status of the soil as well as helping to
increase the population of earthworms (Bowersox and Ward 1977; Jaswal et al. 1993;
Thevathasan and Gordon 1 997). There is little detailed information associated with the
role of deciduous trees in understorey pasture production (Wall et al. 1 997). This
emphasizes the need to study the effect of management practices on deciduous based
tree-pasture systems.
2.2.3 Relationships between trees, pastures, and animal components
Trees and their associated pasture understorey will compete for light, water and mineral
nutrients, and livestock will have an impact on both the trees and pastures (Carneron et
al. 1 989).
Relationships between trees, pastures, and animals on farmland have been studied in
various research works (Hay 1 987; Richardson et al. 1993). The relationships are
dependent on tree density (Hawke 199 1 ; Eason et al. 1997) and the trees, pasture and
animal species involved (Fraser and Rowarth 1 994; Casler et al. 1998).
Work by Hawke ( 1991) with pine agroforestry in New Zealand revealed that lower tree
density allowed pasture production to occur well into the rotation (tree age 1 5 years) to
the extent that at 100 stems/ha, pasture growth was 32% that of open pasture (no trees).
Higher tree density, such as 400-600 stems per hectare reduced pasture production as
well as sheep carrying capacity compared to open sward (Pollock et al. 1 997). Bird et
al. ( 1 995) reported that nutritive value of pasture under Pinus agroforestry systems

12
decreased along with animal production. This could be due to a number of factors
including: increased shading resulting in reduced pasture production, changing species
composition, accumulation of decaying pine needles, and the addition of a relatively
indigestible component to the diet (i.e. pine needles).
In the United Kingdom, under 100-400 stems/ha of sycamore and hybrid larch, there
was no reduction in animal production even after eight years, despite interception of up
to 10% of total PAR by the developing canopy (Eason et al. 1997). In fact, pruned
canopies result in more herbage production (Sibbald et al. 199 1 ). This shows that
performance of grazing animals under forestry could depend on the species of tree. It
may be advantageous to use broadleaved species for long term grazing. Calzadilla et al.
( 1992) concluded from research about performance of sheep with controlled grazing
under a pole stage broadleaved plantation, that after 6 years of forest pasture the grazing
was still economic but was approaching the end of its efficiency. Thinning affects cover
and species composition, but the response could be related to the individual species
involved (Papanastasis et al. 1995).
Apart from direct grazing activity under the trees, trees may provide environmental and
nutritional advantages for animals. Agroforestry has scope to alleviate adverse climatic
effects on livestock through the provision of both shelter and pasture (Djimde et al.
1 989). Shade, windbreaks, shelterbelts, and trees in pasture all have potential for
alleviating climatic stress on animals and increasing pasture production (Radcliffe 1 983;
1 985 ; Djimde et al. 1989; Gregory 1995) as well as improving milk yield, milk fat,
freedom from mastitis, and conception rates in dairy cattle, and growth rate in fattening
cattle (Gregory 1995). Thus, Sturrock ( 1982; 1990) suggested the research direction for,
and possible improvements of, shelter trees in New Zealand.
Performance of grazing animals under agroforestry in general declines over time
(Percival et al. 1984a; 1984b; Hawke 1991). Generally, herbaceous yield decreases as
tree basal area increases (Scanlan and Burrows 1990) which affects the quality (Percival
et al. 1 984a) and quantity of feeds, voluntary feed intake (Samarakoon et al. 1 990a), and
animal performance. Specific edapho-climatic conditions and the growth rate of trees

1 3
are the factors determining the point at which herbage production starts to decline
sharply (Sibbald et al. 199 1 ; Papanastasis et al. 1 995). The effect of these factors on
animal performance will vary according to the nature of tree species, and species of
animal involved. However, increased production of pastures under trees in the summer
and autumn which could sometimes be higher in crude protein level and dry matter
digestibility as well depending on season (Rhodes and Sharrow 1990), can be used to
advantage in fitting pasture availability to animal requirements (Hawke 199 1).
2.2.4 Tree pasture interactions
Vandenbeldt et al. ( 1990) critically examined three types of tree/crop interactions:
positive. negative, and complex, and recommended the study of the processes and
mechanisms involved in tree/crop interactions. Out of the several mechanisms, inter
root competition is likely to have the major effect on plant production (Campbell 1 989).
According to Callaway et al. ( 1 99 1 ) positive effects elicited by litterfall and negative
effects of shallow roots could vary according to tree species and may affect understorey
productivity. Under competitive conditions, only understory species which are best
equipped to capture resources and maximize production can prevail (AI-Mufti et al.
1977). Forage production is a function of tree density and light penetration, with light
penetration decreasing with increasing tree density (Acciaresi et al. 1994).
The level of interaction between trees and the productivity of grass understorey is
influenced by the species of tree (Stuart-Hill and Tainton 1 989; Shelton et al. 1 99 1),
canopy cover (Atta-Krah 1993), and distance from the tree (Hawke and Tombleson
1993) as well as limiting environmental factors and their interrelationship in the system
(Cameron et al. 1989). The tree species and seasonal variation also exhibit an
interaction, as pasture growth was significantly depressed near broad-leaved poplars and
willows during spring and summer in New Zealand (Gilchrist et al. 1993). Suppression
of grass, clover and lotus yield near planted broad-leaved trees was estimated to be up to
1 2-23% during summer in New Zealand (Christ et al. 1993).

14
Several research reports from Australia and elsewhere in the world suggest that
leguminous trees may be beneficial to understorey herbage and this type of effect could
be species and ecosystem specific (Wilson et al. 1990). Type of tree also plays a
significant interactive role with understorey crops (Dhukia et al. 1 989). Shading by
Salix had a weak influence on vegetation cover, and the zones of this effect did not
coincide with the crown outline (Yastrebov 1 989). Eucalypts appear to depress pasture
growth under their canopy more than poplars and willows (Christ et al. 1 993). Savanna
trees competed more intensely with understorey plants at wetter sites, where their roots
terminated in or near crown zones, than at drier sites, where their roots extended farther
into open grassland (Belsky 1994).
Differences in the density of the tree cover are likely to be the main source of variation
in pasture production (Eastham et al. 1990; Robinson, 1 99 1 ; Lee et al. 1 992; Kellas et
al. 1 995). Tree density in agroforestry affects water use efficiency of both tree and
pasture components, reducing evaporation by pasture in densely planted trees.
Therefore, pasture production could be higher at the intermediate tree densities
(Eastham et al. 1 990).
Likewise, length of the pasture measurement periods, shade tolerance of pasture species,
(Gadgil et al. 1 988; Robinson 1 99 1 ), differences in growth season (Shelton et al. 1 99 1 ;
Gilchrist e t al. 1 993), differences in soil moisture and fertility of soils as well as species
mixture (West et al. 1988; Campbell 1 989; Shelton et al. 1 99 1 ; Wild et al. 1 993;
Farnham and George 1994; Reategui et al. 1 995), the nature of below ground interaction
of the tree and crops (Ong et al. 1 99 1 ), the stage of development of the silvo-pastoral
system (Qarro and Montard 1 989; Stuart-Hill and Tainton 1 989; Campbell et al. 1 994;
Dunn et al. 1 994 ), and effects of silvopastoral practices like thinning and pruning (Kellas
et al. 1 995) may all affect pasture performance. Established grasses also affect growth of
companion legumes by reducing light along with competing for water and nutrients
(Dear et al. 1 998).
Management strategies such as fertilizer application and different cutting and grazing
regimes may also be designed to alter the competitive balance (Campbell 1 989), which

15
also depends on the level of tree and pasture interactions (Sukanten et al. 1 993). Having
the correct tree species coupled with appropriate density and management is essential
for a highly productive tree-pasture system (Atta-Krah 1 993).
2.3 Production and persistence of understorey pasture
Since herbage production is inversely related to tree density, maximum yields of
herbage would necessitate thinning of trees (Beale 1 973). Therefore, this review of
production and persistence of understorey pasture is mostly focused on the role of light
(Everson et al. 1 988; Wilson 1 997). This is because understanding the differences in
whole plant carbon gain, growth and reproduction success (Givnish 1 988) and the effect
of light environment on leaf area, tillers, and frequency of species (Gamier and Roy
1 988) could be helpful in understanding the adaptations and persistence of species in
shaded environments.
2.3.1 Pasture species and shade tolerance
Shade tolerance and avoidance are the alternative strategies plants use to adapt to shade.
Shade avoiders respond to shade by stem extension at the cost of leaf development.
Tolerators concentrate mainly on leaf development, perceive mainly light quantity and
increase their photosynthetic efficiency upon shading (Smith 1 98 1 ). For plants to
survive in low light, leaves must be capable of trapping the available light and
converting it into energy with the highest possible efficiency (Ninemets 1 997).
Plants respond to shading in general by partitioning dry matter to maintain or increase
leaf area and stem length (Kephart and Buxton 1993; Grubb et al. 1 996), by decreasing
leaf thickness (Kephart and Buxton 1 993), and decreasing dry matter partitioning for
root growth (Grubb et al. 1996). Likewise, high photosynthetic efficiency through
maximum interception of radiation, regeneration of a large leaf area (Wilson and Wild
1 99 1 ; Walters and Reich 1 996), and lower respiration rates (Bjorkman 1 98 1 ; Teskey
and Shrestha 1 985) under low light are common processes for the success of plants

1 6
under shade. Moreover, responses of plant characters to shade change as the plant grows
(faylor et al. 1968).
More than 29 pasture species are available to fanners in New Zealand (Charlton and
Belgrave 1992), but these species perform differently under shade (Hunt and Easton
1 989). For example, forage production under Pinus radiata trees at 400-600 stems/ha,
aged 4-6 years in New Zealand (pollock et al. 1 997) was highest for lucerne (24.6 t
DMlha) followed by phalaris/c1over (22.8 t DMlha) and cocksfootlc1over (21 .3 t DMlha),
and least for perennial ryegrass/c1over (17.8 t DMlha) and perennial ryegrass only pasture
(pollock et al. 1997). Research results also showed good persistence of lotus in Pinus
radiata agroforests (Gadgil et al. 1986). Perennial ryegrass has reduced photosynthesis in
shade than in the open (Woledge 1972), and Ong and Marshall ( 1979) reported that its
tillers can not withstand shade for more than 5 weeks.
Responses of plants to shade could vary according to the heterogeneity of the soil. Cui
and Caldwell (1997) reported that effects of shade were most pronounced if species were
foraging for nutrients such as phosphorus, in heterogeneous soils.
Genetic variation may also affect the production potential of species under shade.
Bretagnolle and Thompson ( 1996) reported that diploid cocks foot (2n=2x= 14) produced
more leaves more rapidly during winter than tetraploid species (2n=4x=28) under 25%
shaded and unfertilized conditions. Since leaf production is correlated with tiller
production, diploid plants could be more productive than tetraploid in the winter
(Bretagnolle and Thompson 1 996), though this may equally depend on the habitat of the
speCIes. The authors further indicated that diploids are mainly confined to the forest
floors, whereas tetraploids also occur in open fields.
Response of pasture species to shade could also be discussed in relation to the different
photosynthetic pathways. For example, C4 grasses have greater light-saturated
photosynthetic rates, and are prone to reduced assimilation even with minimal shading
while C3 plants have lower light-saturated photosynthetic rates with a lower conversion
coefficient for water (4 kg mm-I Kpa-I for C3 compared with 8 for C4) (Squire 1 990).

17
This indicates that C3 plants are more likely to tolerate a shaded environment than C4
plants.
2.3.1.1 Intensity of light and pasture productivity
Light provides the energy for photosynthesis, and hence for plant growth (Cooper and
Tainton 1968; Monteith 198 1 ), but the effect of a particular energy input will be
influenced by both its intensity and duration (Cooper and Tainton 1968). Effects of
light intensity on growth, anatomy and quality of grasses have been widely discussed
(Deinum et al. 1996).
Solar radiation is transmitted by most leaves and is absorbed in the uppennost part of
the canopy (Caldwell 1987). Light availability under the canopy is estimated by
measuring intercepted photosynthetic ally active radiation (PAR). Measuring
transmitted PAR accurately is difficult, as the intensity of transmitted light is highly
variable (Moss 1992) due to differences in the canopy and available sunlight. Table
(2. 1 ) shows the variation in available total photons (400-800nm) and R:FR in nature
(derived from Smith 1982).

1 8
Table 2. 1 Total photons (400-800 nm) and R:FR in nature.
Ilmoles photons m·2 S·l R:FR
Daylight 1900 1 . 1 9
Sunset 26.6 0.96
Moonlight 0.005 0.94
North aspect 480 1 .3
Ivy canopy 17.7 0. 1 3
Grassland production is based o n the conversion of solar energy, C02, soil nutrients, and
water into herbage. The basic climatic factor limiting production, however, is the input
of solar energy (Cooper and Tainton 1968 ; Saeb0 and Mortensen 1995).
The influence of light intensity on growth rate has often been examined by using natural
daylight modified by shading. In general, all components of growth are depressed by a
low energy input, but root growth and tillering are particularly dependent on
carbohydrate supply (Cooper and Tainton 1968).
The development of the photosynthetic area is influenced by both light intensity
(Henderson and Robinson 1 982) and photoperiod (Solhaug 1 99 1 ). Leaf area ratio and
leaf weight ratio of temperate pasture species, for example perennial ryegrass and
cocksfoot, are decreased at high light intensities. At the same time, leaf length and
specific leaf area are also reduced. Chlorophyll content per unit area of leaf increases, as
the light intensity is raised (Cooper and Tainton 1 968).
Decreased dry matter production under reduced light intensity has been reported in
many grass and legume species (Ludlow et al. 1 974; Deinum et al. 1 996). The
magnitude of the effect on growth depends on the stage of growth, on concurrent
temperature, moisture, nutrient stresses (Eriksen et al. 1 98 1) , and season and age of the
plant (Davis and Evans 1 990). Low intensity of light (Shade) has a marked effect on the
productive performance of both temperate (Hawke 1 99 1 ; Kephart et al. 1 992) and
tropical pasture species (Senanayake 1 995). The response to low-light stress is
generally an increase in leaf area, and changes in physiological processes (Sanderson et
al. 1 997), to a greater extent than those caused by defoliation (Havstad 1 997). There are

1 9
also effects on nutritive va lue and chemical composition (Deinum et al. 1968). Decrease
in PAR does not always resu lt in a proportionate decrease in growth because of the
compe nsatory cha nges in p lant development . For example, a change in speci fic leaf area
(Mitche ll and Woodward 1 988), whi ch norma lly increases with redu ced light intensity,
is a commonly known adaptive mechanism by plants in shade . Neverthe less, intensity
of light is one of the most criti cal factors determining production and persistence of
pasture under a shaded environment .
2.3.1.2 Morphological adaptation of plants to shade Oow light)
Plants respond to under shade by showing typica l morphologica l responses, a
phenomenon commonly known as phenotypic plasticity (Abrams 1 994). For examp le,
under shade orthotropic p lants respond in the length of the inter -node of the shoots, in
contrast to p lagiotropic p lants which adapt more in the length of the petio le (Huber and
Hutchings 1 997). This indicates that p lants which grow vertica lly could have a higher
degree of shade -induced p lasti city than those which spread horizontally (Huber 1 996;
Huber and Hut chings 1997).
Common morphological responses of grasses to shade include : increased leaf -area ratio,
increased shoot -to-root ratio (Cooper and Tainton 1 968; Stilr 1 99 1 ; Kephart et al. 1 992)
i ncreased speci fic leaf area (SLA) (Grubb et al. 1 996), and increased plant height and
reduction in vegetative shoots (Park et al. 1988). Likewise, morphological responses of
grasses that include decreased speci fic leaf weight, leaf b lade thickness and shoot dry
weight (Cooper and Tainton 1968; StUr 1 99 1 ; Kepha rt et al. 1 992), etiolation of shoots
and lower shoot densities (Iason a nd Hester 1993) have a lso been reported . Some of the
characteristic differences bet ween p lants adapted to sun and shade environments are
been summarised in Tab le 2.2.

20
Table 2.2 Characteristic differences between plants adapted or acclimated to sunny v. shady extremes in
irradiance level (derived from Givnish 1988).
Trait
Leaf-level Photosynthetic light response
Light-saturated rate
Compensation irradiance
Saturation irradiance
Biochemistry
N, Rubisco, and soluble protein/mass
Chlorophyll a: chlorophyll b ratio
Morphology
Leaf mass/area
Leaf thickness
Leaf orientation
Stomatal density
Canopy-level Leaf area index
Asymmetric leaf bases
Plant-level Fractional allocation to leaves
Fractional allocation to roots
Reproductive effort
Sun Shade
High Low
High Low
High Low
High Slightly lower
High Low
High Low
High Low
Erect Horizontal
High Low
High to low Low
Very low Infrequent
Low High
High Low
High Low
Morphological adaptations of tropical grasses to shading such as stem elongation, and
increased allocation of dry matter to shoots have also been reported (Wong et al. 1985).
Leaf area of shaded leaf blades is maintained or increased at the expense of leaf
thickness, producing thinner leaf blades. Thinning of leaf blades may result due to the
reduction in cell size (Cooper and Tainton 1968; Kephart et al 1992; Kephart and
Buxton 1993). However, increased leaf area expansion may allow limited photosynthate
for growth of secondary cell walls, which may cause lower cell wall concentration and
increased forage quality (Kepbart et al. 1 992).

2.3.1.3 Persistency of pasture under shade
2 1
Decreasing irradiance reduces the growth of pasture species and influences production
under plantations (Shelton et al. 1987), as well as modified forest canopies (Chen 1993).
Very few high yielding grass species have the potential to grow under shade, and with
few exceptions, they do not persist well under shading and grazing, and are usually
replaced by naturalized species as well as broad leaf weeds (Shelton et al. 1987). This
raises the question about the relationship between growth and persistence of plant
species under shade. Factors affecting the persistence of pastures are discussed in a
following section (section 2.3. 1 .5).
2.3.1.4 Light quality in relation to survival and persistency of shaded plants
The quality of light also affects herbage performance. Holmes ( 198 1) reviewed in detail
the effects of light quality and quantity on plant performance, and commented on the
role of green leaf canopies in reducing the quantity of radiation penetrating to ground
level, and in modifying the spectral quality of light as well (Holmes 198 1 ).
Within the solar spectrum, radiation between 350 and 730nm is photosynthetic ally
effective, and several wavebands like blue (400-S00nm), red (S50-700nm) and far-red
(700-800nm) are biologically active. It is known that red and far-red controls photo
conversion of phytochrome, and the red:far-red (R:FR) ratio, which is the ratio of
photon flux density in 10nm wavebands between 660 and 730nm, is considered a
relevant parameter for plant physiology (Pontailler and Genty 1996). Red:far-red (R:FR)
transmittance ratio was relatively unchanged during summer and autumn under an oak
canopy (McCree 198 1 ; Hughes et al. 1985).
The effect of R:FR ratio on vegetation canopies has been widely reviewed (Smith 1982;
Deregibus et al. 1 983; Casal et al. 1985; Casal et al. 1987a; Casal et al. 1 990; Amone III
and Komer 1 993; Murphy and Briske 1 994; Warringa and Kreuzer 1996; lefferson and
Muri 1997; Hay et al. 1997). Keating and Carberry ( 1 993) suggested that changes in

22
light quality can change plant form, especially an increase in the FR:R ratio, particularly
in shaded regions and at low solar elevation angles. Common effects are reduced
branching and leaf production. Adjustments in leaf structure can result in thinner leaves
with a more horizontal orientation. Photosynthetic rate per unit area of such leaves is
lower under high light but greater under low light (Keating and Carberry 1 993).
Reduction in the R:FR ratio under tree canopies may affect the understorey
independently of the effects of reduced PAR (Arnone ill and Komer 1993), but
defoliation of pasture may help to increase the supply of red light and thereby the
growth of young branches and buds of pasture plants (Teuber and Laidlaw 1 996).
Longer leaves and shoots of grasses developed due to end of day R:FR, or low R:FR,
while increased R:FR also increased in tiller extension (Deregibus et al. 1983; Casal et
al. 1 987a, 1987b; Jefferson and Muri 1997). Low R:FR reduced tillering in Lolium
multiflorum (Casal et al. 1 985; Casal et al. 1 986), but plant dry weight was unaffected
(Casal et al. 1 985). Low R:FR might preclude morphogenic responses to the density of
species (Casal et al. 1986) as well.
Reduction in stolon growth and increased elongation of petioles of white clover in dense
canopies (Thompson 1993) suggests that the stolon is the primary sensor of radiation,
although white clover clones could differ in their responses to PAR and light quality
(Solangaarachchi and Harper 1987). Delayed outgrowth of axillary buds of white clover
by 0.5 plastochrons due to reduced R:FR light (minimum 0.27) at the apical bud
indicates that legumes can also initiate localised responses to a heterogeneous light
environment (Hay et al. 1997).

2.3.1.5 Factors affecting persistence of pasture under shade
23
The persistence of pastures under tree crops varies according to environmental
conditions, and tree species and densities (Percival et al. 1984a; Pineiro and Perez
1 988).
Density of tree plantation can affect the persistence of pastures (see Section 2.2.3).
Research results show that perennial ryegrass and white clover established poorly and
their yield declined with increasing tree densities of Pinus radiata over time (Percival et
al. 1984a). Similarly lotus cv. 'Grasslands Maku' as a forest understorey, changed in
composition to a mixture of Maku and lower fertility demanding grass such as
Yorkshire fog and flat weeds (West et al. 199 1 ) . Sharrow ( 199 1 ) reported a strong
interaction between density and planting pattern of trees, with highly aggregated
plantations better able to maintain forage production even at high tree density.
Sensitivity to the slash from silvicultural operations could be one factor that affects
persistency of pasture. West et al. ( 199 1) reported that slash had much less effect on
forage availability on lotus based swards than on white clover based swards. In fact,
Maku lotus had good growth and could persist at least for 8 years with or without cattle
grazing (West et al. 199 1 ) . The success of perennial lotus species could also be related
to their relative unpalatability compared with red and white clover, and their ability to
compete with the resident weed population (Gadgil et al. 1986; 1988).
Seo et al. ( 1 989) concluded that certain levels of shade (45%) and fertilizers could be
used to sustain fodder production in woodland pastures for species like cocksfoot. This
indicates the role of management practices in sustaining production of pasture under
shade. Likewise, choice of suitable legumes in a mixture could be one way to cope with
shade from companion grass species, in order to have better persistency. Hopkins et al.
( 1996) reported that lotus can be an alternative legume to white clover, especially for
low soil nutrient.

24
2.3.1.6 Positive effects of shade on the understorey pastures
Shade can contribute positively to understorey pastures, especially in the tropical
environments (Wilson et al. 1 986), which are more likely to be driven by increasing
mineralisation rates (Wilson and Wild 199 1 ).
Cameron et al. ( 1989) reported that pasture production was not reduced under widely
spaced eucalyptus trees. Belsky ( 1994) in a study of the influences of trees on Savanna
productivity, reported that effects of shade could also be positive, depending on the
nature of the limiting factors. Moreover, Belsky ( 1992) noted that in Savannas, trees
increase the availability of nutrients in the herbaceous forage, due to improved nutrient
cycling (Shelton et al. 199 1 ). Similarly, soil under deciduous blue oak canopies had
higher nitrogen turnover and inorganic nitrogen availability than open grassland
(Jackson et al. 1990).
Tree shade can possibly conserve soil moisture, allowing better growth of the
understorey through reducing evaporation. Ella et al. ( 199 1 ) in agroforestry research of
Sesbania grandiflora, Calliandra calothyrsus, Gliricidia, and Leucaena with Digiteria,
Panicum, Pennisetum purpureum, and P. clandistenum under different cutting
frequencies concluded that any factor that resulted in conservation of water contributed
to increased plant productivity.
Certain species naturally may perform better in shade than others due to better ecotypes.
Dry matter yields of Paspalum pilosum and Stenotaphrum secundatum (Toledo et al.
1 989), and Stenotaphrum secundatum and Axonopus compressus were increased under
low light transmission (Samarakoon et al. 1990b), the latter without reduction in
nutritive qUality. Both S. secundatum and A. compressus had a strong stoloniferous
habit, with less culm elongation and stem development in tops resulting in better growth
response under shade.
The concurrent decrease in cell wall content of Panicum spp. (Wilson and Wong 1 982),
and higher digestible organic matter of the whole crop at lower light intensity (Deinum

25
et al. 1 996), indicated that light intensity may affect forage qUality. Moreover, Wilson
et al. ( 1990), in their study with Paspalum under shade of Eucalyptus grandis, found
that grass under the trees had a greater proportion of green leaf, greater concentration of
N and K, and greater moisture content than grass in full sun. Similarly, higher dry
matter yield of Paspalum notatum (Wilson et al. 1990), and green panic, Rhodes grass
and speargrass under trees in a subtropical environment (Wilson 1 996) than in open
pasture, and adaptations of legumes like Galactia elliottii for higher production in
shaded environments (Muire and Pitman 1989), indicate that shade can also stimulate
pasture growth. Belsky ( 1 994) under tropical conditions found trees increased
understorey productivity by adding nutrients to the nutrient-limited systems, whereas
shade increased productivity by reducing the temperature, evapo-transpiration, and
conductance in species growing below tree crowns. Under certain tree species, the
positive effects of soil enrichment and improved plant water relations will be greater
than the negative effects of competition. However, Connor et al. ( 1 989) reported that
there was a marked drying under Pinus radiata indicating that improvement in soil
moisture under trees does not always OCCUIT.
2.3.1.7 Negative effects of shade on understorey pastures
Shading can also have a negative impact on the understorey pastures (Sections 2.2:
2.2.3, 2.2.4) . For example, under Pinus radiata agroforestry systems, trees have a
marked impact on the pasture by the age of 13 years (Bird et al. 1 995). Those impacts
are mostly due to changing pasture species composition, accumulation of decaying pine
needles, and subsequent reduction in yields (Bird et al. 1995). Shading was the
dominant factor responsible for decreased subterranean clover pasture growth under 15
years old pine trees (Anderson and Batini 1983).
Studies of grassland in a Korean forest also revealed that annual dry matter yield of
Dactylis glomerata, Phleum pratense, Lolium perenne and Trifolium repens or a
mixture dominated by Dactylis glomerata decreased by about 28-35% and 44-60% with
50% and 75% shade respectively (Park et al. 1987). Likewise, yield of Axonopus

26
affinis and Paspalum conjugatum was reduced by about 38% and 27% respectively
under shade (Toledo et al. 1989).
Shade also affects the nitrogen fixing ability of legumes. Sugawara et al. ( 1997) reported
that nitrogen fixation by white clover was decreased considerably with shading (relative
shading of 40% and 60%), through reduced nitrogen fixation and photosynthesis
(Sugawara et al. 1997). Goh et al. ( 1996) reported that the nitrogen fixing capacity of
pasture species altered under shade in an agroforestry trial in New Zealand. White clover
in a perennial ryegrass and white clover pasture mix fixed more N under shade than other
grass and clover pasture mixtures. However, differences in the rate of N fixation by clover
under shade are not consistent.
2.3.1.8 Pruning of trees in relation to pasture production
The effective management of natural vegetation presupposes an understanding of the
responses of the vegetation components to applied treatments (Walker et al. 1 986).
Thinning and pruning of trees is critical from the pasture productivity point of view, and
varies according to species and the conditions applied. For example, according to
Schacht et al. ( 1988), thinned stands of Caatinga could allow for high levels of forage
production while maintaining moderate to high levels of wood production.
In general, pruning of trees allows penetration of more light to the pasture component.
It can equally reduce competition with pastures in terms of other resources like water
and nutrients. Pruning of branches may also reduce underground root competition with
pastures. This situation varies with the nature of the tree species, and the stage, level,
and severity of pruning. Very few such studies have been carried out (Walker et al.
1 986) to determine the effects of tree pruning, and most available results are related only
to the silvo-pastoral works of thinning stocks.

27
2.3.2 FertUUzer
Since pastures and trees are grown in association, they will compete for available
nutrients, along with light and moisture. Thus improving soil fertility is important to
enhance pasture establishment under trees, especially for poor fertility soils (Hunt and
Easton 1989; Pinto et al. 1997).
Fertilizer application, especially nitrogen, has increased the nutritive value (Hight et al.
1 968) as well as dry matter content of pasture (Steele et al. 1 984). The differential
effect of N deficiency on leaf extension rate and leaf appearance rate modifies sward
structural characteristics (Belanger 1998). Application of nitrogen fertilizer can increase
nitrogen content of grasses (Hight et al. 1 968). Stopping nitrogen application can
decrease tiller density and assimilate allocation to shoots (Van Loo et al. 1 992). There
could be a relationship between nitrogen concentration and soluble carbohydrate content
as well (Alberda 1965).
In grassland development studies in a forest designed to investigate the effect of
nitrogen fertilization, Seo et al. ( 1990) found highest dry matter yields of grasses
(cocksfoot, perennial ryegrass, tall fescue, and kentucky bluegrass) at 240 kg Nlba.
Earlier, Lee and Yun ( 1 988) under similar conditions, with cocksfoot and tall fescue
dominated pastures, under 80, 60, and 20% light, and low to high rates of nitrogen,
phosphorus, and potassic fertilizers (100-350 kglhectare each), reported increased tiller
density, dry matter, and in-vitro digestibility, but found decreasing tiller density
associated with increased level of shading. Lee ( 1991) in his study on the effects of
shade and nitrogen fertilizer on cocksfoot reported that crude protein and nitrate-N
contents were increased with shading and N application, while water soluble
carbohydrate content was lowest with 70% shading and 300 kg Nlba. Likewise, Han et
al. ( 1 985) in their studies on the effects of fertilization on grass/clover mixtures under
pines tree reported that plant height, chlorophyll content, and regrowth after the fust cut
were similar, but rate of leaf decay tended to increase and the proportion of prostrate
plants in the sward increased markedly with increasing N rate, with the highest
economic returns from 2 10-280 kg N, 100- 150 kg P20S. and 1 20- 1 80 k20 Iba.

2.3.2.1 Fertilizer responses of pasture species
28
Grasses preferentially take up soil nitrogen (Right et al. 1 968) but this may differ for
pastures under shade (Campbell et al. 1994). This is because the effect of a lower light
intensity (section 2.3. 1 . 1 ) together with higher soil nitrate levels may cause variation
between grasses and clovers (Hight et al. 1 968) in their capacity to utilize nitrogen. At
reduced radiation, grass growth was depressed at low or high levels of N, but at low N
plant stands compensated for the low levels of irradiance by increasing the leaf area
index to a value similar to that of the stand under full sun (Cruz 1 996).
Legume performance under agroforestry declines in the long term largely due to the
effects of reduced radiation (Balocchi and Phillips 1 997). Moreover, evidence also
suggests that differences in the response to fertilizer by plant species under shade is also
likely to be driven by the differences in mineralization rates (Wilson and Wild 1994).
2.3.3 Defoliation
2.3.3.1 Defoliation responses of pasture species
Defoliation of pasture species may be by either cutting or grazing (Crawley 1983;
Richards 1 993). Defoliation influences the productivity and quality as well as the
persistence of forages. Responses of plants to defoliation can be considered at two
levels: physiological responses defined as occurring over a short period of time
(Richards 1 993), and morphological responses which are taken as being long term
(Chapman and Lemaire 1 993). When photosynthetic capacity is reduced due to
defoliation, photosynthetic rate and nutrient uptake ability of the plant are reduced.
2.3.3.2 Defoliation and its effects on production
29
Production responses to defoliation vary due to differences in the environment and with
pasture species (Kang et al. 1 995; Donaghy et al. 1 997), cutting height and cutting
interval (Fulkerson and Slack 1 995; Rutkowska and Lewicka 1 995; Harris et al. 1 997),
season (Lawson et al. 1 997), tree species (Ella et al. 1 99 1 ), and defoliation management
(Turner et al. 1998). For example, frequent defoliation of cocksfoot-white clover
pasture during autumn in the United States resulted in greater nutritive value than
mature stockpiled herbage (Turner et al. 1998). In general, severe defoliation in white
clover alters the partitioning of assimilates more in favour of the stolon apex and less to
the stolon itself irrespective of cultivar and harvesting occasions (Frankow-Lindberg
1 997), and causes the loss of viability of axillary buds (Hay and Newton 1 996).
2.3.3.3 Physiological changes in plants due to defoliation
After defoliation the allocation of photosynthate to roots reduces, but increases to shoot
meristems and leaf growth regions (Bassmann and Dickmann 1 985). This compensatory
process of increased export from source to growing shoot sinks contributes to a rapid re
establishment of the photosynthetic canopy after defoliation (Richards 1 993). But under
shade, carbohydrate reserves are reduced with reduced light so defoliation of shaded
swards could reduce its capacity for regrowth (W ong and Wilson 1 980) due to continual
decline in photosynthetic area and light interception, low total nonstructural
carbohydrate yield in residual biomass after defoliation, as well as low tiller density
(W ong and Stiir 1996).

30
2.3.3.4 Defoliation and regrowth
The contribution of carbohydrate reserves to shoot regrowth of grasses after defoliation
has been widely researched (Richards 1 993; Wong and Stiir 1 996; Sanderson et al.
1 997). High concentration of fructans in live enclosed leaves appear to be associated
with survival after defoliation (Volaire and Gandoin 1 996). Wong and Stiir ( 1996)
concluded that the concentration of total non-structural carbohydrate was a critical
factor in the regrowth and survival of grasses in shaded environments. Sanderson et al.
( 1997) also extensively reviewed the remobilization of carbohydrates and noted that in
many temperate grasses, fructan is the storage carbohydrate which is remobilised for
regrowth of plants after defoliation. However, cocksfoot cultivars for drought surviving
abilities in the Mediterranean dry lands, reported that there was no consistent
relationship between water soluble carbohydrate reserves in the plant bases and recovery
growth (Volaire and Gandoin 1 996).
Level of nitrogen in the stubble could also be related to the growth of tissue after
defoliation (Matsunaka et al. 1 997; Sanderson et al. 1 997) . High tissue nitrogen
concentration could be more important than level of reserve carbohydrate for alfalfa
plants (Volaire and Gandoin 1 996; Sanderson et al. 1997). But under shade, more
frequent defoliation accentuates the detrimental effects to the plant. It could be due to
progressive weakening of plants recovering from a low stubble leaf area (W ong and
Wilson 1 980) even though plants under shade adapt by reducing dark respiration
(Ludlow et al. 1 974), and through other adaptive changes like increased shoot/root ratio,
larger leaves (Ludlow 1978), and higher leaf area index (Wong and Wilson 1 980; Paez
et al. 1 997).

2.4 Brief introduction to pasture species used in the thesis
2.4.1 Grasses
2.4.1.1 Dactylis giomerata L. (Cocksfoot)
3 1
Cocksfoot , or orchardgrass is a tufted perennial with flattened tillers, the leaves of which
are bluish green and without auricles (Langer 1990). The ligule is white and conspicuous,
and leaf and sheath are both hairless. The inflorescence is a panicle bearing spikelets
crowded together in clumps, each spikelet possesses 3-4 florets (Langer 1990).
Cocksfoot is grown in New Zealand (Lolicato and Rumball 1994; Rumball et al. 1997b)
and other temperate regions of the world (Reed and Sutherland 1996). Cocksfoot is
commonly mixed with compatible temperate pasture species (Grzegorczyk et al. 1996)
like white clover, lotus (Annicchiarico et al. 1995; Aleksandrova 1995), and perennial
ryegrass. It tends to dominate in heavily grazed pastures (Barker et al. 1985).
Cocksfoot is regarded as a medium soil fertility grass in New Zealand pasture (Daly 1990).
'Grassland Wana' is a persistent, prostrate cultivar regarded as having potential in
agroforestry (Hocking 1990).
2.4.1.2 Lolium perenne L. (perennial ryegrass)
Perennial ryegrass is the most important grass species in New Zealand, and is adapted to
medium to high fertility soils, except in those areas with very dry summers (Hunt and
Easton 1989). It is also an important species for pasture renewal (Charlton and Belgrave
1992).
Perennial ryegrass is a hairless plant with flattened tillers bearing dark leaves, which are
very shiny on the lower surface. The auricles are very small and often absent, while the
ligule is short and not conspicuous. The leaf sheath is bright red in colour at the base. The

32
inflorescence of ryegrass is a spike, having spikelets each subtended by a single glume and
containing 3- 10 fertile florets (Langer 1 990).
As a species perennial ryegrass is quite variable, as crosses within the species and with
other ryegrass species readily occur. Since it has been a component of pastures for a long
time, many strains have developed and some have been fIrmly established in the seed trade
as well (Langer, 1990). 'Grasslands Nui' , once the most widely sown cultivar in New
Zealand, is a slightly more open plant with wider leaves. It is very acceptable to stock,
persistent, and shows tolerance to rust infection (Langer 1990).
Perennial ryegrass and cocksfoot exhibit similar patterns of clonal growth and population
structure, but not under tree canopies (Brock et al. 1 996). Perennial ryegrass establishes
faster than Festuca rubra under shade (Barker and Hunt 1997). Perennial ryegrass also
tillers faster than cocksfoot under a wide range of condition, but not under heavy shading.
2.4.1.3 Poa trivialis L. ( Poa trivialis)
Poa trivia lis is more shade tolerant than perennial ryegrass and Poa pratensis (Bar and
Schulz 1995). 'Laser' rough bluegrass, a cultivar of Poa trivia lis, was released in 1988. It
originates from plants selected from old turf in New Jersey, Pennsylvania, New York and
California. Laser is leafy and moderately low growing. It has good tolerance of cool shade
and wet soils (Hurley et al. 1990). Poa trivialis is a potential species for agroforestry
(Hocking 1 990). However, Poa trivialis is a low producing grass and is usually regarded
as a weed of laxly grazed pastures on wet soils.

33
2.4.1.4 Holcus lanatus L. (Yorkshire fog)
Yorkshire fog i s a perennial gra ss from Eur ope which is widely di stributed in New
Zealand ( Madden and Harri s 196 1 ). The plant i s often con sidered a s a weed . However , it
can be use ful to grow under less fertile and relatively shaded condition s. Yorkshire f og is
c overed with den se hair s, the leaves are greyi sh green in colour and the leaf shea th s have
di stinc t p urple veins. The plant has no a uricle , and the ligule i s comparati vely shor t and
toothed ( Madden and Harri s 196 1). The cul ti var 'Ma ssey Basyn ' i s widely used , it i s
pr oduc ti ve and can be used in a range of soil s and climates. However , i ts palatability i s
often q ue stioned (Jacques 1 974), par ticularly when i t reaches the flower ing stage , but the
re-growth i s usually well gra zed . (Wa tt 1 978). The ma in cause of unpalatabili ty i s
probably ligni fication of the culm (Wa tt 1 978). Yorkshire fog wa s one of the more
per si stent pa sture species under Pin us radiata in the Tikitere agrofore stry experiment
( Knowles et al. 1995).
2.4.1.5 Agrostis capillaris, syn. A. tenuis Sibth. (Browntop)
Br owntop i s a perennial gra ss which originated from Europe , and ha s n ow become wide
spread in New Zealand ( Madden and Harri s 1 96 1). It i s a loo sely tufted grass with a
dense bottom growth of lea fy sh oots. Plants in general spread laterally by sh ort rhizo mes.
The leaf blades are erect and flat. The blade and sheath of browntop are hairless.
Br owntop i s also found in pastures on fertile soil s. 'Gra sslands Muster ' i s the only cul tivar
of brown top bred for grazing (Madden and Harris 1 961 ). Browntop i s relatively intolerant
of heavy shade (Brauen et al. 1993).
2.4.1.6 Festuca arundinacea Schreb. (Tall fescue)
Tall fe scue i s a perennial gra ss which wa s intr oduced to New Zealand from Europe one
h undred years ago (Langer 1990). Its leave s are dark green in colour and are distinctly
ribbed on the upper surface . The auricle i s q ui te prominent, but the ligule i s not. At
flowering , tall fescue forms a large open panicle in which each spik let contains 3-10
florets which separate at matur ity ( Langer 1 990). Tall fescue is relati vely slow to
34
establish, however, it is considered more drought tolerant than perennial ryegrass. Tall
fescue is adapted to wet and dry soils, but requires medium to high fertility (Anderson
1982).
2.4.2 Herbs
2.4.2.1 Plantago lane eo lata L. (plantain)
Plantain is a herb with a reputation as a plant with animal health benefits. 'Grasslands
Lancelot' plantain is the first cultivar bred for pasture use in New Zealand and was given
Plant Breeders Rights in 1993 (Rumball et al. 1997a). Naturalised plantain is a component
of most hill pasture.
Grasslands Lancelot is a glabrous to pubescent perennial with a rosette growth form.
Compared to the broadly based genepool, it is more uniform in growth and is more erect,
with a higher number of vegetative shoots. The leaves are lanceolate to ovate lanceolate,
entire to weakly toothed, 3-7 nerved, and with tips usually acuminate and inflexed
(Rumball et al. 1997a).
When feeding on pure swards of plantain growth rates of animals are low. However,
animal performances from plantainllegume mixtures have matched those of other species
in legume mixtures (Rumball et al. 1997a). Plantain would be best used as a component
of mixed swards, particularly for dry regions (Rumball et al. 1997a).

2.4.3 �e�Enes
2.4.3.1 Trifolium repens L. (White clover)
35
White clover is the most commonly grown pasture legume species in New Zealand. It
has creeping stolons that root from internodes and have vertical leaf petioles bearing
trifoliate leaves (Forde et al. 1989). White clover is a glabrous legume with leaflets that
have a distinctly serrated margin and a light coloured centric leaf mark. The
inflorescence is borne on a separate stem (peduncle) and consists of a varied number of
individual flowers, usually 20-40, each having white to pink petals (Langer 1990).
Clover plants form rosettes with a network of branched stolons which have the ability to
develop roots as well as branches from each node, this imparts defoliation tolerance
(Chapman 1 983).
White clover is relatively intolerant of heavy shade, but has the potential for
agroforestry under light shade.
2.4.3.2 Trifolium subterraneum L (Subterranean clover)
Subterranean clover is an annual, which can bury its seeds below the soil surface. It is a
highly prostrate plant but adventitious roots are absent (Langer 1990). The plant is
densely hairy with a conspicuous stipule which often bears colourful marks. The
inflorescence consists of 3-6 fertile, and a number of sterile flowers (Langer 1990).
Subterranean clovers are adapted to growing during mild winters, and require medium
fertility soils. It has higher shade tolerance than white clover.

36
2.4.3.3 Lotus pedunculatus Cav. (Lotus)
Lotus is a perennial legume of Europe, and, or North African origin, and has a long
history of use in New Zealand (Levy 1 970), particularly where soils are wet and
infertile. It forms a crown and a tap root which are eventually supplemented by a
network of rhizomes and fibrous roots (Lambert et al. 1 974). The leaves are trifoliate
but stipules are like leaflets resulting in a compound leaf with 5 leaflets. The
inflorescence bears 4-6 flowers.
'Grasslands Maku' is the most widely grown cultivar. It is valued for its growth on
acid, infertile soils, and also for erosion control. Malm tolerates low levels of phosphate
which are common in hill based silvo-pastoral systems. It is widely used as ground
cover under Pinus radiata (West et al. 1 99 1 ; Balocchi and Phillips 1 997).
2.5 Conclusions
Agroforestry is the land use science which deals with the interactions between trees,
crops, and of both with animals in the same unit of land. It involves the coexistence of
trees with agriculture, both in time and space. Agroforestry in New Zealand is
dominated by silvo-pastoralism. Very few studies have looked at overall pasture
production under trees and in New Zealand, most of those studies are confined to radiata
pine. Deciduous trees have also been used in New Zealand, but information based on
decidious silvo-pastoral systems in terms of their impact on pasture production, soil
fertility, and many other critical issues is limited.
Strong interactions exist between trees, pastures, and animals which are largely
dependent on tree density, and animal as well as pasture species. Generally, herbaceous
yield under trees decreases as tree basal area increases. As well as low pasture
production, herbage quality can be decreased resulting in reduced feed intake and
perfonnance of livestock. The effects of shade will, however, vary according to the
nature of the tree species and species of animal involved.

37
Trees may provide environmental and nutritional advantages for animals through the
provision of shelter and pasture in the same locality. Shade, windbreaks, shelterbelts,
and trees in pasture all have potential for alleviating climatic stress on animals and
increasing pasture production, but more work is needed to quantify these benefits.
Plants respond to shade by showing morphological responses such as an increase in
specific leaf area, shoot to root ratio, and stem length, and a decrease in dry matter
allocation to roots. Shade can have both positive and negative effects on understorey
crops. Positive effects are, however, mostly seen in tropical environments, and could be
largely due to the conservation of soil moisture and better mineralization processes.
Negative effects are mostly associated with the reduction in transmitted light under the
canopy. Response of plants to shading varies according to the morphology of the
species, heterogeneity of soils, composition of pastures, genetic variation of plants as
well as differences in photosynthetic pathways. Pasture species are also sensitive to the
fertility status of soils, particularly to that of nitrogenous fertilizer. Responses to
fertilizer by plant species under shade are commonly different from under full sun.
Light is the critical factor for growth and persistence of forage. Very few pasture
species persist well under shading. It is assumed that under low light, successful plants
will have high photosynthetic efficiency and allocation of resources to larger leaf areas.
Light intensity and quality are the two major aspects to consider in understanding the
effects of light on pasture under a tree canopy. Quantity (intensity) of light, which is
estimated by measuring intercepted photosynthetically active radiation (PAR), can
affect growth as well as anatomy of a plant. In general, all components of growth are
depressed by a low energy input, but root growth and tillering are particularly affected.
The response to low-light stress generally results in changes in physiological processes.
Effects on nutritive value and chemical composition also occur. Therefore, low intensity
of light has a marked effect on the productive performance of pasture species.
Likewise, the quality of light also effects the herbage performance. It is known that red
and far-red light controls photoconversion of phytochrome, and the red:far-red (R:FR)

38
ratio, is considered a relevant parameter for plant physiology. Changes in light quality
can affect tiller production, and also change the plant form, common effects of which
could be reduced branching and thinner leaf production with a more horizontal
orientation. It is also believed that reduction in the R:FR ratio under the canopy may
affect the understorey independently of the effects of reduced PAR. However, many of
these conclusions should be considered with caution in relation to the management of
tree-pasture systems due to most of the evidence being drawn from experiments
conducted with artificial shading.
Tree pasture interactions are a complex phenomenon to understand. The level of
interaction is affected by tree density, canopy cover, seasonal variation, as well as the
tree species. Under competitive conditions, only species that can capture more
resources will persist. This indicates that the success of silvo-pastoral systems depends
on the identification of suitable shade-tolerant species and management practices which
are productive and ensure the persistence of the introduced pasture species.
Pasture productivity varies with species as well as the understorey environment (e.g.
light, moisture, nutrients). Tree species with appropriate density and management are
therefore essential to maintain pasture production under shade. Pruning of trees allows
penetration of more light and reduces competition with pastures for resources. Aspects
of defoliation management like defoliation height, interval, and effects of season also
influence pasture productivity and persistence. Severe defoliation under shade is
harmful in terms of growth and production. Defoliation stress depends on intensity and
timing. Plants subjected to defoliation under shade exhibit a decline in photosynthetic
area, low carbohydrate yield in residual biomass and decreased tiller density.

39
2.6 References
Abrams, M. D. 1994. Genotypic and phenotypic variation as stress adaptations in
temperate tree species: A review of several case studies. Tree Physiology
1 4:833-842.
Acciaresi, H., Ansin, O. E. and Marlats, R. M. 1994. Silvopastoral systems: Effects of
tree density on light penetration and forage production in poplar (Populus
deltoides Marsh) stands. Agroforesteria en las Americas 1 :6-9. (language of
text Spanish).
AIberda, Th. 1965. The influence of temperature, light intensity and nitrate
concentration on dry-matter production and chemical composition of Lolium
perenne L. Netherlands Journal of Agricultural Science 1 3 :355-360.
AIeksandrova, B. 1995. Yield and forage quality of birdsfoot trefoil grown alone and
in mixture with cocksfoot. Rasteniev dni Nauki 32: 1 82- 1 84. (CAB Abstract,
text in Bulgarian).
AI-Mufti, M. M., Sydes, C. L., Fumess, S. B., Grime, J. P. and Band, S. R. 1977. A
quantitative analysis of shoot phenology and dominance in herbaceous
vegetation. Journal of Ecology 65:759-79 1 .
Anderson, G. 1991 . Benefits, limitations and management o f a fully integrated
agroforestry system. Agriculture Science 4(4): 1 5- 17.
Anderson, L. B. 1982. 'Grasslands Roa' tall fescue (Festuca arundinacea Schreb.).
New Zealand Journal of Experimental Agriculture 1 0:269-273.

40
Anderson, G. W. and Batini, E. F. 1983. Pasture, sheep and timber from agroforestry
systems with subterranean clover sown under 1 5 year old Pinus radiata by a
method simulating aerial seeding. Australian Journal of Experimental
Agriculture and Animal Husbandry 23: 123- 1 30.
Annicchiarico, P., Bozzo, F., Parente, G., Gusmeroli, F., Mair, V., Marguerettaz, O. and
Orlandi, D. 1995. Analysis of adaptation of grass/legume mixtures to Italian
alpine and sub alpine zones through an additive main effects and multiplicative
interaction model. Grass and Forage Science 50:405-413 .
Anonymous, 1995. Poplar agroforestry: An introduction to using poplars for timber.
New Zealand Poplar Commission, Palmerston North, New Zealand.
Amone rn, J. A. and Korner C. 1993. Influence of elevated CO2 on canopy
development and red:far-red ratios in two-storied stands of Ricinus communis.
Oecologia 94: 5 1 0-5 1 5 .
Atta-Krah, A. N. 1993. Trees and shrubs as secondary components of pasture.
Proceedings of the XVII Grasslands Congress, New Zealand: 2045-2052.
Balocchi, O. A. and Phillips, C. J. C. 1997. The morphology and development of Lotus
uliginosus and Trifolium subterraneum under Pinus radiata canopy in southern
Chile. Agroforestry Systems 37: 15-26.
Bar, D. and Schulz, H. 1995. Effects of shade on turf grasses. Rasen Turf Gazon
26:48-55. (CAB Abstracts).
Barker, D. J., Lancashire, J. A. and Meurk, C. 1 985. 'Grasslands Wana' cocksfoot - an
improved grass suitable for hill country. Proceedings of the New Zealand
Grassland Association 46: 1 67- 172.

4 1
Barker, S. W. and Hunt, J . A . 1 997. Effects of shade by stands on grass species and
cultivar selection for football pitches. International Turfgrass Society Research
Journal 8:593-60 1 .
Bassman, J . H. and Dickmann, D . I . 1985. Effects o f defoliation in the developing leaf
zone on young Populus X euramericana plants. IT. Distribution of 1 4-C
photosynthate after defoliation. Forest Science 3 1 :358-366.
Beale, I. F. 1 973. Tree density effects on yields of herbage and tree components in
South West Queensland mulga (Acacia aneura f. muell.) scrub. Tropical
Grasslands 7: 135- 1 42.
Belanger, G. 1 998. Morphogenetic characteristics of timothy grown with varying N
nutrition. Canadian Journal of Plant Science 78: 1 03- 1 07.
Belsky, A. J. 1992. Effects of trees on nutritional quality of understorey grarnineous
forage in tropical savanas. Tropical Grasslands 26: 12-20.
Belsky, A. J. 1 994. Influence of trees on savanna productivity: Tests of shade, nutrients,
and tree-grass competition. Ecology 75: 922-932.
Bird, P. R., Bicknell, D., Bulman, P. A., Burke, S. J. A., Leys, J. F., Parker J. N . , Van
Der Sommen, F. J. and Voller, P. 1992. The role of shelter in Australia for
protecting soils plants and livestock. Agroforestry Systems 20:59-86.
Bird, P. R., Kellas, J. D., Kearney, G. A. and Cumming, K. N . 1 995. Animal production
under a series of Pinus radiata-pasture agroforestry systems in South West
Victoria, Australia. Australian Journal of Agricultural Research 46: 1299- 1 3 1 0.

42
Bjorkman, O. 1 98 1 . Responses to different quantum flux densities. Pp 57- 107 in:
Physiological plant ecology I. Responses to the physical environment, Lange, O.
L., Nobel, P. S., Osmond, C. B. and Ziegler, H. ed. Encyclopedia of Plant
Physiology, Springer, Berlin, Heidelberg, New York.
Blair, G. J. 1 99 1 . The ACIAR forage program. Pp 1 -4. in: Forage for plantation crops,
Shelton, H. M. and Stiir, W. W. ed. ACIAR Proceedings No. 32, Canberra.
Bowersox, T. W. and Ward, W. W. 1 977. Soil fertility, growth and yield of young
hybrid poplar plantations in central Pennsylvania. Forest Science 23:463-469.
Brauen, S. E., Goss, S. E., Goss, R. L. and Brede, A. D. 1 993. Registration of 'Putter'
creeping bentgrass. Crop Science 33: 1 100.
Bretagnolle, F. and Thompson, J. D. 1996. An experimental study of ecological
differences in winter growth between sympatric diploid and autotetraploid
Dactylis glomerata. Journal of Ecology 84:343-35 1 .
Brock, J. L., Hume, D. E. and Fletcher, R. H. 1 996. Seasonal variation in the
morphology of perennial ryegrass (Lolium perenne) and cocksfoot (Dactylis
glomerata) plants and populations in pastures under intensive sheep grazing.
Journal of Agricultural Science 1 26:37-5 1 .
Caldwell, M. M. 1987. Plant architecture and resource competition. Pp 1 64- 1 79 in:
Ecological Studies, Schulze, E. D. and Zwolfer, H. ed. Springer-Verlag Berlin,
Heidelberg.
Callaway, R. M., Nadkami, N. M. and Mahall, B. E. 199 1 . Facilitation and interference
of Quercus douglasii on understorey productivity in central California. Ecology
72: 1484- 1499.

43
Calzadilla, E., Torres, J., Mojena, B., Alvarez, A, Renda, A, Forcade, E., Mercadet, A
and Alvarez, L. 1992. Performance of sheep (fattening lambs) with controlled
grazing under a pole- stage broadleaved plantation. Revista-Baracoa 22: 59-7 1 .
Cameron, D. M. , Ranee, S. J., Jones, R. M., Charler-Edwards, D. A and Bames, A
1989. Project STAG: An Experimental Study in Agroforestry. Australian
Journal of Agricultural Research 40: 699-7 14.
Came, J. and Prinsely, R. 1992. Agroforestry: what is it? Agroforestry redefined.
Agricultural Science 5: 45-47.
Campbell, C. D. 1989. The importance of root interactions for grass and trees in a
silvopastoral system. Aspects of Applied Biology 22: 255-26 1 .
CampbeU, C . D., Atkinson, D., Jarvis, P. G. and Newbould, P. 1994. Effects of nitrogen
fertilizer on tree/pasture competition during the establishment phase of
silvopastoral system. Annals of Applied-Biology 124:83-96.
Carruthers, P. 1 990. The prospects for agroforestry: an EC perspective. Outlook on
Agriculture 19: 147-154.
Casal, J. J., Sanchez, R. A and Deregibus, V. A 1987a. Tillering responses of Lolium
multiflorum plants to changes of red/far-red ratio typical of sparse canopies.
Journal oJExperimental Botany 38: 1 432- 1439.
Casal, J. J., Sanchez, R. A and Deregibus, V. A. 1 986. The effect of plant density on
tillering: the involvement of R/FR ratio and the proportion of radiation
intercepted per plant. Journal of Experimental Botany 26:365-37 1 .
Casal, J. J., Sanchez, R. A and Gibson, D. 1990. The significance of change in the
red/far-red ratio associated with either neighbour plants or twilight for tillering
in Lolium multiflorum Lam. New Phytologist 1 16:565-572.

44
Casal, 1. 1., Deregibus, V. A. and Sanchez, R. A. 1985. Variations in tiller dynamics
and morphology in Lolium multiflorum Lam. Vegetative and reproductive plants
as affected by differences in red/far-red irradiation. Annals of Botany 56:443-
559.
Casal, 1. l . , Sanchez, R. A. and Deregibus, V. A. 1987b. The effect of light quality on
shoot extension growth in three species of grasses. Annals of Botany 59: 1-7.
Casler, M. D., Undersander, D. 1., Fredericks, c., Combs, D. K. and Reed, l. D. 1998.
An on-farm test of perennial forage grass varieties under management intensive
grazing. Journal of Production Agriculture 1 1 :92-99.
Chapman, D. F. and Lemaire, G. 1993. Morphogenetic and structural determinants of
plant regrowth after defoliation. Pp 55-64 in: Grasslands for Our World, Barker,
M. 1. ed. SIR Publishing, Wellington, New Zealand.
Chapman, D. F. 1 983. Growth and demography of Trifolium repens L. stolon in grazed
hill swards. Journal of Applied Ecology 20:590-608.
Charlton, 1. F. L. and Belgrave, B. R. 1 992. The range of pasture species in New
Zealand and their use in different environments. Proceedings of the New
Zealand Grassland Association 54:99- 1 04.
Chen, C. P. 1 993. Pastures as the secondary component in tree-pasture systems.
Proceedings of the XVII International Grassland Congress, New Zealand: 2037-
2043.
Churchill, H. 1 993. Forestry with Populus deltoides. South African Forestry Journal
167 :63-66.
45
Clough, P. W. J. and Hicks, D. L. 1993. Soil conservation and the Resource
Management Act: Summary. MAP policy technical paper 93/2.
Connor, D. 199 1 . Research and extension needs in agroforestry. Agricultural Science 4:
20-25.
Connor, D. J., Sands, R. and Strandgard, M. 1 989. Competition for water, light and
nutrients in agroforestry associations of Pinus radiata and pastures. Pp 45 1 -462
in: Meteorology and agroforestry, Reifsnyder, W. S. and Darnhofer, T. O. ed.
Proceedings of an international workshop on the application of meteorology to
agroforestry systems planning and management, 9- 1 3 February, 1 987. Nairobi,
Kenya, International Council for Research in Agroforestry (ICRAF).
Cooper, J. P. and Tainton, N. M. 1968. Light and temperature requirements for the
growth of tropial and temperate grasses. Herbage Abstracts 38 : 167- 176.
Costello, L. R., Thomas, D. and DeVries, J. 1 996. Plant water loss in a shaded
environment: A pilot study. Journal of Arboriculture 22: 1 06- 108.
Crawley, M. J. 1 983. Herbivory: The dynamics of animal-plant interactions.
Blackwell, Oxford. 437p.
Cruz, P. 1 996. Growth and nitrogen nutrition of a Dichanthium aristatum pasture under
shading. Tropical Grasslands 30:407-4 1 3.
Cui, M. and Caldwell, M. M. 1 997. Shading reduces exploitation of soil nitrate and
phosphate by Agropyron desertorum and Artemisia tridentata from soils with
patchy and uniform nutrient distributions. Oecologia 109: 1 77-183.
Daly, G. T. 1990. The grasslands of New Zealand. Pp 1 -38 in: Pastures their ecology
and management, Langer R. H. M. ed. Oxford University Press.

46
Davies, A. and Evans, M. E. 1 990. Axillary bud development in white clover in
relation to defoliation and shading treatments. Annals of Botany 66:349-357.
Dear, B. S., Cocks, P. S., Wolfe, E. C. and Collins, D. P. 1998. Established perennial
grasses reduce the growth of emerging subterranean clover seedlings through
competition for water, light and nutrients. Australian Journal of Agricultural
Research 49:41 -5 1 .
Deinum, B., Van ES, A J. H. and Van Soest, P. J. 1 968. Climate, nitrogen and grass. IT.
The influence of light intensity, temperature and nitrogen on invivo digestibility
of grass and the prediction of these effects from some chemical procedures.
Netherland Journal of Agricultural Science 1 6:2 1 7-223.
Deinum, B., Sulastri, R. D., Zeinab, M. H. J. and Massen, A 1 996. Effects of light
intensity on growth, anatomy and forage quality of two tropical grasses
(Brachiaria brizantha and Panicum maximum var. trichoglume). Netherlands
Journal of Agricultural Science 44: 1 1 1 - 124.
Deregibus, V. A, Sanchez, R. A., Casal, J. J. and Trlica, M. J. 1 985. Tillering
responses to enrichment of red light beneath the canopy in a humid natural
grassland. Journal of Applied Ecology 22: 1 99-206.
Deregibus, V. A, Sanchez, R. A and Casal, J. J. 1 983. Effects of light quality on tiller
production in Lolium spp. Plant Physiology 72:900-902.
Dhukia, R. S., Shardha, R. and Bangarwa, K. S. 1 989. Forage productivity of faba bean
under various spacings of poplar (Poplus deltoides) trees in an agroforestry
system. FABIS Newslwtter 25:3 1 -32.
Ditschal, D. c., Collins, M. and Grove, J. H. 1 997. Black locust effects on forage yield
and nutritive quality produced on reclaimed mined land. Proceedings of the
XVIII International Grassland Congress, Canada. ID NO. 839.

47
Djimde, M., Torres, F. and Migongo-Bake, W. 1989. Climate, animals and agroforestry.
Pp 463-470 in: Meterology and agroforestry, Reifsnyder, W. S. and Damhofer,
T. O. ed. Proceedings of an international workshop on the application of
meteorology to agroforestry systems planning and management, 9- 13 February,
1 987. Nairobi, Kenya, International Council for Research in Agroforestry
(ICRAF).
Donaghy, D. J., Scott, J. M. and Fulkerson, W. J. 1997. Effect of defoliation frequency
and summer irrigation on survival of perennial (Lolium perenne) and biennial
(Lolium multiflorum) ryegrass in the subtropics. Australian Journal of
Experimental Agriculture 37:537-545.
Dunn, G. M., Lowe, K. F., Taylor, D. W. and Bowdler, T. M. 1994. Early tree and
pasture growth in an agroforestry system evaluating Albizia lebbeck, Casuarina
cunninghamiana, and Eucalyptus maculata in south-east Queensland. Tropical
Grasslands 28: 170- 1 8 1 .
Eason, W. R , Lavender, R , Clements, R 0., Duller, c., Gill, E. and Hislop, M. 1 997.
Silvopastoral agroforestry in upland and lowland UK grassland: Tree growth and
animal performance. Proceedings of XVIII International Grassland Congress,
Canada. ID NO. 123.
Eastham, J., Rose, C. W., Charles-Edwards, D. A., Cameron, D. M. and Rance, S. J.
1 990. Planting density effects on water use efficiency of trees and pasture in an
agroforestry experiment. New Zealand Journal of Forestry Science 20:39-53.
Ella, A., Stiir, W. W., Blair, G. J. and Jacobsen, C. N. 1 99 1 . Effect of plant density and
cutting frequency on the yield of four tree legumes and interplanted Panicum
maximum cv. Riversdale. Tropical Grasslands 25:28 1-286.

48
Eriksen, F. I. and Whitney, A. S. 198 1 . Effects of light intensity on growth of some
tropical forage species. I. Interaction of light intensity and nitrogen fertilization
on six forage grasses. Agronomy Journal 73 :427-433.
Everson, C.S., Everson, T. M. and Tainton, N. M. 1 988. Effects of intensity and height
of shading on the tiller initiation of six grass species from highland sourveld of
Natal. South African Journal of Botany 54:3 1 5-3 1 8.
Farnham, D. E. and George, J. R. 1994. Dinitrogen fixation and nitrogen transfer in
birdsfoot treefoil-orchard grass communities. Agronomy Journal 86:690-694.
Forde, M. B. , Hay, M. J. M. and Brock, J. L. 1 989. Development and growth of
temperate perennial legumes. in: Persistence of Forage Legumes, Marten, G. C.
ed. American Society of Agronomy, 9 1 - 1 1 0.
Frankow-Lindberg, B. E. 1 997. Assimilate partitioning in three white clover cultivars in
the autumn, and the effect of defoliation. Annals of Botany 79: 83-87.
Fraser, T. J. and Rowarth, J. S. 1 994. Wana cocksfoot: nitrogen effects on quantity and
qUality. Proceedings of the Agronomy Society of New Zealand 24:21 -24.
Fulkerson, W. J. and Slack, K. 1995. Leaf number as a criterion for determining
defoliation time for Lolium perenne: 2. Effect of defoliation frequency and
height. Grass and Forage Science 50: 1 6-20.
Gadgil, R. L., Charlton, J. F. L., Sandberg, A. M. and AlIen, P. J. 1988. Establishment
of selected legumes in a mid-rotation Pinus radiata plantation. New Zealand
Journal of Forestry Science 1 8:210-220.
Gadgil, R. L., Charlton, J. F. L., Sandberg, A. M. and AlIen, P. J. 1986. Relative growth
and persistence of planted legumes in a mid-rotation radiata pine plantation.
Forest Ecology and Management 14: 1 1 3- 1 24.

49
Gamier, E. and Roy, J. 1988. Modular and demographic analysis of plant leaf area in
sward and woodland populations of Dactylis glomerata and Bromus erectus.
Journal of Ecology 76:729-743.
Gi1christ, A N., DeZ Hall, 1. R., Foote, A G. and Bulloch, B. T. 1 993. Pasture growth
around broad-leaved trees planted for grassland stability. Proceedings of the
XVII International Grassland Congress , New Zealand: 2062-2063.
Givnish, T. J. 1 988 . Adaptation to sun and shade: a whole-plant perspective. Pp 62-92
in: Ecology of photosynthesis in sun and shade, Evans, J. R., Caemmerer, S. V.
and Adams rn, W. W. ed. CSIRO, Australia.
Goh, K. M., Mansur, I., Mead, D. J. and Sweet, G. B. 1996. Biological nitrogen fixing
capacity and biomass production of different understorey pastures in a Pinus
radiata pasture agroforestry systems in New Zealand. Agroforestry Systems
34:33-49.
Gordon, A M., Newman, S. M. and Williams, P. A 1997. Temperate agroforestry: An
overview. Pp 1 -8 in: Temperate Agroforestry System, Gordon, AM. and
Newman, S. M. ed. CAB International, Wallingford, U.K.
Gregory, N. G. 1 995. The role of shelterbelts in protecting livestock: A review. New
Zealand Journal of Agricultural Research 38:423-450.
Grubb, P. J., Lee, W. G., Kollmann, J. and Wilson, J. B. 1 996. Interaction of
irradiance and soil nutrient supply on growth of seedlings of ten European tall
shrub species and Fagus sylvatica. Journal of Ecology 84:827-840.

50
Grzegorczyk, S., Benedycki, S. and Grabowski, K. 1 996. Effect of the participation of
cocks foot on the yield and species composition of the sward of meadow
mixtures. Acta Academiae Agriculturae ac Technicae Olstenensis, Agricultura
No. 62: 1 15- 1 2 1 . (CAB Abstracts, text in Polish).
Guevara-Escobar, A, Kemp, P.D., Hodgson, J., Mackay, A.D. and Edwards, W.R.N.
1 997. Case study of a mature Populus deltoides-pasture system in a hill
environment. Proceedings of the New Zealand Grassland Association 59: 1 79-
1 85.
Han, Y. C., Park, M. S. and Seo, S. 1985. Studies on grassland development in forest. IT. Effect of fertilizer level on growth and dry matter yield of grass/clover mixtures
grown under pine trees. Journal of Korean Society of Grassland Science 5: 1 36-
142.
Harris, C. A, Blumenthal, M. J., Kelman, W. M. and McDonald, L. 1 997. Effect of
cutting height and cutting interval on rhizome development, herbage production
and herbage quality of Lotus pedunculatus cv. Grasslands Maku. Australian
Journal of Experimental Agriculture 37 :63 1 -637.
Havstad, L. T. 1 997. Effects of light intensity and defoliation on the receptiveness for
primary induction in Festuca pratensis huds. Proceedings of the XVIII
International Grassland Congress, Canada. ID NO. 9 1 3 .
Hawke, M. F. 1 99 1 . Pasture production and animal performance under pine agroforestry
in New Zealand. Forest Ecology and Management 45 : 1 09- 1 18 .
Hawke, M. F. and Knowles, R. L. 1 997. Temperate agroforestry systems in New
Zealand. Pp 85- 1 1 8 in: Temperate Agroforestry Systems, Gordon, A M. and
Newman, S. M. ed. CAB International, Wallingford, V.K.

5 1
Hawke, M. F. and Tombleson, J. D. 1993. Production and interaction of pastures and
shelterbelts in the central North Island. Proceedings of the New Zealand
Grassland Association 55: 193- 197.
Hay, M. J. M. and Newton, P. C. D. 1996. Effect of severity of defoliation on the
viability of reproductive and vegetative axillary buds of Trifolium repens L.
Annals of Botany 78: 1 1 7- 123.
Hay, M. J. M., Robin, Ch., Newton, P. C. D., Cresswell, A. and Tilbrook, J. 1997.
Effects of lowered light quality (R:FR ratio) at targeted organs on branching of
Trifolium repens. Proceedings of the XVIII International Grasslands Congress,
Canada. ID NO. 1 092.
Henderson, M. S. and Robinson, D. L. 1982. Environmental influences on yield and in
vitro true digestibility of warm season perennial grasses and the relationships to
fibre components. Agronomy Journal 74:943-946.
Hey, R. J. M. 1987. Understanding pasture growth. Pp 55-63 in: Dairy Farming
Annual. Massey, Palmerston North, New Zealand.
Hicks, D. L. 1995. Towards Sustainable Agriculture: Control of Soil erosion on
Farmland: A summary of erosion's impact on New Zealand agriculture, and farm
management practices which counteract it. MAF policy technical paper 95/4,
45p.
Hight, G. K., Sinclair, D. P. and Lancaster, R. J. 1 968. Some effects of shading and of
nitrogen fertilization on the chemical composition of freeze dried and oven-dried
herbage, and on the nutritive value of oven-dried herbage feed to sheep. New
Zealand Journal of Agricultural Research 1 1 :286-302.
Hocking, D. 1990. Farming with trees on sand country. Proceedings of the New
Zealand Grassland Association 5 1 :59-60.

52
Holmes, M.G. 1 98 1 . Spectral distribution of radiation within plant canopies. Pp 147- 1 58
in: Smith, H. ed. Proceedings of the First International Symposium of the British
Photobiology Society, Leicester.
Hopkins, A., Martyn, T. M., Johnson, R. H., Sheldrick, R. D. and Lavender, R. H. 1 996.
Forage production by two lotus species as influenced by companion grass
species. Grass and Forage Science 5 1 :343-349.
Huber, H. 1 996. Plasticity of intemodes and petioles in prostrate and erect Potentilla
species. Functional Ecology 1 0:401-409.
Huber, H. and Hutchings, M. J. 1 997. Differential response to shading in orthotropic
and plagiotropic shoots of the clonal herb Glechoma hirsuta . Oecologia
1 1 2:485-49 1.
Hughes, J. E., Morgan, D. C. and Black, C. R. 1985. Transmission properties of an oak
canopy in relation to photoperception. Plant, Cell and Environment 8 :509-5 16.
Hunt, W. F. and Easton, H.S. 1 989. Fifty years of ryegrass research in New Zealand.
Proceedings of the New Zealand Grassland Association 50: 1 1 -23 .
Hurley, R. H., Pompei, M. E., Clark-Ruh, M. B., Bara, R. F., Dickson, W. K. and Funk,
C. R. 1990. Registration of Laser' rough bluegrass. Crop Science 30: 1 357-
1 358.
Iason, G. R. and Rester, A. J. 1 993. The response of heather (Calluna vulgaris) to
shade and nutrients - predictions of the carbon-nutrient balance hypothesis.
Journal of Ecology 8 1 :75-80.

53
Jackson, L. E., Strauss, R. B., Firestone, M. K. and Bartolome, J. W. 1990. Influence
of tree canopies on grassland productivity and nitrogen dynamics in deciduous
oak savana. Agriculture, Ecosystems and Environment 32:89- 105.
Jacques, W. A. 1 974. Yorkshire fog (Holcus lanatus). Its potential as a pasture species.
Proceedings of New Zealand Grassland Association 35:249-257.
Jaswal, S. c., Mishra, V. K. and Verma, K. S. 1993. Intercropping ginger and turmeric
with poplar (Populus deltoides 'G-3' Marsh.). Agroforestry Systems 22: 1 1 1 -
1 17 .
Jefferson, P. G. and Muri, R. 1 997. Light quality effects on grass seedling growth and
development. Proceedings of the XVIII International Grassland Congress,
Canada. ID NO. 1 634.
Kang, J. H., Brink, G. E. and Rowe, D. E. 1995. Seedling white clover response to
defoliation. Crop Science 35: 1 406- 14 10.
Keating, B. A. and Carberry, P. S. 1 993. Resource capture and use in intercropping:
Solar radiation. Field Crops Research 34:273-301 .
Kellas, J . D., Bird, P. R., Cumming, K. N., Keamey, G. A. and Ashton, A. K. 1 995.
Pasture production under a series of Pinus radiata-pasture agroforestry systems
in south-west victoria, Australia. Australian Journal of Agricultural Research
46: 1285- 1297.
Kelliher, F. M., Marden, M., Watson, A. J. and Arulchelvan, I. M. 1 995. Estimating the
risk of landsliding using historical extreme river flood data (Note). Journal of
Hydrology (NZ) 33: 123- 1 29 .
Kephart, K. D. and Buxton, D. R. 1 993. Forage quality responses of C3 and C4
perennial grasses to shade. Crop Science 33:83 1 -837.

54
Kephart, K. D., Buxton, D.R. and Taylor, S. E. 1 992. Growth of C3 and C4 perennial
grasses under reduced irradiance. Crop Science 32: 1 033-1038.
Knowles, R. L. 1991 . New Zealand experience with silvopastoral systems: A review.
Forest Ecology and Management 45:25 1 -267.
Knowles, R. L., Brann, G. M. and Brann, G. J. 199 1 . An evaluation of agroforestry on
a Bay of Plenty hill country farm. Proceedings of the New Zealand Grassland
Association 53: 16 1 - 168 .
Knowles, R. L. Hawke, M. F. and Madaren, J. P. 1 995. Agroforestry research at
Tikitere. New Zealand Forest Service, Forest Research Institute. Ministry of
Agriculture and Fisheries, Field Research Division.
Langer, R. H. M. 1990. Pasture plants. Pp 39-76 in: Pastures their Ecology and
Management, Langer, R. H. M. ed. Oxford University Press.
Lambert, J. P., Boyd, A. F. and Brock, J. L. 1 974. An evaluation of five varieties of
Lotus pedunculatus Cav. Compared with ' Grasslands Huia' white clover under
grazing at Kaikohe. New Zealand Journal of Experimental Agriculture 2:359-
363.
Lawson, A. R., Kelly, K. B. and Sale, P. W. G. 1 997. Effect of defoliation frequency
on an irrigated perennial pasture in northern Victoria. 1 . Seasonal production and
sward composition. Australian Journal of Agricultural Research 48: 8 1 1 -8 17 .
Lee, H. J . , Kim, J. H., Yoo, J . W. and Kim, J. W. 1 992. Yield of pasture grass and
growth of upper trees by pasturage establishment under planted Korean pine.
Research Reports of the Forestry Research 44:87-96.

55
Lee, I. D. and Yun, I. S. 1988. Studies on the improvement and utilization of pasture in
the forest. I. The effect of shade degree and fertilization levels on the early
seedling growth and dry matter yield of forest pastures. Herbage Abstracts
58:2 1 1 .
Lee, J. S . 1 99 1 . The effects of shade and N fertilization on the dry matter yields of
orchard grass. Journal of the Korean Society of Grassland Science 1 1 : 1 75-1 8 1 .
LeVy, E. B . 1 970. Grassland of New Zealand. 3rd ed. Government printing, Welington.
324p.
Lolicato, S. and Rumball, W. 1 994. Past and present improvement of cocksfoot
(Dactylis glomerata L.) in Australia and New Zealand. New Zealand Journal of
Agricultural Research 37:379-390.
Ludlow, M. M. 1978. Light relations of pasture plants. Pp 35-49. In: Plant Relations in
Pastures, Wilson, J. R. ed. CSIRO, Australia, Melbourne.
Ludlow, M. M., Wilson, G. L. and Heslehurst, M. R. 1974. Studies on the productivity
of tropical pasture plants. V. Effect of shading on growth, photosynthesis and
respiration in two grasses and two legumes. Australian Journal of Agricultural
Research 25:425-433.
Mac1aren, J. P. 1 993. Radiata Pine Growers' Manual. New Zealand Forest Research
Institute. Griffith, J. and Bryce, I. ed. Forest Research Institute Bulletin No. 1 84.
Madden, E. A. and Harris, G. S. 1 96 1 . Identification of turf plants. in: Turf Culture. The
New Zealand Institute for Turf Culture. Pp 105- 106. Palmerston North, New
Zealand.
56
Matsunaka, T., Ishii, T. and Jin, M. 1997. Nitrogen in stubble as a limiting factor of
regrowth and yield of orchardgrass after cutting. Proceedings of XVI/I
International Grassland Congress, Canada. ID No. 269.
McCree, K J. 198 1 . Photosynthetically active radiation. Pp 41-55 in: Physiological
plant ecology I responses to the physical environment, Lange, O. L., Nobel, P.
S., Osmond, C. B. and Ziegler, H. ed. Encyclopedia of Plant Physiology, New
Series Volume 12A, Springer, Berlin, Heidelberg, New York.
McKenzie, H. M. 1996. "Policies and measures for common action." working paper 7
agriculture and forestry: Identification of options for net GHG reduction. Annex
I. Expert group on the UNFCCC. ed. OECD.OECD Environment Directorate,
Paris, France.
Miller, D. E. K, Gilchrist, A. N. and Hicks, D. L. 1996. The role of broadleaved trees
in slope stabilisation in New Zealand pastoral farming. Pp 96- 104 in: Mountains
of East Asia and the Pacific, Ralston, M. M., Hughey, K F. D. and O'Connor, K
F. ed. Centre for Mountain Studies, Lincoln University, Canterbury, New
Zealand.
Mitchell, P. L. and Woodward, F. I. 1 988. Responses of three woodland herbs to
reduced photosynthetic ally active radiation and low red to far-red ratio in shade.
Journal of Ecology 76:807-825.
Monteith, J. L. 1 98 1 . Does light limit crop production, Pp 23-38 in: Physiological
Processes Limiting Plant Productivity. Butterworth, London, 395p.
Moss, 1. R. J. 1 992. Measuring light interception and the efficiency of light utilization
by the coconut palm (Cocos nucifera). Experimental Agriculture 28:273-285.
Muire, J . P . and Pitman, W. D. 1989. Response of florida legume Galactia elliottii to
shade. Agroforestry Systems 9:233-239.

57
Murphy, J . S. and Briske, D. D. 1994. Density-dependent regulation of ramet
recruitment by the red:far-red ratio of solar radiation: A field evaluation with the
bunchgrass, Schizachyrium scoparium. Oecologia 97:462-469.
Nair, P. K. R. 1987. Agroforestry systems in major ecological zones of the tropical and
subtropics. Paper prepared for the ICRAF-WMO International Workshop on the
Application of Mateorology to Agroforestry Systems Planning and Management,
Nairobi, 9- 1 3 February, 1987.
Nair, P. K. R. and Dagar, J. C. 199 1 . An approach to developing methodologies for
evaluating agroforestry systems in fudia. Agroforestry Systems 1 6:55-8 1 .
New, E . 1 985. Coppicing. New Zealand Tree Grower 10( 1 ): 14- 18.
Newman, S. M. 1997. Poplar agroforestry in fudia. Forest Ecology and Management
90: 1 3- 17.
Ninemets, U. 1997. Role of foliar nitrogen in light harvesting and shade tolerance of
four temperate deciduous woody species. Functional Ecology 1 1 :5 1 8-53 1 .
NZMF (New Zealand Ministry of Forestry) . 1 995. Small forest management I . Special
purpose timber species. Ministry of Forestry.
Ong, C. K. 1996. A framework for quantifying the various effects of tree-crop
interactions. Pp 1 -23 in: Tree-crop interaction: A physiological approach, Ong,
C. K. and Huxley, P. ed. CAB futemational, Wallingford, UK, in association
with futernational Centre for Research in Agroforestry, Nairobi, Kenya.
Ong, C. K. and Marshall, C. 1979. The growth and survival of severely-shaded tillers in
Lolium perenne L. Annals of Botany 43: 1 47-1 55 .

58
Ong, e. K., Corlett, J. E., Singh, R. P. and Black, e. R. 1 99 1 . Above and below ground
interactions in agroforestry systems. Forest Ecology and Management 45 :45-57.
Paez, A., Gonzalez, O. M. E. and Villasmil, J. J. 1 997. Acclimation of Panicum
maximum to different light regimes. Effect of subsequent defoliation. Revista
de la Facultad de Agronomia, Universidad del Zulia 14:625-639. (CAB
Abstract).
Papanastasis, V., Koukoura, Z., Alifragis, D. and Makedos, I. 1995. Effects of thinning,
fertilisation and sheep grazing on the understory vegetation of Pinus pinaster
plantations. Forest Ecology and Management 77: 1 8 1 - 1 89.
Parfitt, R. L., Percival, H. J . , Dahlgren, R. A. and Hill, L. F. 1997. Soil and solution
chemistry under pasture and radiata pine in New Zealand. Plant and Soil
1 9 1 :279-290.
Park, M. S . , Seo, S., Han, Y.e. and Ryoo, J . W. 1987. Studies on grassland
development in the forest VI. Effect of shading degree on the correlations and
the variations of agronomic characteristics in the shoot and root parts of some
grasses. Journal of the Korean Society of Grassland Science 7:79-86. (CAB
Abstract).
Park, M. S . , Seo, S., Han, Y. C. and Lee, J. Y. 1988 . Studies on grassland development
in forest. VII. Effects of shading degrees on the early growth characteristics and
winter survival of main grasses. Herbage Abstracts 58:372.
Percival, N. S . , Bond, D. I., Hawke, M. F., Cranshaw, L. J . , Andrew, B. L. and Knowles,
R. L. 1 984a. Effects of radiata pine on pasture yields, botanical composition,
weed populations, and production of a range of grasses. Proceedings of a
technical workshop on agroforestry, May 1 984. Ministry of Agriculture and
Fisheries, Wellington. Pp 1 3-22.

59
Percival, N. S . , Hawke, M. F., Bond, D. I. and Andrew, B. L. 1 984b. Livestock carrying
capacity and perfonnance on pasture under Pin us radiata. Proceedings of a
technical workshop on agroforestry, May 1 984. Ministry of Agriculture and
Fisheries, Wellington. Pp 25-3 1 .
Pineiro, J . and Perez, M. 1988. Pasture species under pines. Pp 209-2 1 3 . Proceedings
of the 12th General Meeting of European Grassland Federation, Dublin, Ireland.
Pinto, M., Besga, G., Virgel, S . and Rodriguez, M. 1997. Management of soil fertility
and grass-pine interactions in silvopastoral systems. Proceedings of the XVIII
International Grassland Congress, Canada . ID NO. 1229.
Pollock, K. M., Lucas, R. J., Mead, D. J. and Thomson, S. E. 1 994. Forage-pasture
production in the first three years of an agroforestry experiment. Proceedings of
the New Zealand Grassland Association 56: 179- 1 85 .
Pollock, K. M., Lucas, R. J., Pownall, D. B . and Thomson, S . E. 1997. Temperate
pasture and sheep perfonnance under radiata pine and in open pasture.
Proceedings of the XVIII International Grassland Congress, Canada . ID NO.
464.
Pontailler, J. Y. and Genty, B. 1996. A simple red:far-red sensor using gallium arsenide
phospide detectors. Functional Ecology 10:535-540.
Pottinger, A. 1 993. The place of forestry in agriculture. Proceedings of the New
Zealand Grassland Association 55: 1 83- 1 86.

60
Power, I., Thorrold, B. , Balks, M., Dodd, M. and Nicholas, I. 1998. A Report on the
effects of Acacia melanoxylon on light quantity, pasture yield, pasture legume
content and soil chemical and physical status. New Zealand Tree Grower,
November 1998 Pp. 3-6.
Qarro, M. and Montard, FX-de. 1989. A study of rangeland productivity in the Ain
Leuh region (Middle Atlas, central plateau). I. The effects of cutting frequency
and relative tree cover on herbaceous production. Agronomie 9: 477-487.
Radc1iffe, J. E. 1 985. Shelterbelt increases dryland pasture growth. Proceedings of the
New Zealand Grassland Association 46:5 1-56.
Radc1iffe, J . E. 1 983. Grassland responses to shelter - a review. New Zealand Journal
of Experimental Agriculture 1 1 :5- 10.
Reategui, K., Vera, R. R., Loker, W. L. and Vasquez, M. 1 995. On farm grass-legume
pasture performance in the peruvian rainforest. Experimental Agriculture
3 1 :227-239.
Reed, K. F. M. and Sutherland, G. 1 996. Improving adaptation of perennial ryegrass,
tall fescue, phalaris, and cocks foot for Australia. New Zealand Journal of
Agricultural Research 39:457-464.
Rhodes, B . D . and Sharrow, S. H. 1990. Effects of grazing by sheep on the quality of
forage available to big game in Oregon's Coast Range. Journal of Range
Management 43: 235-237.
6 1
Richards, J . H. 1 993. Physiology of plants recovering from defoliation. Pp 46-54 in:
Grasslands for Our World, Barker, M. J. ed. SIR Publishing, Wellington, New
Zealand.
Richardson, B. , Vanner, A., Davenhill, N., Balneaves, J . , Miller, K. and Ray, J. 1993.
Interspecific competition between Pinus radiata and some common weed
species-first year results. New Zealand Journal of Forestry Science 23: 179- 1 93 .
Robinson, J . B . 1 99 1 . The growth of Chloris gayana within and adjacent to a plantation
of Eucalyptus grandis. Tropical Grasslands 25:287-298.
Rumball, W., Keogh, R. G. , Lane, G. E. , Miller, J. E. and Claydon, R. B. 1997a.
'Grasslands Lancelot' plantain (Plantago lanceolata L.). New Zealand Journal
of Agricultural Research 40:373-377.
Rumball, W., Miller, J. E. and Claydon, R. B. 1997b. 'Grasslands Tekapo' cocksfoot
(Dactylis glomerata L.). New Zealand Journal of Agricultural Research
40:365-367.
Rutkowska, B. and Lewicka, E. 1995. Development of reproductive shoots and feeding
value of cocksfoot and perennial ryegrass cultivars as a criterion for the time
periods of pasture utilization. Wiadomosci Instytutu Melioracjii Uzytkow
Zielonych 1 8 : 1 37- 150. (CAB Abstracts, text in Polish).
Samarakoon, S. P., Shelton, H. M. and Wilson, J. R. 1 990a. Voluntary feed intake by
sheep and digestibility of shaded Stenotaphrum secundatum and Pennisetum
clandestinum herbage. Journal of Agricultural Science 1 14: 1 43- 1 50.

62
Samarakoon, S. P., Wilson, 1. R. and Shelton, H.M. 1 990b. Growth, morphology and
nutritive quality of shaded Stenotaphrum secundatum, Axonopus compressus and
Pennisetum clandestinum. Journal of Agricultural Science 1 14: 1 6 1 - 1 69.
Sanderson, M. A., Stair, D. W. and Hussey, M. A. 1997. Physiological and
morhological responses of perennial forages to stress. Advance in Agronomy
59: 1 7 1 -224.
Scanlan, 1. C. and Burrows, W. H. 1990. Woody overstorey impact on herbaceous
understorey in Eucalyptus spp. Communities in central Queensland. Australian
Journal of Ecology 1 5: 191 - 197.
Schacht, W. H., Long, 1. N. and Malechek, J. C. 1 988. Above ground production in
cleared and thinned stands of semiarid tropical woodland, Brazil. Forest Ecology
and Management 23: 201-214.
Senanayake, S. G. I.N. 1 995. The effects of different light levels on the nutritive quality
of four natural tropical grasses. Tropical Grasslands 29: 1 1 1 - 1 1 4.
Seo, S., Lee, 1. K., Han, Y. C. and Lee, M. Y. 1990. Studies on the grassland
development in forest. XI. Effect of nitrogen fertilization on grass growth, yield
and botanical composition by growing season and growth stage in pasture under
shade condition. Journal of the Korean Society of Grassland Science 1 0: 89-95
(CAB Abstract).
. 63
Seo, S ., Han, Y. C. and Park, M. S. 1989. Grassland improvement and N fertilization
management of woodland in Korea. Proceedings of the XVI International
Grassland Congress Nice, France: 1487- 1488.
Sharrow, S. H. 1991 . Tree planting pattern effects on forage production in a Douglas-fir
agroforestry. Agroforestry Systems 16: 167- 175.
Shelton, H. M., Humphreys, L. R and Batello, C. 1987. Pastures in the plantations of
Asia and the Pacific: Performance and prospect. Tropical Grasslands 2 1 : 1 59-
1 68.
Shelton, H. M., Lowry, 1. B . , Gutteridge, R c., Bray, R A. and Wildin, 1. H. 1 99 1 .
Sustaining productive pastures in the tropics 7 . Tree and shrub legumes in
improved pastures. Tropical Grasslands 25 : 1 19- 1 28.
Sibbald, A. R, Griffiths, 1. H. and Elston, D. A. 199 1 . The effects of the presence of
widely spaced conifers on under-storey herbage production in the U.K. Forest
Ecology and Management 45:7 1 -77.
Smith, H. 1982. Light quality, photoperception, and plant strategy. Annual Review of
Plant Physiology 33 :48 1-5 1 8.
Smith, H. 198 1 . Adaptation to shade. Pp 159- 173 in: Physiological processes limiting
plant productivity, Butterworths, London. 395p.
Solangaarachchi, S. M. and Harper, 1. L. 1987. The effect of canopy filtered light on the
growth of white clover (Trifolium repens) . Oecologia 72:372-376.
Solhaug, K. A. 199 1 . Influence of photoperiod and temperature on dry matter
production and chlorophyll content in temperate grasses. Norwegian Journal of
Agricultural Sciences 5 :365-383.

64
Squire, G. R. 1990. The physiology of tropical crop production. CAB International,
Wallingford, Oxford, U.K.
Steele, K. W. and Percival, N. S . 1 984. Nitrogen fertilizer application to pastures under
Pinus radiata. New Zealand Journal of Agricultural Research 27: 49-55.
Stuart-Hill, G. C. and Tainton, N. M. 1989. The competitive interactions between
Acacia karroo and the herbaceous layer and how this is influenced by
defoliation. Journal of Applied Ecology 26:285-298.
Stfu, W. W. 199 1 . Screening forage species for shade tolerance- a preliminary report.
Pp 58-60. in: Forage for plantation crops, Shelton, H. M. and Stfu, W. W. ed.
ACIAR Proceedings No. 32, Canberra.
StUr, W. W. and Shelton, H. M. 1 99 1 . Review of forage resources in plantation crops
of Southeast Asia and the Pacific. Pp 25-3 1 . in: Forage for plantation crops,
Shelton, H. M. and Srur, W. W. ed. ACIAR Proceedings No. 32, Canberra.
Sturrock, 1. W. 1982. "The gnawing or destroying air" : New Zealand shelter research
needs. New Zealand Agricultural Science 1 6:23-26.
Sturrock, 1. W. 1990. Tree species for sheltering hill pasture: Some establishment
results from a North Canterbury site. Proceedings of the New Zealand Grassland
Association 5 1 :69-74.
Sugawara, K., Ogura, S. and Yashima, Y. 1997. White clover saponins and their
variation with shading or nitrogen application level. Proceedings of the
International Grassland Congress, Canada. ID NO. 1 5 1 8.
65
Sukanten, W., Nitis, I. M., Putra, S . and Lana, K. 1993. Effect of shrubs and trees on
growth and yield of Cenchrus ciliaris in the three-strata forage system.
Proceedings of XVII International Grassland Congress, New Zealand: 2053.
Taylor, T. H., Cooper, J. P. and Treharne, K. J. 1968. Growth responses of
orchardgrass (Dactylis glomerata L.) to different light and temperature
environments. I. Leaf development and senescence. Crop Science 8 :437-440.
Teuber, N. and Laidlaw, A. S. 1996. Influence of irradiance on branch growth of white
clover stolons in rejected areas within grazed swards. Grass and Forage Science
5 1 :73-80.
Teskey, R. o. and R. B. Shrestha. 1 985. A relationship between carbon dioxide,
photosynthetic efficiency and shade tolerance. Physioiogia Plantarum 63: 1 26-
1 32.
Thevathasan, N. V. and Gordon, A. M. 1997. Poplar leaf biomass distribution and
nitrogen dynamics in a poplar-barley intercropped system in Southern Ontario,
Canada. Agroforestry Systems 37:79-90.
Thompson, L. 1993. The influence of the environment around the node on
morphogenesis and growth of white clover (Trifolium repens). Grass and
Forage Science 48:27 1 -278.
Thompson, R. C. and Luckman, P. G. 1 993. Performance of biological erosion control
in New Zealand soft rock terrain. Agroforestry Systems 2 1 : 1 9 1 -2 1 1 .

66
Thorrold, B. , Knowles, R. L., Nicholas, I. D., Power, I. L. and Carter, J. L. 1997.
Evaluation of agroforestry options for tree species. Proceedings of the New
Zealand Grassland Association 59: 197 -190.
Toledo, J. M., Arrias, A and Schultze-Kraft, R 1989. Productivity and shade tolerance
of Axonopus spp. Paspalum spp. and Stenotaphrum secundatum in the Humid
Tropics. Proceedings of the XVI International Grassland Congress, Nice,
France: 221 -222.
Treeby, B. 1 978. Poplars:High quality stock food. Farm Forestry 20(4) : 1 10- 1 12.
Trustrum, N. A, Blaschke, P . M. 1 992. Managing hill country erosion. The New
Zealand Farmer. Farm Progress. June 10:45-47.
Turner, K. E., Belesky, D. P., Fedders, J. M. and Solomon, M. B. 1 998. Autumn
grazed orchardgrass-white clover pasture: Nutritive value of herbage and lamb
performance. Journal of Production Agriculture 1 1 :85-9 1 .
Tustin, J . R , Knowles, R . L, and Klomp, B . K. 1979. Forest farming: a multiple land
use production system in New Zealand. Forest Ecology and Management 2: 1 69-
1 89.
Vandenbeldt, R J., Brenner, A. J. and Sinclair, F. L. 1 990. Congress Report, Volume B .
Pp 292-302. Proceedings of J9h IUFRO World Congress, Montreal, Canada.
Canadian IUFRO World Congress Organizing Committee.
Vanloo, E. N., Schapendonk, A. H. C. M. and De Vos, A L. F. 1 992. Effects of
nitrogen supply on tillering dynamics and regrowth of perennial ryegrass
populations. Netherlands Journal of Agricultural Science 40:3 8 1-400.

67
Volaire, F. and Gandoin, J. M. 1996. The effects of age of the sward on the
relationship between water-soluble carbohydrate accumulation and drought
survival in two contrasted populations of cocks foot (Dactylis glomerata L.).
Grass and Forage Science 5 1 : 190- 1 98 .
Wall, A . J . , Mackay, A . D . , Kemp, P. D. , Gillingham, A. G . and Edwards, W. R. N .
1997. The impact of widely spaced soil conservation trees on hill pastoral
systems. Proceedings of the New Zealand Grassland Association 59: 1 7 1 - 1 77.
Walker, J . , Robertson, J. A. and Penridge, L. K. 1 986. Herbage response to tree thinning
in a Eucalyptus crebra woodland. Australian Journal of Ecology 1 1 : 1 35- 140.
Walters, M. B. and Reich, P. 1996. Are shade tolerance, surviVal, and growth linked?
Low light and nitrogen effects on hardwood seedlings. Ecology 77: 84 1 -853.
Warringa, J. W. and Kreuzer, A. D. H. 1 996. The effect of new tiller growth on
carbohydrates, nitrogen and seed yield per ear in Lolium perenne L. Annals of
Botany 78:749-757.
Watt, T. A. 1978. The biology of Holcus lanatus L. (Yorkshire fog) and its significance
in grassland. Herbage Abstract 48: 1 95-204.
West, G. G., Dean, M. G. and Percival, N. S. 199 1 . The productivity of Maku lotus as a
forest understorey. Proceedings of the New Zealand Grassland Association
53: 169- 173.
West, G. G. , Percival, N. S. and Dean, M. G. 1 988. Over sowing legumes and grasses
for forest grazing: interim research results. Pp 203-222. Forestry Research
Institute Bulletin No. 1 39, Rotorua, New Zealand.

68
Wild, D. W. M., Wilson, J. R. , Stili, W. W. and Shelton, H. M. 1 993. Shading increases
yield of nitrogen-limited tropical grass. Proceedings of the XVII International
Grassland Congress, New Zealand :2060-2062.
Wilson, J. R. 1997. Adaptive responses of grasses to shade: Relevance to turf grasses
for low light environments. International Turfgrass Society Research Journal 8:
575-59 1 .
Wilson, J . R. 1996. Shade-stimulated growth and nitrogen uptake by pasture grasses in
a subtropical environment. Australian Journal of Agricultural Research
47: 1075- 1093 .
Wilson, J. R., Catchpoole, C. R. and Weier, K. L. 1986. Stimulation of growth and
nitrogen uptake by shading a rundown green panic pasture on brigalow clay soil.
Tropical Grasslands 20: 1 34- 143.
Wilson, J. R. and Wild, D. M. 1 99 1 . Improvement of nitrogen nutrition and grass
growth under shading. Pp 77-82. in: Forage for plantation crops, Shelton, H. M.
and Srnr, W. W. ed. ACIAR proceedings No. 32, Canberra.
Wilson, J. R. and Wong, C. C. 1 982. Effects of shade on some factors influencing
nutritive quality of green panic and siratro pastures. A ustralian Journal of
Agricultural Research 33:937-949.
Wilson, J. R., Hill, K., Cameron, D. M. and Shelton, H .M. 1 990. The growth of
Paspalum notatum under the shade of a Eucalyptus grandis plantation canopy or
in full sun. Tropical Grasslands 24:24-28.
Wilson, J. R. and Ludlow, M. M. 1 99 1 . The environment and potential growth of
herbage under plantations. Pp 1 0-24. in: Forage for Plantation Crops, Shelton,
H. M. and Stilr, W. W. ed. ACIAR proceedings No. 32, Canberra.

69
Wilson, J. R. and Wild, D. M. 1 994. Nitrogen availability and grass yield under shade
environments. Pp 42-48. In: Integration of ruminants into plantation systems in
Southeast Asia, Mullen, B. F. and Shelton, H. M. ed. Proceedings of a workshop
at Lake Toba, North Sumatra, Indonesia, 9- 1 3 September.
Woledge, J . 1 972. The effect of shading on the photosynthetic rate and longevity of
grass leaves. Annals of Botany 36:55 1 -56 1 .
WoIters, G. L. 1982. Long leaf and slash pine decreases herbage production and alters
herbage composition. Journal of Range Management 35:761 -763.
Wong, C. c., Mohd. Sharudin, M. A. and Rahim, H. 1 985. Shade tolerance potential of
some tropical forages for integration with plantations: 1 . Grasses. MARID
Research Bulletin No. 1 3:225-247.
Wong, C. C. and Stilr, W. W. 1 996. Persistence of tropical forage grasses in shaded
environments . Journal of Agricultural Science 1 26: 1 5 1 - 1 59.
Wong, C. C. and Wilson, J. R. 1 980. Effects of shading on the growth and nitrogen
content of green panic and siratro in pure and mixed swards defoliated at two
frequencies. Australian Journal of Agricultural Research 3 1 :269-285.
Wood, P. J. 1990. The scope and potential of agroforestry. Outlook on Agriculture
19 : 1 4 1 - 146.
Yastrebov, A. B. 1989. Effect of Salix on vegetation cover of a meadow. Botanicheskii
ZhurnaI 74:476-486.

70
Young, A. 1 989. The Environmental basis of agroforestry. Pp 29-48. in: Meteorology
and agroforestry, Reifsnyder, W. S . and Damhofer, T. O. ed. Proceedings of an
international workshop on the application of meteorology to agroforestry
systems planning and management, 9- 1 3 February, 1 987. Nairobi, Kenya,
International Council for Research in Agroforestry (ICRAF).
Yunusa, A. M., Mead, D. l., Pollock, K. M. and Lucas, R. l. 1 995. Process studies in a
Pinus radiata pasture agroforestry system in a subhurnid temperate environment.
I. Water use and light interception in the third year. Agroforestry Systems
32: 1 63- 1 83.

3. Screening pasture species for shade tolerance
7 1
Page
3.1 SUMMARY ............................................................................................................ 72
3.2 INTRODUCTION .................................................................................................. 73
3.3 MATERIALS AND METHODS ..... ..................................................................... 74
3.4 RESULTS ................ ........................... .................................................................... 76
3 .4. 1 Growth environment . . . . . . . . . . . . . . . . . . . . . . . . . . . . . . . . . . . . . . . . . . . . . . . . . . . . . . . . . . . . . . . . . . . . . . . . . . . . . . . . . . . . . . . . . . 76
3 .4.2 Plant growth . . . . . . . . . . . . . . . . . . . . . . . . . . . . . . . . . . . . . . . . . . . . . . . . . . . . . . . . . . . . . . . . . . . . . . . . . . . . . . . . . . . . . . . . . . . . . . . . . . . . . . . 76
3 .4.3 Specific leaf area (SLA) . . . . . . . . . . . . . . . . . . . . . . . . . . . . . . . . . . . . . . . . . . . . . . . . . . . . . . . . . . . . . . . . . . . . . . . . . . . . . . . . . . . . 79
3 .4.4 I..eaf area . . . . . . . . . . . . . . . . . . . . . . . . . . . . . . . . . . . . . . . . . . . . . . . . . . . . . . . . . . . . . . . . . . . . . . . . . . . . . . . . . . . . . . . . . . . . . . . . . . . . . . . . . . . . 79
3 .4.5 Tiller and branch numbers per plant . . . . . . . . . . . . . . . . . . . . . . . . . . . . . . . . . . . . . . . . . . . . . . . . . . . . . . . . . . . . . . . . . . 79
3 .4.6 Ranking pasture species for shade tolerance . . . . . . . . . . . . . . . . . . . . . . . . . . . . . . . . . . . . . . . . . . . . . . . . . . . . . 8 1
3.5 DISCUSSION ......................................................................................................... 83
3.6 CONCLUSIONS ......... ......................................... .................................................. 87
3.7 REFEREN CES ....................................................................................................... 88
This chapter is based on a paper published in the Proceedings Agronomy Society of New Zealand 27: 1 19-
1 28 (Devkota et at. 1997)

72
3.1 Summary
The effects of shade on tillering ability as well as biomass production of hill pasture
species which differed in morphology and for shade tolerance were determined. A split
plot design with four replicate blocks was employed for the experiment, in which five
levels of shade were applied with in 1 .25 x 0.84 x 0.45 m metal frames covered by
Sarlon cloth to shade light from all directions. The main plot treatments were 1 4, 1 8 ,
27, 43, and 73% of the ambient photosynthetically active radiation (PAR). Ten different
pasture species: Dactylis glomerata L. cv. Grasslands Wana; Lolium perenne L. cv.
Grasslands Nui, high endophyte; Holcus lanatus L. cv. Massey Basyn; Plantago
lanceolata L. cv. Grasslands Lancelot; Festuca arundinacea Schreb. cv. Grasslands
Advance; Agrostis capillaris cv. Grasslands Muster; Poa trivia lis cv. Sabre; Trifolium
repens L. cv. Grasslands Tahora, Trifolium subterraneum, L. cv. Karridale; and Lotus
uliginosus cv. Grasslands Maku were grown in pots as subplots. Twelve to fourteen
plants were maintained per pot, and plants were watered daily. Water and fertilizer
were non-limiting. The experiment ran from 5 June to 6 September 1996. Shoot dry
weight, tillers/runners/stolons/number of branches per plant, and specific leaf area were
determined at IS-day intervals for 5 harvests. At each harvest, plants were clipped to 50
mm height. Shade had a marked effect on tillering ability of all grass plants. However,
mean tiller numbers per plant at the final harvest in the lowest PAR (14% ambient) were
significantly higher (P<O.OOOI ) for Holcus lanatus (4) and Dactylis glomerata (4) than
for the other grass species. Similarly, Lotus uliginosus produced a higher (p<O.OOOI )
number of branches (4) in 14% ambient PAR than other legumes. This trend was also
observed for relative tiller numbers per plant (to that of 73% ambient PAR), where
Dactylis glomerata had about 20% of its tiller production in the highest level of shade
( 14% ambient PAR) compared with Lolium perenne which had 5%. The results are
discussed in terms of the desired attributes of shade tolerant pasture species.

73
3.2 Introduction
Large areas of land used for agriculture in New Zealand are susceptible to soil erosion
(Clough and Hicks 1 993). One technology to cope with this situation has been the
planting of conservation trees, particularly poplars and willows (Anonymous 1 995;
Miller et al. 1996). The impact of shading by these trees on the productivity and
persistence of hill pastures has received little research attention (Hawke 1 99 1 ; Knowles
1 99 1 ; Pollock et al. 1 994). However, research with widely spaced Pinus radiata has
suggested that Holcus lanatus L., Dactylis glomerata L. and Lotus uliginosus are more
shade tolerant than other hill pasture species (Seo et al. 1989; West et al. 1 991 ).
Shading is the most significant factor determining the output from pastures grown in
plantations (Shelton et al. 1 987). Decreasing irradiance reduces the growth of pasture
species and influences the outcome of competitive relations between plant species
(Shelton et al. 1987). Low irradiance also affects morphological attributes of pasture
species, through altered partitioning of photosynthate which may impact on productive
performance (Kephart and Buxton 1993). The abilities of plants to regenerate leaf area
to maximise interception of available radiation, and to generate tillers and stolons from
main stems, are the critical factors that determine production and persistence of pasture
species under low irradiance (Chen 1993).
Tree shade also affects the quality of transmitted light, decreasing the ratio of red to far
red wavelengths (R:FR). Effects of R:FR on the productive performance of pasture
plants have been widely reported (Thomson 1993; Murphy and Briske 1 994; Teuber
and Laidlaw 1996). In general, low R:FR stimulates morphological changes, such as
increased plant height and reduced tillering.
Despite research on the impact of shade on the performance of pasture species (Eriksen
and Whitney 198 1 ; Samarakoon et al. 1 990; Kephart and Buxton 1 993) there is little
information available on effects of a range of light intensities, particularly at low levels
of transmitted light (high levels of shade) found under mature stands of conservation
trees on the growth and morphology of hill pasture species. This study aimed to screen
hill pasture species for their biomass and morphological responses to a range of levels

74
of transmitted photosynthetically active radiation (PAR) in glasshouse conditions. This
was part of a programme to determine suitable pasture species for silvo-pastoral
systems based on deciduous trees. Accordingly, three legume species, six grass species,
and one herb species were chosen for their different morphological characteristics and
observed responses to shade.
3.3 Materials and methods
The experiment was conducted from 5 June to 6 September 1 996 (95 days) at the Plant
Growth Unit (PGU), Massey University. A split-plot design was used with four
replicate blocks: the main plots were shade treatments and subplots were pasture
species. Plants were grown under control conditions (without shade) or under a range of
shade levels. Shade levels were imposed by differing densities of neutral shade cloth
(Sarlon) supported on hollow metal frames ( 1 .25xO.84x0.45 m) arranged on benches
that were 0.9 m above the ground. The shade frames were aligned in a north-south
direction and completely enclosed the pots. Five levels of transmitted photosynthetically
active radiation (PAR: J.1I1loles photons m-2 S-I , 400-700 nm) were created. The
transmitted PAR for the five treatments was 73, 43, 27, 1 8, and 14% of the ambient
PAR under full sun light as determined on a daily basis from 1 200 to 1 300 h throughout
the experiment using a LI-COR (Model LI- 1 85) quantum sensor. The treatment with
73% ambient PAR, or 27% shade, was not covered by shade cloth, as this was the
percentage of ambient PAR transmitted through the glasshouse. PAR was measured
inside and outside the glasshouse simultaneously. Red:Far Red (R:FR) ratio during clear
sky days was measured three times a day (morning, afternoon, and evening) with a Skye
sensor, inside and outside the glasshouse, and under the shade cloth treatments.
Details of the pasture species and cultivars used are given in Table 3 . 1 . Seeds of pasture
species were sown on 4 June 1 996 in PB 5 (3 litre capacity) black polypots filled with
potting mix (80% tree bark + 20% pumice), and always kept under their allocated shade
treatments. Dolomite 300 g, agricultural lime 300 g, iron sulphate 50 g, and Osmocote
plus ( 1 6 N-3 .5 P- 1O.8 K) 400 g per 100 litre were blended with the potting mix, which
was rated for medium to long term « 9 months) greenhouse crops. Twelve to fourteen-

Table 3 . 1 Pasture species and cultivars used in the experiment.
Pasture species
1 . White clover (Trifolium repens L.) cv. Grasslands Tahora 2. Lotus (Lotus uliginosus) cv. Grasslands Maku 3. Subterranean clover (Trifolium subterraneum L.) cv. Karridale 4. Browntop (Agroslis capil/aris) cv. Grasslands Muster 5 . Cocksfoot (Dactylis glomerala L.) cv. Grasslands Wana 6. Yorkshire fog (Holcus /anatus L.) cv. Massey Basyn 7 . Tall fescue (Festuca arundinacea Schreb) cv. Grasslands Advance 8. Perennial ryegrass (Lolium perenne L.) cv. Grasslands Nui 9. Poa trivialis (Poa trivialis) cv. Sabre 1 0. Plantain (Plantago lanceolata L.) cv. Grasslands Lancelot
75
plants were maintained per pot, and plants were watered daily. The pots within cages
were re-randomized weekly. Seeds of legumes were inoculated with the appropriate
strain of Rhizobium.
The glasshouse temperature was maintained at 25°C until seeds of all plants were fully
germinated. Thereafter, day temperature was 1 5- 170C and night temperature 8-100C.
The first harvest was on 1 0 July, 35 days after sowing. Subsequent harvests were on 25
July, 9 August, 23 August, and 6 September. At each harvest, all the plants were clipped
to 50 mm above the media surface. Shoot material above 50 mm was dried at 70° C for
24 hours and weighed, and added to the above ground shoot mass at the final harvest.
From the 25 July harvest onwards, five fully expanded leaves were randomly taken
from each pot to measure leaf area, and leaf dry weight for estimation of specific leaf
area. At each harvest, the number of tillers per pot for grasses and branches per pot for
legumes were counted. Plant height and leaf/petiole length were also measured at each
harvesting date. Specific leaf area was analysed by considering harvests as repeated
measures. Statistical analysis was by analysis of variance using the GLM model of a
SAS package (SAS Institute Inc. 1989), and the linear regression of shoot weight and of
relative shoot weight with the percent of transmitted PAR using SAS. Treatment means
were compared with Fisher's protected LSD test at a. = 0.05 (Steel and Torrie 1 980).
Data transformations were not required.

76
3.4 Results
3.4.1 Growth environment
Mean PAR at noon in the shade treatments was 3 1 8, 1 88, 1 17, 8 1 , and 60 JlIDoles
photons m-2 S
-l resulting in 73, 43, 27, 18 , and 14% PAR transmitted, respectively. The
mean ambient PAR outside the glasshouse was 432 J.1II1oles photons m-2 S
-l. R:FR ratio
at noon inside the glasshouse was 1 .3 to 1 .4, while outside it was 1 .4. There was no
effect of shade cloth on R:FR.
3.4.2 Plant growth
The shoot dry weight per plant of all legumes and grasses showed a significant
(P<O.OOOl ) linear increase with % PAR transmitted, producing their highest yield at
73% PAR and lowest at 14% PAR (Fig. 3 . 1 ) . At 73% PAR, perennial ryegrass had the
highest shoot dry weight per plant ( 1 1 13 .8 mg), and lotus the least (277.4 mg).
However, at the lower level of PAR (14%), subterranean clover shoot dry weight (22. 1
mg/plant) was higher (P<O.OOOl ) than white clover ( 13.5 mg/plant), and comparatively
better than that of lotus ( 1 7.4 mg/plant). Yorkshire fog (29.7 mg/plant) produced the
highest shoot dry weight at low PAR ( 14%) followed by perennial ryegrass (24.7
mg/plant), and cocksfoot (22.3 mg/plant), whereas browntop (6.3 mg/plant) and Poa
( 10.8 mg/plant) had the lowest shoot dry weight of the grasses (Fig. 3 . 1 ).
The response of relative shoot dry weight of the species to shading differed from that
for absolute shoot dry weight. The three legume species produced relatively more shoot
dry weight at all levels of shade than the grass species and plantain (Fig. 3 .2a, b, c).
Within the legumes, the relative shoot dry weight of lotus increased in comparison to
subterranean clover and white clover as the intensity of shade increased (Fig. 3 .2a).
Within the grass species, the relative shoot dry weight of cocks foot and Yorkshire fog
was greater than that of the other grass species at 14, 1 8 and 27% PAR transmitted (Fig.
3 .2b, c).
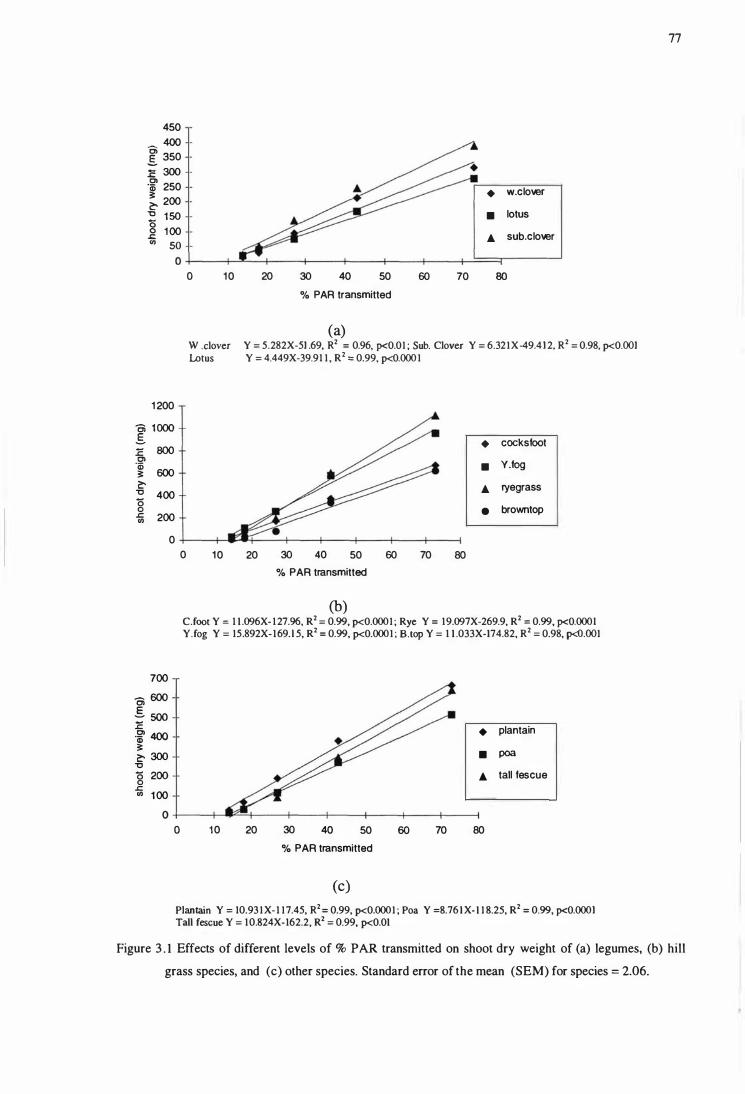
450 � 400 � 350 � 300 .� 250 � 200 ?:"0 150 '8 100 .c <Il 50
• w.clowr
• lotus
• sub.clowr
0 +---���---+--�----+---4---��=1----�
1 200 0; 1000 E-l: 800 Cl 'CD 600 � ?:-
-0 400 '0 0
.c 200 '" 0
700 0; 600 � 500 .c .�
400 � ?:- 300
-0 '0 200 0
.c '" 100
0
o 10 20 30 40 50 60 70 80 % PAR transmitted
(a) W .clover Y = S.282X-SJ .69, R2 = 0.96, p<O.OI ; Sub. Clover Y = 6.32 I X -49.4 l 2, R2 = 0.98, p<O.OOJ Lotus Y = 4.449X-39.91 I , R2 :: 0.99, p<O.OOO I
• cocksfoot
• YJog • ryegrass
• browntop
10 20 30 40 50 60 70 80 % PAR transmitted
(b) C.foot Y :: 1 l .096X- 1 27.96, R2 = 0.99, p<O.OOOI ; Rye Y = 19.097X-269.9, R2 = 0.99, p<O.OOOI Y.fog Y = IS.892X- 1 69. l S, R2 = 0.99, p<O.OOOI ; B.top Y = 1 1 .033X-174.82, R2 = 0.98, p<O.OOI
• plantain
• poa
• tall fescue
O+---����--�-----r----+----+----+---� o 10 20 30 40 50 60 70 80
% PAR transmitted
(c)
Plantain Y = 10.93 I X- 1 I 7.4S, R2 = 0.99, p<O.OOOI ; Poa Y =B.76 1 X- l I B.25, R2 = 0.99, p<O.OOOl Tall fescue Y = 1 0.B24X-162.2, R2 = 0.99, p<O.Ol
77
Figure 3 . 1 Effects of different levels of % PAR transmitted on shoot dry weight of (a) legumes, (b) hill
grass species, and (c) other species. Standard error of the mean (SEM) for species = 2.06.

80 1: 70 Cl 'ij) 60 ::: (5 50 0
� 40 '" CD 30 > � 20 � � 0 1 0
0
70 -§, 60 'ij) 50 ::: (5 40 0 � '" CD 30 > � 20 � � 0 1 0
0
60 -§, 50 'ij) ::: (5 40 0 � 30 '" CD > .� 20 � � 0 1 0
0
0 10 20 30 % PAR transmitted
(a)
40 50
• lotus
• w. clo�r
... sub.clo�r
W .clover Y = 2.237X-29.264, R2 = 0.097, p<O.OOI ; Sub.c1over Y = 2.24I X-26.295, R2
= 0.99, p<O.OO) Lotus Y = 1 .849X-20.987, R2
= 0.%, p<0.01
• c.foot
• Y.fog
... browntop
• ryegrass
0 10 20 30 40 50 % PAR transmitted
(b)
C.foot Y == 1 .768X-21 . 805, R2 = 0.99, p<O.OO I ; Rye Y = 1 .804X-26.34, R2
== 0.97, p<0.01 Y.fog Y = I .964X-24.709, R2
= 0.99, p<O.OOI; B.top Y = 1 .859X-30. l 2, R2 == 0.94, p<O.05
• plantain
• poa ... tall fescue
0 10 20 30 40 50 % PAR transmitted
(c)
Plantain Y = 1 .880X-22.659, R2 = 0.99, p<O.OOI ; Poa Y = 1 .758X-24.366, R2
= 0.99, p<O.OOI Tall fescue Y = 1 .499X-20.%8, R2
= 0.96, p<O.OI
78
Figure 3.2 Effects of different levels of %PAR transmitted on relative (to that of 73% PAR transmitted)
shoot dry weight of (a) legumes, (b) hill grass species, and (c) other species. Standard error of
the mean (SEM) for species = 0.3.

79
3.4.3 Specific Leaf Area (SLA)
Specific leaf area over all harvests increased (P<O.OOOl) with decreasing % PAR
transmitted for all species. There waS a significant interaction between shade level and
species. The SLA of subterranean clover and cocks foot were comparatively
unresponsive to the % PAR transmitted, whereas the SLA of Yorkshire fog increased at
only 14% PAR transmitted (Fig 3.3a, b). On the other hand, the SLA of Poa, and
browntop increased as % PAR decreased, but at 14% PAR their SLA was less than at
27% PAR (Fig 3 .3c). The SLA of white clover, lotus, perennial ryegrass, tall fescue and
plantain all increased with decreasing % PAR (Fig 3.3a, b, c).
3.4.4 Leaf area
Per plant leaf area over all harvests also increased significantly (P<O.OOOl ) with
increasing PAR in all pasture species (Table 3.2). In 73% PAR, Yorkshire fog had the
highest leaf area ( 1 1 8.7xl O-4m2) followed by perennial ryegrass (96.0xlO-4 m2) and
cocksfoot (94.7xlO-4m2) while lotus had the lowest (4 1 .5x1 O-4m2). However, under
dense shade ( 14% PAR), the highest leaf area was produced by Yokshire fog (8.0xl O-
4m2) which was followed by lotus (6.3xlO-4m2), plantain (5.0xl O-4m2) and cocksfoot
(3 .8x lO-4m2). Browntop, Poa and tall fescue produced lowest leaf area (Table 3.2).
3.4.5 Tiller and branch numbers per plant
The main effects and the interaction between shade and species for tiller and branch
numbers per plant were significantly different (P<O.OOOl ) in absolute as well as in
relative terms (Table 3.2). At final harvest, the highest number of tillers in 73% ambient
PAR was produced by Yorkshire fog (39) followed by Poa (35) and browntop (30).
Under the highest shade ( 1 4% ambient PAR transmitted), cocksfoot and Yorkshire fog
and lotus produced the greatest number of tillerslbranches (4), while subterranean
clover, white clover, plantain and tall fescue did not produce any branches/tillers.

80 70
0> .>< 60 N-E '" 50 � « - 40 '" Q)
...J 30 0 ""
.� 20 0-(IJ
1 0 0
o
w.clo\er o lotus . sub.clo\er I
L_� --+ --+ -+ -+ ---j
14 18 27 43 73 % PAR transmitted
(a)
--+ --+ --+
14 18 27 43 73 % PAR transmitted
(b)
-r -+
1 4 1 8 27 43 % PAR transmitted
(c)
73
o ryegrass [] cocksfoot . Y.fog
O plantain
O poa
. browntop
• tall fescue
80
Figure 3.3 Specific leaf area (m2/kg) of (a) legumes, (b) hill grass species, and (c) other species by
repeated analysis. Vertical bar represents standard error of the mean for species (0.29).

8 1
Grasses like Po a, browntop and Yorkshire fog produced more number of tillers than the
number of branches produced by legumes in 73 and 43% ambient PAR. This trend
continued, for cocksfoot, Yorkshire fog, and Po a, as PAR decreased to 27 and 1 8%
ambient PAR (increased shade). However, at the lowest PAR level ( 14% transmission),
lotus, Yorkshire fog, and cocks foot all produced a similar number of branches or tillers,
whereas the number of tillers produced by Poa was lower. Among the grasses, ryegrass
produced one tiller per plant, and tall fescue none in 14% ambient PAR (Table 3 .2).
Among legumes, lotus always produced a higher number of branches per plant than
white clover and subterranean clover in 73% (27% shade) to 1 8% (86% shade) ambient
PAR. However, at 14% ambient PAR, only lotus produced branches (Table 3 .2).
The response of relative tiller or branch numbers to PAR was different from absolute
tiller or branch numbers. Relative to 73% PAR, browntop (99%) followed by lotus
(85%), subterranean clover (78%) cocksfoot (76%), and white clover (76%) produced
more tillers or branches at 43% ambient PAR. All other species produced about 60-70%
of the tillers or branches at 43% ambient PAR relative to 73% ambient PAR. At 27, 1 8
and 14% ambient PAR, cocksfoot produced relatively more tillers than the other species
(Table 3 .2). The relative tillering of Yorkshire fog and Poa was similar at the three
lower levels of PAR, intermediate between that of cocksfoot and tall fescue and
ryegrass (Table 3 .2). Among the legumes, relative branching was decreased by low
PAR in a similar fashion to the better performed grasses, the exception being at 14%
PAR where lotus was the least affected species after cocks foot, but white and
subterranean clovers produced no branches (Table 3.2).
3.4.6 Ranking pasture species for shade tolerance
Ranking of pasture species for shade tolerance on the basis of relative tillers or branches
per plant and leaf area per plant in light shade (43 % ambient PAR) and in dense shade
( 14 % ambient PAR) indicated that Yorkshire fog and cocks foot among the grasses and
lotus of the legumes were the most shade tolerant. Browntop was shade tolerant in light
shade, but tall fescue was the least shade tolerant species at 1 4% ambient PAR (Table
3 .3 ) . Plantain was intermediate in its ranking for shade tolerance.

Table 3 . 2 Effects of shade on pasture species tiller or branch numbers per plant, their relative values (to that of
73% PAR ), and leaf area at final harvest under glasshouse conditions, 1996.
82
% PAR / species Tillers or branches per Relative tillers or branches Leaf area (m2 xIO·4) plant per plant plant
73% PAR White clover 1 4 42.7 Lotus 27 41 .5 Subterranean clover 9 52.4 Browntop 30 72.7 Cocksfoot 1 8 94.7 Yorkshire fog 39 1 18.7 Tall fescue 1 5 66.8 Plantain 4 82.6 Perennial ryegrass 24 96.0 Poa trivialis 35 8 1 .3 43% PAR White clover I I 76 33.5 Lotus 23 85 35.4 Subterranean clover 7 78 35.7 Browntop 30 99 56.4 Cocksfoot 1 4 7 6 7 1 . 1 Yorkshire fog 28 7 1 1 30.4 Tall fescue 1 1 73 38.8 Plantain 2 58 71 .3 Perennial ryegrass 1 6 65 70.5 Poa trivialis 24 69 40.0 27% PAR White clover 7 50 20. 1 Lotus 1 3 46 22.9 Subterranean clover 4 47 16.5 Browntop 9 3 1 1 3.0 Cocksfoot 1 2 65 34.3 Yorkshire fog 1 8 45 55.2 Tall fescue 4 25 10.4 Plantain 2 55 39.0 Perennial ryegrass 5 20 23.1 Poa tri vialis 1 5 43 20.9 18% PAR White clover 3 23 5.2 Lotus 6 23 \3 .6 Subterranean clover 3 29 6.8 Browntop 3 1 1 1 .8 Cocksfoot 7 36 17 . 1 Yorkshire fog 1 0 24 23.8 Tall fescue 3 22 3.8 Plantain 0 0 \3 .4 Perennial ryegrass 3 1 3 1 6.6 Poa tri vialis 6 1 7 5.0 14% PAR White clover 0 0 2.4 Lotus 4 1 6 6.3 Subterranean clover 0 0 3.2 Browntop 2 8 0.4 Cocksfoot 4 1 9 3.8 Yorkshire fog 4 9 8.0 Tall fescue 0 0 0.9 Plantain 0 0 5.0 Perennial ryegrass 1 4 1 .9 Poa trivialis 3 9 0.7 Analysis of variance Shade P (A) <0.0001 <0.0001 <0.0001 Species P (B) <0.0001 <0.0001 <0.0001 Interactions P (A *B) <0.0001 <0.0001 <0.0001 LSD (P <0.05) for shade 0.8 1 4. 1 5 2.90 LSD (P <0.05) for species 0.68 3 . 3 1 1 .94 SEM for shade (d.f. = 4) 0.26 1 .29 (d.f.=3) 0.94 SEM for species (dJ. = 9) 0.24 1 . 1 8 (d.f.=9) 0.69 SEM for A*B (d.f.= 36) 0.54 2.36 (d.f.=27) 1 .55
LSD: Least significant difference, SEM= standard error of the mean, d.f.= degrees of freedom
per

Table 3 .3 Rank of pasture species for their shade tolerance on the basis of relative tillerslbranches
per plant (to that of 73% PAR), and leaf area at 43% and 14% PAR at final harvest under glasshouse
conditions, 1 996.
Pasture species
Browntop Lotus S ubterranean clover Cocksfoot White clover Tall fescue Yorkshire fog Poa trivialis Perennial rye grass Plantain
3.5 Discussion
43 % PAR Relative tillers or branches
1 2 3 4 4 6 7 8 9 1 0
Leaf area (m2 xlO-4) per plant
5 9 8 3 10 7 1 6 4 2
1 4 % PAR Relative Leaf area (m2
tillers or x l O-4) per branches plant
5 10 2 2 7 5 1 4 7 6 7 8 3 1 3 9 6 7 7 3
83
A shade tolerant pasture species needs to have good annual and seasonal dry matter
production under defoliation, and to be able to regenerate. In this screening experiment
the most shade tolerant species were those that maintained a comparatively high
absolute and relative shoot yield in low PAR, due to maintaining a higher leaf area and
higher relative numbers of tillers or branches. On these criteria Yorkshire fog and
cocks foot were the most shade tolerant grasses, and lotus the most shade tolerant
legume. Among the grasses tall fescue, perennial ryegrass and Poa trivialis exhibited
poor shade tolerance. Browntop was one of the lowest ranked grass species in heavy
shade, but was more tolerant of light shade, in terms of tillering, but not in terms of
shoot yield. Lotus was the most shade tolerant legume at higher shade levels, but its
shoot yield was less than that of white clover and subterranean clover possibly because
lotus takes longer to establish than other legumes, so the shoot yield of lotus in long
term may not differ. Plantain ranked in the middle of the species screened for shade
tolerance.
Seo et al. ( 1989) found that under pine trees, cocks foot was the most shade tolerant
species and that it persisted well . West et al. ( 199 1 ) found that initial stands of pure

84
Maku lotus changed to progressively to a mixture of Yorkshire fog, and reported
Yorkshire fog as a shade tolerant grass. Gadgil et al. ( 1 986), West et al. ( 1 988), and
West et al. ( 1 99 1 ) all indicated that lotus is one of the most successful legumes under
shade, and can be readily established on a range of sites. This experiment also showed
that lotus was the best legume to grow under heavy shade.
Perennial ryegrass (Figure 3 .4a) and white clover were more affected by shade than
cocksfoot (Figure 3 .4b), Yorkshire fog and lotus. Percival et al. ( 1984) in their study on
pasture yield under radiata pine, also reported that the yields of ryegrass and white
clover declined with increasing tree density (higher level of shade) and these species
were mainly replaced by annual grasses and Yorkshire fog. Likewise, Brauen et al.
( 1 993) reported that browntop grows well only in full sun or moderate shade. Poa
trivialis has been reported to have good tolerance of cool shade (Hurley et al. 1 990; Bar
and Schulz 1 995), but this was not shown in this experiment. Similarly, subterranean
clover has been reported by Lodge ( 1996) as being shade tolerant at seedling
emergence, and as mature plants, and Pardini et al. ( 1 995) found that subterranean
clover under forest cover in productive and non-productive Mediterranean sites was
shade tolerant. However, results from this experiment showed that subterranean clover
may only be tolerant of moderate shade. Additionally, it was observed that subterranean
clover etiolated faster in the shade in comparison to lotus, which would make it
susceptible to having its growing points grazed.
The comparatively greater shoot dry weights of Yorkshire fog and cocksfoot in heavy
shade could be associated with their ability to produce more tillers in absolute as well as
in relative terms (Table 3 .2). Yorkshire fog and cocksfoot also had a greater leaf area in
heavy shade conditions than the other grasses. Cocks foot specific leaf area was less
responsive to low light than the other grasses, suggesting it has a different adaptive
mechanism to low light. Possibly, the shade tolerance of lotus was related to its upright
growing habit, which would facilitate greater interception of PAR in comparison to
other legumes. Lotus can form new plants from rhizomes (West et al. 1 99 1) which
could also be an added advantage for better persistence under shade.
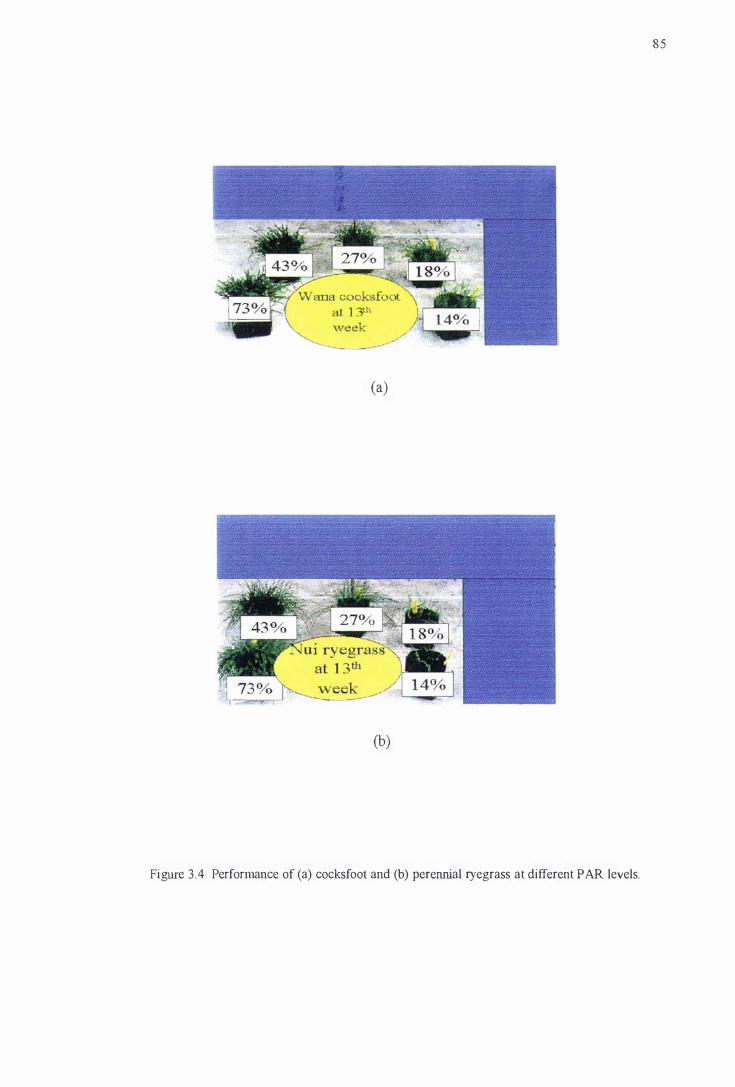
85
(a)
,,,,eek
(b)
Figure 3 .4 Performance of (a) cocks foot and (b) perermial ryegrass at different PAR levels.

86
The relatively poor shade tolerance of white clover and perennial ryegrass appeared to
result from the sensitivity of the stolons and tillers respectively, to low light. The shoot
yield of these species was comparatively low at 14% PAR, due to the low number of
leaves per plant resulting from the suppression of tillers or stolons. Absolute and
relative numbers of tillers or branches per plant could be important characters that
determine the shade tolerance of pasture species. In general, all components of growth
are depressed by a low energy input, but tillering ability of plants is particularly
dependent on carbohydrate supply (Cooper and Tainton 1 968). Persistence of pasture
species under shade could be evaluated on their ability to produce tillers or branches
which will contribute to the accumulation of shoot weight. If a particular species is able
to produce more tillers, it may also withstand defoliation better than those plants with
less tillerslbranches. To be agronomically useful a shade tolerant pasture species needs
defoliation tolerance as well as shade tolerance.
The levels of ambient PAR transmitted in this experiment may not exactly represent the
situation under conservation trees. Both light quantity and light quality signals could be
important in the reactions of plants to shade. R:FR values for deciduous woodlands
ranged from 0.36 to 0.97 (Smith 1 982) in comparison to about 1 .2 in open areas. Smith
further pointed out that morphogenetic reactions occur in response to reductions in the
total fluence rate. To validate the results of this glasshouse experiment, a field
experiment and also the glasshouse experiment were conducted to determine the effects
of shade on the selected pasture species. Chapter 4 describes results for the effects of
different levels of shade on the cocksfoot selections and perennial ryegrass in
glasshouse conditions (experiment 4. 1 ), and also under alder tree shade created by
pruning trees to different heights (experiment 4.2).
87
3.6 Conclusions
The results of this study demonstrated that shade had a marked effect on tillering as well
as on shoot dry weight accumulation of hill pasture species under glasshouse conditions.
However, mean tillers per plant in the lowest PAR 04%) level were significantly higher
for cocksfoot than other species. Similarly, lotus was the best legume under the lowest
PAR where it produced a higher (P<O.OOOl ) number of branches than the other
legumes. Likewise, relative tiller numbers per plant (to that of 7 3 % PAR), also
indicated that cocksfoot had about 20% of its tiller production in the highest level of
shade ( 14% PAR) compared with perennial ryegrass which had only 5 %. The greater
leaf area per plant of Yorkshire fog, cocksfoot and lotus also suggested that these
pasture species are likely to be the most productive under the lowest PAR. The results
indicated that pasture species like cocks foot and lotus can be grown under heavy shade
provided that other management practices are optimum.

88
3.7 References
Anonymous, 1 995. Poplar agroforestry: An introduction to using poplars for timber.
New Zealand Poplar Commission, Palmerston North, New Zealand.
Bar, D. and Schulz, H. 1 995. Effect of shade on turf grasses (review). Rasen Turf Gazon
26: 48-55.
Brauen, S . E. , Goss, S . E. , Goss, R. L. and Brede, A. D. 1993. Registration of Putter
creeping bentgrass . Crop Science 33: 1 100.
Chen, C. P. 1 993. Pastures as the secondary component in tree-pasture systems.
Proceedings of the XVII International Grassland Congress, New Zealand: 2037-
2043.
Clough, P. W. J. and Hicks, D. L. 1993. Soil Conservation and the Resource
Management Act Summary. MAF Policy Technical Paper, 93/2, Wellington,
New Zealand.
Cooper, J. P. and Tainton, N. M. 1 968. Light and Temperature requirements for the
growth of tropical and temperate grasses. Herbage Abstracts 38 : 1 67-223 .
Eriksen, F. I. and Whitney, A. S . 1 98 1 . Effects of light intensity on growth of some
tropical forage species. I. Interaction of light intensity and nitrogen fertilization
on six forage grasses. Agronomy Journal 73: 427-433 .
Gadgil, R . L., Charlton, J . F. L. , Sandberg, A. M. and AlIen, P. J. 1 986. Relative growth
and persistence of planted legumes in a mid-rotation radiata pine plantation.
Forest Ecology and Management 14: 1 1 3- 1 24.
Hawke, M. F. 1 99 1 . Pasture production and animal performance under pine agroforestry
in New Zealand. Forest Ecology and Management 45: 1 09- 1 1 8 .

89
Hurley, R. H. , Pompei, M. E., Clark-Ruh, M. B. , Bara, R. F. , Dickson, W. K. and Funk,
C. R. 1 990. Registration of 'Laser' rough bluegrass. Crop Science 30: 1 357-
1 358 .
Kephart, K. D. and Buxton, D . R. 1 993 . Forage quality responses of C3 and C4
perennial grasses to shade. Crop Science 33 :83 1 -837.
Knowles, R. L. 1 99 1 . New Zealand experience with silvopastoral systems: A review.
Forest Ecology and Management 45: 25 1 -267.
Lodge, G. M. 1 996. Seedling emergence and survival of annual pasture legumes in
Northern New South Wales. Australian Journal of Agricultural Research
47 :559-574.
Miller, D. E. K., Gilchrist, A. N. and Hicks, D. L. 1 996. The role of broad leaved trees in
slope stabilisation in New Zealand pastoral farming. Pp 96- 104 in: Mountain of
East Asia and the Pacific, Ralston, M.M., Hughey, K. F . D. and Q'Connor, K. F.
ed. Centre for Mountain Studies, Lincoln University, Canterbury, New Zealand.
Murphy, J. S . and Briske, D. D. 1994. Density-dependent regulation of ramet
recruitment by the red:far-red ratio of solar radiation: A field evaluation with the
bunchgrass Schizachyrium scoparium. Oecologia 97: 462-469.
Pardini, A., Piemontess, S. and Stagliano, N. 1 995. Selection of subterranean clover
(Trifolium subterraneum L.) cultivars for productive and non-productive sites in
the Mediterranean. Rivista di Agronomia 29:267-272.
Percival, N. S . , Bond, D. I., Hawke, M. F., Cranshaw, L. J. , Andrew, B . L. and
Knowles, R. L. 1 984. Effects of radiata pine on pasture yields, botanical
composition, weed populations, and production of a range of grasses.
Proceedings of a technical workshop on agroforestry, May 1 984. Ministry of
Agriculture and Fisheries, Wellington. Pp 13-22.

90
Pollock, K. M., Lucas, R, J., Mead, D. J. and Thomson, S .E. 1 994. Forage pasture
production in the first three years of an agroforestry experiment. Proceedings of
the New Zealand Grassland Association 56: 179- 1 85 .
Samarakoon, S . P., Wilson, J . R . and S helton, H . M . 1 990. Growth, morphology and
nutritive quality of shaded Stenotaphrum secundatum, Axonopus compressus
and Pennisetum clandestinum. Journal of Agricultural Science 1 14: 1 6 1 - 1 69 .
SAS Institute Inc. 1989. SAS user's guide: Statistics, Version 6 , SAS Inc, Cary, North
Carolina, USA.
Seo, S . , Han, Y. C. and Park, M. S . 1989. Grassland improvement and N fertilisation
management of woodland in Korea. Proceedings of the XVI International
Grassland Congress, Nice, France: 1487 -1488.
Shelton, H . M. , Humphreys, L. R. and B atello, C. 1 987. Pastures in the plantations of
Asia and the Pasific : Performance and prospect. Tropical grass lands 2 1 : 1 59-
1 68 .
Smith, H. 1 982. Light quality, photoperception, and plant strategy. Annual Review of
Plant Physiology 33 : 48 1 -5 1 8 .
Steel, R. G . D. and Torrie, J . H . 1 980. Principles and Procedures o f Statistics: A
Biometrical Approach. 2nd edition, McGrew-Hill International, Singapore, 633p.
Teuber, N. and Laidlaw, A . S. 1 996. Influence of irradiance on branch growth of white
clover stolons in rejected areas within grazed swards. Grass and Forage Science
5 1 :73-80.
Thompson, L. 1993. The influence of the radiation environment around the node on
morphogenesis and growh of white clover (Trifolium repens). Grass and Forage
Science 48: 27 1 -278.

9 1
West, G. G . , Dean, M. G. and Percival, N. S . 1 99 1 . The productivity o f Maku lotus as a
forest understory. Proceedings of the New Zealand Grassland Association
53: 1 69- 173 .
West G. G., Percival, N. S . and Dean, M. G. 1988 . Over sowing legumes and grasses
for forest grazing: Interim research result. Forestry Research Institute Bulletin
No 1 39:203-222. Rotorua, New Zealand.

4. Performance of perennial rye grass and cocksfoot
cultivars under glasshouse conditions and alder shade
92
Page
4.1 SUMM.ARY ................................. . . . . . . . . . . . . . . . . . . . . ................ . . . . . . . . . . . . . .. . . . . . . . . . . . . . . . . . . . . . . . . 94
4.2 INTRODUCTION . . . . . . . . . . . . . . . . . . . . . . . . . . . . . . . . . . . . . . . . . . . . . . . . . . . . . . . . . . . . . . . . . . . . . . . . . . . . . . . . . . . . . . . . . . . . . . . . . . 95
4.3 MATERIALS AND METHODS . . . . . . . . . . . . . . . . . ...................... . . . . . . . . .. . . . . . . . . . . . . . . . . . . . . . . . . . 97
4.3. 1 Design and treatments . . . . . . . . . . . . . . . . . . . . . . . . . . . . . . . . . . . . . . . . . . . . . . . . . . . . . . . . . . . . . . . . . . . . . . . . . . . . . . . . . . . . . . . . 97
4 .3 .2 Measurements . . . . . . . . . . . . . . . . . . . . . . . . . . . . . . . . . . . . . . . . . . . . . . . . . . . . . . . . . . . . . . . . . . . . . . . . . . . . . . . . . . . . . . . . . . . . . . . . . . 1 00
4.3 .2. 1 Experiment 4. 1 . . . . . . . . . . . . . . . . . . . . . . . . . . . . . . . . . . . . . . . . . . . . . . . . . . . . . . . . . . . . . . . . . . . . . . . . . . . . . . . . . . . . . . . . . 1 00
4.3 .2.2 Experiment 4.2 . . . . . . . . . . . . . . . . . . . . . . . . . . . . . . . . . . . . . . . . . . . . . . . . . . . . . . . . . . . . . . . . . . . . . . . . . . . . . . . . . . . . . . . . . 1 00
4 .3 .3 Statistical analysis . . . . . . . . . . . . . . . . . . . . . . . . . . . . . . . . . . . . . . . . . . . . . . . . . . . . . . . . . . . . . . . . . . . . . . . . . . . . . . . . . . . . . . . . . . . . 1 0 1
4.4 'RESULTS ...................................... . . . . . . . . . . . . . . . . . .. . . . . . . . . . . . . . . . . . . . . . . . . . . . . . . . . . . . . . . . . . . . . . . . . . . . .. 101
4.4. 1 Experiment 4. 1 . . . . . . . . . . . . . . . . . . . . . . . . . . . . . . . . . . . . . . . . . . . . . . . . . . . . . . . . . . . . . . . . . . . . . . . . . . . . . . . . . . . . . . . . . . . . . . . . . 1 0 1
4 .4. 1 . 1 Light environment . . . . . . . . . . . . . . . . . . . . . . . . . . . . . . . . . . . . . . . . . . . . . . . . . . . . . . . . . . . . . . . . . . . . . . . . . . . . . . . . . . . . . 1 0 1
4.4 . 1 .2 Shoot dry weight . . . . . . . . . . . . . . . . . . . . . . . . . . . . . . . . . . . . . . . . . . . . . . . . . . . . . . . . . . . . . . . . . . . . . . . . . . . . . . . . . . . . . . . . 10 1
4.4. 1 .3 Tillers per plant . . . . .. . . . . . . . . . . . . . . . . . . . . . . . . . . . . . . . . . . . . . . . . . . . . . . . . . . . . . . . . . . . . . . . . . . . . . . . . . . . . . . . . . . . 1 04
4.4. 1 .4 Leaf area, leaf dry weight per plant, and leaf:stem ratio . . . . . . . . . . . . . . . . . . . . . . . . . . . 1 05
4.4. 1 .5 Specific leaf area (SLA) . . . . . . . . . . . . . . . . . . . . . . . . . . . . . . . . . . . . . . . . . . . . . . . . . . . . . . . . . . . . . . . . . . . . . . . . . . . . 108
4.4. 1 .6 Multivariate approach . . . . . . . . . . . . . . . . . . . . . . . . . . . . . . . . . . . . . . . . . . . . . . . . . . . . . . . . . . . . . . . . . . . . . . . . . . . . . . . . 1 09
4.4. 1 .7 Grouping species in terms of their similar performance . . . . . . . . . . . . . . . . . . . . . . . . . . 1 1 1

93
4.4.2 Experiment 4.2 . . . . . . . . . . . . . . . . . . . . . . . . . . . . . . . . . . . . . . . . . . . . . . . . . . . . . . . . . . . . . . . . . . . . . . . . . . . . . . . . . . . . . . . . . . . . . . . . . 1 14
4.4.2. 1 Light environment . . . . . . . . . . . . . . . . . . . . . . . . . . . . . . . . . . . . . . . . . . . . . . . . . . . . . . . . . . . . . . . . . . . . . . . . . . . . . . . . . . . . . 1 14
4.4.2.2 Shoot dry weight. . . . . . . . . . . . . . . . . . . . . . . . . . . . . . . . . . . . . . . . . . . . . . . . . . . . . . . . . . . . . . . . . . . . . . . . . . . . . . . . . . . . . . . . 1 14
4.4.2.3 Tillers per plant . . . . . . . . . . . . . . . . . . . . . . . . . . . . . . . . . . . . . . . . . . . . . . . . . . . . . . . . . . . . . . . . . . . . . . . . . . . . . . . . . . . . . . . . . 1 15
4.4.2.4 Specific leaf area (SLA) . . . . . . . . . . . . . . . . . . . . . . . . . . . . . . . . . . . . . . . . . . . . . . . . . . . . . . . . . . . . . . . . . . . . . . . . . . . . 1 17
4.4.2.5 Leaf area per plant . . . . . . . . . . . . . . . . . . . . . . . . . . . . . . . . . . . . . . . . . . . . . . . . . . . . . . . . . . . . . . . . . . . . . . . . . . . . . . . . . . . . . 1 1 7
4.4.2.6 Leaf dry weight per plant. . . . . . . . . . . . . . . . . . . . . . . . . . . . . . . . . . . . . . . . . . . . . . . . . . . . . . . . . . . . . . . . . . . . . . . . . . . 1 19
4.4.2.7 Root dry weight per plant . . . . . . . . . . . . . . . . . . . . . . . . . . . . . . . . . . . . . . . . . . . . . . . . . . . . . . . . . . . . . . . . . . . . . . . . . . 1 19
4.5 DISCUSSION .................................. . . . . . . . . . . . .. . . . . . .............. . . . . . . . . . . . . . . . . . . . . . . . . . . . . . . . . . . . . . 120
4.6 CONCLUSIONS . . . . . . . . . . . . . . . . . . ........... . . . . . . . . . .. . . . . . ................ . . . . . . . . . . . . . . . . . . . . . . . . . . . . . . . . . . . . . 125
4. 7 REFERENCES ............. .................... . . . . . . . . . . . . . . ................ . . . . . . . . . . . . . . . . . . . . . . . . . . . . . . . . . . . . .. 126
Part of these results (Experiment 4.2) has been published in the Proceedings Agronomy Society of New
Zealand 28: 1 29-1 35 (Devkota et al. 1 998)

94
4.1 Summary
The previous experiment indicated that cocksfoot had a superior performance in shade.
In this experiment ten cocks foot selections and Grasslands Nui perennial ryegrass were
compared under three levels of shade in a glasshouse, and seven cocksfoot selections
and Grasslands Nui perennial ryegrass were field tested under eleven year old alder trees
in February 1 997 at the Horticultural Research Centre, Aokautere, near Palmerston
North. A split-plot design with four replicate blocks was employed for both
experiments. The main plot treatments were three levels of available PAR (73%, 32%
and 24% of full sunlight) for the glasshouse study, and three levels (77%, 27%, and
1 7%) for the field study, created by pruning lower branches of alder trees to different
heights. The sub-plot treatments were pasture species, grown entirely under shade cloth
for the glasshouse study, and grown at first in a glasshouse and then transferred in pots
to the field for the field study. Four and five plants per pot were used in the glasshouse
experiment and the field experiment, respectively. Water and fertilizer were non
limiting in both experiments. The first experiment ran from 1 8 December 1 996 to 4 May
1 997 ( 1 38 days) in the glasshouse, and the second experiment ran from 1 8 December
1 996 to 2 February 1997 (46 days) in the glasshouse then 3 February to 3 0 April 1 997
(87 days) in the field (total of 1 33 days). Tillers per plant and shoot dry weight were
assessed five times at 1 5 day intervals, and leaf area, leaf dry weight, specific leaf area,
for both experiments. Root dry weight per plant was also determined for the field
experiment at the final harvest.
Shade affected perennial ryegrass more than all the cocksfoot selections, especially at
the lowest PAR level, in both the glasshouse and the field experiment. Tillers per plant
under tree shade, and also at the low PAR level in the glasshouse for perennial ryegrass
were 1 8 compared with 28-29 (P<O.OOO l ) for Wana cocks foot and 24-27 for PG 74 at
the final harvest. Leaf area per plant for perennial ryegrass was also significantly
(P<O.OOO l ) lower than for Wana cocks foot, and similarly for relative specific leaf area
(Experiment 4.2), and leaf dry weight at the low PAR level, indicating Wana and PG 74
are particularly shade tolerant cultivars. Specific leaf area, leaf area, and tillers per plant
were key indicators of performance of the cocksfoot selections under heavy shade. The

95
results are discussed in terms of the attributes that relate to the performance of cocksfoot
and perennial ryegrass in shaded environments such as silvo-pastoral systems.
4.2 Introduction
The planting of conservation trees (Miller et al. 1 996) has become a common land use
practice in recent years for erosion control, income diversification, or both (Pollock et
al. 1 994). When trees are planted primarily for erosion control rather than timber
production then income is affected by the effect of the trees on pasture production: the
extent of decreased pasture production under trees depends on the degree of canopy
closure and the characteristics of the canopy (Hawke and Knowles 1 997). Plantings of
deciduous conservation trees such as alders, poplars, and willows provide a less shaded
environment than evergreen trees . Nevertheless, shade from deciduous trees in silvo
pastoral systems will still affect the productivity of pasture by decreasing growth rate
and persistence (Ditschal et at. 1 997).
Trees may be planted at both high or low densities to allow grazing of the pasture until
tree canopy closure (PoIlock et al. 1 994). Growth and production of pasture are
important criteria to understand the performance of pasture species under such shady
conditions (Deinum et al. 1 996; Devkota et al. 1997) .
Plants exhibit both physiological and morphological responses when growing in the
shade. For example, shade intolerant species have a high (20-30 Ilmoles photons m-2 S-I)
light compensation point (LCP) for photosynthesis (Boardman 1 977; Herrera et al.
1 99 1 ) compared with 0.5- 10 (llIDoles photons m-2 S-I) for shade tolerant species
(Boardman 1977). Saturating intensities of 400-600 Ilmoles photons m-2 S-1 for shade
intolerant plants (Boardman 1 977), and 60-300 Ilmoles photons m-2 S-1 for shade
tolerant C3 plants (Boardman 1 977) have also been reported. The general responses to
low-light stress include increases in plant leaf area to maximize light interception and to
enhance the efficiency of carbon utilization (Sanderson et al. 1 997), resulting in higher
leaf area ratios and reduced specific leaf weight (Chen 1 993). Accordingly some plant
species tolerate heavy shade better than others. For example cocksfoot in heavy shade

96
( 14% of full sunlight PAR) was superior to perennial ryegrass in biomass production
due to higher leaf area, and tillering, in both absolute and relative terms (Devkota et al.
1997; Chapter 3) .
Leaf area development, shoot initiation, plant height, growth rate, and production of
pastures vary directly with the amount of sunlight available under the canopy (Shelton et
al. 1987; Kephart and Buxton 1993; Sanderson et al. 1 997). As well as decreasing the
quantity of light, the tree canopy also absorbs red (R) wavelengths (660nm) more than
far-red (FR) wavelengths (730nm) such that R:FR ratio of light decreases towards the
base of the canopy (Sanderson et al. 1997). In general, low R:FR stimulates
morphological changes such as increased height and decreased tillering (Thomson
1993; Teuber and Laidlaw 1996; Sanderson et al. 1 997).
In the first experiment (Chapter 3), pasture species were screened for their biomass and
morphological responses to a range of levels of photosynthetic ally active radiation
without considering light quality in the glasshouse with cocksfoot showing heavy shade
tolerance. In these experiments (Chapter 4), the emphasis will be to evaluate whether
any differences in shade tolerance attributes exist among cocksfoot selections III
glasshouse conditions and under alder tree shade. Accordingly, ten cultivars of
cocks foot and one cultivar of perennial ryegrass were evaluated under three levels of
light in the glasshouse, and seven cultivars of cocks foot and one cultivar of perennial
ryegrass were field tested under 1 1 year old alder trees for their morphological
characteristics and responses to shade and light quality.

97
4.3 Materials and methods
4.3.1 Design and treatments
Experiment 4. 1 was conducted from 1 8 December, 1 996 to 4 May, 1 997 ( 138 days) at
the Plant Growth unit (PGU), Massey University. A split-plot design was used with
four blocks: the main plots were shade treatments and subplots were pasture species.
Plants were grown under two shade levels. One main plot in each replication was also
maintained under full sun light conditions inside the glasshouse (control; without shade
cloth). Shade levels were imposed by differing densities of neutral shade cloth (Sarlon)
supported on hollow metal frames ( 1 .25 x 0.84 x 0.45 m) arranged on benches that were
0.9 m above the ground. The shade frames were aligned in a north-south direction
(across the sun direction) in order to avoid direct radiation during low sun elevation.
Three levels of transmitted photosynthetically active radiation (PAR, Ilmoles photons m
-2 S-I
, 400-700 nm) were created. The transmitted PAR for the three treatments averaged
73, 32 and 24% of the ambient PAR under full sun light determined on clear sunshine
days (8 occasions) from 1200 to 1 300 h during the experiment using a LI-COR (Model
LI- 1 85) portable quantum sensor. The treatment with 73% ambient PAR was not
covered by shade cloth, as this was the percentage of ambient PAR transmitted through
the glasshouse. PAR was measured inside and outside the glasshouse at the same time.
R:FR ratio was not measured during this experiment, but was considered the same as in
the previous glasshouse experiment (Chapter 3: Section 4.3. 1 ) .
The practical constraints of the glasshouse and field site limited the number of cocksfoot
selections that could be used. Cocks foot cultivars Grasslands Wan a, Grasslands Kara,
Tekapo and Saborto were chosen, as they are the commonly used cultivars in New
Zealand. PG lines were included as they were considered shade tolerant (Allan Stewart,
personal communication). Grasslands Wana was also one of the most shade tolerant
cocksfoot cultivars in the previous experiment (Chapter 3) .

Table 4 . 1 Pasture species and cultivars used in Experiment 4 . 1 .
Pasture species
Cocksfoot (Dactylis glomerata L.) cv. Grasslands Tekapo (tetraploid)
2 Cocksfoot (Dactylis glomerata L.) cv. Grasslands Kara (tetraploid)
3 Cocksfoot (Dactylis glomerata L.) , PG 321 , subsp. izcoi (tetraploid)
4 Cocksfoot (Dactylis glomerata L.), PG 306, subsp. Marina (tetraploid)
5 Cocksfoot (Dactylis glomerata L.), PG 301 , subsp. Marina (tetraploid)
6 Cocksfoot (Dactylis glomerata L.), PG 74, subsp. izcoi (diploid)
7 Cocksfoot (Dactylis glomerata L.) cv. Grasslands Wana (tetraploid)
8 Cocksfoot (Dactylis glomerata L.) cv. Grasslands Apanui (tetraploid
9 Cocksfoot (Dactylis glomerata L.) cv. Saborto (tetraploid)
1 0 Cocksfoot (Dactylis glomerata L.) cv. Dora (tetraploid)
1 1 Perennial ryegrass (Lolium perenne L.) cv. Grasslands Nui
98
Details of the pasture species and cultivars used are given in Table 4. 1 . Seeds were
sown on December 1 8 , 1 996 in PB 61h (3.9 litre) black polypots filled with potting mix
(80% tree bark + 20% pumice). Dolomite 300g, agricultural lime 300g, iron sulphate
SOg, and Osmocote plus ( l 6N-3.5P- 1O.8K) 400 g per 1 00 litre were blended with the
potting mix, which was rated for medium to long term « 9 months) greenhouse crops .
Four plants were maintained per pot. Plants were watered daily.
Experiment 4.2 was conducted from 1 8 December 1996 to 3 0 April 1 997 ( 1 34 days).
Plants were grown in pots III a glasshouse under full sunlight (Plant Growth Unit,
Massey University), and then transferred to the field in the pots on 3 February 1 997.
The field site was at Horticultural Research Centre, Aokautere, near Palmerston North
under 1 1 year old alder trees. Pots in the field were arranged in a split plot design with
four replicate blocks. The main plots were shade treatments created by pruning trees to
different heights from ground level, and subplots were mixed species swards. Pruning
heights were to 2.5 m, 5 .0 m and 7.0 m from the ground, which resulted in three levels
of transmitted PAR ( 17 , 27, and

Table 4.2 Pasture species and cultivars used in Experiment 4.2.
Pasture species
Cocksfoot (Dactylis glomerata L.) cv. Grasslands Tekapo (tetraploid)
2 Cocksfoot (Dactylis glomerata L. ) cv. Grasslands Kara (tetraploid)
3 Cocksfoot (Dactylis glomerata L.), PG 321 , subsp. izcoi (tetraploid)
4 Cocksfoot (Dactylis glomerata L.), PG 306, subsp. Marina (tetraploid)
5 Cocksfoot (Dactylis glomerata L.), PG 301 , subsp. Marina (tetraploid)
6 Cocksfoot (Dactylis glomerata L.), PG 74, subsp. izcoi (diploid)
7 Cocksfoot (Dactylis glomerata L.) cv. Grasslands Wana (tetraploid)
8 Perennial ryegrass (Lolium perenne L.) cv. Grasslands Nui
99
77% of full sunlight, hereafter called heavy, medium, and light shade, respectively) as
determined by measuring on three occasions (7 February, 1 9 March, and 1 4 April, 1 997)
on clear sky days between 1 200 to 1300h using a LI-COR (Model LI- 1 85) quantum
sensor. The R:FR ratio of the light was also measured on the three occasions with a
Skye sensor just above the swards under the trees.
Details of the pasture species and cultivars used are given in Table 4.2. Seeds of the
pasture species were sown on 28 December 1 996 in PB 61/2 (3.9 litre) black polypots
filled with potting mix (80% tree bark + 20% pumice).
Dolomite 3 00g, agricultural lime 3 DOg, iron sulphate 50g, and Osmocote plus ( 1 6N-
3 .5P- IO.8K) 400 g per 1 00 litre were blended with the potting mix, which was rated for
medium to long term « 9 months) greenhouse crops. Five plants were maintained per
pot. Pots in the field were buried in the soil with approximately the top 3 0 mm above
soil level. Plants were watered daily when there was no rain.

1 00
4.3.2 Measurements
4.3.2.1 Experiment 4.1
Plants were harvested on 22 February, 1997 (67 days after sowing), 9 March , (8 1 days
after sowing), 23 March (95 days after sowing), 6 April ( 109 days after sowing), 20
April ( 123 days after sowing), and 4 May ( 1 37 days after sowing) 1 997. At each
harvest, all the plants were clipped to 50mm above the media surface. Shoots above 50
mm were dried at 70 0 C for 24 hours, weighed, and added to the above ground shoot
mass at the final harvest. At each harvest, the number of tillers per pot was counted. At
the final harvest, one plant was randomly selected in each pot and all the leaves and
stems were separated. Leaf area was measured, then leaves and stems dried at 70 0 C for
24 hours. Plant height per pot at each harvest was measured for any 3 randomly
selected plants.
4.3.2.2 Experiment 4.2
Plants were harvested on 5 March 1 997 (77 days after sowing), on 1 9 March (91 days
after sowing), 2 April ( 105 days after sowing), 1 6 April ( 1 19 days after sowing), and 30
April ( 13 3 days after sowing) 1 997. At each harvest, all the plants were clipped to
50mm above the media surface. Shoots above 50 mm were dried at 70 0 C for 24 hours,
weighed, and added to the above ground shoot mass at the final harvest. At each
harvest, the number of tillers per pot was counted. At the final harvest, one plant was
randomly selected in each pot, leaf area measured and dry weight determined as in the
case of experiment 4. 1 (section 4.3.2. 1 ). Roots of all the plants in each pot were washed
and oven dried at 70 0 C for 24 hours to calculate per plant root dry weight.

1 0 1
4.3.3 Statistical analysis
PROC GLM programme of SAS version 6. 12 (SAS 1 997) was used for all analyses.
Residuals were examined for their normality. There was no need of data transformation.
Tillers per plant in Experiment 4. 1 were also analyzed separately by the SAS GLM
procedure using the model of repeated measures (SAS 1 997) over the harvesting times.
Treatment means in the case of Experiment 4. 1 were compared using orthogonal
contrasts when necessary. The ex level was set at 0.05. PROC CANDISC of S AS
version 6. 1 2 (SAS 1 997) was used to carry out canonical variate analysis (CV A) for the
treatments in Experiment 4. 1 .
4.4 Results
4.4.1 Experiment 4.1
4.4.1.1 Light environment
Mean PAR at noon in the shade treatments was 720, 3 1 8, and 232 !-lmoles photons m-2 s
I resulting in 73, 32 and 24% ambient PAR respectively. The mean ambient PAR
outside the glasshouse was 989 !-lmoles photons m-2 S-I . Results of the previous
experiment (Chapter 3 ) showed that there was no effect of shade cloth on R:FR ratio.
4.4.1.2 Shoot dry weight
The cumulative shoot dry weight (glplant) of the grasses at different PAR levels are
presented in Table 4.3 . Table 4.3 shows that all the grasses produced their highest yield
at 73% PAR and lowest at 24% PAR, indicating the significant (P<0.05) effects of
shade on the grass cultivars and selections. Equally, there were significant differences
(P<O.OOOl ) in shoot dry weight among the grass cultivars and selections for different
levels of shade (%PAR transmitted) .
At 73% PAR, perennial ryegrass had the greatest cumulative shoot dry weight per plant

1 02
and Kara the lowest. PG 74 had the highest shoot dry weight of the cocks foot selections
followed by PG 321 (Table 4.3). At 32% PAR, PG 74 produced higher shoot dry
weight than the other cocks foot cultivars and the perennial ryegrass. Apanui had least
dry weight (P<O.05). Shoot weight of perennial rye grass was similar to all other
cocks foot selections except PG 74, and all other PG lines had similar shoot dry weights.
At the heavy shade (24% PAR), PG 74 produced the highest shoot dry weight (2.23 g)
per plant followed by Wana, whereas the shoot weight of perennial ryegrass ( 1 .25 g per
plant) was least (Table 4.3).

1 03
Table 4.3 Effects of level of transmitted PAR on cumulative shoot dry weight (glplant) of cocksfoot
selections and perennial ryegrass in glasshouse conditions, 1 997.
Cocksfoot selections and perennial ryegrass
Apanui Tekapo Kara Wana Saborto Dora PG 32 1 PG 306 PG 74 PG 30! P.ryegrass (Nui)
Analysis of variance Shade (A) SEM for shade (d.f. = 2) Cultivars and selections (B) SEM for cultivars and selections (dJ. = 1 0) Interaction (A *B) SEM for A*B (d.f. = 20)
73% (720 J.1moles photons
m'l S'l) 4.0 3.6 3 .0 3 .9 3A 3 .7 4.3 3.6 4.5 3.8 4.9
P <0.05 0.28
P <0.0001 0. 1 1
P <0.001 0.20
d.f.= degrees of freedom; SEM= standard error of the mean
% PAR transmitted 32% (3 1 8
J.1moles photons m,2 S'I)
2. 1 2.2 2.5 2.4 2.5 2.3 2.4 2.3 3 . 1 2.2 2 .2
24% (232 J.1moles photons
m,2 S'l) 1 .5 1 .5 1 .7 1 .9 l .8 l .8 1 .7 1 .8 2.2 l A 1 .2
The linear relationship between biomass yield and specific leaf area (SLA) for different
levels of PAR is presented in Figure (4. 1 ) . The relationship was strong only at low
levels of PAR (24%), whilst under medium and high levels of PAR, the relationship was
not linear and was weaker (Figure 4 . 1 ). There was a general trend in the ratio of SLA to
dry weight, with a higher ratio at lower PAR levels (Figure 4. 1 ) .
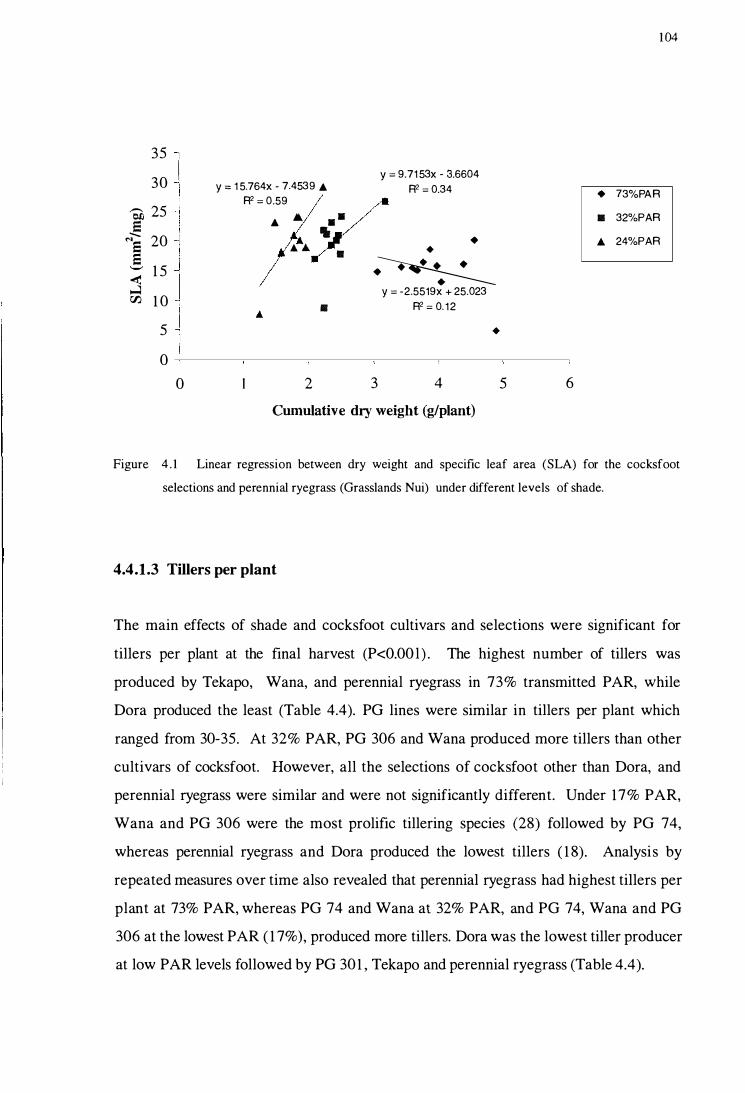
35
30
� 25
-E M8 20 8 '-' 1 5 < ..J rJ'J. 1 0
5
0
0
y =: 1 5.764x - 7.4539 .
. .. l1li l1li
y = 9.71 53x - 3.6604
R2 = 0.34
� .. .
R2 = 0.59
Y . "'- l1li •
.� y = -2.5519x + 25.023
l1li R2 = 0. 1 2
•
2 3 4 5
Cumulative dry weight (g/plant)
1 04
• 73%PAR
l1li 32%PAR
• 24%PAR
6
Figure 4 . 1 Linear regression between dry weight and specific leaf area (SLA) for the cocksfoot
selections and perennial ryegrass (Grasslands Nui) under different levels of shade.
4.4.1.3 Tillers per plant
The main effects of shade and cocksfoot cultivars and selections were significant for
tillers per plant at the final harvest (P<O.OOl ) . The highest number of tillers was
produced by Tekapo, Wana, and perennial ryegrass in 73% transmitted PAR, while
Dora produced the least (Table 4.4). PG lines were similar in tillers per plant which
ranged from 30-35. At 32% PAR, PG 306 and Wana produced more tillers than other
cultivars of cocksfoot. However, all the selections of cocks foot other than Dora, and
perennial ryegrass were similar and were not significantly different. Under 17% PAR,
Wana and PG 306 were the most prolific tillering species (28) followed by PG 74,
whereas perennial ryegrass and Dora produced the lowest tillers ( 1 8). Analysis by
repeated measures over time also revealed that perennial ryegrass had highest tillers per
plant at 73% PAR, whereas PG 74 and Wana at 32% PAR, and PG 74, Wana and PG
306 at the lowest PAR ( 1 7%), produced more tillers. Dora was the lowest tiller producer
at low PAR levels followed by PG 301 , Tekapo and perennial ryegrass (Table 4.4).

1 05
4.4.1.4 Leaf area, leaf dry weight per plant, and leaf:stem ratio
Table (4.5) shows leaf area per plant of the cocksfoot selections and perennial ryegrass.
The main effects of shade and grass cultivars and selections were significant (P<O.OOl )
for per plant leaf area. Over all shade levels, P G 74 had the greatest leaf area of the
cocks foot selections, and Apanui the lowest. Leaf area of perennial ryegrass was lower
than all the cocks foot selections (Table 4.5).
Similarly to leaf area, the main effects of shade and grass cultivars and selections were
significant (P< 0.001) for leaf dry weight per plant (Table 4.5). Among the cocksfoot
selections, the highest leaf dry weight per plant was for PG 74 and Tekapo, while
Apanui had the lowest per plant dry weight in over all shade levels. Perennial ryegrass
produced a lower leaf dry weight compared with all the cocks foot selections (Table 4.5).
The main effects of shade (P<O.Ol ) and grass cultivars and selections (P<0.05) were
significant for leaf:stem ratio (Table 4.5). Tekapo had the greatest leaf:stem ratio, and
PG 74 had the lowest over all shade levels. Leaf: stem ratio of perennial ryegrass was
greater than PG 74, but smaller than all the other cocksfoot selections over all shade
levels (Table 4.5).
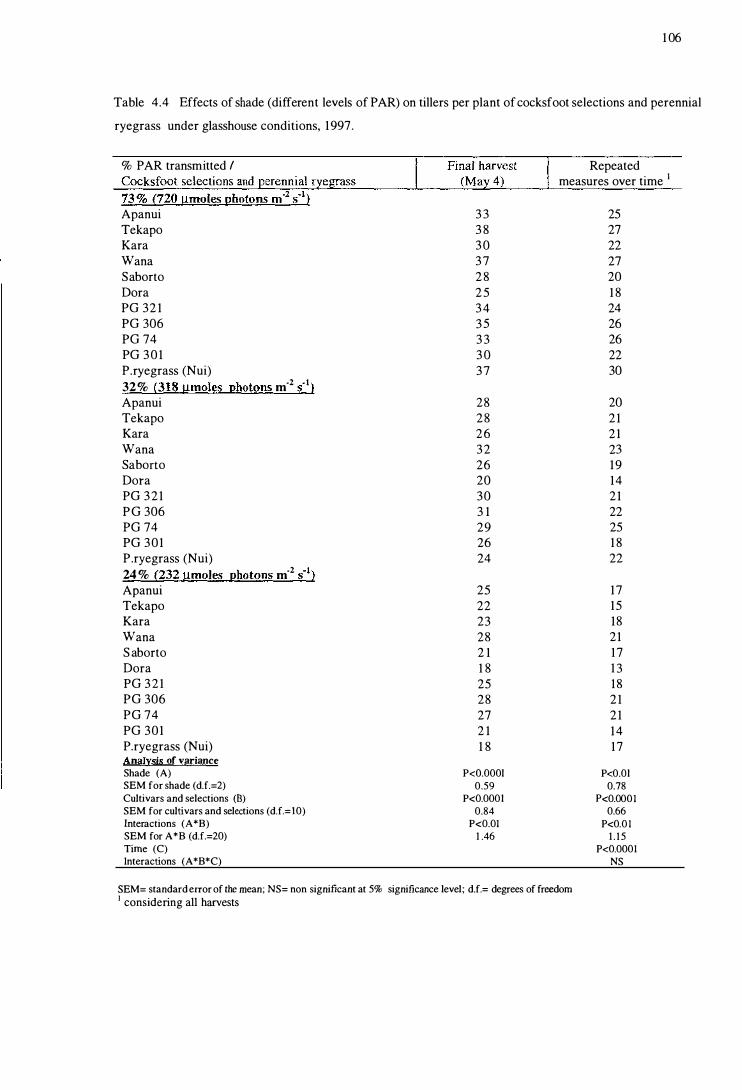
1 06
Table 4.4 Effects of shade (different levels of PAR) on tillers per plant of cocksfoot selections and perennial
ryegrass under glasshouse conditions, 1997.
% PAR transmitted / Repeated measures over time I
Apanui Tekapo Kara Wana Saborto Dora PG 32 1 PG 306 PG 74 PG 3 0 1 P.ryegrass (Nui) 32% (318 umoles photons m-2 sol) Apanui Tekapo Kara Wana Saborto Dota PG 321 PG 306 PG 74 PG 301 P.ryegrass (Nui) 24 % (232 umoles photons m-2 sol) Apanui Tekapo Kara Wana S aborto Dora PG 321 PG 306 PG 74 PG 301 P_ryegrass (Nui) Analysis of variance Shade (A) SEM for shade (dJ.=2) Cultivars and selections (B) SEM for cultivars and selections (dJ.=lO) Interactions (A*B) SEM for A*B (dJ.=20) Time (C) Interactions (A*B*C)
3 3 3 8 3 0 3 7 2 8 2 5 3 4 3 5 3 3 3 0 37
28 28 26 32 26 20 30 3 1 29 26 24
25 22 23 28 2 1 1 8 25 28 27 2 1 1 8
P<O.OOOl 0.59
P<O.OOOl 0.84
P<O.OI 1 .46
SEM= standard error of the mean; NS= non significant at 5% significance level; d.f.= degrees of freedom
I considering all harvests
25 27 22 27 20 1 8 24 26 26 22 30
20 21 21 23 19 14 21 22 25 1 8 22
17 15 18 21 17 1 3 18 21 21 14 17
P<O.Ol 0.78
P<O.OOOI 0.66
P<O.O I 1 . 1 5
P<O.OOOI NS
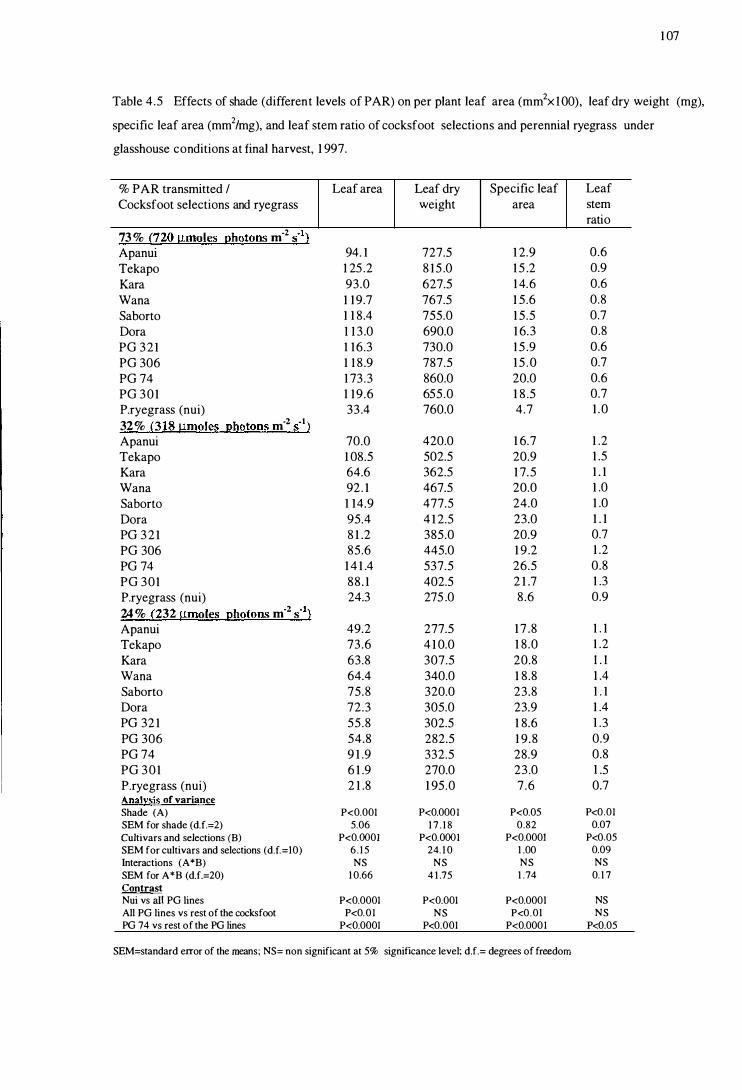
1 07
Table 4.5 Effects of shade (different levels of PAR) on per plant leaf area (mm2x l 00), leaf dry weight (mg),
specific leaf area (mm2/mg), and leaf stem ratio of cocksfoot selections and perennial ryegrass under
glasshouse conditions at final harvest, 1 997.
% PAR transmitted I Leaf area Leaf dry Specific leaf Leaf Cocksfoot selections and rye grass weight area stem
ratio
73 % {720 !,!moles uhotons m-2 S·l) Apanui 94. 1 727.5 1 2.9 0.6
Tekapo 1 25 .2 8 15 .0 1 5 .2 0.9 Kara 93.0 627.5 1 4.6 0.6 Wana 1 19.7 767.5 1 5.6 0.8 Saborto 1 1 8.4 755.0 1 5.5 0.7 Dora 1 1 3 .0 690.0 1 6.3 0.8 PG 321 1 16.3 730.0 1 5 .9 0.6 PG 306 1 1 8 .9 787.5 1 5 . 0 0.7 PG 74 1 73.3 860.0 20.0 0.6 PG 301 1 19.6 655.0 1 8 .5 0.7 P.ryegrass (nui) 33.4 760.0 4.7 1 .0
32% (318 !,!moles uhotons m-2 s·ll Apanui 70.0 420.0 1 6.7 1 .2 Tekapo 1 08.5 502.5 20.9 1 .5 Kara 64.6 362.5 1 7.5 1 . 1 Wana 92. 1 467.5 20.0 1 .0 Saborto 1 14.9 477.5 24.0 1 .0 Dora 95.4 4 1 2.5 23.0 1 . 1 PG 3 2 1 8 1.2 385.0 20.9 0.7 PG 306 85.6 445.0 1 9.2 1 .2 PG 74 1 4 1 .4 537.5 26.5 0.8 PG 301 88. 1 402.5 2 1 .7 1 .3 P.ryegrass (nui) 24.3 275 .0 8.6 0.9
24 % (232 !,!moles uhotons m-2 sol} Apanui 49.2 277.5 1 7 .8 1 . 1 Tekapo 73.6 4 1 0.0 1 8.0 1 .2 Kara 63.8 307.5 20.8 l . l Wana 64.4 340.0 1 8.8 1 .4 Saborto 75.8 320.0 23.8 1 . 1 Dora 72.3 305.0 23.9 1 .4 PG 32 1 55.8 302.5 1 8.6 1 .3 PG 306 54.8 282.5 1 9.8 0.9 PG 74 9 1 .9 332.5 28.9 0.8 PG 301 6 1 .9 270.0 23.0 1 .5 P.ryegrass (nui) 2 1 .8 1 95.0 7 .6 0.7 Analysis of variance Shade (A) P<O.OOI P<O.OOOI P<0.05 P<O.OI SEM for shade (dJ.=2) 5.06 1 7 . 1 8 0.82 0.07 Cultivars and selections (B) P<O. 000 1 P<O. 000 I P<O.OOOl P<O.05 SEM for cultivars and selections (dJ.=10) 6 . 1 5 24. 1 0 1 .00 0.09 Interactions (A*B) NS NS NS NS SEM for A*B (dJ.=20) 1 0.66 4 1 .75 1 .74 0. 1 7 Contrast Nui vs all PG lines P<O.OOOI P<O.OOI P<O.OOOl NS All PG lines vs rest of the cocks foot P<O.OI NS P<O.Ol NS PG 74 vs rest of the PG lines P<O.OOOI P<O.OOI P<O.OOOI P<0.05
SEM=standard error of the means; NS= non significant at 5% significance level; d.f.= degrees of freedom
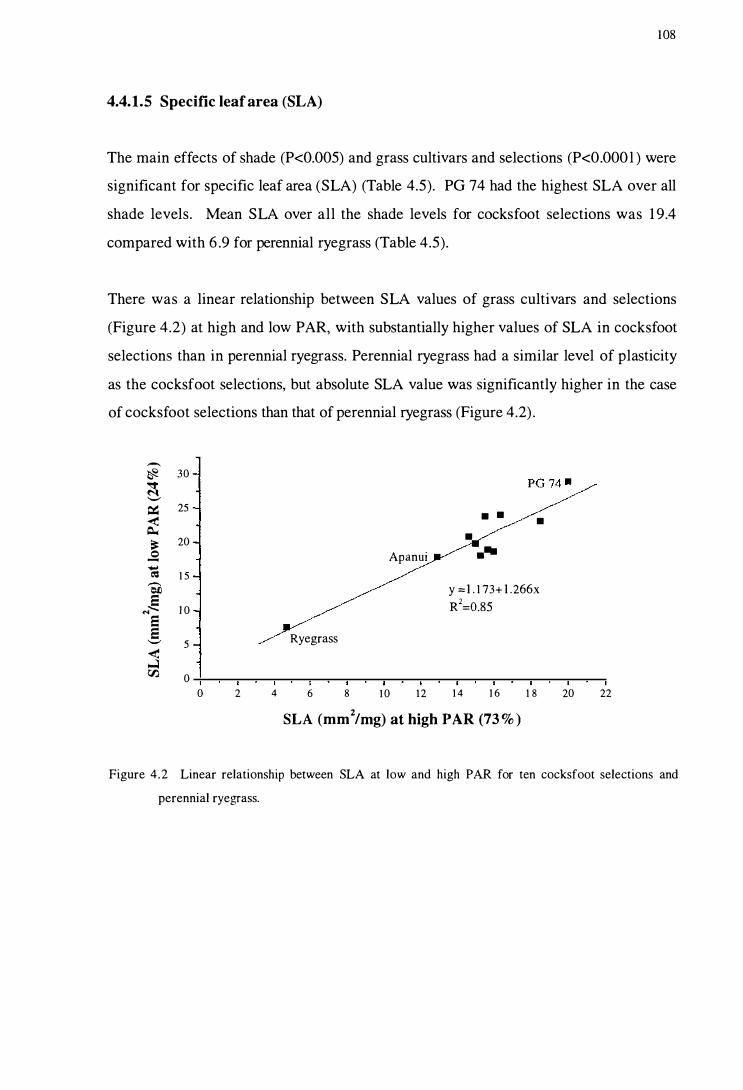
108
4.4.1.5 Specific leaf area (SLA)
The main effects of shade (P<O.OO5) and grass cultivars and selections (P<O.OOOl ) were
significant for specific leaf area (SLA) (Table 4.5). PG 74 had the highest SLA over all
shade levels. Mean SLA over all the shade levels for cocks foot selections was 1 9.4
compared with 6 .9 for perennial ryegrass (Table 4.5).
There was a linear relationship between SLA values of grass cultivars and selections
(Figure 4.2) at high and low PAR, with substantially higher values of SLA in cocksfoot
selections than in perennial ryegrass. Perennial ryegrass had a similar level of plasticity
as the cocksfoot selections, but absolute SLA value was significantly higher in the case
of cocksfoot selections than that of perennial ryegrass (Figure 4.2) .
.-., � 30 � N '-'
� 25
=:; � 20 <:> -..... � 1 5
-OJ) e
"' ........ 1 0 e e '-' 5 � ...:l CI':J 0
0 2 4
Ryegrass
6 8
• • •
Apanui ...
•
y ==1 . l 73+ 1 .266x
R2=O.85
1 0 12 1 4 1 6 1 8
SLA (mm2/mg) at high PAR (73 % )
20 22
Figure 4.2 Linear relationship between SLA at low and high PAR for ten cocksfoot selections and
perennial ryegrass.

1 09
4.4.1.6 Multivariate approach
Results from the canonical variate analysis (CV A) considering all PAR levels, and also
by considering each PAR level separately are summarized in Tables 4.6 and 4.7.
Table 4.6 Eigenvalues and the proportion of variation accounted for by the canonical variate analysis
under different PAR levels.
Eigenvalues Difference Proportion Cumulative
ia} Considering all PAR levels
1 l .7 1 0.89 0.63 0.63
2 0.82 0.69 0.30 0.93
3 0. 1 3 0.09 0.04 0.97
4 0.03 0.02 0.01 0.98
5 0.007 0.002 1 .00
(bl Considering 73% PAR only
3.71 2.39 0.66 0.66
2 1 .32 1 .03 0.24 0.90
3 0.29 0. 1 6 0.07 0.97
4 0. 1 2 0.03 0.02 0.99
5 0.09 0.0 1 1 .00
(c 1 Considering 32 % PAR only
2.55 0.22 0.38 0.38
2 2.33 1 .27 0.36 0.74
3 1 .06 0.5 1 0. 1 6 0.90
4 0.54 0.47 0.08 0.98
5 0.07 0.01 l .00
(d} Considering 24% PAR only
1 3 .8 1 0.95 0.49 0.49
2 2.85 2.3 1 0.37 0.86
3 0.53 0. 1 0 0.06 0.93
4 0.43 0.35 0.05 0.99
5 0.07 0 .01 1 .00

1 10
Table 4 .7 Information about pooled within canonical structure, and pooled within class standardized
coefficients as influenced by different PAR levels.
Pooled within class
Variables Pooled within canonical structure standardized canonical
coefficients
CANl CAN2 CAN} CAN2
{al Considering all PAR only
Leaf area/plant 0.63 0.27 0.37 0.79
Leaf dry weight 0. 1 1 0. 1 3 0.58 - 1 .7 1
Specific leaf area 0.73 0. 1 3 0.88 -0.24
Leaf: stem ratio -0.01 -0.08 -0. 1 1 0.21
Final tillers/plant -0.07 0.68 -0.45 1 .56
{b} Considering 73% PAR only
Leaf area/plant -0.57 0.67 0 . 1 9 1 .0 1
Leaf dry weight 0.05 0.45 -0. 1 4 -0.27
Specific leaf area -0.83 0.48 - 1 .02 -0.27
Leaf: stem ratio 0 . 1 2 0.01 0. 1 9 0.44
Final tillers/plant 0.40 0.7 1 0.59 0.78
{bl Considering 32% PAR only
Leaf area/plant 0.57 -0.43 -2.27 1 .37
Leaf dry weight 0.47 -0. 1 9 l .52 - 1 .3 5
Specific leaf area 0.53 -0.5 1 2. 1 2 - 1 .44
Leaf: stem ratio 0.09 -0.07 0. 1 8 0. 1 1
Final tillers/plant 0.68 0.66 0.61 0.90
{bl Considering 24% PAR only
Leaf area/plant 0.60 -0.49 -0. 1 5 0.32
Leaf dry weight 0.33 -0.32 0.53 - 1 .42
Specific leaf area 0.45 -0.28 0.96 -0.77
Leaf: stem ratio -0.06 -0.08 -0.27 0.46
Final tillers/plant 0.67 0.5 1 0.67 0.99
Consideration of all PAR levels indicated that about 63% separation among the species
could be accounted for by the first canonical variate (CV) and the second canonical
variate explained a further 30% of the separation (Table 4.6). Similarly, when 73 , 32
and 24% PAR were considered separately they all showed that only the first and second

I I I
variates were necessary to explain most of the variation in the data set (Table 4.6).
PAR levels had a strong influence on SLA and final number of tillers per plant which
were highly correlated with CAN 1 and CAN2, respectively, as indicated by the
information of pooled within canonical structure and pooled within class standardized
canonical coefficients. Leaf area per plant was also a major factor explaining differences
among the cocksfoot selections. This effect was reflected at each PAR level, where final
number of tillers was the most influential parameter affecting differences among the
cocksfoot selections, and showed a strong correlation with CAN 1 and CAN2 at 73 and
32% PAR. SLA was just as influential as tiller number per plant, but its affect was
stronger at 32 and 24% PAR than at 73% (Table 4.7).
4.4.1.7 Grouping species in terms of their similar performance
Plotting CAN1 and CAN2 of the class means on canonical variables showed groupings
of cultivars and selections in terms of their coefficients (Figure 4.3 , 4.4) .
It is clear from Figure 4.3 that at 73% PAR, PG 74, Dora, and Nui were clearly
separated from the rest of the selections. Wana, Tekapo and PG 3 06 appeared in a
cluster. The rest of the selections were scattered without forming any close group
(Figure 4.3a) . At 32% PAR, Nui and Dora cocksfoot were still separated from the other
selections of cocksfoot (Figure 4 .3b). At 24% PAR, separation was more distinct for PG
74, Nui and Dora as in the case of 73% PAR, while Wana, Apanui, PG 306, and PG 321
were all within the same cluster (Figure 4.4c). Considering all PAR levels, grouping
was similar to that in 73% PAR where perennial ryegrass, PG 74, and Dora were
isolated from the rest of the selection, and Wana was grouped with PG 306 and Tekapo
and Apanui (Figure 4.4d).

2
G �
� 0 U '-'
<l) ..... c::l
. � - 1 :>
� () . ....
-2 t:: 0 §
U -3
-4 -3
PG 301 •
• ekapo
-2 - 1 0 Canonical variate (CAN!)
(b) 32% PAR
•
PG 306. • Wana • PG 321
• Apanui • PG 74
Saborto
2
Figure 4 .3 Plot of mean canonical variate scores (CANl * CAN2) using leaf area, leaf dry weight, SLA, leaf : stem, and final tillers as variables; (a) 73% PAR , and (b) 32% PAR.
1 12

2
G � N � U '-"
(!) 0 ...., C':S
.� ;:> ca - 1 (.) 'S 0 §
U -2
-3
-5 -4
1 .5
1 .0
"""' N � 0.5 U '-"
0.0 (!) -;; . � -0.5 ;:>
8 ca (.) ' ''-; - 1 .0 I:: 0 I:: C':S
U - 1 .5
-2.0
-3
-3
• PG 306
• Wana • Apanui
· PG 321
• • PG 301 Kara
• Saborto
® • Tekapo
-2 - 1 0 1 2 Canonical variate (CANl)
(c) 24% PAR
PG �l
• Wana
• PG 306 . Tekapo
• Kara • PG 301
• Saborto
G
3
-2 - 1 0 2
Canonical variate (CANl) (d) considering all shade
1 1 3
4
Figure 4 .4 Plot of mean canonical variate scores (CANl * CAN2) using leaf area, leaf dry weight, SLA, leaf :stem, and final tillers as variables; (c) 24% PAR , and (d) all PAR levels.

4.4.2 Experiment 4.2
4.4.2.1 Light environment
Mean noon PAR and R:FR ratio are given in Table 4.8.
Table 4 .8 Light environment and shade levels of Experiment 4.2.
Main plots
(shade levels)
Heavy
Medium
Light
Pruning height
above ground Cm)
2.50
5.00
7.00
4.4.2.2 Shoot dry weight
Mean PAR
(/-l moles photons
m-2s·l)
1 66
262
759
% full sun light
1 7
27
77
R:FR ratio
0.96
1 . 1 7
1 .24
1 14
The cumulative shoot dry weights (glplant) of the grass cultivars and selections at
different shade levels are presented in Table 4.9. All of the grasses produced their
highest yield under light shade and lowest under heavy shade, indicating the significant
(P<O.OOl ) effects of shade. There were also significant differences among the cocksfoot
cultivars and selections and perennial ryegrass shade level (Table 4.9).
Under light shade, perennial ryegrass had the greatest shoot dry weight. The shoot dry
weight of Wana was significantly greater than all the other cocks foot selections except
for PG 306. Under medium shade perennial ryegrass still had a significantly greater
shoot dry weight than any oft the cocks foot selections. Within the cocks foot selections
Wana, which had the highest shoot dry weight, was significantly greater than only Kara.
There were no significant differences between perennial ryegrass and any of the
cocksfoot selections under heavy shade. Perennial ryegrass shoot dry weight under
heavy shade was 33% of that at light shade, whereas shoot dry weight of Wana
cocksfoot was 47% of that under light shade (Table 4.9).
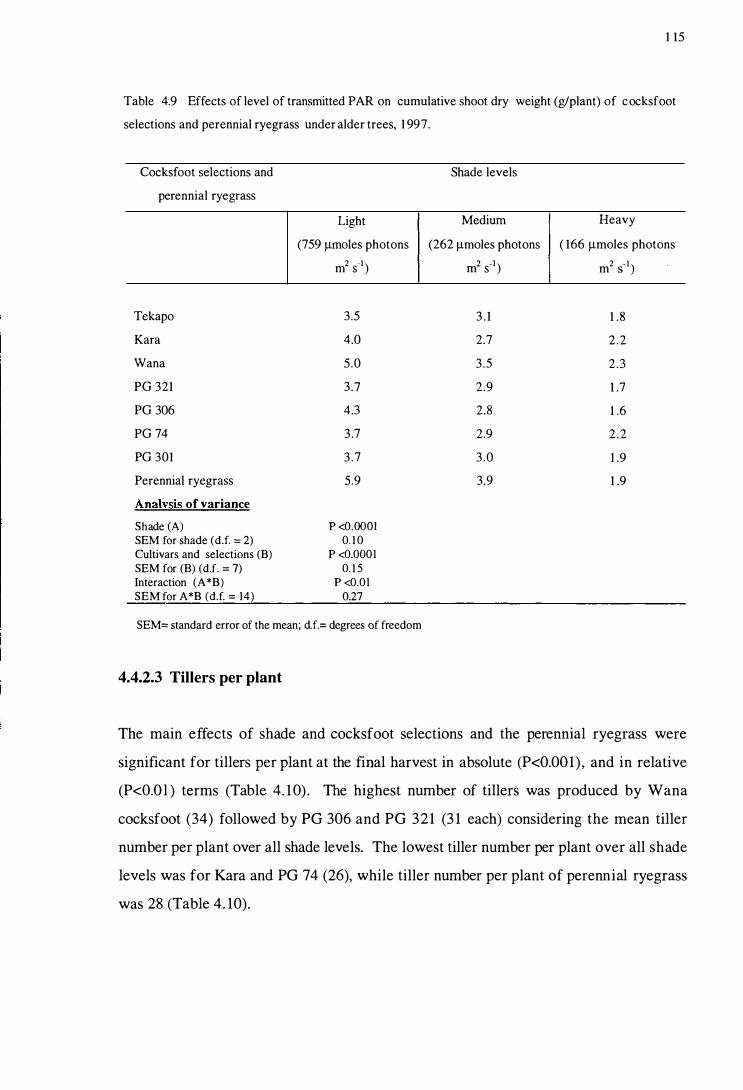
1 15
Table 4.9 Effects of level of transmitted PAR on cumulative shoot dry weight (glplant) of cocksfoot
selections and perennial rye grass under alder trees, 1 997.
Cocksfoot selections and
perennial rye grass
Tekapo
Kara
Wana
PG 321
PG 306
PG 74
PG 301
Perennial ryegrass
Analysis of variance
Shade (A) SEM for shade (d.f. ::: 2) Cultivars and selections (B) SEM for (B) (d.f. :::: 7) Interaction (A*B) SEM for A*B (d.f. :::: 14)
Shade levels
Light Medium Heavy
(759 �moles photons (262 �moles photons ( 166 �moles photons
m2 S· l ) m2 S·l ) m2 S·l )
3.5 3 . 1 1 .8
4.0 2.7 2.2
5.0 3.5 2 .3
3.7 2.9 1 .7
4.3 2.8 1 .6
3 .7 2.9 2.2
3 .7 3.0 1 .9
5.9 3.9 1 .9
P <O.OOOI 0. 1 0
P <O.OOOl 0. 1 5
P <O.Ol 0.27
SEM:::: standard error of the mean; dJ.:::: degrees of freedom
4.4.2.3 Tillers per plant
The main effects of shade and cocksfoot selections and the perennial ryegrass were
significant for tillers per plant at the final harvest in absolute (P<O.OO 1) , and in relative
(P<O.Ol ) terms (Table 4. 1 0) . The highest number of tillers was produced by Wana
cocksfoot (34) followed by PG 306 and PG 321 (3 1 each) considering the mean tiller
number per plant over all shade levels. The lowest tiller number per plant over all shade
levels was for Kara and PG 74 (26), while tiller number per plant of perennial ryegrass
was 28 (Table 4. 10).

1 16
Table 4 . 1 0 Effects of level of transmitted PAR on tillers per plant of cocksfoot selections and perennial
ryegrass at final harvest, under alder trees, 1 997.
Shade levels Icocksfoot selections and perennial
ryegrass
Light shade (pruned up to 'm height)
Tekapo
Kara
Wana
PG 3 2 1
P G 306
PG 74
PG 301
Perennial ryegrass
Medium shade (pruned up to 5.0m height)
Tekapo
Kara
Wana
PG 3 2 1
P G 3 06
P G 7 4
PG 301
Perennial rye grass
Heavy shade (pruned up to 2.5m height)
Tekapo
Kara
Wana
PG 3 2 1
P G 306
PG 74
PG 3 0 1
Perennial ryegrass
Analysis of variance
Shade (A) SEM for shade (dJ.=2) Cultivars and selections (B) SEM for (B) (d.f.=7) Interactions (A*B) SEM for A*B (d.f.=14)
Tillers per plant Relative tillers per plant
32 1 00
29 1 00
4 1 1 00
38 1 00
36 1 00
3 1 1 00
32 1 00
37 1 00
30 94
28 97
33 80
30 8 1
34 94
25 8 1
28 89
29 78
25 79
22 77
29 7 1
24 65
23 64
24 77
23 73
1 8 47
P <O.OOOI P <O.OI 0.68 2.48
P <O.OOI P <0.005 1 .25 4. 1 5 NS NS
2 . 1 7 5.87
SEM= standard error of the mean; NS= non significant at 5% significance level; d.f.= degrees of freedom

4.4.2.4 Specific Leaf Area (SLA)
1 17
The effect of shade, and the interaction between shade and cocks foot selections and
perennial ryegrass for specific leaf area (SLA) were not significant. However, the SLAs
among the cocksfoot selections and perennial ryegrass were significantly different
(Table 4. 1 1 ) . Perennial ryegrass had the lowest SLA and was significantly different to
the cocksfoot selections. SLA of the perennial ryegrass over all PAR levels was
approximately half that of the cocksfoot selections (Table 4. 1 1 ) .
4.4.2.5 Leaf area per plant
Shade and grass cultivars (cocksfoot selections and perennial ryegrass) significantly
affected (P<O.Ol ) leaf area per plant (Table 4. 1 1 ) . Perennial ryegrass always had the
lowest leaf area per plant and was significantly different from all cocks foot selections
except Kara. Leaf areas of the cocksfoot selections did not differ but all were, however,
significantly greater than perennial ryegrass (Table 4. 1 1 ).

1 1 8
Table 4. 1 1 Effects of shade on leaf area per plant (mm2), leaf dry weight (mg), specific leaf area (SLA)
(mm2/mg), and root dry weight (mg) per plant of cocksfoot selections and perennial ryegrass under
alder trees, 1 997.
Shade level sic. selections and ryegrass
Light shade (nruned un to 7.0m height)
Tekapo
Kara
Wana
PG 32 1
PG 306
PG 74
PG 301
Perennial ryegrass
Medium shade !nruned un to 5.0m height}
Tekapo
Kara
Wana
PG 3 2 1
P G 306
PG 74
PG 301
Perennial ryegrass
Hean: shade !nruned u� to 2.5m height}
Tekapo
Kara
Wana
PG 3 2 1
PG 306
PG 74
PG 301
Perennial ryegrass
Analysis of variance
Shade (A) SEM for shade (d.f.=2) CuItivars and selections (B) SEM for (B) (dJ.=7) Interactions (A*B) SEM for A*B (dJ.=14)
1 2660
14300
1 7030
1 7820
1 5790
1 2420
1 5420
1 07 1 0
1 00 1 0
7320
1 1 340
1 2230
1 02 1 0
9400
1 2870
5480
5 670
6430
8 1 60
8050
6030
5 840
8 1 50
1 560
P <O.OI 980
P <0.0001 830 NS
1440
Leaf dry wt.
660 19.7
550 26.0
740 22.7
750 23.4
720 2 1 .9
560 22.2
760 19.7
8 1 0 12.8
530 1 9.0
330 22.0
490 23. 1
5 40 22.5
480 20.9
3 80 24.6
5 80 2 1 .8
5 00 I Ll
270 19.5
250 25.2
3 60 22.4
330 24.0
250 23.8
230 25.0
330 24.5
1 40 1 1 . 1
P <0.001 NS 40 7
P <0.01 P <O.OOOI 30 7 NS NS 60 1 2
SEM=standard error o f the mean; NS= non significant at 5 % significance level; d.L= degrees o f freedom
Root dry wt.
540
480
560
470
530
4 1 0
530
780
380
300
440
360
380
320
290
470
1 70
230
2 1 0
130
1 60
220
1 80
2 1 0
P <0.0001 7
P <O.OOI 20
P <0.05 40

1 19
4.4.2.6 Leaf dry weight per plant
Similarly to leaf area, shade (P<O.OOI ) and of cocks foot selections and perennial
ryegrass were significantly (P<O.OI ) affected the leaf dry weight per plant (Table 4. 1 1 ) .
Considering the mean leaf dry weight over all shade levels greatest leaf dry weight per
plant was for PG 301 (556 mg) followed by PG 321 (540 mg), and Wana (530 mg). The
lowest leaf dry weight per plant was for PG 74 (390 mg). Perennial ryegrass had a leaf
dry weight per plant of 483 mg over all shade levels (Table 4 . 1 1 ).
4.4.2.7 Root dry weight per plant
In general, root dry weight per plant decreased in all species from light to heavy shade.
Highest root weight per plant was for perennial ryegrass (780 mg) under light shade
followed by Wana. Root weight of PG 74 was the lowest and significantly different to
some of the other cocksfoot selections (Table 4. 1 1 ) . Under medium shade, perennial
ryegrass had still a larger root weight (470mg) than the cocksfoot selections, but was
significantly different only from Kara, PG 74 and PG 301 . Among the cocks foot
selections Wana had the highest root weight and PG 301 the lowest. Under heavy
shade, however, root dry weight per plant of all the cocks foot selections/perennial
ryegrass w as similar (Table 4 . 1 1) .

1 20
4.5 Discussion
The ability of species to maintain production under shade indicates shade tolerance, and
a sharp decrease in production indicates shade intolerance (Toledo et al. 1 989). A
shade tolerant pasture species needs to have good annual and seasonal dry matter
production under defoliation, and to be able to regenerate (Devkota et al. 1 997). Leaf
area development, growth rate and yield of forage varies directly with the amount of
sunlight available to the canopy (Sanderson et al. 1 997) . However, tillering ability and
biomass production of the herbage are the cumulative expression of processes of the
plant affected by shade.
Cocksfoot selections maintained a higher relative shoot mass than perennial ryegrass
especially at low PAR, due to higher leaf area, higher absolute (both in glasshouse and
tree shade) and relative (under tree shade) tiller numbers, as well as a higher specific
leaf area. The shoot dry weight of Wan a and PG 74 cocks foot at low PAR (heavy shade)
was about half that in high PAR. For Nui perennial ryegrass shoot dry weight under low
PAR was only about one third of that under high PAR in both the glasshouse and under
alder. At a medium level of shade, however, the performance of perennial ryegrass
relative to that of light shade was near to the mean shoot yield of cocksfoot selections,
especially under tree shade (75% for the cocksfoot selections versus 67% for perennial
ryegrass). Tiller production in cocksfoot selections was more shade tolerant than in
perennial ryegrass in shade under trees, and also under low PAR in glasshouse
conditions. These results are in line with an earlier screening experiment with grasses
and legumes in pots in glasshouse conditions (Devkota et al. 1 997).
In these studies (Experiment 4. 1 -4.2), perennial ryegrass was affected more by shade
than cocks foot selections. Percival et al. ( 1984) and Hunt and Easton ( 1989) have also
indicated low levels of perennial ryegrass production under heavy shade. Pollock et al.
( 1 997) reported that cocks foot production under Pinus radiatas at Lincoln was higher
than perennial ryegrass/cIover and perennial ryegrass only pasture.
Shoot yield of perennial ryegrass was comparatively low under heavy shade due to the
12 1
low absolute (Tables 4.4, 4. 1 0) as well as relative tillering (Table 4. 10), low leaf area
(Tables 4.5, 4. 1 1 ) , and low SLA (Table 4.5). One possible reason for fewer tiller
numbers in perennial ryegrass, especially under tree shade, could be a high level of
sensitivity towards the changes in light quality (lower R:FR ratio) in the lower levels of
the canopy (Deregibus et al. 1983). Average R:FR ratio in the heavy shade under alder
was 0.96. The exact effects of a lower R:FR ratio on the tillering of plants is an issue of
debate, however, R:FR ratio could serve as a signal to indicate canopy cover which is
thought to interact with other stimuli related to the availability of resources like water,
assimilates, and nutrients to determine the rate of tiller formation (Everson et al. 1 988).
Such an effect may be greater for species like perennial ryegrass. On the other hand, the
lower numbers of tillers maintained by perennial rye grass in the glasshouse study, where
natural R:FR ratio was maintained, suggests that there could be some other factors
involved. Nonetheless, an important result was that the performance of perennial
ryegrass in shade (27% PAR) under trees was similar to the cocks foot selections, and
also in the glasshouse (32% PAR) study. However, perennial ryegrass did not tolerate
the heavy shade in either experiment.
The comparatively greater shoot dry weight of Wana cocksfoot in shade could be
associated with its ability to continue to produce tillers, especially in terms of absolute
tillers (Table 4. 1 0). Wana was more shade tolerant than some of the other cocks foot
selections used in the experiments.
The ability of Wana cocksfoot to grow in heavy shade of trees could be associated with
its high SLA (Table 4. 1 1 ). SLA of all the cocksfoot selections in shade was greater in
comparison to perennial ryegrass (about 5 %) (Table 4. 1 1 ) . Relative leaf area for
perennial ryegrass in shade was also very low in comparison to cocksfoot, which was
about 50% for all selections (Table 4. 10) .
PG 74, a diploid cocks foot selection, was similar to Wana in terms of shoot dry weight
production (Table 4.9) in heavy shade ( 1 7% PAR), but not in terms of absolute tiller
numbers per plant. One reason for the comparatively fewer tillers in PG 74 compared
with Wana under tree shade could be that diploid cocksfoot is mainly confined to forest

1 22
floors (Bretagnolle and Thompson 1996), and perhaps adapt to the heavy shade by
allocating more resources to leaves rather than to develop new tillers. This remains to be
determined. In the glasshouse study, however, PG 74 was best in terms of dry weight
production, tillering and leaf area production, followed by Wana. Therefore, the results
of these experiments showed that Wana and PG 74 were both shade tolerant selections
compared to the other cocks foot selections, and Nui perennial ryegrass .
Grasslands Tekapo is a relatively new Grasslands Wana-type cultivar (Lolicato and
Rumball 1 994), but the shoot dry weight producing ability of Tekapo in heavy shade in
the field experiment as well as in the glasshouse study at low PAR was not as good as
that of Wana. However, at medium shade, shoot dry weight production of Grasslands
Tekapo was similar to Wana, which was equally reflected by the higher % of relative
tillering under medium shade.
Canonical variate analysis (Table 4. 12) based on the glasshouse experiment (excluding
cumulative shoot dry weight), particularly helped to identify cocks foot selections and
perennial ryegrass with similar performances.
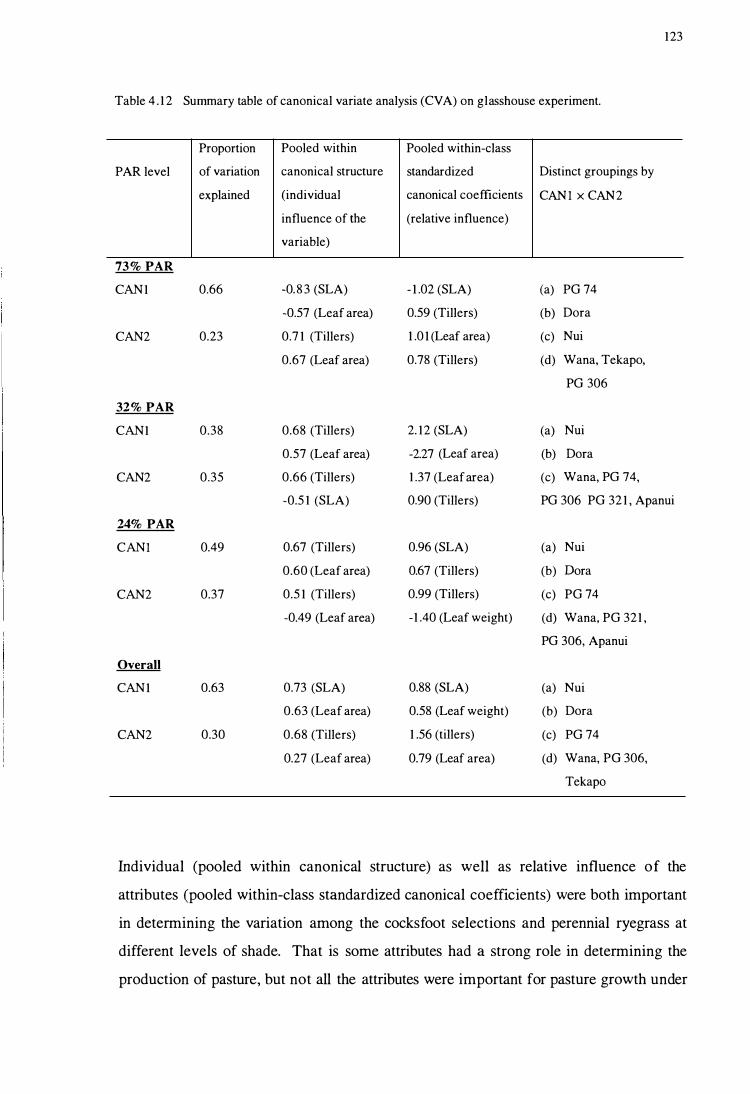
123
Table 4 . 1 2 Summary table of canonical variate analysis (CV A) on glasshouse experiment.
Proportion Pooled within Pooled within-class
PAR level of variation canonical structure standardized Distinct groupings by
explained (individual canonical coefficients CANl x CAN2
influence of the (relati ve influence)
variable)
73% PAR
CAN 1 0.66 -0.8 3 (SLA) - 1 .02 (SLA) Ca) PG 74
-0.57 (Leaf area) 0.59 (Tillers) (b) Dora
CAN2 0.23 0.7 1 (Tillers) 1 .0 1 (Leaf area) (c) Nui
0.67 (Leaf area) 0.78 (Tillers) (d) Wana, Tekapo,
PG 306
32% PAR
CAN 1 0.38 0.68 (Tillers) 2. 12 (SLA) (a) Nui
0.57 (Leaf area) -2.27 (Leaf area) (b) Dora
CAN2 0.35 0.66 (Tillers) 1 .37 (Leaf area) (c) Wana, PG 74,
-0.5 1 (SLA) 0.90 (Tillers) PG 306 PG 32 1 , Apanui
24% PAR
CANl 0.49 0.67 (Tillers) 0.96 (SLA) (a) Nui
0.60 (Leaf area) 0.67 (Tillers) (b) Dora
CAN2 0.37 0.5 1 (Tillers) 0.99 (Tillers) (c) PG 74
-0.49 (Leaf area) -1 .40 (Leaf weight) (d) Wana, PG 321 ,
PG 306, Apanui
Overall
CAN 1 0.63 0.73 (SLA) 0.88 (SLA) (a) Nui
0.63 (Leaf area) 0.58 (Leaf weight) (b) Dora
CAN2 0.30 0.68 (Tillers) 1 .56 (tillers) (c) PG 74
0.27 (Leaf area) 0.79 (Leaf area) (d) Wana, PG 306,
Tekapo
Individual (pooled within canonical structure) as well as relative influence of the
attributes (pooled within-class standardized canonical coefficients) were both important
in determining the variation among the cocks foot selections and perennial ryegrass at
different levels of shade. That is some attributes had a strong role in determining the
production of pasture, but not all the attributes were important for pasture growth under

124
shade. Tiller numbers and leaf area per plant were the most important attributes to
influence the canonical coefficients, while SLA was the main attribute that determined
the variations among pasture species in relative terms. The combined effects of these
attributes largely determined the production of pastures under shade. Higher tiller
numbers, leaf area per plant, and SLA meant better production under shade and vice
versa. Accordingly, Nui perennial ryegrass and cocksfoot selection, Dora, were the least
shade tolerant selections, while PG 74 was more shade tolerant at low PAR. Likewise,
Wana, PG 306, and Tekapo of the cocksfoot selections were also equally shade tolerant
at low PAR.
Canonical variate analysis (CV A) showed the variation in the selections of cocks foot
and Nui perennial ryegrass in terms of shade tolerance ability. This was consistent with
the shoot dry matter production of the selections under different shade, demonstrating
that W ana and PG 74 of the cocksfoot selections were superior at low PAR, while
perennial ryegrass was shade intolerant. CV A, however, also indicated that PG 306 was
always grouped with Wana. The performance of PG 306 is probably related to tiller
numbers per plant other than the other attributes (Table 4.4, 4.5). Tekapo had a similar
number of tillers at each PAR level to Wana and PG 306, but did not have similar SLA
(Tables 4.4, 4.5, Figure 4.3, 4.4).
Change in SLA could be seen as an allocation issue. Other allocation changes of plants
under shade, such as reduction in root mass, high shoot/root ratio, and increased leaf:
stem ratio, although perhaps of value ecologically (Wilson 1 997), may not be directly
relevant attributes for the production of pasture under shade. Absolute and relative
tillers per plant and shoot dry weight along with leaf area and SLA are important
attributes that determine productivity of pastures under shade (Devkota et al. 1 997) . The
cocksfoot selections, particularly Wana and PG 74 were often superior to perennial
ryegrass in heavy shade for these attributes, which are also important for defoliation
tolerance.

125
4.6 Conclusions
Results of these experiments indicated that shade affected perennials ryegrass more than
any of the cocksfoot selections, especially at the low PAR level in both the glasshouse
and field studies. Perennial ryegrass had a similar performance in both the field and
glasshouse studies, where in shade per plant tillers were quite low compared with Wana
and PG 74. Per plant leaf area of perennial ryegrass was also significantly (P<O.OOOl )
lower than for Wana, as was leaf dry weight at the low PAR level. PG lines, other than
PG 74, were similar in performance, but were not promising under shade. Dora was the
cultivar with the lowest production under low PAR in the glasshouse, and Kara was the
lowest in the field. Specific leaf area, leaf area, and tillers per plant were associated with
better performance of cultivars under shade. The results of the study also demonstrated
that there was a difference in terms of production for the cocksfoot selections, but
selections from both tetraploids and diploids could be equally suited to heavy shade.
The consistent result from the field and glasshouse studies was that perennial ryegrass
was less productive and potentially less persistent under shade than the cocksfoot
cultivars.

1 26
4.7 References
Boardman, N. K. 1977. Comparative photosynthesis of sun and shade plants . Annual
Review Plant Physiology 28: 355-377.
Bretagnolle, F. and Thompson, 1. D. 1 996. An experimental study of ecological
differences in winter growth between sympatric diploid and autotetraploid
Dactylis glomerata. Journal of Ecology 84: 343-35 1 .
Chen, C. P. 1 993. Pastures as the secondary component in tree-pasture systems.
Proceedings of the XVII International Grassland Congress: 2037-2043.
Deinum, B . Sulastri, R. D. Zeinab, M. H. 1 . and Maasen, A 1 996. Effects of light
intensity on growth, anatomy and forage quality of two tropical grasses
(Brachiaria brizantha and Panucum maximum var. trichoglume) . Netherlands
Journal of Agricultural Science 44: 1 1 1 - 124.
Deregibus, V. A, Sanchez, R. A and Casal, 1. 1. 1 983. Effects of light quality on tiller
production in Lolium spp. Plant Physiology 72: 900-902.
Devkota, N. R, Kemp, P. D. and Hodgson, 1. 1997. Screening pasture species for shade
tolerance. Proceedings Agronomy Society of New Zealand 27: 1 1 9- 1 28.
Ditschal, D. c., Collins, M. and Grove J. H . 1997 . Black locust effects on forage yield
and nutritive quality produced on reclaimed mined land. Proceedings of XVIII
International Grassland Congress, Canada, ID NO. 839.
Everson, C. S., Everson, T. M. and Tainton, N. M. 1 988. Effects of intensity and height
of shading on the tiller initiation of six grass species from the Highland Sourveld
of Natal. South African Journal of Botany 54: 3 1 5-3 1 8.
127
Hawke, M. E and Knowles R. L. 1997. Temperate agroforestry systems in New Zealand.
Pp 85- 1 1 8 in: Temperate Agroforestry Systems, Gordon, A M.and Newman, S.
M. ed. CAB International, Wallingford, U.K.
Herrara, A, Delgado, J. and Paraguatey, 1. 1 99 1 . Occurrence inducible crassulacean
acid metabolism in leaves of Talinum triangulare (portulacaceae). Journal of
Experimental Botany 42: 493-499.
Hunt, W. F. and Easton, H. S. 1 989. Fifty years of ryegrass research in New Zealand.
Proceedings of the New Zealand Grassland Association 50: 1 1 -23
Kephart, K D. and Buxton, D. R. 1 993. Forage quality responses of C3 and C4
perennial grasses to shade. Crop Science 3 3 : 83 1 -837.
Lolicato, S. and Rumball, W. 1 994. Past and present improvement of cocksfoot
(Dactylis glomerata L.) in Australia and New Zealand. New Zealand Journal of
Agricultural Research 37: 379-390.
Miller, D. E. K, Gi1christ, A N. and Hicks, D. L. 1 996. The role of broadleaved trees
in slope stabilisation in New Zealand pastoral farming. Pp 96- 1 04 in: Mountains
of East Asia and the Pacific, Ralston, M.M., Hughey, KED. and O'Connor,
KF. ed. Centre for Mountain Studies, Lincoln University, Canterbury, New
Zealand.
Percival, N. S . , Bond, D. 1., Hawke, M. E, Cranshaw, L. J., Andrew, B . L., Knowles, R.
L. 1984. Effects of radiata pine on pasture yields, botanical composition, weed
populations, and production of grasses. Proceedings of a technical workshop on
agroforestry , May 1 984. Ministry of Agriculture and Fisheries, Wellington. Pp
25-3 1 .

128
Pollock, K. M., Lucas, R. J. , Mead, D. J. and Thompson, S. E. 1 994. Forage-pasture
production in the first three years of an agroforestry experiment. Proceedings of
the New Zealand Grassland Association 56: 1 79- 1 85.
Pollock, K. M., Lucas, R. J. , Pownall, D. B . and Thompson, S . E. 1 997. Temperate
pasture and sheep performance under radiata pine and in open pasture.
Proceedings of the XVIII International Grassland Congress, Canada, ID NO.
464.
Sanderson, M. A, Stair, D. W. and Hussey, M. A 1997. Physiological and
morphological responses of perennial forages to stress. Advances in Agronomy
59: 1 7 1 -224.
SAS Institute Inc. 1 997. SAS User's guide: Statistics, Version 6. 1 2, SAS Inc, Cary,
North Carolina, USA.
Sheiton, H. M., Humphreys, L. R. and Batello, C. 1 987. Pastures in the plantations of
Asia and the Pacific: Performance and prospect. Tropical grass lands 2 1 : 1 59-
1 68.
Teuber, N. and Laidlaw, A S . 1 996. Influence of irradiance on branch growth of white
clover stolons in rejected areas within grazed swards. Grass and Forage Science
5 1 : 73-80.
Thompson, L. 1 993. Influence of the radiation environment around the node on
morphogenesis and growth of white clover (Trifolium repens). Grass and
Forage Science 48: 27 1 -278.

129
Toledo, J. M. , Arial, A. and Schultze-Kraft, R. 1 989. Productivity and shade tolerance
of Axonopus spp. Paspalum spp. and Stenotaphrum secundatum in the humid
tropics. Proceedings of the XVI International Grassland Congress, Nice,
France: 221 -222.
Wilson, J. R. 1 997. Adaptive responses of grasses to shade: Relative relevance to turf
grasses for Iow light environments. International Tuifgrass Society Research
Journal 8: 575-59 1 .

1 30
5. Effects of light intensity and quality on pasture species
Page
5.1 SUMM.ARY .......................................................................................................... 131
5.2 INTRODUCTION ................................................................................................ 133
5.3 MATERIALS AND METHODS ........................................................................ 134
5.3 . 1 Design and treatments . . . . . . . . . . . . . . . . . . . . . . . . . . . . . . . . . . . . . . . . . . . . . . . . . . . . . . . . . . . . . . . . . . . . . . . . . . . . . . . . . . . . . . 1 34
5 .3 .2 Measurements . . . . . . . . . . . . . . . . . . . . . . . . . . . . . . . . . . . . . . . . . . . . . . . . . . . . . . . . . . . . . . . . . . . . . . . . . . . . . . . . . . . . . . . . . . . . . . . . . . 1 36
5 .3 .3 Statistical analysis . . . . . . . . . . . . . . . . . . . . . . . . . . . . . . . . . . . . . . . . . . . . . . . . . . . . . . . . . . . . . . . . . . . . . . . . . . . . . . . . . . . . . . . . . . . . 1 37
5.4 RESULTS: EXPERIMENT 5 ............................................................................. 137
5.4. 1 Growth environment . . . . . . . . . . . . . . . . . . . . . . . . . . . . . . . . . . . . . . . . . . . . . . . . . . . . . . . . . . . . . . . . . . . . . . . . . . . . . . . . . . . . . . . . 1 37
5.4.2 S hoot dry weight . . . . . . . . . . . . . . . . . . . . . . . . . . . . . . . . . . . . . . . . . . . . . . . . . . . . . . . . . . . . . . . . . . . . . . . . . . . . . . . . . . . . . . . . . . . . . . 1 38
5.4.3 Yield components . . . . . . . . . . . . . . . . . . . . . . . . . . . . . . . . . . . . . . . . . . . . . . . . . . . . . . . . . . . . . . . . . . . . . . . . . . . . . . . . . . . . . . . . . . . . 1 39
5.4.4 S pecific leaf area (SLA) . . . . . . . . . . . . . . . . . . . . . . . . . . . . . . . . . . . . . . . . . . . . . . . . . . . . . . . . . . . . . . . . . . . . . . . . . . . . . . . . . . 146
5 .4.5 l..eaf:stem ratio . . . . . . . . . . . . . . . . . . . . . . . . . . . . . . . . . . . . . . . . . . . . . . . . . . . . . . . . . . . . . . . . . . . . . . . . . . . . . . . . . . . . . . . . . . . . . . . . . 147
5.4.6 Root dry weight . . . . . . . . . . . . . . . . . . . . . . . . . . . . . . . . . . . . . . . . . . . . . . . . . . . . . . . . . . . . . . . . . . . . . . . . . . . . . . . . . . . . . . . . . . . . . . . 1 48
5 .4.7 Chlorophyll concentration . . . . . . . . . . . . . . . . . . . . . . . . . . . . . . . . . . . . . . . . . . . . . . . . . . . . . . . . . . . . . . . . . . . . . . . . . . . . . . . 1 49
5.5 DISCUSSION .................................................................... ................................... 152
5.6 CONCLUSIONS ................................................................................................. 158
5.7 REFERENCES .......................... . ... . . ..................................................................... 159

1 3 1
5.1 Summary
The effects of varied PAR and R:PR ratio on tillering and shoot dry weight production
of hill pasture species, which differed in morphology and shade tolerance, were
evaluated. A split plot design was used with low ( 1 6 and l7%) and medium (38 and
39%) % transmitted PAR (�moles photons m-2 S-I , 400-700 nm), and two natural
( 1 .33 and 1 .34) and two reduced (0.57 each) red (655-665 nm) to far-red (725-735nm)
ratios (R:PR) of light as main plots. The treatment combination was such that each
low and medium PAR level had a natural and a reduced R:PR ratio. PAR levels with
natural R: PR ratio were imposed by differing densities of neutral shade cloth (Sarlon)
with a layer of clear filter, while low R:FR ratio was created with the use of a blue
filter. Shade cloth and filters were supported together on hollow metal frames ( 1 .25 x
0.84 x 0.45 m) arranged on benches that were 0.9 m above the ground. PAR level was
determined each day measurement from 1200 to 1 300 h during the experiment using a
LI-COR (Model LI- 1 85) quantum sensor, while R:FR ratios were the mean of 3
measurements.
Nine pasture cultivars of seven pasture species: Dactylis glomerata L., Grasslands
Wana (cocksfoot); Dactylis glomerata L., PG 74 (cocksfoot) ; Dactylis glomerata L.,
PG 32 1 (cocksfoot); Lolium perenne L. (perennial ryegrass); Holcus lanatus L.
(Y orkshire fog); Agrostis capillaris (browntop); Poa trivialis; Trifolium repens L.
(white clover), and Lotus uliginosus (lotus) were grown in pots as subplots with four
replicate blocks. Six plants were maintained per pot, and plants were watered daily.
Water and fertiliser were non-limiting. Plants were at first grown in a glasshouse
under full available sunlight, and were then transferred to the shade frames after 60
days. All the fully expanded laminae of each plant were removed before imposing
shade treatments. In the shade, plants were not clipped and grew without harvesting.
The experiment ran from 10 June to 9 October, 1 997 ( 1 2 1 days). Plants were
harvested on 9 October, 6 1 days after imposing shade. One plant was randomly
selected in each pot to determine leaf area, leaf dry weight, stem dry weight, SLA,

1 32
and number of leaves and tillers. The remaining five plants were clipped to the media
surface and shoot dry weight per plant determined. Root dry weight of all the plants in
the pots was also determined. Chlorophyll concentration was measured once during
September.
Results showed that there was no effect of R:FR ratio (P>O.05) on the shoot dry
weight per plant. Similarly, the interaction for PARxR:FR was not significant
(P>O.05) nor were speciesxR:FR and speciesxPARxR:FR. There were, however,
significant differences (P<O.05) for PAR, species, and interaction of PARxspecies for
shoot dry weight. At low PAR, Lolium perenne, Dactylis glomerata (Wana) and
Holcus lanatus had the highest and similar yields, whereas the yield of white clover
and lotus were similar and less than for all the grass species. Effects of PAR as well as
R:FR were significant (P<O.OOl ) for total tillers per plant and net tillers/plant
developed in the shade. Poa trivialis, Agrostis capillaris and Lolium perenne had the
highest number of tillers/plant at the low PAR and low R:FR, however, the high
number of tillers for Poa and browntop did not result in higher shoot dry weight for
these species at the low PAR, mainly due to their low weight per tiller. Likewise, SLA
was significantly (P<O.O 1 ) increased by low PAR but not by low R:FR. However,
there was an interaction between species and R:FR for SLA. Among the legumes,
lotus produced a higher (P<O.OOl ) number of branches at the low PAR than white
clover. Similarly, greater shoot dry weight per plant, number of branches/plant, and
total leaves per plant of lotus than of white clover was also found at low PAR with
reduced R:FR. The results are discussed in terms of the effects of PAR and R:FR on
the yield and yield components with respect to the attributes of shade tolerant pasture
speCIes.

1 33
5.2 Introduction
The growth, development and productivity of plants are dependent on both the quantity
and quality of light (Loomis et al. 1963 ; Kasperbauer and Hunt 1998). Reduction in the
quantity as well as quality of light may cause morphological changes in plants, as well
as reducing overall growth, and can influence the outcome of competitive relations
between plant species (Shelton et al. 1987).
Effects of R:FR on the productive performance of pasture plants have been widely
studied (Dergibus et al. 1 983 ; 1985; Thomson 1 993 ; Murphy and Briske 1994; Smith
1 994; Teuber and Laidlaw 1 996; Wan and Sosebee 1 998; Kasperbauer and Hunt 1 998) .
In general, low R:FR stimulates apical dominance causing morphological changes, such
as increased plant height, stem elongation and reduced tillering (Dergibus et al. 1 983;
1 985; Smith 1994; Wan and Sosebee 1998).
Light regulates plant growth and development via informational signals detected by
phytochrome (Smith 1994; Sanderson et al. 1997 ; Wan and Sosebee 1 998). That is, the
colour of light received by a growing plant influences where and how the photosynthate
is used, known as the photo morphogenic function of light (Kasperbauer and Hunt
1 998). For example, red eR) and far-red (FR) are absorbed by and act through a
photoreversible regulatory phytochrome pigment system (Kasperbauer and Hunt 1 998).
The ratio of the red and far-red (R:FR) quanta influences plant development (Lee et al.
1 994; Smith 1994). Generally, not only the amount of light received by a plant
decreases, but the R:FR ratio also decreases under a dense canopy because of selective
absorption of red light relative to far-red and diffusion of different wavelengths by
green tissue (Smith 1 994; Wan and Sosebee 1998). Branching is affected more by shade
with both low photosynthetic ally-active radiation (PAR) and low R:FR than by neutral
shade (low PAR and high R:FR) (Wan and Sosebee 1998).
The first glasshouse experiment screening pasture species for shade tolerance (Chapter
3 ) focused on levels of PAR (400-700nm), independent of changes in R:FR under a
canopy. However, with the reduction in the total amount of light, R:FR is also reduced
in the natural environment (Smith 1994). It is difficult to determine the role of R:FR

1 34
independently of light intensity on the plant' s performance in a field study. The only
way to examine the role of R:FR is to investigate the growth of plants under controlled
conditions, in which R:FR ratio is varied whilst the amount of PAR is held constant
(Smith 1 994).
Chapter 4 examined effects of shade on different cocksfoot selections and perennial
ryegrass in a glasshouse and under trees. In this experiment, pasture species were
screened for their biomass and morphological responses to a fixed low and medium
levels of PAR (% transmitted photosynthetic ally active radiation), each combined with
natural as well as reduced R:FR ratios in glasshouse conditions so that effects of R:FR
could be determined independently of light intensity. It is hypothesised that the
morphological responses of pastoral plants are less affected by low R:RF under a low
level of PAR than a high level of PAR, since survival could be more important for a
plant at a low level of PAR, and hence the efficiency of utilization of light energy is
more important (Corn� 1 983a) than the quality of light.
5.3 Materials and methods
5.3.1 Design and treatments
The experiment was conducted for 12 1 days for legumes ( 10 June to 9 October, 1 997),
and 1 12 days (20 June-9 October, 1 997) for grasses at the Plant Growth Unit (PGU) ,
Massey University. Different sowing times for legumes and grass were intended to
adjust for differences in germination period. A split-plot design was used with four
blocks. The main plots were % transmitted PAR (J..Lmoles photons m-2 S-I , 400-700 nm)
and R:FR ratios (ratio of photon irradiance between 655 and 665 nm, and 725 and
735nm) (Smith 1 994) with 2 x 2 factors of PAR and R:FR, i.e. medium PAR: 38% ( 1 8 1
J..Lmoles photons m-2 S- I) with natural R:FR ( 1 .33 - 1 .34), and 39% PAR ( 1 89 J..Lmoles
photons m-2 S-I ) with low R:RF (0.57), and low PAR: 1 6% PAR (78 J..Lmoles photons m-2
S-I ) with natural R:FR ( 1 .32- 1 .37), and 17% PAR (84 J..Lmoles photons m-2 S-I ) with low
R:RF (0.57). Thus, the transmitted PAR was 39, 38 , 1 7, and 1 6% of the ambient PAR
under full sunlight as determined on each day from 1 200 to 1 300 h during the

135
experiment using a LI-COR (Model LI- 1 85) portable quantum sensor, while R:FR
ratios were the mean of 3 measurements by using Skye sensor. Subplots were pasture
species.
PAR levels with natural R:FR ratio were imposed by differing densities of neutral shade
cloth (Sarlon) with a layer of clear filter (Effects filters, 30 clear, Chris James and Co.
LTD; Lighting Filters, 43 Colville Road, Acton, London W38BL) while low R:FR ratio
was created with the use of steel blue filters (Effects filter, 1 17 steel blue). S hade cloths
and filters were supported together on hollow metal frames (0.25 x 0.84 x 0.45 m)
arranged on benches that were 0.9 m above the ground. The shade frames were aligned
in a north-south direction (across the sun direction) in order to avoid direct radiation
during low sun elevation, but the pots were not fully enclosed to facilitate aeration and
to reduce temperature increase due to the use of filters. In the east-west direction the
frames completely enclosed the pots. Thus, in each cage as main plot, pots of 9 cultivars
were accommodated where each pot had only one cultivar with 6 plants per pot. 6 plants
per pot for the 3 .9 litre pot size was optimum in terms of spacing, and also for ease of
handling as determined on the basis of knowledge of previous experiments.
Details of the pasture species and cultivars used are given in Table 5 . 1 . Seeds of the
pasture species were sown on 9 June for legumes, and 20 June, 1997 for grasses in PB
61/2 (3 .9 litre) black polypots filled with potting mix (80% tree bark + 20% pumice).
Dolomite 300g, agricultural lime 300g, iron sulphate 50g, and Osmocote plus ( l 6N-
3 .5P- 1O.8K) 400 g per 1 00 litre were blended with the potting mix, which was rated for
medium to long-term « 9 months) greenhouse crops. S ix plants were retained per pot.
Plants were watered daily.

Table 5 . 1 Pasture species and cultivars used in the Experiment.
Pasture species
1 . White clover (Trifolium repens L.) cv. Grasslands Tahora
2. Lotus (Lotus uliginosus) cv. Grasslands Maku
3 . Cocksfoot (Dactylis glomerata L.) cv . Grasslands Wana, (tetraloid)
4. Cocks foot (Dactylis glomerata L.), PG 74, subsp. Izcoi (diploid)
5 Cocksfoot (Dactylis glomerata L.), PG 321 subsp. Izcoi (tetraploid)
6 Perennial rye grass (Lolium perenne L.) cv. Grasslands Nui
7 Yorkshire fog (Holcus lanatus L.) cv. Massey Basyn
8 Browntop (Agrostis capillaris) cv. Grasslands Muster
9. Poa trivialis (Poa trivialis) cv. Sabre
1 36
The pots within cages were re-randomized weekly. Seeds of legumes were inoculated
with the appropriate rhizobia. The glasshouse temperature was maintained at 25°C until
seeds of all plants were fully germinated. Thereafter, day temperature was 15- 170C and
night temperature 8-10oC.
Plants were at first grown in a glasshouse under full available sunlight, and were then
transferred to the shade frames on 10 August 1997. All the fully expanded lamina were
clipped at ligule before imposing shade treatments to avoid confounding effects of full
sunlight. Clipped laminae were l ater oven dried at 70° C for 24 hours and weighed and
added to the cumulative biomass. Leaves were not clipped once plants were under the
shade, and plants were harvested only at the end of experiment.
5.3.2 Measurements
Plants were harvested on 9 October 1997 (61 days after imposing shade). One plant was
randomly selected in each pot and all the leaves, stems, mature and immature leaves
were separated. Leaf area was measured, then leaves and stems dried at 70 ° C for 24
hours to calculate cumulative biomass per plant. Number of tillers was also determined

1 37
for the same plant. The remaining five plants were clipped to the media surface. Shoots
were dried at 70 0 C for 24 hours, weighed, and added to the above ground shoot mass
at the final harvest. The roots of all the six plants were removed, washed, and dried at
70 0 C for 24 hours to calculate per plant root dry weight. During September, one plant
in each pot of the each treatment was randomly selected and marked. The number of
tillers, and leaves of the marked plants were counted each week for four weeks, and
chlorophyll concentration was measured once. To determine the chlorophyll
concentration, a fresh sample of about 2 g of leaf was ground in acetone (30-40ml), kept
in the cool room (-1°C) over-night and then centrifuged for 10 minutes at 4000 rpm,
diluted to a known volume (SOml) by adding acetone, and the absorbance read at 664
and 647 nm in a spectrophotometer (U-2000 double beam, Hitachi, Ltd. Tokyo Japan)
(Holden 1 965; Harborne 1973).
5.3.3 Statistical analysis
PROC GLM programme of SAS version 6. 1 2 (SAS 1 997) was used for all analyses.
Residuals were examined for their normality, and transformation was carried out when
needed. Type of data transformation has been indicated on the appropriate result table.
Treatment means were compared using orthogonal contrasts. The Cl level was set at
O.OS.
For all the tables SEM denotes standard error of the mean; NS, nonsignificant at
P<O.OS; d.f., degrees of freedom; Wc, white clover; rye, perennial ryegrass ; and Y.fog.,
Yorkshire fog.
5.4 Results: experiment 5
5.4.1 Growth environment
Mean PAR at noon in the shade treatments was 189, 1 8 1 , 84, and 78 Ilmoles photons
m-2 S-l resulting in 39, 38, 17, and 1 6% PAR transmitted respectively to that of available
PAR inside the glasshouse. The mean ambient PAR outside and inside the glasshouse
was 67S, and 482 Ilmoles photons m-2 S-l respectively. Mean R:FR ratio in each PAR

1 38
level was 0.57, 1 .33, 0.57, and 1 .34, respectively, as detenmned by the three
measurements during the experiment periods, while R:FR inside as well as outside the
glasshouse was 1 .4.
5.4.2 Shoot dry weight
There was no effect of R:FR ratio (P>0.05) on the shoot dry weight per plant of the
pasture species studied. Similarly the interaction of PAR x R:FR, species x R:FR, and
species x PAR x R:FR were not significant (P>0.05). However, there were significant
(P<0.05) effects of PAR, species, and PAR x species on the shoot dry weight (Table
5.2). Higher shoot dry weight was produced by all the species at medium PAR than at-
Table 5.2 Effect of level of PAR and R:FR on shoot dry weight (g Iplant) of grass and legume species
at final harvest in glasshouse conditions, 1 997.
% transmitted PAR and R:FR ratio Medium PAR Low PAR
Species/culti vars 38% PAR , 39% PAR, 16% PAR , 17% PAR , Natural R:FR Low R:FR Natural R:FR Low R:FR
( 1 .33- 1 . 34) (0.57) ( 1 .32- 1 .37) (0.57) WhIte clover 1 .4 1 .0 0.4 0.3 Lotus 1 .0 1 . 1 0.4 0.4 Cocksfoot (Wana) 1 .9 1 .8 1 .2 1 .0 Cocksfoot (PG 74) 1 .6 1 .2 0.8 0.5 Cocksfoot (PG 321) 1 .8 1 .7 0.7 0.7 Perennial ryegrass (Nui) 2.8 2.7 1 .2 1 . 1 Yorkshire fog 2.7 2.8 1 .3 0.9 B rowntop 1 .9 1 .8 0.6 0.8 Poa trivialis 1 .9 1 .7 0.9 1 .0 Analysis of variance J!robabilitv SEM PAR (A) (dJ. == 1 ) P<0.00 1 0.Q3 R:FR (B) (d.f.=! ) NS 0.03 (A *B) (d.f.:l ) N S 0.04 Species (C) (d.f.=8) P<O.OOl 0.06 C*A (d.f.=8) P<0.001 0.09 (C*A*B) (d.f.=8) NS 0. 1 2 Contrasts Legumes vs rest P <0.001 Wc vs lotus NS Rye vs PG 74, PG 321 , Wan a, Y.fog, Poa, browntop P <0.001
low PAR. At medium PAR, Yorkshire fog and perennial ryegrass had produced most
shoot dry weight followed by Wana cocksfoot and brown top. Shoot dry weights of

1 39
white clover and lotus were similar and lower than all the grass species (Table 5 .2). At
low PAR, perennial rye grass , Wana cocksfoot and Yorkshire fog were similar and had
the highest shoot dry weight, whereas shoot dry weight of white clover and lotus was
similar and less than all the grass species. Perennial ryegrass and Yorkshire fog had 45
and 39% shoot dry weight, respectively, of their medium PAR shoot dry weight at low
PAR, compared with 59% for Wana cocks foot (Table 5.2).
5.4.3 Yield components
Only the effects of PAR and species significantly affected (P<O.05) the yield
components leaf area, leaf dry weight, and stem dry weight. There was no effect
(P>O.05) of R:FR or any interactions on shoot, leaf dry weight, and leaf area (Table 5 .2,
5 . 3, and 5 .4), but there was an effect on stem dry weight (Table 5 .5) .
Leaf area per plant increased with increased PAR in all pasture species (Table 5 .3) .
Yorkshire fog had the highest leaf area in medium as well as in low PAR. Leaf areas of
the Wana cocksfoot was higher than that of perennial rye grass and legumes. Leaf area
of legume was the lowest among all the species studied. Similar results were also
observed for leaf dry weight per plant, which was higher in medium PAR than in low.
Perennial ryegrass leaf dry weight was significantly higher (P<O.OOOl ) than the rest of
the species. Leaf dry weight of legumes was the lowest. Lotus had more leaf dry weight
than white clover (Table 5 .4).
Stem dry weight per plant had also similar response to that of leaf area and leaf dry
weight, but there was a significant effect of R:FR on the stem dry weight along with
PAR (Table 5.5). Stem dry weight was higher in 38% PAR, natural R:FR compared to
39% PAR and low R:FR in all species, except for lotus. Browntop was least affected by
low R:FR followed by Yorkshire fog. Similarly, reduction in R:FR reduced the stem
dry weight of species under low PAR, except for PG 32 1 , Nui, browntop, and Po a,
which increased under low PAR, and low R:FR treatments (Table 5.5).
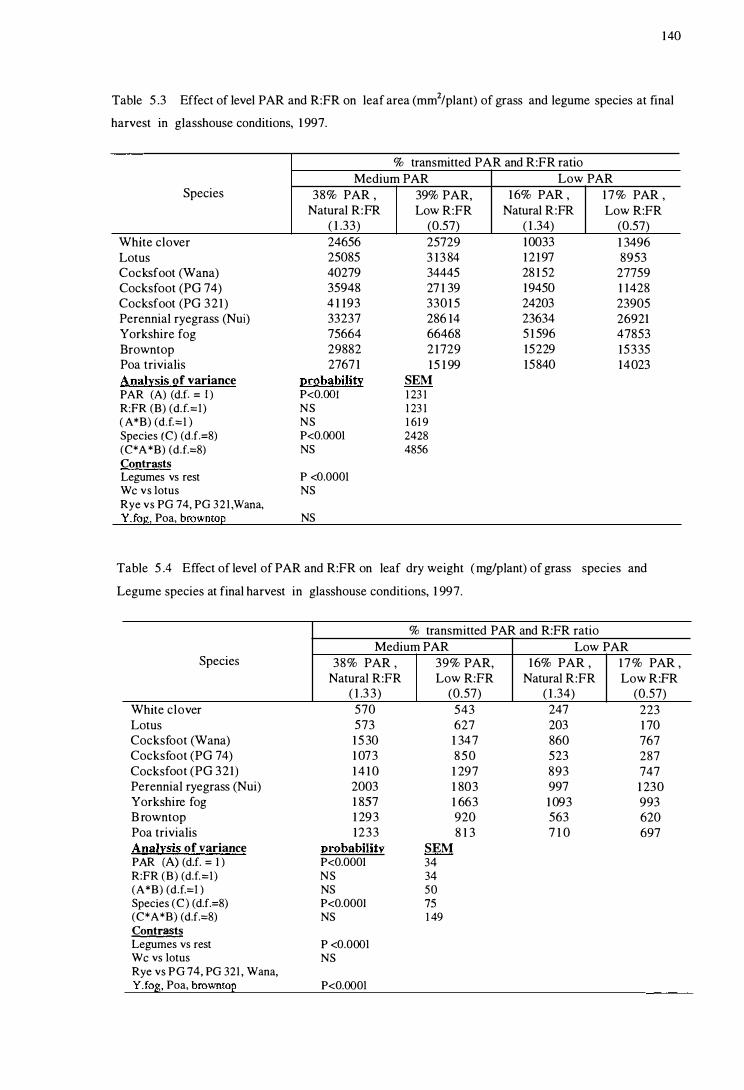
140
Table 5 .3 Effect of level PAR and R:FR on leaf area (mm2/plant) of grass and legume species at final
harvest in glasshouse conditions, 1 997.
% transmitted PAR and R:FR ratio Medium PAR Low PAR
Species 38% PAR , 39% PAR, 1 6% PAR , 1 7 % PAR , Natural R:FR Low R:FR Natural R:FR Low R:FR
( 1 .33) (0.57) ( 1 .34) (0.57) WhIte clover 24656 25729 10033 1 3496 Lotus 25085 3 13 84 12197 8953 Cocksfoot (Wana) 40279 34445 28 1 52 27759 Cocksfoot (PG 74) 35948 27 1 39 19450 1 1428 Cocksfoot (PG 321) 4 1 193 3301 5 24203 23905 Perennial ryegrass (Nui) 33237 286 14 23634 26921 Yorkshire fog 75664 66468 5 1 596 47853 Browntop 29882 2 1729 15229 15335 Poa trivialis 2767 1 15 1 99 15840 14023 Analysis of variance urobability SEM PAR (A) (d.f. == l ) P<O.OOI 1 23 1 R:FR (B) (d.f.::!) NS 1 23 1 ( A *B) (d.f.::l ) NS 1 61 9 Species (C) (d.f.==8) P<O.OOOl 2428 (C* A *B) (d.f.::8) NS 4856 Contrasts Legumes vs rest P <O.OOOl Wc vs lotus NS Rye vs PG 74, PG 321 ,Wana, Y.fog, Poa, browntop NS
Table 5 A Effect of level of PAR and R:FR on leaf dry weight ( mg/plant) of grass species and
Legume species at final harvest in glasshouse conditions, 1 997.
% transmitted PAR and R:FR ratio Medium PAR Low PAR
Species 38% PAR , 39% PAR, 1 6% PAR , 1 7 % PAR , Natural R:FR Low R:FR Natural R:FR Low R:FR
( 1 .3 3) (0.57) ( 1 .34) (0.57) WhIte clover 570 543 247 223 Lotus 573 627 203 1 70 Cocksfoot (Wana) 1 5 30 1 347 860 767 Cocksfoot (PG 74) 1 073 850 523 287 Cocks foot (PG 321) 1 4 1 0 1 297 893 747 Perennial rye grass (Nui) 2003 1 803 997 1 230 Yorkshire fog 1 857 1 663 1 093 993 B rowntop 1 293 920 563 620 Poa trivialis 1233 8 1 3 7 1 0 697 AnaJysis of variance (!robabilit£ SEM PAR (A) (d.f. == I ) P<O.OOOI 34 R:FR (B) (dJ.::l) NS 34 (A*B) (d.f.::! ) NS 50 Species (C) (d.f.==8) P<O.OOOI 75 (C*A*B) (d.f.::8) NS 1 49 Contrasts Legumes vs rest P <O.OOOl Wc vs lotus NS Rye vs PG 74, PG 321 , Wana, Y.fog, Poa, browntop P<O.OOOl

Table 5 . 5 Effect of Level of PAR and R:FR on stem dry weight (glplant) of grass and
legume species at final harvest in glasshouse conditions, 1 997.
% transmitted PAR and R :FR ratio
1 4 1
Medium PAR Low PAR Species 38% PAR , 39% PAR, 1 6% PAR , 1 7% PAR ,
Natural R:FR Low R:FR Natural R:FR Low R:FR ( 1 .33) (0.57) ( 1 .34) (0.57)
White clover 1 .3 0.7 0.3 0 . 1 Lotus 0.7 0.8 0.3 0.2 Cocksfoot (Wana) 1 . 1 0.7 0.7 0.2 Cocksfoot (PG 74) 0.6 0.4 0.2 0.2 Cocks foot (PG 321 ) 0.9 0.8 0.3 0.4 Perennial rye grass (Nui) 1 . 1 0.9 0.3 0.4 Yorkshire fog 1 .0 0.9 0.4 0.4 B rowntop l . l 1 .0 0.3 0.3 Poa trivialis 1 .0 0 .8 0.3 0.4 Analysis of variance J!robabilitv SEM PAR (A) (d.f. = I ) P<O.OOOl 0.03 R:FR CB) (d.f.=l ) P<0.05 0.03 (A*B) (d.f.=I ) NS 0.04 Species (C) (d.f.=8) P<O.Ol 0.06 (C*A*B) (d.f.=8) NS 0. 1 3 Contrasts Legumes vs rest NS Wc vs lotus NS Rye vs PG 74, PG 321 , Wana, Y .fog, Poa, browntop NS
Effect of PAR was significant (P<O.OOl ) for all the parameters related to tillering; total
tillers/plant, net tillers/plant developed in the shade, and tiller weight per plant.
However, R:FR only significantly affected the total and net tillers per plant (P<O.OOl ),
and not tiller weight. In contrast, species were significantly different (P<O.OOl) for all
the tiller related parameters. There were, however, no significant (P>O.05) interactive
effects of PAR, R:FR, and species for all these tillers parameters, except the pasture
species with PAR (P<O.OOl ) for the net tillers (Tables 5 .6, 5 .7 , 5.8).

1 42
Table 5.6 Effect of level of PAR and R:FR on 10& total tillers or stolonslbranches per plant of grass
and legume species at final harvest in glasshouse conditions, 1 997. Values in parentheses are back
transformed.
% transmitted PAR and R:FR ratio Medium PAR Low PAR
Species 38% PAR , 39% PAR, 1 6 % PAR , 1 7% PAR , Natural R:FR Low R:FR Natural R:FR Low R:FR
( 1 .33) (0.57) ( 1 .34) (0.57) White clover 2.97 (19 .4) 2.65 ( 14 . 1 ) 2 .21 (9. 1 ) 1 .73 (5.6) Lotus 3 .79 (44.2) 3 .61 (36.9) 3 . 39 (29.6) 3 . 1 9 (24.2) Cocksfoot (Wana) 3 .00 (20.0) 2.95 ( 19 . 1 ) 2.62 ( 1 3.7) 2.22 (9.2) Cocksfoot (PG 74) 2.82 ( 16.7) 2.56 (1 2.9) 1 .97 (7. 1 ) 1 .73 (5.6) Cocksfoot (PG 321 ) 2.78 ( 1 6. 1 ) 2.62 ( 13 .7) 2 . 1 8 (8.8) 2.3 1 ( 1 0.0) Perennial ryegrass (Nui) 3 .28 (26.5) 3 .29 (26.8) 2 .97 ( 19.4) 2.67 ( 14.4) Yorkshire fog 3 .27 (26.3) 3.09 (21 .9) 2.86 ( 17 .4) 2 .76 ( 15 .7) Browntop 3.52 (33.7) 3 .67 (39.2) 3 . 1 3 (22.8) 3.24 (25.5) Poa trivialis 4.03 (56.2) 3.78 (43.8) 3 .55 (34.8) 3.47 (32. 1 ) Analysis of variance urobabili!J:: SEM PAR (A) (d.f. = 1 ) P<O.OOOI 0.01 R:FR (B) (d.f.=l ) P<O.OOl 0.01 (A*B) (d.f.:l ) NS 0.04 Species (C) (d.f.:=8) P<O.OOOl 0.06 (C*A*B) (d.f.:=8) NS 0. 1 3 Contrasts Legumes vs rest NS Wc vs lotus P<O. 000 1 Rye vs PG 74, PG 3 2 1 , Wana, Y Jog, Poa, browntop NS

143
Table 5 .7 Effect of level of PAR and R:FR on 10& net tillers or stolonsl branches per plant of grass
and legume species developed in the shade at final harvest in glasshouse conditions, 1 997. Values in
parentheses are back transformed.
% transmitted PAR and R:FR ratio Medium PAR Low PAR
Species 38% PAR , 39% PAR, 1 6% PAR , 17% PAR , Natural R:FR Low R:FR Natural R:FR Low R:FR
( 1 .33-1 .34) (0.57) ( 1 .32-1 .37) (0.57) WhIte clover 2.80 ( 16.4) 2. 1 6 (8.67 1 .3 2 (3.7) 0.59 ( 1 .8) Lotus 3.62 (37.3) 3.45 (3 1 .5 ) 3 . 1 5 (23.3 ) 2.82 ( 16.7) Cocksfoot (Wana) 2.82 ( 16.7) 2.77 ( 15.9) 2.30 (9.9) 1 .83 (6.2) Cocks foot (PG 74) 2.64 ( 14.0) 2.36 (1 0.5) 1 .52 (4.5) 1 .29 (3.6) Cocks foot (PG 3 21 ) 2.64 ( 1 4 .0) 2 .40 ( 1 1 .0) 1 .87 (6.4) 2.08 (8.0) Perennial ryegrass (Nui) 3.04 (20.9) 3.07 (2 1 .5) 2.57 ( 13 .0) 2.42 ( 1 1 .2) Yorkshire fog 2.97 ( 19.4) 2.46 ( 1 1 .7) 2 .32 ( 1 0. 1 ) 2.07 (7.9) Browntop 3.25 (25.7) 3.43 (30.8) 2.74 ( 15 .4 ) 2.85 ( 1 7.2) Poa trivialis 3 .88 (48.4) 3.61 (36.9) 3 .28 (26.5) 3.24 (25 .5) Analysis of variance J:!robability SEM PAR (A) (d.f. ::: 1 ) P<O.OOl 0.02 R:FR (B) (d.f.:::: l ) P<O.OO I 0.02 (A*B) (d.f.::::! ) NS 0.05 Species (C) (d.f.:::8 ) P<O.OOOl 0.08 (C*A) (d.f.=8) P<O.OO l 0.12 (C* A *B) (d.f.::::8 ) NS 0.17 Contrasts Legumes vs rest P<0.05 Wc vs lotus P<O.OOOl Rye vs PG 74, PG 3 2 1 , Wana, Y.fog, Poa, browntoe NS
Higher numbers of total tillers or branches per plant were produced by all the species at
the medium PAR than at the low PAR. The highest number of tillers was on Poa and on
browntop among the grasses, and lotus had more branches per plant than white clover in
the case of legumes. This trend was similar under low PAR (Table 5.6). Tiller numbers
of Wana cocks foot, PG 74 cocksfoot and PG 321 cocks foot were smaller than for
perennial ryegrass, but were not significantly different (P>O.05) . In general, a lower
number of tillers were produced by all species under low R:FR compared with natural
R:FR, except in the case of browntop (Table 5.6).

Table 5 .8 Effect of level of PAR and R:FR on tiller weight per plant (mg) of grass species at final
harvest in glasshouse conditions, 1 997.
% transmitted PAR and R:FR ratio Medium PAR Low PAR
Species 38% PAR , 39% PAR, 1 6% PAR , 1 7% PAR , Natural R:FR Low R:FR Natural R :FR Low R:FR
( 1 .33- 1 .34) (0.57) ( 1 .32- 1 .37) (0.57) Cocks foot (Wana) 1 38 1 15 1 08 108 Cocksfoot (PG 74) 101 98 1 12 99 Cocksfoot (PG 321) 150 1 49 1 1 3 1 15 Perennial ryegrass (Nui) 119 101 7 3 109 Yorkshire fog I I I 1 1 8 8 9 93 Browntop 80 50 4 1 38 Poa trivialis 4 1 40 3 1 35 Anal,Ysis of variance l!robabiIitv SEM PAR (A) (d.f. == 1 ) P<O.OS 4.6 R:FR (B) (d.f.::l ) NS 4.6 (A*B) (d.f.==I ) NS 4.4 Species (C) (d.f.:::::8) P<O.OOOl 5.8 (C*A*B) (d.f.=8) NS 1 1 .5 Contrasts Rye vs PG 74, PG 321 , Wana P<O.OI Rye vs PG 74, PG 321 , Wana, Y Jog, Poa, browntop NS
1 44
Similarly to total tillers, higher numbers of net tillers or branches per plant were
produced by all the species at the medium PAR, than at the low PAR. Accordingly,
highest net tillers per plant were measured in Poa and browntop among the grasses, and
lotus had more net branches per plant than white clover (Table 5 .7). This trend was
similar under low PAR. R:FR ratio also affected the net tillerslbranches per plant: more
tillers or branches per plant were produced by all species at natural R:FR than at
reduced R:FR except browntop in both medium and low PAR (Table 5.7).
Except PG 74 cocksfoot, which had a higher tiller weight at low PAR than at medium
PAR mainly due to having fewer tillers, all other species had higher tiller weight at the
medium PAR than at low PAR. Under medium PAR, PG 3 2 1 and Wana cocksfoot had
the highest tiller weight/plant followed by Yorkshire fog, and perennial ryegrass. This
trend was similar under low PAR as well (Table 5.8).

Table 5 .9 Effect of level of PAR and R:FR on total number of leaves per plant of grass
and legume species at final harvest in glasshouse conditions, 1 997.
% transmitted PAR and R:FR ratio Medium PAR Low PAR
Species 38% PAR , 39% PAR, 1 6% PAR , 17% PAR , Natural R:FR Low R:FR Natural R:FR Low R:FR
( 1 .33) (0.57) ( 1 .34) (0.57) WhIte clover 1 00 8 1 32 24 Lotus 1 45 1 55 89 7 1 Cocksfoot (Wana) 78 76 65 43 Cocksfoot (PG 74) 73 56 27 22 Cocksfoot (PG 3 2 1 ) 6 3 68 36 44 Perennial rye grass (Nui) 1 00 96 77 7 1 Yorkshire fog 98 86 80 73 Browntop 1 58 1 54 89 1 07 Poa trivialis 24 1 1 93 1 53 1 28 Analysis of variance (!robability SEM PAR (A) (d.f. ::: 1 ) P<O.OOOl 2. 12 R:FR (B) (d.f.::: ! ) P<O.05 2. 12 (A*B) Cd.f.:::l ) N S 3.61 Species (C) (d.f.:::8) P<O.OOOl 5.42 (C* A *B) (d.f.=8) NS 10.85 Contrasts Legumes vs rest NS Wc vs lotus P<O.OOOl Rye vs PG 74, PG 321 , Wana, Y.fog, Po a, browntop NS
145
There was a significant effect of PAR (P<O.OO 1 ) and R:FR (P<O.05) on the total number
of leaves per plant. However, none of the interactive effects of PAR, R:FR, and species
were found to affect total number of leaves per plant except the interaction of species
with PAR (P<O.OOl ) (Table 5 .9) . In Yorkshire fog, perennial ryegrass and Wana
cocksfoot, total number of leaves per plant was 17-30% under low PAR relative to
medium PAR compared with 39% on PG 321 cocks foot. Total number of leaves per
plant was reduced by 69% in white clover under low PAR relative to medium PAR,
whereas the reduction was only 47% in lotus. Poa and browntop had more total leaves
per plant than the rest of the grass species at medium PAR. Lotus had more total
number of leaves per plant than white clover at both PAR levels, and reduction in
number of leaves at low PAR was much greater in white clover than in lotus. Total
number of leaves per plant was higher on perennial ryegrass than on cocksfoot, but the-

Table 5 . 1 0 Effect of PAR and R:FR on specific leaf area (mm2/mg) of grass and legume
species at final harvest in glasshouse conditions, 1 997.
% transmitted PAR and R:FR ratio
1 46
Medium PAR Low PAR Species
WhIte clover Lotus Cocksfoot (Wana) Cocksfoot (PG 74) Cocks foot (PG 32 1 ) Perennial ryegrass (Nui) Yorkshire fog Browntop Poa trivialis Analysis of variance PAR (A) (d.t. = 1 ) R:FR (B) (d.f.::: ! ) (A*B) (d.f.=l ) Species (C) (d.f.=8) (C*A*B) (d.f.:::8) Contrasts Legumes vs rest Wc vs lotus Rye vs PG 74, PG 321 , Wana, Y.fog, Poa, browntop
38% PAR , Natural R:FR
( 1 .33) 43.2 43.6 26.3 33.7 29.4 1 6.0 4 1 .0 23.3 22.8
l!robabilitv P<O.OI NS NS P<O.OOI P<0.05
P <0.001 P<0.05
P<O.OOl
39% PAR, 16% PAR , 17% PAR , Low R:FR Natural R:FR Low R:FR
(0.57) ( 1 .34) (0.57) 46. 8 38.4 60.0 49.5 59.7 53.6 25.7 32.6 36.8 3 1 .6 37.2 39.0 24.9 29.0 32.0 16. 1 23.7 22. 1 39.6 41.2 48. 1 23.4 27.4 24.4 1 8.7 22. 1 20.3
SEM 0.85 0.85 0.95 1 .43 2.87
relative decrease in the total number of leaves per plant on Wana cocksfoot and
perennial rye grass at the low PAR was similar (Table 5.9)
5.4.4 Specific leaf area (SLA)
PAR significantly affected SLA (P<O.Ol ), but there was no effect of R:FR on SLA, and
also the interaction between PAR and R:FR was not significant (P>O.05). There was a
significant effect (P<O.OOO 1 ) of species on SLA, and also a significant interaction of
species x R: FR (P<O.Ol ), and PAR x species x R:FR (P<0.05) (Table 5 . 1 0).
All the species had a higher SLA under low PAR than under medium PAR, but species
such as browntop, Poa and Yorkshire fog had similar SLA at both PAR levels . At low
PAR, lotus had the highest SLA, whereas the Poa had the lowest. SLA of Wana
cocksfoot was higher than perennial ryegrass at both PAR levels. SLA of PG 32 1
cocksfoot and PG 74 cocksfoot were similar to that of Wana cocksfoot (Table 5 . 10) .

1 47
R:FR had no effect on SLA. Yorkshire fog had the highest SLA followed by PG 74
cocksfoot and Wana cocks foot among the grass species, while lotus had a higher SLA
than white clover. SLA of perennial rye grass and Poa were lowest among the species
under both natural and low R:FR (Table 5 . 10).
5.4.5 Leaf:stem ratio
Species and PAR significantly affected (P<O.Ol ) the leaf:stem ratio. There were no
interactive effects of PAR, R:FR, and species, except the interaction of species with
PAR (Table 5 . 1 1) . Higher leaf: stem ratio was found at low PAR for all species except
lotus, which had similar ratio at low and medium PAR (Table 5 . 1 1 ) . At medium PAR,
leaf: stem ratio was highest for perennial ryegrass, and lowest for white clover. At low
PAR, the highest leaf: stem ratio was for perennial ryegrass, followed by Wana
cocksfoot and Yorkshire fog (Table 5 . 1 1 ) .
Table 5 . 1 1 Effect of level of PAR and R:FR o n leaf:stem ratio o f grass and legume species at final
harvest in glasshouse conditions, 1 997 .
% transmitted PAR and R:FR ratio Medium PAR Low PAR
Species 3 8 % PAR , 39% PAR, 1 6% PAR , l 7 % PAR , Natural R:FR Low R:FR Natural R:FR Low R:FR
( 1 .33) (0.57) ( 1 .34) (0.57) White clover 0.5 0.7 0.7 1 .8 Lotus 0.8 0.7 0.7 0.7 Cocksfoot (Wana) 1 . 3 1 .8 1 .6 3 . 1 Cocksfoot (PG 74) 1 .8 1 .7 2.2 1 .5 Cocksfoot (PG 321) 1 .5 1 .5 2.9 1 .8 Perennial ryegrass (Nui) 1 . 8 2.0 2.6 2.6 Yorkshire fog 1 . 8 1 .8 2 .3 2.3 Browntop 1 .3 0.9 1 .7 1 .7 Poa trivialis 1 .2 1 .0 2.0 1 .7 Analysis of variance nrobabili!! SEM PAR (A) (d.f. :::: 1 ) P<O.Ol 0.07 R:FR (B) (d.f.=! ) NS 0.07 (A *B) (d.f.=l ) NS 0.08 Species (C) (d.f.=8) P<O.OOOl 0 . 12 (C*A) (d.f.=8) P<O.Ol 0. 1 7 (C*A*B) (d.f.=8) NS 0.25 Contrasts Legumes vs rest P<O.OOOI Wc vs lotus NS Rye vs PG 74, PG 321 , Wana, Y.fog, Poa, browntop P<O.OO l

1 48
5.4.6 Root dry weight
Effects of PAR and R:FR on root dry weight were similar to the effects on leaf:stem
ratio, where only the effects of PAR (P<O.OOI) , species, and interactive effect of PAR x
species were significant (P<O.OOO l ) . There was n o effect o f R:FR on root dry weight
(Table 5 . 1 2).
Table 5 . 1 2 Effect of level of PAR and R:FR on root dry weight (glplant) of grass and legume species at
final harvest in glasshouse conditions, 1 997.
% transmitted PAR and R:FR ratio Medium PAR Low PAR
Species 38% PAR , 39% PAR, 1 6% PAR , 1 7 % PAR , Natural Low R:FR Natural R:FR Low R:FR
R:FR ( 1 .33) (0.57) ( 1 .34) (0.57) White clover 0. 1 3 0. 12 0.06 0.04 Lotus 0.21 0. 16 0.04 0.03 Cocks foot (Wana) 0.93 0.80 0.23 0 . 19 Cocksfoot (PG 74) 0.61 0.41 0. 1 6 0. 1 0 Cocksfoot (PG 321 ) 0.64 0.58 0. 1 9 0 . 1 5 Perennial rye grass (Nui) 0.89 0.82 0.20 0. 1 7 Yorkshire fog 0.85 0.8 1 0. 1 6 0. 1 5 Browntop 0.30 0.32 0.08 0.06 Poa trivialis 0.50 0.35 0. 1 4 0. 1 1 Analysis of variance I:!robabilitt SEM PAR (A) (d.f. = 1 ) P<O.OOI 0.02 R:FR (B) (d.f.=l ) NS 0.02 (A *B) (d.f.=l ) NS 0.01 Species (C) (d.f.=8) P<O.OOl 0.Q2 (C* A) (d.f.=8) P<O.OOl 0.35 (C* A *B) (d.f.=8) NS 0.04 Contrasts Legumes vs rest P<O.OOI Wc vs lotus NS Rye vs PG 74, PG 321 , Wana, Y.fog, Poa, browntop P<O.OOI
All the species had higher root dry weight at medium PAR than at low PAR, where
Wana cocks foot, followed by perennial ryegrass and Yorkshire fog had the highest root
dry weight and white clover had the lowest (Table 5 . 12). At low PAR, root dry weight
of Wana cocksfoot was the highest, whereas lotus, white clover and browntop had their
lowest root dry weight (Table 5. 1 2) .

1 49
Table 5 . 1 3 Effect of level of PAR and R:FR on chlorophyll 'a' concentration (mg/g) of grass and legume
species in glasshouse conditions, 1997.
% transmitted PAR and R:FR ratio Medium PAR Low PAR
Species 38% PAR , 39% PAR, 16% PAR , 1 7 % PAR , Natural Low R:FR Natural R:FR Low R:FR
R:FR ( 1 .33) (0.57) ( 1 .34) (0.57) WhIte clover 2.5 2.9 2.6 2.6 Lotus 2.5 2.3 2.5 3 .0 Cocksfoot (Wana) 2.6 2.5 2.3 2.5 Cocksfoot (PG 74) 2.3 2. 1 2.4 2.3 Cocksfoot (PG 32 1 ) 2 .2 1 .9 2.3 2.3 Perennial ryegrass (Nui) 1 . 8 2 . 1 1 .5 1 .7 Yorkshire fog 2. 1 2.0 1 .9 2.2 Browntop 3 . 1 3.3 3 .3 3 .2 Poa trivialis 2.4 3.0 2.5 3.0 Analysis of variance I!robability SEM PAR (A) (dJ. ::::: 1 ) NS 0 . 10 R:FR (B) (dJ.::::: l ) NS 0 . 10 (A*B) (d.f.:::::l ) NS 0.08 Species (C) (d.f.=8) P<O.OOl 0. 1 2 (C*A*B) (d.f.=8) NS 0.25 Contrasts Legumes vs rest P<0.05 Wc vs lotus NS Rye vs PG 74, PG 321 , Wana, Y.fog, Poa, browntop P<O.Ol
5.4.7 Chlorophyll concentration
Chlorophyll 'a' and 'b' concentration were not affected by PAR, R:FR ratio, and any
interactions between them. There were only species differences in terms of chlorophyll
concentration (Table 5. 13, 5 . 14).
Browntop, Poa, white clover, and Wana cocksfoot had significantly higher
concentrations of chlorophyll 'a' than other species. Perennial ryegrass had the lowest
chlorophyll ' a' , concentration. Except for lotus, PG 74 cocksfoot, and PG 321
cocks foot, all species had higher chlorophyll concentrations at medium PAR than at the
low PAR (Table 5. 1 3). Concentration for chlorophyll 'b' were similar to those for

Table 5 . 14 Effect of level of PAR and R:FR on chlorophyll ob' concentration (mg/g) of grass and
legume species in glasshouse conditions, 1 997.
% transmitted PAR and R:FR ratio Medium PAR Low PAR
Species 38% PAR , 39% PAR, 1 6% PAR , 17% PAR , Natural Low R:FR Natural R:FR Low R:FR
R:FR ( 1 .33) (0.57) ( 1 .34) (0.57) White c lover 1 .0 0.7 1 .2 0.9 Lotus 1 . 1 0.8 1 .0 1 . 3 Cocksfoot (Wana) l.l 0.8 1 . 1 0.9 Cocksfoot (PG 74) 10. 0.7 1 .0 0.8 Cocksfoot (PG 321) 0.9 0.8 1 . 1 0.8 Perennial rye grass (Nui) 0.8 0.9 0.8 0.6 Yorkshire fog 0.8 0.7 0.8 0.8 Browntop 1 .2 l A 1 .3 1 .2 Poa trivialis 0.9 l . l 1 .0 1 . 2 Analysis of variance (!robability SEM PAR (A) (d.f. == 1 ) NS 0.05 R:FR (B) (d.f.=l ) NS 0.05 (A *B) (d.f.:::! ) NS 0.05 Species (C) (d.f.=8) P<O.OOI 0.07 (C* A *B) (d.f.=8) NS 0. 1 5 Contrasts Legumes vs rest NS Wc vs lotus NS Rye vs PG 74, PG 321, Wana, Y.fog, Poa, browntop P<O.01
1 50
chlorophyll 'a' , but all the species had lower concentrations of chlorophyll 'b' at
medium PAR than at low PAR, except perennial ryegrass and browntop (Table 5 . 14).
There was a significant effect of PAR (P<O.05) and R: FR (P<O.Ol ) on the ratio of
chlorophyll 'a'/'b' (Table 5 . 15) . However, no interactive effects of PAR, R:FR, and
species were found (Table 5 . 1 5).
All the species had higher ratio of chlorophyll 'a'/'b' at medium PAR than at low PAR
(Table 5 . 15). White clover, Yorkshire fog, and Wana cocksfoot followed by lotus had
the highest ratio of chlorophyll 'a' /'b' , whereas the ratio in perennial ryegrass was the
lowest at medium PAR. At low PAR, however, the highest ratio was for Yorkshire fog
followed by PG 74 cocksfoot and browntop. Lotus and Nui had the lowest ratio at the
low PAR.
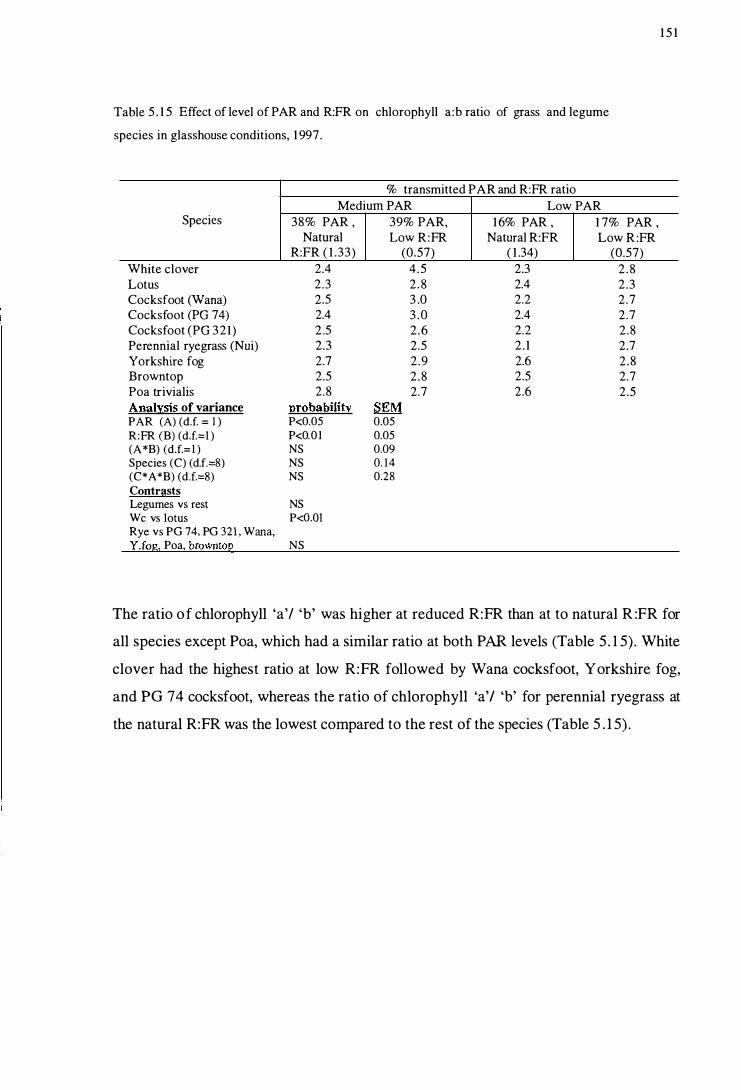
Table 5 . 1 5 Effect of level of PAR and R:FR on chlorophyll a:b ratio of grass and legume
species in glasshouse conditions, 1 997.
% transmitted PAR and R:FR ratio Medium PAR Low PAR
Species 38% PAR , 39% PAR, 1 6% PAR , 1 7% PAR , Natural Low R:FR Natural R:FR Low R:FR
R:FR ( 1 .33) (0.57) ( 1 .34) (0.57) WhIte clover 2.4 4.5 2.3 2 .8 Lotus 2.3 2.8 2.4 2.3 Cocks foot (Wana) 2.5 3 .0 2.2 2.7 Cocksfoot (PG 74) 2.4 3 .0 2.4 2.7 Cocksfoot (PG 321) 2 .5 2 .6 2.2 2.8 Perennial rye grass (Nui) 2.3 2.5 2 . 1 2.7 Yorkshire fog 2.7 2.9 2.6 2.8 Browntop 2.5 2.8 2.5 2.7 Poa trivialis 2.8 2.7 2.6 2.5 Analysis of variance J:!robability SEM PAR (A) (d.f. = 1 ) P<0.05 0.05 R:FR (B) (d.f.:::l ) P<O.O I 0.05 (A *B) (d.f.= l ) NS 0.09 Species (C) (d.f.:::8) NS 0. 14 (C*A*B) (d.f.:::8) NS 0.28 Contrasts Legumes vs rest NS Wc vs lotus P<O.Ol Rye vs PG 74, PG 321 , Wana, Y.fog, Poa, browntop NS
1 5 1
The ratio of chlorophyll 'a'/ 'b' was higher at reduced R:FR than at to natural R :FR for
all species except Poa, which had a similar ratio at both PAR levels (Table 5 . 1 5). White
clover had the highest ratio at low R:FR followed by Wana cocksfoot, Yorkshire fog,
and PG 74 cocksfoot, whereas the ratio of chlorophyll 'a'/ 'b' for perennial ryegrass at
the natural R:FR was the lowest compared to the rest of the species (Table 5 . 1 5) .
152
5.5 Discussion
The results showed that there was no interaction between PAR and R:FR for all of the
parameters measured. On the other hand, a significant interaction of PAR x species was
measured for shoot dry weight, Ieaf:stem ratio, root dry weight, log net tillers, and total
number of leaves per plant, but not for leaf area, leaf dry weight, stem dry weight, SLA,
tiller weight and chlorophyll concentration. There were no interactive effects of R:FR x
species , and PAR x R:FR x species for any parameters except SLA. The effect of R:FR
was not significant for most of the parameters studied, except stem dry weight, log total
tillers, log net tillers, total leaf number per plant, and the chlorophyll 'a' I 'b' ratio.
Effects of R:FR on plant species have been widely studied, particularly to investigate
the evolution of plant function (Schmitt and Wulff 1 993) and the structure of natural
vegetation (Smith 1982; Deregibus et al. 1983 ; 1994). Studies on the effects of R:FR
have often focussed either at the seedling stage to determine the sensitivity to light
competition (lefferson and Muri 1997), or to understand the effects of increased or
decreased ratio of R:FR light on a particular plant part such as the growing point of
white clover, and the shoot base of grasses (Casal et al. 1985, 1 986, 1 987a, b;
Solangaarachchi and Harper 1 987; Thompson 1993 ; Hay et al. 1 997) , which are
important from physiological points of view (Keating and Carberry 1 993), instead of the
morphology and production potential of the plants. The results of this study clearly
indicated that PAR is more important to the pasture species than R:FR ratio from the
production point of view. Results showed that apart from some interactive effects of
R:FR as in the case of stem dry weight, tillers, and total leaves per plant, other
parameters related to the yield and yield components were not affected by R:FR ratios.
This evidence combined with significant effects of PAR for all the parameters except
chlorophyll concentration, clearly indicated the relative importance of PAR over R :FR.
The ability of plant species to tolerate low light (shading) has its basis in
photosynthesis, viz. in the efficiency of utilization of light energy (Corn! 1983a, b). The
role of photomorphogenic light is mainly to work as a regulator of photosynthate
allocation in growing plants (Kasperbauer and Hunt 1 998).

1 53
Table 5 . 1 6 S ummary table of the parameters measured: mean values of the PAR and R:FR and the
differences.
PAR R :FR
Mean of Mean of Ratio of Mean of Mean of Ratio of
Parameters medium low PAR relativity natural low R:FR relativity
PAR (38, ( 1 7 , index % J R:FR (38, (39, l7% index
39%) 1 6%) (b) 1 6%PAR) PAR) % 1
(a) (a) (b)
Dry weIght (g/plant) 1 .86 0.78 4 1 1 .40 1 .29 92
Leaf area (mm2/plant) 34296 2 1 666 63 29663 1 5206 5 1
Leaf dry weight (mg/plant) 1 189 656 55 979 866 88
Specific leaf area (mm2/mg) 30 36 1 1 7 33 34 1 02
Stem dry weight (g/plant) 0.92 0.36 39 0.70 0.58 82
Leaf :stem ratio 1 .33 1 .88 141 1 .58 1 .62 102
Root dry weight (g/plant) 0.52 0. 1 2 23 0.35 0.29 82
Log total tillers Iplant 3.20 2.67 83 3 .0 1 2.86 95
Log net tillers per plant
developed inside the shade 2.96 2.23 75 2.70 2.49 96
Tiller weight (mg/plant) 1 00 82 82 93 90 99
Total number of leaves/plant 1 12 68 60 94 86 90
Chlorophyll 'a' (mg/g) 2.40 2.43 1 0 1 2.36 2.46 1 04
Chlorophyll 'b' ( mg/g) 0.91 0.98 1 07 0.98 0.91 92
Ratio of chlorophyll 'a' / 'b' 2.73 2.50 9 1 2.42 2.80 1 15
I value of Iow (b)/value of medium (a) xlOO
Generally, the values for all the parameters were greater at medium PAR than at low
PAR, and at natural R:FR than at reduced R:FR (Table 5 . 1 6) . However, reduction at the
low PAR, in comparison to medium PAR was much greater than at the low R:RF
compared with natural R:FR. This further strengthened the findings of previous studies
(Chapters 3 , 4), based on alteration of PAR only. However, these conclusions are
limited as they relate to only two levels of PAR and R:FR ratios. A lower R:FR ratio
than measured in this experiment could have had a greater effect on the parameters
measured.
In this experiment, mean PAR at medium and low shade were maintained 1 8 1 - 1 89
Ilmo1es photons m'2 S'l and 78-84 Ilmoles photons m'2 s'l , respectively, where reduced

1 5 4
R:FR ratio was 0.57 compared with 1 .3 3 for natural R:FR. The lower R:FR ratio was
similar to the R:FR ratio of 0.4-0.6 under dense tree canopies as reported by Wilson
( 1997), and that for deciduous wood lots of 0.36-0.97 (Smith 1 982).
Of the parameters measured, root weight was most affected followed by shoot dry
weight and leaf dry weight (Table 5 .9). Considering the PAR effects only, it was noted
root dry weight at low PAR was only about 23% of the medium PAR, whereas in terms
of R:FR ratios, root dry weight at the reduced R:FR was more than 80% of that of
natural R :FR. Similarly, mean shoot dry weight of the pasture species at low PAR was
only about 4 1 % of the medium PAR compared to 92% at reduced R:FR to that of
natural R:FR. Likewise, mean leaf dry weight of the pasture species was only about
55% at low PAR of that at medium PAR, whereas at low R:FR, it was nearly 90% of
that of natural R:FR.
Comparatively, tiller related attributes were least affected at low PAR and also at low
R:FR. At low PAR, >75% of the total tillers and net tillers/plant was produced by the
pasture species compared to that of medium PAR, while it was >95% in the case of low
R:FR relative to that of natural R:FR. This also indicated that tillering was least affected
under low R :FR in this study relative to the reduction from medium PAR to the low
PAR. However, there was a significant effect of R:FR on the tillering ability of pasture
species studied (Table 5.9, 5. 10). B ut, this could be largely also due to the influence of
R:FR only on some species like white clover, while on average, effects of R:FR seem
negligible relative to those of natural R:FR. Significant effects of R:FR on the pasture
species also suggested that there could be a different response of light quality as per
differences in species . Casal et al. ( 1986), however, reported that tillering was reduced
in perennial ryegrass at low R:FR. But, mean net tillers of all the species in this study
indicated that there were no marked effects of reduced R:FR on tillering. Low or no
effect of R:FR on tillering in this study, however, partly could be due to the general
application of reduced R:FR inside the shade frame rather than specifically treating the
individual plant parts. Hay et al. ( 1 997) reported the localised response of R:FR to the
apical bud of white clover in order to get the effects of reduced R:FR treatment.

1 55
Yorkshire fog, Wana cocksfoot, browntop, and Poa had higher shoot dry weight than
the rest at medium PAR, but at low PAR, perennial ryegrass, Wana cocksfoot and
Yorkshire fog had similar and higher shoot dry weight than the other species. One of
the important parameters, SLA which had the interaction for PAR as well as species and
R:FR indicates the different response of SLA to the species. This also indicated that
there could be an important relationship between SLA and shoot dry weight per plant
which could be varied by changes in both PAR and R:FR. Higher SLA of Wana
cocks foot, lotus, PG 74 cocks foot and Yorkshire fog than of perennial ryegrass
indicated the importance of SLA in terms of higher shoot dry weight.
In general, responses to low-light stress include an increase in plant leaf area (Sanderson
et al. 1997) which is usually at the expense of leaf thickness (Kephart et al. 1992;
Kephart and Buxton 1993) resulting in increased SLA. European tall-shrub species
increased SLA in shade (Grubb et al. 1996), and pasture species like white clover
grown at the reduced light of 30 J m-2 S-l also had greater SLA and longer petioles than
unshaded plants (Dennis and Woledge 1983). Dennis and Woledge ( 1983)
demonstrated that white clover grown in dim light or shade had a higher SLA, which is
interpreted as an adaptation to shade in that for each unit weight of leaf dry matter a
greater area is exposed to the available light. Higher SLA therefore means greater
ability of pastures to adapt and produce more in shade. Devkota et al. ( 1 997) reported
that lotus, Yorkshire fog, and Wana cocksfoot all produced relatively higher SLA and
shoot dry weight than other species in heavy shade ( 14% transmitted PAR).
Wana cocksfoot was one of the most shade tolerant cultivars in terms of shoot dry
weight per plant, mainly due to the larger leaf area per plant, higher number of tillers
and SLA per plant. This is consistent with the results of the previous studies (Chapters
3 , 4) and also with the findings of other researchers (Seo et al. 1 989) that Wana is a
shade tolerant cultivar and that it persists well under shade. However, total leaf number
seems less important for Wana cocks foot than to perennial ryegrass and Yorkshire fog,
as Wana cocksfoot had lower number of leaves per plant compared to those species, but
had a greater shoot dry weight in the shade.

1 56
Perennial ryegrass also had a greater shoot dry weight per plant like Wana cocksfoot,
which was in contrast to the results of the previous studies (Chapters 3 ,4). As in the
case of Wana cocks foot, greater shoot dry weight of perennial ryegrass was mainly
supported by the higher leaf area per plant, higher leaf dry weight, and higher number of
tillers per plant, but not by changed SLA. Perennial ryegrass had a lower SLA
compared with Wana cocksfoot and Yorkshire fog (Table 5. 10).
One important reason for the greater shoot dry weight per plant of perennial ryegrass
could be the establishment of pasture species under full sunlight at the beginning of the
experiment ( section 5.2. 1 ) . Similarly, pasture species were not defoliated for the entire
experimental period unlike the previous experiments. Perennial ryegrass establishes
faster than other species even under shade (Barker and Hunt 1 997), and thus could have
the advantage of capturing higher resources due to the maintenance of higher tiller
numbers and leaf area per plant compared with other species. Nevertheless, this
suggests that, provided the optimum leaf area and tiller density are maintained by
optimum grazing/defoliation management, perennial ryegrass could be a useful
improved grass species to grow under shade despite being a shade intolerant species .
Shoot dry weight per plant of Yorkshire fog was lower than Wana cocksfoot and
perennial ryegrass at low PAR in this study. West et al. ( 1 99 1 ) also reported that
Yorkshire fog was more vigorous than lotus as a forest understorey during the early
establishment phase from May to September. However, Yorkshire fog in this
experiment did not produce the highest shoot dry weight per plant despite having the
highest leaf area per plant. Higher SLA, total tiller numbers and net tiller numbers per
plant as well as higher chlorophyll 'a' / 'b' ratio were the main contributing factors for
the higher shoot dry weight per plant of Yorkshire fog in low shade.
Shoot dry weight per plant of the cocksfoot cultivars such as PG 74 and PG 321 was
between the legumes and the high producing grasses such as Wana cocksfoot and
perennial ryegrass. However, PG 74 cocksfoot had the higher SLA at the low PAR
compared with Wana cocksfoot and perennial ryegrass, while PG 32 1 had higher
leaf:stem ratio compared with both Wana and perennial ryegrass, especially under low
PAR with natural R:FR, and both the cultivars had the highest tiller weight per plant,

1 57
specially under low PAR with natural R:FR. Lower shoot dry weight per plant of these
species compared with Wana cocks foot could be due to lack of defoliation management.
Results of the previous studies (Chapters 3, 4) indicated that these species also produced
similar shoot dry weight per plant with Wana cocksfoot under heavy shade and regular
defoliation management.
Browntop and Poa produced high shoot dry weight per plant at medium PAR, but not at
low PAR. Higher shoot dry weight per plant of these species at medium PAR was due
to the higher number of tillers/plant, and chlorophyll concentration rather than leaf area
(Table 5 .7) , leaf dry weight (Table 5.8), and specific leaf area (Table 5 . 1 8). In the
previous experiments (Chapter 3), shoot dry weight production of both browntop, and
Poa was worse under heavy shade and periodic defoliation.
Production was poorer for the legumes than the grass species at both shade levels.
However, lotus was less affected than white clover under low PAR in terms of shoot dry
weight per plant. The leaf area of lotus was higher than the white clover at medium
PAR, but was lower than white clover at low PAR. Still, white clover had the lowest
shoot dry weight per plant at low PAR which could be mainly due to the lower number
of leaves (Table 5. 1 6) , and fewer stolons/plant, possibly resulting from the suppression
of stolons (Tables 5.9, 5 . 10, 5 . 1 2 and 5 . 13) . White clover also had the highest SLA at
low PAR and low R:FR. Leaf dry weight per plant of white clover at low R:FR was
reduced compared to its comparatively higher leaf area (Table 5.4). The relatively poor
performance of white clover thus appeared to result from the sensitivity of its stolons to
low light.
Similar shoot dry weight, higher SLA, number of branches/plant, and total leaves per
plant for lotus than white clover, indicated the suitability of lotus compared to white
clover for growth under shade, as found in Chapter 3 . Gadgil et al. ( 1986), West et al.
( 1988), and West et al. ( 199 1 ) also indicated that lotus is one of the most successful
legumes under shade, and can be readily established on a range of sites.

1 58
5.6 Conclusions
The effect of R:FR ratio was not significant for most of the parameters measured except
stem dry weight, tiller numbers and total number of leaves per plant. PAR was a more
important factor than light quality in influencing pasture growth under shade, and grass
species were more productive than legumes at low PAR. Perennial ryegrass, Wana
cocks foot and Yorkshire fog had the highest and similar shoot dry weight per plant
under low shade without defoliation. Poa and browntop had the highest tillers/plant at
low PAR, as well as low R:FR. However, the higher number of tillers for these two
species did not support a high shoot dry weight at the low PAR, mainly due to the low
tiller weight. Shoot dry weight was more affected in white clover than lotus at low PAR,
and they were both more severely affected than the grass species. However, lotus had a
higher SLA, and a higher number of branches per plant than white clover, especially
under low PAR with natural R:FR. White clover was more affected by light quality than
lotus and the grass species. Yorkshire fog and Wana cocksfoot had a greater leaf area
production under the low PAR, and were less affected by the changes in light quality
than the other species. The effects of R:FR on the tillering of Yorkshire fog and Wana
cocks foot were not as severe as for other species under Iow PAR.

159
5.7 References
Barker, S . W. and Hunt, J. A. 1997. Effects of shade by stands on grass species and
cultivar selection for football pitches. International Twigrass Society Research
Journal 8 :593-601 .
Casal, J . J . , Sanchez, R . A. and Deregibus, V. A . 1987a. Tillering responses of Lolium
multiflorum plants to changes of red/far-red ratio typical of sparse canopies.
Journal of Experimental Botany 38 : 1 432-1439.
Casal, J. J., Sanchez, R. A. and Deregibus, V. A. 1986. The effect of plant density on
tillering: the involvement of RfFR ratio and the proportion of radiation
intercepted per plant. Journal of Experimental Botany 26:365-37 1 .
Casal, 1 . 1 . , Deregibus, V. A. and Sanchez, R. A. 1985. Variations in tiller dynamics
and morphology in Lolium multiflorum Lam. Vegetative and reproductive plants
as affected by differences in red/far-red irradiation. Annals of Botany 56:443-
559.
Casal, 1 . 1 . S anchez, R. A. and Deregibus, V. A. 1987b. The effect of light quality on
shoot extension growth in three species of grasses. Annals of Botany 59: 1-7.
Corre, W. 1. 1983a. Growth and morphogenesis of sun and shade plants 1. The
influence of light intensity. Acta Bot. Neerl 32 ( 112): 49-62.
Corre, W. 1. 1983b. Growth and morphogenesis of sun and shade plants IT. The
influence of light quality. Acta Bot. Neerl 32 (3): 1 85-202.
Deregibus, V. A., Sanchez, R. A., Casal, J . J . and Trlica, M. J. 1 985. Tillering
responses to enrichment of red light beneath the canopy in a humid natural
grassland. Journal of Applied Ecology 22: 199-206.

1 60
Deregibus, V. A., Sanchez, R. A. and Casal, J. J. 1983. Effects of light quality on tiller
production in Lolium spp. Plant Physiology 72:900-902.
Dennis, W. D. and Woledge, J. 1 983 . The effect of shade during leaf expansion on
photosynthesis by white clover leaves. Annals of Botany 5 1 : 1 1 1 - 1 1 8.
Devkota, N . R. , Kemp, P. D. and Hodgson, J. 1997. Screening pasture species for shade
tolerance. Proceedings Agronomy Society of New Zealand 27: 1 19-128.
Gadgil, R. L. , Charlton, J. F. L. , S andberg, A. M. and AlIen, P. J . 1 986. Relative growth
and persistence of planted legumes in a mid-rotation radiata pine plantation.
Forest Ecology and Management 14: 1 1 3- 124.
Grubb, P. J . , Lee, W. G., Kollmann, J. and Wilson, J. B . 1 996. Interaction of irradiance
and soil nutrient supply on growth of seedlings of ten European tall-shrub
species and Fagus sylvatica. Journal of Ecology 84:827-840.
Harbome, J. B. 1973. Phytochemical methods: A guide to Modem Techniques of Plant
Analysis. Chapman and Hall, London, New York, 278p.
Hay, M. J. M. , Robin, Ch., Newton, P. C. D., Cresswell, A. and Tilbrook, J. 1 997.
Effects of lowered light quality (R:FR ratio) at targeted organs on branching of
Trifolium repens. Proceedings of the XVIII International Grasslands Congress,
Canada ID NO. 1092.
Holden, M. 1 965. Chlorophyll . Pp 462-488 in: Chemistry and Biochemistry of Plant
Pigments, Goodwin, T.W. ed. Academic Press, London.
Jefferson, P. G. and Muri, R. 1 997. Light quality effects on grass seedling growth and
development. Proceedings of the XVIII International Grassland Congress,
Canada ID NO. 1 634.

16 1
Johnston, M. and Onwueme, 1 . C. 1 998. Effects of shade on photosynthetic pigments
in the tropical root crops: yam, taro, tannia, cassava and sweet potato.
Experimental Agriculture 34:30 1 -3 1 2.
Kasperbauer, M. J. and Hunt, P. G. 1 998. Far-red light affects photosynthate allocation
and yield of tomato over red mulch. Crop Science 38:970-974.
Keating, B. A. and Carberry, P. S. 1993. Resource capture and use in intercropping:
Solar radiation. Field Crops Research 34:273-301 .
Kephart, K. D . and Buxton, D . R . 1 993. Forage quality responses of C3 and C4
perennial grasses to shade. Crop Science 33:831-837.
Kephart, K. D., Buxton, D. R. and Taylor, S. E. 1 992. Growth of C3 and C4 perennial
grasses under reduced irradiance. Crop Science 32: 1 033- 1038.
Lee, W. W., Oberbauer, S . F., Krishnapillay, B ., Marzalina, M. , Hacis, M. and Yap, S .
K. 1 994. Forest shade and seedling development in fine dipterocarps.
Proceedings, Fifth round-table conference on Dipterocarps, Chiang Mai,
Thailand, 7-1 0 November, 1 994. Forest Research Institute Malaysia (FRIM) ,
Kualalumpur. Pp 102- 1 16.
Loomis, R. S. and Williams, W. A. 1 963 . Maximum crop productivity: An estimate.
Crop Science 3 :67-72.
Murphy, J. S. and Briske, D. D. 1 994. Density-dependent regulation of ramet
recruitment by the red:far-red ratio of solar radiation: A field evaluation with the
bunchgrass Schizachyrium scoparium. Oecologia 97:462-469.
Sanderson, M. A., Stair, D. W. and Hussey, M. A. 1 997. Physiological and
morphological responses of perennial forages to stress. Advances in Agronomy
59: 17 1 -224.

1 62
SAS Institute Inc. 1997. SAS /STAT user's guide, Version 6 . 1 2 SAS Institute. Cary,
North Carolina, USA.
Schmitt, J. and Wulff, R. D. 1 993 . Light spectral quality, phytochrome and plant
competition. Trends in Ecology and Evolution 2:47-5 1 .
Seo, S . , Han, Y. C. and Park, M. S . 1 989. Grassland improvement and fertilization
management of woodland in Korea. Proceedings of the XVI International
Grassland Congress, Nice, France: 1487- 1488.
Shelton, H. M., Humpbreys , L. R. and B atello, C. 1987 . Pastures in the plantations of
Asia and the Pasific: Performance and prospect. Tropical Grasslands 2 1 : 1 59-
1 68 .
Smith, H. 1994. Sensing the light environment: the functions of the phytochrome
family. Pp 377-4 1 6 in: Photomorphogenesis in plants, Kendrick R. E. and
Kronenberg, G.H.M. ed., 2nd ed. Kendrick,Kluwer, Dordrecht.
Smith, H. 1982. Light quality, photoperception, and plant strategy. Annual Review of
Plant Physiology 3 3 :48 1 -5 1 8 .
Solangaarachchi, S . M . and Harper, J. L. 1 987. The effect of canopy filtered light on
the growth of white clover (Trifolium repens). Oecologia 72:372-376.
Teuber, N. and Laidlaw, A. S. 1 996. Influence of irradiance on branch growth of white
clover stolons in rejected areas within grazed swards. Grass and Forage
Science 5 1 :73-80.
Thompson, L. 1993. The influence of the environment around the node on
morphogenesis and growth of white clover (Trifolium repens). Grass and
Forage Science 48: 27 1-278.

163
Wan, C . and Sosebee, R.E. 1 998. Tillering responses to red: far-red light ratio during
different phenological stages in Eragrotis curvula. Environmental and
Experimental Botany 40: 247-254.
West, G. G. , Dean, M. G. and Percival, N. S. 199 1 . The productivity of Maku lotus as a
forest understorey. Proceedings of the New Zealand Grassland Association
53 : 1 69-173.
West, G. G., Percival, N. S. and Dean, M. G. 1988. Over sowing legumes and grasses
for forest grazing: Interim research results . Pp 203-222. Forestry Research
Institute Bulletin No. 1 39, Rotorua, New Zealand.
Wilson, 1. R. 1 997. Adaptive responses of grasses to shade: Relevance to turf grasses
for low light environments. International Turfgrass Society Research Journal
8 :575-59 1 .

1 64
6. Effect of defoliation frequency on the performance of Nui
perennial ryegrass and Wana cocksfoot under glasshouse
conditions
Page
6.1 SU"MJ\.fARY ......................................................•...........................•....................... 1 66
6.2 INTRODUCTION ................................................................................................ 167
6.3 MATERIALS AND METHODS ........................................................................ 169
6.3 . 1 Design and treatments . . . . . . . . . . . . . . . . . . . . . . . . . . . . . . . . . . . . . . . . . . . . . . . . . . . . . . . . . . . . . . . . . . . . . . . . . . . . . . . . . . . . . . 1 69
6.3.2 Measurements . . . . . . . . . . . . . . . . . . . . . . . . . . . . . . . . . . . . . . . . . . . . . . . . . . . . . . . . . . . . . . . . . . . . . . . . . . . . . . . . . . . . . . . . . . . . . . . . . . 1 7 1
6 .3 .2 . 1 Experiment 6. 1 . . . . . . . . . . . . . . . . . . . . . . . . . . . . . . . . . . . . . . . . . . . . . . . . . . . . . . . . . . . . . . . . . . . . . . . . . . . . . . . . . . . . . . . . . . 1 7 1
6.3 .2 .2 Experiment 6.2 . . . . . . . . . . . . . . . . . . . . . . . . . . . . . . . . . . . . . . . . . . . . . . . . . . . . . . . . . . . . . . . . . . . . . . . . . . . . . . . . . . . . . . . . . 1 72
6.3.3 Statistical analysis . . . . . . . . . . . . . . . . . . . . . . . . . . . . . . . . . . . . . . . . . . . . . . . . . . . . . . . . . . . . . . . . . . . . . . . . . . . . . . . . . . . . . . . . . . . . 1 73
6.4 RESUL TS .................................................................................................. . . . . . . . . . . . 174
6.4. 1 Experiment 6.1 . . . . . . . . . . . . . . . . . . . . . . . . . . . . . . . . . . . . . . . . . . . . . . . . . . . . . . . . . . . . . . . . . . . . . . . . . . . . . . . . . . . . . . . . . . . . . . . . 174
6.4. 1 . 1 Light environment . . . . . . . . . . . . . . . . . . . . . . . . . . . . . . . . . . . . . . . . . . . . . . . . . . . . . . . . . . . . . . . . . . . . . . . . . . . . . . . . . . . . . 1 74
6.4. 1 .2 Above ground biomass . . . . . . . . . . . . . . . . . . . . . . . . . . . . . . . . . . . . . . . . . . . . . . . . . . . . . . . . . . . . . . . . . . . . . . . . . . . . . . 1 74
6.4 . 1 .3 Relative growth rate (RGR) . . . . . . . . . . . . . . . . . . . . . . . . . . . . . . . . . . . . . . . . . . . . . . . . . . . . . . . . . . . . . . . . . . . . . . 1 76

165
6.4.2 Experiment 6.2 . . . . . . . . . . . . . . . . . . . . . . . . . . . . . . . . . . . . . . . . . . . . . . . . . . . . . . . . . . . . . . . . . . . . . . . . . . . . . . . . . . . . . . . . . . . . . . . . 1 78
6.4.2. 1 Light environment . . . . . . . . . . . . . . . . . . . . . . . . . . . . . . . . . . . . . . . . . . . . . . . . . . . . . . . . . . . . . . . . . . . . . . . . . . . . . . . . . . . . . 1 78
6.4.2.2 Shoot dry weight. . . . . . . . . . . . . . . . . . . . . . . . . . . . . . . . . . . . . . . . . . . . . . . . . . . . . . . . . . . . . . . . . . . . . . . . . . . . . . . . . . . . . . . . 178
6.4.2.3 Leaf area . . . . . . . . . . . . . . . . . . . . . . . . . . . . . . . . . . . . . . . . . . . . . . . . . . . . . . . . . . . . . . . . . . . . . . . . . . . . . . . . . . . . . . . . . . . . . . . . . . . . 1 80
6.4.2.4 Leaf dry weight . . . . . . . . . . . . . . . . . . . . . . . . . . . . . . . . . . . . . . . . . . . . . . . . . . . . . . . . . . . . . . . . . . . . . . . . . . . . . . . . . . . . . . . . . . 1 8 1
6 .4.2.5 Specific leaf area (SLA) . . . . . . . . . . . . . . . . . . . . . . . . . . . . . . . . . . . . . . . . . . . . . . . . . . . . . . . . . . . . . . . . . . . . . . . . . . . . 1 83
6.4.2.6 Tillers per plant . . . . . . . . . . . . . . . . . . . . . . . . . . . . . . . . . . . . . . . . . . . . . . . . . . . . . . . . . . . . . . . . . . . . . . . . . . . . . . . . . . . . . . . . . 1 84
6 .4.2.7 Root dry weight . . . . . . . . . . . . . . . . . . . . . . . . . . . . . . . . . . . . . . . . . . . . . . . . . . . . . . . . . . . . . . . . . . . . . . . . . . . . . . . . . . . . . . . . . 1 86
6.4.2.8 Tiller site usage . . . . . . . . . . . . . . . . . . . . . . . . . . . . . . . . . . . . . . . . . . . . . . . . . . . . . . . . . . . . . . . . . . . . . . . . . . . . . . . . . . . . . . . . . 1 87
6.4.2.9 Leaf appearance interval . . . . . . . . . . . . . . . . . . . . . . . . . . . . . . . . . . . . . . . . . . . . . . . . . . . . . . . . . . . . . . . . . . . . . . . . . . . . 1 88
6.5 DISCUSSION .... ......... . . . . . . . . . . . . . . . . . ..................... . . . . . . . . . . . . . . . . . . . . . . . . . . . . . . . . . . . . . . . . . . . . . . . . . . . . 190
6.6 CONCLUSIONS .......... . . . . . . . . . . . . . . .................................. . . . . . . . . . . . . . . . . _ . . . . . . . . . . . . . . . . . . . . . . . 194
6. 7 REFERENCES ..................................................................................................... 195

1 66
6.1 Summary
Two experiments were conducted to determine the relative growth rate (RGR) of two
grass species at the seedling stage, and also to obtain more information on their tillering
and biomass producing ability at different P ARIRF ratios and defoliation frequencies.
Experiment 6. 1 was conducted from 15 April to 1 9 June 1 998 at the Plant Growth Unit
(PGU) , Massey University. A split-plot design was employed with three replicate
blocks. The main plots were three levels of % transmitted PAR, IJ,moles photons m-2 S- l ,
400-700 nm, and R: FR ratio (photon irradiance between 655 and 665 nm, and between
725 and 735nm). Dactylis glomerata L. cv. Grasslands Wana, and Lolium perenne L.
cv. Grasslands Nui were compared as sub-plots. Among three PAR levels, one was
natural PAR under the glasshouse. For the other two PAR levels filters were used, one
was covered with neutral shade cloth (Sarlon) plus a layer of clear filter (Effects filters,
1 30 clear) while the other was covered with neutral shade cloth plus the steel blue filter
(Effects filter, 1 17) so that PAR levels of the two treatments were similar, but the blue
filter provided a low R:FR while the clear filter had a natural R:FR ratio. Two plants
were grown per pot. Water and fertiliser were non- limiting. Seven pots of each
treatment were maintained to conduct destructive harvests in each successive week in
order to carry out growth analysis.
Experiment 6.2 was conducted from 15 April, 1 998 to 10 August, 1 998 under similar
conditions to experiment 6. 1 . Six plants were maintained per pot. Plants were watered
daily. 3 PARJRF levels were used as main plots. Nui perennial ryegrass and Wana
cocks foot were grown in pots as sub-plots, and were defoliated at weekly (Wl ) and
three weekly (W3) intervals as sub-sub plots. At each defoliation, clipped biomass was
oven dried to calculate per plant cumulative herbage dry weight, and plants were fully
harvested on 1 0 August, 1 998. Total tillers in each treatment were counted weekly.
Likewise tiller site usage value was also calculated.
Results showed that the total (above and underground) RGR of Wana was always higher
than Nui at all PARJRF, in contrast to the consistently higher absolute mass per plant of

1 67
Nui over Wana at each PAR level. RGR of Wana was also less affected by reduced PAR
compared with Nui. However, RGR of both species was not affected by low R:FR.
Results of the defoliation experiment showed that effect of P ARIRF was significant for
cumulative shoot dry weight (P<O.OOl ), leaf area development (P<O.01 ), leaf dry weight
(P<O.OO l ), SLA (P<O.O l ), tillers per plant (P<O.OOl ), and root dry weight per plant at
the final harvest (P<O.OOOl) . Species differences were also significant for all these
measurements. At Iow PAR, Wana produced more shoot dry weight than Nui under
both defoliation frequencies. Wana outperformed Nui, especially at low PAR, mainly
due to the ability to produce higher leaf area and higher leaf dry weight. SLA of Wana
was significantly higher (P<O.OOl ) than that of Nui for WI as well as W3 defoliation.
Wana had significantly more tillers per plant than Nui at both low PAR plus natural and
reduced R:FR. Site usage value was also higher for Wana at low PAR plus natural
R:FR. Leaf appearance interval was shorter for Wana than Nui at all light levels. In this
experiment Nui was more affected by defoliation than Wana. Its low level of site usage
value reflected that under heavy shade and defoliation condition Nui would have less
chance of producing tillers than Wana. Wana could continue to produce leaf in spite of
high defoliation intensity.
6.2 Introduction
Many plant species have a constant relative growth rate (RGR) (Hunt 1 982) over a wide
range of irradiance. Plants grown in a low light intensity in the seedling development
phase, before the morphological adaptations to low light are accomplished, can have
decreased RGR because the relative increase in leaf area cannot compensate for the
lower light (Com� 1 983). However, studies on the differing reactions of RGR in
different light environments in pasture species are scarce.
Perennial forages are defoliated once or more during the growing season. Removing the
aboveground phytomass causes a large stress on the stubble, roots, and rhizomes by
depriving them partially or totally of assimilates (Richards 1993; Sanderson et al. 1 997).
The growth of perennial forages after defoliation is an important aspect of grazing

1 68
system management (Li et al. 1 997) . The removal of biomass by defoliation, generally
results in a reduction in absolute growth rate (AGR) depending on the RGR and the
amount of defoliated biomass (Hilbert et al. 1 98 1 ; Li et al. 1 997; Thomton and Millard
1 997).
The extent to which physiological and morphological responses influence pasture
production depends on the defoliation regime and the balance obtained between the
supply and demand of growth resources by plants (Chapman and Lemaire 1 993). In
general, defoliation reduces the supply of photosynthate to roots, but increases it to
shoot meristems and leaf growth regions (Bassmann and Dickmann 1 985) . This kind of
compensatory process of increased export from source to growing shoot sinks
contributes to a rapid re-establishment of the photosynthetic canopy to restore
homeostatic growth after defoliation (Richards 1993; Chapman and Lemaire 1993). If,
however, the limitation is more significant due to frequent or severe defoliation, plants
are unable to restore their original resource supply rates. Moreover, a very low level of
leaf area index (LA!) left after defoliation markedly reduces photosynthesis because of
insufficient green leaf tissue (Chapman and Lemaire 1 993).
The effects of defoliation could differ between plant species in the shade due to different
plant architecture (Gautier et al. 1 999), differences in ability to regenerate leaf area after
defoliation (Wilson and Ludlow 1 99 1 ), and also differences in the capacity to maintain
leaf area in response to defoliation frequency (Nassiri and Elgersma 1 998) . The growing
region of the leaf is a strong sink that can deprive other sinks, such as tiller buds.
Hence, defoliation of pasture plants under low light intensity will have a greater effect
than under high light intensity due to the decline in photosynthetic leaf area and
therefore light interception leading to a lower tiller density (Wong and SWr 1 996).
The previous experiments of pasture species showed the importance of PAR over R:FR
ratio with a marked effect of shade on tillering as well as on shoot dry weight
accumulation. Also, there were differences in species in terms of shade tolerance
(Chapters 3 ,4,5). Two further experiments were conducted to determine the RGR of
selected species at the seedling stage, and also to obtain more information on the

1 69
tillering and biomass producing ability at different P ARIRF ratios and defoliation
frequencies.
The objective of this research was to determine the morphological and growth responses
of perennial ryegrass and cocksfoot to defoliation at high light intensities with natural
R:FR ratio, and low light intensities with natural as well as reduced R:FR ratio. The
species were chosen to represent heavy shade tolerance (cocksfoot, cv. Grasslands
Wana) and relative shade intolerance (perennial ryegrass, cv. Grasslands Nui) as
determined by the previous studies (Chapters 3,4,5).
6.3 Materials and methods
6.3.1 Design and treatments
Experiment 6. 1 was conducted from 1 5 April, 1997 to 9 June, 1 997 (56 days) at the
Plant Growth unit (PGU), Massey University. A split- plot design was used with three
replicate blocks: the main plots were three levels of light intensity and subplots were
two pasture species. Shade levels were imposed with different densities of neutral shade
cloth (Sarlon) supported on hollow metal frames ( 1 .25 x 0.84 x 0.45m) arranged on
benches that were 0.9 m above the ground. The shade frames were aligned in a north
south direction (across the sun direction) in order to avoid direct radiation during low
sun elevation thus completely enclosed the pots. Three levels of transmitted
photosynthetic ally active radiation (PAR; Ilmoles photons m-2s-1 ,400-700nm) were
created. The transmitted PAR for the three treatments was 69, 25 and 24% of the
ambient PAR determined on a daily basis from 1 200 to 1 300 h throughout the
experiment using a LI-COR (Model LI- 1 85) portable quantum sensor. The treatment
with 69% ambient PAR, or 3 1 % shade, was not covered by shade cloth, as this was the
percentage of ambient PAR transmitted through the glasshouse. For the other two PAR
levels, one was covered with neutral shade cloth (Sarlon) plus a layer of clear filter
(Effects filters, 130 clear, Chris James and Co. LTD; Lighting Filters, 43 Colville Road,
Acton, London) while the other was covered with neutral shade cloth plus the steel blue
filter (Effects filter, 1 17) so that PAR levels of the two treatments were similar, but the

1 70
blue filter provided a low R:FR while the clear filter had a natural R:FR ratio. PAR was
measured inside and outside the glasshouse at the same time. Red:Far Red (R:FR) ratio
during clear sky days was measured two times during 1 200 to 1 300h with a Skye sensor
under the filters as well as in the open inside the glasshouse.
Details of the pasture species and cultivars used are given in Table 6. 1 . Seeds of the
pasture species were sown on 1 5 April, 1 998 in PB 6lh (3.9 litres) black polypots filled
with potting mix (80% tree bark + 20% pumice). Dolomite 300g, agricultural lime
300g, iron sulphate 50g, and Osmocote plus ( l 6N-3.5P- 1O.8K) 400 g per 1 00 litre were
blended with the potting mix, which was rated for medium to long-term « 9 months)
greenhouse crops. There were seven pots for each treatment so that weekly destructive
harvests for growth analysis could be made. Two plants were grown per pot, and plants
were watered daily.
Experiment 6.2 was conducted from 1 5 April, 1998 to 10 August, 1 998 ( 1 1 8 days) using
the same method as Experiment 1 , but with different design and treatments. The
transmitted PAR for the three treatments was 7 1 , 25 and 24% of the ambient PAR
determined on a daily basis from 1 200 to 1300 h throughout the experiment using a LI
COR (Model LI-1 85) portable quantum sensor. The treatment with 7 1 % ambient PAR,
or 29% shade, was not covered by shade cloth, as this was the percentage of ambient
PAR transmitted through the glasshouse. The other two levels of PAR were obtained
with the same arrangement of filters and shade cloth as in Experiment 6. 1 . The slight
difference in the levels of PAR in Experiment 6.2 compared to that of Experiment 6. 1
was probably due to the longer period over which the experiment was conducted.
Red:Far Red (R:FR) ratio during clear sky days for this experiment was measured three
times during 1 200 to 1 300h with a Skye sensor under the shade of the blue and clear
filters, which also included the first two times of measurement for Experiment 6. 1 .
Pasture species used in experiment 6.2 were the same as those in Table 6. 1 . Seeds of
the pasture species were sown on 1 5 April, 1998 in PB 611z (3.9 litres) black polypots
filled with potting mix (80% tree bark + 20% pumice). Dolomite 300g, agricultural
lime 300g, iron sulphate 50g, and Osmocote plus ( 1 6N-3 .5P- 1O.8K) 400 g per 1 00 litre

1 7 1
were blended with the potting mix, which was rated for medium to long-term « 9
months) greenhouse crops. Six plants were maintained per pot. Plants were watered
daily.
A split-split plot design was used with three replicate blocks: the main plots were shade
treatments; two species, Nui ryegrass, and Wana cocksfoot were maintained in pots as
the subplots, and sub-sub plots were Nui and Wana plants in subplots defoliated either
weekly (W l ) or three weekly (W3) (Figure 6. 1 ).
Table 6. 1 Pasture species and cultivars used in the Experiment.
Pasture species
1 . Cocks foot (Dactylis glomerata L. ) cv. Grasslands Wana
2. Perennial ryegrass (Lolium perenne L.) cv. Grasslands Nui
6.3.2 Measurements
6.3.2.1 Experiment 6.1
Plants were first harvested on 28 April, 1998 (two weeks after sowing). Subsequent
harvests were at 7day intervals; 5 May, 1 2 May, 19 May, 26 May, 2 June and 9 June
1 998. At each harvest, one pot from each treatment was randomly selected. All the
leaves and stems of both plants were separated, then were dried at 70 0 C for 24 hours.
Roots of both plants per pot were washed and then oven dried at 70 0 C for 24 hours.
Total dry weights of stem, leaf, and root per pot were converted to per plant values.

Figure 6 . 1 Experimental set-up showing one replication: 24% PAR plus reduced
R:FR with the use of filters, and 25% PAR plus natural R:FR ,without
filters.
6.3.2.2 Experiment 6.2
1 72
Defoliation was ftrst imposed on 8 June, 5 5 days after sowing, at 50 mm above the
media surface. Three cyc les of three-weekly defoliation were completed by 1 0 August,
1 99 8 . At each defoliation, clipped biomass was oven dried at 70 0 C for 24 hours and
added to the cumulative herbage mass per plant. On 1 0 August 1 998, one plant from
each treatment was randomly selected, all the leaves and stems separated and the leaf
area measured. Leaves and stems were then dried at 70 0 C for 24 hours and added to
the cumulative mass per plant. The remaining 5 plants were harvested at the base, and
oven dried at 70 0 C for 24 hours and added to the cumulative mass. Roots of all six
plants were washed and oven dried at 70 0 C for 24 hours to calculate root mass per
plant.
Total tillers in each pot were counted weekly. Site Usage was calculated as:
SU = { In (tnb) - In (tna) }/LI
1 7 3
Where, SU= site usage, tillerslleaf; tn b= tiller numbers per plant at time 'b' ; tn a= tiller
numbers per plant at time 'a' , and LI = leaf appearance interval in days (Skinner and
Nelson 1 992). Leaf Appearance Interval CLl) for each treatment was determined by
counting the days for each new leaf to appear. Since the defoliation treatment w as
imposed at weekly (W l ) or three-week (W3) intervals, it was practically impossible to
mark a single tiller and count the days to leaf appearance for the weekly defoliation
regime (Wl ) . Hence, 30 tillers in total, irrespective of replication, in W l treatments
were selected and marked with a plastic ring. All the leaves on each tiller were marked,
and new leaves on the marked tillers were counted 6 days later, before imposing
defoliation. Thus 1 80 tiller days were maintained in order to increase the probability of
the appearance of new leaves within the week in order to calculate the average leaf
appearance intervaL For the W3 treatments, one tiller per treatment was randomly
selected and marked with a plastic ring, all of the old leaves were spotted with a blue
marker, and new leaves were counted daily during 1200-1 300h until imposing the next
defoliation. This process was repeated three times, with cycle one from 8 June to 28
June, two from 29 June to 1 9 July, and three from 20 July to 9 August 1 998.
6.3.3 Statistical analysis
PROC GLM programme of SAS version 6 . 1 2 (SAS 1 997) was used for all analyses. For
Experiment 6. 1 , total dried mass of leaf, stem and root per plant were log transformed
using the natural logarithm and regressed against time. The regression slope estimated
mean relative growth rate (Hunt 1 982). ANOVA was performed on regressed data to
assess significance of differences in relative growth rate. For Experiment 6.2, residuals
were examined for their normality, and appropriate transformation was carried out (SAS
1 997) as indicated on the appropriate result table. The a level was set at 0.05. For all
the tables NS denotes non significant at P>0.05.

1 74
6.4 Results
6.4.1 Experiment 6.1
6.4.1.1 Light environment
Mean PAR at noon in the three shade treatments was 486, 1 77, and 1 69 llmoles photons
m-2s-1 resulting in 69, 25 and 24% ambient PAR respectively (Table 6.2). Mean PAR
outside the glasshouse was 707 llmoles photons m-2s- l •
Table 6.2 Light environment and shade levels used in Experimental 6. 1 .
Mean PAR
Shade (Ilmoles photons % fun sun light R:FR ratio
m-2 s·J)
0% shade, no shade cloth 486 69 1 .36
50% shade cloth + natural R:FR 177 25 1 .33
30% shade cloth + blue filter
(Iow R:FR) 1 69 24 0.68
6.4.1.2 Above ground biomass
Aboveground biomass, leaf and stem dry mass (mg/plant) at each harvest under
different PAR levels are presented in Table 6.3. There was a significant effect (P<O.Ol )
of shade (except for 28 April) , along with the differences in species (P<O.OOl ), and the
interaction (P<O.Ol ) of shade and species for all the harvests (Table 6.3). Accordingly,
both Nui and Wana produced their highest mass at 69% PAR and lowest at 24, and 25%
PAR. Likewise, biomass of Nui was always higher (P<O.OO l ) than Wana at each
harvest, while mass of both species under 25% and 24% PAR was similar throughout
the period (Table 6.3).

1 75
Table 6 .3 Above ground mass for Grasslands Nui perennial ryegrass and Grasslands Wana cocksfoot
under different PAR and R:FR levels.
April May 05 May 1 2 May 1 9 May 26 June 02 June 09
Treatments 28 ( 14-21 (21 -28 (28-35 (35-42 (42-49 (49-56
(0-1 4 days) days) days) days) days) days)
days)
ground mass
690/0 PAR, 00/0 shade
Nui 1 .0 8.0 3 1 .0 95.0 23 1 .0 426.0 785.0
Wana 0.4 1 .0 1 0.0 33.0 96.0 206.0 368 .0
250/0 PAR, natural R:FR
Nui 1 .0 4.0 9.0 32.0 75.0 101 .0 1 74.0
Wana 0.4 1 .0 3 .0 1 1 .0 37.0 72.0 1 37.0
240/0 PAR, low R:FR
Nui 1 .0 4.0 15 .0 36.0 60.0 119.0 173 .0
Wana 0. 1 1 .0 4.0 1 3 .0 38.0 74.0 1 33 . 0
Analysis of variance
Interactions (A*B) ** * ** *** * *** **
SEM 0.08 0.6 1 .0 2.0 1 6.0 1 3 .0 35.0
* P<0.05, ** P<O.Ol , *** P<O.OOl , degrees of freedom: 2 for shade, I for species, and 2 for shade x species. A and B
denotes shade and cu[tivars, respectively. SEM:::standard error of the mean
Nui had greater below ground mass than Wana at 69% PAR, which was significantly
higher (P<O.Ol ) than that at 24 and 25% PAR for all harvests (Table 6 .4). Nui had
similar below ground mass under 24 and 25% PAR, as did Wana, but the mass of Nui
was always higher (P<O.OO 1 ) than that of Wana for all harvests.

1 76
Table 6.4 Below ground mass for Grasslands Nui perennial ryegrass and Grasslands Wana cocksfoot
under different PAR and R:FR levels.
April May 05 May 1 2 May 1 9 May 26 June 02 June 09
Treatments 28 ( 14-2 1 (21 -28 (28-35 (35-42 (42-49 (49-56
(0- 14 days) days) days) days) days) days)
days)
Below ground mass (mg/plant)
69% PAR, 0% shade
Nui 1 .6 2.0 8.0 24.0 55.0 1 72.0 344.0
Wana 0.6 1 .0 3.0 9.0 28.0 66.0 1 33.0
25% PAR, natural R:FR
Nui 1 .0 1 .0 2.0 5.0 1 1 .0 1 6.0 32.0
Wana 0.4 0.6 2.0 3 .0 7.0 1 1 .0 23.0
24% PAR, low R:FR
Nui 1 .0 1 .0 2.0 6.0 8.0 1 5.0 3 1 .0
Wana 0.5 0.7 1 .0 3 .0 7.0 1 2.0 24.0
Analysis of variance
Interactions (A *B) NS NS * ** * *** ***
SEM 0. 1 0 . 1 0.7 1 .0 3 .0 0.6 1 2.0
* P<0.05, ** P<O.O l , *** P<O.OOl , degrees of freedom: 2 for shade, 1 for species and 2 for shade x species. A and B
denotes shade and cultivars, respectively. SEM=standard error of the mean
6.4.1.3 Relative growth rate (RGR)
The total (above and below ground) relative growth rate of Nui and Wana increased, in
general, with increase in ambient PAR. There was also a significant effect of shade
(P<O.OOl ) as well as differences in the species (P<O.OOl ) in the relative growth rate of
Nui and Wana (Figure 6.2) .

0.20
0. 1 8
0 . 1 6
0. 14
;;:; 0. 1 2 �
"t:l � 0. 1 0 '-'
� 0.08 � �
0.06
0.04
0.02
0.00
20 30 40
• Nu; • Wana
Nui: y = O.08667+O.0005x, r2=O.94 2 Wana: y = O. l l 108+O.0004x, r =0.92
50 60 70 80
% ambient PAR
90
1 77
1 00 1 10
Figure 6.2 RGR of Wan a and Nui grown under varied PAR ievels and R:FR: (P<O.Ol) for PAR as well
as species with NS for interaction of PAR x species. SEM of PAR and of species ± 0.001 . Note
that PAR levels on the x axis are adjusted to the shade rating of the Sarlon shade cloth: 30% PAR
for the 24% PAR with low R:FR treatment, 50% PAR for 25% PAR with natural R:FR treatment,
and 1 00% PAR (no shade cloth) for the 69%PAR with natural R:FR treatments.
Wana always had higher RGR than Nui at all PAR levels and R:FR ratios (Figure 6 .2) .
RGR of W an a and Nui at both 24 and 25% PAR were similar. However, both Nui and
Wana had higher RGR at 69% PAR compared with RGR at 24 and 25% PAR (Figure
6.2).

178
6.4.2 Experiment 6.2
6.4.2.1 Light environment
Mean PAR at noon in the shade treatments was 44 1 , 1 53 , and 149 J1,moles photons m-2s-
1 resulting in 7 1 , 25 and 24% ambient PAR, hereafter called H/N, UN and UR,
respectively, (Table 6.5). Mean PAR outside the glasshouse was 623 Ilmoles photons
-2 -1 m s .
Table 6.5 Light environment and shade levels used in Experiment 6.2.
Mean PAR % full R:FR
Shade (J.1 moles photons sun ratio
m-2s-1) light
0% shade, no shade cloth 44 1 7 1 1 .36
50% shade c1oth+ natural 153 25 1 .34
R:FR
30% shade cloth + blue filter 149 24 0.68
(Iow R:FR)
6.4.2.2 Shoot dry weight
Remarks
HIgh PAR, natural R:FR
(HIN) Low PAR, natural R:FR (UN)
Low PAR, reduced R:FR
(LIR)
Effects of PARJRF, species, and defoliation on shoot dry weight per plant were all
significant (P<O.OOl) . Likewise interactions for P ARlRFxdefoliation,
speciesxdefoliation and PARJRFxspecies were also significant (P<O.Ol ), but not the
P ARlRFxspeciesxdefoliation. Both Nui and Wana had higher cumulative shoot dry
weight at high PAR plus natural R:FR than at low PAR plus natural R:FR and low PAR
plus reduced R:FR (Table 6.6). Between the species, Nui had higher cumulative shoot
dry weight than Wana at high PAR plus natural R:FR while between the defoliation
frequencies, W3 had higher cumulative shoot dry weight than W l . However, at low
PAR and natural R:FR, Wana produced higher shoot dry weight than Nui under both
defoliation frequencies.

1 79
Table 6.6 Effects of level of transmitted photosynthetically active radiation (PAR) and Red to Far red
(R:FR) ratio: 7 1 % PAR+ natural R:FR , 1 .36 ( HIN); 25%PAR + natural R:FR, 1 .34 (UN), and 24%
PAR + reduced R:FR, 0.68 (LIR) under weekly (Wl ) and three weekly (W3) defoliation frequencies, on
the cumulative herbage dry mass (gfplant; in transformed 1) of cocksfoot (Grasslands Wana) and
perennial ryegrass (Grass lands Nui) at final harvest in glasshouse conditions, 1 998.
Species/defoliation
Perennial ryegrass f Wl Perennial ryegrass / W3 Cocks foot / W 1 Cocksfoot f W3
SEM for PARIR:FR SEM for species = 0.03 SEM for defoliation = 0.02 Overall SEM = 0.06
% transmitted PAR and R:FR ratio (P ARIRF)
High PAR plus Low PAR plus Low PAR plus natural R:FR natural R:FR reduced R:FR
(HIN) (UN) (LIR)
0.79 (2.20) - 1 .22 (0.29) - 1 .38 (0.25) 1 .72 (5.58) 0. 1 2 ( 1 . 1 2) 0.04 ( 1 .04) 0.88 (2.4 1 ) -0.45 (0.63) -0.43 (0.65) 1 .57 (4.80) 0.34 ( 1 040) 0.30 ( 1 .34)
0.04 0.04 0.04
W l = defoliated at 50 mm height in every week; W3= defoliated at 50 mm height in every three weeks; I figures inside the parentheses are back transformed value. SEM=standard error of the mean
At low PAR plus reduced R:FR, shoot dry weight of both species w as similar to that of
low PAR plus natural R:RF, but effects of defoliation were more visible, particularly for
weekly defoliation. Under the Wl regime, Nui had about 86% of its shoot dry weight at
low PAR plus reduced R:FR compared to that at low PAR plus natural R:FR, while
Wana had 100% or more of its shoot dry weight at low PAR plus reduced R:FR.
However, this difference was not found under W3 defoliation where both Nui and Wana
were similar (Table 6.6).
There were no significant differences between relative shoot dry weight per plant of Nui
and Wana at low PAR plus reduced R:FR and low PAR plus natural R:FR compared to
that of high PAR plus natural R:FR, although there were significant differences
between species and defoliation frequencies (P<O.OOl) (Table 6.7). Nui had lower
relative herbage production than Wana at both defoliation frequencies, while Wana had
a similar proportion of production at both low PAR plus reduced R:FR and low PAR
plus natural R:FR as well as W l and W3 defoliation frequencies (Table 6.7).

1 80
Table 6.7 Effects of level of transmitted photosyntheticaUy active radiation (PAR) and Red to Far red
(R:FR) ratio: 25%PAR + natural R:FR, 1 .34 (UN), and 24% PAR + reduced R:FR, 0.68 (UR) under
weekly (Wl ) and three weekly (W3) defoliation frequencies on the % relative dry mass/plant (compared
to that of 7 1 % PAR+ natural R:FR , 1 .36) of cocksfoot (Grasslands Wana) and perennial ryegrass
(Grasslands Nuj) at final harvest in glasshouse conditions, 1 998.
Species/defoliation
Perennial ryegrass I W l Perennial ryegrass / W3 Cocksfoot I W l Cocksfoot / W3
SEM for P ARIR:FR SEM for species = 0.78 SEM for defoliation = 0.66 Overall SEM = 1 .33
% transmitted PAR and R:FR ratio (P ARIRF) low PAR plus natural R:FR Low PAR plus reduced
(UN) R:FR
14 2 1 26 29
0.78
(UR)
1 1 1 9 27 28
0.78
W l = defoliated at 50 mm height in every week; W3= defoliated at 50 mm height in every three weeks. SEM= standard error of the mean
6.4.2.3 Leaf area
Leaf area per plant was significantly affected by PARJRF, species, and defoliation
frequencies (P<O.OOI), and the following interactions: PARJRFxdefoliation (P<O.05),
speciesxdefoliation (P<O.Ol ) and PARJRFxspecies (P<O.05) (Table 6.8).
Both species had higher leaf area under high PAR plus natural R:FR than at low PAR
plus natural R:FR and low PAR plus reduced R:FR, with the highest leaf area produced
by Wana cocksfoot under W3 defoliation. Leaf area of both species under W 1
defoliation was about half that of W3 at high PAR plus natural R:FR (Table 6 .8) .
Wana and Nui at low PAR plus natural R:FR, under both defoliation frequencies had
higher leaf area than at low PAR plus reduced R:FR, except Nui at W3 defoliation
which had higher leaf area at low PAR plus reduced R:FR. Leaf area of Nui under W3
defoliation at low PAR plus natural R:FR was only about 32% of Wana under W3
defoliation at low PAR plus natural R:FR, whereas this proportion was about 46 % in
the case of low PAR plus reduced R:FR.

1 8 1
Table 6.8 Effects of level o f transmitted photosyntheticaIly active radiation (PAR) and Red to Far red
(R:FR) ratio: 7 1 % PAR+ natural R:FR , 1 .36 ( H/N); 25%PAR + natural R:FR, 1.34 (UN), and 24%
PAR + reduced R:FR, 0.68 (UR) under weekly (Wl ) and three weekly (W3) defoliation frequencies on
the leaf area (mm2/plant) of cocksfoot (Grasslands Wana) and perennial ryegrass (Grasslands Nui) at
final harvest in glasshouse conditions, 1 998
Species/defoliation
Perennial ryegrass / Wl Perennial rye grass / W3 Cocksfoot / W l Cocksfoot I W3
SEM for PAR!R:FR SEM for species = 610 SEM for defoliation = 460 SEM for P ARJRF xdefoliation = 800 Overall SEM = 1 133
% transmitted PAR and R:FR ratio (P ARIRF) High PAR plus Low PAR plus Low PAR plus
natural R:FR natural R:FR reduced R:FR (HIN) (UN) (LIR) 5380 1 530 1 100 1 1730 4470 5780 1 2220 6040 5590 25 1 00 1 4070 1 2530
750 750 750
W l = defoliated at 50 mm height in every week; W3= defoliated at 50 mm height in every three weeks; SEM=standard error of the mean
On the other hand, W3 defoliation had higher leaf area than W l , and Wana had
significantly higher leaf area than Nui in both low PAR plus natural R:FR and low PAR
plus reduced R:FR as in the case of high PAR plus natural R:FR. (Table 6.8).
6.4.2.4 Leaf dry weight
PARJRF significantly affected the leaf dry weight, as did defoliation (P<O.OOl) but not
the species (P>0.05). Only the interaction of P ARfRFxdefoliation was significant
(P<O.OOl) (Table 6.9). Highest leaf dry weight was for Nui at W3 followed by Wana
W3 defoliation under high PAR plus natural R:FR. Leaf dry weight of both species at
W l defoliation was only about 40% of W3 defoliation.

1 82
Table 6.9 Effects of level of transmitted photosynthetically active radiation (PAR) and Red to Far red
(R:FR) ratio: 7 1 % PAR+ natural R:FR , 1 .36 ( HIN); 25%PAR + natural R:FR, 1 .34 (UN), and 24%
PAR + reduced R:FR, 0.68 (UR) under weekly (W I ) and three weekly (W3) defoliation frequencies on
the leaf dry weight (glplant) of cocksfoot (Grasslands Wana) and perennial ryegrass (Grasslands
Nui) at final harvest in glasshouse conditions, 1 998.
Species/defoliation
Perennial ryegrass / W I Perennial ryegrass I W3 Cocksfoot I W l Cocksfoot I W3
SEM for PARIRF SEM for species = 0.02 SEM for defoliation :::: 002 SEM for P AR!RFxdefoliation = 0.03 Overall SEM :::: 0.05
% transmitted PAR and R:FR ratio (PARIRF) High PAR plus Low PAR plus Low PAR plus
natural R:FR natural R:FR reduced R:FR (HIN) (UN) (UR) 0.36 0.06 0.04 1 . 16 0.32 0.30 0.46 0. 1 6 0. 15 1 .08 0.38 0.38
0.03 0.03 0.03
Wl= defoliated at 50 mm height in every week; W3= defoliated at 50 mm height in every three Weeks; SEM=standard error of mean
Leaf dry weight of both species at both defoliation frequencies under low PAR plus
natural R:FR and low PAR plus reduced R:FR was similar. Wana W3 had similar leaf
dry weight to Nui W3. Wl defoliation produced the lowest leaf dry weight for both
species, but leaf dry weight of Nui under Wl defoliation at low PAR plus reduced
R:FR, and low PAR plus natural R:FR, was only about 25 and 37% respectively of that
of Wan a W l (Table 6.9).
1 83
6.4.2.5 Specific leaf area (SLA)
PARJRF and species, but not defoliation, significantly affected SLA (P<O.OI ) . There
were no significant interactions of PARIRF, species and defoliation on SLA. SLA of
both Nui and Wana was greater at low PAR plus natural or reduced R:FR than at high
PAR plus natural R:FR (Figure 6.3), whereas it was similar at low PAR plus natural
R:FR and low PAR plus reduced R:FR for all the treatments, except Nui W3 which was
higher at low PAR plus reduced R:FR than at low PAR plus natural R:FR.
SLA of Wana was always higher than that of Nui at each P ARIRF level. Nui had lower
SLA at each PARIRF level indicating that SLA of Nui was more affected by defoliation
frequency than Wana (Figure 6.3) . Considering all PARIRF levels, Nui at W l
defoliation had about 58% of the SLA of Wan a at W l defoliation. Likewise, Nui at W3
defoliation had only about 45 % of the SLA of Wana W3 defoliation.
SLA of Nui increased 1 4 1 % from high PAR plus natural R:FR to low PAR plus natural
R:FR, and increased further to 1 66% for low PAR plus reduced R:FR. SLA of Wana
increased to 146% and 1 36% respectively for low PAR plus natural R:FR and low PAR
plus reduced R:FR from that of high PAR plus natural R:FR (Figure 6.3).
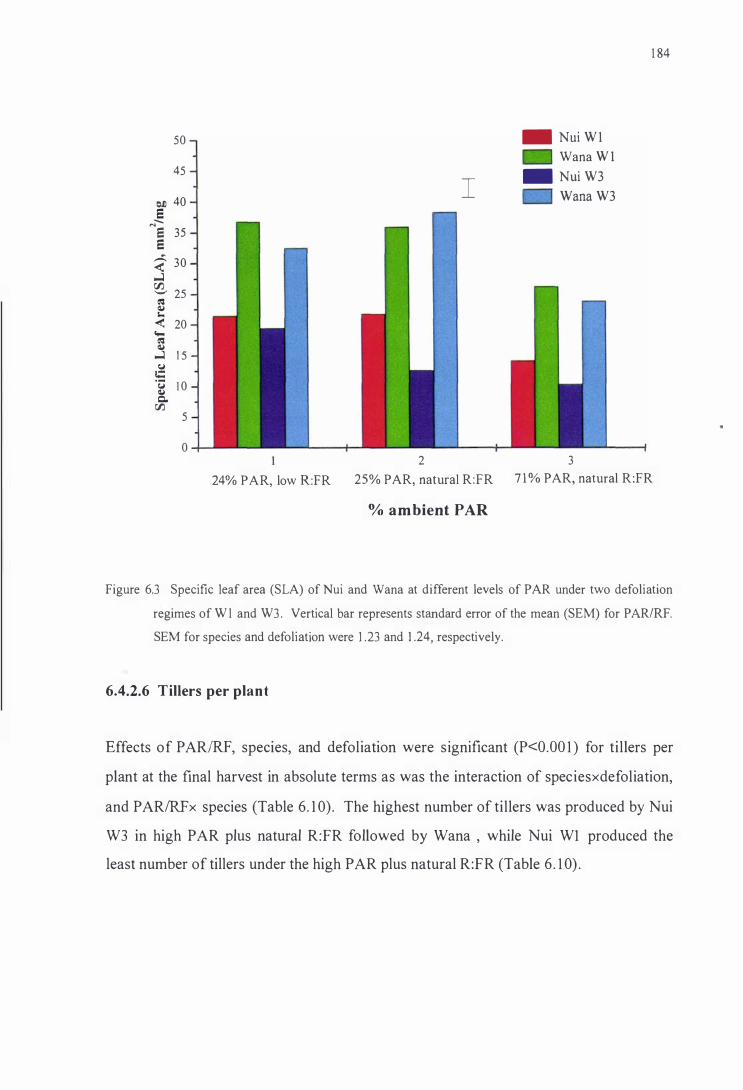
50
45
t:J) 40 e
N--
e 35 e � 30 � rJJ '-" 25
� � r.. < 20
.... � �
� 1 5 <:j
<:: .c:; 1 0 � C. rJJ 5
0
1 84
_ Nui Wl Wana Wl
_ Nui W3 I Wana W3
2 3 24% PAR, low RFR 25% PAR, natural R:FR 7 1 % PAR, natural R:FR
% ambient PAR
Figure 6.3 Specific leaf area (SLA) of Nui and Wana at different levels of PAR under two defoliation
regimes of W l and W3 . Vertical bar represents standard error of the mean (SEM) for PARIRF.
SEM for species and defoliation were 1 .23 and 1 .24, respectively.
6.4.2.6 Tillers per plant
Effects of PARIRF, species, and defoliation were significant (P<O.OO l ) for tillers per
plant at the fmal harvest in absolute terms as was the interaction of speciesxdefoliation,
and PARlRFx species (Table 6. l 0) . The highest number of tillers was produced by Nui
W3 in high PAR plus natural R:FR followed by Wana , while Nui W1 produced the
least number of tillers under the high PAR plus natural R:FR (Table 6 . 1 0) .

1 85
Table 6. 1 0 Effects of level of transmitted photosynthetically active radiation (PAR) and Red to Far
red (R:FR) ratio: 7 1% PAR+ natural R:FR , 1 .36 ( HIN); 25%PAR + natural R:FR, 1 .34 (UN), and
24% PAR + reduced R:FR, 0.68 (LIR) under weekly (Wl ) and three weekly (W3) defoliation
frequencies on the number of tillers/plant of cocksfoot (Grasslands Wana) and perennial ryegrass
(Grasslands Nui) at final harvest in glasshouse conditions, 1 998.
Species/defoliation
Perennial ryegrass / W 1 Perennial ryegrass / W3 Cocksfoot / W 1 Cocksfoot I W3
SEM for PARIR:FR SEM for species = 1 .04 SEM for defoliation = 0.7
SEM for PARlRFxdefoliation = 1 .0 Overall SEM = 1 .73
% transmitted PAR and R:FR ratio (P AR/RF)
High PAR plus Low PAR plus Low PAR plus natural R:FR natural R:FR reduced R:FR
(HIN) (UN) (L/R) � 6 5 48 19 12 41 30 23 38 3 1 23
1 .2 8 1 .28 1 .28
W I:::: defoliated at 50 mm height in every week; W3= defoliated at 50 mm height in every three weeks; SEM= standard error of the mean
Nui and Wana both had significantly higher numbers of tillers at low PAR plus natural
R:FR than at low PAR plus reduced R:FR for both defoliation frequencies, except Nui
W l which had the lowest number of tillers per plant (Table 6. 10). Wana W 1 and W3
both had almost similar number of tillers per plant at low PAR plus natural R:FR, which
was about 75% of the number at high PAR plus natural R:FR, while Nui W3 had 40%
and Nui W 1 about 1 8% of the tillers per plant compared to that of Nui W3, and Nui W l ,
respectively at high PAR plus natural R:FR. Tiller numbers at Iow PAR plus reduced
R:FR decreased to that of low PAR plus natural R:FR, but Wana, both at W l and W3, at
Iow PAR plus reduced R:FR had about 75% of the tillers of Wana W l and W3 at low
PAR plus natural R:RF, while the number of tillers for Nui W3 at low PAR plus
reduced R:FR was only about 60% of that of Nui W3 at low PAR plus natural R:FR.
However, tiller number per plant of Nui W l at low PAR plus natural R:FR and at low
PAR plus reduced R:FR were similar (Table 6 .10) .

186
Table 6. 1 1 Effects of level of transmitted photosynthetically active radiation (PAR) and Red to Far red
(R:FR) ratio: 71 % PAR+ natural R:FR , 1 .36 ( HIN); 25%PAR + natural R:FR, 1 .34 (UN), and 24%
PAR + reduced R:FR, 0.68 (L/R) under weekly (W l ) and three weekly (W3) defoliation frequencies on
root dry weight (glplant; In transformed I) of cocksfoot (Grasslands Wana) and perennial ryegrass
( Grasslands Nui) at final harvest in glasshouse conditions, 1998
Species/defoliation
Perennial ryegrass / W 1 Perennial ryegrass I W3 Cocksfoot / W l Cocksfoot I W3
SEM for PAR/R:FR SEM for species == 0.06 SEM for defoliation = 0.08 Overall SEM :::: 0.20
% transmitted PAR and R:FR ratio (PARIRF)
High PAR plus Low PAR plus Low PAR plus natural R:FR natural R:FR reduced R:FR
(HIN) (UN) (L/R) - 1 .97 (0. 1 3) -4.02 (0.01 ) -4.47 (0.01) -0. 1 1 (0.89) -2.84 (0.05) -2.89 (O.OS) - 1 .7 1 (0. 1 8 ) -3.57 (0.02) -3 .49 (0.03) -0.39 (0.67) -2.32 (0.09) -2.41 (0.08)
0.08 0.08 0.08
Wl= defoliated at 50 mm height in every week; W3:: defoliated at 50 mm height in every three weeks; 1 figure inside the parentheses are the value of back transformed; SEM= standard error of the mean
6.4.2.7 Root dry weight
Effect of PARIRF (P<O.OOl) , species (P<O.Ol) , and defoliation (P<O.OOOl ) on per plant
root dry weight at final harvest were significant. However, there was no interaction of
PARfRF, species, and defoliation frequencies (P>O.05). For both species, under both
defoliation frequencies, root dry weight was higher at high PAR plus natural R:FR.
Accordingly, Nui W3 had highest root dry weight followed by Wana W3. Root dry
weight of Nui and Wana W l at high PAR plus natural R:FR was similar (Table 6. 1 1 ) .
Among low PAR levels, both Nui and Wana either at Wl or W3 defoliation frequency
had similar root dry weight per plant, but Wana W3 had the highest root dry weight per
plant and Nui W l the lowest at both low PAR plus natural R:FR and low PAR plus
reduced R:FR (Table 6. 1 1) .

1 87
6.4.2.8 Tiller site usage
Tiller site usage was higher for Wana W3 then Wana W 1 at low PAR plus natural R:FR
taking the whole experimental period. Site usage of Wana was also higher at low PAR
plus reduced R:FR and high PAR plus natural R:FR, but site usage of Nui was very low
particularly by Nui Wl at low PAR levels, both with natural and reduced R:FR (Figure
6.4d).
0.16
014
0.12
O.W 0.08
o.tJ6
0.08 (c) Cycle ill
o.m
0.06
0.05
O.M 0.03
0.01
24 25
----- Nw Wl
�"-- Nui W3
• Wana WI
....... - W.Il. W3
0.42
0.40
038
0.36
0.34
0.32
0.30
0.28
0.26
0.24
0.21
0.20
0.18
0.16
0.14 0.12 0.10
0.08
(b) Cycle n
0.06 O.Mi-';:::::;:::::=;:====:;:::"�--r_�..,.......� 7I 24
% ambient PAR 25 71
Figure 6.4 Site usage (tillersJIeat) of Nui and Wana under different PAR, R:FR and defoliation
frequency: (a) cycle I (8 June-28 June), (b) cycle II (29 June-19 July), (c) cycle III (20 July-9
August), and (d) cycle IV (for the whole period of 8 June-9 August, 1 998). Where, 24% PAR
was with low R:FR, and 25% and 7 1 % PAR were with natural R:FR light.

1 88
Results also indicated that the probability of a tiller appearing in Wana W3 at low PAR
plus natural R:FR was almost one in two leaves, while for Nui W3, one tiller would
have emerged for every five leaves.
There was a changing trend of site usage by both Nui and Wana in each cycle. For
example, during the first cycle, site usage in all the treatments was lowest at low PAR
and reduced R:FR, however, it increased in the second cycle in all treatments except,
Nui W l (Figure 6.4 a, b). All the treatments had higher site usage values at low PAR
plus natural R:FR in both cycles, but Wana W3 had the highest site usage. In all cycles,
Wana had a higher site usage than Nui, particularly Wana W3 which had the highest site
usage at high PAR plus natural R:FR, except in cycle rn, where Nui W 1 was highest.
However, Wana W3 and W l both had higher site usage in all three cycles at low PAR
plus reduced R:FR, except at cycle III (Figure 6.4). A similar trend was repeated at
low PAR plus natural R:FR, except in cycle IT, where Nui W3 was similar to Wana W3.
Nui W l had the lowest site usage overall, and in all cycles, except during cycle ID at
high PAR plus natural R:FR (Figure 6.4).
6.4.2.9 Leaf appearance interval
Leaf appearance interval was shorter for Wana than Nui at all PARIRF levels (Table
6. 12) . S hortest duration for the appearance of a new leaf was at low as well as high
PAR with natural R:FR for Wana W3 (Table 6. 1 2) . At high PAR plus natural R:FR, Nui
W3 also had the shortest leaf appearance interval (cycle IT, Ill ). Overall, leaf
appearance interval was greater at low PAR plus reduced R:FR (Table 6. 1 2) .

1 89
Table 6. 1 2 Effects of level of transmitted photosynthetically active radiation (PAR) and Red to Far red
(R:FR) ratio under different defoliation frequencies on the leaf appearance interval (days) of cocksfoot
(Grasslands Wana) and perennial ryegrass (Grasslands Nui) in glasshouse conditions, 1 998.
Species/defoliation
Cycle I (June 8-June28)
Perennial ryegrass (Nui, W l ) Perennial ryegrass (Nui, W3) Cocksfoot (Wana,W l )
Cocksfoot (Wana,W3) Cycle il (June 29-July 19)
Perennial ryegrass (Nui, W l )
Perennial ryegrass (Nui, W3) Cocksfoot (Wana,W l ) Cocksfoot (Wana,W3) Cycle ill (July 20-August 9)
Perennial ryegrass (Nui, W I ) Perennial ryegrass (Nui, W3) Cocks foot (Wana,W l ) Cocksfoot (Wana,W3)
A verage of 3 cycles
Perennial ryegrass (Nui, W l ) Perennial ryegrass (Nui, W3)
Cocksfoot (Wana,W l ) Cocksfoot (Wana,W3)
% transmitted PAR and R:FR ratio (P ARIRF)
High PAR plus Low PAR plus Low PAR plus
natural R:FR natural R:FR reduced R:FR (H/N) (UN) (L/R)
8.3 1 3 .3 1 1 .9
7.2 1 0.3 1 0.6
6.7 7.2 7.9
4.9 5 . 1 6.0
8.2 I Ll 1 3 . 1
5.6 7.3 7.5
7.3 7.3 7.2
5. 1 5 . 3 5 . 5
7 . 2 1 0.6 1 1 .7
6.6 6.8 9.3
7. 1 6.9 7 .6
7.0 4.7 7.0
7.9 1 1 .7 1 2.2
6.5 8 . 1 9. 1
7.0 7 . 1 7.6
5.7 5 .0 6. 1
The pattern of leaf appearance interval for the species over all cycles were similar.
Wana W3 required the least days in all cycles at all PAR levels, except at cycle rn, high
PAR plus natural R:FR, where Nui W3 was faster. Nui W 1 had the longest leaf
appearance interval in all cycles at all P ARIRF levels. The general trend for shortest to
longest leaf appearance interval was Wana W3 < Wana W 1 < Nui W3 < Nui W 1 (Table
6. 1 2).

1 90
6.5 Discussion
The RGR of Wana cocksfoot was always higher than that of Nui perennial ryegrass at
all PAR!R: FR. RGR of Wan a was less affected by reduced PARIRF compared with Nui.
Low PAR and reduced R:FR ratio had less affect on Wana than Nui, particularly under
weekly defoliation. Wana produced higher biomass than Nui under both W l and W3
defoliation regimes mainly due to its ability to produce higher leaf area, and higher leaf
dry weight at low PAR plus natural or reduced R:F. Likewise, SLA of Wana was
always higher than that of Nui at each P ARIRF level. Nui had the lowest SLA at each
P ARIRF level indicating that SLA of Nui was more affected by defoliation frequency
than Wana. Wana also had significantly more tillers per plant, higher site usage value,
and a shorter leaf appearance interval than Nui under low PAR plus reduced R:FR.
Shoot dry mass of Nui was comparatively low under low P ARIRF mainly due to the low
tillering, and leaf area per plant. Low tiller site usage indicated that under low P ARIRF
and defoliation conditions, Nui would have less chance of producing tillers, than Wana.
Wana could continue to produce leaf area despite high defoliation frequency. This may
be due to the higher SLA of Wana than Nui, suggesting that Wana could allocate more
carbon to the leaves and thereby produce more tillers per plant. It was concluded that
Wana is more tolerant of a high defoliation frequency than Nui, and can produce more
shoot dry weight and tillers consistently under low P AR!R:FR.
Wana had a greater RGR than Nui in each PAR level irrespective of the light quality.
Nui produced more aboveground shoot mass than Wana, but this could be due to bigger
seed, faster germination and establishment compared to Wana cocksfoot. Genetic
differences between plants and allocation of assimilates will also have a large impact on
the relative growth rate of species (Zarrough et al. 1983). Sugiyama ( 1995) reported that
carbohydrate availability could be closely related to the shoot growth rate. However, in
relative growth rate terms, Wana was better than Nui, which suggests that Wana
cocks foot is more shade tolerant (Figure 6.2).
The higher shoot dry weight (Tables 6.6 and 6.7) of both Nui and Wana under W3
rather than W l defoliation indicated that if a plant can receive more light and alter the

1 9 1
allocation to leaves, this would be advantageous in terms of production and persistence
(Caldwell 1 987) . Production is possible only when a plant is in a position to intercept
light. The productivity of pasture can be rapidly altered by variation in defoliation
management, particularly the frequency and height of the defoliation (Stockdale 1992;
Fulkerson and Slack 1995; Rutkowska and Lewicka 1995; Harris et al. 1 997; Sanderson
et al. 1 997 ; Turner et al. 1998) though the influence on plant growth depends on
species, stage of growth and the degree of defoliation (Kang et al. 1995; Havstad 1997;
Donaghy et al. 1 997) . For these reasons the effects of defoliation have been interpreted
largely in terms of competition for light (Remison et al. 1980) .
Number of tillers per plant is also an important indicator of shade tolerance (Devkota et
al. 1 997) , which also contributes to the productivity and persistence of the pasture
species under continuous defoliation in the shade. This is because the growing region of
the leaf is a strong sink that can deprive other sinks, such as tiller buds, when defoliated
(Gautier et al. 1 999). Removing the aboveground phytomass places a large stress on the
stubble and roots (Sanderson et al. 1 997) . Moreover, tillering is well known to be
sensitive to both defoliation and light environment (Gautier et al. 1 999). Tillering was
reduced for both Wana and Nui at low PAR plus reduced R:FR in this experiment
(Table 6. 1 0) , but Nui was more sensitive than Wana in terms of tillering. Therefore,
results of this study showed that as Wana can maintain higher tiller numbers per plant
than Nui it could withstand low PAR and defoliation frequency.
High SLA of pasture species at low PAR (heavy shade) appears to be an important
morphological attribute that determines the ability of species to produce and persist. A
high SLA enables species to allocate more carbon to leaf area and therefore intercept
more of the available light in the shade (Sanderson et al. 1 997; Dennis and Woledge
1 983). Ultimately, a high SLA would also increase the chance of producing more tillers.
Wana had better growth than Nui, especially at low PAR, mainly due to its ability to
produce a higher leaf area (Table 6.8), and a higher leaf dry weight (Table 6.9). Higher
leaf area of Wana contributed to higher site usage than that of Nui under weekly (Wl )
and three weekly defoliation (W3) (Figure 6.4) resulting in significantly more tillers per
plant (P<O.OOl ) for Wana than Nui at both low PAR plus reduced R:FR and low PAR

1 92
plus natural R:FR (Table 6. 10). These results were in line with an earlier screening
experiment with grasses and legumes in pots in glasshouse conditions (Devkota et al.
1 997).
In this study, Nui was more sensitive to defoliation frequency than Wana. In general,
increasing the frequency of defoliation progressively reduces leaf size (Brock et al.
1 996). Nui leaf area was more severely decreased by the weekly defoliation (Table 6.8).
Thomton and Millard ( 1 997) also reported that increasing the frequency of defoliation
resulted in a reduction in the rate of growth of new leaves of Nui perennial ryegrass.
The low level of biomass production by Nui at low PAR could also be associated with
its reduced root dry weight under frequent defoliation (Table 6. 1 1 ; Thomton and Millard
1 997 ; Mawdsley and Bardgett 1 997).
Cocks foot is considered to be adapted to both shade and dry conditions (Hocking 1990),
and also the tree shade of Pinus radiata (Seo et al. 1989) in New Zealand. The results
of these experiments also showed that cocks foot is adapted to heavy shade and intensive
defoliation. Ward and Blaser ( 1961 ) reported that the rate of regrowth of cocks foot
following defoliation was largely due to the carbohydrate reserves in the stubble and the
remaining leaf area. The carbohydrate reserves, or the remobilization of nutrients, of
cocks foot appear to enable it to produce relatively high leaf area and tiller numbers per
plant in the shade. Wana cocksfoot is a particularly defoliation tolerant species that can
be grown under heavy shade.

natural R: FR
(8 Aug, 1 998)
(a)
(b)
1 93
Figure 6 .5 Effects of defoliation at weekly and three-weekly interval for Wana cocksfoot and Nui
perennial rye grass (a) under 7 1% PAR, natural R:FR, and (b) 24% PAR with reduced R:FR by
using filters. Wana in background.

1 94
6.6 Conclusions
A study to determine the relative growth rate (RGR) of Wana cocksfoot and Nui
perennial ryegrass at the seedling stage showed that the RGR of Wana was always
higher than that of Nui in all P AR/R:FR treatments. RGR of Wana was also less
affected by reduced P AR/R:FR compared with Nui. Likewise, effects of defoliation on
the tilleting and biomass producing ability of these species at low P ARIR:FR ratio
revealed that W ana was a better species under frequent defoliation. Wana produced
higher biomass than Nui under both W l and W3 defoliation regimes mainly due to its
ability to produce higher leaf area and higher leaf dry weight. Likewise, SLA of Wana
was significantly higher (P<O.OOOl ) than that of Nui at both W l and W3 defoliation
frequencies. Wana also had significantly higher tillers per plant, higher site usage value,
and shorter leaf appearance interval than Nui under low P ARJR:FR conditions. Biomass
yield of Nui was comparatively Iow in the heavy shade due mainly to the low tillering,
and per plant leaf area. The low level of site usage value reflected that under heavy
shade and defoliation, Nui would have least chance of producing tillers. Wana could
continue to produce leaf even despite a high defoliation frequencies. Results from these
studies, therefore, clearly indicated that under the experimental conditions Nui was
particularly defoliation sensitive; the higher the defoliation frequency, the lower the
biomass and tillering producing abilities. On the other hand, Wana was particularly
defoliation insensitive, compared with Nui, and produced more biomass and tillers
under a high frequency of defoliation and low P ARJR:FR ratio.

1 95
6.7 References
Bassman, J . H. and Dickmann, D. 1. 1 985. Effects of defoliation in the developing leaf
zone on young Populus X euramericana plants. ll. Distribution of 14-C
photosynthate after defoliation. Forest Science 3 1 :358-366.
Brock, J. L., Hume, D. E. and Fletcher, R. H. 1 996. Seasonal variation in the
morphology of perennial ryegrass (Lolium perenne) and cocksfoot (Dactylis
glomerata) plants and populations in pastures under intensive sheep grazing.
Journal of Agricultural Science 26:37-5 1 .
Caldwell, M . M. 1987. Plant architecture and resource competition. Pp 1 64-179 in:
Ecological Studies, Schulze, E. D. and Zwolfer, H. ed. Springer-Vedag Berlin,
Heidelberg.
Chapman, D. F. and Lemaire, G. 1 993. Morphogenetic and structural determinants of
plant regrowth after defoliation . Pp 55-64 in: Grasslands for Our World,
Barker M. 1. ed. SIR Publishing, Wellington, New Zealand.
CornS, W. J . 1 983. Growth and morphogenesis of sun and shade plants 1. The influence
of light intensity. Acta Bot. Neerl. 32 (1/2): 49-62.
Dennis, W. D. and Woledge, J. 1 983. The effect of shade during leaf expansion on
photosynthesis by white clover leaves. Annals of Botany 5 1 : 1 1 1 - 1 1 8 .
Devkota, N. R., Kemp, P. D. and Hodgson, J. 1997. Screening pasture species for shade
tolerance. Proceedings Agronomy Society of New Zealand 27: 1 1 9- 1 28 .

1 96
Donaghy, D. J., Scott, J. M. and Fulkerson, W. J. 1 997. Effect of defoliation frequency
and summer irrigation on survival of perennial (Lolium perenne) and biennial
(Lolium multiflorum) ryegrass in the subtropics. A ustralian Journal of
Experimental Agriculture 37 :537 -545.
Fulkerson, W. J. and Slack, K. 1 995. Leaf number as a criterion for determining
defoliation time for Lolium perenne: 2. Effect of defoliation frequency and
height. Grass and Forage Science 50: 16-20.
Gautier, H. , Varlet-Grancher, C . and Hazard, L. 1 999. Tillering responses to the light
environment and to defoliation in populations of perennial ryegrass (Lolium
perenne L.) selected for contrasting leaf length. Annals of Botany 83 :423-429.
Harris , C. A, Blumenthal, M. J., Kelman, W. M. and McDonald, L. 1997. Effect of
cutting height and cutting interval on rhizome development, herbage production
and herbage quality of Lotus pedunculatus cv. Grasslands Maku. Australian
Journal of Experimental Agriculture 37:63 1-637.
Havstad, L .T. 1997. Effects of light intensity and defoliation on the receptiveness for
primary induction in F estuca pratensis huds. Proceedings of the XVIII
International Grassland Congress, Canada, ID NO 9 13.
Hilbert, D. W., Swift, D. M., Detling, J. K. and Dyer, M. 1 . 198 1 . Relative growth rates
and the grazing optimization hypothesis. Oecologia 5 1 : 1 4-18 .
Hocking, D. 1990. Farming with trees on sand country. Proceedings of the New
Zealand Grassland Association 5 1 :59-60.
Hunt, R. 1 982. Plant Growth Curves: The Functional Approach to Plant Growth
Analysis, Edwards, Amold, London, 248p.

1 97
Kang, J. H., Brink, G. E. and Rowe, D. E. 1 995. Seedling white clover response to
defoliation. Crop Sciene 35: 1406- 14 10.
Li, G. D. , Kemp, P. D. and Hodgson, J. 1997. Effects of defoliation intensity on the
absolute and relative growth rates of 'Grasslands Puna' Chicory. Proceedings of
the XVIII International Grassland Congress, Canada, ID NO 1093.
Mawdsley, J. L. and Bardgett, R. D. 1997. Continuous defoliation of perennial ryegrass
(Lolium perenne) and white clover (Trifolium repens) and associated changes in
the composition and activity of the microbial population of an upland grassland
soil. Biology and Fertility of Soils 24:24-52.
Nassiri, M. and Elgersma, A. 1998. Competition in perennial ryegrass-white clover
mixtures under cutting. 2. Leaf characteristics, light interception and dry-matter
production during regrowth. Grass and Forage Science 53:367-379.
Remison, S. U. and Snaydon, R. W. 1 980. Effects of defoliation and fertilizers on root
competition between Dactylis glomerata and Lolium perenne. Grass and
Forage Science 35 :8 1 -93.
Richards, J. H. 1993 . Physiology of plants recovering from defoliation. Pp 46-54 in:
Grasslands for Our World, Barker, M. J. ed. SIR Publishing, Wellington, New
Zealand.
Rutkowska, B. and Lewicka, E. 1 995. Development of reproductive shoots and feeding
value of cocksfoot and perennial ryegrass cultivars as a criterion for the time
periods of pasture utilization. Wiadomosci Instytutu Melioracjii Uzytkow
Zielonych 18 : 1 37-150. (CAB Abstracts, text in Polish).
Sanderson, M. A., Stair, D. W. and Hussey, M. A. 1 997. Physiological and
morphological responses of perennial forages to stress. Advances in Agronomy
59: 17 1-224.

1 98
S AS Institute Inc. 1997. SAS User's guide: Statistics, Version 6 . 1 2, SAS Inc, Cary,
North Carolina, USA.
Seo, S . , Han, Y. C. and Park, M. S. 1989. Grassland improvement and N fertilization
management of woodland in Korea. Proceedings of the XVI International
Grassland Congress, Nice, France: 1 487-1488.
Skinner, R. H. and Nelson, C. J . 1 992. Estimation of potential tiller production and site
usage during tall fescue canopy development. Annals of Botany 70:493-499.
Stockdale, C. R. 1992. Effects of frequency and height of defoliation on the production
of a Persian clover-annual ryegrass sward. Australian Journal of Experimental
Agriculture 32:339-344.
Sugiyama, S. 1 995. The relationship between growth and development of vegetative
shoots in genotypes of tall fescue (Festuca arundinacea Schreb.). Annals of
Botany 76: 553-558.
Thornton, B. and Millard, P. 1 997. Increased defoliation frequency depletes
remobilization of nitrogen for leaf growth in grasses. Annals of Botany 80: 89-
95.
Turner, K. E. , Be1esky, D. P., Fedders, J . M. and Solomon, M. B. 1 998. Autumn
grazed orchardgrass-white clover pasture: Nutritive value of herbage and lamb
performance. Journal of Production Agriculture 1 1 :85-9 1 .
Ward, C. Y. and Blaser, R. E . 1 96 1 . Carbohydrate food reserves and leaf area in
regrowth of orchardgrass. Crop Science 1 :366-370.

1 99
Wilson, J. R. and Ludlow, M. M. 199 1 . The environment and potential growth of
herbage under plantations. Pp 10-24. in: Forage for Plantation Crops, She1ton,
H. M. and Stiir, W. W. ed. ACIAR proceedings No. 32, Canberra.
Wong, C. C. and Stiir, W. W. 1996. Persistence of tropical forage grasses in shaded
environments . Journal of Agricultural Science 1 26: 1 5 1 - 159.
Zarrough. K. M., Nelson, C. J. and Coutts, J . H. 1 983. Relationship between tillering
and forage yield of tall fescue. ll. Pattern of tillering. Crop Science 23:338-343 .
200
7. Performance of pasture species under deciduous tree shade
Page
7.1 SUMMARY ............................................... . . . . . . . . . . . . . . ............................................. 202
7.2 INTRODUCTION ...................................... . . . . . . . . . . . . . . . . . . . ....................................... 203
7.3 MATERIALS AND METHODS ................. . . . . . . . . . . ............................................. 205
7 .3 . 1 S ite description . . . . . . . . . . . . . . . . . . . . . . . . . . . . . . . . . . . . . . . . . . . . . . . . . . . . . . . . . . . . . . . . . . . . . . . . . . . . . . . . . . . . . . . . . . . . . . . . 205
7 .3 .2 Experimental treatments, procedures and designs . . . . . . . . . . . . . . . . . . . . . . . . . . . . . . . . . . . . . . . . . . . 206
7 .3 .2. 1 Experiment 7 . 1 . . . . . . . . . . . . . . . . . . . . . . . . . . . . . . . . . . . . . . . . . . . . . . . . . . . . . . . . . . . . . . . . . . . . . . . . . . . . . . . . . . . . . . . . . . 206
7 .3 .2.2 Experiment 7.2 . . . . . . . . . . . . . . . . . . . . . . . . . . . . . . . . . . . . . . . . . . . . . . . . . . . . . . . . . . . . . . . . . . . . . . . . . . . . . . . . . . . . . . . . . . 2 1 1
7 .3 .3 Statistical analysis . . . . . . . . . . . . . . . . . . . . . . . . . . . . . . . . . . . . . . . . . . . . . . . . . . . . . . . . . . . . . . . . . . . . . . . . . . . . . . . . . . . . . . . . . . . . 2 1 1
7.4 RESUL TS .................................................................. ............................................ 212
7.4. 1 Experiment 7 . 1 . . . . . . . . . . . . . . . . . . . . . . . . . . . . . . . . . . . . . . . . . . . . . . . . . . . . . . . . . . . . . . . . . . . . . . . . . . . . . . . . . . . . . . . . . . . . . . . . . 2 1 2
7.4. 1 . 1 Light environment . . . . . . . . . . . . . . . . . . . . . . . . . . . . . . . . . . . . . . . . . . . . . . . . . . . . . . . . . . . . . . . . . . . . . . . . . . . . . . . . . . . . . 2 1 2
7.4. 1 .2 Soil moisture . . . . . . . . . . . . . . . . . . . . . . . . . . . . . . . . . . . . . . . . . . . . . . . . . . . . . . . . . . . . . . . . . . . . . . . . . . . . . . . . . . . . . . . . . . . . . 2 14
7 .4. 1 .3 Soil temperature . . . . . . . . . . . . . . . . . . . . . . . . . . . . . . . . . . . . . . . . . . . . . . . . . . . . . . . . . . . . . . . . . . . . . . . . . . . . . . . . . . . . . . . . 2 1 6
7 .4. 1 .4 Herbage mass . . . . . . . . . . . . . . . . . . . . . . . . . . . . . . . . . . . . . . . . . . . . . . . . . . . . . . . . . . . . . . . . . . . . . . . . . . . . . . . . . . . . . . . . . . . . 2 1 8
7 .4. 1 .5 Herbage harvested above the defoliation height of 50mm . . . . . . . . . . . . . . . . . . . . . . . . 221
7 .4. 1 .6 Botanical composition . . . . . . . . . . . . . . . . . . . . . . . . . . . . . . . . . . . . . . . . . . . . . . . . . . . . . . . . . . . . . . . . . . . . . . . . . . . . . . . 224
7 .4. 1 .7 Tiller density . . . . . . . . . . . . . . . . . . . . . . . . . . . . . . . . . . . . . . . . . . . . . . . . . . . . . . . . . . . . . . . . . . . . . . . . . . . . . . . . . . . . . . . . . . . . . . 227
7 .4. 1 .8 Legumes growing points or branches density . . . . . . . . . . . . . . . . . . . . . . . . . . . . . . . . . . . . . . . . . . . 229

201
7.4.2 Experiment 7.2 . . . . . . . . . . . . . . . . . . . . . . . . . . . . . . . . . . . . . . . . . . . . . . . . . . . . . . . . . . . . . . . . . . . . . . . . . . . . . . . . . . . . . . . . . . . . . . . . . 232
7 .4.2. 1 Diet selection by sheep . . . . . . . . . . . . . . . . . . . . . . . . . . . . . . . . . . . . . . . . . . . . . . . . . . . . . . . . . . . . . . . . . . . . . . . . . . . . . . 232
7.5 DISCUSSION . . . . . . . . . . . . . . . . . . . . . . . . . . . . . . . . . . ........ . . . . . . . . . . . . . . . . . .. . . . . . . . . . . . . . . . . . . . . . . . . . . . . . . . . . . . . . . . . . . 234
7 .5 . 1 Pasture species in the mixture and performance under deciduous tree shade . 234
7 .5 .2 Diet selection by sheep under tree shade . . . . . . . . . . . . . . . . . . . . . . . . . . . . . . . . . . . . . . . . . . . . . . . . . . . . . . . . . 238
7.6 CONCLUSION . . . . . . . . . . . . . . . . . . . . . . . ................. . . . . . . . . . . . . . . . .. . . . . . . . . . . . . . . . . . . . . . . . . . . . . . . . . . . . . . . . . . . . 239
7.7 REFEREN CES . . . . . . . . . . . . . . . . . . . . . . . . ...................... . . . . . . . . . . . . . .. . . . . . . . . . . . . . . . . . . . . . . . . . . . . . . . . . . . . . . . . 241

202
7.1 Summary
Deciduous trees are commonly used in silvo-pastoral systems to improve the stability of
hill country. However, information on the effects of deciduous trees on understorey
pasture production is scanty. There is a need for more information about management
practices for deciduous based tree-pasture systems, especially in relation to performance
of pasture species under different levels of shade.
A preliminary screening study on pasture species under glasshouse conditions showed
that shade had a marked effect on tillering as well as on shoot dry weight accumulation.
Mean tiller numbers per plant in the lowest PAR (photosynthetic ally active radiation)
level was significantly higher for cocks foot than for other species (Chapter 3). In this
chapter, the results of an experiment conducted to validate the results obtained in the
glasshouse study are reported. Perennial ryegrass (Grasslands Nui), Yorkshire fog
(Massey Basyn), and cocks foot (Grasslands Wana) with white clover (Grasslands
Tahora) as the legume component in each sward, and also cocksfoot with lotus
(Grasslands Maku) , were examined under 1 1 year old alder trees ( 1 1 97 stemslha) in
September, 1 996 at Horticultural Research Centre, Aokautere, near palmerston North.
A split -plot design with four replicate blocks was used. The main plot treatments were
three levels of transmitted PAR (8 1 %, 23%, and 1 2% ; light, medium and heavy shade,
respectively) created by pruning trees to different heights. The sub-plot treatments were
combination of pasture species. The experiment ran from October 28, 1 996 to May 28,
1998. Pasture plots were mowed monthly at 50mm aboveground. Pre-mowing herbage
mass (g/m2) , and herbage harvested above 50mm were measured once in a month.
Tillers/m2 of the grass component, and number of growing points or branches (per m2)
for the legumes were counted.
In a subsidiary experiment, a grazing preference experiment was conducted at the same
site in November 1998.
Herbage mass in heavy and medium shade was about 50% and 70%, respectively, of
that in light shade (P<O.OOOl ) . Herbage mass was highest for cocksfoot, either with

203
lotus or white clover at all levels of light (P<O.OOOI ), whereas herbage mass of ryegrass
and Yorkshire fog was similar. Shade affected ryegrass more than cocks foot and
Yorkshire fog, especially at the lowest PAR level, which was consistent with the results
obtained in the glasshouse study.
In the subsidiary experiment, observations were made on the distribution of grazing
activity (n=1 2) across plots over periods of 2 hours in the afternoon on two successive
days. There was no difference (P>O.05) in the number of observations of sheep grazing
such plots of different pasture species in a 2 hour period. More sheep grazed in the light
shade than in the heavy shade (P<O.05).
For a silvo-pastoral system based on alders at a high tree density, cocksfoot, in
combination with either lotus or white clover was more productive and persistent than
the other pasture species examined, supporting the results of the earlier glasshouse
experiment. Further research on the long-term impact of shade on sustainable pasture
production, however, is still required.
7.2 Introduction
Large areas of land used for agriculture in New Zealand are susceptible to soil erosion
(Clough and Hicks 1993; KelIiher et al. 1995) mostly due to forest clearing for
agriculture (Trustrum and Blaschke 1992). One technology to cope with this situation
and to maintain pastoral farming has been the planting of conservation trees,
particularly poplars and willows (Madaren 1993; Anonymous 1995; NZMF 1 995;
Miller et al. 1 996). High or low density planting of trees as an agroforestry system has
also become a common land use practice in recent years, as a means of income
diversification along with the erosion control (Pollock et al. 1 994).
There are several published reVIews on agroforestry which show the range of
information on tree-crop systems (Wolters 1982; Cameron et al. 1989; Nair and Dagar
1 99 1 ; Stlir and Shelton 199 1 ; Wilson and Ludlow 199 1 ; Bird et al. 1 992; Atta-Krah
1 993 ; Ong 1 996), but most of this information in New Zealand is associated only with
Pinus radiata based systems (Knowles et al. 1 99 1 ). Studies on Pinus radiata indicated
204
that understorey herbage production decreases as crown density increases (Anderson
and Batini, 1983, Pollock et al. 1994, Hawke and Knowles, 1 997), and as there is an
increase in age and slash from trees (Knowles et al. 1995; Hawke and Knowles 1997).
Shading is the most significant factor determining the output from pastures grown in
plantations (Shelton et al. 1 987). Some species like Yorkshire fog (Holcus lanatus L.),
cocksfoot (Dactylis glomerata L.) and lotus (Lotus uUginosus) are more shade tolerant
than other pasture species (Seo et al. 1 989; West et al. 1 99 1 , Devkota et al. 1 997;
Chapters 3, 5). The results of a screening of pasture species under glasshouse conditions
showed that shade had a marked effect on tillering as well as on shoot dry weight
accumulation (Chapter 3 ; Devkota et al. 1 997). Mean tiller number per plant at the
lowest PAR (photosynthetic ally active radiation) level was significantly higher for
cocksfoot than for other species (Devkota et al. 1 997). Lotus produced a higher
number of branches at the lowest ambient PAR ( 14%) than did the other legumes
(Chapter 3 , Devkota et al. 1 997).
Poplars and other deciduous trees have the advantage of increasing soil organic matter
and nutrient status on tilled (Jaswal et al. 1 993; Thevathasan and Gordon 1997) and
pastoral land (Bowersox and Ward 1 977). Pasture production i s decreased under
deciduous trees (Ditschal et al. 1997), but less than under evergreen trees, and it can be
managed better by pruning trees, by short rotations, or by coppice management (Treeby
1 978; New 1 985). However, detailed information on the effect of deciduous trees on
understorey production by temperate pasture is scanty (Wall et al. 1 997), despite some
research on the impact of shade on the performance of pasture species (Eriksen and
Whitney 1 98 1 ; Samarakoon et al. 1990; Kephart and Buxton 1 993). Particularly, the
impact of shading by deciduous trees on the productivity and persistence of hill pastures
has received little research attention (Hawke 1 99 1 ; Knowles 1 99 1 ; Pollock et al. I994).
There is little objective information available on effects of a range of light intensities,
particularly at the low levels of transmitted light (high levels of shade) found under
mature stands of conservation trees (e.g. poplars, alders and willows) , on the growth and
morphology of pasture species.

205
An experiment was conducted to relate the results obtained in the glasshouse (Chapters
3 , 4 and 5, Devkota et al. 1 997) to the shade of deciduous trees. The experimental site
used was the same as for Experiment 4.2, but in that experiment only alder tree shade
was used as the main plot, and sub plots were cocksfoot selections and perennial
ryegrass tested in pots under alder tree shade. In this experiment, perennial ryegrass
(Grasslands Nui),Yorkshire fog (Massey Basyn), and cocksfoot (Grasslands Wan a) ,
with white clover (Grasslands Tahora) as the legume component in each sward, and also
cocksfoot with lotus (Grasslands Maku) were grown to evaluate the effects of shade on
tillering ability and biomass production of pasture under alders.
7.3 Materials and methods
7.3.1 Site description
The two experiments were conducted on a moist, lowland site at the Horticultural
Research Institute's (HortResearch) field station at Aokautere, near palmerston North.
The long term mean annual rainfall is 995 mm with dry months from January to April.
The long term mean annual air temperature is 12.9° C (Oppong 1 998) . Mean monthly
rainfall from September 1 996 to November 1998, taken at the nearest Meteorological
station (AgResearch, Palmerston North), was 7 1 .4 ± 39.4mm (Figure 7. 1 ). The mean
global radiation was 403 ± 1 76.2 MJ/m2/month (Figure 7.2). The soil is a Manawatu
silt loam, fairly well drained with medium to poor fertility. For example, Olsen P was
1 1 .4 Olglg) at the beginning of the experiment, and soil pH was 5 .5 (Table 7. 1 ). The site
had been established with evenly spaced (width between rows 3 .0m and width within
rows 4.0m, or 1 197 stemslha) Italian grey alder (Alnus chordata) trees with Robinia
planted alternately in each row. Before the experiment began, all the Robinia trees were
removed. The alder trees had been un-pruned until the experiment began.

- 1000 -= - 950 c: 900 0 S 850
N- 800 .€ 750
� 700 '-' 650 c: 600 0 ..... 550 -= 500 .....
"Q = 450 .. 400 -= 350 ,.Q
300 0 -0.() 250 - 200 = -
1 50 0 E-! 1 00
• \
�\ l �, _�
�.\\\ � \ ''''-
Legend
-.- 1 996
-.- 1997
�� ./ � / " " " �K
/.
1 998
:f& /
/
A
Jan Feb Mar Apr May lun Jul Aug Sep Oct Nov Dec Jan
Months
206
Figure 7. 1 Monthly total global radiation (MJ/m2/s), during the experiment period. Data from the nearest
Meteorological Station (AgResearch, Palmerston North).
7.3.2 Experimental treatments, procedures and designs
7.3.2.1 Experiment 7.1
Experiment 7. 1 was conducted from 14 October, 1996 to 28 May 1 998 under 1 1 year
old alder trees. Plots in the field were arranged in a split plot design with four replicate
blocks (Appendix Figure 7. 1 ). The main plots were shade treatments created by
pruning trees to different heights from ground level, and subplots were mixed species
swards. Pruning heights were to 2.5 m, 5.0 m and 7.0 m from the ground, which
resulted in three different levels of transmitted PAR, hereafter called heavy, medium,
and light shade respectively as determined by measuring PAR monthly (7 February, 19
March, 14 April, 22 November and 30 December in 1 997, and 1 3 January, 1 1 February,
9 March, 7 April and 14 May 1998) on clear sky days between 1 200- 1 300h using a LI
COR (Model LI- 185) portable quantum sensor.

207
Legend
220 --- 1 996
--- 1 997 200 1 998
-- 1 80
§ 1 60 '-' --
140 c: � c: .- 1 20 c: � ...., 1 00 -oS c: 80 Q
� 60
40
20
Jan Feb Mar Apr May Jun Ju! Aug Sep Oct Nov Dec Jan
Months
Figure 7.2 Monthly total rainfall distribution (mm) during the experiment period. Data from the nearest
Meteorological Station (AgResearch, Palmerston North).
The R:FR ratio of the light was also measured monthly whenever possible ( 1 7 to 20
February, 23 to 25 March, 1 8 November, and 30 December in 1 997, and 1 3 January, 7
April, and 20 May in 1998) with a Skye Sensor at just above the swards under the trees.
Soil temperature was recorded monthly at 100 mm depth in each treatment. Likewise,
volumetric soil moisture (v/v%) was estimated using the Time Domain Reflectometry
technique (TDR, Soil moisture Co. USA). Soil moisture was measured from 0-200mrn
depth randomly in each plot once a month using TDR probes of 200mrn length.
The site was divided into three main plots (23 stems in one main plot of 1 2x I 6m2,
1 92m2) . Each main plot had four sub-plots, with 2 x 4m of net cultivable area per sub-

208
plot (by leaving O.5m margin from the row of tree on both sides) used to gr0W
understorey swards. Sub-plots were replicated four times (Figure 7.3) .
Mean tree height in each main plot at the end of the experiment was 1 0.4 ± 0.4 m, 10.9
± 0.5m, and 9.9 ± 1 .3m for heavy, medium and light shade respectively. Mean diameter
at breast height (DBH, at l .4m) was 15 . 1 ± 2.3cm, 1 6.3 ± 1 .8cm and 1 4.0 ± 1 .4cm for
heavy, medium <tbd light shade, respectively. Mean leaf area index (LAI) of the trees
was measured using a LAI 2000 Plant Canopy Analyser (Welles 1 990; Welles and
Norman 1 99 1 ). LAI for heavy shade was 6.4 ± 0.7. Likewise, LAI of medium and light
shade was 3 .6 ± 0.7, and 1 .7 ± 0. 1 , respectively, at the end of experiment.
The sub-plot treatments were pasture species III combination: perennial ryegrass
(Grasslands Nui), Yorkshire fog (Massey Basyn), and cocks foot (Grasslands Wana) ,
were each grown with white clover (Grasslands Tahora) as the legume component in
each sub-plot sward, and cocksfoot was also combined with lotus (Grasslands Maku)
(Table 7 .2). Before sowing, on 25 September 1996, all plots were sprayed with
Roundup (glyphosate, 360g in 1 litre) to remove existing vegetation. After two weeks,
on 8 October 1 996, plots were ploughed by a rotary cultivator. Land was levelled, and
the plots laid out on 10 October 1 996. Seed was hand sown on 1 4 October 1 996.
Legume seeds were treated with appropriate Rhizobium cultures. Details of the pasture
species and cultivars used are given in Table 7.2. After emergence, plots were hand
weeded regularly from December 1 996 to early January, 1 997. Sprinkler irrigation was
used twice, once in November and once in December, in order to help establishment of
the swards. Irrigation was not used thereafter. There was no use of chemical or organic
fertilizer. Plots were mowed monthly at 50mm height.
Pre-mowing herbage mass, and herbage harvested above the defoliation height of 50
mm were measured. The first harvest was on 25 March 1 997 and the second harvest
was on 24 April 1997. At each harvest a quadrat of 0.25 x 0.25m (0.0625 m2) was used
randomly in each plot. Plants were clipped to ground level with electric hand shears
and washed carefully when necessary. All the clipped materials were separated into
legume, grass, and other (flat weeds and dead materials) and dried at 70 0 C for 24
hours, weighed, and added to the herbage mass. This information was also used to

209
composition in each harvest. After quadrat cutting, a randomly se lected 1 . 0m2 in each
plot was mowed at 5 0mm height, and fresh weight was recorded. Representative
samples of l 5 0-200g from each plot were taken, dried at 70 0 C for 24 hours, and
weighed to determine herbage harvested above the defo liation height of 50mrn (re
growth).
After the harvest on 24 April 1 997, tree leaf fall began, and it was completed by the first
week of June. The fal len leaves were completely raked away from the site, and sward
harvests were not started again until trees had a full canopy o f leaves. Therefore, the
first harvest after the winter was on 28 October, 1 997 and monthly harvests continued
until May, 1 99 8 . From October, 1 997 onwards, at each harvest, ti l lers/m2 of the grass
component, and number of growing points or branches (per m2) for legumes were
counted in small quadrats ( 1 Ox 1 0 cm). Counting was done in two randomly placed
quadrat in each plot and the mean p lot value calculated.
Figure 7.3 Field preparation to establish pasture under alder trees at Aokautere, September 1996.

2 1 0
Table 7 . 1 Soil nutrient levels at Aokautere site, sampled to 75mm depth before and at the end o f the
experiment.
Exchangeable cations
Date/treatments pH" OIsen P SI> (meq/l 00gt
(�g1g) (Ilglg) K I Ca I Mg
2112/1996:
Experimental area 5.4 1 1 .4 5 . 8 0.5 5 .0 1 . 3
511011998
Heavy shade
Ryegrass + white clover 5 .5 7.6 3.5 0.4 5 .2 1 . 2
Yorkshire fog + white clover 5 .6 6.7 3 .3 0.4 5 . 1 1 .2
Cocks foot + white clover 5 .5 7 . 1 2.8 0.3 4.6 1 . 1
Cocksfoot + lotus 5.6 7 . 1 2.5 0.3 5 .0 1 .2
Medium shade
Ryegrass + white clover 5.5 6.7 3 .5 0.4 4.8 1 .2
Yorkshire fog + white clover 5 .5 7 . 1 2 .8 0.4 4.8 1 .2
Cocksfoot + white clover 5.5 6 .2 3 .0 0.4 4.8 1 . 1
Cocksfoot + lotus 5.5 6.9 3 .9 0.4 4.9 1 .2
Light shade
Ryegrass + white clover 5 .5 7 . 1 4.0 0.5 6.4 1 .4
Yorkshire fog + white clover 5 .6 6 .7 3 .3 0.4 6.7 1 .5
Cocksfoot + white clover 5 .6 6.2 3.0 0.4 6.0 1 .4
Cocksfoot + lotus 5.6 6.7 3 .3 0.5 6 .0 1 .4
a Determined on a 1 :2.5 soil : water suspension; CaH2P04 extractable 504-5; c IM ammonium acetate,
pH 7
Table 7.2 Pasture species and cultivars used in the Experiment 7. 1 .
Pasture species
1 . White clover (Trifolium repens L.) cv. Grasslands Tahora 2 . Lotus (Lotus uliginosus) cv. Grasslands Maku 3 . Cocksfoot (Dactylis glomerata L.) cv. Grasslands Wana 4 . Yorkshire fog (Holcus lanatus L.) cv. Massey Basyn 5. Perennial ryegrass (Lolium perenne L.) cv. Grasslands Nui
Seed rate (kglha)
3.0 5 .0 6.0 2.0
12.0

2 1 1
7.3.2.2 Experiment 7.2
A grazing preference experiment was carried out at the same site as Experiment 7 . 1
with some modification. The plots of perennial ryegrass + white clover were destroyed
by using Roundup (glyphosate, a.i. 360 g in 1 litre). Overall growth and performance of
perennial ryegrass was poor in each plot compared with other swards, so it was removed
to provide the homogeneity of swards to test diet selection.
The four replicates of Experiment 7 . 1 were partitioned into two replicates for ease of
animal control. Battery operated electric fencing was used for this purpose. It was not
possible to observe all replications at a time, hence observations were made in the
afternoon of two successive days covering one partitioned area (two replications) a day
over a period of 2 hours. Twelve dry ewes of mixed age (4-6 years) with an average
weight of 60-70 kg were used for the observations. Sheep were allowed to graze in the
morning in another paddock, then were transported to the site and penned in the
afternoon until used for the grazing observations. Sheep were brought back to their pen
overnight, allowed to graze in the next morning in another paddock, and then
transported in the afternoon to record grazing observations in the remaining two
replicates.
The number of sheep observed grazing at the end of each two-minute period was
recorded for 2 hours. The position of each sheep in terms of treatment and replicate was
also noted every two minutes. Recording was done by three people each responsible for
the treatments in one main plot while hiding in the nearby bushes. A 2m transect was
placed in each plot and five legumes (growing points or branches) and five grass tillers,
in every 20cm distance were identified alternately and marked with plastic wire before
grazing. Number of grazed marked tillers and marked legumes (out of 5 each) , were
recorded after grazing. The ratio of grazed tillers to legumes was also calculated.
7.3.3 Statistical analysis
The statistical significance for all the analyses was determined by analysis of variance
using the PROC GLM procedure (SAS 1 997). Residuals were examined for their

212
normality and appropriate transformation was carried out when needed, and indicated
on the appropriate results table. Tillers per- plant in Experiment 7. 1 were also analyzed
separately by the SAS GLM procedure using the model of repeated measures (SAS
1 997) over the harvesting times. The significance level was set at a=0.05.
7.4 Results
7.4.1 Experiment 7.1
7.4.1.1 Light environment
The mean PAR as a % of unshaded PAR under the heavy, medium and light shade
treatments was approximately 15, 25 and 75%, respectively (Table7.3a, b; Figure 7 .4).
S imilarly, periodic R:FR measurements by instantaneous mode, or by data logger over
24 hours, found the range for R:FR was 0.7- 1 .0 under heavy shade, 0.9- 1 . 1 , under
medium shade, and 1 .3 under light shade (Table 7 .3a, b, c).
Table 7.3a Levels of transmitted PAR (photosynthetically active radiation), and R:FR (red:far-red) ratios
measured at various occasions under tree canopies at Aokautere, February to April 1 997.
PAR (J.1moles photons m-2 s·l ) R:FR ratios
Shade 7 Feb 19 Mar 14 Apr Mean Mean % 1 7-20 Feb 23-25 Mar Mean
1997 1997 1 997 full PAR 1997 1 997
(logged) (logged)
Heavy 1 3 1 121 245 1 66 1 7 0.9 1 .0 1 .0
Medium 227 174 383 262 27 1 .2 1 .2 1 .2
Light 1 050 527 702 759 77 1 .4 1 .3 1 .4
Open 1265 750 91 9 978 1 .5- 1 .4- l .5-
Logged: use of data logger for the given periods; • instantaneous reading

2 1 3
Figure 7.4 Establ ishment o f experimental plots under l ight, medium and heavy shade from front to back,
respectively, at Aokautere, February 1 997.
Table 7.3b Levels of transmitted PAR (photosynthetically active radiation), measured at various
occasions under tree canopies at Aokautere, November 1 997 to May 1 998.
PAR ().lmoles photons m-2s- l )
Shade
22 Nov 30 Dec 1 3 Jan 1 1 Feb 9 Mar 7 Apr 14 May Mean %
1 997 1 997 1 998 1 998 1 998 1 998 1 998 full PAR
Heavy 420 33 42 55 208 26 1 259 1 83 1 2
Medium 774 63 86 1 7 1 405 532 491 360 23
Light 1 79 1 1 245 1 1 52 1 054 1 352 1206 1 045 1 264 8 1 Open 1 998 1 8 1 6 1 565 1 460 1 589 1 337 1 1 98 1 566

2 14
Table 7.3c R:FR (red:far-red) ratios measured at various occasions under tree canopies with different
shade levels at Aokautere, November 1997 to May 1998.
R:FR ratios
Shade
22 Nov 30 Dec 1 3 Jan 10- 1 3 9 Mar 7 Apr 14 May Mean
1997 1997 1 998 Feb 1 998 1998 1 998
1998 •
Heavy 0.7 NA NA 0.6 0.7 0.7 0.6 0.6
Medium 0.9 NA NA 0.9 1 .0 0.9 0.7 0.9
Light 1 .5 NA NA l A 1 . 3 1 . 1 1 . 1 1 . 3
Open 1 .5 NA NA l A 1 .5 l A l A l A • Logged: use of data logger for the given period; NA, data not taken due to technical reason
7.4.1.2 Soil moisture
In the early phase of the experiment, there were significant differences (P<O.Ol ) in %
soil moisture content across the shade levels . However, moisture differences for
species and interaction of shade and species were not significant, except in March, 1 997
when species differences in % moisture were also found (Table 7Aa).
The trend in moisture content in those months revealed that a higher percentage of
moisture was found under light shade followed by medium shade, then heavy shade.
The soil moisture was higher in February and March than April and May (Table 7 Aa).
October, November, December, and May were the wettest months, while January to
April were the driest months (Table 7 Ab).

2 1 5
Table 7 .4a Changes i n % soil moisture to 200mm depth under different levels o f shade at Aokautere
during February to May 1997.
Shade/ 15 February 7 March 14 April 8 May treatments 1997 1 997 1 997 1 997
H�YYi1��� Mean value 19 22 1 1 1 4
Mean value 21 24 1 1 1 5
Mean value 27 24 14 1 7
AnalIsis of variance Shade (A) P<O.OI NS P<O.OOI P<O.OOI SEM for shade 1 .24 0.46 0.45 0.35 (d.f.=2) Species (B) NS NS P<0.05 NS SEM for species 0.63 0.52 0.44 0.42 (d.f.=3) Interactions CA *B) NS NS NS NS SEM for A*B 1 .09 0.90 0.76 0.73 (d.f.=6) NS= no significant differences at P<0.05, SEM=standard error of the mean ,d.f.=degrees of freedom
Soil moisture contents from October 1997 to May 1 998 were greater in light than heavy
shade (P<O.05) until January 1 998. However, there was no effect of shade on the soil
moisture content from February to May 1 998 (Table 7 Ab). There were no differences
in soil moisture content between pasture species, except in January and March 1 998.
Likewise, the interaction between shade and species was also not significant for all the
months, except November 1 997 (Table 7 .4b).

2 1 6
Table 7Ab Changes i n % soil moisture t o 200mm depth under different levels o f shade at Aokautere
during October 1 997 to May 1998.
Months Shade/ 29 0ct 26 Nov 22 Dec 13 Jan 1 1 Feb 20 Mar 8 Apr 14 May treatments 1997 1 997 1 997 1 998 1 998 1 998 1 998 1 998
ge��,1!tli�4� Mean value 31 27 25 14 7 1 2 9 26
Mean value 32 32 28 1 5 6 1 1 9 27
Mean value 35 34 30 1 9 7 10 9 25
AnalIsis of variance Shade CA) P<0.05 P<O.OOl P<0.05 P<0.01 NS NS NS NS SEM for shade 0.77 0.54 0.90 0.85 0.48 0.32 1 .02 0.93 (d.f.=2) Species (B) NS NS NS P<0.05 NS P<O.Ol NS NS SEM for species 0.40 0.66 0.84 0.53 0.26 0.27 0.38 0.73 (dJ.=3) Interactions (A *B) NS P<0.01 NS NS NS NS NS NS SEM for A*B 0.70 1 . 1 5 1 .46 0.92 0.46 0.48 0.66 1 .26
NS= no significant differences at P<0.05, SEM=standard error of the mean , dJ.=degrees of freedom
7.4.1.3 Soil temperature
During the period February to May 1 997, there was no variation (P>O.05) in soil
temperature at 1 00mm depth under different shade levels, except in March (P<O.OOO 1 ).
Species differences in terms of soil temperature were also not significant, except for
April (P<O.05) while there was no interactive effect of shade and species. Soil
temperature ranged from 14 (April) to 20°C (March) (Table 7 .5a).

217
Table 7 .sa Soil temperature at l 00mm depth under different levels of shade at Aokautere from
February to May 1 997.
Months Shade! 15 February 7 March 4 April 8 May treatments 1 997 1 997 1 997 1997
H�i��tr Mean value 17. 1 1 8.0 1 6.5 1 3.8
Mean value 17.5 1 8.9 15 .5 14.0
Mean value 17.9 20.2 1 6.3 13 .6
AnaiIsis of variance Shade (A) NS P<O.OOOl NS NS SEM for shade 0.22 0.09 0.59 0. 10 (d.f.=2) Species (B) NS NS P<0.05 NS SEM for species 0.24 0. 1 4 0.34 0.08 (d.f.=3) Interactions (A *B) NS NS NS NS SEM for A*B 0.42 0.24 0.59 0. 14
NS= no significant differences at P<0.05, SEM=standard error of the mean , d.f.=degrees of freedom
The effect of shade on soil temperature was significant for all months from October
1 997 to May 1 998, except during October 1 997 and April 1 998 (Table 7.5b). Species
differences were only significant (P<O.OS) for February and March 1 998, while the
interactive effect of shade and species was significant (P<O.OS) only in November
(Table 7.Sb).
The highest soil temperature was under light shade for all the months. Soil temperature
was highest in December 1997 and lowest in October 1 997 and March 1998 (Table
7 .5b).

Table 7.5b Soil temperature at l 00mm depth under different levels of shade at Aokautere from
October 1 997 to May 1998.
Shade! 28 0ct 22 Dec 1 3 Jan 9 Mar Apr 4 May treatments 1997 1 997 1997 1998 1998 1998 1 998
It�l!:� Mean value 12. 1 1 6.7 20.3 1 9.6 20.8 2 1 .2 17 . 1 9 .6
Mean value 1 1 .6 17.9 2 1 .5 1 9.8 2 1 .9 22. 1 17 .5 1 1 .4
Mean value 12.0 20. 1 23.7 2 1 .2 22.4 22.6 1 8. 6 1 1 .0
Analysis of variance
2 1 8
Shade (A) NS P<O.OOl P<O.OOl P<O.OS P<O.O l P<O.Ol NS P<O.OOl SEM for shade 0. 16 0. 1 8 0.34 0.37 0. 19 0.23 O.SO 0. 1 7 (d.f.=2) Species (B) NS NS NS NS P<O.OS P<O.OS NS NS SEM for species 0.2S 0. 1 3 0.21 0.23 0 . 17 0. 1 6 O.3S 0.28 (d.f.=3) Interactions NS P<O.OS NS NS NS NS NS NS (A*B) SEM for A*B 0.43 0.22 0.37 0.40 0.30 0.28 0.6 1 0.49 (d.f.=6)
NS= no significant differences at P<O.OS, SEM=standard error of the mean, d.f.=degrees of freedom
7.4.1.4 Herbage mass
Pre-mowing herbage mass (HM) during the establishment period showed that there was
a significant effect of shade for March (P<O.O l ) as well as April 1 997 (p<O.OOOl ), but
not a difference between species. There was only a significant interactive effect of
shadexspecies for the above ground herbage mass during April 1 997 (Table 7 .6) .
During March, herbage mass was highest in light shade followed by medium shade.
Heavy shade had about 53% of the herbage mass (g/m2) of that of light shade, compared
to 66% under the medium shade. A similar trend was repeated during April harvest
where the highest herbage mass was under light shade (239.9 glm2). However, under
medium shade, it was increased, to about 74% of that of light shade, but under heavy
shade it was down to 37% of light shade.

219
Table 7 .6 Pre-mowing herbage mass (HM) (g1m2) for March and April 1 997 under different levels of
shade at Aokautere.
Shade! treatments
Heavy shade RW YW CW CL
Medium shade RW YW CW CL
Light shade RW YW CW CL
Analysis of variance Shade (A) SEM for shade (d.f.::2) Species (B) SEM for species (d.f.::3) Interactions (A *B) SEM for A*B (d.f.::6)
Pre-mowing herbage mass (HM) at each harvest (g1m2)
25 Mar 1997
25 1 .9 259 . 1 242.0 230.7
P<O.01 14.75
NS 9.75
NS 16.89
24 Apr 1 997
92.3 60.0 95.0 11
205.2 149.2 176.6
2 17.2 25 1 . 1 240.8 250.4
P<O.OOOl 8.80
NS 6.88
P<O.Ol 1 1 .92
NS=no significant differences at P<0.05, SEM=standard error of the mean; RW=perennial ryegrass+white clover, YW=Yorkshire fog+white clover, CW=cocksfoot+white clover, and CL=cocksfoot+lotus, dJ.=degrees of freedom
Herbage mass (g/m2) for 28 October 1 997 to 28 May 1 998 are presented in Table 7.7.
Effect of shade was always significant (P<O.O 1) from October 1 997 to the end of the
experiment, while differences between species were significant (P<O.O 1 ) only from -
December-January onwards. There were no interactive effects of shade x species for the
whole experimental period.
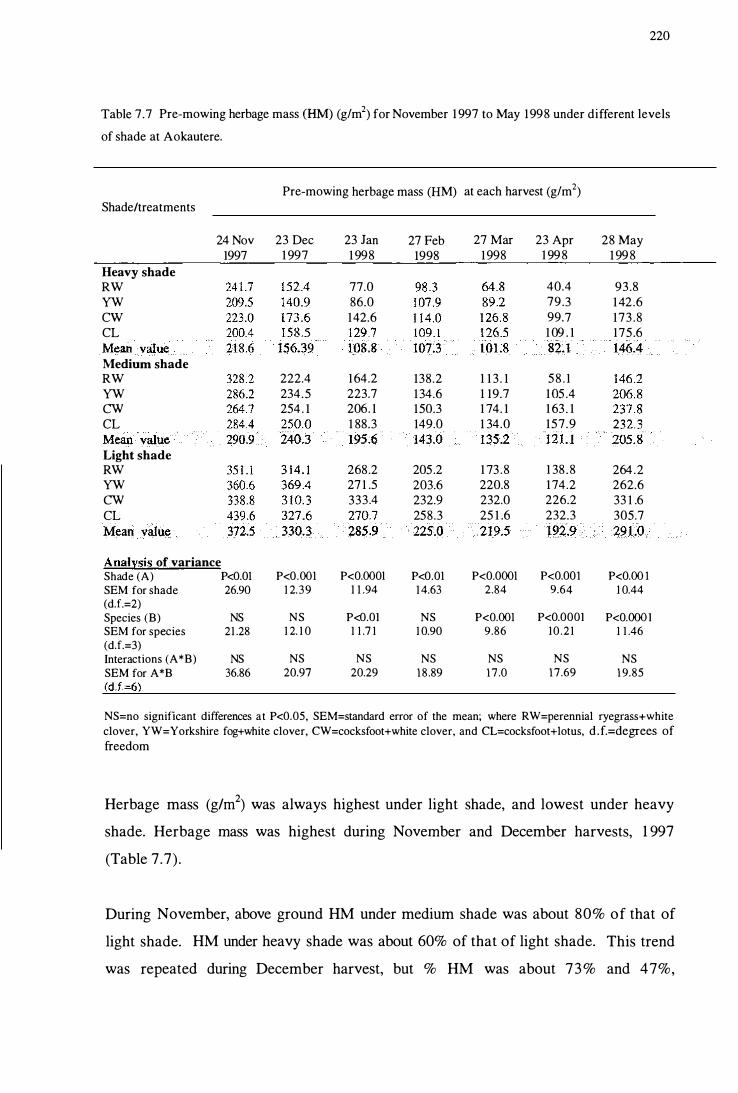
220
Table 7.7 Pre-mowing herbage mass (HM) (g1m2) for November 1 997 to May 1998 under different levels
of shade at Aokautere.
Pre-mowing herbage mass (HM) at each harvest (g1m2) Shade/treatments
24 Nov 23 Dec 23 Jan 27 Feb 27 Mar 23 Apr 28 May 1997 1 997 1 998 1998 1998 1 99 8 1 99 8
Heavy shade RW 77.0 40.4 93.8 YW 86.0 79.3 1 42.6 CW 142.6 99.7 173 .8 CL 1 09 . 1 175.6
Medium shade RW 222.4 164.2 138.2 1 1 3 . 1 5 8 . 1 YW 234.5 223.7 134.6 1 19.7 105 .4 CW 254. 1 206. 1 150.3 1 74. 1 1 63. 1 CL 1 88.3 149.0 1 34.0 157.9
Light shade RW 268.2 205.2 1 73 .8 1 38 .8 264.2 YW 27 1 .5 203.6 220.8 1 74.2 262.6 CW 333.4 232.9 232.0 226.2 33 1 .6 CL 258.3 25 1 .6 232.3 305.7
Analysis of variance Shade (A) P<O.Ol P<O.OOl P<O.OOOl P<O.Ol P<O.OOOl P<O.OOI P<O.OO I SEM for shade 26.90 1 2.39 1 1 .94 1 4.63 2.84 9.64 1 0.44 (dJ.=2) Species (B) NS NS P<O.OI NS P<0.OO1 P<O.OOOI P<O.OOOI SEM for species 21 .28 1 2. 1 0 1 1 .7 1 1 0.90 9.86 10 .21 1 1 .46 (dJ.=3) Interactions (A *B) NS NS NS NS NS NS NS SEM for A*B 36.86 20.97 20.29 18.89 17.0 17.69 19.85
NS=no significant differences at P<0.05, SEM=standard error of the mean; where RW=perennial ryegrass+white clover, YW=Yorkshire fog+white clover, CW=cocksfoot+white clover, and CL=cocksfoot+lotus, d.f.=degrees of freedom
Herbage mass (g/m2) was always highest under light shade, and lowest under heavy
shade. Herbage mass was highest during November and December harvests, 1 997
(Table 7 .7) .
During November, above ground HM under medium shade was about 80% of that of
light shade. HM under heavy shade was about 60% of that of light shade. This trend
was repeated during December harvest, but % HM was about 7 3 % and 47%,

221
respectively, under medium and heavy shade relative to that of light shade. HM started
to decrease from January-February but was similar in each shade level until the end of
the experiment. For example, under medium shade, HM ranged from 62 (March
harvest) to 7 1 % (May harvest) of that of light shade, while under heavy shade it was
consistently within the range of 45-50% of that of light shade (Table 7.7).
During January, HM of cocksfoot with lotus or white clover was highest under light
shade, whereas HM of perennial ryegrass and Yorkshire fog, each with white clover,
were similar and less than that of cocksfoot with lotus or white clover. Under the
medium shade, HM of Yorkshire fog and cocksfoot, were also similar, but HM of
perennial ryegrass with white clover was lower. Under the heavy shade, HM of
cocksfoot, either with lotus or white clover, was significantly higher (P<O.O l ) than
perennial rye grass or Yorkshire fog (Table 7.7).
From February onwards, HM of cocksfoot either with white clover or lotus, was
significantly (P<O.OOl ) higher than any other pasture combinations in each shade level
for each harvest, whereas HM of perennial ryegrass with white clover was the lowest,
especially under heavy shade. For example, during March, HM of perennial ryegrass
with white clover was about 80% of that of the mean HM for light shade, about 85%
under the medium shade, and 64 % under the heavy shade. HM of Yorkshire fog with
white clover under heavy shade was, however, inconsistent. For example, it was similar
or slightly higher than perennial ryegrass with white clover during February to April,
but was significantly higher than perennial ryegrass with white clover during May
(Table 7.7).
7.4.1.5 Herbage harvested above the defoliation height of 50mm
Herbage harvested (glm2) above the defoliation height of 50mm (re-growth) at each
month and the total of each month (g1m2) for the whole experiment (21 2 days) is
presented in Table 7.8 .
There was a significant effect (P<O.Ol ) of shade on the re-growth of the herbage
understorey for all the harvests and also on the total re-growth (total herbage harvested

222
over months). Similarly, there was a significant (P<O.Ol ) difference between species
for herbage re-growth, while the interactive effect of shade x species was not significant
for all the harvests, except for March, 1 998 (P<O.O l ) (Table 7 .8) .
Results showed a similar trend in re-growth of herbage harvest as for HM with the
highest re-growth at the 28 October, 1 997 harvest (Table 7.8).
For all the harvests highest re-growth was obtained under light shade, followed by
medium shade. Re-growth of herbage harvest under the heavy shade was the lowest for
all harvests and also for all the species combination.
Re-growth of cocksfoot, either with lotus or white clover, was always higher than the
other species combinations at each harvest from November onwards . Re-growth of
perennial ryegrass and Yorkshire fog each with white clover was similar and was
lowest from February to May 1 998 (Table 7.8).
Re-growth of perennial rye grass with white clover was affected more under heavy shade
than that of the other grass species. Relative to the mean re-growth of the other pasture
species under heavy shade, perennial ryegrass with white clover had about 80% of its
re-growth in November, December and February, and for the other months, it was
within the range 70-75%. Under medium and light shade, however, re-growth of
perennial ryegrass with white clover was well above 80% relative to the mean re-growth
of the pasture species for most of the harvests (Table 7 .8) .
Total re-growth of herbage harvested was significantly affected by shade (P<0.OO01 ) .
Differences between species were also significant (P<0.OOO1 ), but not the interactive
effect of shade x species (Table 7.8) . Light shade had the highest total re-growth
followed by medium and the heavy shade. Highest total re-growth under light, medium
and heavy shade was by cocksfoot with lotus followed by cocks foot with white clover,
while lowest total re-growth was by perennial rye grass with white clover (Table 7.8) .

223
Table 7.8 Herbage harvested above 50mm (re-growth) (g/m2) at each month, and total herbage harvested
(glm2) of over all months (October 28,1997 to May 28, 1 998 ) (2 1 2 days) under different levels of shade at
Aokautere.
28 24 Treatments Gct Nov
1 997 1 997
63.5 43.5 YW 97.5 45.7 CW 83.8 54.9
Medium shade RW 1 15.2 55.3 YW 1 50.7 65.3 CW 1 32.6 70.4
Light shade RW 1 68.0 60.9 YW 202.4 67.0 CW 1 86.1 75.3
Analysis of variance Shade CA) P<O.OOOI P<O.05 SEM for shade 4.90 3.74 (dJ.=2) Species (B) P<O.OOOI P<O.OI SEM for species 6.82 2.62 (d.f.=3) Interactions NS NS (A*B) SEM for A*B 1 1 .82 4.53 (dJ.=6)
Herbage re-growth above 50 mm at each harvest (g/m2) 23 23 27 27 23
Dec Jan Feb Mar Apr 1 997 1 998 1 998 1998 1 998
39.2 3 1 . 1 3 1 .5 37.6 22.5 39.9 37.5 36.8 42.9 26.9 54.6 62.8 46.5 60.7 40.0
62.5 64.2 40.7 62.8 29.5 64.5 89.7 56.5 50. 1 36.9 82.2 94.8 58.7 57.9 45.6
76.0 79.8 40.7 57. 1 33.8 1 03 . 1 1 04.1 30.7 54.6 37.3 82.8 1 29.1 50.7 60.0 54.9
P<O.OI P<O.OOl P<O.Ol NS P<O.OOI 5 . 1 2 5.33 2.34 2.58 1 .28
P<O.Ol P<O.OOOl P<O.OI P<O.OI P<O.OOOI 4 . 17 3.99 4.09 2.28 2.30
NS NS NS P<O.OI NS
7.23 6.91 7.09 3.96 4.00
28 Total May herbage 1 998 over all
month
28.5 297.7 29.9 357.4 44.7 448.4
35.8 466.4 33. 1 547.1 47. 1 589.7
35.6 552.3 34.4 633.9 56. 1 695.5
P<0.05 P<O.OOOI 1 .56 1 5.71
P<O.OOOI P<O.OOOI 2.21 1 1 .55
NS NS
3.83 20.00
NS=no significant differences at P<0.05, SEM=standard error of the mean; where RW=perennial ryegrass+white clover, YW=Yorkshire fog+white clover, CW=cocksfoot+white clover, and CL=cocksfoot+lotus, d.f.=degrees of freedom

224
7.4. 1 .6 Botan ical composition
Distribution of grass, legumes, weeds and dead materials are presented as % botanical
composition for each month from March 1 997 to May 1 998 (Appendix Table 7 . 1 a,b).
The trend in botanical composition indicated inverse relationship between grass and
legume components. The mean % grass of all shade levels increased from March 1 997
to May 1 998 so as the decreased in mean % legumes (Figure 7 .5 , 7.6). Higher
percentage of grass in the composition during May 1 998 resulted severe reduction in %
legumes in all species, but with the maximum affect for legumes in a mixture with
cocksfoot which was highest in the proportion than other grasses (Figure 7.6).
C/l (1) "0 «:l ...s:: VJ (1) (1) .... 6 0 ...s:: .....
'-0 = 5 0 0 C/l 4 0 0 0.. S 0 3 0 c.> C/l C/l «:l 2 0 .... Of) = «:l 1 0 (1) S 'cf- 0
M arch 1 9 9 7
_ R yegrass Y o rk s h ire fo g
_ C o c k s fo o t w i th w c C o c k s fo o t w i th l o t u s
F e b r u ary 1 9 9 8 M o n th s
M ay 1 9 9 8
Figure 7.5 Percent mean grass composition of three shade levels on different grass-legumes combinations
over selected months.

'" Q) "'0 � ..c '" Q) Q) ..... ..s:: ...
4-< 0 c:: 0
.",::: '" 0 0.. 8 0 t) Q) 8 ;:J on Q) -c:: � Q) 8
'::f? 0
3 0
2 5
2 0
1 5
1 0
5
0 M arch 1 9 97
_ W h ite c lo v e r w ith rye g rass W h ite c lover w ith Y . fo g
_ W h ite c l o v e r w ith c o c k s fo o t L otu s w ith c o c k s foot
F ebruary 1 9 98
M o n t h s
M ay 1 9 9 8
225
Figure 7.6 Percent mean legume composition for three shade levels on different grass-legume
combinations over selected months.
Percent other materials that included dead materials and weeds in the botanical
composition were more or less similar over time, except during some dry months, such
as in February, where the proportion of dead material was nearly 50% in the
composition, especially for Yorkshire fog. The percentage of dead material, however,
dropped in the May once moisture contents in the soils improved (Figure 7 .7).
In general botanical composition was similar during March, April, and May 1 997. The
grass component contributed a higher percentage in all shade levels for all species
combinations. Cocksfoot ' s contribution was higher than for all other species in all shade
levels. The highest % of legume, as wel l as dead material, was with perennial ryegrass,
especially in heavy shade. The proportion of legume in the Yorkshire fog with white
clover in combinations, particularly under light shade, was also high, whi le the % dead
material was lowest with cocksfoot under all shade levels (Appendix Table 7 . 1 a).

tIl Q) "0 Cl:! ..c tIl Q) Q) .... ..c ....
<+-< 0 tIl "0 Q) Q) �
"0 c Cl:! tIl -Cl:! . .: Q) .... Cl:! S
"0 Cl:! Q)
"0 s:: Cl:! Q) S
�
5 0 4 5 4 0 3 5 3 0 2 5 2 0 1 5 1 0
5 0
March 1 99 7
Ryegrass w i th w . c lover Y . fo g w ith w . c lover
_ C ocksfoot w ith w. c lover C oc k s foot w ith l o tu s
F eb ruary 1 99 8 M o n t h s
M ay 1 9 9 8
226
Figure 7.7 Percent mean other materials composition of three shade levels on different grass-legumes
combinations over selected months.
January and February 1 998 had decreased percentage of grass in the case of perennial
ryegrass with white clover in combination, mainly under heavy shade, which was
largely replaced by weeds as well as dead materials. During February, botanical
composition was changed mainly in a mixture of Yorkshire fog with white clover where
proportion of grass was dropped down to 35% of the composition, whereas proportion
of dead material was increased up to 55% under the light shade . Likewise proportion of
legumes with the cocks foot mixture was decreased, with only about 1 -2% in the case of
lotus with cocks foot under light shade, which was replaced by dead material.
Proportion of weeds in a cocksfoot mixture was minimum (Appendix Table 7 . 1 b)

227
7.4.1.7 Tiller density
Increased shade level significantly (P<O.OOl ) reduced the number of tillers/m2, which
was also significantly different (P<O.OOl ) between species from November 1 997 to
February 1 998. However, the interactive effect of shade x species was not significant
(Table 7.9a). Highest tiller number/m2 was produced under light shade for all the
months by all the species, followed by medium shade and then heavy shade. Under
heavy shade cocksfoot always produced highest tiller number 1m2, while values for
Yorkshire fog were highest under the light shade (Table 7 .9a).
Table 7 .9a Tiller density (number/m2) of the grass component in grass-legume mixtures under three levels
of tree shade at Aokautere from November 1 997 to February 1 998.
Treatments 24 November 20 December 1 7 January 2 1 February 1 997 1997 1 99 8 1 998
Heavy shade RW 2275 1 850 1 67 5 1 925 YW 1 675 2025 2350 2200 CW 2825 2275 2400 2500 CL 2675 2225 1750
Medium shade RW 2950 1 875 2575 2 1 75 YW 2275 3025 3600 2725 CW 3500 2800 2775 2675 CL 2850 2275 2625 2825
Light shade RW 3700 2650 2975 2475 YW 3 850 3900 4650 3500 CW 4075 3 1 25 3700 3 1 50 CL 3425 2975 2950 2850
Analysis of variance Shade (A) P<O.OOI P<O.OOI P<O.OOI P<O.OOl SEM for shade 1 29.95 94.99 1 3 1 .62 77.81 (d.f.=2) Species (B) P<O.Ol P<O.OOI P<O.OOOl P<O.OOl SEM for species 1 6 l .02 1 29.20 1 2 1 . 10 96.71 (d.f.=3)
NS=no significant differences at P<0.05, SEM=standard error of the mean; where RW=perennial ryegrass+white clover, YW=Yorkshire fog+white clover, CW=cocksfoot+white clover, and CL=cocksfoot+lotus, d.f.=degrees of freedom

228
March, April, and May 1998 also had significant (P<O.OO I ) effects of shade on tiller
density where species differences were also significant (P<O.OOOl ) for all the months
but the interactive effects of shade x species were not significant. Light shade always
produced highest tiller number/m2 with the lowest under heavy shade (Table 7 .9b).
Table 7.9b Tiller density (number/m2) of the grass component in grass-legume mixtures under three
levels of tree shade at Aokautere from March to May 1 998.
Treatments March 20 April 1 8 May 20 Repeated measures 1998 1 998 1 99 8 (Nov 24 to May 20)
Heavy shade RW 1 575 1757 YW 3000 2496 CW 3200 2793 CL 3075
Medium shade RW 2125 2675 2250 2375 YW 3325 3925 4 1 50 3289 CW 3350 3550 3775 3204 CL 3575 3625 3575 3050
Light shade RW 3075 3400 301 1 YW 4350 4575 4100 CW 4 1 25 4425 3732 CL 4 1 75
Analysis of variance Shade (A) P<O.OI P<OOOI P<O.OOI P<O.OOOI SEM for shade 97.78 1 08.79 1 5 1 .94 57.63 (dJ.=2) Species (B) P<O.OOOl P<O.OOOI P<O.OOOI P<O.OOOI SEM for species 97.35 1 07.38 86.93 66.55 (dJ.=3) Interactions (A *B) NS NS NS P<0.05 SEM for A*B 168.61 1 85.99 1 50.57 I l5 .27 (dJ.=6)
NS=no significant differences at P<O.05, SEM=standard error of the mean; where RW=perennial ryegrasS+white clover, YW=Yorkshire fog+white clover, CW=cocksfoot+white clover, and CL=cocksfoot+lotus, d.f.=degrees of freedom
Repeated measures of tiller density over seven occasions showed a significant effect
(P<O.OOOI ) of shade, species (P<O.OOOI ) and the interaction of shadexspecies (P<O.05).
Highest tiller density was under light shade by Yorkshire fog with white clover

229
followed by cocksfoot with white clover. Tiller density of perennial ryegrass was
lowest. This trend was repeated under the medium shade. Under heavy shade, however,
highest tiller density was by cocksfoot either with white clover or lotus followed by
Yorkshire fog. Perennial ryegrass had only about 73% of the tiller density relative to
the mean value for heavy shade (Table 7.9b).
7.4.1.8 Legumes growing points or branches density
There was no effect of shade on the number of growing points (GP) of white clover or
the number of branches of lotus for November and December 1 997, but the effect was
significant for January and February 1 998 (P<O.Ol ). There were also differences
between species (P<O.OOOl ) for all the months. However, interactive effects between
shade and species were not significant (Table 7. lOa).
Lotus always had higher density of branches under all levels of shade with the highest
under light shade and for the months of November and December.
In general, white clover GP density was greater under heavy shade but often similar to
that under medium shade (e.g. November). White clover GP density was highest with
perennial ryegrass and lowest with a mixture of cocksfoot. For example, in February,
white clover GP density under light shade with perennial ryegrass was 1 12% relative to
the mean value of light shade, in comparison to 97% with Yorkshire fog and 60% with
cocksfoot (Table 7. l 0a). Effects of shade on the number of GP of white clover or the
number of lotus branches was significant (P<O.OOOl ) for the months of April and May,
and also for the repeated measurements (Table 7. l Ob). Similarly, differences between
species were significant (P<O.OOOl ) for these months . GP density of white clover with
ryegrass component was similar in all shade levels, often greater under medium shade
(April) which was highest than with the Yorkshire fog or the cocks foot in mixture.
Repeated measures analysis revealed the significance of shade, species, and time with
the interactive effects of shade x time and species x time for the GP density of white
clover or the branches of lotus. Highest mean density w as found under light shade
followed by medium and heavy shade. Among the species, greater density was in a

230
mixture with perennial rye grass followed by Yorkshire fog and the lowest with
cocksfoot (Table 7 . l0b).
Table 7 . l Oa Density of growing points or branches (number/m2 ) for white clover and lotus in grass
legume mixtures under different levels of tree shade at Aokautere from 24 November 1997 to 2 1
February 1 998. ( * In transform, and value inside the parentheses are back transformed).
Treatments 24 Nov 1 997 *
Heavy shade RW 6.10 (446) YW 5.97 (392) CW 5.67 (290) CL
Medium shade RW YW CW
Light shade RW 6.23 (508) YW 6.28 (534) CW 6.08 (437)
Analysis of variance Shade (A) NS SEM for shade 0.07 (dJ.=2) Species (B) P<O.OOOl SEM for species 0.06 (dJ.=3)
20 Dec 1 997
350 250 250
575 450 425
NS 72.49
P<O.OOOl 70.02
Jan 1 99 8 *
5.91 (369) 5 .50 (245) 5 .39 (2 19)
1
5.95 (384) 6.05 (424) 5 .74 (3 1 1 ) 7.44 ( 1 703)
"�1""�'V"'!."', " " ,"'
6.56 (706) 6 . 14 (464) 5 .74 ( 3 1 1 )
P<O.Ol 0.08
P<O.OOOl 0.06
21 Feb 1 998
400 325 250
P<O.Ol 54.64
P<O.OOl 37. 1 3
NS=no significant differences at P<D.05, SEM=standard error o f the mean; where RW=perennial ryegrass+white clover, YW::::Yorkshire fog+white clover, CW=cocksfoot+white clover, and CL=cocksfoot+lotus, d.f.=degrees of freedom
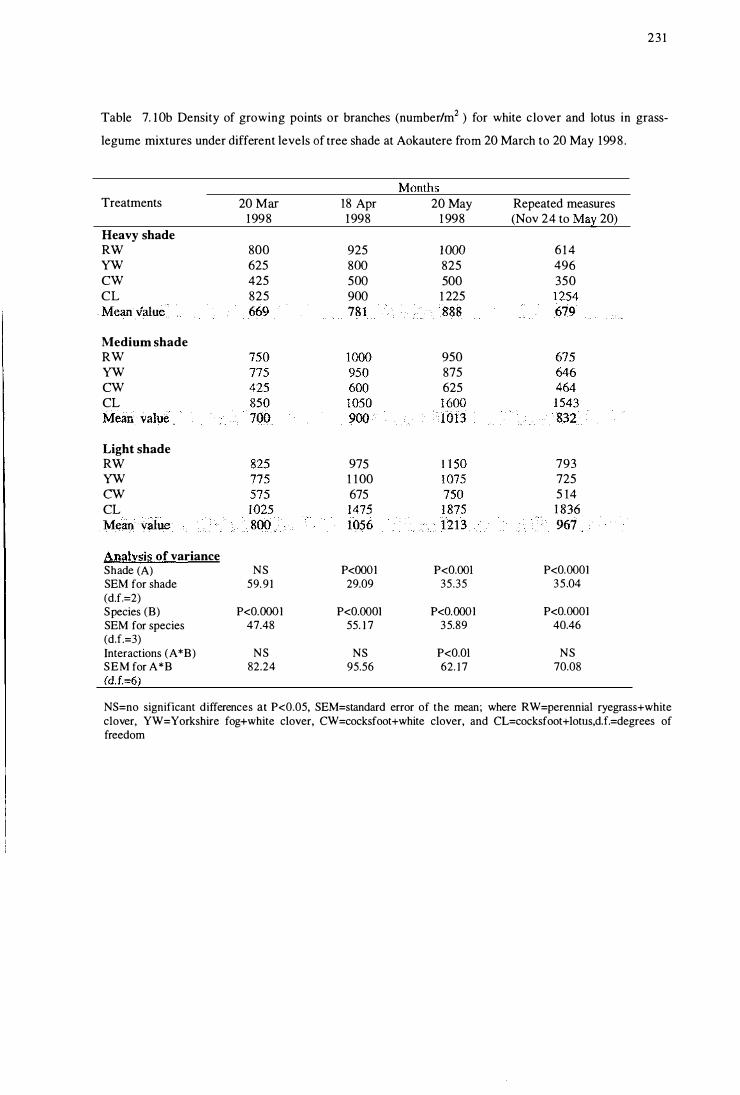
23 1
Table 7. l Ob Density of growing points or branches (number/m2 ) for white clover and lotus in grass
legume mixtures under different levels of tree shade at Aokautere from 20 March to 20 May 1998 .
Treatments 20 Mar 18 Apr 20 May Repeated measures 1998 1998 1 998 (Nov 24 to Ma� 20)
Heavy shade RW 800 925 1000 6 1 4 YW 625 800 825 496 CW 425 500 500 350 CL 825 900 1 225
Medium shade RW 950 YW 875 CW 625 CL
Light shade RW 975 793 YW 1 100 725 CW 675 5 14 CL 1
Analysis of variance Shade (A) NS P<OOOI P<O.OOl P<O. 000 I SEM for shade 59.91 29.09 35.35 35.04 (d.f.=2) Species (B) P<O.OOOI P<O.OOOI P<O.OOOI P<O. 000 I SEM for species 47.48 55. 1 7 35.89 40.46 (dJ.=3) Interactions (A *B) NS NS P<O.Ol NS SEM for A*B 82.24 95.56 62. 17 70.08
NS=no significant differences at P<0.05, SEM=standard error of the mean; where RW=perennial ryegrass+white clover, YW=Yorkshire fog+white clover, CW=cocksfoot+white clover, and CL=cocksfoot+lotlis,dJ.=degrees of freedom

232
7.4.2 Experiment 7.2
7.4.2. 1 Diet selection by sheep
Diet selection by sheep was examined in terms of total number of sheep grazing, total
number of observations of sheep grazing, grazed tillers and legume growing points, and
the ratio of the grazed tillers to legumes (Table 7 . 1 1 ) .
There was a significant difference between the shade levels (P<0.05) in terms of the
total number of sheep grazing in two hours. More sheep grazed under light shade,
followed by medium, and then heavy shade (Figure 7 . 8) . Under medium shade, there
were about 80% of the observations of sheep grazing relative to the mean sheep grazing
observations under light shade, whereas under heavy shade there were 50% of the l ight
shade grazing observations (Table 7. 1 1 ) . However, choice of pasture species, and the
interaction between shade and species was not significant (P>0 .05) for the total number
of sheep grazing in two hours.
Figure 7.8 Sheep grazing under light shade.

233
Table 7 . 1 1 Total number of sheep grazing, total number of observations of sheep grazing, grazed tillers
and growing points/branches of marked legumes, and the ratio of grazed tillers to legumes for Yorkshire
fog with white clover, cocksfoot with white clover, and cocksfoot with lotus components of pastures
grown under alder trees, at Aokautere, November 1 998.
Grazing and related attributes
Treatments Total number Total number Number of Number of Ratio of
of sheep of tagged tillers tagged grazed tillers grazing observations grazed legumes to legumes
of sheep (out of S ) grazed
YW 12.2 6.2 2.0 1 .7 1.4 CW 2S .0 8 .2 2.7 2.0 1 .6 CL 1 9.0 6.7 2.2 3 .0 0.7
�!!!mi��d� YW 33.0 1 2.0 3.7 2.2 1 .7 CW 29.0 1 1 .2 3.0 1 .7 2.0 CL 26.S 1 3.2 3 .5 3 .0 1 . 1
����4� YW 36.0 12.7 3.2 2.5 1 .4 CW 38.5 l S .0 3.2 2.7 1 .2 CL 36.7 14 .0 3 .2 3.S 1 .0 Anal:ysis of variance Shade (A) P<0.05 P<0.05 P<O.Ol NS NS SEM 3.69 0 . 10 0. 1 3 0.35 0.25 (d.f.=2) Species (B) NS NS NS P<O.O l P<O.Ol SEM 2.36 0.07 0. 1 7 0 . 1 9 0. 1 3 (d.f.=2) Interaction (A *B) NS NS NS NS NS SEM 4.08 0. 13 0.29 0.34 0.23 (d.f.=4) NS=no significant differences at P<O.05, SEM=standard error of the mean, YW=Yorkshire fog+white clover, CW=cocksfooHwhite clover, and CL=cocksfooHiotus,dJ.=degrees of freedom, d.f.=degrees of freedom
The number of tagged tillers that were grazed by sheep was significantly different
(P<O.Ol ) between the shade levels, but the species and the shade x species effects were
not significant. Out of 5 marked tillers, 3 .2 under light shade, 3 .4 under medium shade
and 2.3 under heavy shade were grazed (Table 7. 1 1 ) .
There was no significant difference (P>O.05) in the of number of tagged legumes that
were grazed across the shade levels, but species differences (P<O.Ol ) in grazing
234
preference were found. Lotus was selected more than white clover in all shade levels in
cocksfoot plots with the highest preference under light shade. Grazing of white clover
was similar in the mixtures with Yorksire fog and with cocksfoot (Table 7 . 1 1 ).
For ratio of grazed tillers to legumes there was a significant difference between species
(P<O.O 1 ) but not shade levels. Lotus was grazed more than white clover. The grass:
legume ratio was smaller for cocksfoot with lotus in all shade levels, compared with
Yorkshire fog with white clover, or cocksfoot with white clover (Table 7 . 1 1 ) .
7.5 Discussion
7.5.1 Pasture species in the mixture and performance under deciduous tree shade
The greater the shade levels under the alders the lower the herbage production and the
tiller density and the lower the grazing preference by sheep. There was a marked effect
of shade on the herbage mass (HM), and also on the re-growth of herbage harvested
above the defoliation height of 50mm. HM was always higher under the light shade and
lowest under the heavy shade for all the experimental period. For example, HM in
heavy and medium shade was only about 50% and 70%, respectively, of that in light
shade. Differences between species were also markedly affected by shade; HM and
tiller density of cocksfoot were always highest especially under heavy shade whereas
perennial ryegrass and Yorkshire fog had the lowest HM and tiller density. Tiller
density under heavy shade was only about 60% of that in light shade. There was no
difference in the choice of understorey pasture species by sheep, while the number of
observations of sheep grazing was about 50% higher under light shade than under heavy
shade.
HM in heavy and medium shade was 50% and 70%, respectively, of HM in light shade
for alders pruned to different heights. This suggested that understorey herbage
production will be largely affected by increased shading at high density of trees if they
are not pruned effectively (Braziotis and Papanastis 1995; Eastham and Rose 1 998).
Therefore pruning management could be an effective practice for deciduous trees.
Shading is one of the most significant factors that detennine the productive performance

235
of understorey pastures (Shelton et al. 1987). Accordingly, the abilities of plants to
regenerate leaf area to maximise interception of available radiation, and to generate
tillers and stolons from main stems are the critical factors that determine production and
persistence of pasture species under low irradiance (Chen 1993) .
Cocksfoot either with lotus or white clover, always produced significantly higher HM or
the re-growth above the defoliation height of 50mm in all shade levels compared with
Yorkshire fog with white clover or perennial ryegrass with white clover. The higher
HM of cocksfoot was supported by higher tiller density, except during January, (Tables
7 .9a, b), and a higher proportion of the grass component in the botanical composition
(Appendix Tables 7. 1a, b; Figures 7.5-7.7), especially under heavy shade. Previous
research results in the glasshouse conditions also supported this trend that higher
numbers of tillers per plant was positively associated with higher shoot dry weight per
plant (Devkota et al. 1997; 1998; Chapters 3, 4). High numbers of tillers, however, did
not result in a high HM for Yorkshire fog in a mixture with white clover (Tables 7 .9a,
b). Previous research results (Chapters 3-6) also revealed that morphological
characteristics of pasture species such as tiller numbers per plant, leaf area, and specific
leaf area were important to sustain and produce higher shoot dry weight under heavy
shade.
Significant differences between the species under shade from December/January
onwards in HM indicated that there were differences in competition for water between
trees and pasture during the dry period. Total moisture distribution across all months
was not monitored in this experiment, but less water stress in the cocks foot plots than
other species was particularly visible during January 1998 (Table 7Ab). Miller et al.
( 1 998) in a study of transpiration rates and canopy conductance of Pinus radiata
growing with different pasture understories in Canterbury, New Zealand, reported that
there was a reduction in mean transpiration flux density of Pinus radiata trees in the
cocks foot treatments, indicating the greater competition between Pinus radiata and
cocksfoot than Pinus radiata and perennial ryegrass, enabling cocksfoot to grow better
during a dry summer compared with perennial ryegrass. Montard et al. ( 1999) found
strong competition for light, water and nutrients in an association of hazel trees and

236
cocksfoot. Cocksfoot roots were predominant in the upper 20cm layer during dry
periods, resulting in both water and N deficits for the trees.
Cocksfoot is the second most commonly sown grass species after perennial ryegrass in
New Zealand farming (Moloney 1 993). Relative to perennial ryegrass , cocks foot
provides reliable leafy summer growth free of endophyte and of moderate nutritive
value, but with greater persistency in dryland (Rumball 1 982; MacFarlane 1 990;
Woodman and Fraser 199 1 ; Moloney 1 993; Fraser and Hewson 1 994). This experiment
indicated that cocksfoot is also a good producer under heavy shade (PAR level about
200 Jlmoles photons m-2 S-I or even lower) (Tables 7.3a, b ; Chapters 3-6), even when
fertility is low and with prolonged drought. Cocksfoot, 'Grasslands Wana' was also
determined to be one of the most shade tolerant species in monoculture conditions
(Devkota et al. 1 997; 1998). Cocks foot was equally shade tolerant in mixture with
either white clover or lotus. However, legume abundance in dry months was
particularly affected due to the presence of cocks foot as a component species.
Low HM by perennial ryegrass, particularly in the heavy shade, could have been
exacerbated by the poor soil fertility. Olsen P of the experiment plots was 1 1 .4 Jlglg
with pH of 5.5 (Table 7 . 1 ) . Low level of monthly rainfall during January to April with
lowest in March 1998 (Figure 7 .2) also suggests that perennial ryegrass was under stress
not only due to shade but also from the low level of soil moisture, coupled with low
fertility and high soil temperature (> 20°C) (Tables 7.5a, b). However, production of
perennial ryegrass under medium and light shade was not affected as much as under
heavy shade, which indicates that perennial ryegrass could probably be managed under
an intermediate level of shade (PAR level >200 Jlmoles photons m-2 S-l) (Tables 7 .3a, b ;
Chapters 3 -6).
The proportion of legume in the pasture was always lower with cocks foot than
Yorkshire fog and perennial ryegrass , especially under light and medium shade (Figure
7 .6). Moloney ( 1993) suggested that cocksfoot appeared to suppress white clover with
its ability to compete faster for resources. This experiment also showed that there was a
very small proportion of white clover and lotus in mixture with cocksfoot, especially
during dry months under light shade.

237
West et al. ( 1 988 ; 1991 ) reported that Yorkshire fog was one of the better performed
species under shade. However, this experiment showed that Yorkshire fog was inferior
to cocksfoot, and similar to perennial ryegrass in terms of HM in all the shade levels
(Table 7.7). Yorkshire fog had a higher tiller density compared to other species in all the
shade levels , but this did not lead to a higher level of HM. Yorkshire fog was
particularly affected by the dry periods. Botanical composition revealed that % dead
material in Yorkshire fog in all the shade levels was well above 50% during March
1998 (Appendix Table 7 . 1b).
There was no difference in the HM of cocks foot with white clover or with lotus in all
shade levels. Lotus was particularly seasonal in growth. For example, there was a
significantly higher proportion of lotus in the mixture with cocksfoot during October
and November in all shade levels compared with the other months, but the proportion
from December onwards was progressively lower with almost none during March and
April 1998 . Gadgil et al. ( 1986), West et al. ( 1 988), and West et al. ( 199 1 ) all indicated
that lotus is one of the most successful legumes under shade, and can be readily
established on a range of sites. However, results of this experiment showed that lotus
could be sensitive to the changes in season, and was also suppressed by the companion
grass during a dry summer.
The proportion of white clover in all the shade levels was reasonably high until January
(Appendix Table 7 . 1a, b). The contribution of white clover to the botanical composition
was negligible from February to April, as in the case of lotus. White clover could have a
lower level of photosynthesis in shade 0N oldge and Parsons 1986), especially in a
mixture of cocksfoot which was mowed only once in a month. This could be the one
reason for the lower proportion of white clover during the dry period.

238
7.5.2 Diet selection by sheep under tree shade
Vigilant behaviour of sheep while grazing (Pulliam and Caraco 1 984; TIlius and
Fitzgibbon 1 994) could explain the sheep behaviour of selecting their diet more in light
shade than under heavy shade. It is well known that vigilant behaviour of ruminants is
the best defence against predators. It was noticed while monitoring the grazing that
sheep mostly moved in a group and were most vigilant under heavy shade. Therefore,
availability of more light under light shade and medium shade could be one of the
reasons why sheep concentrated their grazing there. This was further supported by the
sheep becoming indifferent to grazing across the shade levels after sunset, which was
observed on both days of grazing.
Differences in pasture structure (Gordon and Lascano 1993) between the shade levels
could have affected the differences in diet selection, as could have changes in texture
(Vallentine 1 990). Equally, differences in selection could have also been due to the
animal response to variation in the vertical distribution between species (Hodgson
198 1 ) .
One important point to note is that the limited area available around the experimental
site meant that the sheep could not be acclimatised to the conditions before observations
started, so they had no preliminary experience of the plot lay out. However, there was
no notable change observed in the behaviour of the sheep over the two days.

239
7.6 Conclusion
Cocksfoot was found to be the most shade tolerant pasture species, whether grown with
white clover or lotus in a mixture, in the conditions of low soil fertility and moisture
stress present during this experiment. The ability of cocksfoot to produce herbage mass
under shade was associated with its relatively higher tiller production in heavy shade
than for the other grass species. Cocksfoot was also defoliation tolerant. The ability of
cocks foot to regenerate leaf area to maximise interception of available radiation, and to
generate tillers were critical factors that determined its production and persistence
under low irradiance. On the other hand, Yorkshire fog was sensitive to shade, and
drought. In Chapter 3 Yorkshire fog was one of the species that produced tillers under
low irradiance in monoculture and it was assumed to be shade tolerant. Yorkshire fog
also had high tiller numbers under the different shade levels under alders, but it could
not produce a high biomass under the tree shade.
Perennial ryegrass was the most affected pasture species in all shade levels, particularly
under heavy shade. The low level of herbage mass of perennial ryegrass under tree
shade was directly related to its low tillering ability in the shade, and also, possibly, to
the combined effects of low light, poor soil fertility and low soil moisture content.
Production of perennial ryegrass was also affected under medium and light shade, but
not as much as under heavy shade, which indicates that ryegrass could probably be
managed under an intermediate level of shade. This agreed with findings of previous
studies in the glasshouse (Chapters 3 , 5 and 6) as well as under trees (Chapter 4).
It can be concluded that cocksfoot is the most shade tolerant pasture species which
produced higher herbage mass, especially under heavy shade. This suggested the use of
cocks foot under heavy shade even when soils are limited with poor fertility and climatic
stress such as summer drought. However, the moderate nutritive value of cocks foot
needs to be considered while trading-off between the scale of cocksfoot production for a
silvo-pastoral system. The level of shade rather than the differences in the pasture
species largely determined differences in the diet selection by sheep. Vigilant behaviour

240
of sheep against dark (low light) under heavy shade could be an important factor for
having a low level of grazing under heavy shade.
Cocksfoot was concluded to be the most shade tolerant pasture which produced higher
herbage mass, especially under heavy shade. This suggested the use of cocks foot under
heavy shade even when soils are limited with poor fertility and climatic stress such as
summer drought. However, the moderate nutritive value of cocksfoot needs to be
traded off against its superior production in a silvo-pastoral system. Sheep grazing
under alder trees indicated no differences in choice between pasture grass, but their
preference to graze more under light shade needs further validation in a long-term study.
Results suggested that pasture production is affected by shade but comparatively it can
be managed by pruning trees. Pruning trees can be an equally effective way to conserve
soil moisture content along with minimizing the effects of shade.

241
7.7 References
Anderson, G. W. and Batini, E . F. 1983. Pasture, sheep and timber from agroforestry
systems with subterranean clover sown under 15 year old Pinus radiata by a
method simulating aerial seeding. Australian Journal of Experimental
A griculture and Animal Husbandry 23: 123-1 30.
Anonymous, 1 995. Poplar agroforestry: An introduction to using poplars for timber.
New Zealand Poplar Commission, Palmerston North, New Zealand.
Atta-Khrah, A. N. 1993. Trees and shrubs as secondary components of pasture.
Proceedings of the XVII Grasslands Congress, New Zealand: 2045-2052.
B ird, P . R , Bicknell, D., Bulman, P. A., Burke, S . J. A., Leys, J. F., Parker J. N.,
Van Der Sornmen, F. J. and Voller, P. 1992. The role of shelter in Australia for
protecting soils plants and livestock. Agroforestry Systems 20:59-86.
Bowersox, T. W. and Ward, W . W. 1977. Soil fertility, growth and yield of young
hybrid poplar plantations in central Pennsylvania. Forest Science 23:463-469.
Braziotis D. C and Papanastasis, V. P. 1 995. Seasonal changes of understorey herbage
yield in relation to light intensity and soil moisture content in a Pinus pinaster
plantation. Agroforestry Systems 29:9 1-10 1 .
Cameron, D . M., Rance, S . J . , Jones, R. M., Charler-Edwards, D . A . and Barnes, A.
1 989 . Project STAG: An experimental study in agroforestry. Australian Journal
of Agricultural Research 40:699-7 14.
Chen, C. P. 1993. Pastures as the secondary component in tree-pasture systems.
Proceedings of the XVII International Grassland Congress, New Zealand, 2037-
2043 .

242
Clough, P. W. J. and Hicks, D. L. 1993 . Soil Conservation and the Resource
Management Act Summary. MAF Policy Technical Paper, 93/2, Wellington,
New Zealand.
Devkota, N . R., Kemp, P. D. and Hodgson, J. 1 997. Screening pasture species for shade
tolerance. Proceedings Agronomy Society of New Zealand 27: 1 19- 128 .
Devkota, N. R . , Kemp, P . D . , Valentine, I . and Hodgson, 1. 1 998. Performance of
perennial ryegrass and cocksfoot cultivars under tree shade. Proceedings
Agronomy Society of New Zealand 28: 1 29- 1 35 .
Ditschal, D . c., CoIlins, M. and Grove, J. H. 1 997. Black locust effects on forage yield
and nutritive quality produced on reclaimed mined land. Proceedings of the
XVIII International Grassland Congress, Canada, ID NO. 839.
Eastham J and Rose C. W. 1 988. Pasture evaporatranspiration under varying tree
planting density in an agroforestry experiment. Agricultural Water Management
1 5 : 87-105 .
Eriksen, F. I . and Whitney, A. S . 1 98 1 . Effects of light intensity on growth of some
tropical forage species . I. Interaction of light intensity and nitrogen fertilization
on six forage grasses. Agronomy Journal 73 :427-433 .
Fraser, T. 1 . and Hewson, D. C . 1994. Establishing drought-tolerant pasture species on
east coast down lands by direct drilling. Proceedings of the New Zealand
Grassland Association 56:73-76.
Gadgil, R. L., Charlton, J. F. L., Sandberg, A. M. and Allen, P. J. 1 986. Relative growth
and persistence of planted legumes in a mid-rotation radiata pine plantation.
Forest Ecology and Management 14: 1 1 3 - 124.

243
Gordon, I. J . and Lascano, C. 1 993. Foraging strategies of ruminant livestock on
intensively managed grasslands : Potential and constraints. Proceedings of the
XVII International Grassland Congress, New Zealand, 68 1 -690.
Hawke, M. F. 1 99 1 . Pasture production and animal performance under pine agroforestry
in New Zealand. Forest Ecology and Management 45 109- 1 1 8.
Hawke, M. F. and Knowles, R. L. 1997. Temperate agroforestry systems in New
Zealand. Pp 85-1 1 8 in: Temperate Agroforestry Systems, Gordon, A. M. and
Newman, S . M. ed. CAB International, Wallingford, U.K.
Hodgson, J . 1 98 1 . Variations in the surface characteristics of the sward and the short
term rate of herbage intake by calves and lambs. Grass and Forage Science
36:49-57.
mius, A.W. and Fitzgibbon, C. 1994. Costs of vigilance in foraging ungulates . Animal
Behaviour 47 :48 1 -484.
Jaswal, S . c., Mishra, V. K. and Verma, K. S . 1 993. Intercropping ginger and turmeric
with poplar (Populus deltoides 'G-3 ' Marsh.). Agroforestry Systems 22: 1 1 1-
1 17 .
Kelliher, F. M., Marden, M. , Watson, A. J. and Arulchelvan, I . M. 1995. Estimating
the risk of land sliding using historical extreme river flood data (Note). Journal
of Hydrology (NZ) 33: 123-129.
Kephart, K. D. and Buxton, D. R. 1993 . Forage quality responses of C3 and C4
perennial grasses to shade. Crop Science 33: 432-450.
Knowles, R. L. 1 99 1 . New Zealand experience with silvopastoral systems: A review.
Forest Ecology and Management 45: 25 1 -267.

244
Knowles, R. L., Brann, G. M. and Brann, G. J. 199 1 . An evaluation of agroforestry on
a Bay of Plenty hill country farm. Proceedings of the New Zealand Grassland
Association 53: 1 6 1 - 168 .
Knowles, R . L. , Hawke, M. F . and Madaren, J. P. 1995. Agroforestry research at
Tikitere. New Zealand Forest Service, Forest Research Institute. Ministry of
Agriculture and Fisheries, Field Research Division.
MacFarlane, A. W. 1990. Field experience with new pasture cultivars in Canterbury.
Proceedings of the New Zealand Grassland Association 52: 1 39- 143.
Madaren, J. P. 1 993. Radiata Pine Growers' Manual. New Zealand Forest Research
Institute. Griffith, J. and Bryce, I. ed. Forest Research Institute Bulletin No. 1 84.
Miller, B. J. , Clinton, P. W., Buchan, G. D. and Robson, A. B . 1 998. Transpiration
rates and canopy conductance of Pin us radiata growing with different pasture
understories in agroforestry systems. Tree Physiology 1 8 :575-5 82.
Miller, D. E. K., Gi1christ, A. N. and Hicks, D. L. 1 996. The role of broadleaved trees
in slope stabilisation in New Zealand pastoral farming. Pp 96- 1 04 in: Mountains
of East Asia and the Pacific, Ralston, M. M., Hughey, K. F. D. and O'Connor,
K. F. ed. Centre for Mountain Studies, Lincoln University, Canterbury, New
Zealand.
Moloney, S. C. 1 993. Selection, management and use of cocks foot cultivars in North
Island pastoral farming. Proceedings of the New Zealand Grassland Association
55 : 1 19-125.
Montard, F. X., Rapey, H., Delpy, R. and Massey, P. 1 999. Competition for light,
water and nitrogen in an association of hazel (Corylus avellana L.) and
cocksfoot (Dactylis glomerata L.). Agroforestry Systems 43: 1 35- 1 50.

245
Nair, P. K. R. and Dagar, J . C. 199 1 . An approach to developing methodologies for
evaluating agroforestry systems in India. Agroforestry Systems 1 6:55-8 1 .
New, E . 1 985. Coppicing. NewZealand Tree Grower 10( 1 ): 14- 1 8.
NZMF (New Zealand Ministry of Forestry). 1 995. Small forest management r. Special
purpose timber species. Ministry of Forestry.
Ong, C. K. 1 996. A framework for quantifying the various effects of tree-crop
interactions. Pp 1-23 in: Tree-Crop Interaction: A Physiological Approach,
Ong, C. K. and Huxley, P. ed. CAB International, Wallingford, UK, in
association with International Centre for Research in Agroforestry, Nairobi,
Kenya.
Oppong, S . K. 1 998. Growth, management and nutritive value of willows (Salix spp.)
and other browse species in Manawatu, New Zealand. Unpublished PhD thesis ,
Massey University, 1 7Op.
Pollock, K. M., Lucas, R, J., Mead, D. J. and Thomson, S . E. 1 994. Forage pasture
production in the first three years of an agroforestry experiment. Proceedings of
the New Zealand Grassland Association 56: 179- 1 85 .
Pulliam, H. R. and Caraco, T. 1 984. Living in groups: Is there an optimal group size?
Pp 1 22-147 in: Behavioural Ecology. Krebs, J. R. and Caraco, T. ed. Blackwell
Scientific, Oxford.
Rumball, W. 1 982. 'Grasslands Wan a' cocksfoot (Dactylis glomerata L.). New
Zealand Journal of Experimental Agriculture 10:5 1 -52.
Samarakoon, S. P., Wilson, J. R. and Shelton, H. M. 1 990. Growth, morphology and
nutritive quality of shaded Stenotaphrum secundatum, Axonopus compressus
and P ennisetum clandestinum. Journal of Agricultural Science 1 14: 1 6 1 - 169.

246
SAS Institute Inc. 1997. SAS /STAT user' s guide, Version 6. 1 2 SAS Institute. Cary,
North Carolina, USA.
Seo, S . , Han, Y. C. and Park, M. S. 1989. Grassland improvement and N fertilization
management of woodland in Korea. Proceedings of the XVI International
Grassland Congress, Nice, France: 1487-1488.
Shelton, H. M., Humphreys, L. R. and Batello, C. 1 987. Pastures in the plantations of
Asia and the Pasific: Performance and prospect. Tropical Grasslands 2 1 : 1 59-
1 68 .
Stilr, W . W. and Shelton, H. M. 1 99 1 . Review of forage resources in plantation crops
of Southeast Asia and the Pacific. Pp 25-3 1 . in: Forage for Plantation Crops,
Shelton, H. M. and Stilr, W. W. ed. ACIAR proceedings No. 32, Canberra.
Thevathasan, N. V. and Gordon, A. M. 1997. Poplar leaf biomass distribution and
nitrogen dynamics in a poplar-barley intercropped system in Southern Ontario,
Canada. Agroforestry Systems 37:79-90.
Treeby, B . 1978. Poplars:High quality stock food. Farm Forestry 20(4) : 1 1 0- 1 1 2.
Trustrum, N. A. and Blaschke, P. M. 1992. Managing hill country erosion. The New
Zealand Farmer. Farm Progress. June 1 0:45-47.
Vallentine, J. F. 1990. Grazing Management. Academic press, USA, 533 p.
Wall, A. J., Mackay, A. D., Kemp, P. D., Gillingham, A. G. and Edwards, W. R. N.
1 997. The impact of widely spaced soil conservation trees on hill pastoral
systems. Proceedings of the New Zealand Grassland Association 59: 1 7 1 - 1 77.
Welles, J . M. 1990. Some indirect methods of estimating canopy structure. Remote
Sensing Reviews 5 :3 1 -43.

247
Welles, J. M. and Norman, J. M. 1 99 1 . Instrument for indirect measurement of canopy
architecture. Agronomy Journal 83:8 18-825.
West, G. G. , Dean, M. G. and Percival, N. S. 199 1 . The productivity of Maku lotus as a
forest understory. Proceedings of the New Zealand Grassland Association
5 3: 1 69- 173.
West, G. G. , Percival, N. S. and Dean, M. G. 1988 . Over sowing legumes and grasses
for forest grazing: Interim research result. Forestry Research Institute Bulletin
1 39 :203-222. Rotorua, New Zealand
Wilson, J . R. and Ludlow, M. M . 1 991 . The environment and potential growth of
herbage under plantations. Pp 10-24 in: Forage for Plantation Crops, Shelton,
H. M. and Sttir, W. W. ed. A CIAR proceedings No. 32, Canberra.
Woodman, R. F. and Fraser, W . J . 1 99 1 . Alternative grass options for dry east coast
and down land pastoral systems. Proceedings Agronomy Society of New
Zealand 2 1 :45-53.
Woledge, J. and Parsons, A. J. 1986. Temperate grasslands. Pp 1 73- 197 in:
Photosynthesis in Contrasting Environments, Barker, N. R. and Long, S . P. ed.
Elsevier Science Publishers, Amsterdam.
Wolters, G. L. 1 982. Long leaf and slash pine decreases herbage production and alters
herbage composition. Journal of Range Management 3 5:761-763.

8. Effect of tree shade on tissue turnover in perennial
ryegrass/white clover, Yorkshire fog/white clover
and cocksfootlwhite clover pasture
248
Page
8.1 SUMM.ARY .......................................................................................................... 250
8.2 INTRODUCTION ................................................................................................ 252
8.3 MATERIALS AND METHODS .................... .................................................... 253
8 .3 . 1 Site description . . . . . . . . . . . . . . . . . . . . . . . . . . . . . . . . . . . . . . . . . . . . . . . . . . . . . . . . . . . . . . . . . . . . . . . . . . . . . . . . . . . . . . . . . . . . . . . . 253
8 .3 .2 Experimental treatments and designs . . . . . . . . . . . . . . . . . . . . . . . . . . . . . . . . . . . . . . . . . . . . . . . . . . . . . . . . . . . . . . 253
8 .3 .3 Tissue turnover . . . . . . . . . . . . . . . . . . . . . . . . . . . . . . . . . . . . . . . . . . . . . . . . . . . . . . . . . . . . . . . . . . . . . . . . . . . . . . . . . . . . . . . . . . . . . . . . 254
8 .3 .3 . 1 Tissue turnover in grasses . . . . . . . . . . . . . . . . . . . . . . . . . . . . . . . . . . . . . . . . . . . . . . . . . . . . . . . . . . . . . . . . . . . . . . . . . 255
8 .3 .3 .2 Tissue turnover in white clover . . . . . . . . . . . . . . . . . . . . . . . . . . . . . . . . . . . . . . . . . . . . . . . . . . . . . . . . . . . . . . . . . 256
8 .3 .4 Statistical analysis . . . . . . . . . . . . . . . . . . . . . . . . . . . . . . . . . . . . . . . . . . . . . . . . . . . . . . . . . . . . . . . . . . . . . . . . . . . . . . . . . . . . . . . . . . . . 256
8.4 RESULTS .............................................................................................................. 257
8 .4 . 1 Light environment . . . . . . . . . . . . . . . . . . . . . . . . . . . . . . . . . . . . . . . . . . . . . . . . . . . . . . . . . . . . . . . . . . . . . . . . . . . . . . . . . . . . . . . . . . . 257
8.4.2 Tissue turnover . . . . . . . . . . . . . . . . . . . . . . . . . . . . . . . . . . . . . . . . . . . . . . . . . . . . . . . . . . . . . . . . . . . . . . . . . . . . . . . . . . . . . . . . . . . . . . . . 257
8.4.2. 1 Spring measurements . . . . . . . . . . . . . . . . . . . . . . . . . . . . . . . . . . . . . . . . . . . . . . . . . . . . . . . . . . . . . . . . . . . . . . . . . . . . . . . . 257
8 .4 .2 . 1 . 1 Net leaf expansion and net leaf production of grasses . . . . . . . . . . . . . . . . . . . . . . . . 257
8 .4.2. 1 .2 Net production of grasses . . . . . . . . . . . . . . . . . . . . . . . . . . . . . . . . . . . . . . . . . . . . . . . . . . . . . . . . . . . . . . . . . . . . 260
8 .4.2. 1 .3 Net dry weight per growing point, and net dry weight per m2 of white clover . . . . . . . . . . . . . . . . . . . . . . . . . . . . . . . . . . . . . . . . . . . . . . . . . . . . . . . . . . . . . 262

249
8 .4.2.2 Autumn measurements . . . . . . . . . . . . . . . . . . . . . . . . . . . . . . . . . . . . . . . . . . . . . . . . . . . . . . . . . . . . . . . . . . . . . . . . . . . . . . 264
8 .4.2.2. 1 Net leaf expansion and net leaf production of grasses . . . . . . . . . . . . . . . . . . . . . . . . 264
8 .4.2.2.2 Net production of grasses . . . . . . . . . . . . . . . . . . . . . . . . . . . . . . . . . . . . . . . . . . . . . . . . . . . . . . . . . . . . . . . . . . . . 266
8 .4.2.2.3 Net dry weight per growing point and net dry weightfm2 of white clover. . . . . . . . . . . . . . . . . . . . . . . . . . . . . . . . . . . . . . . . . . . . . . . . . . . . . . . . . . . . . 268
8.5 DISCUSSION ............... . . . ..................................................................................... 270
8.5 . 1 Effect of shade on tissue turnover . . . . . . . . . . . . . . . . . . . . . . . . . . . . . . . . . . . . . . . . . . . . . . . . . . . . . . . . . . . . . . . . . . . 270
8 .5 .2 Tissue turnover and production of grasses under tree shade . . . . . . . . . . . . . . . . . . . . . . . . . . . 27 1
8 .5 .3 Tissue turnover and production of white clover under tree shade . . . . . . . . . . . . . . . . . . . 272
8.6 CONCLUSIONS .................................................................................................. 273
8.7 REFEREN CES ..................................................................................................... 274

250
8.1 Summary
There are a large number of published research results on tissue turnover of temperate
pastures species, but information on tissue turnover of pastures under tree shade is
scanty. Previous studies of pasture production under tree shade show that cocks foot,
either with white clover or lotus, had higher biomass production than perennial ryegrass
and Yorkshire fog throughout the seasons (Chapter 7).
A study was conducted on tissue turnover of pasture species under 1 1 year old alder
trees during late spring and the early autumn at the Horticultural Research Institute' s
field station at Aokautere, near Palmerston North. A split-plot design with four
replicate blocks was employed. The main plot treatments were three levels of shade
created by pruning trees 2.5m, S.Om and 7.0m from ground level, and the sub-plot
treatments were pasture species in combination. Perennial ryegrass, Yorkshire fog, and
cocksfoot were each combined with white clover, and cocksfoot was also combined
with lotus (see Chapter 7 : sections 7 .3 . 1 , 7 .3 .2 for detail). Leaf elongation and
senescence were measured three times in both experiments ; late spring/early summer
(November-December 1 997), and early autumn (March 1998) using the techniques of
Birchrnan and Hodgson ( 1983) for grasses, and with some modifications (Williams et
al. 1 964) for white clover. Estimates of leaf weight per unit length (Hernandez-Garay
et al. 1 997a) together with the tiller population data (tillers/m2), recorded routinely once
each month by counting in two randomly chosen a lOxlO cm quadrats in each plot,
were used to calculate net leaf expansion (mm1tiller/day), and weight change per tiller
(mg/tiller/day), as well as weight change per unit of ground area (g/m2/day). Leaf area,
stolon and petiole length and dry weight of white clover were also measured to calculate
net expansion per growing point and weight change per growing point, and per unit
area.
The effect of shade on rates of net leaf expansion (mg/tiller/day) was not significant
during November-December or March, while net leaf production (g/m2/day) was only
significantly (P<O.OI ) affected by shade during late spring/early summer. Likewise,

25 1
shade had no effect on net dry weight accumulation per growing point of white clover,
but the effect was significant (P<0.05) on net dry weight per unit area during early
springllate summer. However, there was an effect of shade (P<O. l O) on the net
production during late spring/early summer, when species differences (P<O.OOl ) were
also observed between the treatments. Cocksfoot combined either with white clover or
lotus had the highest leaf expansion per tiller, with the order being cocksfoot
> Yorkshire fog > perennial ryegrass . Yorkshire fog had about 76% of the leaf
expansion of the cocksfoot whereas perennial ryegrass had only about 70%.
Highest leaf production (glm2/day) was under light shade followed by medium and
heavy shade. Under heavy shade, leaf production was highest for cocksfoot compared
with Yorkshire fog or perennial ryegrass, where both perennial ryegrass and Yorkshire
fog had similar production, which was about 62% of that of cocksfoot. Net
accumulation of white clover was always higher when with perennial ryegrass in a
mixture, and lowest with cocksfoot. This showed that white clover was particularly
sensitive to the shade of the companion grass regardless of tree shade probably due to
the higher level of competition by cocksfoot than with perennial rye grass for light and
moisture.
There was a seasonal difference in rates of net leaf expansion per tiller and net
production per unit area. They were lower during autumn than in the late spring/early
summer. Yorkshire fog and perennial ryegrass tissue dynamics were probably more
affected by low soil moisture over summer and autumn than cocks foot. Cocksfoot could
also have a relative advantage of higher SLA and tiller numbers and thus higher tissue
turnover, especially under heavy shade than perennial ryegrass.

252
8.2 Introduction
Leaves, tillers and other plant parts of swards are continuously emerging, growing and
dying at different rates depending on environmental conditions and stage of
development (Davies 198 1 ; Hernandez-Garay et al. 1 997a). In a given period the net
change in the weight of living shoot material of a species is the result of the difference
between the gross increase in weight brought about by the formation of new tissue and
the gross decrease caused either by senescence and decomposition of older tissue, or by
herbage intake (Birchman and Hodgson 1983; Carrere et al. 1 997) . The processes of
growth and senescence are continuous in swards and they respond in different ways to
variation in sward management (Hodgson 198 1 ).
The rate of production of new tissue by individual tillers may be computed either in
terms of the rate of increase of the weight of leaf laminae only, or of total above-ground
parts (Davies 198 1 ). Likewise, estimates of white clover growth and senescence can be
based on measurement of length or area increments of petioles, stolons and laminae
(Birchman and Hodgson 1983; Carrere et al. 1 997) .
To study the mechanisms affecting the abundance, and productivity of species, detailed
swards measurements are required to estimate the growth, senescence and intake fluxes
for each of the species (Carrere et al. 1997). Tiller dynamics under a range of sward
managements have been determined. These include herbage production under different
grazing managements, covering seasonal variation in tissue flows and tiller and growing
point densities (Brereton et al. 1 985; Grant et al. 1988 ; Xia et al. 1990; Hepp et al.
1 996; Hernandez-Garay et al. 1997a; 1997b). These studies were all primarily
concentrated on perennial ryegrass and white clover swards, but there have been studies
on other pasture species (Xia et al. 1994). However, there is little or no information
available on tiller or tissue dynamics of perennial ryegrass and white clover in silvo
pastoral system where pastoral plants are grown under tree shade. Moreover,
information on the tissue dynamics of temperate species other than perennial ryegrass is
also rare. The objective of this research was to determine tissue turnover of pasture
species relevant to temperate silvo-pastoral systems based on deciduous trees .

253
Accordingly, perennial ryegrass, cocksfoot, Yorkshire fog, and white clover were
monitored from late spring to early autumn.
8.3 Materials and methods
8.3.1 Site description
The experiment was conducted on a moist, lowland site at the Horticultural Research
Institute' s (HortResearch) field station at Aokautere, near Palmerston North and
involved the same site and pasture species were used as used in Chapter 7. Details of
the site have been described in Chapter 7, methodology (Section 7 .3 . 1 ) .
8.3.2 Experimental treatments and designs
The first measurement (Spring) was conducted from 28 November 1 997 to 1 6
December 1 997, and the second (Autumn) from 1 March 1 998 to 2 2 March 1 998. The
field site was at the Horticultural Research Centre, Aokautere, near Palmerston North
under 1 1 year old alder trees. Plots in the field were arranged in a split-plot design with
four replicate blocks. The main plot treatments were three levels of shade created by
pruning trees up to 2.5 m, 5.0 m and 7.0 m from the ground, which resulted in three
different levels of transmitted PAR, hereafter called heavy, medium, and light shade,
respectively (Chapter 7: section 7 .3 . 1 , 7.3 .2). PAR was measured monthly on clear sky
days between 1 200 to 1300h using a LI-COR Model LI- 1 85 Quantum Sensor. R:FR
ratio of the light was also measured monthly with a Skye sensor at just above the swards
under the trees.
The subplots were four mixed species swards: perennial ryegrass (Grasslands Nui),
Yorkshire fog (Massey Basyn), and cocksfoot (Grasslands Wana), which were each
combined with white clover (Grasslands Tahora), and cocks foot was also combined
with lotus (Grasslands Maku) (Table 8 .2). Details of the experimental treatments and
design have been described in Chapter 7, methodology (Section 7.3 .2).

Table 8 . 1 Pasture species and cultivars used in the Experiment.
Pasture species
1 . White clover (Trifolium repens L.) cv. Grasslands Tahora 2. Lotus (Lotus uliginosus) cv. Grasslands Maku 3 . Cocksfoot (Dactylis glomerata L.) cv. Grasslands Wana 4. Yorkshire fog (Holcus lanatus L.) cv. Massey Basyn 5 . Perennial rye grass (Lolium perenne L.) cv. Grasslands Nui
8.3.3 Tissue turnover
Seed rate (kglha)
3.0 5 .0 6.0 2.0
1 2.0
254
Leaf elongation and senescence were measured three times in both experiments;
NovemberlDecember ( 1997), and March ( 1 998) using the techniques of Birchman and
Hodgson ( 1 983) for grasses, and with the modification of Williams et al. ( 1 964) for
white clover. At the beginning of each cycle, one 2-m long transect per plot was
randomly placed on the plot after leaving one metre from each end. Four individual
rooted grass tillers and four white clover stolons were selected at random at 20-cm
intervals in each transect, but in alternate fashion of grass and white clover. The
selected tillers and stolons were identified by tagging with short lengths of coloured
split plastic tubing (2-5 mm diameter and 3-5 mm long) on day one (Hernandez-Garay
et al. 1 997a). The marked tillers and stolons were not changed until the measurements
were completed.
Tissue turnover estimates were fitted within the re-growth period of pasture species
since the measurements were started after a week of mowing. Since the total
measurement period did not exceed 23 days, the turnover estimates period was well
within the active re-growth of pasture species after mowing, and covered the period
from one mowing to the next. Mowing was conducted only once per month.
Data on tiller density and density of white clover growing points from Chapter 7 were
used in the tissue turnover study to calculate weight change per unit of ground area
(glm2/day). This was done to avoid repetition of measurements since counting tillers
and white clover growing points was a continuous part of the experiments, as described
in Chapter 7 .

255
8.3.3.1 Tissue turnover in grasses
For all grass tillers, the length of the lamina was recorded to a precision of 1 mm for
each leaf of each tiller on three occasions over 1 9 days (days 1 , 9 and 1 8) in spring
measurements, and over 23 days (days 1 , 1 3 and 22) in autumn measurements. The leaf
lengths were measured as the distance from the point of insertion (ligule) to the tip of
the leaf or, in senescent leaves, to the base of the chlorotic tissue. The lengths of all
laminae, and the length of the pseudostem of vegetative tillers were measured. There
were no reproductive tillers during both measurements. Leaf elongation of young leaves
(mmltiller/day) was calculated from the length data. Senescence was also determined
similarly for mature leaves, and net elongation was calculated as elongation minus
senescence. At the end of the measurement period 10 tillers per replicate were randomly
harvested and the relationship between leaf length (mm) and leaf weight (mg) was
determined. Estimates of leaf weight per unit length were then used (Hernandez
Garay et al. 1997) together with the tiller population data (tillers/m2) , recorded each
month by counting them in two random IOxlO cm quadrats in each plot, to calculate net
leaf expansion per tiller (mrnltiller/day) and weight change per tiller (mg/tiller/day), as
well as weight change per unit of ground area (g/m2/day) . Tiller population data used
were as described in Table 7 .9a: 24 November 1 997, and Table 7 .9b: 20 March, 1 998.
Note that tiller population data in these tables are mean values of all replications, but
while calculating weight change per unit of ground area (g/m2/day), tiller population of
the respective plot was used for more accuracy.
Net accumulation was calculated as:
Gross tissue growth (G) = Il. in leaf weight
Senescence (S) = loss in leaf weight
Net accumulation (NA) = (G-S) +Il. in pseudostem weight

256
8.3.3.2 Tissue turnover in white clover
Petiole elongation and leaf expansion were estimated from measurements from four
stolons per plot on the same three occasions as the grasses. Elongation measurements
of white clover petiole were made from the stipule to the tip or the lower edge of the
senescent region (Hemandez-Garay et al. 1 997a). Stolon length was measured up to the
tip of the growing point. Likewise, leaf lamina expansion was determined according to
visual assessment of leaf area in cm2 using standard scores (Williams et al. 1 964). To
estimate the relationship between leaf area expansion, stem length and petiole length to
their mass, 10 stolons were randomly collected at the end of the measurements and
separated into leaf, stolon and petiole. Leaf area, stolon and petiole lengths were
measured. The components were separately oven dried for 24 hours at 70°C, and dry
weight was taken to calculate net (net stolon + net petiole + net leaf) expansion per
growing point (mm/growing point per day for stolon and petiole, and cm2/growing
point/day for leaf area) and weight change per growing point (mg/growing point/day),
and per unit area (g/m2/day) . Density of white clover growing points data was used as
described in Table 7 . lOa: 24 November 1997, and Table 7. lOb: 20 March, 1998 to
calculate weight change per unit area. Note that density of white clover growing points
data in these tables are mean values of all replications, but while calculating weight
change per unit of ground area (g/m2/day), density of white clover growing points of the
respective plot was used for more accuracy.
8.3.4 Statistical analysis
The statistical significance for all the analyses was determined by analysis of variance
using PROC GLM procedure (SAS 1997) . Residuals were examined for their normality.
No transformation of data was necessary. The significance level was set at a.=0.05.

257
8.4 Results
8.4.1 Light environment
Measurements of PAR on 22 November 1 997 showed that the mean Ilmoles photons m-
2 S- l under heavy, medium, and light shade were 420, 774, 1 79 1 respectively. PAR
measured in the open area was 1 998 Ilmoles photons m-2 S-l . On the 9th March 1997,
PAR levels under heavy, medium and light shade were 208 , 405, and 1 352 Ilmoles
photons m-2 S-1 , respectively, compared with 1 589 Ilmoles photons m-2 S-l in the open
(Chapter 7, Table 7.3b). Similarly, the R:FR ratio on 22 November 1 997 was 0.7, 0.9
and 1 .5 under heavy, medium and light shade, respectively. R:FR ratio in the open was
also 1 .5 (Chapter 7, Table 7 .3c).
8.4.2 Tissue turnover
8.4.2.1 Spring measurements
8.4.2.1.1 Net leaf expansion and net leaf production of grasses
The effect of shade on the rates of net leaf expansion per tiller during late spring/early
summer (November-December) was not significant whereas shade had a significant
effect (P<O.O l ) on net leaf production (g/m2/day) (Table 8 .2). However, species
differences were significant (P<O.OOOl) for per tiller expansion (mg/tiller/day) as well
as for net leaf production (glm2/day) during the same period (Table 8.2).
Cocks foot either with white clover or lotus had the highest leaf expansion per tiller
compared with perennial ryegrass and Yorkshire fog with white clover during 28
November to 16 December, 1 997. Accordingly, relative to the leaf expansion rate of
cocksfoot, Yorkshire fog was about 80% and perennial ryegrass 70%. This trend was
repeated during 28 November to 1 6 December as well, where Yorkshire fog had about
76% of the leaf expansion of cocksfoot and perennial ryegrass about 70% (Table 8 .2).

258
Leaf production (g/m2/day) was highest under the light shade followed by medium and
heavy shade in both periods of measurements during NovemberlDecember. Cocksfoot,
either with white clover or lotus , and also the Yorkshire fog with white clover had the
highest production under light shade during 28 November- 16 December. Perennial
ryegrass had only 55% of the leaf production of cocksfoot with white clover under the
light shade. A similar trend was repeated under the medium shade where perennial
ryegrass had about 73% of the leaf production of cocksfoot and Yorkshire fog (Table
8.2).
From November 28 to December 16 production of perennial ryegrass was down to
about 50% relative to the leaf production of cocks foot in the cocksfootlwhite clover
mixture under the medium shade. Under the heavy shade, leaf production was higher
for cocksfoot than for Yorkshire fog or perennial ryegrass, with both perennial ryegrass
and Yorkshire fog producing about 62% of that of cocksfoot (Table 8 .2) .

--------------------------------------------� �--. �
Table 8 .2 Rates of net leaf expansion per tiller (mg/tiller/day) and net leaf production (g/m2/day) of the grass components of ryegrass-white clover (RW),
Yorkshire fog-white clover (YW), cocksfoot-white clover (CW) and cocksfoot-Iotus (CL) swards under different levels of shade at Aokautere, 1 997.
-.-----.-... �---.-....... ----------.... ---.. ------�-� --........ _----
Treatments r Significance Net leaf expansion/ production
Heavy shade Medium shade Light shade shade
RW YW CW CL RW YW CW CL RW YW CW CL Nov. 28-Dec.61 97
Per tiller (mg) 1 .02 1 . 1 8 1 .29 1 .52 1 . 1 6 1 .54 1 .66 1 .47 1 . 1 3 1 .42 1 .80 1 .50 NS SEM 0.08 Per m2 (g) 1 .8 8 2.38 2.96 3.39 2. 1 9 4 .63 4.62 3.40 3.03 5.52 5 .59 4.50 P<O.O I SEM 0.29 Nov.28-Dec.16197
Per tiller (mg) 0.99 0.87 1 .23 1 .24 1 .05 1 .20 1 .59 1 .3 1 0.95 1 . 1 4 1 .68 1 .52 NS SEM 0.07 Per m2 (g) 1 .73 1 .73 2. 8 1 2.79 2. 1 3 3.60 4.4 1 2.99 2.52 4.40 5. 29 4 .46 P<O.O l SEM 0.27
NS no significant differences at P=O.05
I RW = Ryegrass + white clover; YW = Yorkshire fog + white clover; CW = cocks foot + white clover, and CL = cocksfoot + lotus 2 Interactions tests for treatment responses with differences in shade, SEM = standard error of the means
species
P<O.O I 0.07 P<O.OOO I 0.25
P<O.OOO I 0.07 P<O.OOO l 0.20
interactions 2
NS 0. 1 2 P<O. l O 0.43
NS 0. 1 2 P<O. l O 0.35
N Ul \0

260
8.4.2.1.2 Net production of grasses
There was a significant effect of shade (P<O. l O) for November 28 to December 6 and
for November 28 to December 1 6 (P<O.05) on the net production (leaves plus sterns)
per tiller. Species differences (P<O.OOl ) were also observed between the treatments in
both periods. An interactive effect of shade and species for net production per tiller was
also observed (Table 8.3) . Effects of shade were also significant for the net production
per unit area (g1m2/day) for both periods and differences in the species were also
significant (P<O.Ol ).
There was a similar performance of species in terms of net production per tiller
(mg/tiller/day) under different shade levels in both periods, but the effect of shade was
more obvious during November 28 to December 1 6, 1997. Accordingly, the highest net
production was under light shade by cocksfoot in the cocksfootlwhite clover mixture
followed by cocksfoot in the cocksfootllotus mixture. Net production per tiller of
perennial ryegrass was lower than cocksfoot under light shade, but was similar under
medium and heavy shade. Perennial ryegrass net production per tiller under heavy
shade was about 78% of that of cocksfoot under heavy shade compared with only about
66% in the case of Yorkshire fog (Table 8 .3) .
In terms of net production per unit area (glm2/day), the species were similar under shade
for both periods. Cocksfoot and Yorkshire fog had higher production per unit area
compared with perennial ryegrass, except for Yorkshire fog under heavy shade (Table
8 .3) . Under heavy shade, production of Yorkshire fog was lower than perennial ryegrass
during 28 November- 16 December, and was only about 66% of that of cocksfoot in the
mixture with white clover or lotus under heavy shade. Cocksfoot always had the
highest net production per unit area (g1m2/day) even under the heavy shade (Table 8 .3 ) .
Net production per m2 of cocks foot mixed with white clover, was higher than for
cocksfoot with lotus under all shade levels, except under heavy shade during 28
November to 6 December, 1 997 (Table 8 .3 ) .

Table 8 .3 Rates of net production (stem+leaf) per tiller (rug/tiller/day) and per m2 ( g/ m2/day) of the grass components o f ryegrass-white clover (RW), Yorkshire
fog-white clover (YW), cocksfoot-white clover (CW), and cocksfoot-Iotus (CL) swards under different levels of shade at Aokaulere, 1 997.
Treatments 1
Net production Heavy shade Medium shade Light shade
RW YW CW CL RW YW CW CL RW YW CW CL
Nov. 28-Dec.62 97
Per tiller (mg) 1 . 1 9 1 . 3 0 1 .5 5 1 .82 1 . 34 1 .80 1 .97 1.68 1 .4 1 1 . 69 2. 1 7 1 .79 SEM Per m2 (g) 2.20 2.63 3 .56 4 .09 2.52 5 .4 1 5 .46 4 . 1 1 3 .83 6.56 6.76 5 .34 SEM Nov. 28-Dec.16297
Per tiller (mg) I . l 9 0.99 1 .5 1 1 .5 1 1 .35 1 .3 8 1 . 94 1 .74 1 .28 1 .57 2. 1 5 1 .92 SEM Per m2 (g) 2. 1 0 1 .96 3 .46 3 . 3 8 2.55 4 .54 5 . 36 3 .97 3 .4 1 6. 1 1 6.77 5 .70 SEM
NS no significant differences at P=0.05
I RW = Ryegrass + white clover; YW = Yorkshire fog + white clover; CW = cocks foot + white clover, and CL = cocksfoot + lotus 2 Interactions tests for treatment responses with differences in shade, SEM = standard error of the means
shade
P<0. 1 0 0. 1 0
P<O.Ol 0.32
P<0.05 0.09
P<O.O I 0.3 1
Significance
species inter-actions 2
P<O.O l NS 0.08 0. 1 5
P<O.OOOl P<O. l O 0.3 1 0.54
P<O.OOOl NS 0.07 0. 1 3
P<O.OOOI P<0. 1 0 0.25 0.44

8.4.2.1.3 Net dry weight per growing point, and net dry weight per m2 of white
clover
262
Shade had no effect on the rate of net dry weight accumulation per growing point
(mg/growing point/day) of white clover during 28 November-6 December. Also, there
was no difference in the rate of net accumulation of white clover in mixture with the
three grasses, and there was no interaction between shade and species (Table 8 .4).
However, shade had a significant effect (P<0.05) on the net dry weight per growing
point of white clover during 28 November- 1 6 December. There were also differences
between white clover in the mixtures (P<0.05) and a weak (P<O. l O) interactive effect of
shade and species (Table 8 .4).
In terms of rate of net dry weight accumulation per growing point during 28 November-
1 6 December, white clover mixed with perennial rye grass had the highest production
followed by white clover with Yorkshire fog. White clover with cocksfoot had the
lowest production, and was 75% of that of white clover in the mixture with perennial
ryegrass (Table 8 .4). Net dry weight per growing point of white clover was highest
under light shade and lowest under heavy shade. Under heavy shade net dry weight per
growing point of white clover was about 70% of that of light shade, but not significantly
different (Table 8 .4).
In terms of net dry weight production per unit area (g/m2/day), there was a similar
performance of white clover in mixture with grass species for both periods, with highest
production of white clover with perennial ryegrass , followed by with Yorkshire fog and
then with cocksfoot (Table 8.4). White clover production per unit area with cocksfoot
was only about 60% of that of white clover with perennial ryegrass. Similarly, in both
periods, highest production per unit area (g/m2/day) was under light shade, while under
heavy shade production was only 50% of that under light shade (Table 8 .4).

Table 8.4 Rates of net dry weight accumulation (net stoion+net petiole+net leaf) per growing point (mg/growing point/day) , and per unit area ( g/ m2/day) of the
white clover component of ryegrass-white clover (RW) , Yorkshire fog-white clover (YW), and cocksfoot-white clover (CW) swards under different levels of shade at
Aokautere, 1 997.
Treatments I Significance
Net production Heavy shade Medium shade Light shade shade species interactions 2
Nov. 28-Dec.6, 97
Per growing point (mg) SEM Per m2 (g) SEM Nov. 28·Dec.16,97
Per growing point (mg) SEM Per m2 (g) SEM
RW
1 .99
0.69
1 .93
0.67
NS no significant differences at P=0.05
YW CW RW
1 .65 1 .62 2. l l
0.43 0.45 1 .2 1
1 .3 1 1 .08 2.63
0.33 0.27 1 .4 1
YW CW RW YW CW
1 . 80 1 .56 2.07 2.30 1 .96
0.74 0.52 1 . 1 7 0.98 0.83
1 .99 1 .70 1 .99 2.44 2. 1 1
0.70 0.57 1 . 1 3 1 .04 0.90
1 RW = Ryegrass + white clover; YW = Yorkshire fog + white clover; CW = cocksfoot + white clover, and CL = cocksfoot + lotus 2 Interactions tests for treatment responses with differences in shade, SEM = standard error of the means
NS NS NS 0. 1 6 0.20 0.36
P<O. l O P<O. l O NS 0. 1 2 0. 1 2 0.20
P<0.05 P<0.05 P<O. l O 0. 1 8 0. 1 3 0.23
P<0.05 P<O.O l N S 0. 1 1 0.09 0. 1 5

264
8.4.2.2 Autumn measurements
8.4.2.2.1 Net leaf expansion and net leaf production of grasses
There was no effect of shade on net leaf expansion per tiller (mg/tiller/day) or net leaf
production per unit area (g/m2/day) during early autumn (March 1998), while species
differences were significant for all the periods of measurement (P<O.Ol ) . There was no
interactive effect of shade and species (Table 8.5).
Net leaf expansion per tiller (mg/tiller/day) of the grasses was higher for early ( 1 - 1 3),
than mid March (1 3-22). Cocksfoot always had a higher leaf expansion rate than
Yorkshire fog and perennial ryegrass . In terms of leaf expansion, Yorkshire fog was
most affected followed by perennial ryegrass. Yorkshire fog had only about 3 1 % of the
net leaf expansion of that of cocksfoot during March 1 3-22, compared with 52% by
perennial ryegrass (Table 8 .5) .
Similarly to net leaf expansion, net leaf production per unit area (g/m2/day) was higher
during early ( 1 - 1 3) than mid-March ( 13-22). Leaf production per unit area was highest
for cocks foot compared with the other grasses, while cocks foot from the cocksfootllotus
mixture had the highest production in each period. During early March ( 1 - 1 3) , perennial
ryegrass leaf production per unit area was lowest with Yorkshire fog intermediate, but
leaf production of Yorkshire fog decreased and was the lowest in mid-March. Overall
March ( 1 -22), leaf production of Yorkshire fog was about 20% of that of cocks foot in
the cocksfootllotus mixture, and 25% of that of perennial ryegrass (Table 8 .5).

Table 8 .5 Rates of net leaf expansion per tiller (mg/tiller/day) and net leaf production (g/m2/day) of the grass components of ryegrass-white clover (RW),
Yorkshire fog-white clover (YW), cocksfoot-white clover (CW), and cocksfoot-lotus (CL) swards under different levels of shade at Aokautere, 1 998.
Treatments 1 Significance Net leaf expansion / production
Heavy shade Medium shade Light shade shade species interactions 2
RW YW CW CL RW YW CW CL RW YW CW CL Marchl-13: 98
Per tiller (mg) 0.52 0.40 0.80 1 . 37 0.49 0.34 0.96 1 . 36 0.3 1 0.22 1 .28 1 .32 NS P<O.OOOI NS SEM 0.07 0. 1 0 0. 1 8 Per m2 (g) 0.85 1 .22 2.58 4 . 2 1 1 .08 1 . 14 3 .24 4.84 0.88 0.88 4.45 4.6 1 NS P<O.OOO I NS SEM 0.30 0.34 0.59 March 13-22: 98 Per tiller (mg) 0.3 1 0.27 0.46 0.66 0.2 1 0. 1 0 0.59 0.64 0.36 0. 1 4 0.47 0.74 NS P<O.OOO I NS SEM 0.07 0.06 0. 1 1 Per m2 (g) 0.53 0.82 1 .48 2.02 0.43 0.30 2.07 2.30 1 .03 0.54 1 .62 2.61 NS P<O.OOOI NS SEM 0.24 0.21 0.37 March 1-22: 98
Per tiller (mg) 0.45 0.25 0.68 1 .06 0.38 0. 1 8 0.63 1 .09 0.35 0. 1 6 0.92 1 .09 NS P<O.OOO I NS SEM 0.06 0.08 0. 1 4 Per m2 (g) 0.75 0.79 2. 1 8 3 .26 0.82 0.6 1 2 . 1 5 3 .88 1 .03 0.60 3. 1 4 3.80 NS P<O.OOO I NS SEM 0.24 0.25 0.44
NS no significant differences at P=0.05
1 RW = Ryegrass + white clover; YW = Yorkshire fog + white clover; CW = cocksfoot + white clover, and CL = cocksfoot + lotus, 2 Interactions tests for treatment responses with differences in shade, SEM = standard error of the means

8.4.2.2.2 Net production of grasses
266
Net production per tiller (mg/tiller/day) and per unit area (g/m2/day) of the grass
components of the swards was unaffected by shade in March (Table 8 .6). However, the
net production of the grass species was significantly different (P<O.OOl , Table 8 .6).
There was no interaction between shade and grass species.
Highest net production per tiller was by cocks foot in the cocksfootllotus mixture
followed by cocksfoot in the cocksfootlwhite clover mixture, while Yorkshire fog
produced the least. For example, net production per tiller under light shade during
March ( 1 -22) for Yorkshire fog was about 20% of that of cocksfoot mixed with lotus,
followed by perennial ryegrass which produced 37% of that of cocksfoot mixed with
cocksfoot (Table 8.6).
Similarly, the highest net production per unit area was also by cocksfoot in the
cocksfootllotus mixture followed by cocks foot in the cocksfootlwhite clover mixture
(Table 8.6). Net production per unit area of perennial ryegrass and Yorkshire fog was
usually about 20% of that of cocksfoot, while production of perennial ryegrass was
slightly higher than Yorkshire fog, especially during 1 -22 March (Table 8 .6).

Table 8.6 Rates of net production (stem+leaf) per til ler ( mg/tiller/day) and per m2 ( g/ m2/day) of the grass components of ryegrass-white clover (RW), Yorkshire fog
white clover (YW), cocksfoot-white clover (CW), and cocksfoot-lotus (CL) swards under different levels of shade at Aokautcre, 1 998.
Treatments 1 Significance
Net production Heavy shade Medium shade Light shade shade species
RW YW CW CL RW YW CW CL RW YW CW CL March 1.131 98
Per tiller (mg) 0.6 1 0.45 0.92 1 .64 0.57 0.35 1.23 1 .56 0.4 0.27 1 .46 1 .7 1 NS P<O.OOO I SEM 0.09 0. 1 2 Per m2 (g) 0.97 1 . 37 2.96 5 . 02 1 .24 1 . 1 8 4. 1 4 5 .53 l.l5 1 . 1 0 5 .05 5 .95 NS P<O.OOO I SEM 0.36 0.39 March 13.221 98
Per tiller (m g) 0.43 0.38 0.64 0.8 1 0.32 0. 1 9 0.86 1 .03 0.49 0.24 0.90 1 .05 NS P<O.OOO I SEM O. l l 0.07 Per m2 (g) 0.72 1 . 1 7 2.06 2.49 0.66 0.62 2.89 3 .70 1 .39 0.93 3 . 1 8 3 .68 NS P<O.OOO I SEM 0.40 0.27 March 1.221 98 Per tiller (mg) 0.56 0.3 1 0.82 1 .27 0.47 0.23 0.89 1 . 37 0.47 0.24 1 .2 1 1 .43 NS P<O.OOO I SEM 0.08 0.09 Per m2 (g) 0.90 0.99 2.64 3 .88 1 .02 0.77 3 .02 4 .88 1 . 35 0.94 4 . 1 5 4.97 NS P<O.OOO I SEM 0.33 0.30
NS no significant differences at P=0.05
1 RW = Ryegrass + white clover; YW = Yorkshire fog + white clover; CW = cocksfoot + white clover, and CL = cocksfoot + lotus 2 Interactions tests for treatment responses with differences in shade, SEM ::::: standard error of the means
interac-tions 2
NS 0.20 NS
0.67
NS 0. 1 3 NS
0.47
NS 0. 1 6 NS
0.5 1
N 0\ --l

268
8.4.2.2.3 Net dry weight per growing point and net dry weightlm2 of white clover
There was a marginally significant effect of shade on net dry weight per growing point
(mg/growing point/day) of white clover for early March ( 1 - 1 3, P<O. l ), and also during
March ( 1 -22, P<O. l ), but not for mid-March ( 13-22). On the other hand, white clover
was significantly different in the three grass species for those two periods (P<0.05), but
not for March 13-22 (Table 8 .7). Net dry weight accumulation per unit area was
affected by shade only during March 1 - 1 3 (P<O. l ). Species differences were significant
(P<O.001 ) for all the periods. There was no interactive effect of shade and species for
all the periods for net dry weight in terms of per growing point or per unit area of land
(Table 8.7) .
For the net dry weight per growing point all the periods had similar results, with white
clover with perennial rye grass always highest followed by white clover with Yorkshire
fog. White clover with cocksfoot had the lowest dry weight per growing point. For all
periods, white clover under light shade had the highest dry weight per growing point
followed by medium shade and then heavy shade which produced about 65% of the
white clover per growing point that was produced under light shade. However, this
effect of shade on white clover growth per growing point during March was only
marginally significant (P<O. l O) except during 13-22 March where shade had no effect
(Table 8 .7).
Similarly, white clover dry weight per unit area (g/m2/day), for all the periods, was
highest for white clover with perennial ryegrass followed by with Yorkshire fog and
with cocks foot. White clover with cocks foot had only about 45-50% of the dry weight
per unit area of that of white clover with perennial ryegrass (Table 8.7). White clover
production was always highest under light shade in all the periods, followed by under
medium shade and then under heavy shade. Production under heavy shade was about
66% of that under light shade (Table 8 .7) . This was, however, statistically not
significant except for a marginal effect of shade (P<O. l O) during early March ( 1 - 13) .

Table 8 .7 Rates of net dry weight accumulation (net stolon+net petiole+net leaf) per growing point (mg/growing point/day) , and per m2 area ( gI m2/day) of the
white clover component of rye grass-white clover (RW), Yorkshire fog-white clover (YW), and cocksfoot-white clover (CW) swards under different levels of shade at
Aokautere. 1 998 .
Net production Heavy shade Medium shade Light shade shade species interactions 2
Per growing point (mg) 1 .27 1 .08 0.80 1 .44 1 .06 0.80 1 .63 1 .67 1 . 2 1 P<O. I O P<0.05 NS SEM 0.03 0.02 0.22 Per m2 (g) 1 .03 0.67 0.37 1 .0 1 0.85 0.39 1 .3 1 1 .28 0.63 P<O. J O P<O.OOO I NS SEM O. J O 0.07 0. 1 3 March 1 3-222 98 Per growing point (mg) 1 .27 1 .06 0.80 1 .3 8 1 .2 1 1 .05 1 .36 1 .3 1 1 .65 NS NS NS SEM 0. 1 3 0. 1 1 0. 1 9 Per m2 (g) 1 .03 0.7 1 0.36 1 .00 0.95 0.45 1 . 1 6 1 .02 0.96 NS P<O.OOl NS SEM 0. 1 5 0.07 0. 1 2 March 1 .22. 98 Per growing point (mg) 1 .25 1 .04 0.79 1 .45 1 .05 0.80 1 .5 1 1 .5 1 1 .32 P<O. J O P<O.Ol NS SEM O. J O 0.09 0. 1 5 Per m2 (g) 1 .02 0.67 0.36 1 .03 0 .83 0.37 1 .24 1 . 1 6 0.72 NS P<O.OOI NS
NS no significant differences at P=0.05
I RW :::: Ryegrass + white clover; YW = Yorkshire fog + white clover; CW = cocksfoot + white clover, and CL :::: cocks foot + lotus 2 Interactions tests for treatment responses with differences in shade, SEM ::::: standard error of the means
IV 0\ 10

270
8.5 Discussion
8.5.1 Effect of shade on tissue turnover
Species differences were more apparent than level of shade effects on tissue net herbage
accumulation in this study (Tables 8 .2-8.7). Effect of shade on the net leaf expansion
per tiller was not significant for both seasons, and hence significant differences in the
rates of net production per tiller and also per unit area during late spring/early summer
must be associated with the number of tillers .
Previous research also supported the finding that tiller population density (numbers/m2)
was significantly different (P<O.Ol ) across the shade levels during November and
December, 1 997 (early spring), and in March 1998 (late autumn/early summer). Tillers
per unit area under heavy shade were significantly lower than under medium and light
shade in both seasons (Chapter 7 : section 7 .4.1 .6, Tables 7 .9 a, b). Similarly, SLA was
found to be positively correlated with higher dry weight per plant of pasture species
under heavy shade (Chapters 3-6). The high SLA of cocks foot in heavy shade resulted
in a higher leaf area per unit area available for photosynthesis and therefore greater
likelihood of tiller formation. Perennial rye grass always had a smaller SLA than
cocksfoot, and under heavy shade its tiller numbers and shoot dry weight per plant
decreased relatively more than for cocksfoot (Chapters 3-6). Increased herbage
accumulation rate has been associated with a greater tiller population (Hernandez- Gary
et al. 1 993) and higher growth per tiller (Xia et al. 1990), while tillering ability of plants
is particularly dependent on carbohydrate supply (Cooper and Tainton 1968).
Tissue flow of white clover was seasonal and was more affected by shade during
autumn than late spring (Tables 8 .4, 8.7). On the other hand, the consistent significant
differences in net dry weight accumulation per growing point as well as per unit area for
white clover mixed with grass species during both late spring/early summer as well as
early autumn (Tables 8.4, 8 .7) , indicated that white clover was more affected by the
shade or some other form of competition by the companion grass than by tree shade.
For example, under heavy shade white clover production per unit area with cocksfoot
was only about 60% of that of white clover with perennial ryegrass.

27 1
Grazing management practices affect tillering, tissue flows and thereby the production
of the swards (Birchman and Hodgson 1 983; Hemandez-Garay et al. 1997a, b).
Similarly, changes in the light spectra reaching the understorey sward are a critical
aspect of tree canopy management that affects the tissue flows in the swards in silvo
pastoral system. Shelton et al. ( 1987) reported that shading is one of the major factors
that determines the productive performance of understorey pastures. Decreased
irradiance reduces the growth of pasture species and can affect morphological attributes
of pasture species that may impact on productive performance (Kephart and Buxton
1993).
8.5.2 Tissue turnover and production of grasses under tree shade
The tissue turnover of the three grass species differed, and was also affected by season.
Rates of net leaf expansion and net production per tiller for all the grass species were
reduced more during autumn than in the late spring/early summer. Perennial ryegrass
and Yorkshire fog were the most affected in terms of net leaf expansion per tiller as well
as production per unit area during early autumn and late spring/early summer. Net leaf
expansion per tiller and net production per unit area of Yorkshire fog were especially
affected during early autumn (Tables 8.5 and 8.6). During autumn, net leaf expansion
per tiller and net production per unit area for perennial rye grass were also decreased,
especially under light shade. However, this effect later disappeared during the period of
1 -22 March for perennial ryegrass, but not for Yorkshire fog (Tables 8 .5 and 8 .6).
An increase in both tiller population density and leaf growth per tiller enhance pasture
production of perennial rye grass-white clover pasture under spring grazing management
and conventional farm practice in New Zealand (Hernandez-Garay et al. 1 997a). In
general, under a conventional management system, growth rate of herbage is greater on
relatively tall than short swards of perennial ryegrass, while senescence rates are similar
(Hepp et al. 1 996). In Experiment 7 . 1 (Chapter 7), total above ground herbage
accumulation per unit area during the establishment period was similar for perennial
ryegrass, cocksfoot, and Yorkshire fog when soil moisture content was not limited, and
soil nutrient content was reasonable (Chapter 7: section 7 .4. 1 .4, Table 7.6).

272
The prolonged period of low soil moisture (February-April) decreased the tissue
turnover of Yorkshire fog and perennial ryegrass more than that cocksfoot. Low soil
moisture resulted in Yorkshire fog and perennial ryegrass having an increased rate of
leaf senescence. The rates of net leaf expansion and production of these species were
not affected during late spring/early summer due to the higher soil moisture during that
period. Lower rates of net leaf expansion per tiller and production per unit area for
perennial ryegrass could also have resulted due to the low level of soil fertility. Olsen P
of the experiment plots was 1 1 .4 J.lg/g with a pH of 5.5 (Chapter 7 : section 7.3 . 1 , Table
7. 1 ). Bradshaw et al. ( 1960) reported that perennial rye grass is adapted to fertile
habitats and it shows a marked growth response to increasing phosphate levels .
Therefore, the low production of perennial ryegrass could have been due to the
combined effects of shade, low fertility, and moisture stress.
Net flows of tissues of cocksfoot were consistently higher than for the other species
throughout the experiment and it was comparatively less affected by the period of low
soil moisture. Cocks foot is known to be adapted to moderate soil fertility and short
periods of drought (Moloney 1993; Woodman and Fraser 199 1 ; MacFarlane 1990;
RumbalI 1 982).
8.5.3 Tissue turnover and production of white clover under tree shade
The rate of net dry weight accumulation of white clover per growing point, as well as
per unit area, was significantly different for the grass species and white clover mixtures
for both periods of the experiment (Tables 8 .4, 8 .7). Net dry weight accumulation per
growing point, and per unit area, was always higher for white clover with perennial
ryegrass, and with Yorkshire fog in mixture than it was for white clover in a mixture
with cocksfoot (Tables 8 .4, 8 .7,8.7).
One of the reasons for the net dry weight accumulation per growing point and per unit
area of white clover being highest with perennial ryegrass and lowest with cocks foot
could be the competitive effects of the companion grass on white clover. Perennial
ryegrass had a lower tissue flow and lower tiller density than cocksfoot. Consequently,
there was less shading of the companion white clover by perennial ryegrass, or

273
Yorkshire fog, compared with cocksfoot. Accumulation of herbage reduces the amount
of light reaching the bottom layer of the sward (Thomas and Davies 1978; Orr et al.
1 988) which will affect white clover growth. Similarly, Moloney ( 1993) suggested
cocksfoot suppressed white clover growth. Dear et al. (1998) showed that the growth of
subterranean clover was mainly decreased by the companion perennial grass reducing
light, along with competition for water and nutrients.
8.6 Conclusions
Shade did not affect rates of net leaf expansion per tiller of three perennial grass species.
However, shade decreased the net leaf production per tiller and per unit area which
indicated the effect of shade on herbage accumulation was a decrease in tiller numbers.
Rates of net leaf expansion per tiller and net production per unit area were lower during
autumn than in the late spring/early summer for all the species . Perennial ryegrass net
leaf expansion per tiller and production per unit area decreased more than the other
grass species from late spring/early summer to autumn. Yorkshire fog and perennial
ryegrass tissue dynamics were probably affected more negatively by low soil moisture
over summer and autumn than was cocksfoot. Net accumulation of white clover was
always higher when with perennial ryegrass in a mixture, intermediate with Yorkshire
fog, and lowest with cocks foot. This was probably due to the higher level of
competition by cocksfoot, than perennial ryegrass and Yorkshire fog, for light and
moisture.
Cocksfoot' s tissue turnover was probably higher due to its higher SLA and higher
number of tillers per unit area than perennial ryegrass. Cocksfoot maintains a higher
SLA than perennial rye grass, and a greater number of tillers per plant that enables
cocks foot to produce more leaf area per unit area compared with perennial ryegrass.
274
8.7 References
Birchman, J. S. and Hodgson, J. 1 983. The influence of sward conditions on rates of
herbage growth and senescence in mixed swards under continuous grazing
management. Grass and Forage Science 38 :323-33 1 .
Bradshaw, A D., Chadwick, M. J . , Jowett, D . , Lodge, KW. and Snaydon, KW. 1960.
Experimental investigations into the mineral nutrition of several grass species.
Journal of Ecology 48:63 1 -637.
Brereton, A J., Carton, O. T. and O'keeffe, W. F. 1 985. Tissue turnover in perennial
ryegrass (Lolium perenne L.) during winter. Irish Journal of Agricultural
Research 24:49-62.
Carrere, P., Louault, F. and Soussana, 1. F. 1 997. Tissue turnover within grass-clover
mixed swards grazed by sheep. Methodology for calculating growth,
senescence and intake fluxes. Journal of Applied Ecology 34:333-348.
Cooper, J. P. and Tainton, N. M. 1968. Light and temperature requirements for the
growth of tropical and temperate grasses. Herbage Abstracts 38 : 1 67-223.
Davies, A 198 1 . Tissue turnover in the sward. Pp 179-208 in: Sward measurement
Handbook, Hodgson, J . , Baker, R. D., Davies, A, Laidlaw, A S. and Leaver, J.
D. eds. British Grassland Society, Hurley, Maidenhead, UK.
Dear, B. S. Cocks, P. S. Wolfe, E. C. and Collins, D. P. 1998. Established perennial
grasses reduce the growth of emerging subterranean clover seedlings through
competition for water, light and nutrients. Australian Journal of Agricultural
Research 49: 4 1 -5 1 .
Grant, S . A , Barthram, G. T., Lynne Torvell, J . K. and Elston, D. A 1988.
Comparison of herbage production under continuous stocking and intermittent
grazing. Grass and Forage Science 43 :29-39.
275
Hepp, c., Milne, J. A, TIlius, A. W. and Robertson, E. 1996. The effect of summer
management of perennial ryegrass-dominant swards on plant and animal
responses in autumn when grazed by sheep. 1 . Tissue turnover and sward
structure. Grass and Forage Science 5 1 :250-259.
Hernandez-Garay, A, Hodgson, J . and Matthew, C. 1 997a. Effect of spring grazing
management on perennial ryegrass and perennial ryegrass-white clover pasture
1 . Tissue turnover and herbage accumulation. New Zealand Journal of
Agricultural Research 40:25-35 .
Hernandez-Garay, A, Hodgson, J. and Matthew, C. 1 997b. Effect of spring grazing
management on perennial ryegrass and perennial ryegrass-white clover pasture
2 . Tiller and growing point densities and population dynamics. New Zealand
Journal of Agricultural Research 40:37-50.
Hernandez-Garay, A., Hodgson, J. and Matthew, C. 1 993. Spring grazing management
and tiller dynamics in a perennial ryegrass/white clover pasture. Proceedings of
the New Zealand Grassland Association 55: 1 33- 1 36.
Hodgson, J. 198 1 . Sward studies: Objectives and priorities. Pp 1 - 14 in: Sward
Measurement Handbook, Hodgson, J., Baker, R. D., Davies, A., Laidlaw, A. S.
and Leaver, J . D. eds. British Grassland Society, Hurley, Maidenhead, UK.
Kephart, K. D. and Buxton, D. R. 1 993. Forage quality responses of C3 and C4
perennial grasses to shade. Crop Science 33:83 1 -837.
MacFarlane, A. W. 1990. Field experience with new pasture cultivars in Canterbury.
Proceedings of the New Zealand Grassland Association 52: 1 39- 143 .
Moloney, S . C. 1993. Selection, management and use of cocks foot cultivars in North
Island pastoral farming. Proceedings of the New Zealand Grassland Association
55 : 1 19-125.

276
OIT, R. J . , Parsons, A. J., Treacher, T. T. and PennIng, P. D. 1 988 . Seasonal patterns of
grass production under cutting or continuous stocking managements. Grass and
Forage Science 43 : 199-207.
Rumball, W. 1982. 'Grasslands Wana' cocks foot (Dactylis glomerata L.). New
Zealand Journal of Experimental Agriculture 1 0: 5 1 -52.
SAS Institute Inc. 1997. SAS /STAT user's guide, Version 6 . 1 2 SAS Institute. Cary,
North Carolina, USA
Shelton, H. M., Humphreys, L. R. and B atello, C. 1987. Pastures in the plantations of
Asia and the Pasific: Performance and prospect. Tropical grasslands 2 1 : 1 59-
168 .
Thomas, H . and Davies, A . 1 978 . Effect of shading on the re growth of Lolium perenne
swards in the field. Annals of Botany 42:705-7 15 .
Williams, R. F . , Evans, L . T. and Ludwig, L . J . 1964. Estimation of leaf area for clover
and lucerne. Australian Journal of Agricultural Research 1 5 :23 1-233 .
Woodman, R .F. and Fraser, W. J . 1 99 1 . Alternative grass options for dry east coast
and down land pastoral systems. Proceedings Agronomy Society of New
Zealand 2 1 :45-53.
Xia, J. X . , Hodgson, J. and Chu, A. C. P. 1 994. Effects of severity of grazing on tissue
turnover in Matua prairie grass dairy pasture. New Zealand Journal of
Agricultural Research 37:41 -50.
Xi a, J. X., Hodgson, J., Matthew, C. and Chu, A. C. P. 1 990. Tiller population and
tis sue turnover in a perennial ryegrass pasture under hard and lax spring and
summer grazing. Proceedings of the New Zealand Grassland Association
5 1 : 1 1 9- 1 22.

277
9. General discussion and conclusions
Page
9.1 INTRODUCTION ................................................................................................ 278
9.2 EVALUATION OF EXPERIMENTAL PROCEDURES • . • • . • • . .•.•••.......•..••.• • • • • 278
9 .2. 1 PAR measurements . . . . . . . . . . . . . . . . . . . . . . . . . . . . . . . . . . . . . . . . . . . . . . . . . . . . . . . . . . . . . . . . . . . . . . . . . . . . . . . . . . . . . . . . . . 278
9.2.2 Field tests .. '" . . . . . . . . . . . . . . . . . . . . . . . . . . . . . . . . . . . . . . . . . . . . , . . , . . . . . . . . . . . . . . . . . . . . . . . . . . . . . . . . . . . . . . . . . . . . . . . . . . . . 279
9.2.3 Research needs . . . . . . . . . . . . . . . . . . . . . . . . . . . . . . . . . . . . . . . . . . . . . . . . . . . . . . . . . . . . . . . . . . . . . . . . . . . . . . . . . . . . . . . . . . . . . . . . . 280
9.3 GENERAL DISCUSSION OF RESUL TS .................... . . . . . . . . . . . . . . . .................. . . . . 280
9.3 . 1 Pasture species under range of shade . . . . . . . . . . . . . . . . . . . . . . . . . . . . . . . . . . . . . . . . . . . . . . . . . . . . . . . . . . . . . . . 285
9.3 . 1 . 1 Light intensity versus quality under shade ' " . . . . . . . . . . . . . . . . . . . . . . . . . . . . . . . . . . . . . . . . . . . . . 287
9.3 . 1 .2 Defoliation and plant growth under shade . . . . . . . . . . . . . . . . . . . . . . . . . . . . . . . . . . . . . . . . . . . . . . . . 289
9.3. 1 . 3 Morphological attributes in relation to shade tolerant pasture species . . . . . . . . . . . . . . . . . . . . . . . . . . . . . . . . . . . . . . . . . . . . . . . . . . . . . . . . . . . . . . . . . . . . . . . . . . . . . . 290
9 .3 .2 Pasture production and management under a deciduous tree-pasture system . . . . . . . . . . . . . . . . . . . . . . . . . . . . . . . . . . . . . . . . . . . . . . . . . . . . . . . . . . . . . . . . . . . . . . . . . 294
9.3.2. 1 Canopy management of trees by pruning . . . . . . . . . . . . . . . . . . . . . . . . . . . . . . . . . . . . . . . . . . . . . . . . . . 295
9.3.2.2 Shade tolerant pasture species and the options for management . . . . . . . . . . . . . . 295
9.4 CONCLUSIONS .................................................................................................. 297
9.5 REFERENCES ................................................................ . . . . . . . . . . . . . . ....................... 300

278
9.1 Introduction
Large areas of New Zealand pastoral hill country are susceptible to soil erosion (Clough
and Hicks 1 993 ; Kelliher et al. 1 995). The planting of selected trees has, therefore,
become a common land-use practice to counter the negative impact of erosion and to
diversify farm income (Pollock et al. 1994; Anonymous 1 995; Miller et al. 1996).
Understorey pasture productivity is affected principally by the tree shade, which in turn
depends upon the degree of canopy closure and characteristics of the tree canopy.
Despite important past experience in the use of trees for soil conservation (Miller et al.
1996), detailed information associated with the effects of deciduous trees on
understorey pasture production is scanty (Wall et al. 1997). There is a need to
understand the effect of a range of light intensities (particularly low levels of
transmitted light) on morphological attributes of common pasture species. Also, there is
a need to understand the management of shade levels in deciduous tree-pasture systems.
A series of glasshouse and field experiments were conducted to determine the
morphological attributes of pasture species that are associated with shade tolerance, and
to determine appropriate grazing management practice. The responses of pasture
species to a range of light intensities, to the quality of light, and to different defoliation
frequencies were determined in Chapters Three to Six. Chapters Seven and Eight
determined responses of selected pasture species under different levels of shade
imposed by tree pruning. This Chapter focuses on a general discussion of the findings
in previous Chapters and implications for the management of deciduous tree-pasture
systems.
9.2 Evaluation of experimental procedures
9.2.1 PAR measurements
A range of PAR levels was created in the glasshouse and in the field experiments. The
lowest levels of PAR were 14% (Chapter 3) to 17% of incident radiation (Experiment
4.2: section 4.4.2. 1) , while it was 24% in one experiment (Experiment 4. 1 : section

279
4.4. 1 . 1 ) , equivalent to the range 60-200 (J..Lmoles photons m-2 S-l ). This variation was
mainly due to seasonal fluctuations while conducting the experiments. For example,
some experiments were conducted during winter (Chapters 3 and 5), while others were
conducted during spring and summer (Experiments 4. 1 and 4.2), and the field
experiment (Experiment 7. 1 ) ran all year round. Similarly, variation at the lowest level
of transmitted PAR was also due to reductions in light quality (R:FR ratio) by the use of
filters (Lee et al. 1994) to simulate the natural tree canopy environment (section 5.4. 1 ) .
Obtaining actual PAR measurements i s often difficult. In all the experiments, the % of
transmitted PAR was measured using a single, but the same Licor quantum sensor. Still,
there is a question about the accuracy of measurements (Smith 1 982), especially when
in the field under natural conditions . The variable geometry of plant parts clearly makes
it impossible to specify a single photodetector arrangement (Smith 1 994). Yet, PAR is
very relevant to plant growth studies (Wilson and Ludlow 199 1 ). In practice, it appears
that a spectral error of ± 20% is not uncommon (McCree 198 1 ) .
All the experiments conducted in a glasshouse had about 20% transmitted PAR ( 1 30
J..Lmoles photons m-2 sol ) at the low PAR level (Table 9. 1 ). Similarly, the field
experiment under the alder trees that ran all year round also had an average of 1 2% of
the transmitted PAR in the heavy shade, and the mean transmitted PAR was about 1 80
J..Lmoles photons m-2 sol . Results from the glasshouse experiments at low PAR,
therefore, ought to provide comparable information to the results under the heavy shade
of the alders in the field experiment.
9.2.2 Field tests
Results showed differences between cocks foot selections in terms of tiller numbers and
cumulative shoot dry weight per plant at low PAR. Repeating of these studies under
other deciduous trees such as poplars would be beneficial to draw clear conclusions on
broad-leaved tree pasture management, but it was not possible here due to time, budget,
and technical constraints.

280
9.2.3 Research needs
Frequent defoliation markedly affected shoot dry weight and tiller numbers per plant for
perennial ryegrass, while cocksfoot was relatively less affected. This should be tested
in field experiments under tree shade in terms of grazing management studies . R :FR
ratio did not significantly affect the performance of plants. However, studies with
further low levels of R:FR ratios would be beneficial to quantify the effects of light
quality. Likewise, the feeding value of cocks foot under tree shade should be
determined. More research on the morphological and physiological adaptations of
perennial pasture species, including Poa trivia lis and browntop, under shade are
necessary.
9.3 General discussion of results
Shade markedly decreased tillering as well as shoot dry weight for all grass species but
mean tiller number per plant at low PAR was significantly higher for cocks foot than for
other species . Yorkshire fog was also tolerant of heavy shade in glasshouse conditions,
but not under tree shade. Browntop and Poa trivialis were intolerant of heavy shade, but
had higher shoot dry weight than cocksfoot and legumes in medium shade, especially
when plants were not defoliated. Perennial ryegrass was more affected than the other
pasture species under heavy shade, but was on par with cocks foot under medium shade
in terms of shoot dry weight. When defoliated at weekly or three weekly intervals,
cocksfoot produced higher shoot dry weight per plant than perennial ryegrass, mainly
due to the higher tiller numbers and leaf area per plant. Likewise, lotus produced a
higher number of branches at low PAR than the number of stolons produced by white
clover. The R:FR ratio had no effect on cumulative shoot dry weight per plant.
Likewise, the diet selection of sheep under tree shade showed no difference in
preference for alternative grasses but more sheep grazed in light than heavy shade.

28 1
Tiller number per plant, leaf area, specific leaf area (SLA), root dry weight per plant and
leaf appearance intervals were identified in this thesis as the important morphological
attributes related to shade tolerance of common pastoral plants used in New Zealand hill
country. Tables 9. 1-9.3 summarise the attributes of cocksfoot and perennial ryegrass as
determined under heavy shade at the lowest PAR reported in this thesis. General
discussions of the results obtained are presented in the following sections .

282
Table 9 . 1 Summary of properties of cocksfoot and perennial ryegrass as determined under heavy shade
or at Iow PAR in a series of experiments.
Properties
Cumulative shoot dry weight
Net leaf expansion
(1)) Tillering
Tiller number/plant
Tiller weight
(c) Leaf area
{d} Leaf do: weight
(e} S[!£cific leaf area (SLA)
ill Root do: weight
(g} Leaf al
2 8 3
Table 9.2 Tolerance index of perennial ryegrass and cocksfoot as indicated by cumulative shoot dry
weighUplant at different PAR levels.
% tolerance index % tolerance index of % tolerance index of
% transmitted PAR levels of cocksfoot for perennial ryegrass for cocksfoot to that of
different PAR different PAR levels perennial rye grass at
levels each PAR level
(a} Screening Rasture sRecies in
range of light intensitiesl grown
fullr under shade (ChaRter 3}
7 3 1 00 1 00 60
43 55 54 6 1
27 25 1 7 8 9
1 8 1 0 6 1 06
1 4 3 2 9 0
(b 1 Screening with selected PAR:
Initiallr established under full
sunlight (Chal!ter 4}
73 1 00 1 00 8 1
32 62 46 1 09
24 49 26 1 5 8
(cl Grown without defoliation
! ChaRter 5}
38, natural R : FR 1 00 1 00 68
39, reduced R:FR 96 95 69
1 6, natural R:FR 63 48 95 1 7 , reduced R:FR 54 42 87
(d} Weekly defoliated (ChaRter 6}
7 1 , natural R:FR 1 00 1 00 1 10 25, natural R:FR 26 1 3 2 1 7 24, reduced R:FR 27 I I 260
(el Field conditionsl under alder
trees (ChaRter 7)
Light shade 1 00 1 00 1 1 6 Medium shade 7 3 68 1 24 Heavy shade 5 3 44 1 38

284
Table 9 .3 Tolerance index of perennial rye grass and cocksfoot as indicated by tiller number/plant at
different PAR levels.
% tolerance index % tolerance index of % tolerance index of
of cocksfoot for perennial ryegrass for cocksfoot to that of
% transmitted PAR levels different PAR different PAR levels perennial rye grass at
levels each PAR level
(a} Screening (!asture s(!ecies in
range of light intensities 2 grown
fully under shade {Cha(!ter 3}
73 1 00 1 00 7 5
4 3 7 8 67 8 8
27 67 2 1 240
18 39 1 3 233
14 22 4 400
(b) Screening with selected PAR:
Initially established under full
sunlight {Cha(!ter 4}
73 1 00 1 00 9 0
32 85 73 1 05
24 78 5 1 24
(cl Grown without defoliation
{Cha(!ter 5}
3 8 , natural RFR 1 00 1 00 8 0
3 9 , reduced R:FR 95 1 03 7 4
1 6, natural R:FR 59 62 7 6 1 7 , reduced R:FR 37 54 5 5
(d) Weekly defoliated (Cha(!ter
� 7 1 , natural R:FR 1 00 1 00 1 2 1 25 , natural R:FR 7 3 1 8 500 24, reduced R:FR 56 15 460
(e) Field conditions2 under alder
trees (Cha(!ter 7)
Light shade 1 00 1 00 1 24 Medium shade 86 79 1 35 Heavy shade 75 58 1 59

285
9.3.1 Pasture species under range of shade
In all experiments, shade markedly affected the cumulative shoot dry weight per plant
(Figure 3 .2, Tables 4.3, 4.9, 5.2, 6.6, 7.6, 7 .8) for all pasture species. The highest
cumulative shoot dry weight was always produced at the highest level of PAR.
However, pasture species responded differently over a range of shade. In terms of shoot
dry weight per plant, some species ranked best at lowest PAR, while others ranked well
at medium levels of PAR.
Cocks foot was the best species for all shade levels including heavy shade (Chapters 3 to
7). Cumulative shoot dry weight of perennial rye grass was similar to cocksfoot at 27%
or 3 2 % PAR (section 3 .3 .2), under enclosed shade cloth and even at 17% PAR when
not defoliated (section 5 .4.2), or in 25% PAR under tree shade (Experiment 7. 1 : section
7 .4 . 1 .4). However, when plants were defoliated at weekly intervals then cumulative
shoot dry weight of perennial ryegrass was similar to the cocksfoot only at 70% PAR
(Experiment 6.2: section 6 .4.2.2).
Poa trivia lis and browntop had the lowest shoot dry weight per plant of the grass
species examined at low levels of PAR (section 3 .3 .2). However, they produced the
highest number of tillers per plant (section 5 .4.3), but not the highest shoot dry weight
per plant (section 5.4.2) when plants were not defoliated (section 5 .4) . There is a
possibility of successfully growing these species under medium or intermediate tree
shade.
The cumulative shoot dry weight and tiller number per plant of Yorkshire fog under
heavy shade were similar to cocksfoot in the glasshouse experiments (sections 3 .3.2,
3 . 3 .5 , 5 .4, 5 .4.2, and 5.4.3) , but in the field under heavy tree shade its performance was
similar to that of perennial ryegrass (Experiment 7. 1 : sections 7.4. 1 .4, 7.4. 1 .5).
Lotus was less affected than white clover under heavy shade in terms of shoot dry
weight production, and also number of branches per plant, or branches per m2 area
(sections 3 .3 .5; 5.4.3; experiment 7. l : sections 7.4. 1 .4, 7.4. 1 .7) . White clover was more
sensitive to changes in the intensity of light than lotus, as white clover could not

286
produce any stolons at 14% PAR (section 3 .3 .5). It was also more affected by the
companion grass species than lotus (Experiment 7. 1 : section 7.4. 1 .7).
Pasture species that maintained high shoot dry weight per plant, due to maintaining
higher tiller numbers per plant or a high leaf area per plant, ranked best at either the
lowest or the highest available PAR (Devkota et al. 1 997).
There were distinct differences between the cocks foot selections in terms of shoot dry
weight and tiller number per plant. Wana (tetraploid) cocksfoot had higher shoot dry
weight, leaf area, and tiller number per plant compared with the other selections of
tetraploid cocksfoot (sections 3.3 .2; Experiment 4. 1 : section 4.4. 1 .2; section 5 .4.2,
experiment 6.2: sections 6.4.2.2, 6.4.2.6; Experiment 7. 1 : sections 7.4. 1 .4, 7.4. 1 .6) .
However, the cumulative shoot dry weight per plant of PG 74 (diploid) cocksfoot was
also similar or even better than Wana cocksfoot in the glasshouse (Experiment 4. 1 :
sections 4.4. 1 .2, 4.4. 1 .3), but not under tree shade (Experiment 7. 1 : sections 4.4.2.2,
4.4.2.3). Wana also had higher SLA at low levels of PAR. This clearly suggests that
even within the tetraploid selections of cocksfoot, some are better at low levels of PAR,
and thus are tolerant of heavy shade.
Cocksfoot could have the morphogenetic capacity to increase its light capture to
increase carbon for leaf growth, as in the case of Dichanthium aristatum (Cruz 1 997). In
a field experiment Brook et al ( 1 996) found cocksfoot had 50% higher total dry weight,
and 150 % heavier stem components (basal + connective stem) than perennial ryegrass.
In mixed species stands, the competitive ability of cocksfoot root was greater than
perennial ryegrass (Remison and Snaydon 1 980). Cocksfoot can provide reliable leafy
summer growth (Rumball 1 982; Moloney 1 993), and is moderately tolerant of drought
and low fertility (MacFarlane 1 990; Woodman and Fraser 199 1 ; Fraser 1 994; Fraser
and Hewson 1994; Lolicato and Rumball 1 994). Cocks foot can be grown as an
understorey crop in New Zealand (Hocking 1 990) and is regarded as one of the most
shade tolerant grass species (Seo et al. 1 989; Pollock et al. 1997).
Tetraploid cocksfoot is found in contrasting climates of Galicia, Spain, either in the area
of highest rainfall, or summer drought (Lindner and Garcia 1 997). This wide

287
adaptability of tetraploid cocksfoot is thought to be related to the higher number of
alleles (genetic buffering) and to higher heterozygosity (Lindner and Garcia 1 997).
Galician diploid cocksfoots were found in shady habitats and in perennial meadows, but
with shorter, fewer and wider leaves (Lindner and Garcia 1 997). Fewer as well as wider
leaves on diploid cocksfoot (PG 74) were also observed in the glasshouse and field
experiments. Perhaps for these reasons, PG 74 was also one of the most heavy shade
tolerant cocksfoot selections (Experiment 4. 1 : section 4.4. 1 .2 and Experiment 4.2:
section 4.4.2.2).
9.3.1.1 Light intensity versus quality under shade
Only PAR had a significant effect on the shoot dry weight per plant of the pasture
species in this thesis. However, research results indicate that plants are able to detect
change in light quality (reduced R:FR ratio) via the phytochrome family of
photoreceptors and respond morphologically (Smith 1982; Smith 1994; Maliakal et al.
1999). The common morphological responses are reduced tillering, or branching
(Deregibus et al. 1985; Solangaarachchi and Harper 1 987; Casal et al. 1 987 ; Assmann
1 992; Hay et al. 1997). The effects of light quality on pastoral plants, therefore, could
be photomorphogenic via regulation of photosynthate allocation (Kasperbauer and Hunt
1 998), and could stimulate morphological changes such as increased plant height, and
reduced tillering or branching, but may not affect the shoot dry weight production.
However, the differences between individual species were more important than those in
response to light levels for the performance of pasture species in the shade. That is,
differences between species in attributes that affect the plant' s performance in shade
like tillering and SLA were largely due to inherent differences between species rather
than due to a response to light quality (R:FR). This could also be an indication that
morphological responses such as reduced tillering, branching or stem elongation are not
potentiated only by a low R:FR (Assmann 1992), but also by other variables including
light intensity, leaf temperature and humidity (Maliakal et al. 1 999).
The significant effect of PAR on all the parameters studied (Chapter 5) showed that the
ability of a plant species to tolerate low light has its root in photosynthesis (Corn� 1 983).
The allocation of biomass to plant organs can be considered as a strategy used to

288
improve survival (Lee et al. 1994), and hence light quantity might have its greatest
effect on shoot dry weight. There is a threshold level of PAR for plant species to grow.
Assmann ( 1992) found that Commelina communis, a shade tolerant plant, was able to
flower and set seed with 13 hours daily of 25 ± 5 Jlmoles photons m-2 s-lwhite light,
which could be the threshold of light quantity for that species. The lowest level of PAR
maintained in the experiments reported in this thesis was 60 Jlmoles photons m-2 sol
(Chapter 3 ) and 78 Jlmoles photons m-2 sol (Chapter 5), which may be near to the
threshold value to these pasture species. Since some species could not produce any
tillers at 60 Jlmoles m-2 S- I , it is postulated that this could be the heaviest shade under
which these plants could be grown.
Light quantity, rather than quality, was the important factor determining photosynthetic
capacity for white clover (Dennis and Woledge 1 983). Light demanding plants have
high rates of respiration, and there can be a great variation in the extent to which the
respiration rate is reduced in heavy shade (Grubb et al. 1 996). However, to determine
the respiration rates of species under various levels of shading was not within the scope
of this thesis.
The level of transmitted PAR affected the relative growth rate (RGR) of cocksfoot and
perennial rye grass, where the RGR of cocksfoot was less affected by reduced PAR
compared with perennial ryegrass . However, the RGR of both species was not affected
by a reduced R:FR. This further suggests that light quantity was more important than
light quality (R:FR ratio) for plants grown under shade (experiment 6. 1 : sections 604. 1 .2
and 604. 1 .3) . There was also no effect of reduced R:FR ratio on the shoot dry weight per
plant of cocksfoot and perennial ryegrass under weekly and three-weekly defoliation in
the glasshouse (Experiment 6.2: section 6.4.2.2).
In glasshouse experiments, the reduced R:FR ratio was maintained at 0.57 (section 5 04)
and 0.68 (Experiment 6. 1 : section 604. 1 . 1 ) which were similar to values of 004-0.6 found
under dense tree canopies by Wilson ( 1997). In the field experiment (Experiment 7 . 1 )
the R:FR under heavy shade was 0.66 (Experiment 7. 1 : section 704. 1 . 1) , which was
similar to levels measured by Smith ( 1982) for deciduous wood lots (ranging from 0.36-

289
0.97). This means that the reduction of R:FR along with the reduction in transmitted
PAR in the glass house was in a manner similar to natural light filtering through an
overstorey canopy (sections 5.4.2-5.4.6; Experiment 6. 1 : sections 6.4 . 1 .2, 6.4. 1 .3 ;
Experiment 6 .2 : sections 6.4.2.2-6.4.2.7). However, these results should be interpreted
with caution and should not be extrapolated since R:FR can be down to 0.2 under deep
shade in tropical forest (Lee et al. 1 994).
Shade is an ever-present factor in crop production, be it in agriculture or agroforestry
(Smith 1 98 1 ). S hade tolerant species concentrate their efforts into leaf development in
the shade, and appear to principally perceive the light quantity aspect of shade rather
than light quality (Smith 198 1 ).
9.3.1.2 Defoliation and plant growth under shade
Perennial rye grass was more affected than cocksfoot by defoliation and shade, in terms
of growth related attributes (Experiment 6. 1 : sections 6.4.2.2-6.4.2.9). When plants
were established under full sunlight and not defoliated until final harvest (sections 5.3,
5 .4), shoot dry weight and tiller number per plant of perennial ryegrass was higher than
cocks foot (Table 9.3). But weekly defoliation greatly reduced the tiller number per plant
of perennial ryegrass relative to the cocksfoot (Table 9.3).
Increased frequency of defoliation or shorter re-growth periods results in a reduction in
the rate of growth of new leaves, and in the leaf size of perennial ryegrass (Brock et al.
1996; Faurie et al. 1996; Thomton and Millard 1997). Defoliation also significantly
reduces root dry weight (Experiment 6. 1 : section 6.4.2.7; Mawdsley and Bardgett
1 997) . For these reasons defoliated perennial ryegrass had poor shoot dry weight and
tiller number per plant at low levels of PAR. In contrast, cocksfoot had relatively higher
cumulative shoot dry weight and tiller number per plant under weekly defoliation at low
PAR compared with perennial rye grass (Experiment 6. 1 : sections 6.4.2.2, 6.4.2.6) . This
superiority of cocksfoot was mainly due to its higher leaf area (Table 6.8), higher leaf
dry weight (Table 6.9), higher SLA (Figure 6.2) and higher tiller number per plant
(Table 6 . 1 0) .

290
Cocksfoot can tolerate more frequent defoliation in the shade than perennial ryegrass. If
perennial rye grass is managed to maintain optimum LAI under shade, then it will be
able to intercept sufficient light and alter the allocation of assimilates to leaves for
production and persistence (Caldwell 1987). Also, the re-growth potential of perennial
ryegrass could be based more on the total amount of water-soluble carbohydrates in the
stubble (Fulkerson and Slack 1995). In comparison, cocksfoot is less sensitive to LAI,
and keeps on allocating a high proportion of its photosynthates to the leaves even under
frequent defoliation. This is perhaps due to a higher level of soluble carbohydrates in
the bases of expanding leaves, and a more efficient photosynthesis system (Davidson
and Milthorpe 1966).
9.3.1 .3 Morphological attributes in relation to shade tolerant pasture species
The morphological responses of plants to shade are a complex phenomenon (Thompson
1 993) . Some research has shown that morphological responses of plants are based only
on light quality (CornS 1 983), but most studies have focused on the effects of light
quantity and quality in relation to the morphological adaptations of plants in shade
(Monteith 1 98 1 ; Kephart and Buxton 1 993; Callan and Kennedy 1 995; Wilson 1997;
Sanderson et al. 1997). However, it is difficult to determine which morphological
attribute(s) is the most important contributor to the productive performance of pasture
species in shade.
Morphological responses of plants growing under shade include: increased leaf-area
ratio, increased shoot-to-root ratio, increased specific leaf area, increased plant height,
and reduction in vegetative shoots (Cooper and Tainton 1 968; Park et al. 1988; Stur
1 99 1 ; Kephart et al. 1992; Lambers and Poorter 1 992; Grubb et al. 1 996; Sanderson et
al. 1 997; Wilson 1997; Nassiri and Elgersma 1998; Wan and Sosebee 1 998). Tillers per
plant, specific leaf area and leaf area were also found to be associated with the more
productive pasture species under heavy shade reported in this thesis (sections 4.4. 1 .6,
4.4. 1 .7) .
Absolute or relative number of tillers or branches per plant were the most influential
attributes affecting shoot dry weight at low PAR in all the experimental conditions

29 1
presented in this thesis (section 3 .3 .5; Experiment 4. 1 : section 4.4. 1 .3 ; Experiment 4.2:
section 4.4.2.3; section 5.4 .3 ; Experiment 6.2: section 6.4.2.6; Experiment 7. 1 : section
7 .4. 1 .6). In shade all the components of plant growth are depressed by a low energy
input, and tillering ability of the plant is mainly dependent on carbohydrate supply
(Cooper and Tainton 1 968) . In this sense, persistence of pasture species under low PAR
could best be evaluated on their ability to continue to tiller or branch (Devkota et al.
1 997).
The defoliation experiment (Experiment 6.2) demonstrated that under heavy shade and
defoliation, only a species that can continue to produce leaf under intense defoliation
was able to produce tillers in the shade. The relative index of perennial ryegrass and
cocksfoot as indicated by tiller number per plant also summarized the importance of
tiller number as a determinant of plant performance under shade (Table 9.3) . Number of
leaves per tiller and axillary tiller formation are greater in Wana cocks foot than Nui
perennial rye grass even in unshaded field conditions with intensive grazing
management (Brock et al. 1 996).
Plants grown under a low PAR generally have a higher SLA and thinner leaves, which
is also associated with less non-structural carbohydrate (Lambers and Poorter 1992)
invested in leaves (Nassiri and Elgersma 1 998). High SLA is interpreted as adaptation
to shade in that for each unit weight of leaf dry matter, a greater area of leaf is able to
intercept the available light (Dennis and Woledge 1 983 ; Grubb et al. 1 996; Sanderson et
al. 1 997). In this thesis, species that produced the greatest shoot dry weight per plant
and tiller number per plant usually also had the highest SLA at low PAR. For example,
SLA of perennial ryegrass was always lower than Yorkshire fog and cocksfoot (Figure
3 .3 , Tables 4. 1 . 1 , 4.5, 5. 1 0) , and SLA of Wana cocksfoot was always higher than Nui
perennial ryegrass at a range of PAR and defoliation levels (Figure 6.3).
Shade tolerant pasture species appear to allocate more assimilates to leaf growth and to
increase SLA. In this way photosynthetic capacity per plant will increase, which creates
a positive feed back system since more assimilates will be available for leaf growth due
to the higher photosynthesis per plant. Increased total plant photosynthesis results in
increased tiller number per plant, which will also have a positive feed back to a larger

292
leaf area via increased SLA (Ward and Blaser 196 1 ; Solhaug 1 991 ) . Thus, successful
grass plants in shade will increase in shoot dry weight mainly due to tiller production.
The mechanism of increased leaf area and SLA influencing maintenance of tillering
leading to increased dry weight per plant for shade tolerant grass is illustrated in Figure
9. 1 . Cocks foot appears to have the mechanism for SLA maintained increased tillering
shown in Figure 9.1 to result in higher number of tillers per plant. Solhaug ( 199 1 )
found increased leaf area and SLA resulted in increased leaf area ratio i n cocksfoot in
response to a range of different photoperiods and temperatures. Conversely Eagles
( 1 973) showed for a natural population of cocksfoot there was a negative relationship
between SLA and increased light.
There are two hypotheses that could explain the greater biomass accumulation of
cocksfoot in heavy shade as suggested by Ballare (199 1 ) in the case of elongated plants:
( 1 ) efficient at capturing light or (2) greater light conversion into biomass. Since
photosynthesis measurements were not carried out in this thesis, the physiological
mechanism governing these adaptations is not fully explained. However, larger leaf area
or higher SLA, and maintenance of tillering and shoot dry weight by cocksfoot, as
demonstrated in this thesis, suggested increased proportional investment in leaves by
cocksfoot as discussed by Maliakal et al. ( 1999) in their work with Impatiens capensis.
Like cocks foot, perennial rye grass also had a higher leaf area ratio (LAR), due to its
high SLA, in a mixture of perennial ryegrass with white clover under conditions of low
N and high temperature (Davidson and Robson 1 986). However, in this study perennial
ryegrass always had lower S LA in the heavy shade than cocksfoot, and thus was unable
to produce the shoot dry weight of cocksfoot. Ong and Marshall ( 1979) reported that
tillers of ryegrass severely stressed by heavy shade were unable to survive.

Positive feed back loop
Shade tolerant plant
Increased shoot growth
Positive Feed back loop
293
Figure 9 . 1 Mechanism of leaf area/SLA maintenance of tillering and shoot dry weight for shade tolerant
grass species.

294
9.3.2 Pasture production and management under a deciduous tree-pasture system
Pasture production under deciduous trees is higher than that under younger Pinus
radiata agroforest at a similar tree density (Hawke and Knowles 1 997), and also than
under widely spaced as well as closed plantations of Pinus radiata (Miller et al. 1996).
Pasture production under trees decreases basically due to the competition of trees and
associated pasture understorey for light, water, and mineral nutrients (Cameron et al.
1 989). For these reasons, the management of trees in terms of density, species, canopy
management and the understorey (mainly in terms of pasture species introduction,
defoliation and mixture of companion grass species and legumes) are an important part
of silvo-pastoral systems.
Deciduous trees such as alders, poplars and willows are primarily planted in New
Zealand hill country for soil erosion control (DeRose et al. 1 993; Miller 1996).
Understorey pasture production is reduced by deciduous trees (Ditschal et al. 1997), but
comparatively it can be better managed via practices like tree pruning or short rotations
(New 1 985). In this thesis, for the tree density of 1 197 stems!ha (PAR level of around
1 80 and 360 Ilmoles photons m-2 S
-I, respectively, for heavy and medium shade;
Experiment 7. 1 : sections 7.3. 1 , 7 .3 .2) with 1 1 year old alders, herbage mass in heavy
and medium shade was about 50 and 70% respectively of that in light shade (section
7.4. 1 .4). Pasture production in a wide spaced (37 stems!ha) mature poplar-pasture
system in a hill environment (PAR level 122 Ilmoles photons m-2 S-1 during December)
in New Zealand was 60% of that of open pasture (Guevara-Escobar et al. 1997). The
pasture was dominated by browntop, with a mixture of other perennial grasses and
legumes (Guevara-Escobar et al. 1 997). However, the canopy allowed sun flecks due to
the wide tree spacing, and so browntop probably dominated for that reason although the
measured PAR level was less than 200 Ilmoles photons m-2 S
-1 (Guevara-Escobar et al.
1997).
Reduction of understorey pasture production appeared to be mainly associated with the
shading effects of trees. However, there could be other limiting factors as well, for
example, there were differences in competition for water between trees and pasture
during the dry period; less water stress in cocksfoot plots than other species. Pasture
295
species such as perennial ryegrass were under stress from low fertility, high soil
temperature, coupled with a low level of soil moisture (Chapter 7 :section 7.5 . 1 ). Soil
moisture and nutrients were also limiting in a poplar-cereal crop system as reported by
Thevathasan and Gordan ( 1 997).
There is always a trade-off between tree production and understorey pasture production
but the results suggest pasture production can be maintained at a reasonable level by
pruning the trees (Experiment 7 . 1 : sections 7.3 . 1 , 7.3 .2), or widely spacing the trees
(Guevara-Escobar et al. 1 997).
9.3.2.1 Canopy management of trees by pruning
As the alders were at the same spacing over the site, but pruned to different heights, it
was possible to make some conclusions on the pruning management of trees. From a
practical point of view, it was noted that pruning all but the last whorl (light shade) was
not an appropriate practice since in some cases the tree' s top whorl was broken off due
to swinging in high wind. Likewise, pruning only the lower 2-3 branches (heavy shade)
did not greatly reduce the canopy shading effect since it resulted in PAR levels of less
than 200 J.Lmoles photons m-2 S- I and depressed pasture production to about half of that
of light shading. Pruning half way up the trees (medium shade; Srn pruned) would be an
appropriate practice, as it resulted in a canopy of understorey PAR levels about 360
J.Lmoles photons m-2 S-I that depressed understorey pasture production by only about
30% relative to light shade. However, the objectives and purpose of the particular tree
pasture system would affect the pruning decision. Deciduous trees only use available
resources for part of the year, thus allowing resource use by pasture with minimal
competition (Newman 1997), for about 25% of the year in the case of alders.
9.3.2.2 Shade tolerant pasture species and the options for management
The impact of spaced trees on understorey pasture production increases as the tree
canopy develops (Guevara-Escobar et al. 1 997; McGregor et al. 1 999). As the canopy
becomes closed, light, then the soil moisture contents under the trees, would be the main
limiting factors determining total pasture dry matter accumulation (Power et al. 1 999).

296
The tree density, tree species, and degree of canopy closure therefore, largely determine
introduction of appropriate pasture species under tree shade.
Cocksfoot, particularly Wana was identified as the grass species most tolerant of heavy
shade in this thesis. Yorkshire fog was also a shade tolerant pasture species in the
glasshouse conditions, but not under the shade of the alder trees. Unlike cocksfoot,
Yorkshire fog is not a common species under tree shade apart from as a weed in a
condition when pasture species are not well defoliated, or managed by grazing. Among
legumes, lotus was more tolerant of heavy shade than white clover, as also indicated by
other research results (Gadgil et al. 1986; West et al. 1988; West et al. 1 99 1 ). However,
both lotus and cocksfoot have some disadvantages. Lotus can not tolerate frequent
defoliation. Long rotations are required to maintain a persistent sward of lotus (Harris et
al. 1 997). For cocksfoot, Barker et al. ( 1 985) discussed disadvantages that include
reduced palatability when rank, and slow establishment. Total nitrogen and crude
protein of cocks foot were also reported to be lower than for perennial ryegrass
(W oodman and Fraser 1 99 1 ), but metabolizable energy and digestibility were ranked as
high in cocksfoot as in perennial ryegrass (Woodman and Fraser 1 99 1 ). In this thesis
when grown under 27% ambient PAR (Chapter 3), in vivo organic matter digestibility
of perennial ryegrass and cocksfoot were about 82 and 7 1 % , respectively, (data not
presented in the chapter). Further nutrient analyses of pasture species were outside the
scope of this thesis. Nevertheless, if cocksfoot is managed to maintain the sward in an
actively growing state, animal production is within expectations from other grass
pasture species (Fraser and Rowarth 1 994).
A conclusion from this thesis is that a cocks foot based pasture, preferably with lotus, is
likely to be the most persistent and productive under heavy tree shade (PAR <200
Jlmoles photons m-2 sol ) . Additionally, cocksfoot and lotus are both tolerant of the low
to medium soil fertility and seasonal dry periods likely to be encountered on hill country
where deciduous trees are used for erosion control.
Under medium shade, however, the opportunity exists to manage the light environment
by pruning trees rather than introducing pasture species tolerant of heavy shade. As
indicated by the results in this thesis, perennial ryegrass and browntop with white

297
clover, can be grown under a medium level of shade if the PAR level is well above 200
Jlmoles photons m-2 S-I . As perennial rye grass , browntop and white clover are used
traditionally in hill country pastures, management of these species under a medium
shade by pruning trees is perhaps a cheaper option than establishing a new pasture
species like cocksfoot.
Pruning of trees is a major way to benefit understorey pastures, by reducing above
ground competition between trees and pastures (Noordwijk and Purnomosidhi 1995).
Pruning trees can be an equally effective way to conserve soil moisture contents (Tables
7.4a, b). The results of this study indicate that canopy management of deciduous trees to
maintain medium shade is very important in order to improve understorey pasture
productivity.
9.4 Conclusions
This thesis has provided important information for deciduous based tree-pasture
systems, particularly with respect to the performance of pasture species in a range of %
transmitted PAR. Suitable pasture species for use in heavy and medium levels of shade
were identified as well as some effective options for pasture management under trees .
The overall conclusions from this thesis on the effect of a range of light intensities and
variation in light quality on the growth and morphology of pasture species are
summarized below.
( 1 ) S hade had a marked effect on regeneration from main sterns as well as on shoot dry
weight accumulation. However, pasture species responded differently to shade.
Cocks foot was the best species for heavy shade and can be grown either with lotus or
white clover in a mixture, even under low levels of soil fertility and moisture. Cocksfoot
should be the choice for a tree-pasture system if PAR level is less than 200 Jlmoles m-2
S-I
, while perennial ryegrass, browntop, or Poa are suitable pasture species for medium
shade with PAR levels more than 200 Jlmoles photons m-2 S-I . Yorkshire fog was not
suitable for growth under heavy shade. Lotus is preferable to white clover under heavy

298
shade, but white clover can be grown with any of the above grass species under a
medium level of shade.
(2) Wana (tetraploid), and PG 74 (diploid) were the most shade tolerant cultivars of
cocksfoot. Tetraploids and diploids could be equally suited for heavy shade. PG lines of
cocksfoot, other than PG 74, were similar in performance, but were not promising under
heavy shade. Cocksfoot produced the highest shoot dry weight in heavy shade, and thus
can be recommended for use under a dense tree canopy, but its long-term persistence
under tree shade requires further study.
(3) Wana cocks foot performed better than Nui perennial ryegrass under intense
defoliation in the shade. Wana produced higher biomass than Nui rye grass under both
weekly (WI ) and three-weekly (W3) defoliation intervals due mainly to its ability to
produce higher leaf area, higher leaf dry weight, and higher specific leaf area (SLA).
Wana also had significantly more tillers per plant, a higher tiller site usage value, and a
shorter leaf appearance interval than Nui ryegrass at both low PAR and low R:FR
conditions . ID contrast, perennial ryegrass production was poor under the combination
of heavy shade and defoliation mainly due to its low tillering and leaf area per plant,
and also due to its low tiller site usage value. Relative growth rate (RGR) of Wana was
always higher than Nui at all PAR levels. RGR of both species was not affected by low
R:FR.
(4) Nui perennial ryegrass is not adapted to silvo-pastoral systems where the degree of
shading is heavy, i.e. less than 200 JlII10les photons m-2 S-1 . There was a consistency in
the results of field and glasshouse studies. However, there could be variation in the
shade tolerance of cultivars of perennial rye grass , and further research would be
required to determine the extent of any shade tolerance within perennial ryegrass.
(5) Tillers per plant, specific leaf area, and leaf area, were the morphological attributes
that mainly influenced the performance of pasture plants under heavy shade. Net flows
of tissues were also consistently higher for the plants that performed well under shade.
The ability to regenerate leaf area to maximise the interception of available radiation,

299
and to generate new tillers were the critical factors that determined production and
persistence of pasture species under low irradiance.
(6) The level of shade rather than differences between the pasture species largely
determined the diet selection by sheep that were inexperienced in grazing under trees,
with the least grazing in the heaviest shade level.
(7) Shade is the most significant factor determining the production from pastures grown
under trees . However, the decrease in pasture production due to shading can be
managed by pruning lower branches from trees.

300
9.5 References
Anonymous. 1 995. Poplar agroforestry: An introduction to using poplars for timber.
New Zealand Poplar Commission, Palmerston North, New Zealand.
Assmann, S . M. 1 992. Effects of light quantity and quality during development on the
morphology and stomatal physiology of Commelina communis. Oecologia
92: 1 88- 1 95 .
B alIare, C. L. , Scopel, A. L. and Sanchez, R. A . 1 99 1 . On the opportunity cost of the
photosynthate invested in stem elongation reactions mediated by phytochrome.
Oecologia 86:561 -S67.
B arker, D. J . , Lancashire, J. A. and Meurk, C. 1 985. 'Grasslands Wana' cocksfoot-an
improved grass suitable for hill country. Proceedings of New Zealand
Grassland Association 46: 1 67 - 172.
Brock, J . L., Hume, D. E. and Fletcher, R. H. 1996. Seasonal variation in the
morphology of perennial ryegrass (Lolium perenne) and cocks foot (Dactylis
glomerata) plants and populations in pastures under intensive sheep grazing.
Journal of Agricultural Science 1 26 :37-5 1 .
Caldwell, M . M . 1987. Plant architecture and resource competition. Pp 1 64-179 in:
Ecological Studies, Schulze, E. D. and Zwolfer, H. ed. S pringer-Verlag Berlin,
Heidelberg.
Callan, E. J . and Kennedy, C. W. 1 995. Intercropping stokes aster: Effect of shade on
photosynthesis and plant morphology. Crop Science 3S: l I lO- I l l S .
Cameron, D . M. , Ranee, S . J . , Jones, R. M. , Charler-Edwards, D. A. and Barnes, A.
1 989. Project STAG: An experimental study in agroforestry. A ustralian Journal
of Agricultural Research 40: 699-7 1 4.
301
Casal, J. J. , Sanchez, R. A. and Deregibus, V. A. 1987. The effect of light quality on
shoot extension growth in three species of grasses. Annals of Botany 59: 1 -7 .
Clough, P. W. J. and Hicks, D. L. 1 993. Soil Conservation and the Resource
Management Act: Summary. MAP Policy Technical Paper, 93/2, Wellington,
New Zealand.
Cooper, J. P. and Tainton, N. M. 1 968. Light and temperature requirements for the
growth of tropial and temperate grasses. Herbage Abstracts 3 8 : 1 67-176.
Com§, W. J . 1 983. Growth and morphogenesis of sun and shade plants I. The
influence of light intensity. Acta Bot. Neerl. 32 ( 1 /2): 49-62.
Cruz, P. 1 997. Effect of shade on the carbon and nitrogen allocation in a perennial
tropical grass, Dichanthium aristatum. Journal of Experimental Botany 48: 1 5-
24.
Davidson, L A. and Robson, M. J. 1 986. Effect of temperature and nitrogen supply on
the growth of perennial ryegrass and white clover. 2 . A comparison of
monocultures and mixed swards . Annals of Botany 57 :709-7 1 9 .
Davidson, 1 . L . and Milthorpe, F. L . 1 966. The effect of defoliation on the carbon
balance in Dactylis glomerata. Annals of Botany 30 ( 1 1 8) : 1 85- 198 .
Dennis, W. D. and Woledge, J. 1 983 . The effect of shade during leaf expansion on
photosynthesis by white clover leaves. Annals of Botany 5 1 : 1 1 1- 1 1 8 .
Deregibus, V. A., Sanchez, R. A., Casal, J. J. and Trlica, M . J . 1 985. Tillering
responses to enrichment of red light beneath the canopy in a humid natural
grassland. Journal of Applied Ecology 22: 199-206.

302
De Rose, R. C. Trustrum, N. A. and Blaschke, P. M., 1 993. Post-deforestation soil loss
from steepland hillslopes in Taranaki, New Zealand. Earth Suiface Processes
and Landforms 1 8: 1 3 1 - 144.
Devkota, N. R. ; Kemp, P. D. and Hodgson, J. 1 997. Screening pasture species for
shade tolerance. Proceedings Agronomy Society of New Zealand 27: 1 19- 128 .
Ditschal, D . C . , Collins, M. and Grove, J . H . 1 997 . Black locust effects on forage yield
and nutritive quality produced on reclaimed mined land. Proceedings of the
XVIII International Grassland Congress, Canada. ID NO. 839.
Eagles, C . F. 1 973. Effect of light intensity on growth of natural populations of
Dactylis glomerata L. Annals of Botany 37:253-262.
Faurie, 0., Soussana, J. F. and Sinoquet, H. 1 996. Radiation interception, partitioning
and use in grass-clover mixtures. Annals of Botany 77:35-45.
Fraser, T. J. 1 994. Persistence of dryland pasture species in mixed swards in
Canterbury. Proceedings of the New Zealand Grassland Association 56:77-79.
Fraser, T .J. and Hewson, D. C. 1994. Establishing drought-tolerant pasture species on
east coast downlands by direct drilling. Proceedings of the New Zealand
Grassland Association 56:73-76.
Fraser, T. J. and Rowarth, J. S. 1 994. Wana cocksfoot: Nitrogen effects on quantity and
quality. Proceedings Agronomy Society of New Zealand 24:2 1 -24.
Fulkerson, W. J. and Slack, K. 1 995. Leaf number as a criterion for detennining
defoliation time for Lolium perenne: 2. Effect of defoliation frequency and
height. Grass and Forage Science 50: 1 6-20.
303
Gadgil, R. L. , Charlton, J. F. L., Sandberg, A. M. and AlIen, P. J. 1 986. Relative growth
and persistence of planted legumes in a mid-rotation radiata pine plantation.
Forest Ecology and Management 14: 1 1 3- 1 24.
Grubb, P. J . , Lee, W. G., Kollmann, J . and Wilson, J. B. 1 996. Interaction of irradiance
and soil nutrient supply on growth of seedlings of ten European tall-shrub
species and Fagus sylvatica. Journal of Ecology 84:827-840.
Guevara-Escobar, A., Kemp, P. D. , Hodgson, J . , Mackay, A. D. and Edwards, W. R N.
1 997. Case study of a mature Poplus deltoides-pasture system in a hill
environment. Proceedings of the New Zealand Grassland Association 59: 1 79-
1 85 .
Harris, C . A . , Blumenthal, M. J . , Kelman, W. M. and McDonald, L . 1 997. Effect of
cutting height and cutting interval on rhizome development, herbage production
and herbage quality of Lotus pedunculatus cv. Grasslands Maku. Australian
Journal of Experimental Agriculture 37 :63 1 -637.
Hawke, M. F. and Knowles, R. L. 1 997. Temperate agroforestry systems in New
Zealand. Pp 85- 1 1 8 in: Temperate Agroforestry Systems, Gordon, A. M. and
Newman, S. M. ed. CAB International, Wallingford, U.K.
Hay, M. J. M., Robin, Ch. , Newton, P. C. D., Cresswell, A. and Tilbrook, J. 1 997.
Effects of lowered light quality (R:FR ratio) at targeted organs on branching of
Trifolium repens. Proceedings of the XVIII International Grasslands Congress,
Canada ID NO. 1 092.
Hocking, D. 1 990. Farming with trees on sand country. Proceedings of the New
Zealand Grassland Association 5 1 , 59-60.
Kasperbauer, M. 1. and Hunt, P. G. 1 998. Far-red light affects photosynthate allocation
and yield of tomato over red mulch. Crop Science 38:970-974.

304
Kelliher, F. M. , Marden, M. , Watson, A .1 . and Arulche1van, 1. M. 1995 . Estimating
the risk of landsliding using historical extreme river flood data (Note) . Journal
of Hydrology (NZ) 33 : 1 23 - 1 29.
Kephart, K. D. and Buxton, D. R. 1 993. Forage quality responses of C3 and C4
perennial grasses to shade. Crop Science 33:83 1 -837.
Kephart, K. D., Buxton, D. R. and Taylor, S. E. 1992. Growth of C3 and C4 perennial
grasses under reduced irradiance. Crop Science 32: 1033- 1038.
Lambers, H. and Poorter, H. 1 992. Inherent variation in growth rate between higher
plants: A search for physiological causes and ecological consequences.
Advances in Ecological Research 23: 187- 260.
Lee, W. W. , Oberbauer, S . F., Krishnapillay, B. , Marzalina, M., Haris, M. and Yap, S .
K. 1 994. Forest shade and seedling development in fine dipterocarps.
Proceedings, Fifth round-table conference on Dipterocarps, Chiang Mai,
Thailand, 7-10 November, 1 994. Forest Research Institute Malaysia (FRIM), Kualalumpur. Pp 1 02- 1 16 .
Lindner, R. and Garcia, A. 1 997. Geographic distribution and genetic resources of
Dactylis in Galicia (northwest Spain). Genetic Resources and Crop Evolution
44:499-507.
Lolicato, S. and Rumball, W. 1 994. Past and present improvement of cocksfoot
(Dactylis glomerata L.) in Australia and New Zealand. New Zealand Journal of
Agricultural Research 37: 379-390.
MacFar1ane, A. W. 1 990. Field experience with new pasture cultivars in Canterbury.
Proceedings of the New Zealand Grassland Association 52: 1 39- 143.

305
Maliakal, S . K, McDonnell, K., Dudley, S . A. and Schmitt, J. 1999. Effects of Red to
far-red ratio and plant density on biomass allocation and gas exchange in
Impatiens capensis. International Journal of Plant Science 1 60:723-733.
Mawdsley, J . L. and Bardgett, R. D. 1 997. Continuous defoliation of perennial ryegrass
(Lolium perenne) and white clover (Trifolium repens) and associated changes in
the composition and activity of the microbial population of an upland grassland
soil. Biology and Fertility of Soils 24:24-52.
McCree, K. J. 198 1 . Photosynthetic ally active radiation. Pp 41 -55 in: Physiological
plant ecology 1. Responses to the physical environment, Lange, O. L., Nobel, P .
S . , Osmond, C. B . and Ziegler, H. ed. Encyclopedia of Plant Physiology, New
S eries Volume 1 2A, Springer, Berlin, Heidelberg, New York.
McGregor, E . , Mackay, A. D. , Dodd, M. and Kemp, P. D. 1999. Silvopastoralism using
tended poplars on New Zealand hill country: The opportunities. Proceedings of
the New Zealand Grassland Association 6 1 :85-89.
Miller, D. E. K, Gilchrist, A. N. and Hicks, D. L. 1 996. The role of broadleaved trees
in slope stabilisation in New Zealand pastoral farming. Pp 96-1 04 in: Mountains
of East Asia and the Pacific, Ralston, M . M. , Hughey, K. F. D. and O 'Connor,
K F. ed. Centre for Mountain Studies, Lincoln University, Canterbury, New
Zealand.
Moloney, S . C. 1 993. Selection, management and use of cocksfoot cultivars in North
Island pastoral farming. Proceedings of the New Zealand Grassland Association
55 : 1 1 9- 1 25.
Monteith, J . L. 198 1 . Does light limit crop production. Pp 23-38 in: Physiological
Processes Limiting Plant Productivity. Butterworth, London, 395p.

306
Nassiri, M. and Elgersma, A. 1 998. Competition in perennial ryegrass-white clover
mixtures under cutting. 2. Leaf characteristics, light interception and dry-matter
production during regrowth. Grass and Forage Science 53:367-379.
New, E. 1 985. Coppicing. New Zealand Tree Grower 1 0( 1) : 1 4- 1 8 .
Newman, S .M. 1 997. Poplar-pasture system in India. Forest Ecology and Management.
90: 1 3- 1 7.
Noordwijk, M. V and Purnomosidhi, P. 1 995. Root architecture in relation to tree-soil
crop interactions and shoot pruning in agroforestry. Agroforestry Systems
30: 1 6 1 - 1 73 .
Ong, C. K. and Marshall, C . 1 979. The growth and survival o f severely-shaded tillers in
Lolium perenne L. Annals of Botany 43: 147- 1 55 .
Park, M. S . , Seo, S. , Han, Y. C. and Lee, J. Y. 1 988. Studies on grassland development
in forest. VII. Effects of shading degrees on the early growth characteristics and
winter survival of main grasses. Herbage Abstracts 58:372.
Pollock, K. , Lucas, R, J., Mead, D. J . and Thomson, S. E. 1 994. Forage pasture
production in the first three years of an agroforestry experiment. Proceedings of
the New Zealand Grassland Association 56: 179- 1 85 .
Pollock, K . M . , Lucas, R . J . , PownalI, D . B . and Thompson, S. E. 1 997. Temperate
pasture and sheep performance under radiata pine and in open pasture.
Proceedings of the XVIII International Grassland Congress, Canada, ID NO
464.
Power, 1. L., Dodd, M. B. and ThoITold, B. S. 1999. A comparison of pasture and soil
moisture under Acacia melanoxylon and Eucalyptus nitens. Proceedings of the
New Zealand Grassland Association 6 1 :203-207.

307
Remison, S. U. and Snaydon, R. W. 1980. Effects of defoliation and fertilizers on root
competition between Dactylis glomerata and Lolium perenne. Grass and
Forage Science 35: 8 1 -93.
Rumball, W. 1 982. 'Grasslands Wana' cocksfoot (Dactylis glomerata L.). New
Zealand Journal of Experimental Agriculture 10 :5 1 -52.
S anderson, M. A., Stair, D. W. and Hussey, M. A. 1997. Physiological and
morhological responses of perennial forages to stress. Advances in Agronomy
59: l 7 1-224.
S eo, S . , Han, Y. C. and Park, M. S. 1 989. Grassland improvement and N fertilisation
management of woodland in Korea. Proceedings of the XVI International
Grassland Congress: 1487- 1488.
S mith, H. 1 994. Sensing the light environment: The functions of the phytochrome
family. Pp 377-4 1 6 in: R. E. Kendrick and Kronenberg, G.H.M. ed.
Photomorphogenesis in plants, 2nd ed,. Kendrick, Kluwer, Dordrecht.
S mith, H. 1 982. Light quality, photoperception, and plant strategy. Annual Review of
Plant Physiology 33 :48 1-5 18 .
Smith, H. 1 98 1 . Adaptation to shade. Pp 1 59-1 73 in: Physiological processes limiting
plant productivity, Butterworths, London. 395p.
Solangaarachchi, S. M. and Harper, J. L. 1 987 . The effect of canopy filtered light on
the growth of white clover Trifolium repens. Oecologia 72:372-376.
S olhaug, K. A. 199 1 . Influence of photoperiod and temperature on dry matter
production and chlorophyll content in temperate grasses. Norwegian Journal of
Agricultural Sciences 5:365-383.

308
Stilr, W. W. 199 1 . Screening forage species for shade tolerance-a preliminary report.
Pp 58-60 in: Forage for plantation crops, S helton, H. M. and Stilr, W. W. ed.
A CIAR proceedings No. 32, Canberra.
Thevathasan, N. V. and Gordon, A. M. 1 997. Poplar leaf biomass distribution and
nitrogen dynamics in a poplar-barley intercropped system in southern Ontario,
Canada. Agroforestry Systems 37:79-90.
Thornton, B. and Mill ard , P. 1 997. Increased defoliation frequency depletes
remobilization of nitrogen for leaf growth in grasses. Annals of Botany 80:89-
95.
Wall, A. J . , Mackay, A. D., Kemp, P. D. , Gillingham, A. G. and Edwards, W. R. N.
1 997. The impact of widely spaced soil conservation trees on hill pastoral
systems. Proceedings of the New Zealand Grassland Association 59: 1 7 1 - 1 77 .
Wan, C. and Sosebee, R. E. 1 998. Tillering responses to red: far-red light ratio during
different phenological stages in Eragrotis curvula. Environmental and
Experimental Botany 40: 247-254.
Ward, C . Y. and Blaser, R. E. 196 1 . Carbohydrate food reserves and leaf area in
regrowth of orchard grass. Crop Science 1 :366-370.
West, G. G., Dean, M. G. and Percival, N. S . 199 1 . The productivity of Maku lotus as a
forest understorey. Proceedings of the New Zealand Grassland Association
53: 1 69- 173.
West, G. G., Percival, N. S. and Dean, M. G. 1988. Over sowing legumes and grasses
for forest grazing: Interim research results. Pp 203-222. Forestry Research
Institute Bulletin No. 1 39, Rotorua, New Zealand.

309
Wilson, l. R. 1997. Adaptive responses of grasses to shade: Relevance to turf grasses
for low light environments. International Turfgrass Society Research Journal 8 :
575-59 1 .
Wilson, J . R. and Ludlow, M. M. 199 1 . The environment and potential growth o f
herbage under plantations. Pp 10-24. in: Forage for Plantation Crops, Shelton,
H. M. and Stilr, W. W. ed. ACIAR proceedings No. 32, Canberra.
Woodman, R .F. and Fraser, W. 1. 199 1 . Alternative grass options for dry east coast
and down land pastoral systems. Proceedings Agronomy Society of New
Zealand 21 :45-53 .

3 10
APPENDICES

Appendix 3 . 1 Effects of shade on pasture species tiller or branch number per plant, and their relative
values ( to that of 73% ambient PAR) at different harvest dates under glasshouse conditions, 1996.
PARlspcies
73% ambient PAR White clover 4 5 Lotus 5 1 0 Sub. clover 4 5 Browntop 9 1 9 Cocksfoot 5 8 Yorkshire fog 1 3 22 Tall fescue 4 7 Plantain 0 2 Perennial ryegrass 8 1 3 Poa trivialis 7 14 43%ambient PAR White clover 3 5 88 82 Lotus 5 8 91 82 Sub.c1over 3 5 93 84 Browntop 4 9 5 1 50 Cocksfoot 4 8 70 88 Yorkshire fog 7 1 3 56 59 Tall fescue 3 4 66 59 Plantain 0 2 0 67 Perennial ryegrass 4 7 5 1 5 1 Poa trivialis 5 1 1 69 80 27% ambient PAR White clover 2 3 59 54 Lotus 3 6 6 1 59 Sub.c1over 2 3 52 50 Browntop 3 4 32 22 Cocksfoot 3 5 64 56 Yorkshire fog 5 8 35 36 Tall fescue 2 3 53 37 Plantain 0 0 0 0 Perennial ryegrass 2 3 27 23 Poa tri vialis 4 6 50 4 1 18% ambient PAR White clover 0 2 0 4 1 Lotus 2 5 44 47 Sub.clover 0 0 0 0 Browntop 0 2 0 1 3 Cocks foot 3 4 53 45 Yorkshire fog 3 6 25 26 Tall fescue 2 2 50 30 Plantain 0 0 0 0 Perennial ryegrass 2 3 28 20 Poa tri vialis 2 4 34 25 14% ambient PAR White clover 0 0 0 0 Lotus 2 3 44 35 Sub.clover 0 0 0 0 Browntop 0 0 0 0 Cocksfoot 0 3 0 3 8 Yorkshire fog 3 3 1 9 1 4 Tall fescue 0 0 0 0 Plantain 0 0 0 0 Perennial ryegrass 0 2 0 1 6 Poa trivialis 0 2 0 1 6 Analysis of variance Shade P (A) <0.0001 <0.0001 <0.0001 <0.0001
3 1 1
SEM (d.f.=4) 0.1 8 0. 1 8 1 .30 (dJ.=3) 1 .33 (dJ.:::3) Species P (B) <0.0001 <0.0001 <0.0001 <0.0001 SEM (dJ.=9) 0.14 0.20 1 .56 1 .5 1 Interactions P (A*B) <0.0001 <0.0001 <0.001 NS SEM (d.f.=36) 0.32 0.46 3. 1 3 (d.f.=27) 3.02 (d.f.=27)
SEM= standard error of the mean, d.f.= degrees of freedom, NS= non significant at P<O.05 . Note that relative tillers are the mean of four replications, calculated first for each replication, and then the mean value. This also implies to the Appendix table 3.2.

3 1 2
Appendix 3.2 Effects of shade on mean specific leaf area (SLA, m2/kg) of the pasture species ,and their
relative values ( to that of 73% ambient PAR) at different harvest dates under glasshouse conditions,
1 996.
PARIs ies
73% ambient PAR White clover 45.48 42.98 40.87 Lotus 54.21 47.94 42.89 Sub.c1over 38.29 36.24 37.19 Browntop 28.68 29.08 27.68 Cocksfoot 34.84 3 1 .48 33.96 Yorkshire fog 41 .25 4 1 .41 44.67 Tall fescue 28.55 28.83 30.46 Plantain 3 1 .62 3 1 .3 1 30.38 Perennial ryegrass 27.51 30. 15 27. 13 Poa trivialis 28.25 30.26 36.91 43%ambient PAR White clover 48.78 43.70 42.30 1 07 101 1 03 Lotus 62.57 52.43 5 1 .60 1 15 1 09 120 Sub.clover 40.46 36.93 40.67 1 06 1 02 109 Browntop 37.64 33.52 32.07 1 3 1 1 15 1 16 Cocksfoot 37. 17 37.64 4 1 .68 1 07 1 19 123 Yorkshire fog 48.40 47.81 5 1 .02 1 17 1 1 5 1 13 Tall fescue 32.67 33.98 35.62 1 14 1 1 8 ! I7 Plantain 36.42 35.93 36.88 115 1 15 1 2 1 Perennial ryegrass 29.05 29.14 30.16 1 05 96 1 1 1 Poa tri vialis 39. 1 8 39.89 35.96 1 38 1 32 97 27% ambient PAR White clover 51 .92 49.54 54.97 1 32 1 15 1 34 Lotus 48.09 6 1 .93 68.56 88 1 29 160 Sub.c1over 43.35 42.27 41 .59 1 13 1 16 I I I Browntop 37.80 50. 1 8 32.91 1 3 2 1 72 1 1 9 Cocksfoot 44. 1 1 45.03 42.39 1 27 143 125 Yorkshire fog 51 .76 46.74 55.41 1 25 1 13 1 24 Tall fescue 37.1 0 38.37 33.86 1 30 1 33 I I I Plantain 45.90 40.42 43.40 145 1 29 143 Perennial ryegrass 35.90 36.94 3 1 .72 1 30 1 22 1 17 Poa trivialis 37.39 46.05 35.99 1 3 2 1 52 97 18% ambient PAR White clover 5 1 .76 57.01 57.13 1 1 3 1 32 1 39 Lotus 56.92 69.56 7 1 . 14 1 05 145 166 Sub.c1over 43.21 45.23 45.88 1 1 3 1 24 1 23 Browntop 37.00 42.75 36.27 1 29 147 1 3 1 Cocksfoot 38.41 45.45 46.25 1 10 144 136 Yorkshire fog 56.02 50. 1 2 55.58 1 36 1 2 1 1 24 Tall fescue 39.75 44.26 41 .77 1 39 1 53 1 37 Plantain 47.57 47.57 44.84 1 50 1 52 148 Perennial ryegrass 38.1 7 43.70 38.52 1 38 145 142 Poa trivialis 40.94 48.06 37.93 145 1 59 102 14% ambient PAR White clover 57.39 59.88 55.86 1 26 1 39 1 36 Lotus 55.21 72.92 82.78 1 02 1 52 1 93 Sub.c1over 43.50 45.26 49.69 1 14 1 24 1 33 Browntop 39.36 43.94 28.74 1 37 1 5 1 1 04 Cocksfoot 47.53 46.33 46.86 136 147 1 3 8 Y orkshlre fog 67.94 60.03 64.47 1 64 1 45 144 Tall fescue 34.99 46.24 44.39 1 22 1 60 1 46 Plantain 47.62 49.57 45.92 1 50 1 5 8 1 5 1 Perennial ryegrass 48.59 50.64 41 .07 1 76 1 68 1 5 1 Poa trivialis 40.59 40.85 3 1 .09 1 43 135 84 Analysis of variance Shade p eA) P<O.OOOI P<O.OOOI P<O.OOOI P<O.OOOI P<O.OOOI P<O.OOOI SEM (d.f.=4) 0.75 0.74 0.44 2.01 (d.f.=3) 2.38 (d.f.=30 1 .43 (d.f.=3) Species P (B) P<O.OOOI P<O.OOOl P<O.OOOI P<O.OOOI P<O.OOOI P<O.OOOI SEM (dJ.==9) 0.57 0.61 0.53 2.25 2. 1 7 1 .75 Interactions P (A *B) P<O.OOOI P<O.OOOI P<O.OOOI P<O.OOOI P<O.OOOI P<O.OOOI SEM (dJ.=36) 1 .28 1 .38 1 .20 4.50 (d.f.=27) 4.35 9d.f.=27) 3.50 (d.f.=27)
SEM= standard error of the mean, d.£.= degrees of freedom
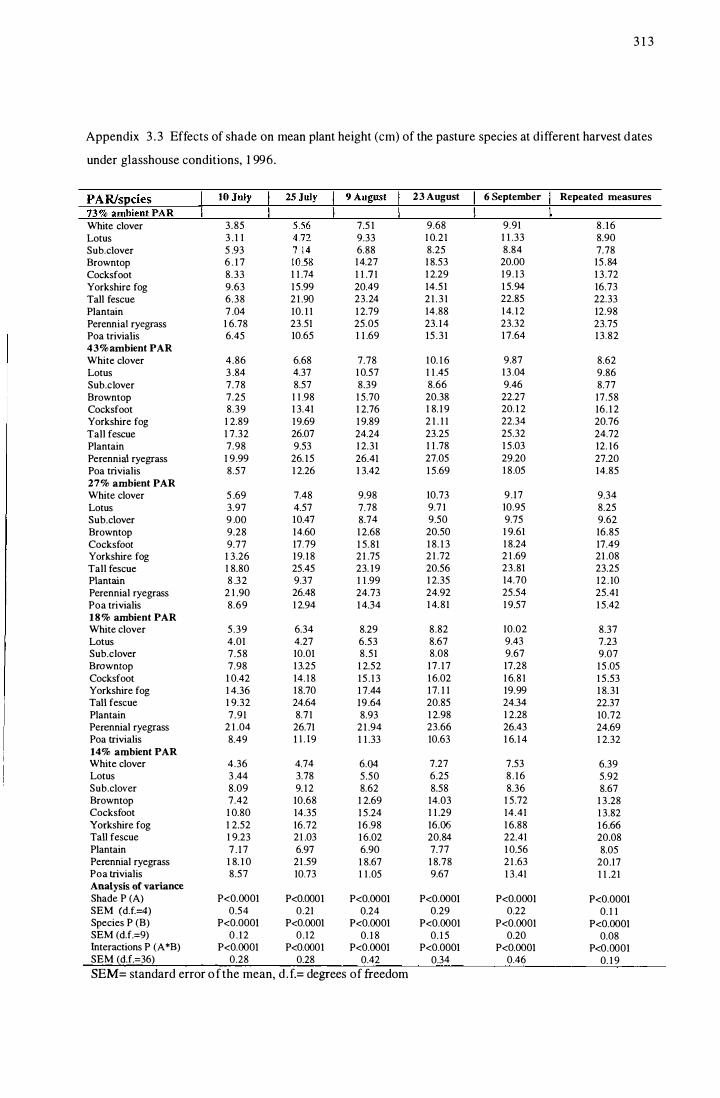
3 1 3
Appendix 3 . 3 Effects of shade on mean plant height (cm) of the pasture species at different harvest d ates
under glasshouse conditions, 1 996.
23 August 6 September Repeated measures
White clover 3.85 7.5 1 9.68 9.91 8 . 16 Lotus 3 . 1 1 9.33 1 0.21 1 1 .33 8.90 Sub.c1over 5 .93 6.88 8.25 8.84 7.78 Browntop 6 . 1 7 14.27 1 8.53 20.00 15 .84 Cocksfoot 8.33 1 1 .74 1 1.71 1 2.29 19 . 13 1 3.72 Yorkshire fog 9.63 15.99 20.49 14.51 1 5.94 16.73 Tall fescue 6.38 21 .90 23.24 21 .3 1 22.85 22.33 Plantain 7 .04 10. 1 1 1 2.79 14.88 14. 1 2 12.98 Perennial ryegrass 1 6.78 23.51 25.05 23. 14 23.32 23.75 Poa trivialis 6.45 10.65 1 1 .69 15 .31 17.64 13.82 43 % ambient PAR White clover 4.86 6.68 7.78 10. 1 6 9.87 8.62 Lotus 3 .84 4.37 1 0.57 1 1 .45 13 .04 9.86 Sub.c1over 7.78 8.57 8.39 8.66 9.46 8.77 Browntop 7.25 1 1 .98 1 5.70 20.38 22.27 17.58 Cocksfoot 8.39 1 3.41 1 2.76 1 8. 1 9 20. 1 2 16. 1 2 Yorkshire fog 1 2.89 19.69 1 9.89 2 1 . 1 1 22.34 20.76 Tall fescue 1 7.32 26.07 24.24 23.25 25.32 24.72 Plantain 7.98 9.53 1 2.31 1 1 .78 1 5.03 12. 16 Perennial ryegrass 1 9.99 26. 15 26.41 27.05 29.20 27.20 Poa tri vialis 8.57 1 2.26 1 3.42 1 5.69 1 8.05 14.85 27% ambient PAR White clover 5 .69 7.48 9.98 10.73 9.17 9.34 Lotus 3.97 4.57 7.78 9.7 1 10.95 8.25 Sub. clover 9 .00 10.47 8.74 9.50 9.75 9.62 Browntop 9.28 14.60 1 2.68 20.50 1 9.61 16.85 Cocksfoot 9.77 17.79 1 5.81 1 8. 1 3 1 8.24 17.49 Yorkshire fog 1 3.26 19. 18 2 1 .75 21 .72 2 1 .69 21 .08 Tall fescue 1 8.80 25.45 23. 19 20.56 23.81 23.25 Plantain 8 .32 9:37 1 1 .99 1 2.35 14.70 12 . 10 Perennial ryegrass 2 1 .90 26.48 24.73 24.92 25.54 25.41 Poa tri vialis 8.69 1 2.94 1 4.34 1 4.81 1 9.57 1 5.42 18% ambient PAR White clover 5.39 6.34 8.29 8.82 10.02 8.37 Lotus 4.01 4.27 6.53 8.67 9.43 7.23 Sub.clover 7.58 10.01 8.51 8.08 9.67 9.07 Browntop 7.98 13.25 1 2.52 17 . 17 17.28 15 .05 Cocksfoot 1 0.42 14.18 15 . 13 1 6.02 1 6.8 1 1 5.53 Yorkshire fog 1 4.36 18.70 1 7.44 17. 1 1 19.99 1 8.31 Tall fescue 1 9.32 24.64 19.64 20.85 24.34 22.37 Plantain 7.91 8.71 8.93 1 2.98 1 2.28 10.72 Perennial ryegrass 2 1 .04 26.71 2 1 .94 23.66 26.43 24.69 Poa trivialis 8.49 I U9 1 1 .33 10.63 1 6. 14 1 2.32 14% ambient PAR White clover 4.36 4.74 6.04 7.27 7.53 6.39 Lotus 3 .44 3.78 5.50 6.25 8 . 16 5.92 Sub.c1over 8.09 9. 12 8.62 8.58 8.36 8.67 Browntop 7.42 10.68 1 2.69 14.03 1 5.72 1 3 .28 Cocksfoot 1 0.80 14.35 1 5.24 1 1 .29 14.41 1 3.82 Yorkshire fog 1 2.52 16.72 16 .98 16.06 1 6.88 1 6.66 Tall fescue 1 9.23 21 .03 1 6.02 20.84 22.41 20.08 Plantain 7 . 17 6.97 6.90 7.77 1 0.56 8.05 Perennial ryegrass 1 8. 1 0 21 .59 1 8.67 1 8.78 21 .63 20.17 Poa trivialis 8.57 10.73 1 1 .05 9.67 1 3.41 1 1 .21 Analysis of variance Shade P (A) P<O.OOOI P<O.ooOI P<O.OOOI P<O.OOOI P<O.OOOI P<O.OOOI SEM (d.f.=4) 0.54 0.21 0.24 0.29 0.22 0. 1 1 Species P (B) P<O.OOOl P<O.OOOI P<O.OOOI P<O.OOOI P<O.OOOI P<O.OOOI SEM (dJ.=9) 0 . 12 0.12 0. 1 8 0. 1 5 0.20 0.08 Interactions P (A *B) P<O.OOOI P<O.OOOI P<O.OOOI P<O.OOOI P<O.OOOI P<O.ooOI SEM (dJ.=36) 0.28 0.28 0.42 0.34 0.46 0. 1 9 SEM= standard error o f the mean, d .f.= degrees of freedom

3 1 4
Appendix 3.4 Effects of shade o n mean leaf/petiole length (cm) o f the pasture species at different
harvest dates under glasshouse conditions, 1 996.
23 August 6 September Repeated measures
White clover 2.72 3.89 5.84 6 . 19 7.61 5 .88 Lotus 0.24 0.27 0.38 0.49 0.54 0.42 Sub.clover 3.92 4.93 4.72 5.21 7. 1 3 5.50 Browntop 5.42 8.69 1 1 .38 1 2.43 1 2.97 1 1 .37 Cocksfoot 6.32 8.92 1 1 .08 1 1 .77 1 3 .37 1 1 .28 Yorkshire fog 8.75 1 2.03 15.65 1 2.84 1 1 .80 1 3.08 Tall fescue 1 2.32 1 6.36 15.83 14.78 1 6.60 1 5.89 Plantain 6 . 1 0 8.38 10. 1 8 1 1 .67 1 1 .54 1 0.44 Perennial ryegrass 1 2.73 18 . 16 15.44 1 6.37 1 6.38 16.59 Poa trivialis 4.6 1 8.05 9.3 1 1 0.43 1 1 .28 9.77 43%ambient PAR White clover 3.33 4.41 4.98 7.05 7.96 6 . 1 0 Lotus 0.24 0.27 0.37 0.44 0.59 0.41 Sub. clover 4.49 5.65 4.42 6.08 7.65 5.90 Browntop 5.75 9.76 9.94 1 2. 8 1 1 3.28 1 1 .45 Cocksfoot 6.34 10.72 1 0.44 1 2.63 1 5 . 1 5 1 2.23 Yorkshire fog 8.80 1 1 .03 14.46 1 3.82 14.91 13 .56 Tall fescue 1 1 .73 18 . 17 15.22 1 5.03 1 8.05 1 6.61 Plantain 6.38 7.03 9.8 1 10.27 1 3.02 1 0.03 Perennial ryegrass 1 3.60 1 7.38 19.26 18 . 17 1 8.56 1 8.34 Poa trivialis 7.03 7 90 9.91 10.79 13 .07 1 0.42 27 % ambient PAR White clover 3 .46 4.04 5.51 6 . 1 2 7.1 8 5 .7 1 Lotus 0.23 0.23 0.32 0.38 0.50 0.36 Sub.clover 4.52 6.06 5.39 6 . 16 6.83 6. 1 1 Browntop 6.32 9.80 12.34 1 1 .2 1 14.51 1 1 .96 Cocksfoot 6.89 1 1 .60 10.41 1 1 .0 l 1 3.50 1 1 .63 Yorkshire fog 1 0.53 1 3 .65 15.00 1 3.52 1 5.53 14.42 Tall fescue 1 2.23 16.83 1 3 . 1 8 1 2.59 1 5.88 14.62 Plantain 5.57 7.80 8.71 9.68 1 1 .72 9.48 Perennial ryegrass 1 3.24 19.23 14.85 1 5.92 1 7 .90 16.97 Poa tri vialis 6.78 9.21 10.90 1 0.69 1 2.46 10.81 18% ambient PAR White clover 2.77 4.13 4.51 6.55 6.68 5.46 Lotus 0 . 1 5 0. 1 7 0.32 0.34 0.38 0.30 Sub.clover 4.83 5.50 5.66 5.92 6.7 1 5.95 Browntop 6.52 8.41 8.67 1 1 . 1 2 10. 1 0 9.57 Cocksfoot 7.58 9.93 9.72 1 0.55 1 3.45 1 0.91 Yorkshire fog J 1 .2 1 1 3.32 1 2.32 1 2.40 14.87 1 3.23 Tall fescue 14 .90 1 4.63 1 1 .07 14.14 1 5 .95 1 3 .95 Plantain 4.75 6 . 1 2 6.24 8.02 8.94 7.33 Perennial ryegrass 1 4 . 1 1 1 6.90 15.76 14.57 1 6.48 1 5 .93 Poa trivialis 6.80 8 . 10 8.86 9. 1 6 1 0.87 9.25 14% ambient PAR White clover 3 . 1 4 3.08 3.98 4.95 5.3 1 4.33 Lotus 0.3 1 0 . 10 0.22 0.29 0.29 0.22 Sub.clover 6 .1 1 4.79 6.34 6.02 5.50 5.66 Browntop 5.73 7.03 8.99 9.68 8 . 1 9 8.47 Cocksfoot 9 .25 9 .99 10.32 9.22 1 0.66 10.05 Yorkshire fog 1 0.04 9.61 1 0.94 7.78 1 2.85 1 0.30 Tall fescue 1 4.39 14.80 10.36 8.80 1 0.44 1 1 . \0 Plantain 4.66 5.61 6.27 6.64 6.58 6.28 Perennial ryegrass 1 4.68 1 2.84 14.97 9.70 1 3 .5 1 1 2.75 Poa tri vialis 7.28 7.76 8.52 7.01 8.79 8.02 Analysis of variance Shade P (A) P<O.OOOI P<O.OOOI P<O.OOOI P<O.OOOI P<O.OOOI P<O.OOOI SEM (d.f.=4) 0.08 0.1 2 0. 1 9 0. 1 7 0. 1 5 0.09 Species P (B) P<O.OOOI P<O.OOOI P<O.OOOl P<O.OOOl P<O.OOOI P<O.OOOI SEM (dJ.=9) 0 . 1 5 0.20 0.1 9 0.21 0 . 17 0 . 10 Interactions P (A*B) P<O.OOOI P<O.OOOI P<O.OOOI P<O.OOOI P<O.OOOI P<O.OOOI SEM (d.f.=36) 0.34 0.45 0.42 0.48 0.38 0.23
SEM= standard error of the mean, d.f.::: degrees of freedom

Appendix 7 . 1 a Percent mean botanical composition under different levels of shade at Aokautere, 25
M arch 1 997 to 24 November 1 99 7 .
3 1 5
% mean 25 March 24 April 28 May 28 October 24 November com�ition 1 997 1 997 1 997 1997 1 997
�if[� Ryegrass+wc
Grass 33 40 47 70 45 Legumes 34 29 1 7 20 33 Other 33 3 1 3 6 1 0 22
Y.fog+wc Grass 37 41 59 63 55 Legumes 34 26 1 6 23 1 6 Other 29 33 25 14 29
C.foot+wc Grass 47 55 62 68 67 Legumes 33 24 1 8 25 1 5 Other 20 21 20 7 1 8
C.foot+lotus Grass 5 1 54 66 65 63 Legumes 33 27 1 5 24 1 8 Other 1 6 1 9 1 9 I I 1 9
�.� Ryegrass+wc
Grass 3 5 3 7 54 63 43 Legumes 28 30 1 5 26 36 Other 37 33 3 1 1 1 21
Y.fog+wc Grass 38 43 48 56 60 Legumes 3 2 26 1 8 29 1 8 Other 30 3 1 34 1 5 22
C.foot+wc Grass 49 47 60 64 64 Legumes 29 27 1 6 29 1 8 Other 22 26 24 7 1 8
C.foot+lotus Grass 55 52 59 70 61 Legumes 28 27 1 9 22 1 8 Other 1 7 21 22 8 21
U��� Ryegrass+wc
Grass 36 42 52 62 41 Legumes 32 30 1 6 27 35 Other 3 2 28 3 2 1 24
Y.fog+wc Grass 5 3 46 56 6 1 50 Legumes 26 32 1 9 24 23 Other 2 1 22 25 1 5 27
C.foot+wc Grass 44 59 68 68 62 Legumes 27 2 1 1 4 23 12 Other 29 20 1 8 9 26
C.foot+lotus Grass 54 53 60 69 54 Legumes 23 28 1 5 24 22 Other 23 1 9 2 5 7 24
wc= whie clover, Y.fog=Yorkshire fog, C. foot::: coeksfoot

Appendix 7 . 1 b Percent mean botanical composition under different levels of shade at Aokautere, 23
December 1 997 to 28 May 1 998.
% mean 23 23 27 27 23 28 composition December January February March April May
1997 1 998 1998 1 998 1 998 1 998
�yy� Ryegrass+wc
Grass 41 35 55 32 40 45 Legumes 24 1 3 9 1 9 22 29 Weed 1 9 23 1 0 1 2 3 1 2 Dead materials 16 29 26 37 35 1 4
YJog+wc Grass 49 53 46 28 32 59 Legumes 1 5 9 9 9 1 2 1 3 Weed 12 7 3 4 6 4 Dead materials 24 3 1 42 59 50 24
C.foot+wc Grass 73 62 68 5 5 1 65 Legumes 8 7 2 3 4 3 Weed 2 8 2 2 2 3 Dead materials 1 7 23 28 44 43 29
C. foot+lotu5 Grass 67 65 65 56 57 7 1 Legumes 9 6 2 I 3 4 Weed 6 4 2 2 2 2 Dead materials 1 8 25 3 1 4 1 38 23
��llffi�� Ryegrass+wc
Grass 42 48 60 32 44 50 Legumes 23 1 9 6 1 5 I S 20 Weed 1 8 8 1 2 5 4 8 Dead materials 17 25 22 48 34 22
Y.fog+wc Grass 54 47 47 8 40 57 Legumes 24 1 8 7 33 1 0 9 Weed 2 7 6 4 3 4 Dead materials 20 28 42 55 47 3 0
C.foot+wc Grass 62 6 1 63 47 53 63 Legumes 16 1 3 3 4 4 4 Weed 2 3 2 2 1 1 Dead materials 20 23 32 47 42 3 2
C.foot+lotus Grass 64 6 1 60 47 52 5 8 Legumes 17 7 3 2 5 4 Weed 7 7 4 4 3 2 Dead materials 15 25 33 47 40 36
���� Ryegrass+wc
Grass 38 44 49 34 54 57 Legumes 37 23 17 1 3 20 20 Weed 7 4 4 1 6 2 3 Dead materials 1 8 29 30 37 24 20
YJog+wc Grass 62 42 38 24 42 65 Legumes 1 6 20 8 1 7 1 5 1 2 Weed 4 8 2 2 2 2 Dead materials 18 30 52 57 41 2 1
C.foot+wc Grass 59 60 59 46 54 62 Legumes 1 5 1 1 5 4 6 8 Weed 3 3 2 1 2 2 Dead materials 23 26 34 49 38 28
C.foot+Jotus Grass 59 52 50 40 49 65 Legumes 17 1 2 8 3 8 7 Weed 7 7 4 6 2 2 Dead materials 17 29 38 5 1 4 1 26
3 1 6

317
wc= whle clover, Y Jog=: Y orksbire fog, C . foot:: cocksfoot
Replication I Replication 11 Replication III Replication IV
2.5m prnning height
.t YW CW "" RW YW ""
4m "" "" "" "" ""
CW CL YW RW 2m "" ""
"" � � "" "" CL RW CW CL
"" "" "" "" ""
RW YW CL CW "" ""
"" "" ""
5.Om prnning height
"" RW CW "" CL RW "" "" ""
"" "" "" YW CL RW YW
"" "" "" "" ""
CL YW CW CL "" ""
"" "" "" CW RW YW CW
"" "" "" "" ""
7 .Om prnning height
"" CW RW "" CW CL "" "" ""
"" "" "" RW YW RW CW
"" "" "" "" ""
CL CW CL YW "" ""
"" "" "" YW CL YW RW
"" "" "" "" ""
Replication I Replication 11 Replication ill Replication IV
Appendix Figure 7.1 Lay out of the field experiment. RW = perennial ryegrass with white clover,
YW=Yorkshire fog with white clover, CW= cocksfoot with white clover, and
CL: cocksfoot with lotus.

3 1 8
BIOGRAPHY
I, Naba Raj Devkota was born in 19th August 1961 in Gorkha, Nepal. I studied I. Sc,
and B. Sc. Agriculture at Institute of Agriculture and Animal Sciences (IAAS),
Tribhuvan University (TU), Nepal from 1 98 1 to 1 986. I joined TUIIAAS in December
1 986 as an Assistant Lecturer and were involved in teaching undergraduate courses on
animal husbandry and fodder production and pasture management besides being
involved in related research. From 1 99 1 to 1993 I studied M. Sc. Agriculture
(Agricultural Systems) in Chiang Mai University, Thailand, for which I got a
scholarship from the Ford Foundation. I resumed my teaching and researching job at
TUIIAAS, department of Animal Nutrition and Pasture Production, Rampur, Nepal in
1 993 to the capacity of Lecturer and have been continuously associated with IAAS to
date. I worked as a Farm Superintendent at the IAAS Livestock Farm in 1 995. From
1 996 to 1 999/2000, I undertook a Ph.D program in Pastoral Science at Massey
University, with the support of a scholarship provided by the New Zealand Official
Development Assistance (NZODA). After completing my Ph.D studies, I will return to
Nepal and continue my teaching and researching job at TUIIAAS, Rampur.
![arXiv:1910.03676v1 [cs.CV] 8 Oct 2019 · arXiv:1910.03676v1 [cs.CV] 8 Oct 2019. Shade 1 Shade 2 Shade 3 Shade 4 Shade 5 Shade 6 1 0 Average Face per Shade Baseline VGG16 BR-Net VGG16](https://img.pdfslide.us/doc/110x75/5f06e0387e708231d41a2ca7/arxiv191003676v1-cscv-8-oct-2019-arxiv191003676v1-cscv-8-oct-2019-shade.jpg)