Embed Size (px)
Citation preview
Westbrook, G.K., Carson, B., Musgrave, R.J., et al., 1994Proceedings of the Ocean Drilling Program, Initial Reports, Vol. 146 (Part 1)
8. GROWTH OF ACCRETIONARY WEDGES OFF VANCOUVER ISLAND AND OREGON1
G.K. Westbrook2
ABSTRACT
A simple formulation for the growth of a wedge of constant taper accreting a sediment layer of given thickness and exponentialdecrease of porosity with depth was used to estimate the rates of growth of the accretionary wedges off Vancouver Island andOregon. Application to the section off Vancouver Island indicates that the accreted sediments penetrated at Site 889 were addedto the toe of the wedge between 0.8 and 1.1 Ma. Application to the Oregon section shows that the thickness of the accreted layerbefore 0.3 Ma must have been substantially less than the present 1.5 km for Pliocene sediments at Site 892. For both wedges theaccretion of a thick layer of sediment from the Cascadia Basin appears to have occurred over only the past few hundred thousandyears, and no more than about a million years. Since the Eocene, the equivalent average thickness of the layer of sediment thathas been accreted is about 0.5 km.
INTRODUCTION
For an interpretation of the results of drilling into the accretionarywedge, it is useful to be able to estimate when a sequence penetratedby a borehole in the accretionary wedge was actually accreted. Thetime taken to build the accretionary wedge is an important parameterin the analysis of the geologic evolution of the continental margin.
To provide a straightforward means of making a first-order estimateof these parameters, a simple model of a wedge that accretes a layerof sediment with a given thickness and porosity/depth function hasbeen developed. It is similar in its properties to other models developedfor the purpose of calculating mass flux into the wedge and fluid out-flow (e.g., Le Pichon et al., 1990; Bekins and Dreiss, 1992; Fergusonet al., 1993), but simpler and set up to provide values of quantities suchas the amount that the wedge grows forward for a given amount ofsubduction of oceanic lithosphere. The formulation was encoded as aMicrosoft Excel spreadsheet, using the Excel module Solver to find thevalues of variables in the equations. The derivation of the formulae isset out below.
WEDGE ADVANCE INTO SEDIMENT IN WHICHPOROSITY VARIES WITH DEPTH
Figure 1 shows a model for the growth of a wedge in which theporosity varies as a function of depth. The wedge grows forwarddistance XG during the period that the subducting plate moves distanceXs. The initial cross-sectional area of the sediment added to the wedgeis (XG + Xs)t, where t = the thickness of the accreted layer, w = thewidth of the wedge before the increment of growth, and α = the angleof taper of the wedge.
The cross-sectional area of sediment accreted to the wedge de-creases in response to porosity reduction produced by deeper burialbeneath the thickening wedge, as the wedge continues to grow.
Porosity as a function of depth is equal to
where Φo = porosity at the surface, and λ is the depth at which porosityis I/e times porosity at the surface.
Westbrook, G.K., Carson, B., Musgrave, R.J., et al, 1994. Proc. ODP, Init. Repts.,146 (Pt. 1): College Station, TX (Ocean Drilling Program).
2 School of Earth Sciences, University of Birmingham, Birmingham B15 2TT, UnitedKingdom.
Figure 1. Principal parameters for the growth of the accretionary wedge. Theinitial width is w. The angle of taper is α. The thickness of the accreted layeris t. The wedge grows outward a distance XG, for a distance of plateconvergence (subduction) Xs.
The volume of fluid per unit area, over the depth range Z to Z2,is equal to
Φo[c -λe λ
λ a λλ e λ - e
The volume of solid per unit area over the same depth range Z } toZ2 is equal to
-z, -
e λ - e λ
Relationship Between Forward Growth of Wedge,Subduction Rate, and Porosity Function
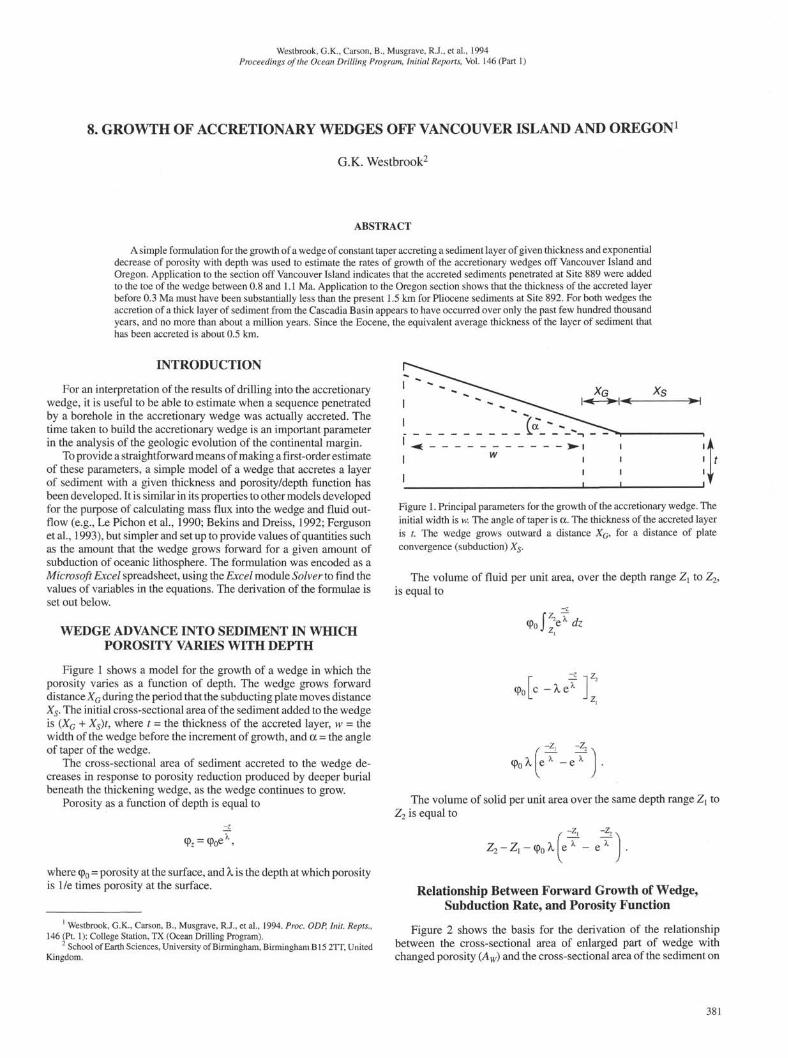
Figure 2 shows the basis for the derivation of the relationshipbetween the cross-sectional area of enlarged part of wedge withchanged porosity (Aw) and the cross-sectional area of the sediment on
381
G.K. WESTBROOK
the ocean floor moved into the wedge by subduction (As). Althoughthe cross-sectional areas are different, the solid portions of the cross-sectional areas (AWSolid and ASSotid) are equal.
t-t-(poλ[eλ- e
-t - [ (H• + x) tan a + I ]
dx
-t -I (w + x) tan α ]
J o
G(w + x) tan α - Φ o λ e λ 1 - e
x2 tan α . 7hwx tan α - x Φo λ e +
Jx
—.x tan a _
tan α) ( _ ) , p λ
Φ0 λ etan α
y 2G
Φo
tan α + w XG tan α - XG Φo λ e K +
tan α
- (f + H• tan α )
, λ
w,soiid = As,soiui =
1 - e
- Φo λ [I - e
Hence, the amount of subduction required to allow the wedge togrow forward by XG is determined from the following:
Xs =Xb 7— tan α + w XG tan α - XG Φo λ e Λ +
(1)
in Y2 P -(f
Φo X
G
e
tan α
•tanα) / -×ç 'an a
1 - e λt - 1-e
Original width of wedge
Cross-sectionalareaaddedfromlayer withno changein porosity
Cross-sectional areas ×^^A^contain same cross-sectional
area of solid but with different porosities
Figure 2. Illustration of the basis of the calculation for the amount that thewedge grows outward XG for a given amount of plate convergence Xs. Theshaded areas contain the same amount of solid material, but they have differentporosities because of their different depths and shapes. The white areas of thefigure have the same porosities as they did before new material was accreted.
the thickness of the accreted layer is small and the differences inporosities between the different functions have their greatest effect uponthe amount of solid material that is accreted. Using different porosityfunctions for the Cascadian accretionary wedges does not have a verygreat effect upon the amounts of growth, as will be shown below.
When it comes to predicting which parts of an accretionary wedgewere accreted at which time, it is then necessary to adopt a model forhow the sediment "flows" into the wedge as it is accreted. A simplemodel is one in which the accreted section is represented by a verticallysided block of sediment, the width of which decreases progressivelywith advance into the wedge in response to the increase in its heightand the decrease in its cross-sectional area from porosity reduction(Fig. 3). The effects of horizontal displacements produced by thrustsand folds, and the effects of greater compaction in the lower part of thewedge will in nature produce departures from this simple model. Theseare to some extent compensating effects. Thrusting moves componentsof the upper part of the wedge relatively seaward, and greater compac-tion of the lower part of the accreted section could, in some models(Bekins and Dreiss, 1992), reduce its rate of flow into the wedge, whichis also a relative seaward motion. The important point to be made isthat the simple model developed here should not be used in too detaileda manner. For example, the horizontal displacements on thrusts in thetoe of the wedge off Vancouver Island are about 1 km, which places alower limit on the resolution of the approach.
The derivation of the method for finding how far sediment movesinto the wedge during a given period of accretion follows.
The total solid mass added to the wedge is equal to
Up to this point in the derivation, no assumptions have been madeabout how the new sediment is added to the wedge or how the sedi-ment moves within the wedge. As long as the sediment is accreted ina self-similar manner from a layer of constant thickness, then therelationship between the amount of forward growth of the wedge andthe amount of plate convergence is given by the equation above. Anunderlying assumption in the derivation has been that the function ofporosity with depth is everywhere the same. It is a common observa-tion, however, that the toes of wedges are undercompacted relative tothe sedimentary section of the ocean floor, and that the most landwardsections of wedges are relatively overcompacted. The consequence ofthis would be that in very young wedges in which undercompactionpredominated, the amount of forward growth would be underestimated,and that in old overcompacted wedges the amount of forward growthwould be overestimated. This effect would be most prominent where
+ Xs)[t -
Figure 3. In a simple model of accretion, the cross-sectional area of newmaterial added to the toe of the wedge is spread over horizontal distance XA.

GROWTH OF ACCRETIONARY WEDGES
This new mass occupies the frontal part of the wedge over a distanceXA from the toe (Fig. 3). Its solid cross-section is equal to
J At + x tan α -
- (t + x tan a ) ,1 - e d*
xt + — tan a-x %λ +Φ 0 λ 2 e λ e
-r -xtan α
λ
tan α
= XA t + ~• tan α - XA <pQλ2
Φo λ 2 e :
tan α
-XA tan α
λ
Hence, the material at the toe of the wedge at the beginning of theaccretion increment will be XA back from the toe at the end of theaccretion increment.
More generally, the movement and change in volume of anysegment of the wedge can be tracked by solving for the width of thesegment while conserving the solid mass. The water lost from thesegment over any increment is the change in the total cross-sectionalarea of the segment.
For material added in one increment to the toe, we can findXA from
(2)
(XG + Xs) t-
XA t + — tan α - XA
2
Φo λ 2 e ;
tan α
The fluid lost in this increment is equal to
+ Xs)t-XAt-X2
A tan a
In the explanations of the general model for the growth of the wedgeand the more specific model for establishing the age of accretion ofelements of the accretionary wedge, given above, the newly accretedmaterial was shown as a simple vertically sided prism. This is not,however, a requirement of these models. The shape of the accretionsurface can take any form, as long as it does not change (Fig. 4). Inother words, the only requirement is that the mode of propagation ofthe wedge is self similar. So, different angles and shapes of accretion-ary faults or a ramp-flat geometry can all be accommodated, becausethey do not affect the cross-sectional area or the relative amounts ofsediment with different porosity added with each accretion increment.
APPLICATION TO THE VANCOUVER ISLANDMARGIN
Off Vancouver Island, the width of the accretionary wedge beneaththe continental slope and the outer part of the Tofino Basin, back tothe edge of the Crescent Terrane where the wedge is about 10 kmthick, is about 50 km (Hyndman et al., 1990). The thickness of thesediment on the ocean floor in front of the wedge is about 2.5 km,above the décollement that appears to lie just above the igneousoceanic crust. Virtually all of the incoming sediment is accreted to thetoe of the wedge. The overall angle of taper of the wedge is 8.5° (seeFig. 2 in "Introduction" chapter, this volume). The porosity-depthfunction used by Davis et al. (1990) in their analysis of compaction-
Figure 4. The shape of the accretionary surface (the interface between theaccretionary wedge and the incoming sediment) does not affect the model, aslong as the shape does not change with time. A. Possible variants to thegeometry of Figure 1. B. Variant of Figure 3. XA is independent of the shapeof the accreted material as long as its outer and inner surfaces are parallel.
Width of accretionary wedge (km)50 100
Figure 5. Graph illustrating the time taken to grow a wedge of given widthfrom layers of different thicknesses. The eight curves show times of growthfrom layers of 0.5 to 4.0 km thickness. The taper of the wedge is 8.5°, thesurface porosity is 0.6, and λ is 1.5. The rate of plate convergence is 42 km/m.y.
driven fluid outflow from the margin is of exponential form with asurface porosity of 0.6, and 1.5 km for the depth at which the porosityhas declined to 0.6/e. Using these parameters, the model predicts thatit only takes 2.4 m.y. to accrete the whole of the accretionary wedgeif the rate of subduction of the oceanic lithosphere is 42 km/m.y. (Fig.5). This is clearly not what has occurred, because of the Eocene ageof the sediments in the Tofino Basin overlying the landward end of
G.K. WESTBROOK
Shotpoints100 150 200 250 300 350 400 450 500 550 600 650
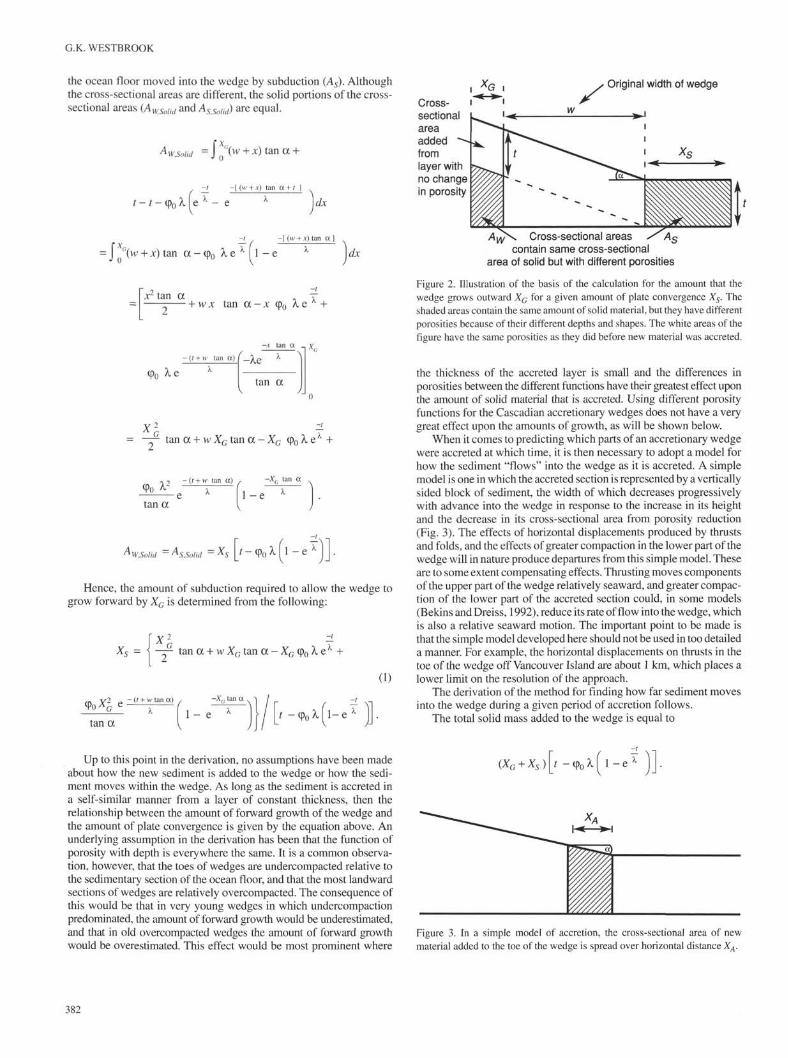
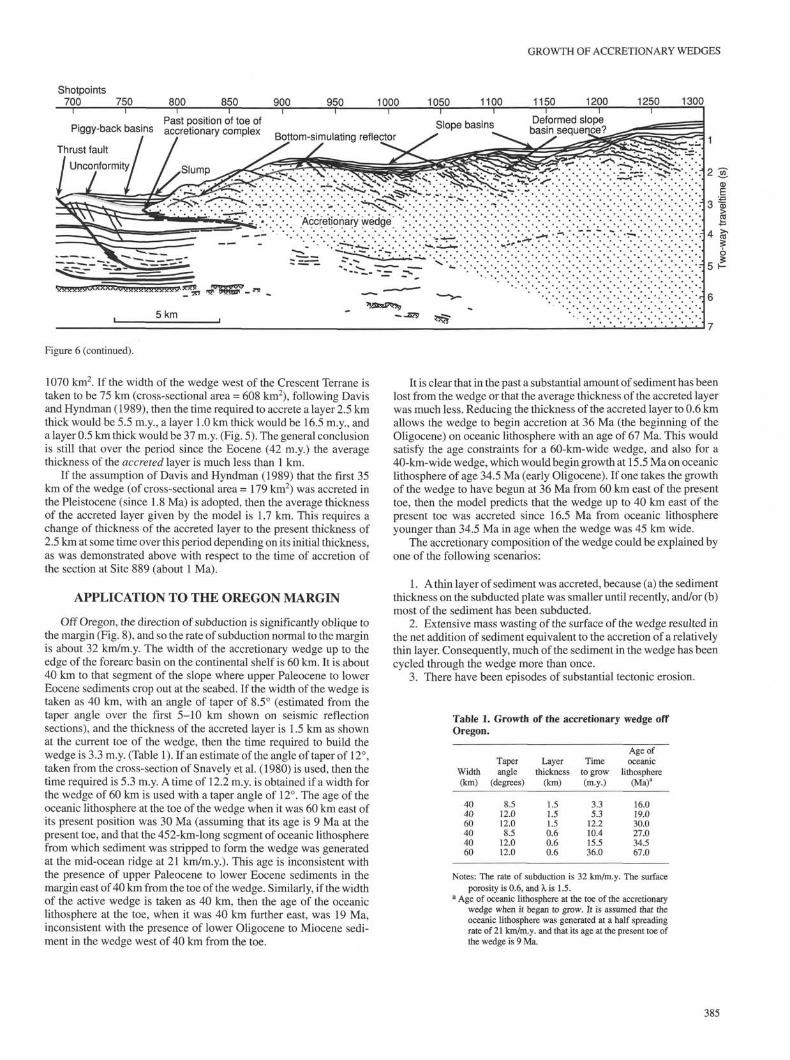
Figure 6. Interpretative line drawing of migrated seismic reflection section 89-04, on which Site 888 is situated. The first three thrust slices of the accretionarywedge are rooted in a décollement that lies only a little above the base of incoming sediment sequence in the Cascadia Basin. The wedge landward of thesefirst three thrust slices appears to have been accreted from above a shallower décollement, lying at a stratigraphic position close to the base of the well-layeredsequence in the first three thrust slices. The style of the older accreted section is one of the shorter wavelength, more intensely deformed structures. This isoverlain by a slope-cover sequence that is only mildly deformed.
the accretionary wedge. Even if one takes into account the sedimentthat is underplated beneath the Crescent Terrane, then it still requiresless than 5 m.y. to accrete all the sediment, and, by implication, theunderplated sediment was initially subducted beneath the toe of theaccretionary wedge. Using a different porosity-depth function for thewedge (by substituting different values of Φo and λ into the right sideof Eq. 2), in which the surface porosity is less and porosity decreasesmore rapidly with depth, makes little difference to the time requiredto build the wedge. A function with surface porosity of 0.5 and depthat which porosity is 0.5/e of 1.0 km only increases the time taken tobuild the wedge from 2.4 to 2.7 m.y.
It must be the case that in the past a thinner layer of sediment wasaccreted. Inspection of seismic reflection sections 89-04 and 89-08shows clear evidence of this. Landward of the point where the gradientof the continental slope becomes greater, the wavelengths of structuresin the wedge become much shorter, and undeformed reflectors can betraced up to 5 km beneath this more intensely deformed part of thewedge (Figs. 6-7). If an average thickness of 1 km is assumed for theaccreted layer, then a period of 7.1 m.y. is required to accrete the sedi-ment in the wedge (Fig. 5).
Site 889, situated on seismic reflection line 89-08, is about 24 kmfrom the deformation front. If it is assumed that a thickness of 2.50km of sediment has been accreted over the period since the accretedsediment at Site 889 was at the deformation front, then the length ofthat period is about 0.8 m.y. If the thickness of the accreted layer wasinitially 1.0 km and subsequently became 2.5 km, then the length ofthe period following the accretion of the sediment at Site 889 totalled1.05 m.y.: 0.76 m.y. when the layer was 1.0 km thick and 0.29 m.y.when the layer was 2.5 km thick.
Davis and Hyndman (1989) have also examined the budget ofaccreted sediment for the wedge off Vancouver Island. They showedthat the thickness of the layer of accreted sediment before the Pleis-tocene must have been much less than its present thickness. Theyconcluded, however, that all the wedge had been formed by accretionat the toe of the wedge and that the accreted layer was always verynearly the whole of the sedimentary section on the incoming plate.They derived an average thickness of 2.1 km for the layer accreted inthe Pleistocene by assuming that all the wedge seaward of a steepen-ing of the slope of the wedge about 35 km from the toe was accreted
in the Pleistocene, and they estimated an average thickness of 0.9 kmfor the layer accreted between the Eocene and the Pleistocene. Thisis apparently at variance with what is presented here, but there is onlyone major difference between the two approaches, which is in theinterpretation of how the sediment underlying the Tofino Basin andCrescent Terrane came to be emplaced. Davis and Hyndman (1989)stated that all the sediment was accreted at the toe of the wedge, butto get beneath the Crescent Terrane, the sediment must have "flowed"underneath by some unspecified mechanism, because it all lies land-ward of the Eocene deformation front and the overlying terrane iseffectively intact. Similarly, the sediment in the deeper part of thesection underneath the Tofino Basin west of the edge of the CrescentTerrane would also have had to "flow" under, following accretion atthe toe, as there is no mechanism to thicken the section without dis-turbing the overlying basin other than that of underplating (subcre-tion), which Davis and Hyndman exclude. In the analysis presentedhere, the width of the wedge is taken to the most landward portion ofthe wedge that can have grown by accretion at the toe of the wedgesince the Eocene (42 Ma), without invoking large-scale horizontalflow within the accretionary wedge. Consequently, the material be-neath the Crescent Terrane and the deeper part of the section beneaththe Tofino Basin is considered to have been subcreted.
The thicknesses of the accreted layer given by Davis and Hynd-man (1989) are also the total thicknesses of sediment on the incomingplate, whereas the thicknesses given here are strictly those of the layeraccreted at the toe of the wedge. The sediment beneath that layer istaken on the subducting oceanic lithosphere beneath the toe of theaccretionary wedge to be subcreted further back or subducted deeperinto the subduction zone. From the cross-sectional area of the morelandward parts of the accretionary wedge, it appears that most of it issubducted.
Other differences are also apparent between the parameters usedby Davis and Hyndman (1989) and those used in this analysis. Davisand Hyndman place the edge of the Crescent Terrane 75 km from thetoe of the wedge, whereas in this study the distance taken from thesection of Hyndman et al. (1990) is just over 50 km (see fig. 2 of the"Introduction" chapter and figs. 2 and 7 of Hyndman et al., both inthis volume). The total cross-sectional area of the wedge used byDavis and Hyndman, including that beneath the Crescent Terrane, is
384
GROWTH OF ACCRETIONARY WEDGES
Shotpoints700 750 800 850 900 950 1000 1050 1100 1150 1200 1250 1300
Past position of toe ofPiggy-back basins acçretionary complex
Thrust fault
/ Unconformity
L
Slope basins Deformed slopebasin sequence?
Figure 6 (continued).
1070 km2. If the width of the wedge west of the Crescent Terrane istaken to be 75 km (cross-sectional area = 608 km2), following Davisand Hyndman (1989), then the time required to accrete a layer 2.5 kmthick would be 5.5 m.y., a layer 1.0 km thick would be 16.5 m.y., anda layer 0.5 km thick would be 37 m.y. (Fig. 5). The general conclusionis still that over the period since the Eocene (42 m.y.) the averagethickness of the accreted layer is much less than 1 km.
If the assumption of Davis and Hyndman (1989) that the first 35km of the wedge (of cross-sectional area =179 km2) was accreted inthe Pleistocene (since 1.8 Ma) is adopted, then the average thicknessof the accreted layer given by the model is 1.7 km. This requires achange of thickness of the accreted layer to the present thickness of2.5 km at some time over this period depending on its initial thickness,as was demonstrated above with respect to the time of accretion ofthe section at Site 889 (about 1 Ma).
APPLICATION TO THE OREGON MARGIN
Off Oregon, the direction of subduction is significantly oblique tothe margin (Fig. 8), and so the rate of subduction normal to the marginis about 32 km/m.y. The width of the accretionary wedge up to theedge of the forearc basin on the continental shelf is 60 km. It is about40 km to that segment of the slope where upper Paleocene to lowerEocene sediments crop out at the seabed. If the width of the wedge istaken as 40 km, with an angle of taper of 8.5° (estimated from thetaper angle over the first 5-10 km shown on seismic reflectionsections), and the thickness of the accreted layer is 1.5 km as shownat the current toe of the wedge, then the time required to build thewedge is 3.3 m.y. (Table 1). If an estimate of the angle of taper of 12°,taken from the cross-section of Snavely et al. (1980) is used, then thetime required is 5.3 m.y. A time of 12.2 m.y. is obtained if a width forthe wedge of 60 km is used with a taper angle of 12°. The age of theoceanic lithosphere at the toe of the wedge when it was 60 km east ofits present position was 30 Ma (assuming that its age is 9 Ma at thepresent toe, and that the 452-km-long segment of oceanic lithospherefrom which sediment was stripped to form the wedge was generatedat the mid-ocean ridge at 21 km/m.y.). This age is inconsistent withthe presence of upper Paleocene to lower Eocene sediments in themargin east of 40 km from the toe of the wedge. Similarly, if the widthof the active wedge is taken as 40 km, then the age of the oceaniclithosphere at the toe, when it was 40 km further east, was 19 Ma,inconsistent with the presence of lower Oligocene to Miocene sedi-ment in the wedge west of 40 km from the toe.
It is clear that in the past a substantial amount of sediment has beenlost from the wedge or that the average thickness of the accreted layerwas much less. Reducing the thickness of the accreted layer to 0.6 kmallows the wedge to begin accretion at 36 Ma (the beginning of theOligocene) on oceanic lithosphere with an age of 67 Ma. This wouldsatisfy the age constraints for a 60-km-wide wedge, and also for a40-km-wide wedge, which would begin growth at 15.5 Ma on oceaniclithosphere of age 34.5 Ma (early Oligocene). If one takes the growthof the wedge to have begun at 36 Ma from 60 km east of the presenttoe, then the model predicts that the wedge up to 40 km east of thepresent toe was accreted since 16.5 Ma from oceanic lithosphereyounger than 34.5 Ma in age when the wedge was 45 km wide.
The accretionary composition of the wedge could be explained byone of the following scenarios:
1. A thin layer of sediment was accreted, because (a) the sedimentthickness on the subducted plate was smaller until recently, and/or (b)most of the sediment has been subducted.
2. Extensive mass wasting of the surface of the wedge resulted inthe net addition of sediment equivalent to the accretion of a relativelythin layer. Consequently, much of the sediment in the wedge has beencycled through the wedge more than once.
3. There have been episodes of substantial tectonic erosion.
Table 1. Growth of the accretionaryOregon.
Width(km)
404060404060
Taperangle
(degrees)
8.512.012.08.5
12.012.0
Layerthickness
(km)
1.51.51.50.60.60.6
Timeto grow(m.y.)
3.35.3
12.210.415.536.0
wedge off
Age ofoceanic
lithosphere(Ma)a
16.019.030.027.034.567.0
Notes: The rate of subduction is 32 km/m.y. The surfaceporosity is 0.6, and λ is 1.5.
a Age of oceanic lithosphere at the toe of the accretionarywedge when it began to grow. It is assumed that theoceanic lithosphere was generated at a half spreadingrate of 21 km/m.y. and that its age at the present toe ofthe wedge is 9 Ma.
385
G.K. WESTBROOK
Shotpoints 100 150 200 250 300 350 400 450 5000
.i 3
ro 4
§
5 kmBottom-simulating reflector
Igneous oceanic crust Past position of toe of accretionary complex
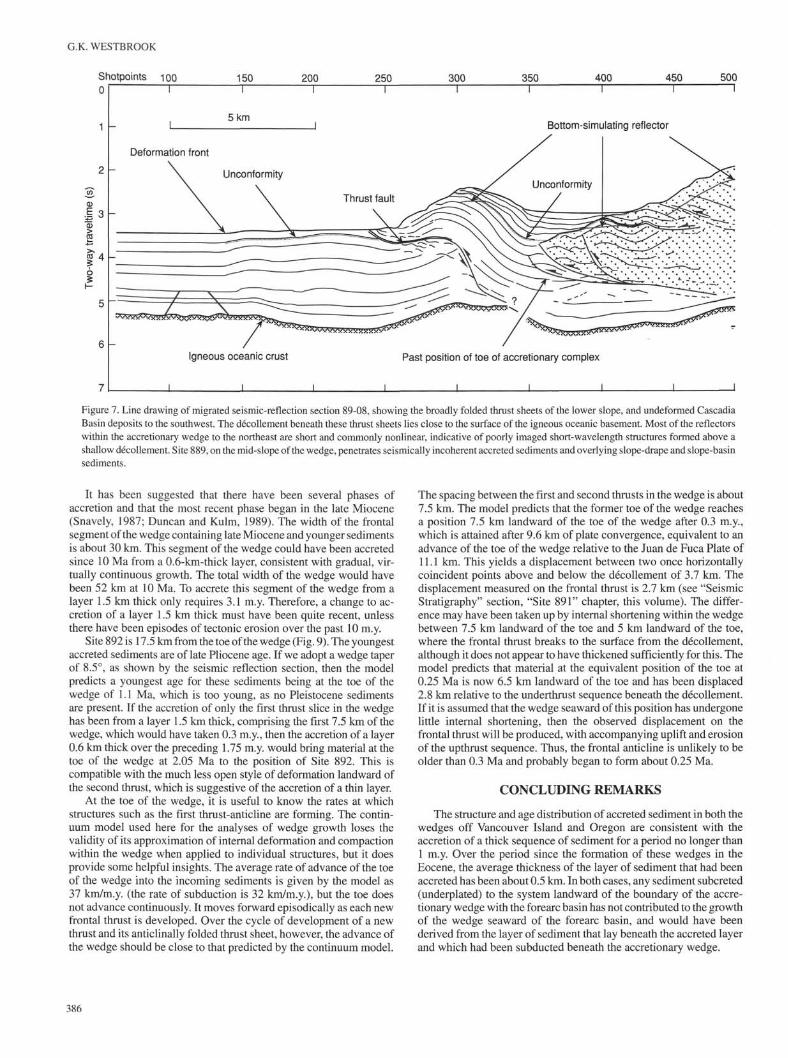
Figure 7. Line drawing of migrated seismic-reflection section 89-08, showing the broadly folded thrust sheets of the lower slope, and undeformed CascadiaBasin deposits to the southwest. The décollement beneath these thrust sheets lies close to the surface of the igneous oceanic basement. Most of the reflectorswithin the accretionary wedge to the northeast are short and commonly nonlinear, indicative of poorly imaged short-wavelength structures formed above ashallow décollement. Site 889, on the mid-slope of the wedge, penetrates seismically incoherent accreted sediments and overlying slope-drape and slope-basinsediments.
It has been suggested that there have been several phases ofaccretion and that the most recent phase began in the late Miocene(Snavely, 1987; Duncan and Kulm, 1989). The width of the frontalsegment of the wedge containing late Miocene and younger sedimentsis about 30 km. This segment of the wedge could have been accretedsince 10 Ma from a 0.6-km-thick layer, consistent with gradual, vir-tually continuous growth. The total width of the wedge would havebeen 52 km at 10 Ma. To accrete this segment of the wedge from alayer 1.5 km thick only requires 3.1 m.y. Therefore, a change to ac-cretion of a layer 1.5 km thick must have been quite recent, unlessthere have been episodes of tectonic erosion over the past 10 m.y.
Site 892 is 17.5 km from the toe of the wedge (Fig. 9). The youngestaccreted sediments are of late Pliocene age. If we adopt a wedge taperof 8.5°, as shown by the seismic reflection section, then the modelpredicts a youngest age for these sediments being at the toe of thewedge of 1.1 Ma, which is too young, as no Pleistocene sedimentsare present. If the accretion of only the first thrust slice in the wedgehas been from a layer 1.5 km thick, comprising the first 7.5 km of thewedge, which would have taken 0.3 m.y., then the accretion of a layer0.6 km thick over the preceding 1.75 m.y. would bring material at thetoe of the wedge at 2.05 Ma to the position of Site 892. This iscompatible with the much less open style of deformation landward ofthe second thrust, which is suggestive of the accretion of a thin layer.
At the toe of the wedge, it is useful to know the rates at whichstructures such as the first thrust-anticline are forming. The contin-uum model used here for the analyses of wedge growth loses thevalidity of its approximation of internal deformation and compactionwithin the wedge when applied to individual structures, but it doesprovide some helpful insights. The average rate of advance of the toeof the wedge into the incoming sediments is given by the model as37 km/m.y. (the rate of subduction is 32 km/m.y.), but the toe doesnot advance continuously. It moves forward episodically as each newfrontal thrust is developed. Over the cycle of development of a newthrust and its anticlinally folded thrust sheet, however, the advance ofthe wedge should be close to that predicted by the continuum model.
The spacing between the first and second thrusts in the wedge is about7.5 km. The model predicts that the former toe of the wedge reachesa position 7.5 km landward of the toe of the wedge after 0.3 m.y.,which is attained after 9.6 km of plate convergence, equivalent to anadvance of the toe of the wedge relative to the Juan de Fuca Plate of11.1 km. This yields a displacement between two once horizontallycoincident points above and below the décollement of 3.7 km. Thedisplacement measured on the frontal thrust is 2.7 km (see "SeismicStratigraphy" section, "Site 891" chapter, this volume). The differ-ence may have been taken up by internal shortening within the wedgebetween 7.5 km landward of the toe and 5 km landward of the toe,where the frontal thrust breaks to the surface from the décollement,although it does not appear to have thickened sufficiently for this. Themodel predicts that material at the equivalent position of the toe at0.25 Ma is now 6.5 km landward of the toe and has been displaced2.8 km relative to the underthrust sequence beneath the décollement.If it is assumed that the wedge seaward of this position has undergonelittle internal shortening, then the observed displacement on thefrontal thrust will be produced, with accompanying uplift and erosionof the upthrust sequence. Thus, the frontal anticline is unlikely to beolder than 0.3 Ma and probably began to form about 0.25 Ma.
CONCLUDING REMARKS
The structure and age distribution of accreted sediment in both thewedges off Vancouver Island and Oregon are consistent with theaccretion of a thick sequence of sediment for a period no longer than1 m.y. Over the period since the formation of these wedges in theEocene, the average thickness of the layer of sediment that had beenaccreted has been about 0.5 km. In both cases, any sediment subcreted(underplated) to the system landward of the boundary of the accre-tionary wedge with the forearc basin has not contributed to the growthof the wedge seaward of the forearc basin, and would have beenderived from the layer of sediment that lay beneath the accreted layerand which had been subducted beneath the accretionary wedge.
386

GROWTH OF ACCRETIONARY WEDGES
500 550 600 650 700 750 800 850 900 950
Site 889
I I
Slope drape and basins
•." ." ." •." •." •." ." •.' •." ." .' . Accretionary wedge
I l" I I I I
CD
3.1
4 |
i
Figure 7 (continued).
50°N
130°W 128° 126° 124°
Figure 8. Location map of the Cascadia Margin, showing the convergent platemotion, major physiographic features in the Cascadia Basin (overlying the Juande Fuca Plate), the position of the continental margin, and the positions ofdrilling sites off Vancouver Island and Oregon.
REFERENCES*
Bekins, B.A., and Dreiss, SJ., 1992. A simplified analysis of parameterscontrolling dewatering in accretionary prisms. Earth Planet. Sci. Lett.,109:275-287.
Davis, E.E., and Hyndman, R.D., 1989. Accretion and recent deformation ofsediments along the northern Cascadia subduction zone. Geol. Soc. Am.Bull., 101:1465-1480.
Davis, E.E., Hyndman, R.D., and Villinger, H., 1990. Rates of fluid expulsionacross the northern Cascadia accretionary prism: constraints from new heatflow and multichannel seismic reflection data. J. Geophys. Res., 95:8869-
Duncan, R.A., and Kulm, L.D., 1989. Plate tectonic evolution of the Cascadesarc-subduction complex. In Winterer, E.L., Hussong, D.M., and Decker,R.W. (Eds.), The Eastern Pacific Ocean and Hawaii. Geol. Soc. Am.,413-438.
Ferguson, I.J., Westbrook, G.K., Langseth, M.G., and Thomas, G.P., 1993.Heat flow and thermal models of the Barbados Ridge accretionary com-plex. J. Geophys. Res., 98:4121—4142.
Hyndman, R.D., Yorath, C.J., Clowes, R.M., and Davis, E.E., 1990. Thenorthern Cascadia subduction at Vancouver Island: seismic structure andtectonic history. Can. J. Earth Sci., 27:313-319.
Le Pichon, X., Henry, P., and Lallement, S., 1990. Water flow in the Barbadosaccretionary complex. J. Geophys. Res., 95:8945-8967.
Snavely, P.D., Jr., 1987. Tertiary geologic framework, neotectonics, and petro-leum potential of the Oregon-Washington continental margin. In Scholl,D.W., Grantz, A., and Vedder, J.G. (Eds.), Geology and Resource Potentialof the Continental Margin of Western North America and Adjacent OceanBasins—Beaufort Sea to Baja California. Circum-Pac. Counc. EnergyMineral Resour., 305-336.
Snavely, P.D., Jr., Wagner, H.C., and Lander, D.L., 1980. Geologic crosssection of the central Oregon continental margin. Geol. Soc. Am., Map andChart Sen, MC-28J.
*Abbreviations for names of organizations and publication titles in ODP reference listsfollow the style given in Chemical Abstracts Service Source Index (published byAmerican Chemical Society).
Ms 146IR-011
387

G.K. WESTBROOK
100 200 300 400 500Shotpoints
600 700 800 900 1000 1100 1200 1300
α.α>Q
5 kmSite 891projected
fromProtothrust zone south
Frontal thrust
Backthrust
BSR Bioherm ^ Site 892
Accreted sediments ofthe second ridge
Igneous oceaniccrust
^ rasjsδsç^ Décollement
WWW
Figure 9. Depth-converted migrated seismic-reflection section OR-9, showing flat-lying Cascadia Basin deposits (shotpoints 43-150), the proto-deformationzone characterized by blind thrusts (shotpoints 150-400), the ridge of the lower slope underlain by a seaward-verging thrust fault (shotpoints 400-600), andthe second ridge (shotpoints 725-1355). The position of Site 892 is indicated. The structural position of Site 891 has been projected from the actual drillinglocation, 3 km to the south.