Embed Size (px)
Citation preview
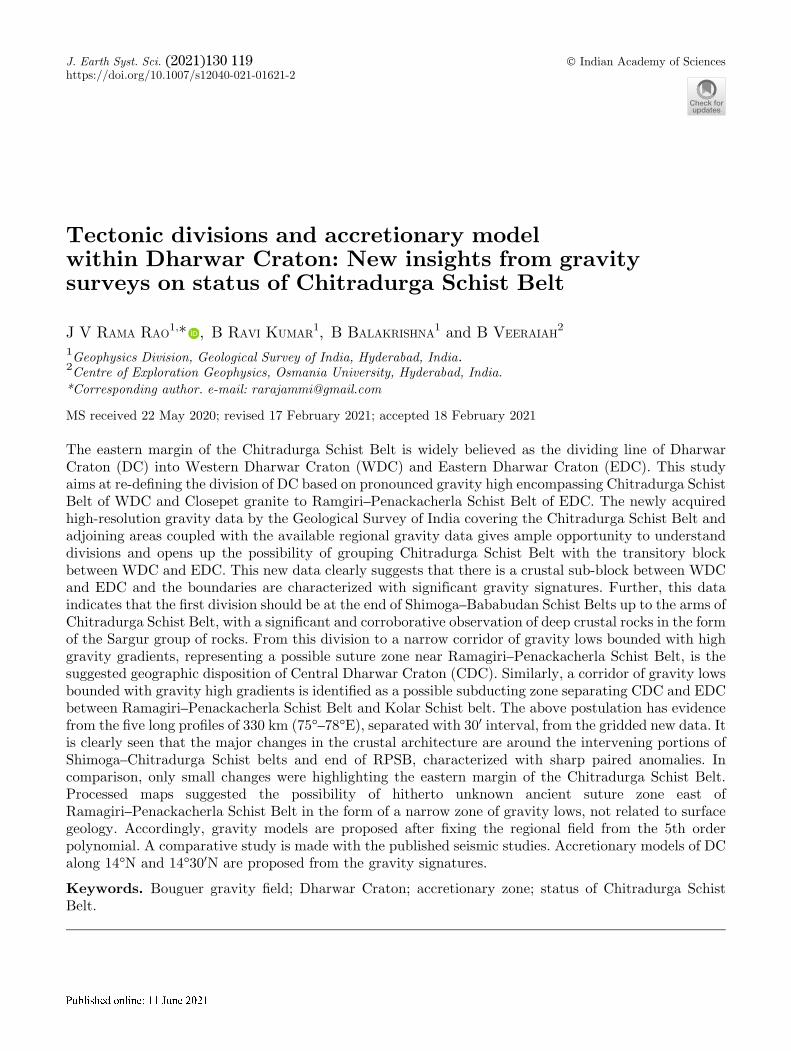
Tectonic divisions and accretionary modelwithin Dharwar Craton: New insights from gravitysurveys on status of Chitradurga Schist Belt
J V RAMA RAO1,* , B RAVI KUMAR
1, B BALAKRISHNA1 and B VEERAIAH
2
1Geophysics Division, Geological Survey of India, Hyderabad, India.2Centre of Exploration Geophysics, Osmania University, Hyderabad, India.*Corresponding author. e-mail: [email protected]
MS received 22 May 2020; revised 17 February 2021; accepted 18 February 2021
The eastern margin of the Chitradurga Schist Belt is widely believed as the dividing line of DharwarCraton (DC) into Western Dharwar Craton (WDC) and Eastern Dharwar Craton (EDC). This studyaims at re-deBning the division of DC based on pronounced gravity high encompassing Chitradurga SchistBelt of WDC and Closepet granite to Ramgiri–Penackacherla Schist Belt of EDC. The newly acquiredhigh-resolution gravity data by the Geological Survey of India covering the Chitradurga Schist Belt andadjoining areas coupled with the available regional gravity data gives ample opportunity to understanddivisions and opens up the possibility of grouping Chitradurga Schist Belt with the transitory blockbetween WDC and EDC. This new data clearly suggests that there is a crustal sub-block between WDCand EDC and the boundaries are characterized with significant gravity signatures. Further, this dataindicates that the Brst division should be at the end of Shimoga–Bababudan Schist Belts up to the arms ofChitradurga Schist Belt, with a significant and corroborative observation of deep crustal rocks in the formof the Sargur group of rocks. From this division to a narrow corridor of gravity lows bounded with highgravity gradients, representing a possible suture zone near Ramagiri–Penackacherla Schist Belt, is thesuggested geographic disposition of Central Dharwar Craton (CDC). Similarly, a corridor of gravity lowsbounded with gravity high gradients is identiBed as a possible subducting zone separating CDC and EDCbetween Ramagiri–Penackacherla Schist Belt and Kolar Schist belt. The above postulation has evidencefrom the Bve long proBles of 330 km (75�–78�E), separated with 300 interval, from the gridded new data. Itis clearly seen that the major changes in the crustal architecture are around the intervening portions ofShimoga–Chitradurga Schist belts and end of RPSB, characterized with sharp paired anomalies. Incomparison, only small changes were highlighting the eastern margin of the Chitradurga Schist Belt.Processed maps suggested the possibility of hitherto unknown ancient suture zone east ofRamagiri–Penackacherla Schist Belt in the form of a narrow zone of gravity lows, not related to surfacegeology. Accordingly, gravity models are proposed after Bxing the regional Beld from the 5th orderpolynomial. A comparative study is made with the published seismic studies. Accretionary models of DCalong 14�N and 14�300N are proposed from the gravity signatures.
Keywords. Bouguer gravity Beld; Dharwar Craton; accretionary zone; status of Chitradurga SchistBelt.
J. Earth Syst. Sci. (2021) 130:119 � Indian Academy of Scienceshttps://doi.org/10.1007/s12040-021-01621-2 (0123456789().,-volV)(0123456789().,-volV)
1. Introduction
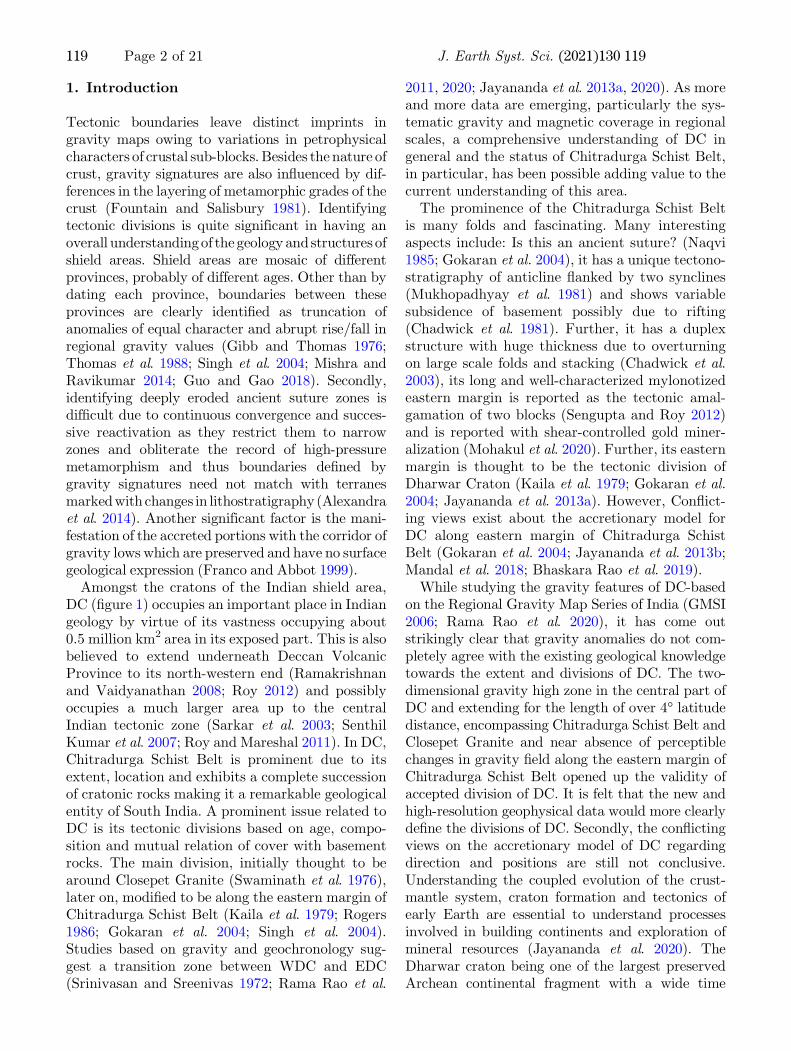
Tectonic boundaries leave distinct imprints ingravity maps owing to variations in petrophysicalcharacters of crustal sub-blocks.Besides thenature ofcrust, gravity signatures are also inCuenced by dif-ferences in the layering of metamorphic grades of thecrust (Fountain and Salisbury 1981). Identifyingtectonic divisions is quite significant in having anoverall understandingof thegeology andstructures ofshield areas. Shield areas are mosaic of differentprovinces, probably of different ages. Other than bydating each province, boundaries between theseprovinces are clearly identiBed as truncation ofanomalies of equal character and abrupt rise/fall inregional gravity values (Gibb and Thomas 1976;Thomas et al. 1988; Singh et al. 2004; Mishra andRavikumar 2014; Guo and Gao 2018). Secondly,identifying deeply eroded ancient suture zones isdifBcult due to continuous convergence and succes-sive reactivation as they restrict them to narrowzones and obliterate the record of high-pressuremetamorphism and thus boundaries deBned bygravity signatures need not match with terranesmarkedwith changes in lithostratigraphy(Alexandraet al. 2014). Another significant factor is the mani-festation of the accreted portions with the corridor ofgravity lows which are preserved and have no surfacegeological expression (Franco and Abbot 1999).Amongst the cratons of the Indian shield area,
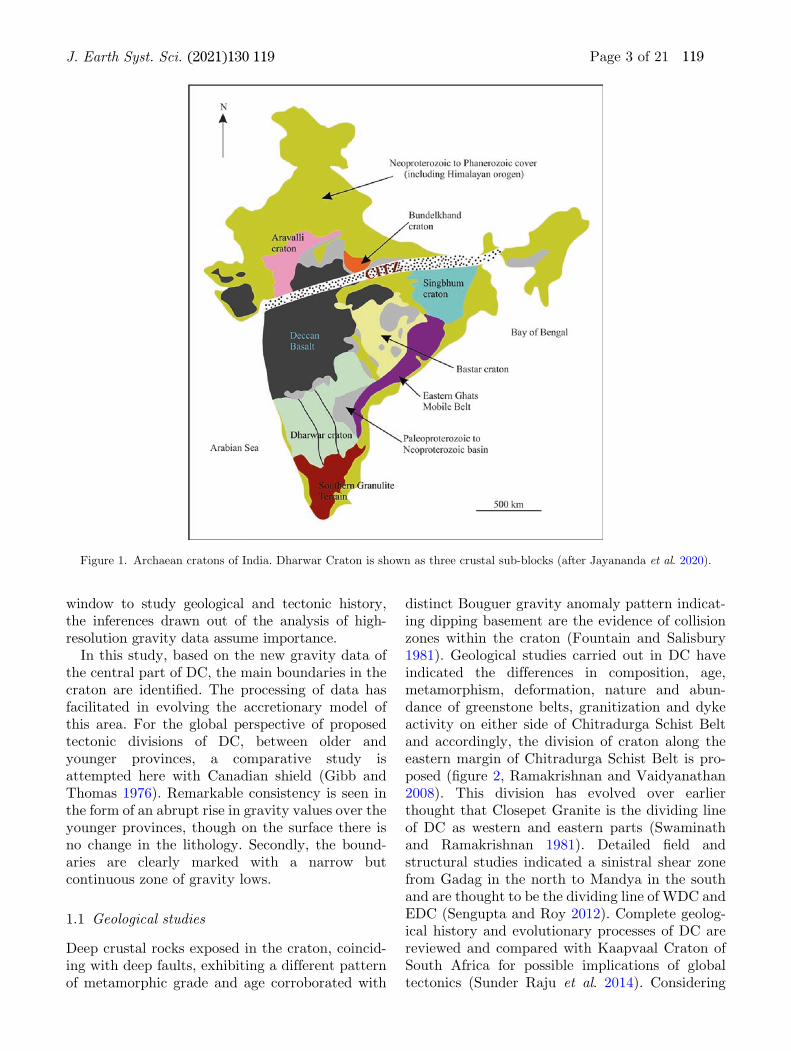
DC (Bgure 1) occupies an important place in Indiangeology by virtue of its vastness occupying about0.5 million km2 area in its exposed part. This is alsobelieved to extend underneath Deccan VolcanicProvince to its north-western end (Ramakrishnanand Vaidyanathan 2008; Roy 2012) and possiblyoccupies a much larger area up to the centralIndian tectonic zone (Sarkar et al. 2003; SenthilKumar et al. 2007; Roy and Mareshal 2011). In DC,Chitradurga Schist Belt is prominent due to itsextent, location and exhibits a complete successionof cratonic rocks making it a remarkable geologicalentity of South India. A prominent issue related toDC is its tectonic divisions based on age, compo-sition and mutual relation of cover with basementrocks. The main division, initially thought to bearound Closepet Granite (Swaminath et al. 1976),later on, modiBed to be along the eastern margin ofChitradurga Schist Belt (Kaila et al. 1979; Rogers1986; Gokaran et al. 2004; Singh et al. 2004).Studies based on gravity and geochronology sug-gest a transition zone between WDC and EDC(Srinivasan and Sreenivas 1972; Rama Rao et al.
2011, 2020; Jayananda et al. 2013a, 2020). As moreand more data are emerging, particularly the sys-tematic gravity and magnetic coverage in regionalscales, a comprehensive understanding of DC ingeneral and the status of Chitradurga Schist Belt,in particular, has been possible adding value to thecurrent understanding of this area.The prominence of the Chitradurga Schist Belt
is many folds and fascinating. Many interestingaspects include: Is this an ancient suture? (Naqvi1985; Gokaran et al. 2004), it has a unique tectono-stratigraphy of anticline Canked by two synclines(Mukhopadhyay et al. 1981) and shows variablesubsidence of basement possibly due to rifting(Chadwick et al. 1981). Further, it has a duplexstructure with huge thickness due to overturningon large scale folds and stacking (Chadwick et al.2003), its long and well-characterized mylonotizedeastern margin is reported as the tectonic amal-gamation of two blocks (Sengupta and Roy 2012)and is reported with shear-controlled gold miner-alization (Mohakul et al. 2020). Further, its easternmargin is thought to be the tectonic division ofDharwar Craton (Kaila et al. 1979; Gokaran et al.2004; Jayananda et al. 2013a). However, ConCict-ing views exist about the accretionary model forDC along eastern margin of Chitradurga SchistBelt (Gokaran et al. 2004; Jayananda et al. 2013b;Mandal et al. 2018; Bhaskara Rao et al. 2019).While studying the gravity features of DC-based
on the Regional Gravity Map Series of India (GMSI2006; Rama Rao et al. 2020), it has come outstrikingly clear that gravity anomalies do not com-pletely agree with the existing geological knowledgetowards the extent and divisions of DC. The two-dimensional gravity high zone in the central part ofDC and extending for the length of over 4� latitudedistance, encompassing Chitradurga Schist Belt andClosepet Granite and near absence of perceptiblechanges in gravity Beld along the eastern margin ofChitradurga Schist Belt opened up the validity ofaccepted division of DC. It is felt that the new andhigh-resolution geophysical data would more clearlydeBne the divisions of DC. Secondly, the conCictingviews on the accretionary model of DC regardingdirection and positions are still not conclusive.Understanding the coupled evolution of the crust-mantle system, craton formation and tectonics ofearly Earth are essential to understand processesinvolved in building continents and exploration ofmineral resources (Jayananda et al. 2020). TheDharwar craton being one of the largest preservedArchean continental fragment with a wide time
119 Page 2 of 21 J. Earth Syst. Sci. (2021) 130:119
window to study geological and tectonic history,the inferences drawn out of the analysis of high-resolution gravity data assume importance.In this study, based on the new gravity data of
the central part of DC, the main boundaries in thecraton are identiBed. The processing of data hasfacilitated in evolving the accretionary model ofthis area. For the global perspective of proposedtectonic divisions of DC, between older andyounger provinces, a comparative study isattempted here with Canadian shield (Gibb andThomas 1976). Remarkable consistency is seen inthe form of an abrupt rise in gravity values over theyounger provinces, though on the surface there isno change in the lithology. Secondly, the bound-aries are clearly marked with a narrow butcontinuous zone of gravity lows.
1.1 Geological studies
Deep crustal rocks exposed in the craton, coincid-ing with deep faults, exhibiting a different patternof metamorphic grade and age corroborated with
distinct Bouguer gravity anomaly pattern indicat-ing dipping basement are the evidence of collisionzones within the craton (Fountain and Salisbury1981). Geological studies carried out in DC haveindicated the differences in composition, age,metamorphism, deformation, nature and abun-dance of greenstone belts, granitization and dykeactivity on either side of Chitradurga Schist Beltand accordingly, the division of craton along theeastern margin of Chitradurga Schist Belt is pro-posed (Bgure 2, Ramakrishnan and Vaidyanathan2008). This division has evolved over earlierthought that Closepet Granite is the dividing lineof DC as western and eastern parts (Swaminathand Ramakrishnan 1981). Detailed Beld andstructural studies indicated a sinistral shear zonefrom Gadag in the north to Mandya in the southand are thought to be the dividing line of WDC andEDC (Sengupta and Roy 2012). Complete geolog-ical history and evolutionary processes of DC arereviewed and compared with Kaapvaal Craton ofSouth Africa for possible implications of globaltectonics (Sunder Raju et al. 2014). Considering
Figure 1. Archaean cratons of India. Dharwar Craton is shown as three crustal sub-blocks (after Jayananda et al. 2020).
J. Earth Syst. Sci. (2021) 130:119 Page 3 of 21 119

the geochronological data of U–Pb zircon ages andNd isotope and regional metamorphism, thesedivisions are further improved from the two crustalblocks to three provinces; Western Dharwar Cra-ton (WDC) with dominant old crust (3.4–3.2 Ga),Central Dharwar Craton with both old andyounger crust (3.4–3.2 Ga and 2.56–2.52 Ga) andEastern Dharwar Craton (EDC) with mainlyyounger crust (2.7–2.52 Ga) (Jayananda et al.2013a). The emphasis is still on the steep shearzone along the eastern margin of the ChitradurgaSchist Belt as the boundary between WDC and
CDC (Chardon et al. 2008; Jayananda et al.2013a). Two major episodes of crustal accretionduring 3.45–3.17 Ga and 2.7–2.5 Ga are postulatedin DC based on recent data on geology and agerelationships (Bhaskara Rao et al. 2019). On theother hand, detailed geological and structuralstudies in the southern part of the ChitradurgaSchist Belt indicated that volcanic and sedimen-tary rocks show characteristics of a narrow basin inthe failed rift zone rather than an accretionaryprism evolving during the subduction process(Sreehari and Toyoshima 2020).
Figure 2. Regional geological map of central part of Dharwar Craton showing the major geological domains and the majortectonic division as Chitradurga Shear Zone at the eastern contact of Chitradurga Schist Belt (Jayananda et al. 2013a). For thepurpose of comparative studies, the chosen seismic sections, cutting across the Dharwar Craton, through Chitradurga Schist Beltare shown.
119 Page 4 of 21 J. Earth Syst. Sci. (2021) 130:119
1.2 Geophysical studies
The geophysical studies carried out so far aremainly two-fold: (a) regional assessment of DC andChitradurga Schist Belt; its evolution and struc-tural aspects, the nature of the crust and thecomposition of crustal rocks; (b) area-speciBcdetailed geophysical surveys to aid the overallmineral exploration in this potentially mineralizedbelt (Ramachandran et al. 1997, 2000; Rama Raoet al. 2015).Systematic geophysical mapping, particularly
with potential methods like, airborne magneticsurveys, airborne-radiometric surveys, surfacegravity and magnetic surveys have great utility ingeological and structural mapping. These surveysbeing two-dimensional, eAectively bring out thefeatures both laterally and in the third dimension.Besides, the regional geological and structuralinferences reCecting the surface features, gravityanomalies play a vital role in delineating the col-lision tectonics (Gibb and Thomas 1976; Kaila andBhatia 1981; Subrahmanyam and Verma 1982;Cordell and Grauch 1985; Thomas et al. 1988;Krogstad et al. 1989; Anand and Rajaram 2002;Singh et al. 2004; Shandini and Tadjou 2010; Mis-hra and Ravikumar 2014). With the advent of highprecision equipment, the ability to record smallorder anomalies, which have a direct bearing onmapping the surface and near-surface geologicaldomains, has been possible (Rama Rao et al.2013, 2015). Secondly, there is marked improve-ment in data processing techniques which can givemeaningful inferences. Without downgrading theimportance of line based geophysical data genera-tion particularly the seismic methods, it is a knownfact that gravity and magnetic surveys beingpotential methods occupy prominence in thegeological and structural mapping (Whitaker 1994).Deep seismic studies have established two faults
on either side of the Chitradurga Schist Belt; thewestern contact as a deep fault and the easterncontact indicating of low-angle reverse fault allalong the eastern margin of schist belt, triggeringthe re-classiBcation of a division of DC (Kaila et al.1979, 1992; Gibbs 1986). The division of DC alongChitradurga Shear Zone is also inferred fromcharacteristic aeromagnetic signatures (Anand andRajaram 2002; Rajaram and Anand 2014). Recentseismic studies across Chitradurga Schist Belt fromChikmagalur in WDC to Perur in EDC haveindicated the difference in reCectivity patterns inWDC to EDC and the collision boundary to be
under Closepet Granite (Mandal et al. 2018). Theseseismic studies and the other regional geophysicalapproach so far have taken the view that theeastern margin of Chitradurga Schist Belt is themajor tectonic division of the DC. However, someconCicting views were expressed based on Poisson’sratio variations deduced from broadband seismicstudies, suggesting gradational transformationfrom thicker crust beneath WDC to relativelythinner crust beneath EDC, with the transitionfrom Chitradurga Shear Zone to Closepet Granite(Gupta et al. 2003; Sarkar et al. 2003). Geo-electricstudies have more or less gone along the lines ofseismic studies, identifying Archaean age suturealong Chitradurga Shear Zone being the dividingline of DC (Gokaran et al. 2004).The eastern margin of the Chitradurga Schist
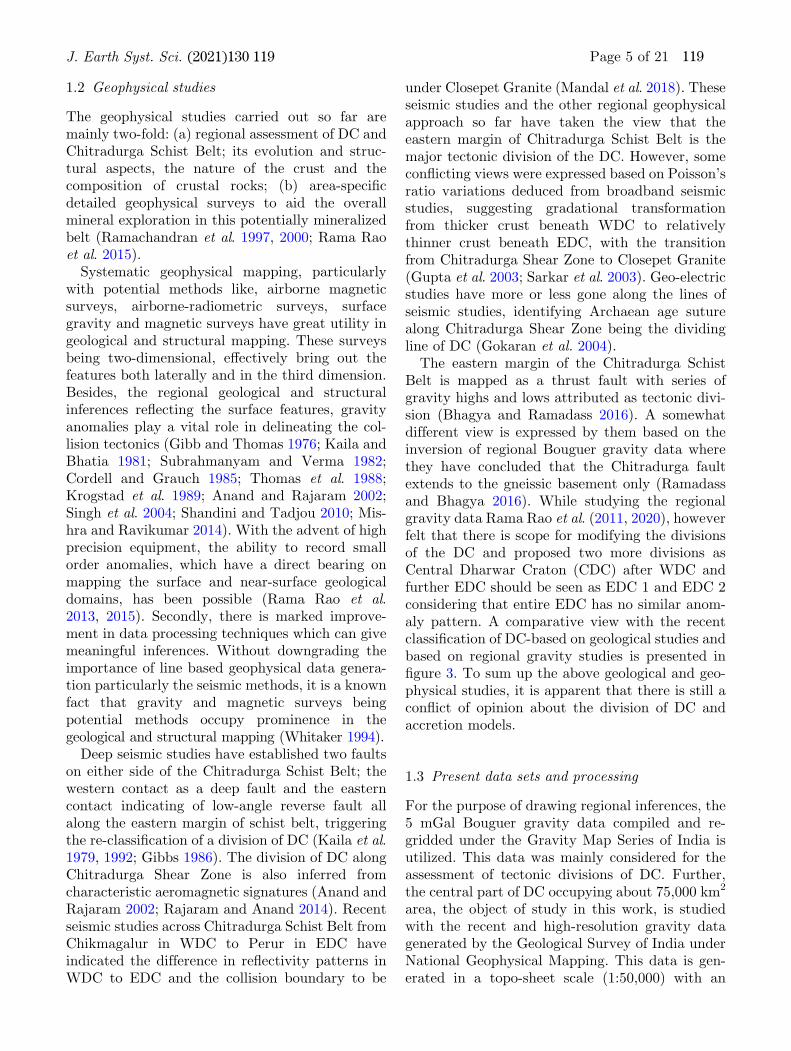
Belt is mapped as a thrust fault with series ofgravity highs and lows attributed as tectonic divi-sion (Bhagya and Ramadass 2016). A somewhatdifferent view is expressed by them based on theinversion of regional Bouguer gravity data wherethey have concluded that the Chitradurga faultextends to the gneissic basement only (Ramadassand Bhagya 2016). While studying the regionalgravity data Rama Rao et al. (2011, 2020), howeverfelt that there is scope for modifying the divisionsof the DC and proposed two more divisions asCentral Dharwar Craton (CDC) after WDC andfurther EDC should be seen as EDC 1 and EDC 2considering that entire EDC has no similar anom-aly pattern. A comparative view with the recentclassiBcation of DC-based on geological studies andbased on regional gravity studies is presented inBgure 3. To sum up the above geological and geo-physical studies, it is apparent that there is still aconCict of opinion about the division of DC andaccretion models.
1.3 Present data sets and processing
For the purpose of drawing regional inferences, the5 mGal Bouguer gravity data compiled and re-gridded under the Gravity Map Series of India isutilized. This data was mainly considered for theassessment of tectonic divisions of DC. Further,the central part of DC occupying about 75,000 km2
area, the object of study in this work, is studiedwith the recent and high-resolution gravity datagenerated by the Geological Survey of India underNational Geophysical Mapping. This data is gen-erated in a topo-sheet scale (1:50,000) with an
J. Earth Syst. Sci. (2021) 130:119 Page 5 of 21 119
Figure
3.Regionalaspects
ofDharw
arCraton.CentralDharw
arCratonisperceived
tobeextendingfrom
Chitradurgashearzoneto
Kolar–Kadiri–Hungundgreenstonebelts,
includingClosepet
Granite(B
aidyanandaet
al.2011;Jayanandaet
al.2013a;PeucatJ-J
etal.2013)(A
).In
contrast
tothisdivision,analysisofnature
andpatternofgravity
anomalies
ofsouth
Indianshield
areahasledto
thedivisionofDharw
arCratonasessentiallyfourdomainsasW
DCupto
thewestern
margin
ofChitradurgaSchistBelt,CDCup
totheeasternmargin
ofRamagiri–Penackacherla
SchistBeltandEDCisseen
astw
oparts;EDC1andEDC2(R
amaRaoet
al.2020)(B
).RegionalgravityproBlesacross
South
IndianShield.A
majorgravityhighzonedepictingthedispositionofCDC
occupiedbyClosepet
graniteasmajorgeologicaldomain
(C).
119 Page 6 of 21 J. Earth Syst. Sci. (2021) 130:119
average station density of 275–350 stations pereach topo-sheet occupying about 720 km2. Con-sidering all possible errors, the accuracy of the datagenerated was up to repeatability of 0.05 mGal.The randomdatawere griddedat 1000mandBouguergravity proBles are generated at regular interval.
2. High resolution gravity data of DharwarCraton
So far, the gravity inferences drawn about DC arebased on regional gravity data with about 1 mGalresolution and average station density of 10 km,restraining the inferences to broad understanding(NGRI 1978; GMSI 2006). Many significant con-tributions towards the understanding of DC and itsimportant domains were derived from the analysisof regional gravity data (Subrahmanyam andVerma 1982; Kesavamani et al. 1997; Singh andMishra 2002; Ramdass et al. 2003, 2006; Mishra et al.2008, 2011; Rama Rao et al. 2011, 2017, 2020; NirajKumar et al. 2013; Bhagya and Ramdass 2016).Here, we present the gravity image of the central
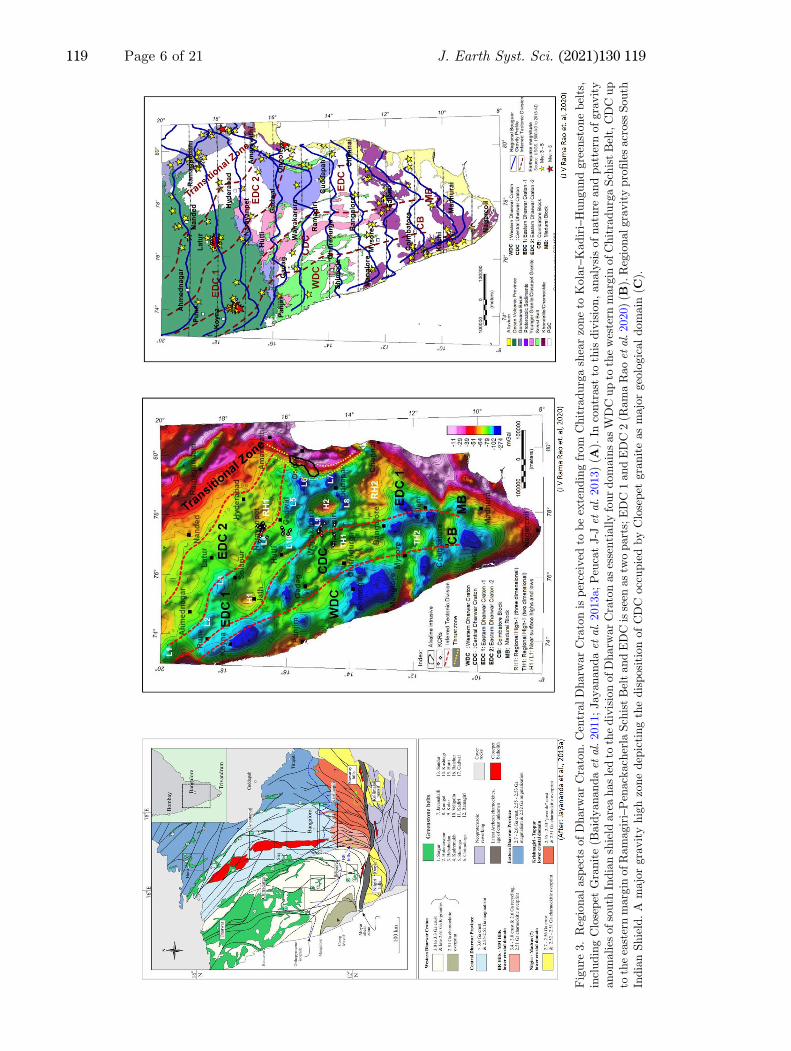
part of DC and its salient features with the new
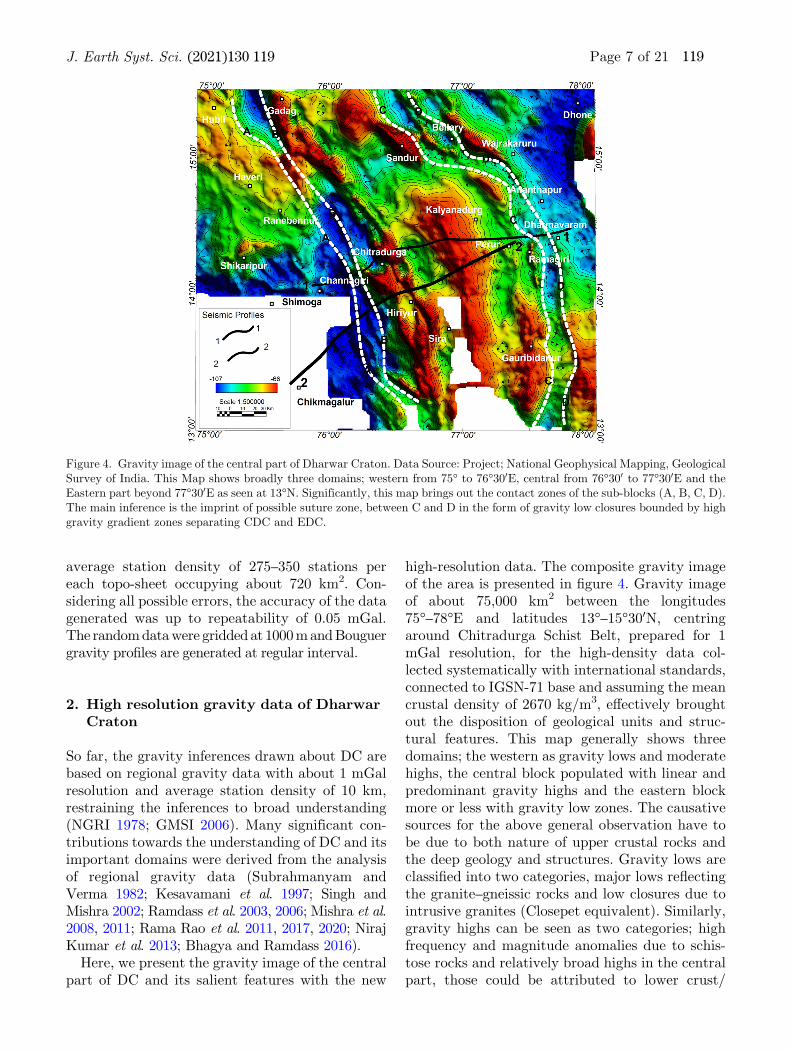
high-resolution data. The composite gravity imageof the area is presented in Bgure 4. Gravity imageof about 75,000 km2 between the longitudes75�–78�E and latitudes 13�–15�300N, centringaround Chitradurga Schist Belt, prepared for 1mGal resolution, for the high-density data col-lected systematically with international standards,connected to IGSN-71 base and assuming the meancrustal density of 2670 kg/m3, eAectively broughtout the disposition of geological units and struc-tural features. This map generally shows threedomains; the western as gravity lows and moderatehighs, the central block populated with linear andpredominant gravity highs and the eastern blockmore or less with gravity low zones. The causativesources for the above general observation have tobe due to both nature of upper crustal rocks andthe deep geology and structures. Gravity lows areclassiBed into two categories, major lows reCectingthe granite–gneissic rocks and low closures due tointrusive granites (Closepet equivalent). Similarly,gravity highs can be seen as two categories; highfrequency and magnitude anomalies due to schis-tose rocks and relatively broad highs in the centralpart, those could be attributed to lower crust/
Figure 4. Gravity image of the central part of Dharwar Craton. Data Source: Project; National Geophysical Mapping, GeologicalSurvey of India. This Map shows broadly three domains; western from 75� to 76�300E, central from 76�300 to 77�300E and theEastern part beyond 77�300E as seen at 13�N. Significantly, this map brings out the contact zones of the sub-blocks (A, B, C, D).The main inference is the imprint of possible suture zone, between C and D in the form of gravity low closures bounded by highgravity gradient zones separating CDC and EDC.
J. Earth Syst. Sci. (2021) 130:119 Page 7 of 21 119
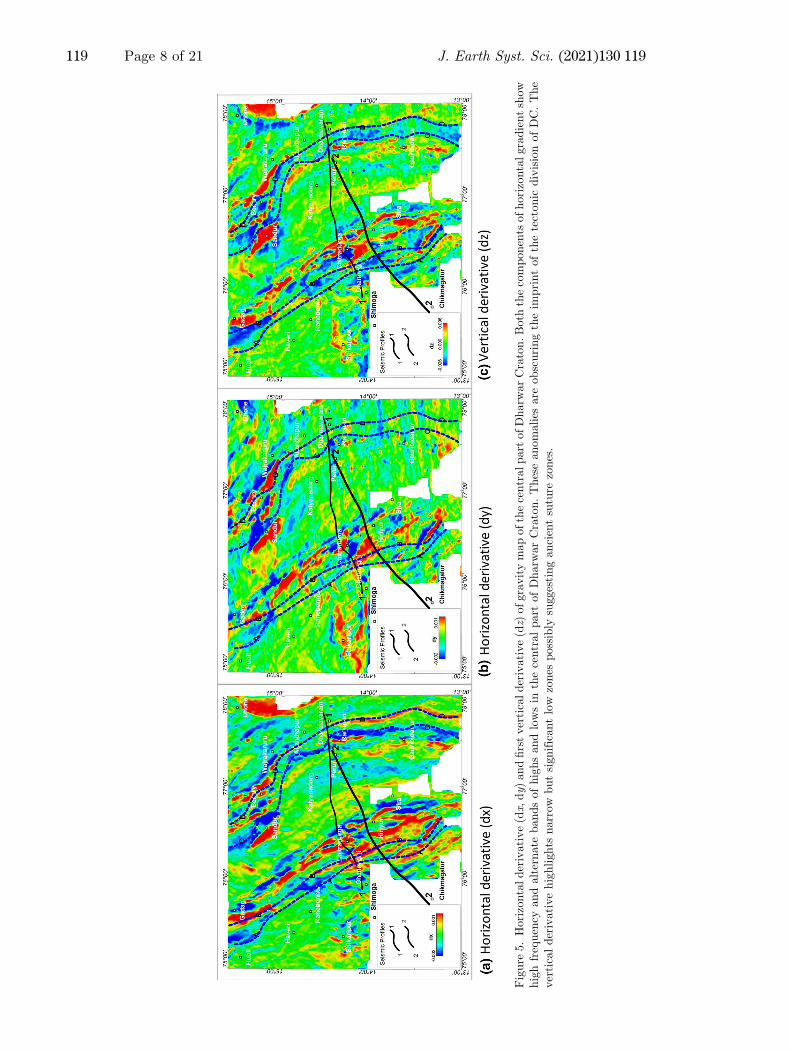
Figure
5.Horizontalderivative(dx,dy)
andBrstverticalderivative(dz)
ofgravitymapofthecentralpart
ofDharw
arCraton.Both
thecomponents
ofhorizontalgradientshow
highfrequency
andalternate
bandsofhighsandlowsin
thecentralpart
ofDharw
arCraton.Theseanomalies
are
obscuringtheim
printofthetectonic
divisionofDC.The
verticalderivativehighlights
narrow
butsignificantlow
zones
possibly
suggestingancientsuture
zones.
119 Page 8 of 21 J. Earth Syst. Sci. (2021) 130:119

Moho in this region, as seen over the regionoccupied with Closepet Granite (Bgure 4).Major gravity lows in the western part could
be attributed to predominantly thicker granite–gneissic crust and moderate highs in the north-western part are reCections of the Shimoga SchistBelt. Gravity highs populate the central part of
DC, mainly due to up warp of interfaces of lowercrust/Moho and the linear schist belts of thisregion. The eastern part of the area is seen mostlywith gravity lows (relatively higher compared tothe southern part of the western block), exceptingthe highs over narrow schist belts of this region.The south-eastern part of this block is seen with a
Figure 6. Bouguer gravity proBles (blue line) from the gridded data and its Bfth-order polynomial regional (red line) are plottedalong with the geographic position of main geological units for every 300 interval indicate the architecture of craton in its centralpart. The regional gravity Beld has clearly demarcated two highs one over the schist belts of WDC and prominent high overChitradurga Schist Belt, Closepet Granite and Ramagiri–Penackacherla Schist Belt marking the area as a distinct crustal sub-block, Central Dharwar Craton (CDC). Between these blocks, a narrow transitory zone is seen as ‘w’ shaped anomalous zonestarting from the end of the Shimoga Schist Belt to the beginning of the Chitradurga Schist Belt. The end of CDC is characterizedwith major gravity low zone with sharp contacts.
J. Earth Syst. Sci. (2021) 130:119 Page 9 of 21 119
major high that could be due to a maBc chamber inthe crustal rocks. Most significantly, this mapbrings out a corridor of gravity lows marked withhigh gravity gradients, shown as A and B in thewestern part and C and D in the eastern part overthe entire length of the map. We consider these asprobable imprints of ancient suture zones, andthese could be the major dividing lines of WDC andCDC and CDC and EDC, respectively.
2.1 Derivatives of Bouguer gravity
Horizontal derivatives (dx, dy) and the Brst verticalderivative (dz) of Bouguer gravity reCects the con-tact zones with pronounced features and helps inidentifying areas of similar anomaly character. Lat-eral discontinuities in upper crustal density and/orthickness associated with suturing and rifting evenwhen buried and with tectonic significance providehigh gravity gradient zones (Sharpton et al. 1987;Bakkali and Mourabit 2006; Marcel et al. 2018). Thecentral part of DC processed for horizontal gradientsigniBes that this area is characterized by alternatebands of narrow gravity high maxima/low maxima(Bgure 5a, b). The gravity gradients in both X and Ydirections are computed and compared. These mapsare populated with high-frequency anomalies proba-bly reCecting the near-surface features, particularlythe volcanic bands of the schist belts, in the form oflinear high zones. Though these features are obscur-ing the deep fault zones, it can be observed that themosaic of anomalies is similar from the westernmargin of Chitradurga Schist Belt to the easternmargin of Ramagiri–Penackacherla Schist Belt,marking these high-intensity anomalous zones as adistinct crustal block (CDC). East-west features arehighlighted in dy map. Further, the vertical deriva-tive is very significant as the main boundaries withinthe craton are reCected with narrow and character-istic gravity lows (Bgure 5c).
2.2 Regional gravity proBles across CDC
Five gravity proBles are generated, 300 apart,cutting across the DC in East–West direction from13�300N to 15�300E mainly to understand the tec-tonic division in this area (Bgure 6). The gravityproBles are generated from the gridded data of thearea for 1000 m spacing. For having the assessmentof the regional gravity Beld, the polynomial Bttingmethod is adopted as we are dealing with theproBles generated from gridded data (Beltrao et al.
1991). The optimum degree of the polynomial isestimated judiciously, trying different degrees andobserving the one that is least aAected by theresidual anomalies (Zeng 2006; Abokhodair 2011).Accordingly, the Bfth-order polynomial for Bou-guer gravity anomalies is computed and plottedalong with Bouguer anomalies for each ProBle. Thegeographic location of each major geologicaldomain is plotted on the proBles. Geological unitsshown in this map are Shimoga Schist Belt,Chitradurga Schist Belt, Closepet Granite andRamagiri–Penackacherla Schist Belt (Bgure 6).From the regional gravity proBles, it is apparent
that the central part of the region is distinctlycharacterized with gravity high of about 50 mGalin the south (13�300N) to progressively diminishingas 5 mGal in the north (15�300N). The westernmargin of this regional high is sharp in the southernpart and at the end of Shimoga Schist Belt, as seenup to 14�300N. In the northern part, this division isnot sharp, probably due to the fact that the area ispredominantly occupied with Shimoga Schist Beltand this belt is widest in these parts. Secondly, it isalso seen that in these parts the Shimoga SchistBelt and Chitradurga Schist Belt are jointed geo-graphically. However, one can clearly recognize the‘w’ shaped gravity low separating these two blocksand can be marked as the dividing zone of WDCand CDC. The fall in gravity values at the end ofthe Shimoga Schist Belt is the beginning of thetransitory zone between WDC and CDC and araise in gravity values coinciding with the begin-ning of the Chitradurga Schist Belt is seen as theend of this zone. This zone is more or less appearingas ‘w’ shaped. The eastern contact of CDC withEDC is not as sharp with a fall of 5–15 mGal fromthe peak value. This means that Bxing the easterncontact of CDC with EDC is somewhat subjectivein the northern part ([14�300N). However, goingby the sharpness of contact at the eastern marginof Ramagiri–Penackacherla Schist Belt at 14�300and further south, it is suggested from this studythat probably end of Ramagiri–PenackacherlaSchist Belt is the end of CDC and beginning ofEDC. A linear corridor of gravity low zone is seenas the end of CDC and the sharp gravity highgradients deBning this contact zone could beattributed to a possible suture zone. On the sur-face, the geological map does not show any possiblechanges that could be attributed to these sharphigh gravity gradients. Probably this is the zonewhere EDC has subducted under its western partthat is CDC. Since this zone is widest, these parts
119 Page 10 of 21 J. Earth Syst. Sci. (2021) 130:119
of the contact zone of sub-blocks is quite visibleand the rest of the places, this feature is not asdistinctly evident.
2.3 Gravity models along seismic proBles
Deep seismic sounding studies carried out acrossDC have greatly contributed in understanding thecrustal architecture and in identifying the deepfaults separating the crustal-sub-blocks, the tec-tonic sub-divisions of DC. It is worthwhile to modelgravity proBles across the newly emerging conceptof CDC to Bx up the divisions of DC. Secondly,there are conCicting views on crustal architecturebeneath the WDC and EDC and their convergence.Particularly, the seismic studies indicated west-ward thrusting of EDC (Kaila et al. 1979; Gibbs1986; Vijaya Rao et al. 2015; Mandal et al. 2018)whereas geo-electrical studies suggested WDCthrusting beneath the EDC (Gokaran et al. 2004).In the present study, Bouguer gravity proBles aregenerated along the seismic proBles. To carry out2D gravity modelling, we have assumed averagedensities for schist belts as 2750 kg/m3, Closepet
Granite as 2620 kg/m3, upper crustal rocks as 2670kg/m3, lower crustal rocks as 3100 kg/m3 andupper mantle as 3300 kg/m3.
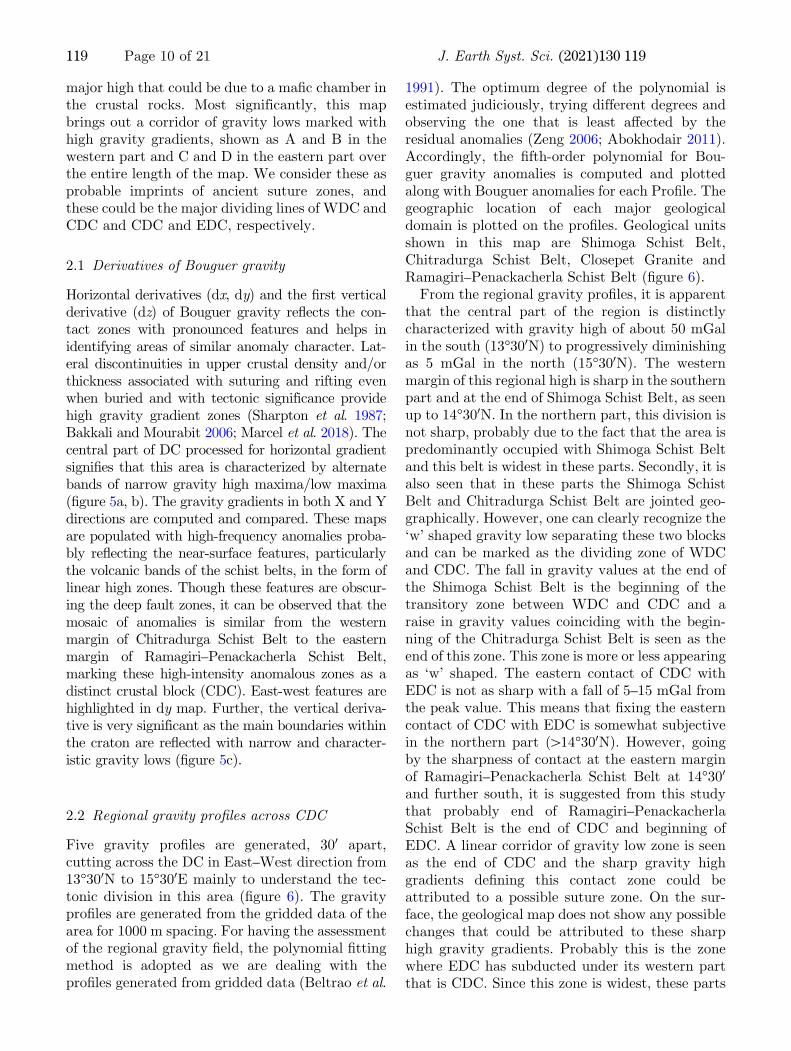
2.4 Channagiri–Dharmavaram proBle
This proBle is part of Udipi–Kavali proBle (Kailaet al. 1979) and re-interpreted by Gibbs (1986). Forthe purpose of comparison, we have modelled thegravity proBle from the gridded gravity data(Bgure 7). The interpretation of seismic surveysindicated Bve deep faults (A–E) in this part of DC.Significant are those on either side of ChitradurgaSchist Belt and Closepet Granite. Faults A and Ccoincide with shear zones of Shimoga and Chi-tradurga schist belts. From the above section, it isapparent that there is a significant rise in the Mohodepth from west of Chitradurga Schist Belt, aroundfault B up to Closepet Granite and beyond up tothe west of Dharmavaram. Significantly, the Mohointerface is not seen under Closepet Granite and istentatively the up-warped potion of crustal inter-faces (marked with the red line, Bgure 7). It is alsoapparent that the eastern margin of the
Figure 7. Gravity 2D model along Channagiri–Dharmavaram Seismic ProBle. Faults A to F is identiBed based on the reCectionpattern (Rogers 1986). Of these, A and C are low angle faults at the end of Shimoga and Chitradurga Schist Belt s depictingmajor shear zones. Interestingly, Moho reCection is not marked under Closepet Granite. We suggest, up-warp of Moho in theseismic section, marked with the dashed red line, coinciding with long-wavelength gravity high zone. Comparing both seismicsection and gravity proBle, we have identiBed other deep faults, which are significant in deBning the crustal architecture.
J. Earth Syst. Sci. (2021) 130:119 Page 11 of 21 119

Chitradurga Schist Belt is reCected as low anglefault C and limited to mid-crustal levels. It hasappeared to us that three faults shown in red couldbe identiBed dipping towards west based on ter-mination of reCections along these lines. The Brstinferred fault is at the western boundary with Chi-tradurga Schist Belt and together with alreadyidentiBed fault ‘B’ possibly suggesting a domal fea-ture beneath Chitradurga Schist Belt. Similar faultsin opposite directions are noticed beneath the Clo-sepet granite around fault ‘D’ in the seismic section.The gravity model along this proBle brought out
significant features. The eastern boundary of theShimoga Shist Belt is significant as it marks asudden rise in gravity values. But for a gravitylow over Chitradurga granite, this broad high isextending up to the eastern margin of Rama-giri–Penackacherla Schist Belt. This entire regioncan be viewed as a broad uplifted zone; thus, webelieve this is the transitory sub-block betweenWDC and EDC and now christened as CDC(Rama Rao et al. 2011; Jayananda et al. 2013a).The lower crustal interface, in this model, is viewed
as two distinct up-warp regions one beneath Chi-tradurga Schist Belt and the other beneath ClosepetGranite. The difference in direction of gravity gra-dients at the contacts of these domains suggests thetectonic regime of this region. Inferred faults of thismodel marked as ‘A’ and ‘F’ with divergent trendsand suggest that both WDC and EDC have gonebeneath the CDC. Accordingly, a possible alternativeaccretionary model of DC is proposed in this study.
2.5 Chikmagalur–Perur proBle
A 200 km long proBle cutting across ChitradurgaShear Zone in NE–SW direction from Chikmagalurin WDC to Perur in EDC is recently covered withseismic refraction and wide-angle seismic reCectionsurveys to bring out the velocity structure acrossDC. These results (Vijaya Rao et al. 2015) and there-processing of the data (Mandal et al. 2018) haveconBrmed the variation in crustal thickness and theboundary between the WDC and EDC to be alongChitradurga Shear Zone. Further, this seismic
Figure 8. Gravity 2D model along Chikmagalur–Perur Seismic ProBle (Mandal et al. 2018). Faults F2 and F3 of seismic sectioncoinciding with steep gravity gradients. In this section also moho reCection is not marked under CSB, which is a regional gravityhigh zone. Significant observation from the gravity proBle is that the regional high is seen as two distinct highs; one under CSBand the other under CG. Detailed inferences are discussed in the text.
119 Page 12 of 21 J. Earth Syst. Sci. (2021) 130:119

study is consistent with convergence, subductionand accretion of crustal blocks. The accretionaryboundary is shown to be beneath the ClosepetGranite where EDC has subducted beneath theolder WDC.Bouguer Gravity proBle is generated along the
seismic proBle from the gridded data. Some part ofthe data in the south-western part around Chik-magalur is not available. The gravity model alongwith the seismic section is presented in Bgure 8.Bouguer gravity proBle shows the abrupt rise ingravity values up to 35 mGals at the end of Shi-moga/Bababudan Schist Belts. This marks thecontact between WDC and CDC. CDC is charac-terized by two broad gravity highs coinciding withChitradurga Schist Belt and Closepet granite andthe major part of this anomaly is due to upwarping of Moho/lower crust. The distinct gravityhigh under Chitradurga Schist Belt is seen withpoor seismic reCections. The end of the Chi-tradurga Schist Belt is marked with a fault prob-ably extending up to the lower crust. As bothWDC and EDC are appearing to be sub-ductingbeneath the CDC resulting in upliftment of lowercrust/Moho which in turn is the reason why thisarea is characterized with major gravity highs.The closepet Granite batholith going up to lowercrustal margin as shown in the seismic proBle isdifBcult to explain based on gravity values.
3. Tectonic boundaries and gravitysignatures
The regional gravity proBle from the recent dataalong 14�N for about 330 km length (75�–78�E) iscompared with the proBle across Canadian shield(Bgure 9). It is seen that there is an abrupt rise of24 mGal in 80 km distance (Gradient of 0.3 mGal/km) between the older and younger provinces ofthe Canadian shield with a density contrast of+0.07 gm/cc. In comparison to that, we see asharp rise of about 30 mGals seen from the westernmargin of the Chitradurga Schist Belt over a dis-tance of 110 km (0.27 mGal/km). The presence ofdeep crustal rocks (Sargur group) in the westernmargin of the Chitradurga Schist Belt conBrmedwith significant gravity changes make us believethat the Brst division of DC is at the westernmargin of the Chitradurga Schist Belt. No suchevidence is seen at the eastern margin of the Chi-tradurga Schist Belt. This makes us believe thatthough there is a long shear zone all along theF
igure
9.ComparativegravitystudywithCanadianShield.Rem
arkableconsistency
isseen
ingravityproBlesover
theCanadianshield
(GibbandThomas1976)andtheproBle
across
DC.A
similarabruptrise
inregionalgravityBeldatthecontact
ofOlder
andYounger
provincesofCanadianshield
isseen
asattheinferred
contact
ofW
DC
andCDC
(western
contact
ofChitradurgaSchistBelt).W
eassumeaveragecrustaldensity
under
CDCishigher
incomparisonwithitsneighbours
oneither
sidewhichpoints
tosuturing
atthesecontactsasthey
are
associatedinvariably
withdifferentaveragecrustaldensities.
J. Earth Syst. Sci. (2021) 130:119 Page 13 of 21 119

Figure
10.Accretionary
modelsofDharw
arCratonbasedongeologicalstudies.Tworecentmodelsbasedongeologicalstudiesare
shownhere.TheBrstmodel(Jayanandaet
al.
2013b)suggests
two-stageaccretionandtw
o-stagevolcanisms.
Thesecondmodel
indicatedatransitiontowardsaplate
tectonic
regim
e(B
haskara
Raoet
al.2019).
119 Page 14 of 21 J. Earth Syst. Sci. (2021) 130:119

eastern margin, the eastern margin of theChitradurga Schist Belt is not a tectonic division.The next contact is around Ramagiri–Penack-
acherla Schist Belt as again we see a fall of gravityvalues there with a gradient of about 0.25 mGal/km. This we assume as the contact zone of CDCand EDC. The contact zone of EDC and EGMB isseen with a much sharper gravity gradient of 1.5mGal/km coinciding with the presence of granuliterocks (Mishra and Ravikumar 2014).
3.1 Accretionary models of Dharwar Craton
After substantial works during the last two decadesin geology, geochronology and geophysics, it is gen-erally understood that Dharwar Craton has stabi-lized in Archaean periods (3.6–2.5 Ga) with two-stage volcanism and two-stage accretionary processbetween the two blocks of DC; WDC and EDC.Mainly two contemporary works are summarizedand the models are shown here (Bgure 10).Geochronological studies have established two epi-sodes of accretion, which led to the growth of thejuvenile province of maBc volcanic and felsic pluton(2.7–2.6 Ga) along the eastern margin of WDC andinduced reworking of the margin. The easternreworked fringe of WDC and the juvenile provinceformed EDC. Second stage accretion (2.58–2.52 Ga)
proceeded by emplacement of TTG and calc-alka-line plutons and felsic volcanics throughout EDC(Jayananda et al. 2013b). Reviewing the geological,geochronological and geophysical works so far car-ried out in DC, Bhaskara Rao et al. (2019) haveindicated transition towards Plate TectonicRegime. They suggested two major episodes ofjuvenile crust accretion between 3.45–3.15 Ga andminor event around 2.6–2.5Ga.Crustal reworking issuggested between 3.1 and 2.7 Ga. Secondly, thevertical tectonic regime in the Paleo-Mesoarcheanperiod (sagduction processes) which produced domeand keel structural pattern has shifted to plate tec-tonic regime around 2.7 Ga. Both the models areshown together in Bgure 10.
3.2 Geophysical studies towards the accretionarymodel of Dharwar Craton
Mainly seismic proBling and broadband magnetotel-luric studies have contributed for generating accre-tionary models for DC. Here we present two suchmodels, though somewhat contradictory evidenceabout which block of DC is subducting. Magne-totelluric studies in DC across all the major schistbelts and Closepet Granite brought out an Archaeansuture along the eastern margin of the ChitradurgaSchist Belt. This suture is attributed to the thrusting
Figure 11. Accretionary models across Dharwar Craton based on Geophysical studies. The Brst model based on MT studiessuggesting WDC going beneath EDC along the eastern margin of CSB (Gokaran et al. 2004). The second model suggestsaccretionary block beneath Closepet granite and EDC going beneath WDC (Mandal et al. 2018).
J. Earth Syst. Sci. (2021) 130:119 Page 15 of 21 119

Figure 12. Proposed accretionary models for the central part of Dharwar Craton. Two long gravity proBles at 14�300N (A) and14�N (B) are modelled assuming the same density parameters. Whereas the high-frequency anomalies depict the extent of schistbelts and granite bodies, the regional proBles give an idea about the nature of crust, suture zones as boundaries between theWDC–CDC and CDC–EDC blocks of DC. The Cartoons suggest subduction of both WDC and EDC beneath the CDC.
119 Page 16 of 21 J. Earth Syst. Sci. (2021) 130:119
of WDC beneath EDC and predates the schist belts.In their interpreted model along with the seismicproBling, Gokaran et al. (2004) suggested the crustalevolution starting as distinct cratons with interven-ing sea prior to 2.6 Ga and subsequent closure of seaand subduction of WDC beneath EDC which hascreated the suture along the eastern margin.The recent seismic reCection surveys (Vijaya Rao
et al. 2015) and re-processing of data from Chikma-galur inWDCtoPerur inEDChave indicated dippingMoho, oppositely dipping reCections and a thrust faultin DC. This study concluded that EDC was thrustedobliquely against pre-existingWDC and accreted to itduring the Neoarchean period. This study has shifted
the collision boundary to further east under ClosepetGranite (Mandalet al. 2018).Theyhave shownanareaoccupied with Closepet Granite as an accretionaryblock of DC. To simplify, from the essence of theseworks, that there exists contradiction both in theaccretionary process of subduction and its geographiclocation. These situations and the present-day statusare shown in Bgure 11.
3.3 Accretionary model based on gravityproBles 14�N and 14�30 0N
Considering the above, we in this study aimedto resolve the issue of accretion based on the
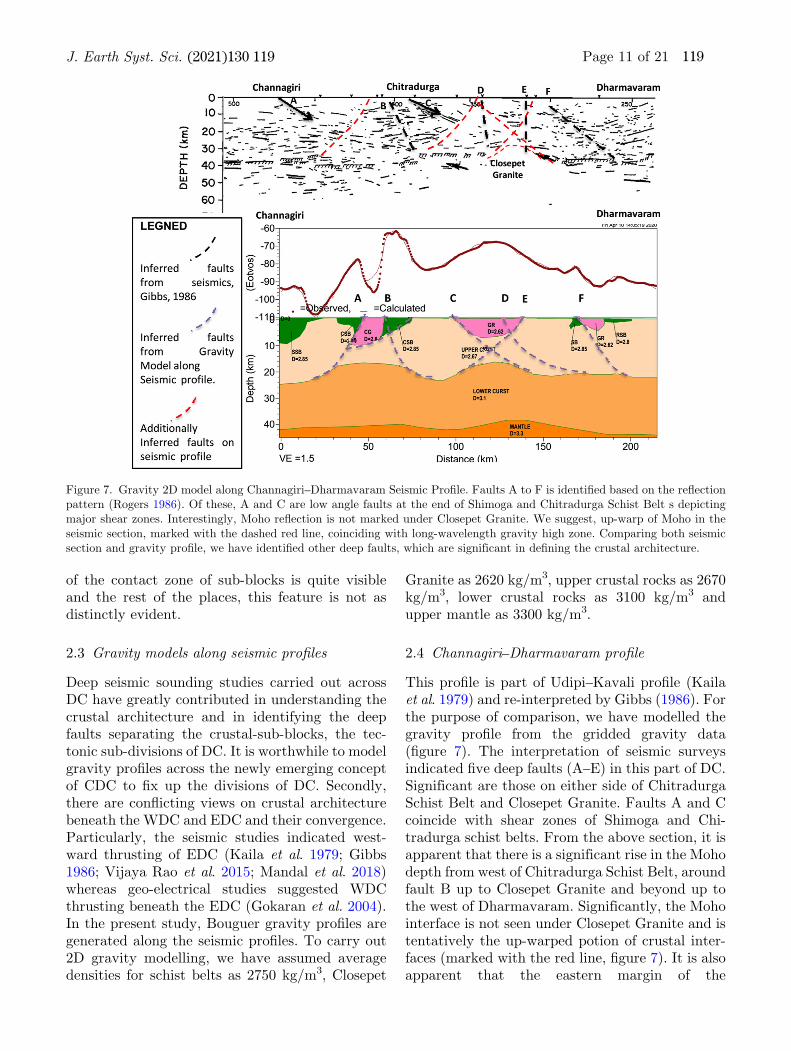
Figure 13. Regional geological map of Dharwar Craton and adjoining terrain depicting the disposition of schist belts andChitradurga Shear Zone (after Jayananda et al. 2013b). Proposed tectonic divisions within Dharwar Craton inferred from gravitydata are superposed on to this map.
J. Earth Syst. Sci. (2021) 130:119 Page 17 of 21 119
high-resolution gravity data. For this, we havechosen the East–West proBles of 14�N and14�300N from the gridded gravity data, as theseproBles more or less cut across the DC in thecentral part where it is widest. These proBlesrepresent comparable proportions of WDC, CDCand EDC. Important geological domains occu-pying on the surface of these proBles and con-tributing to gravity responses include ShimogaSchist Belt, Chitradurga Schist Belt, ClosepetGranite and Ramagiri–Penckacherla Schist Belt.Further, these traverses are of 3� distance lon-gitudinal wise, that is about 330 km length, assuch it is expected that fair representation ofcrustal architecture could be achieved from them(Bgure 12).Unlike earlier models discussed above most of
which show EDC going beneath the WDC alongthe eastern margin of Chitradurga Schist Belt,we believe that the Central block (CDC) isuplifted and both the sub-blocks are subductedbeneath the CDC and marked with sharp gravitygradients (Bgure 12). There is at least 4–6 km risein this part for both the lower crust and Mohointerfaces. This inference is based on the fact thatthe observed gravity high can only be explainedby this assumption, particularly the high overClosepet Granite which is relatively lower den-sity compared to the surrounding granite–gneis-sic medium. Secondly, the eastern margin of theChitradurga Schist Belt which is thought to bethe tectonic boundary of WDC and EDC is notcharacterized with any significant gravityanomaly. The difference in the direction ofgravity gradients at the contacts of the CDCshould not have been the case if merely EDC isgoing beneath WDC.From this study, we propose the accretionary
model, as cartoon, for the DC. Two aspects wereclear from this data that, there is no substantialsignal at the end of the Chitradurga Schist Belt andthere is no indication of major low angle fault asthe accretionary zone of DC. A ‘w’ shaped anomalynoticed in the intervening portion of ShimogaSchist Belt and Chitradurga Schist Belt is sug-gested as the accretionary zone of WDC and CDCdipping towards east. CDC is seen with a majorregional high encompassing Chitradurga SchistBelt, Closepet Granite and Ramagiri–Penack-acherla Schist Belt. As the regional gravity risesfurther east after the gravity low at the contact ofRamagiri–Penackacherla Schist Belt, it is apparentthat CDC is well deBned. The second accretionary
zone is suggested at the eastern margin ofRamagiri–Penackacherla Schist Belt with awesterly dip. Both the zones are inferred as highangle and as both WDC and EDC subductbeneath CDC causing major gravity high overthis block, otherwise mostly populated withgranite–gneissic rocks.
4. Summary and conclusions
The new gravity data has yielded a wealth ofinformation about the exposed part of DC. Severalinferences have emerged other than mapping thedisposition of important geological domains likeschist belts, younger granites and structural fea-tures. In this study, an attempt is made to studythe status of the Chitradurga Schist Belt in DC asthe eastern margin of this belt is generally believedto be the division of DC into western and easternblocks. Bouguer gravity image shows threeprominent domains: one populated by and largewith major gravity lows (WDC), second as thezone of linear gravity highs (CDC) and the third asgravity low zone with intermittent narrow highs(EDC). There are marked and well-deBned corri-dor of gravity lows separating these blocks. Grav-ity proBles across the craton have shown the exactdivision of craton in the form of regional gravityhighs enveloping Shimoga–Bababudan Schist Beltfrom that of another high encompassingChitradurga Schist Belt, Closepet Granite andRamagiri–Penackacherla Schist Belt. The secondgravity high is further split as two discrete highsunder Chitradurga Schist Belt and ClosepetGranite, suggesting up-warp of Moho/lower crustunder these units. Gravity models along with ear-lier inferred seismic reCection studies show themajor faults, some agreement is seen about theMoho pattern in the DC. Based on the analysis ofthis data we suggest that both WDC and EDC aresubducting beneath the CDC, contrary to earlierunderstanding, and this is the reason why thecentral portion of DC is characterized with gravityhighs. The two-dimensional gravity highs in CDCare mainly attributed to up warp of Moho/lowercrustal interface. This study confers with the con-cept of CDC as a distinctly different crustal sub-block in comparison with WDC and EDC andsuggests modiBcation of its boundaries with theadjoining blocks. A major suture zone, hithertounknown, is identiBed as the boundary betweenCDC and EDC (Bgure 13).
119 Page 18 of 21 J. Earth Syst. Sci. (2021) 130:119

Acknowledgements
The authors Rama Rao and Ravikumar arethankful to Dy Director General and HOD, GSI,SR for his kind permission to publish this work. Wewish to place on record our great appreciation to allthe Geophysicists of GSI, SR who were engaged indata generation and have painstakingly collectedthis valuable data under NGPM. We are gratefulto Dr S Ravi, Director, GSI-TI, for the fruitfuldiscussion. We are greatly beneBted by the criticaland constructive assessment of this work by theanonymous reviewer.
Author statement
J V Rama Rao: Conceptualizing the researchwork, literature collection, data generation, dataprocessing, interpretation, integration andmanuscript preparation; B Ravikumar: Literaturecollection, data compilation, data processing,modelling, manuscript checking; B Balakrishna:Data generation, compilation; and B Veeraiah:Overall involvement in Research problem identi-Bcation, interpretation, manuscript Bnalization.
References
Abokhodair A 2011 Constrained polynomial Btting for recov-ery of regional gravity; Geophys. Prospect. 59(4) 749–759.
Alexandra G, Karel S, Marc M, Jean-Marc M, Jean-BernardE, Ondrej L and Derek F 2014 Geophysical constraints forterrane boundaries in southern Mongolia; J. Geophys. Res.119 7966–7991.
Anand S P and Rajaram M 2002 Aeromagnetic data to probethe Dharwar Craton; Curr. Sci. 83(2) 162–167.
Baidyananda M, Goswami J and Srinivasan R 2011 Pb–Pbzircon ages of Archaean metasediments and gneisses fromthe Dharwar Craton, Southern India: Implications for theantiquity of the eastern Dharwar Craton; J. Earth Syst. Sci.120 643–661.
Bakkali S and Mourabit T 2006 Horizontal gradient signatureof Morocco Bouguer anomaly; Theoria 15(1) 25–31.
Beltrao J F, Silva J B C and Costa J C 1991 Robustpolynomial Btting method for regional gravity estimation;Geophysics 56(1) 80–89.
Bhagya G and Ramadass G 2016 Subsurface topography ofsupra-crustals of Dharwar Craton through inversionof regional Bouguer gravity; Adv. Appl. Sci. Res. 7(5)54–89.
Bhaskara Rao Y J, Vijaya Kumar T, Sreenivas B and Babu EV S S K 2019 A review of Paleo- to Neoarchean crustalevolution in the Dharwar Craton, southern India and thetransition towards a Plate Tectonic regime; Episodes 43(1)51–68.
Chadwick B, Ramakrishnan M and Viswanatha M N 1981 Thestratigraphy and structure of the Chitradurga region: Anillustration of cover-basement interaction in the lateArchaean evolution of the Karnataka craton, SouthernIndia; Precamb. Res. 16(1–2) 31–54.
Chadwick B, Vasudev V N and Hegde G V 2003 TheChitradurga Schist Belt and its adjacent plutonic rocks,northwest of Tungabhadra, Karnataka: A duplex in the lateArchean convergent setting of Dharwar craton; J. Geol.Soc. India 61 645–663.
Chardon D, Jayananda M, Chetty T R K and Peucat J-J 2008Precambrian continental strain and shear zone patterns.South Indian Case; J. Geophys. Res. 113 1–16.
Cordell L and Grauch V J S 1985 Mapping basementmagnetization zones from aeromagnetic data in the SanJuan Basin, New Mexico; In: The Utility of RegionalGravity and Magnetic Anomaly Maps (ed.) Hinze W J, Soc.Explor. Geophys., pp. 181–197.
Elling R P, Stein S, Stein C A and Keller G R 2020 Tectonicimplications of the gravity signatures of the MidcontinentalRift and Grenville Front; Tectonophysics 776 1–6.
Franco H and Abbott D 1999 Gravity signatures of terraneaccretion; Lithos 46 5–15.
Fountain D M and Salisbury M H 1981 Exposed cross-sectionsthrough the continental crust: Implications for crustalstructure, petrology, and evolution; Earth Planet. Sci. Lett.56 263–277.
Gibb R A and Thomas M D 1976 Gravity signature of fossil plateboundaries in the Canadian Shield; Nature 262 199–200.
Gibbs A K 1986 Seismic reCection proBles of Precambrian crust –A qualitative assessment; In: ReCection Seismology – Thecontinental crust (eds) Baraganzi M and Brown I, Am.Geophys. Union Geodyn. Ser. 4 95–106.
GMSI 2006 Gravity Map Series of India, GSI-NGRI andothers.
Gokarn S G, Gupta G and Rao C K 2004 Geoelectric structureof the Dharwar craton from magnetotelluric studies,Archean suture identiBed along the Chitradurga-Gadagschist belt; Geophys. J. Int. 158(2) 712–728.
Guo L and Gao R 2018 Potential Beld evidence for the tectonicboundaries of the central and western Jiangnan belt insouth China; Precamb. Res. 309 45–55.
Gupta S, Rai S S, Prakasam K S, Sriganesh D, Chadha R K,Priestly K and Gaur V K 2003 First evidence for anomalousthick crust beneath mid-Archean Dharwar craton; Curr.Sci. 14(9,10) 1219–1226.
Jayananda M, Tsutsumi Y, Miyazaki T, Gireesh R V, KapfoKowe-u, Tushipokla Hiroshi H and Kano T 2013aGeochronological constraints on Meso- and Neoarcheanregional metamorphism and magmatism in Dharwar Cra-ton, Southern India; J. Asian Earth Sci. 78 18–38.
Jayananda M, Peucat J J, Chardon D, Krishna Rao B,Fanning C M and Corfu F 2013b Neoarchean greenstonevolcanism and continental growth, Dharwar craton, South-ern India: Constraints from SIMS U–Pb zircon geochronol-ogy and Nd isotopes; Precamb. Res. 227 55–76.
Jayananda M, Dey S and Aadhiseshan K R 2020 EvolvingEarly Earth. Insights from Peninsular India; In: Geody-namics of the Indian Plate (eds) Gupta N and Tandon S K,Springer, Evolution. Perspect., pp. 5–103.
Kaila K L, Roy Chowdhury K, Reddy P R, Krishna V G,Narian Hari, Subbotin S I, Sollogub V B, Chekunov C,
J. Earth Syst. Sci. (2021) 130:119 Page 19 of 21 119

Kharachetko G E, Lazarenko M A and Ilchenko T V 1979Crustal structure along the Kavali–Udipi proBle in theIndian Peninsular Shield from deep seismic sounding; J.Geol. Soc. India 20 307–330.
Kaila K L and Bhatia S C 1981 Gravity study along KavaliUdipi deep seismic sounding proBle in the Indian peninsularshield: Some inferences about origin of anorthosites andEastern Ghat orogeny; Tectonophysics 79 129–143.
Kaila K L and Krishna V G 1992 Special issue on seismology inIndia, overview, deep seismic sounding studies in Indianand major discoveries; Curr. Sci. 62(1&2) 117–154.
Krogstad E J, Balakrishnan S, Mukhopadhyay D K, RajamaniV and Hanson G N 1989 Plate tectonics 2.5 billion yearsago: Evidence at Kolar, South India; Science 243(4896)1337–1340.
Kesavamani M, Rao N B K and Rama Rao J V 1997Characteristics of granite-greenstone basement below theCuddapahs: A geophysical insight; J. Indian Geophys.Union 1(1) 27–39.
Mandal B, Vijaya Rao V, Sarkar D, Bhaskar Rao Y J, Raju S,Karuppannan P and Sen M K 2018 Deep crustal seismicreCection images from the Dharwar craton, Southern India –
evidence for Neoarchean subduction; Geophys. J. Int. 212777–794.
Marcel J, Essi J M A, Nouck P N, Sanda O and Eliezer M-D E2018 Validation of gravity data from the geopotential Beldmodel for subsurface investigation of the Cameroon Vol-canic Line (Western Africa); Earth Planets Space 70 1–18.
Mishra D C, Singh B and Tiwari V M 2008 Gravity studies inIndia; Golden Jubilee Memoir Geol. Soc. India, pp. 329–372.
Mishra D C 2011 A uniBed model of Neoarchean–Proterozoicconvergence and rifting of Indian cratons: Geophysicalconstraints; Int. J. Geosci. 2 610–630.
Mishra D C and Ravi Kumar M 2014 Proterozoic orogenicbelts and rifting of Indian cratons: Geophysical constraints;Geosci. Front. 5 25–41.
Mohakul J, Babu P H, Madusudanan R, Khan S A andBalakrishnan S 2020 Regional and deposit scale control ofgold mineralization in Chitradurga Schist Belt, DharwarCraton, India, Personal Communication.
Mukhopadhyay D, Barl M C and Ghosh D 1981 A tectono-stratigraphic model of Chitradurga schist belt, Karnataka,India; J. Geol. Soc. India 22 22–31.
Naqvi S M 1985 Chitradurga Schist Belt – An ArchaeanSuture (?); J. Geol. Soc. India 26(8) 511–525.
NGRI 1978 Gravity Map Series of India, 1.5M scale, FirstEdition (with Explanatory Brochure, 13p.) Nat. Geophys.Res. Inst., Hyderabad.
Niraj K, Zeyen H, Singh A P and Singh B 2013 Lithosphericstructure of southern Indian shield and adjoining oceans:Integrated modelling of topography, gravity, geoid and heatCow data; Geophys. J. Int. 194 30–44.
Rajaram M and Anand S P 2014 Aeromagnetic signatures ofPrecambrian shield and suture zones of Peninsular India;Geosci. Front. 5 3–15.
Ramachandran C, Ramamurty V, Khan S A, Rao H V, MuraliN C and Rao T M 1997 Potential areas for Goldmineralization from Airborne Total count maps in Chi-tradurga District. An exploration strategy for Gold; J.Geophys. XVIII(1) 3–14.
Ramachandran C, Acharya R S and Ramamurty V 2000Discovery of an auriferous major quartzite body, south of
Kallenahalli, Chitradurga Schist Belt from integration ofgeological models for Archean gold and air-borne radio-metric map; J. Geophys. XXI(2) 71–77.
Ramakrishnan M and Vaidyanathan R 2008 Geology of India,Vol. I, Geol. Soc. India.
Rama Rao J V, Bhattacharya P M and Singh N 2011 MajorGravity high zone in Central Dharwar Craton – Implica-tions for transitory zone between WDC and EDC andcrustal shortening over Closepet Granite. Internationalsymposium on Precambrian Accretionary orogens and Fieldworkshop in the Dharwar Craton, Southern India, 2–11,February, Organized by Geological Society of India, NewDelhi.
Rama Rao J V, Murty N V S and Balakrishna B 2013 Imprintsof Gadwal-Raichur Schist Belt beneath Cuddapah Sedi-ments, Evidences from Gravity and Magnetic anomalies,Kurnool area, Andhra Pradesh; J. Geophys. XXXIV(2)95–99.
Rama Rao J V, Balakrishna B, Murty N V S, Ajay Kumar P,Ramakrishna Rao M V, Acharya R S and Sankaram SP 2015 A Comprehensive view from Geophysical signaturesover Chitradurga Schist Belt, Karnataka; J. Geol. Soc.India 86 489–499.
Rama Rao J V 2017 Gravity anomalies over Indian Cratonsand their geological implications; Indian J. Geosci. 71(4)599–610.
Rama Rao J V, Ravi Kumar B, Kumar Manish, Singh R B andVeeraiah B 2020 Gravity of Dharwar Craton, SouthernIndian Shield; J. Geol. Soc. India 96 239–249.
Ramdass G, Himabindu D and Srinivasulu N 2003 Structuralappraisal of the Gadag Schist Belt from gravity investiga-tions; Indian Acad. Sci. (Earth Planet. Sci.) 112(94)577–586.
Ramdass G, Ramprasada Rao I B and Himabindu D 2006Crustal conBguration of the Dharwar craton, India based onjoint modelling of regional gravity and magnetic data;J. Asian Earth Sci. 26 437–448.
Ramadass G and Bhagya K 2016 Tectonic classiBcation ofDharwar Craton, India based on inversion of RegionalBouguer Gravity; Int. J. Adv. Res. 499 255–277.
Rogers J J W 1986 Dharwar craton and assembly ofPeninsular India; J. Geol. 94 129–143.
Roy A B 2012 Indian Shield. Insight into pristine size, shape andtectonic framework; Indian J. Geosci. 66(4) 181–192.
Roy S and Mareshal J-C 2011 Constraints on the deep thermalstructure of the Dharwar craton, India, from heat Cow,shear wave velocities, and mantle xenoliths; J. Geophys.Res. Solid Earth 116(B2) 1–15.
Sarkar D, Ravi Kumar M, Saul J, Kind R, Raju P S, Chadha RK and Shukla A K 2003 A receiver function perspective ofthe Dharwar craton (India) crustal structure; Geophys.J. Int. 154 205–211.
Sengupta S and Roy A 2012 Tectonic amalgamation of crustalblocks along Gadag-Mandya shear zone in Dharwar cratonof Southern India; J. Geol. Soc. India 80 75–88.
Senthil Kumar P, Rajeev M and Koti Reddy G 2007Crustal geotherm in southern Deccan basalt province,India; The Moho is as cold as adjoining cratons. Plates,Plumes and Planetary Processes, GSA Special papers430.
Shandini Y N and Tadjou J M 2010 Gravity Data Interpre-tation in the Northern edge of the Congo Craton,
119 Page 20 of 21 J. Earth Syst. Sci. (2021) 130:119

South-Cameroon; Anu �ario do Instituto de Geociencias33(1) 73–82.
Sharpton V L, Grieve R A F, Thomas M D and Halpenny J F1987 Horizontal gravity gradient. An aid to the definition ofcrustal structure in North America; Geophys. Res. Lett.14(8) 808–811.
Singh A P and Mishra D C 2002 Tectono-sedimentaryevolution of Cuddapah basin and Eastern Ghat mobile belt(India) as Proterozoic collision gravity seismic and geody-namic constraints; J. Geodyn. 33 249–267.
SinghAP,MishraDC,Gupta SB andRaoMRKP2004Crustalstructure and domain tectonics of Dharwar Craton (India):Insight from new gravity data; J. Asian Earth Sci. 23 141–152.
Sreehari L and Toyoshima T 2020 Structural architecture andgeological relationships in the southern part of ChitradurgaSchist Belt, Dharwar Cratons, South India; J. Mineral. Petrol.Sci., J-STAGE Advance Publication, March 31, 2020.
Srinivasan R and Sreenivas B L 1972 Dharwar Stratigraphy;J. Geol. Soc. India 13 75–85.
Subramanyam C and Verma R K 1982 Gravity interpretationof the Dharwar greenstone–gneiss–granite terrain in thesouthern Indian Shield and its geological implications;Tectonophysics 84 225–245.
Sunder Raju P V, Erikson P G, Catuneanu O, Sarkar S andBanerjee S 2014 A review of the inferred geodynamic
evolution of the Dharwar craton over the ca. 3.5–2.5 Gaperiod, and possible implications for global tectonics;Canadian J. Earth. Sci. 51 312–325.
Swaminath J, Ramakrishnan M and Viswanatha M N 1976Dharwar stratigraphic model and Karnataka craton evolu-tion; Rec. Geol. Surv. India 107(2) 149–175.
Swaminath J and Ramakrishnan M 1981 Dharwar strati-graphic model and Karnataka craton evolution; Rec. Geol.Surv. India 107(2) 149–175.
Thomas M D, Grieve R A F and Sharpton V L 1988 Gravitydomains and assembly of the North American continent bycollision tectonics; Nature 331(28) 333–334.
Vijaya Rao V, Murty A S N, Sarkar D, Bhaskar Rao Y J,Khare P, Prasad A S S S R S, Sridher V, Raju S, Rao G S,Karuppannan P and Prem Kumar N 2015 Crustalvelocity structure of the Neoarchean convergence zonebetween the eastern and western blocks of DharwarCraton, India from seismic wide-angle studies; Precamb.Res. 266 282–295.
Whitaker A J 1994 Integrated geological and geophysicalmapping of Southwestern Australia; AOSO J. Aus. Geol.Geophys. 15(3) 313–328.
Zeng H 2006 Estimation of degree of polynomial Btted togravity anomalies and its applications; Geophys. Prospect.37(8) 959–973.
Corresponding editor: ARKOPROVO BISWAS
J. Earth Syst. Sci. (2021) 130:119 Page 21 of 21 119