Embed Size (px)
Citation preview
Sean GowranPresident and Country ManagerEricsson Philippines
Commercial in confidence, © Ericsson AB 2016
Global OPERATORinvestment and bandwidth management
Telecom Industry Competitiveness And Digitalization | PHILIPPINE TELECOM SUMMIT 2017 | 2017-03-01 | Page 2
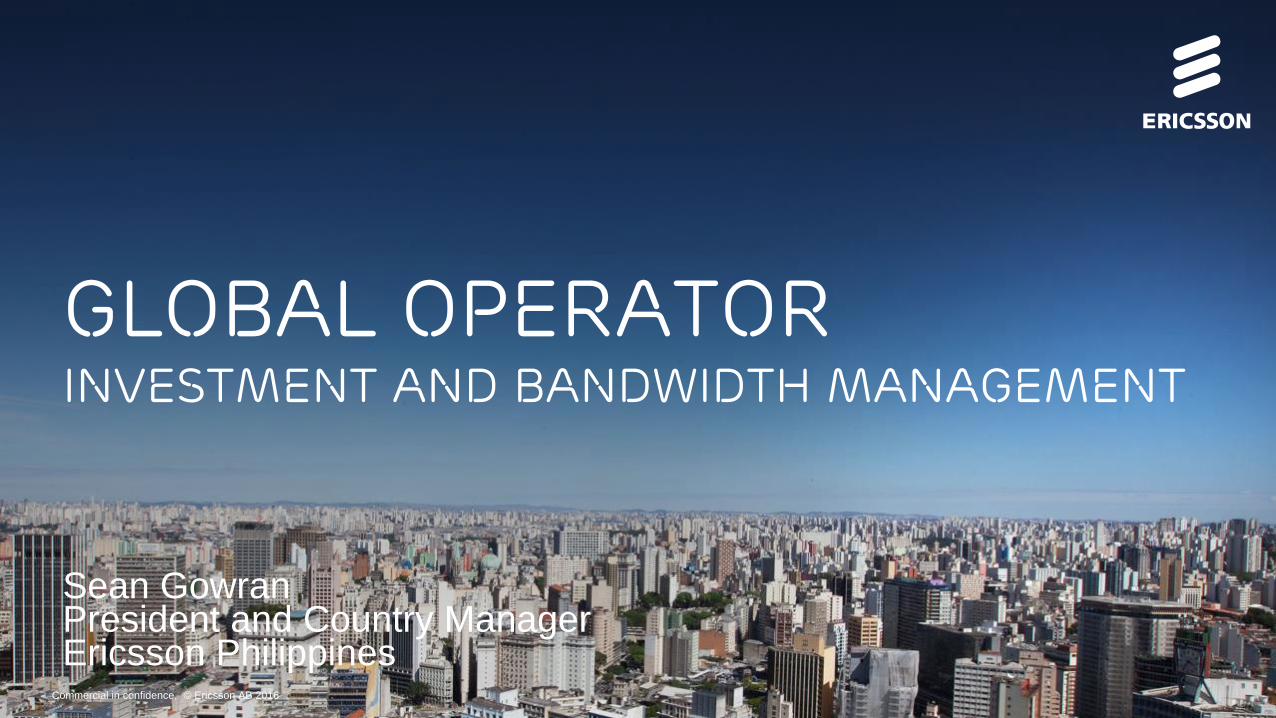
Ericsson at a glance
42,000
24,100
66,000
2.5 billion
1 billion
180
111,464
Subscribers
managed by us
Subscribers
supported by us
Services professionals Employees
Countries with customers
R&D Employees
Patents
In R&D
222.6 B. SEK Net Sales
31,6 B. SEK
NETWORKSCreate one network for
a million different needs
ITTransform IT to accelerate
business agility
MEDIADelight the TV
consumer every day
INDUSTRIESConnect industries to
accelerate performance
Full year 2016 figures
Telecom Industry Competitiveness And Digitalization | PHILIPPINE TELECOM SUMMIT 2017 | 2017-03-01 | Page 3
Philippines as ONE OF THE FASTEST GROWING MARKETS
Source: Ericsson analysis based pm The Economist Intelligence Unit (EIU) and range of financial and market analysts forecasts
Indonesia
LaosMalaysia
Myanmar
Philippines
Singapore
Thailand
Vietnam
0.0%
0.5%
1.0%
1.5%
2.0%
0.0% 1.0% 2.0% 3.0% 4.0% 5.0% 6.0% 7.0% 8.0% 9.0% 10.0%
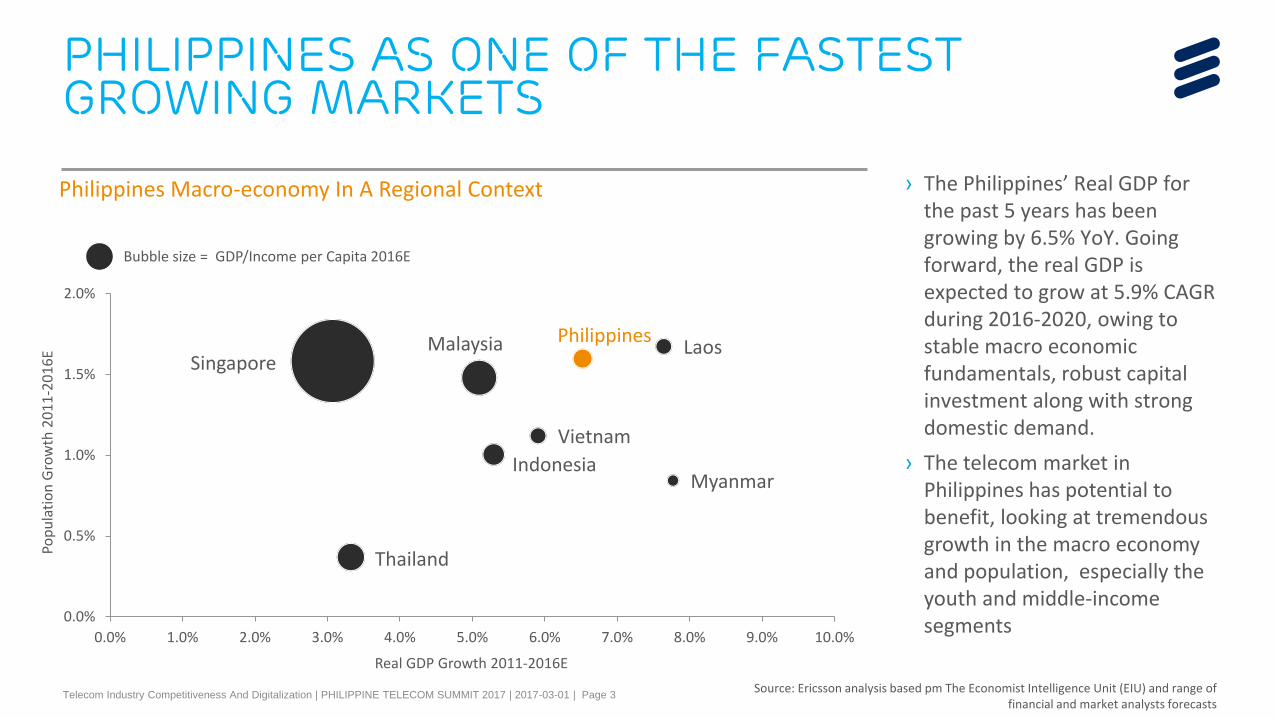
Philippines Macro-economy In A Regional Context
Real GDP Growth 2011-2016E
Pop
ula
tio
n G
row
th 2
01
1-2
01
6E
Bubble size = GDP/Income per Capita 2016E
› The Philippines’ Real GDP for the past 5 years has been growing by 6.5% YoY. Going forward, the real GDP is expected to grow at 5.9% CAGR during 2016-2020, owing to stable macro economic fundamentals, robust capital investment along with strong domestic demand.
› The telecom market in Philippines has potential to benefit, looking at tremendous growth in the macro economy and population, especially the youth and middle-income segments
Telecom Industry Competitiveness And Digitalization | PHILIPPINE TELECOM SUMMIT 2017 | 2017-03-01 | Page 4
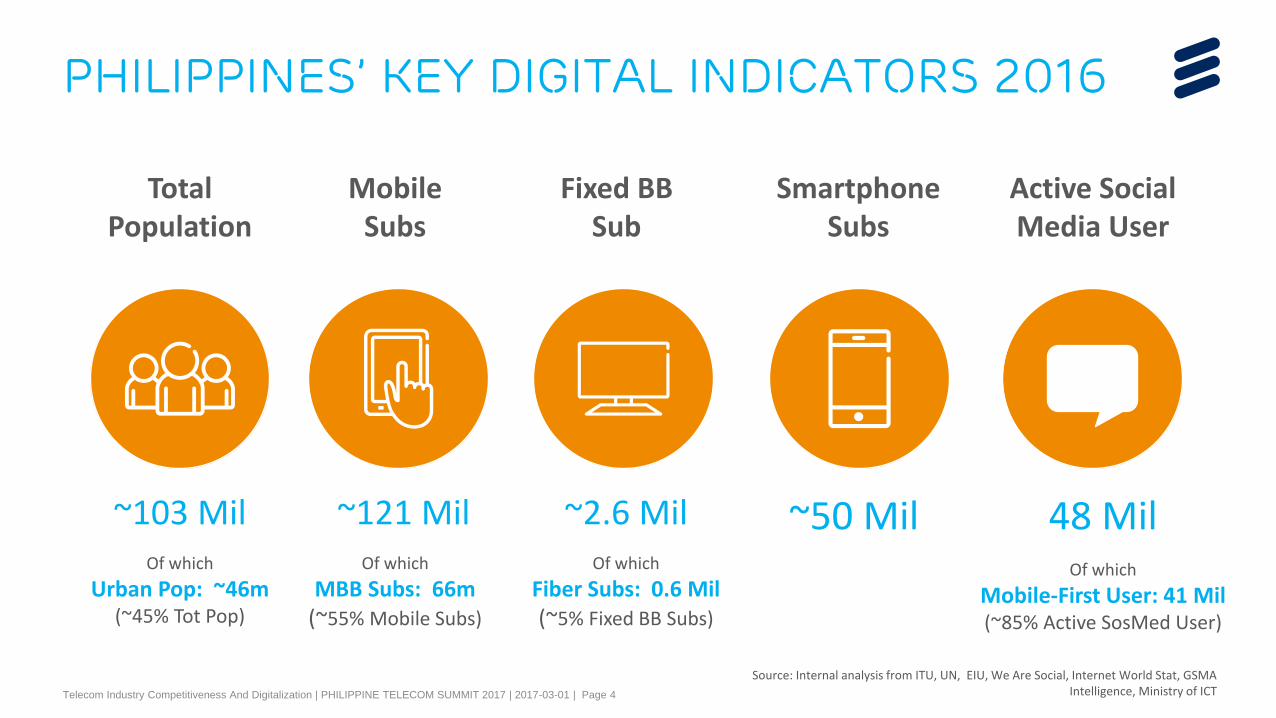
Philippines’ KEY DIGITAL INDICATORS 2016
Smartphone Subs
~50 Mil
Mobile Subs
~121 MilOf which
MBB Subs: 66m(~55% Mobile Subs)
Active Social Media User
48 MilOf which
Mobile-First User: 41 Mil(~85% Active SosMed User)
Source: Internal analysis from ITU, UN, EIU, We Are Social, Internet World Stat, GSMA Intelligence, Ministry of ICT
Total Population
~103 MilOf which
Urban Pop: ~46m(~45% Tot Pop)
Fixed BBSub
~2.6 MilOf which
Fiber Subs: 0.6 Mil(~5% Fixed BB Subs)
Telecom Industry Competitiveness And Digitalization | PHILIPPINE TELECOM SUMMIT 2017 | 2017-03-01 | Page 5
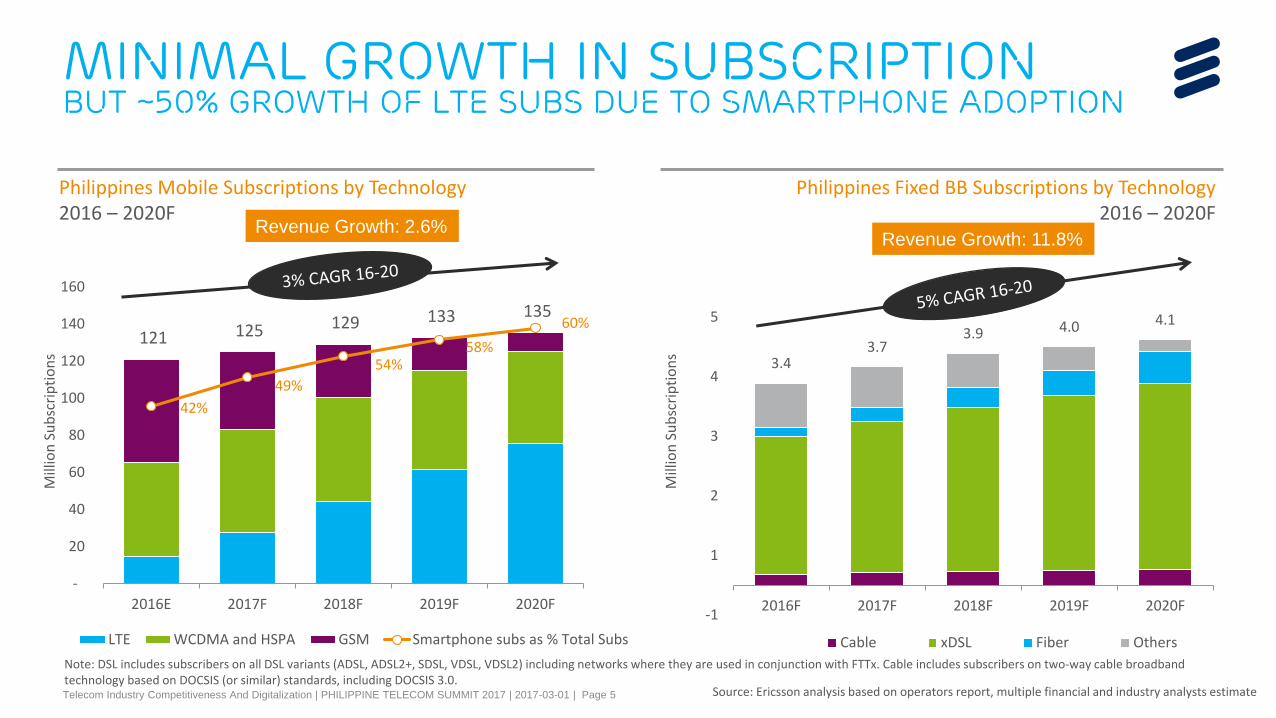
Philippines Mobile Subscriptions by Technology 2016 – 2020F
Philippines Fixed BB Subscriptions by Technology2016 – 2020F
121 125 129 133 135
42%
49%
54%58%
60%
0%
10%
20%
30%
40%
50%
60%
70%
-
20
40
60
80
100
120
140
160
2016E 2017F 2018F 2019F 2020F
LTE WCDMA and HSPA GSM Smartphone subs as % Total Subs
Mill
ion
Su
bsc
rip
tio
ns
Mill
ion
Su
bsc
rip
tio
ns
Source: Ericsson analysis based on operators report, multiple financial and industry analysts estimate
3.43.7
3.9 4.0 4.1
-1
1
2
3
4
5
2016F 2017F 2018F 2019F 2020F
Cable xDSL Fiber Others
Note: DSL includes subscribers on all DSL variants (ADSL, ADSL2+, SDSL, VDSL, VDSL2) including networks where they are used in conjunction with FTTx. Cable includes subscribers on two-way cable broadband technology based on DOCSIS (or similar) standards, including DOCSIS 3.0.
Minimal growth in subscriptionbut ~50% growth of lte subs due to smartphone adoption
Revenue Growth: 2.6%Revenue Growth: 11.8%
Telecom Industry Competitiveness And Digitalization | PHILIPPINE TELECOM SUMMIT 2017 | 2017-03-01 | Page 6
-
5
10
15
20
25
30
35
40
45
2010 2011 2012 2013 2014 2015 2016 2017 2018 2019 2020
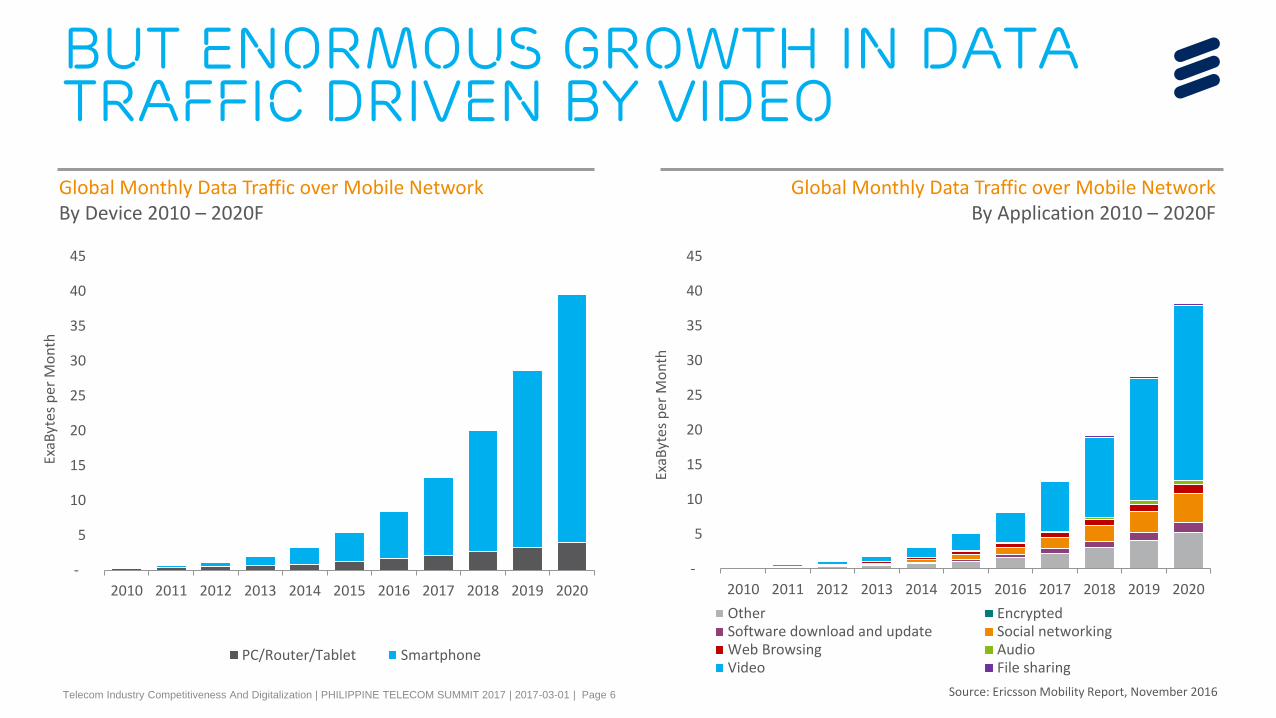
PC/Router/Tablet Smartphone
Global Monthly Data Traffic over Mobile NetworkBy Device 2010 – 2020F
ExaB
ytes
per
Mo
nth
Global Monthly Data Traffic over Mobile NetworkBy Application 2010 – 2020F
-
5
10
15
20
25
30
35
40
45
2010 2011 2012 2013 2014 2015 2016 2017 2018 2019 2020
Other EncryptedSoftware download and update Social networkingWeb Browsing AudioVideo File sharing
Source: Ericsson Mobility Report, November 2016
ExaB
ytes
per
Mo
nth
but enormous growth in data traffic driven by video
Telecom Industry Competitiveness And Digitalization | PHILIPPINE TELECOM SUMMIT 2017 | 2017-03-01 | Page 7
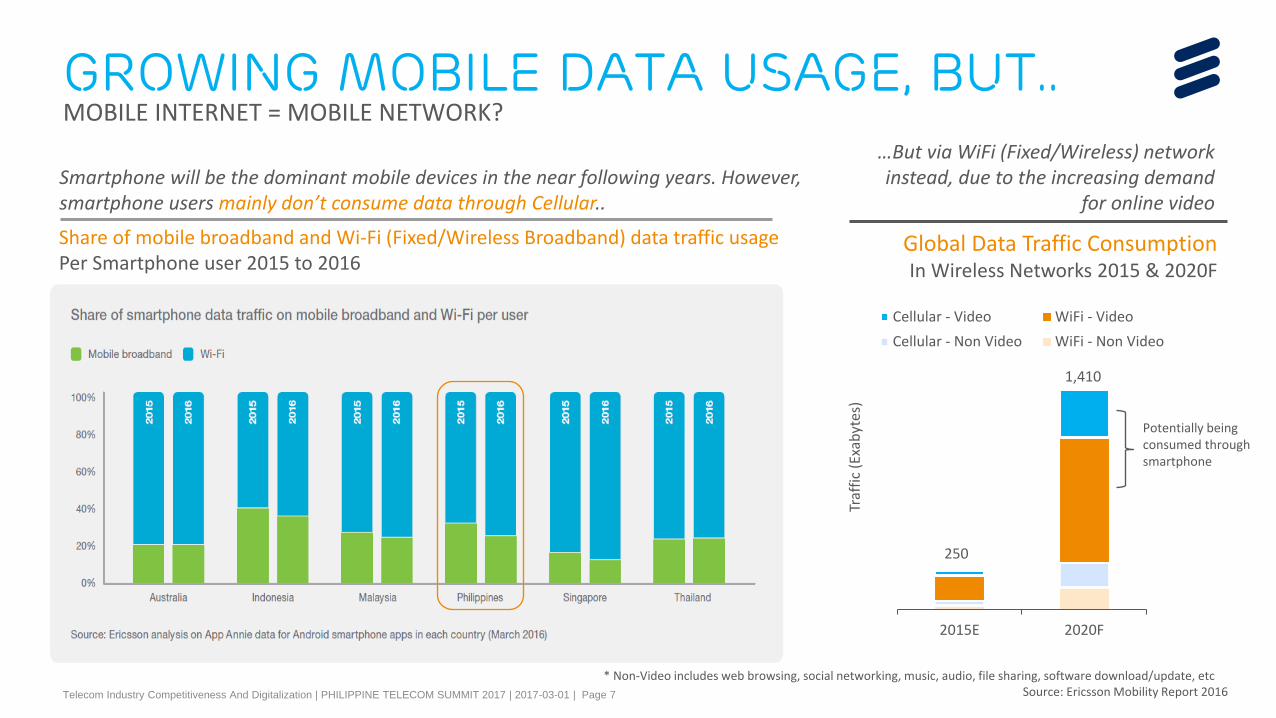
GROWING MOBILE data USAGE, BUT..MOBILE INTERNET = MOBILE NETWORK?
Share of mobile broadband and Wi-Fi (Fixed/Wireless Broadband) data traffic usage Per Smartphone user 2015 to 2016
Source: Ericsson Mobility Report 2016* Non-Video includes web browsing, social networking, music, audio, file sharing, software download/update, etc
Global Data Traffic Consumption In Wireless Networks 2015 & 2020F
250
1,410
2015E 2020F
Cellular - Video WiFi - Video
Cellular - Non Video WiFi - Non Video
Potentially being consumed through smartphone
…But via WiFi (Fixed/Wireless) network instead, due to the increasing demand
for online video
Traf
fic
(Exa
byt
es)
Smartphone will be the dominant mobile devices in the near following years. However, smartphone users mainly don’t consume data through Cellular..
Telecom Industry Competitiveness And Digitalization | PHILIPPINE TELECOM SUMMIT 2017 | 2017-03-01 | Page 8
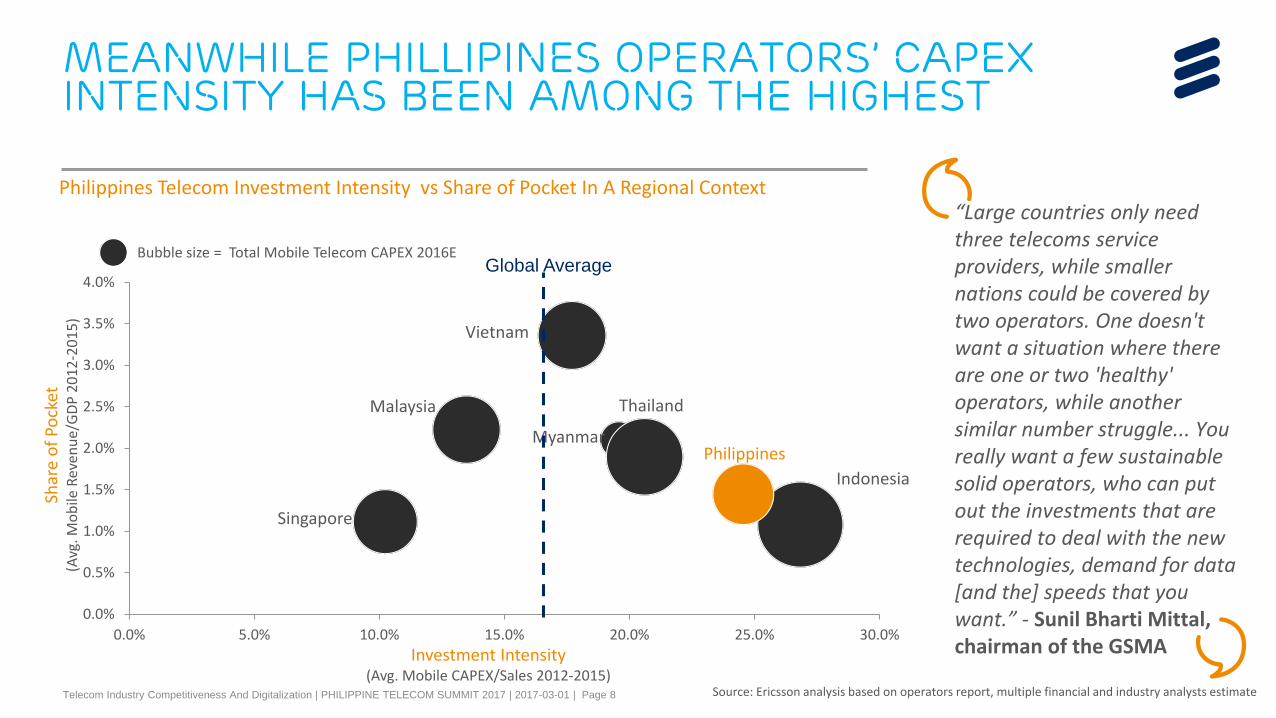
MEANWHILE PHILLIPINES OPERATORS’ CAPEX INTENSITY HAS BEEN AMONG THE HIGHEST
Indonesia
Malaysia
MyanmarPhilippines
Singapore
Thailand
Vietnam
0.0%
0.5%
1.0%
1.5%
2.0%
2.5%
3.0%
3.5%
4.0%
0.0% 5.0% 10.0% 15.0% 20.0% 25.0% 30.0%
Philippines Telecom Investment Intensity vs Share of Pocket In A Regional Context
Investment Intensity (Avg. Mobile CAPEX/Sales 2012-2015)
Shar
e o
f Po
cket
(A
vg. M
ob
ile R
even
ue
/GD
P 2
01
2-2
01
5)
Bubble size = Total Mobile Telecom CAPEX 2016E
“Large countries only need three telecoms service providers, while smaller nations could be covered by two operators. One doesn't want a situation where there are one or two 'healthy' operators, while another similar number struggle... You really want a few sustainable solid operators, who can put out the investments that are required to deal with the new technologies, demand for data [and the] speeds that you want.” - Sunil Bharti Mittal, chairman of the GSMA
Source: Ericsson analysis based on operators report, multiple financial and industry analysts estimate
Global Average
Telecom Industry Competitiveness And Digitalization | PHILIPPINE TELECOM SUMMIT 2017 | 2017-03-01 | Page 9
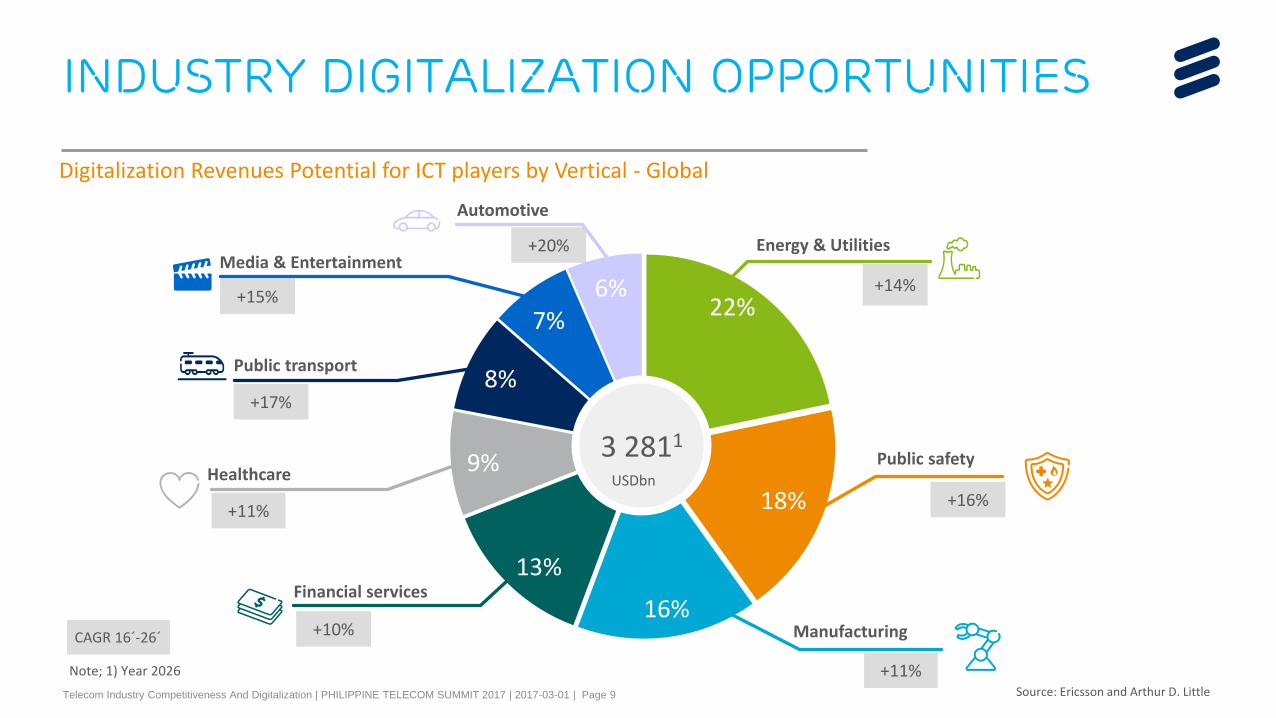
Industry digitalization opportunities
Note; 1) Year 2026
Energy & Utilities
Automotive
Media & Entertainment
Public transport
Healthcare
Financial services
Public safety
+16%
+10%
+14%
+20%
+15%
+17%
+11%
3 2811
CAGR 16´-26´
USDbn
Manufacturing
+11%
22%
8%
7%6%
18%
9%
13%
16%
Source: Ericsson and Arthur D. Little
Digitalization Revenues Potential for ICT players by Vertical - Global
Telecom Industry Competitiveness And Digitalization | PHILIPPINE TELECOM SUMMIT 2017 | 2017-03-01 | Page 10
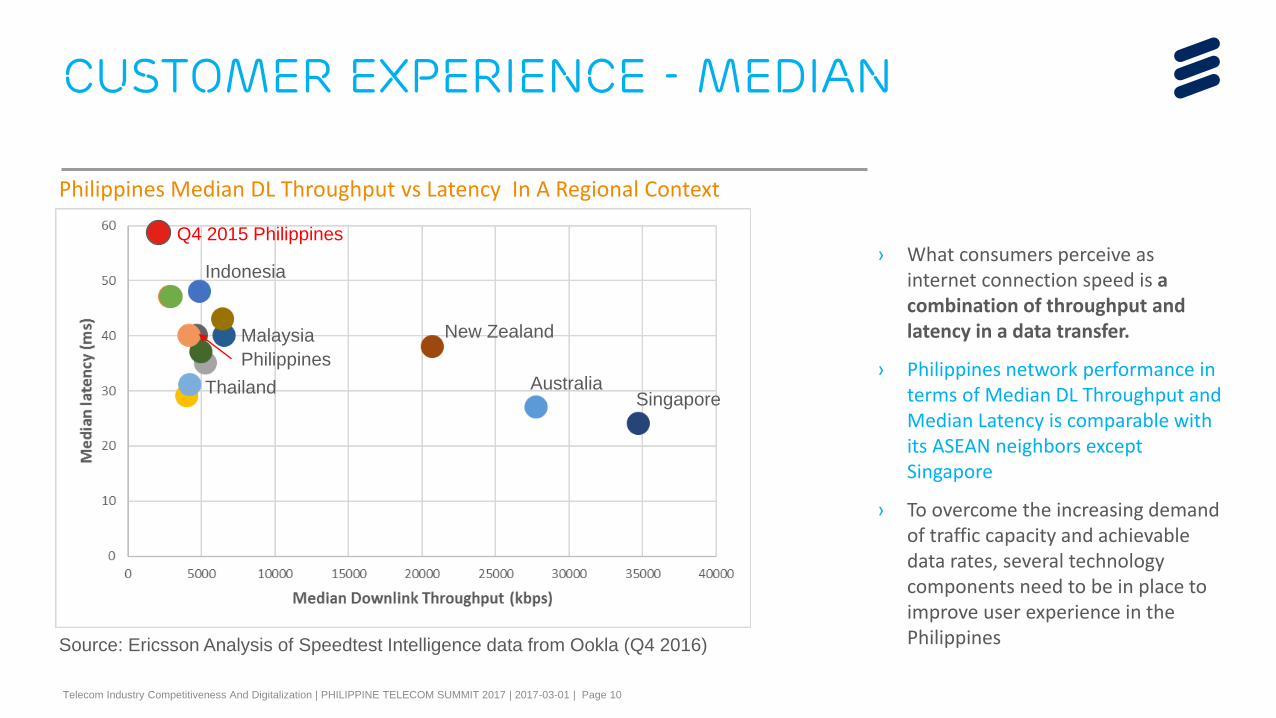
Philippines Median DL Throughput vs Latency In A Regional Context
› What consumers perceive as internet connection speed is a combination of throughput and latency in a data transfer.
› Philippines network performance in terms of Median DL Throughput and Median Latency is comparable with its ASEAN neighbors except Singapore
› To overcome the increasing demand of traffic capacity and achievable data rates, several technology components need to be in place to improve user experience in the Philippines Source: Ericsson Analysis of Speedtest Intelligence data from Ookla (Q4 2016)
AustraliaSingapore
New Zealand
Philippines
Indonesia
Thailand
Malaysia
Customer experience - median
Q4 2015 Philippines
Telecom Industry Competitiveness And Digitalization | PHILIPPINE TELECOM SUMMIT 2017 | 2017-03-01 | Page 11
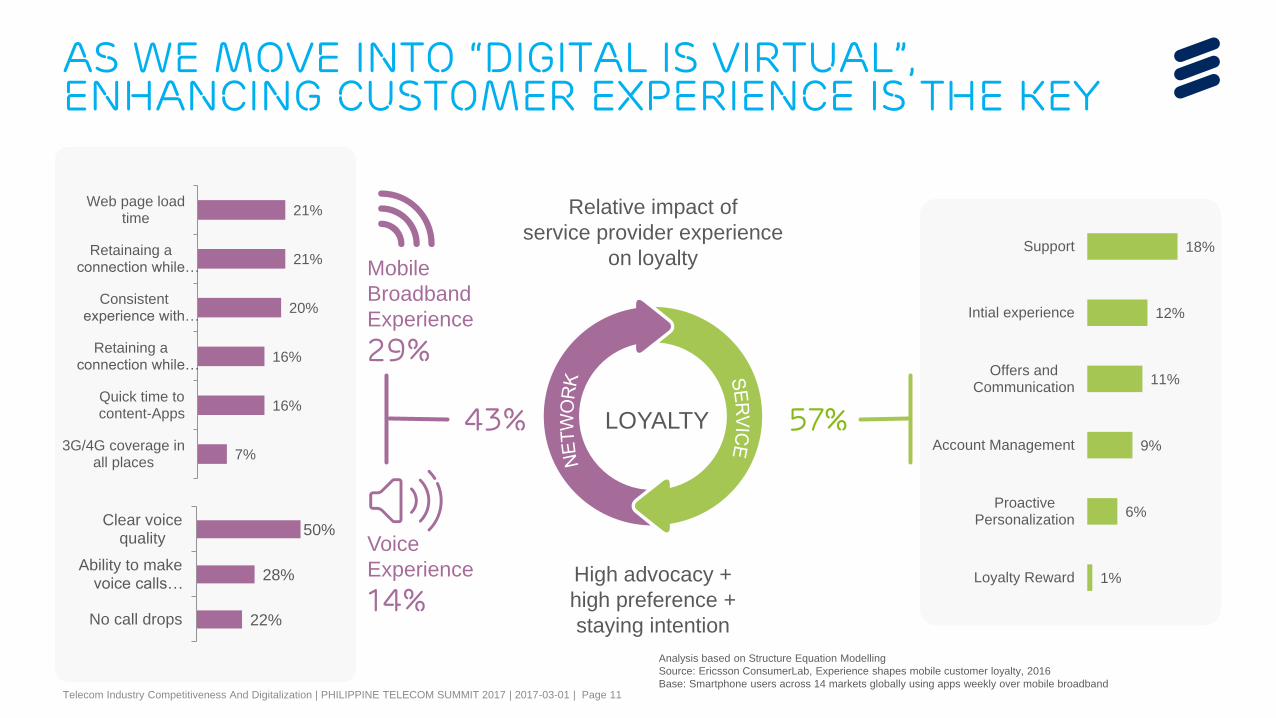
As we move into “digital is virtual”, enhancing CUSTOMER experience is THE key
18%
12%
11%
9%
6%
1%
Support
Intial experience
Offers andCommunication
Account Management
ProactivePersonalization
Loyalty Reward
21%
21%
20%
16%
16%
7%
Web page loadtime
Retainaing aconnection while…
Consistentexperience with…
Retaining aconnection while…
Quick time tocontent-Apps
3G/4G coverage inall places
50%
28%
22%
Clear voicequality
Ability to makevoice calls…
No call drops
LOYALTY
Relative impact of
service provider experience
on loyalty
High advocacy +
high preference +
staying intention
Mobile
Broadband
Experience
29%
Voice
Experience
14%
43% 57%
Analysis based on Structure Equation Modelling
Source: Ericsson ConsumerLab, Experience shapes mobile customer loyalty, 2016
Base: Smartphone users across 14 markets globally using apps weekly over mobile broadband
Telecom Industry Competitiveness And Digitalization | PHILIPPINE TELECOM SUMMIT 2017 | 2017-03-01 | Page 12
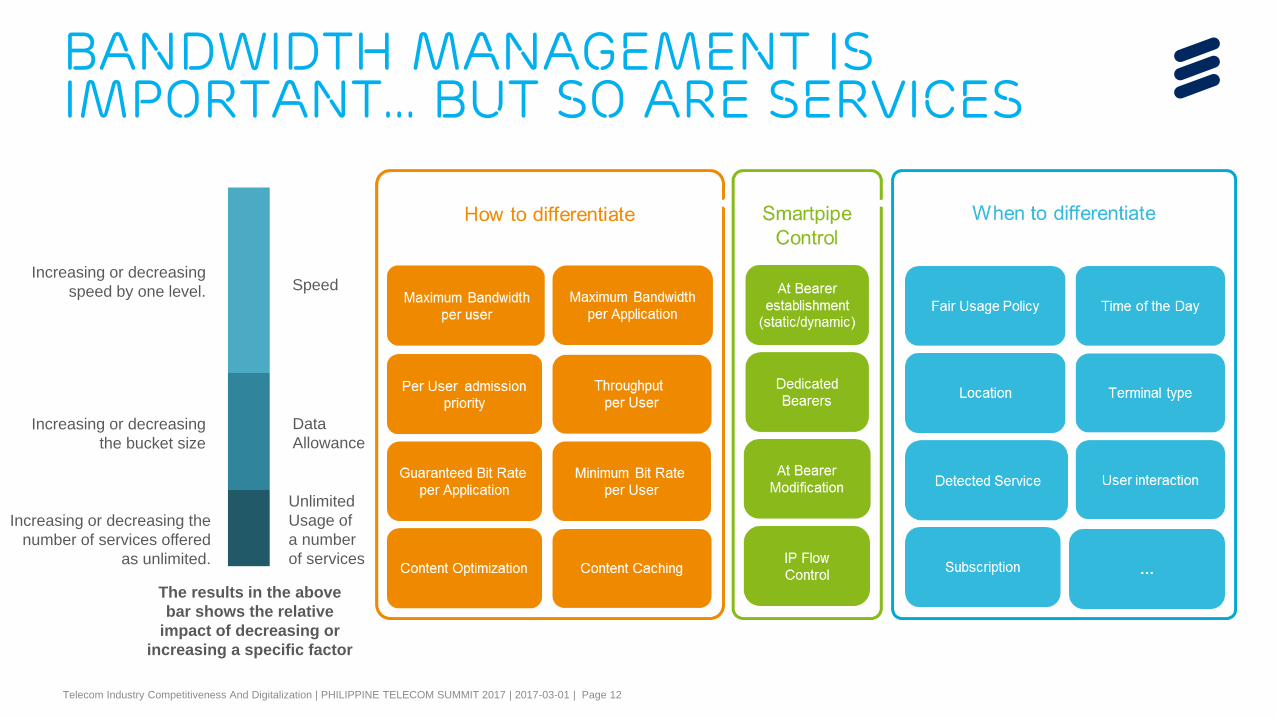
Bandwidth management is important... but so are services
Speed
Data
Allowance
Unlimited
Usage of
a number
of services
Increasing or decreasing
speed by one level.
Increasing or decreasing
the bucket size
Increasing or decreasing the
number of services offered
as unlimited.
The results in the above
bar shows the relative
impact of decreasing or
increasing a specific factor
Telecom Industry Competitiveness And Digitalization | PHILIPPINE TELECOM SUMMIT 2017 | 2017-03-01 | Page 13
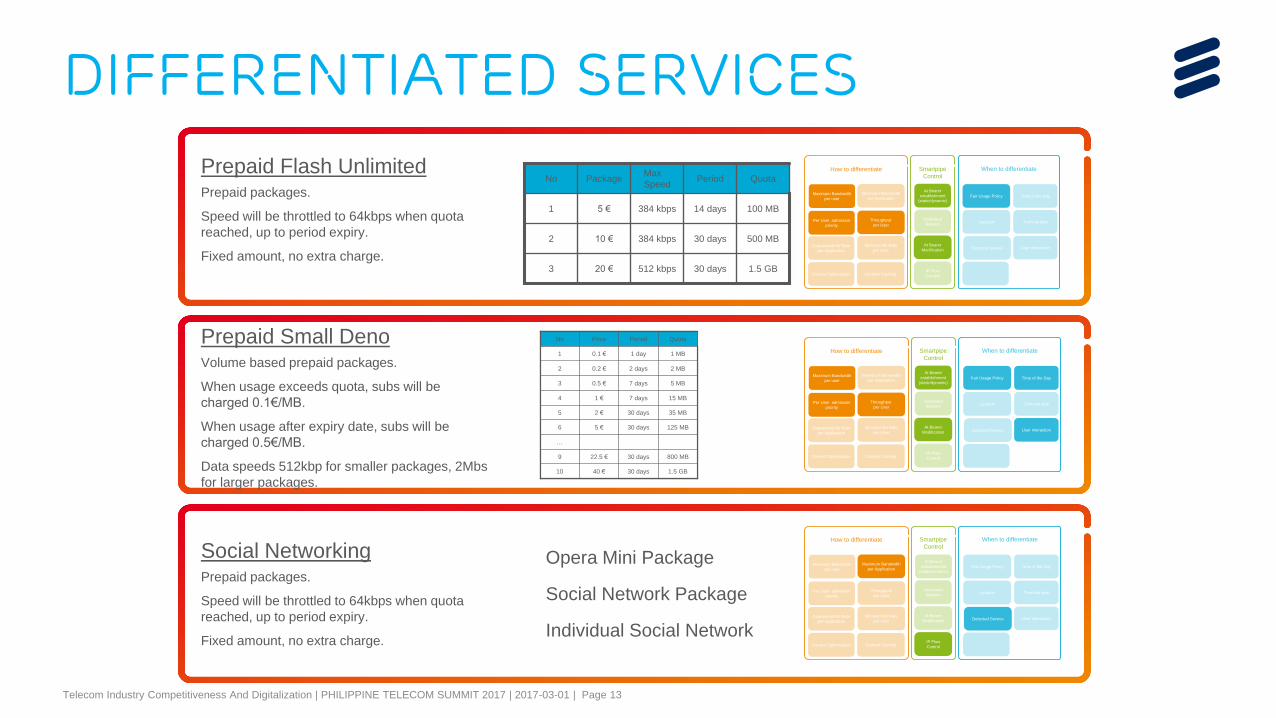
differentiated Services
1.5 GB
500 MB
100 MB
Quota
30 days512 kbps20 €3
30 days384 kbps10 €2
14 days384 kbps 5 €1
PeriodMax
SpeedPackageNo
Prepaid packages.
Speed will be throttled to 64kbps when quota
reached, up to period expiry.
Fixed amount, no extra charge.
Prepaid Flash Unlimited
Volume based prepaid packages.
When usage exceeds quota, subs will be
charged 0.1€/MB.
When usage after expiry date, subs will be
charged 0.5€/MB.
Data speeds 512kbp for smaller packages, 2Mbs
for larger packages.
Prepaid Small Deno
Prepaid packages.
Speed will be throttled to 64kbps when quota
reached, up to period expiry.
Fixed amount, no extra charge.
Social Networking
When to differentiateHow to differentiate Smartpipe
Control
Maximum Bandwidth
per user
Per User admission
priority
Throughput
per User
Content Caching
Guaranteed Bit Rate
per Application
Content Optimization
Minimum Bit Rate
per User
Fair Usage Policy Time of the Day
Location Terminal type
User interaction
…
At Bearer
Modification
At Bearer
establishment
(static/dynamic)
Dedicated
Bearers
IP Flow
Control
Maximum Bandwidth
per Application
Detected Service
1.5 GB30 days40 €10
800 MB30 days22.5 €9
…
125 MB30 days5 €6
35 MB30 days2 €5
15 MB7 days1 €4
5 MB
2 MB
1 MB
Quota
7 days0.5 €3
2 days0.2 €2
1 day0.1 €1
PeriodPriceNo
1.5 GB30 days40 €10
800 MB30 days22.5 €9
…
125 MB30 days5 €6
35 MB30 days2 €5
15 MB7 days1 €4
5 MB
2 MB
1 MB
Quota
7 days0.5 €3
2 days0.2 €2
1 day0.1 €1
PeriodPriceNo
When to differentiateHow to differentiate Smartpipe
Control
Maximum Bandwidth
per user
Per User admission
priority
Throughput
per User
Content Caching
Guaranteed Bit Rate
per Application
Content Optimization
Minimum Bit Rate
per User
Fair Usage Policy Time of the Day
Location Terminal type
User interaction
…
At Bearer
Modification
At Bearer
establishment
(static/dynamic)
Dedicated
Bearers
IP Flow
Control
Maximum Bandwidth
per Application
Detected Service
Opera Mini Package
Social Network Package
Individual Social Network
When to differentiateHow to differentiate Smartpipe
Control
Maximum Bandwidth
per user
Per User admission
priority
Throughput
per User
Content Caching
Guaranteed Bit Rate
per Application
Content Optimization
Minimum Bit Rate
per User
Fair Usage Policy Time of the Day
Location Terminal type
User interaction
…
At Bearer
Modification
At Bearer
establishment
(static/dynamic)
Dedicated
Bearers
IP Flow
Control
Maximum Bandwidth
per Application
Detected Service
Telecom Industry Competitiveness And Digitalization | PHILIPPINE TELECOM SUMMIT 2017 | 2017-03-01 | Page 14
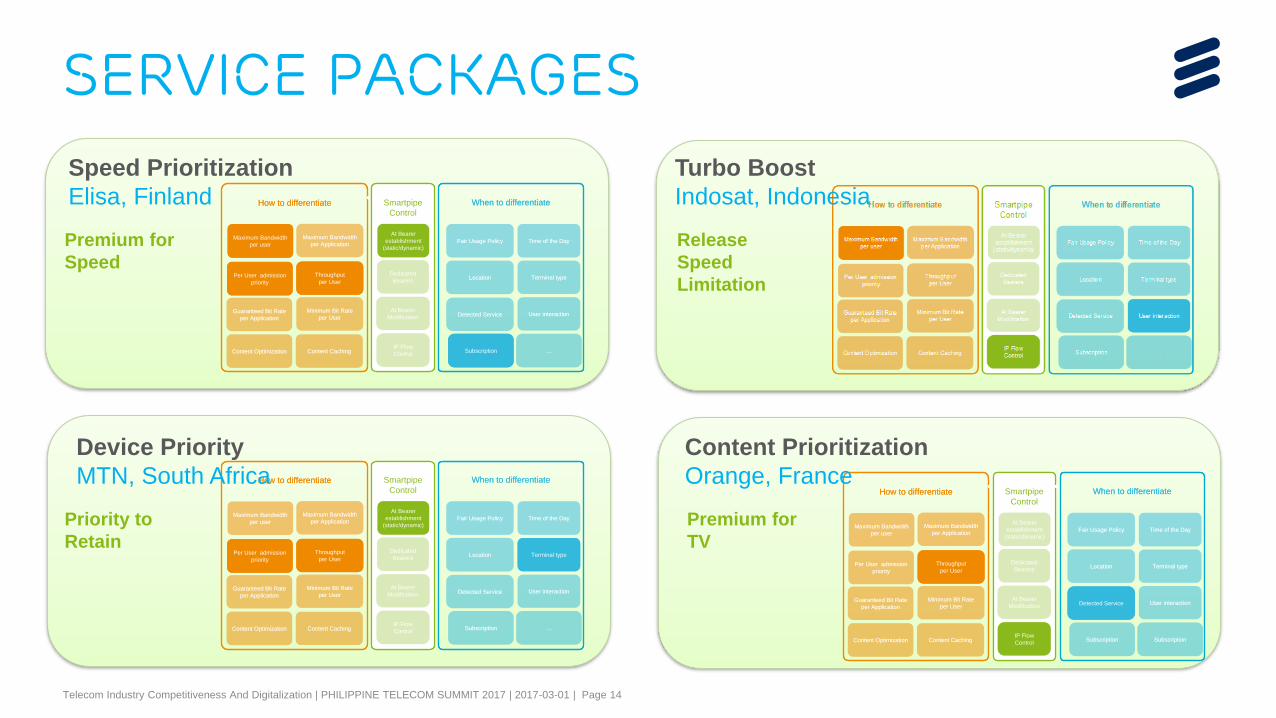
Service packages
When to differentiateHow to differentiate Smartpipe
Control
Maximum Bandwidth
per user
Per User admission
priority
Throughput
per User
Content Caching
Guaranteed Bit Rate
per Application
Content Optimization
Minimum Bit Rate
per User
Fair Usage Policy Time of the Day
Location Terminal type
User interaction
Subscription
At Bearer
Modification
At Bearer
establishment
(static/dynamic)
Dedicated
Bearers
IP Flow
Control
Maximum Bandwidth
per Application
Detected Service
…
Speed Prioritization
Elisa, Finland
Turbo Boost
Indosat, Indonesia
When to differentiateHow to differentiate Smartpipe
Control
Maximum Bandwidth
per user
Per User admission
priority
Throughput
per User
Content Caching
Guaranteed Bit Rate
per Application
Content Optimization
Minimum Bit Rate
per User
Fair Usage Policy Time of the Day
Location Terminal type
User interaction
Subscription
At Bearer
Modification
At Bearer
establishment
(static/dynamic)
Dedicated
Bearers
IP Flow
Control
Maximum Bandwidth
per Application
Detected Service
…
Device Priority
MTN, South AfricaWhen to differentiateHow to differentiate Smartpipe
Control
Maximum Bandwidth
per user
Per User admission
priority
Throughput
per User
Content Caching
Guaranteed Bit Rate
per Application
Content Optimization
Minimum Bit Rate
per User
Fair Usage Policy Time of the Day
Location Terminal type
User interaction
Subscription
At Bearer
Modification
At Bearer
establishment
(static/dynamic)
Dedicated
Bearers
IP Flow
Control
Maximum Bandwidth
per Application
Detected Service
Subscription
When to differentiateHow to differentiate Smartpipe
Control
Maximum Bandwidth
per user
Per User admission
priority
Throughput
per User
Content Caching
Guaranteed Bit Rate
per Application
Content Optimization
Minimum Bit Rate
per User
Fair Usage Policy Time of the Day
Location Terminal type
User interaction
Subscription
At Bearer
Modification
At Bearer
establishment
(static/dynamic)
Dedicated
Bearers
IP Flow
Control
Maximum Bandwidth
per Application
Detected Service
Subscription
Content Prioritization
Orange, France
Premium for
Speed
Release
Speed
Limitation
Priority to
Retain
Premium for
TV
Telecom Industry Competitiveness And Digitalization | PHILIPPINE TELECOM SUMMIT 2017 | 2017-03-01 | Page 15Commercial in confidence, © Ericsson AB 2016
• Minimal growth in subscription and forecasted mobile revenues but enormous
growth in data traffic driven by video and adoption of smartphones
• Migration to newer technology, e.g., LTE, is key to provide efficient network and better
customer experience
• Service providers must capitalize on Industries’ Digitalization revenue opportunities
• Philippines’ telecom services providers are investing on network infrastructure
above global average in terms of CAPEX/Revenue
• Bandwidth Management is necessary but so are services
Key takeaways