Embed Size (px)
Citation preview
Impact of clim
ate change on plant grow
th and nutrition
-Small Study G
roup 2018-
1University of Vienna (BOKU), Department of Natural Resources and
Life Sciences, Austria 2University of Novi Sad, Faculty of Agriculture, Novi Sad, Serbia 3University of Florence, Departm
ent of Agrifood Production and Environmental Sciences, Italy
Workshop 2018
SERBIA FOR EXCELL, W
ORKSHO
P, 2018
Lukas Koppensteiner 1, Anh Mai Thi Tran
1, Tijana Narandžić
2, Carolina Fabbri 3, Milena Daničić2

Wo
rksho
p, 2
01
8 N
ovi Sad
•The increasing w
orld population is putting stress on rising demands for crop
production. By 2050, global agricultural production w
ill have to double to meet the
future demands.
•
Clim
ate projections predict changes in atmospheric C
O2 level, tem
perature and rainfall pattern.
•There is high concern about direct im
pact of climate change on agriculture.
•
Uncertainties related to representation of higher C
O2 level and tem
perature dem
onstrate that further knowledge upon effect of clim
ate change on agriculture is needed.
•To get better insight to im
pact of climate change on agriculture, different aspects of
agricultural production, such as crop growth and nutrition, m
ust be investigated.
Ge
ne
ral intro
du
ction

Wo
rksho
p, 2
01
8 N
ovi Sad
Objective
• To discuss
aspects, benefits,
disadvantages and
the practical
applicability of
spectral measurem
ents and selected vegetation indices in plant production and clim
ate change research. Spectral m
easurements
¾radiation reflected by a given vegetation cover is detected
¾used to calculate algorithm
s called “vegetation indices” (VIs).
Vegetation indices num
erous applications – e.g. measure plant properties, predict yields, detect w
eeds and diseases, investigate effects of clim
ate change on crops.
1. Spectral measurem
ents and selected vegetation indices in plant production and clim
ate change

Wo
rksho
p, 2
01
8 N
ovi Sad
General inform
ation on radiation ¾
light reaches an object => radiation is absorbed/transm
itted/reflected ¾
spectral measurem
ents detect the reflected radiation Spectral characteristics of plant canopy ¾
many plant properties have an im
pact on spectral reflectance of crops at certain w
avelengths
wavelengths < 700 nm
: low reflectance; light absorption by chlorophyll
wavelengths > 700 nm
: high reflectance; not used for photosynthesis
Spectral measurem
ents
Distinct spectral reflectance curve of green plant canopy (M
ulla, 2013)

Wo
rksho
p, 2
01
8 N
ovi Sad
Differences betw
een platforms
altitude, spatial and spectral resolution, return frequency
Satellites ¾
return frequency, spatial resolution, cloudy conditions ¾
estimation of crop biom
ass and yields on a regional scale
Aerial system
s ¾
transition platform, cloudy conditions
¾real-tim
e site-specific agricultural managem
ent decision making
Proximal system
s ¾
active and passive spectrometers
¾on-the-go detection of plant properties
Platfo
rms fo
r con
du
cting sp
ectral
me
asure
me
nts
Conducting spectral
measurem
ents using a handheld spectrom
eter (AS
D, 2010)

Wo
rksho
p, 2
01
8 N
ovi Sad
Selected vegetation indices N
DVI (N
ormalised D
ifference Vegetation Index) ¾
reflectance ratio at near infrared (~ 790 nm) and red bands (~ 670 nm
) ¾
useful for assessing LAI and plant biomass
¾soil reflectance at low
canopy densities affects ND
VI results
ND
RE (N
ormalised D
ifference Red E
dge) ¾
reflectance ratio at near infrared (~ 790 nm) and red edge bands
(~ 720 nm)
¾sensitive to high levels of chlorophyll content
CC
CI (C
anopy Chlorophyll C
ontent Index) ¾
based on NDVI and N
DRE
¾used to m
easure plant N nutrition

Wo
rksho
p, 2
01
8 N
ovi Sad
Goal
Estim
ating plant N status via C
CC
I and CN
I (Canopy N
itrogen Index) by combining
spectral measurem
ents and crop models for various crops (w
heat, maize, potato
and sugar beet).
Current B
OK
U project on spectral measurem
ents and VIs (C
CCI)
Conducting spectral
measurem
ents at BO
KU
Relationship betw
een CC
CI
and CN
I in wheat (Fitzgerald et al., 2010)

Wo
rksho
p, 2
01
8 N
ovi Sad
Goal
gather knowledge on the typical responses of plants to the various effects of
climate change and their im
pacts on crop production A
pproach com
bining available long-term and large-scale data on historical w
eather as well
as indirect measurem
ents of various plant canopy characteristics based on spectral sensing Im
provement to resource use efficiency
Optim
ised farm m
anagement based on spectral sensing (fertilization, irrigation,
plant protection measures)
Spe
ctral me
asure
me
nts an
d V
Is in clim
ate ch
ange
rese
arch

Wo
rksho
p, 2
01
8 N
ovi Sad
Challenges
¾spectra of plant canopies are influenced by various factors
¾m
any VI applications need cultivar and site-specific calibrations
¾only few
farmers have access to spectral data of their crops
Opportunities
¾optim
ized farm m
anagement strategies
¾increase in farm
profitability ¾
reduction in environmental pollution
¾better estim
ation of the climate change effects on crops
Challenges and opportunities of spectral m
easurements
and VIs in plant production

Wo
rksho
p, 2
01
8 N
ovi Sad
Research questions
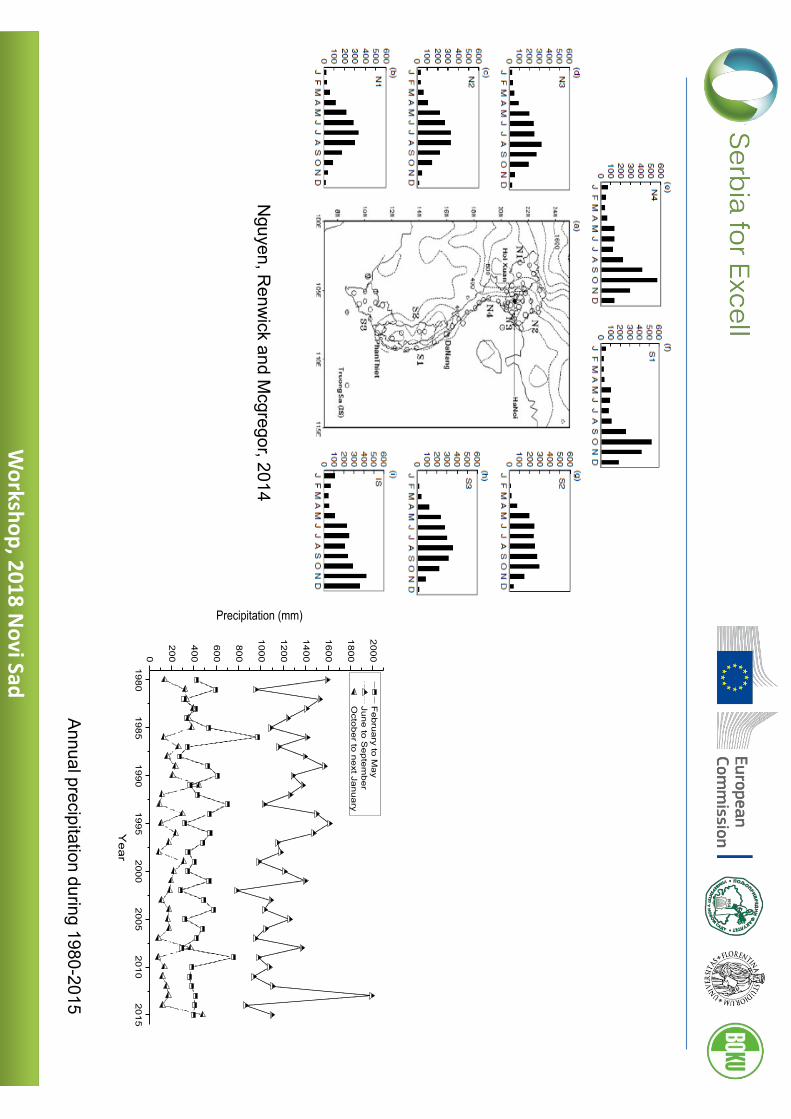
• How
was the “behavior” of clim
ate in the last three decades in Thai Nguyen province,
the mountainous area in the N
orth of Vietnam (the study area)?
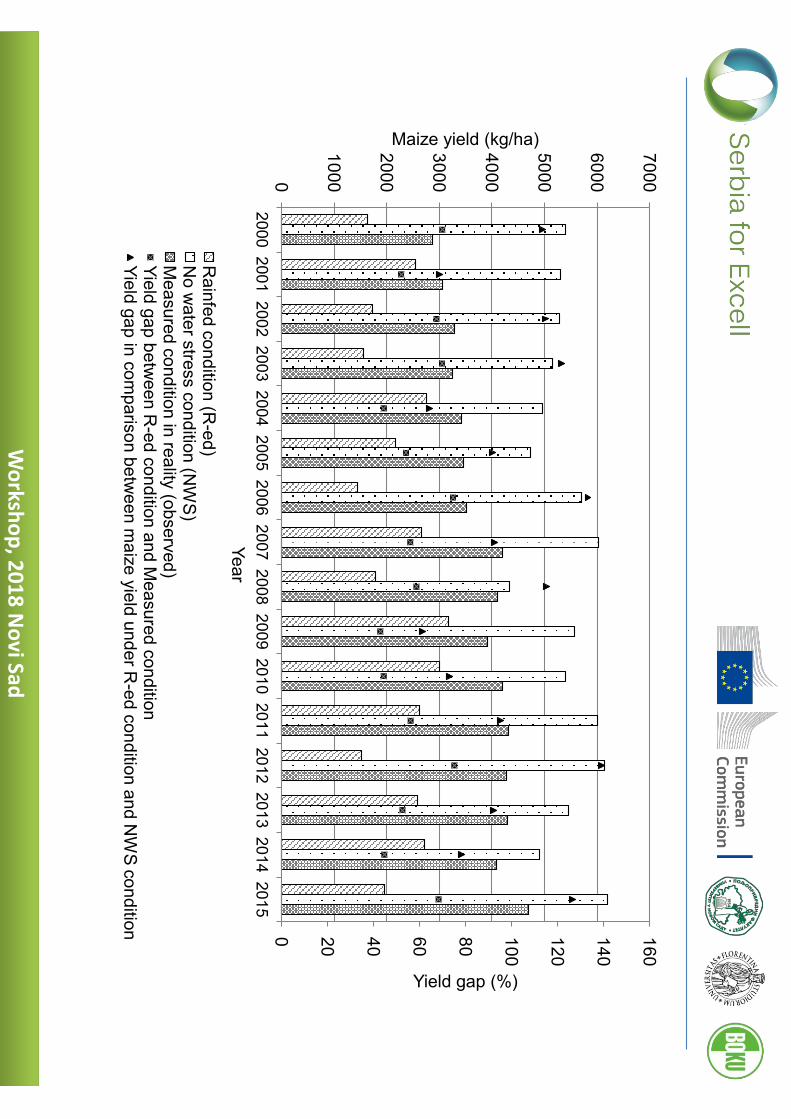
• Did historical clim
ate conditions have positive impact on m
aize production over the past 30 years in the study area?
2. Climate change and crop grow
th
Wo
rksho
p, 2
01
8 N
ovi Sad
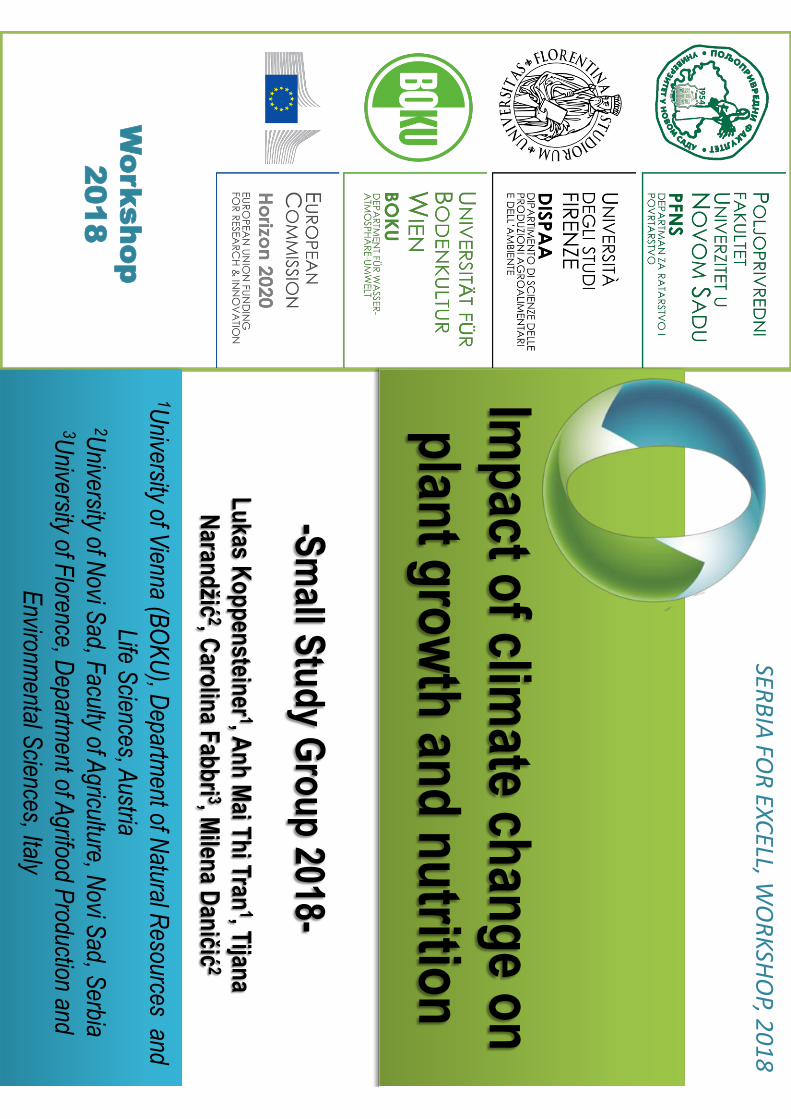
http
s://catalog.flatw
orld
kno
wled
ge.com
/bo
okh
ub
/26
57
?e=b
erglee_1
.0-ch
05
_s05
Wo
rksho
p, 2
01
8 N
ovi Sad
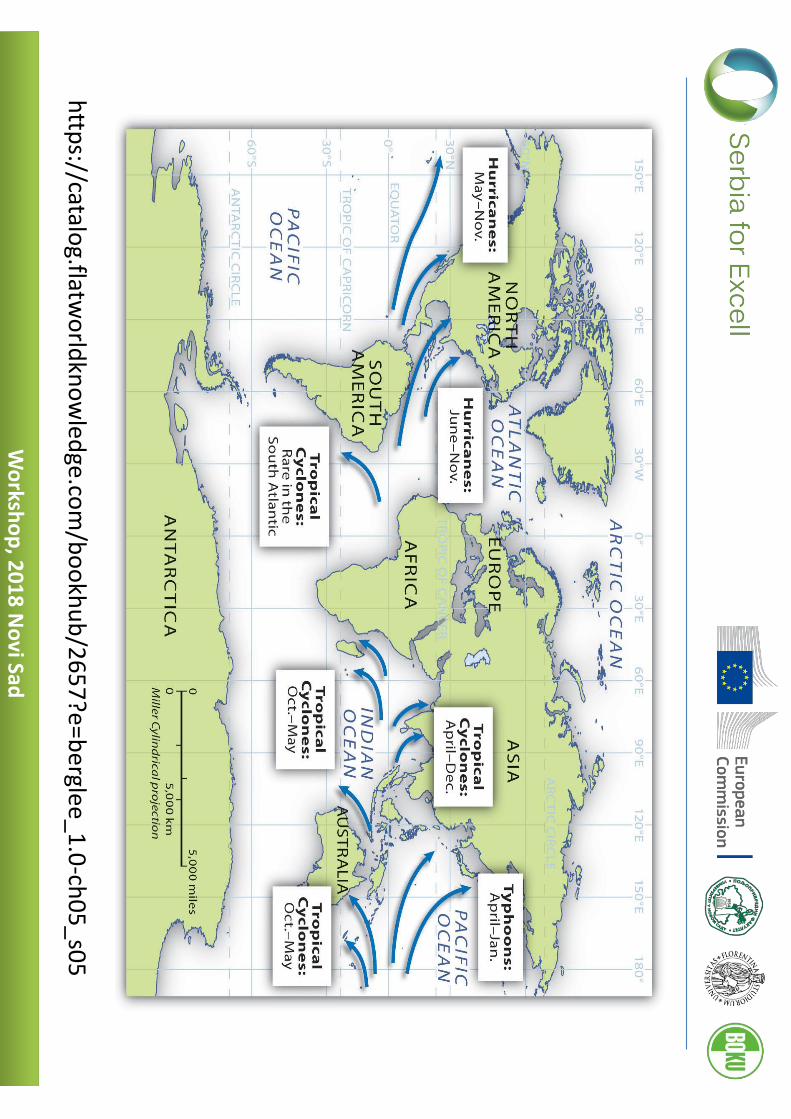
Source:
http://ww
w.colorado.edu/geography/class_homepages/geog
_3251_sum08/
Source: http://cafef.vn/thai-nguyen-nhieu-noi-ngap-lut-nghiem
-trong-do-anh-huong-cua-bao-so-6-20170825111338504.chn

Wo
rksho
p, 2
01
8 N
ovi Sad
Wo
rksho
p, 2
01
8 N
ovi Sad
1980
1985
1990
1995
2000
2005
2010
2015
0
200
400
600
800
1000
1200
1400
1600
1800
2000
Precipitation (mm)
Ye
ar
Fe
bru
ary to
Ma
y Ju
ne
to S
ep
tem
be
r O
ctob
er to
ne
xt Jan
ua
ry
Nguyen, R
enwick and M
cgregor, 2014
Annual precipitation during 1980-2015

Wo
rksho
p, 2
01
8 N
ovi Sad
12001400
16001800
20002200
24002600
2800
3000
3200
3400
3600
3800
4000
4200
4400
Observed grain yield (kg/ha)
Total annual rainfall (mm)
Equationy = a + b*x
Weight
No W
eighting
Residual Sum
of Squares
5.0942E6
Pearson's r--
Adj. R-Square
-0.45953Value
Standard Error
BIntercept
2022.01333155.75017
Slope1
--
12001300
14001500
16001700
2800
3000
3200
3400
3600
3800
4000
4200
4400
Observed grain yield (kg/ha)
Total solar radiation (hours)
Equation
y = a + b*x
Weight
No W
eightingR
esidual Sum
of S
quares4.33886E
6
Pearson's r
--A
dj. R-S
quare-0.24312
Value
Standard E
rror
BIntercept
2423.2143.74018
Slope
1--
7980
8182
83
2800
3000
3200
3400
3600
3800
4000
4200
4400
Observed grain yield (kg/ha)
Averaged annual humidity (%)
Equationy = a + b*x
Weight
No Weighting
Residual Sum
of Squares3.49583E6
Pearson's r--
Adj. R-Square-0.00159
ValueStandard Error
BIntercept
3671.4129.02255
Slope1
--
272274
276278
280282
284286
288290
292
2800
3000
3200
3400
3600
3800
4000
4200
4400
Observed grain yield (kg/ha)
Total annual temperature (Celsius degree)Equation
y = a + b*xW
eightNo W
eightingResidual Sum
of Squares
3.50446E6
Pearson's r--
Adj. R-Square-0.00406
ValueStandard Error
BIntercept
3468.13333129.18158
Slope1
--
Wo
rksho
p, 2
01
8 N
ovi Sad
0 20
40
60
80
100
120
140
160
0
1000
2000
3000
4000
5000
6000
7000
2000 2001 2002 2003 2004 2005 2006 2007 2008 2009 2010 2011 2012 2013 2014 2015
Yield gap (%)
Maize yield (kg/ha)
Year R
ainfed condition (R-ed)
No w
ater stress condition (NW
S)
Measured condition in reality (observed)
Yield gap between R
-ed condition and Measured condition
Yield gap in comparison betw
een maize yield under R
-ed condition and NW
S condition

Wo
rksho
p, 2
01
8 N
ovi Sad
(Anh, 2016)
Wo
rksho
p, 2
01
8 N
ovi Sad
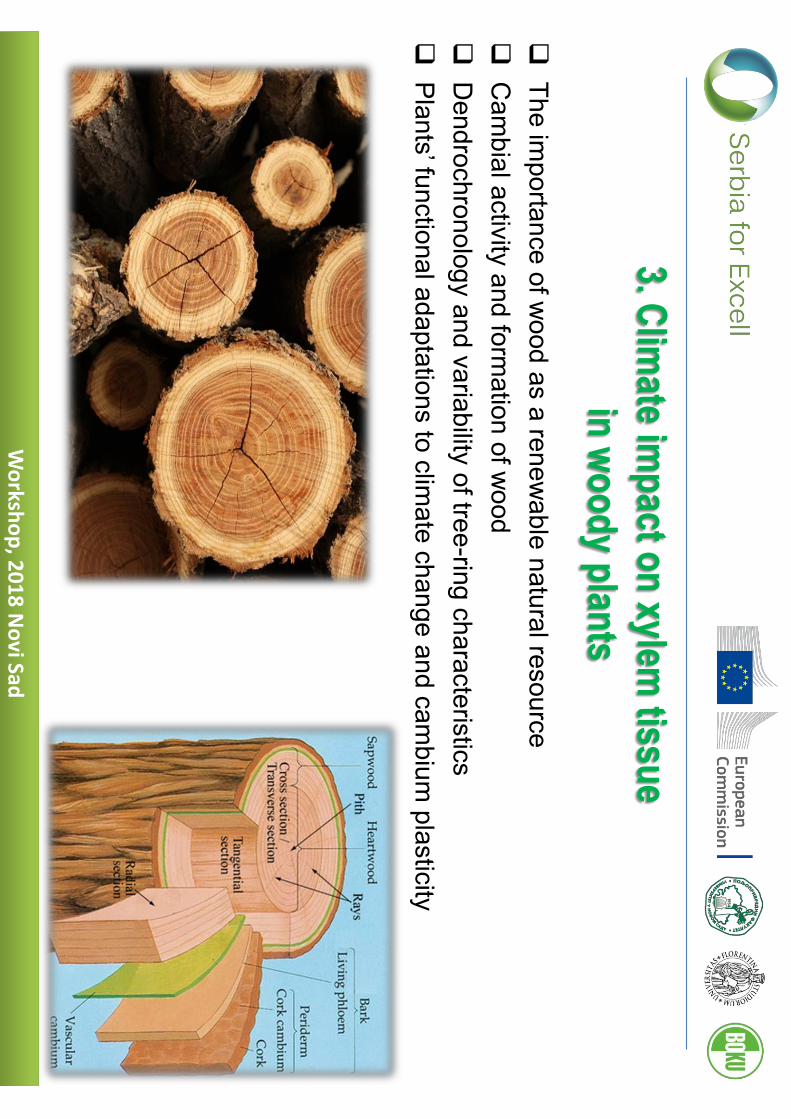
3. Climate im
pact on xylem tissue
in woody plants
�
The importance of w
ood as a renewable natural resource
�C
ambial activity and form
ation of wood
�D
endrochronology and variability of tree-ring characteristics �
Plants’ functional adaptations to climate change and cam
bium plasticity
Wo
rksho
p, 2
01
8 N
ovi Sad
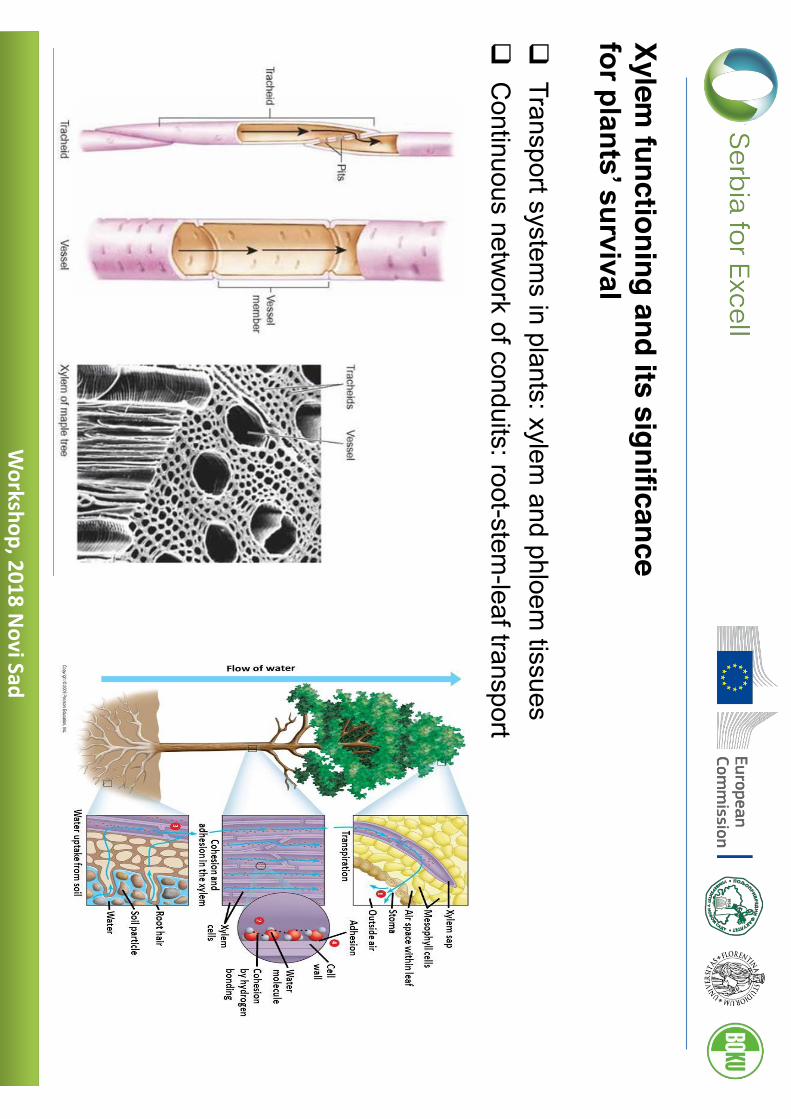
Xylem functioning and its significance
for plants’ survival
�Transport system
s in plants: xylem and phloem
tissues �
Continuous netw
ork of conduits: root-stem-leaf transport
Wo
rksho
p, 2
01
8 N
ovi Sad
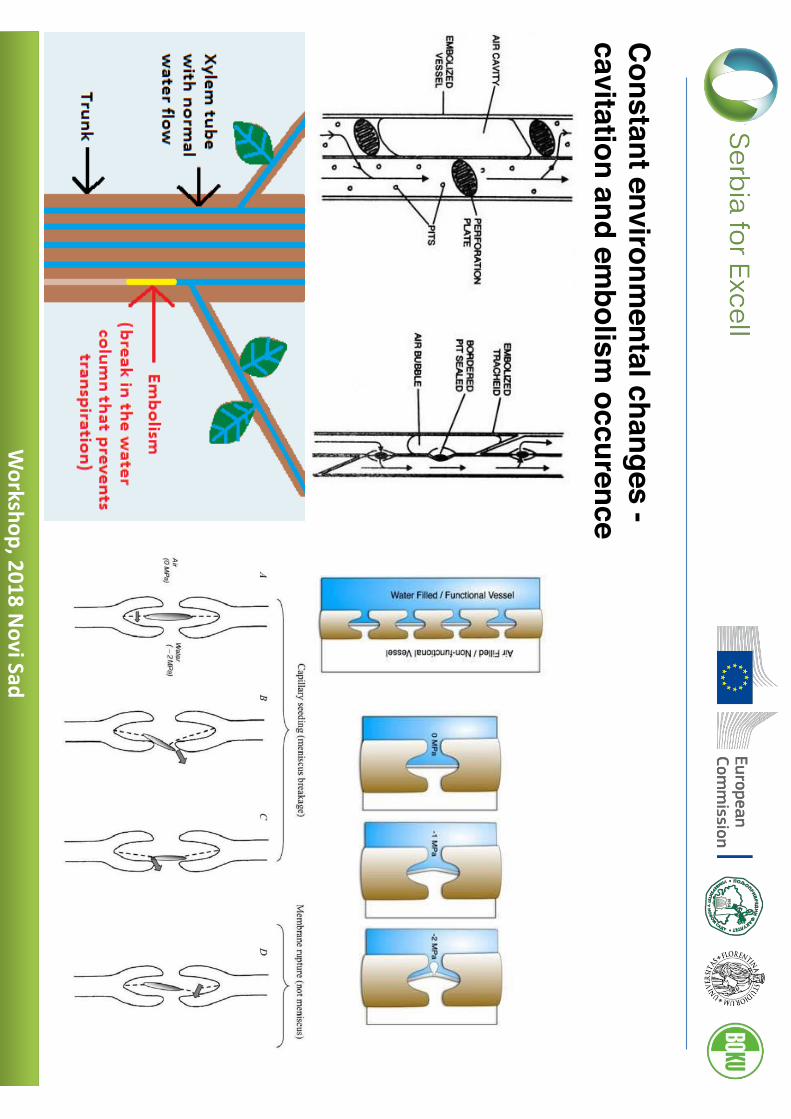
Constant environm
ental changes - cavitation and em
bolism occurence
Wo
rksho
p, 2
01
8 N
ovi Sad
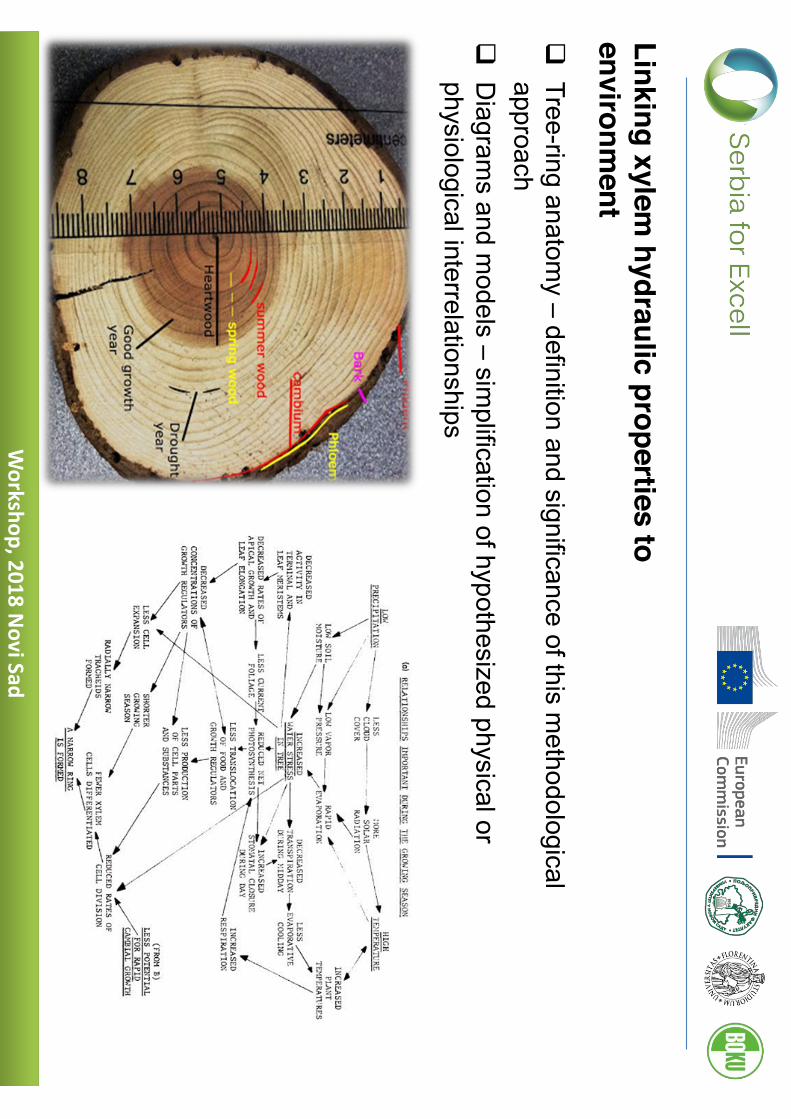
Linking xylem hydraulic properties to
environment
�Tree-ring anatom
y – definition and significance of this methodological
approach �
Diagram
s and models – sim
plification of hypothesized physical or physiological interrelationships

Wo
rksho
p, 2
01
8 N
ovi Sad
�W
ood-anatomical
modifications
can greatly
differ depending
on tree
metabolism
and species specific wood structure, as w
ell as on the timing of
the season when the particular environm
ental event occurs �
Modifications of xylem
tissue, regarding cell size, num
ber and shape �
Seasonal pattern of adaptations
�S
pecies-specific responses to contrasting w
ater supply �
Importance of previous
growing season conditions
�B
imodal patterns of cam
bial activity and cell differentiation

Wo
rksho
p, 2
01
8 N
ovi Sad
Photom
icrographs of cross sections from w
ell-w
atered control trees in early (A) and late (C
) sum
mer com
pared with those from
drought-treated trees in early (B
) and late (D) sum
mer.
Black lines show
the size of the different zones of w
ood cell development in control and
drought-treated trees. Num
bered arrows in A
and B give exam
ples of newly form
ed fibers that define the xylem
considered for anatom
ical analysis. Abbreviations: P
h, phloem
; Ca, cam
bium; E
Z, xylem cell
expansion zone; and SW
, secondary cell wall
formation (from
Arend and From
m, 2007).
Deform
ed vessel elements (arrow
s) in the outermost xylem
of drought-treated poplar trees in early (A
) and late (B) sum
mer (from
A
rend and Fromm
, 2007). (B
elow) Tree-ring w
idth chronologies (n = 15) of control and (at least tem
porarily) irrigated oak and pine. Black, trees of the
irrigation or irrigation stop site; grey, trees of the control site; and arrow, the year irrigation stopped (from
Eilm
ann et al., 2009).
Wo
rksho
p, 2
01
8 N
ovi Sad
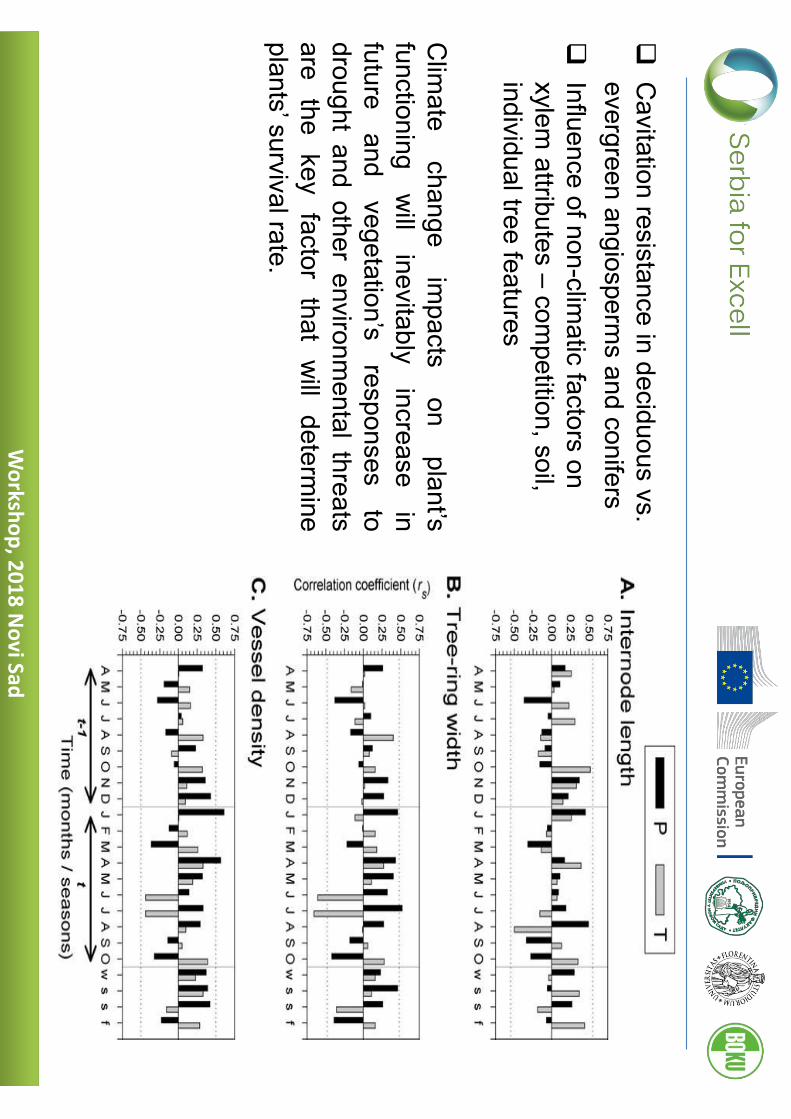
�C
avitation resistance in deciduous vs. evergreen angiosperm
s and conifers �
Influence of non-climatic factors on
xylem attributes – com
petition, soil, individual tree features
Clim
ate change
impacts
on plant’s
functioning w
ill inevitably
increase in
future and
vegetation’s responses
to drought and other environm
ental threats are
the key
factor that
will
determine
plants’ survival rate.
Wo
rksho
p, 2
01
8 N
ovi Sad
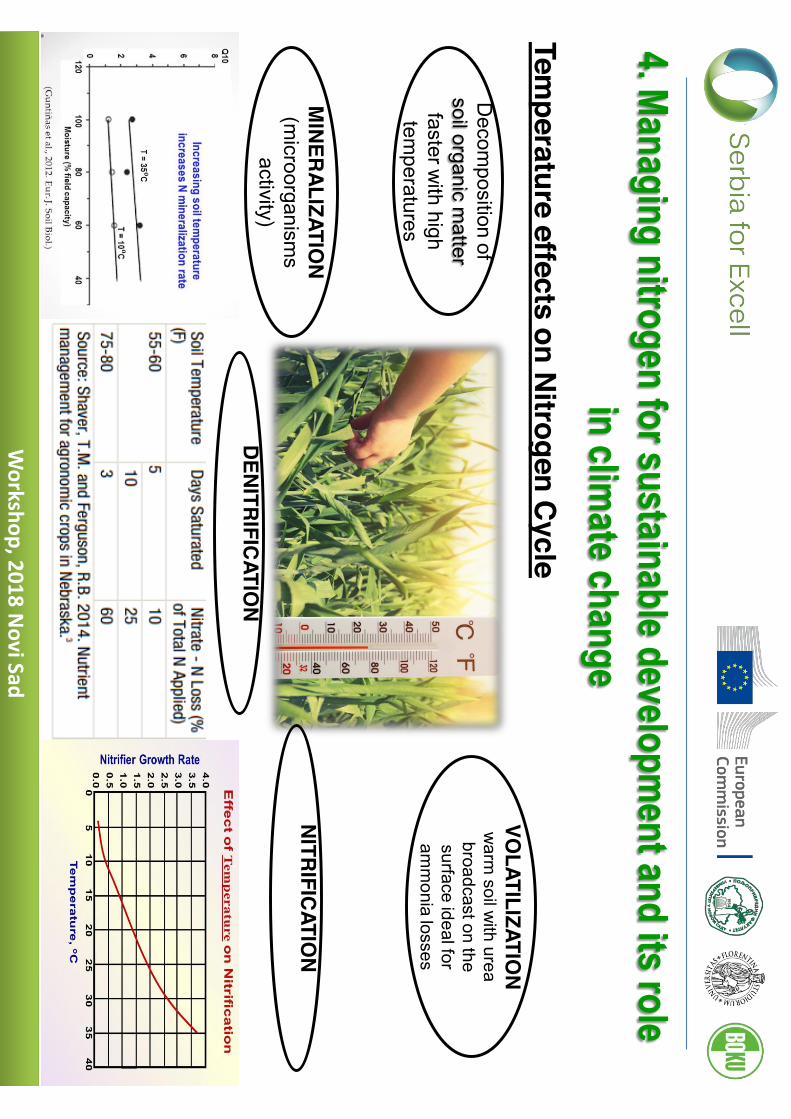
4. Managing nitrogen for sustainable developm
ent and its role in clim
ate change Tem
perature effects on Nitrogen C
ycle
D
ecomposition of
soil organic matter
faster with high
temperatures
MINERALIZATIO
N (m
icroorganisms
activity) DENITRIFICATIO
N
NITRIFICATION
VOLATILIZATIO
N
warm
soil with urea
broadcast on the surface ideal for am
monia losses

Wo
rksho
p, 2
01
8 N
ovi Sad
Precipitation effects on Nitrogen C
ycle
precipitation increase =
plant N uptake from
the soil increase
soil dry = there is less plant transpiration that results in decreased N
uptake
M
INERALIZATIO
N and NITRIFICATIO
N
Conditions of no
oxigen: INCREASED
DENITRIFICATION
Rain
fallW
ithin
days afte
r
app
lication
N vo
latilization
losse
s
0.42
0
0.43
10
0.1 to 0.2
510 to
30
05
30+
Effects o
f rainfall o
n N
volatilizatio
n lo
sses
VOLATILIZATIO
N

Wo
rksho
p, 2
01
8 N
ovi Sad
Thermo-rainfall conditions: em
ission N₂O
+ soil moisture
+ temperature
N₂O
: greenhouse gas with high radiative
forcing per unit mass.
Agricultural soils are assessed to produce
2.8 (1.7–4.8) Tg N2O
-N year−1

Wo
rksho
p, 2
01
8 N
ovi Sad
The problem of clim
ate change: Nitrogen cycle
For exam
ple hottest and most hum
id conditions could: �
Increase nitrification �
Increase denitrification rates �
Increase nitrogen release by mineralization
�Increase N
2O production
redu
cing p
ow
er on
N₂O em
issions through soil drying and an in
crease in n
itrogen
up
take
Changes in the N
itrogen cycle
Increase global mean
temperature: 1.5°C
to 4°C

Wo
rksho
p, 2
01
8 N
ovi Sad
Mitigation strategies for clim
ate change
NU
E im
proved by: -
Rotations w
ith cover crops: improved
yield and crop quality, enhanced erosion protection, reduced runoff and pollutants in runoff, increased soil organic m
atter, incresed biological activity in the soil, reduced soil com
paction. -
Better P
rediction of Crop N
itrogen and W
ater Requirem
ents: needs of the crops m
easured with a
soil test approach or yield goal

Wo
rksho
p, 2
01
8 N
ovi Sad
Mitigation strategies for clim
ate change P
recision Nitrogen m
anagement: the right
time and the right place
�M
easuring the concentration of nitrogen in plant sap or plant tissue, or in a laboratory, or directly in the field using a test kit;
�M
easuring the chlorophyll content in the leaves using a simple chlorophyll
meter;
�M
easuring the reflectance of crop foliage through remote sensing

Wo
rksho
p, 2
01
8 N
ovi Sad
5. Impact of the environm
ent on uptake of micronutrients
Introduction •
Feeding the world's grow
ing population in the present era of climate change is a
serious challenge.
•C
limate m
odels predict that warm
er temperatures and increases in the frequency
and duration of drought during 21st century w
ill have net negative effect on agricultural productivity. S
cientific publications on the isolated effects of elevated C
O2 level, tem
perature rise and water supply, on crop grow
th and yield synthesis, biom
ass accumulation and crop yield are necessary to predict im
pacts of climate
change on agriculture •
Elem
ental composition in plant tissue is expected to change in future high C
O2
world .
•E
ffects of climate change on soil fertility and the ability of crops to acquire and
utilize soil nutrients is poorly understood, but it is essential for understanding the future of global agriculture.

Wo
rksho
p, 2
01
8 N
ovi Sad
Micronutrients in plants

Wo
rksho
p, 2
01
8 N
ovi Sad
Drought effect on m
icronutrient acquisition
•C
rop yields
on soils
in developing
countries decrease
exponentially w
ith increasing aridity. S
oil moisture deficit directly im
pacts crop productivity and also reduces yields through its influence on the availability and transport of soil m
icronutrients. •
Drought increases vulnerability to nutrient losses from
root zone to erosion. B
ecause nutrients are carried to the roots by water, soil m
oisture deficit decreases nutrient diffusion over short distances.
•R
eduction of root growth and im
pairment of root function under drought thus
reduces micronutrient acquisition capacity of root system
. •
In wet soils. Fe
2+/Fe3+ ratio is higher, w
hich results in greater Fe availability for plants. U
nder drought condition, the greater presence of O2 in the soil induces a
decrease in the Fe2+/Fe
3+ ratio, leading to a decrease in available Fe for plant absorption, since Fe
2+ is more soluble then Fe
3+ . •
The conversion of Mn to its reduced and m
ore soluble forms is increased in
moist soil conditions
Wo
rksho
p, 2
01
8 N
ovi Sad
Drought effects on m
icronutrient acquisition •
Mahonachi et al. (2006) found an increase of Cl - concentration in leaves and
roots of papaya after 34 days of water stress. H
ence, together with organic
solutes these ions contribute to osmotic adjustm
ent in plants and therefore, under conditions of low
supply, symptom
s are visible mainly in aerial m
eristems, young
leaves and reproductive organs. •
Cu critical free concentration in the media ranges from
10-14 M to 10-16 M
. B
elow this range C
u deficiency occurs.
•A
ccording to Reddy (2006) B
deficiency is mainly seen in soils w
ith high pH and
under drought conditions. •
The lower diffusion of Zn in dry soil restricts uptake of Zn and m
ay exacerbate Zn deficiency.
•H
igher Ni mobility w
as also reported in the soils with low
er humus content, lighter
granulometric com
position and higher moisture content.

Wo
rksho
p, 2
01
8 N
ovi Sad
•
Surface erosion during intense precipitation events is a significant source of soil
nutrients loss in developing countries. •
Agricultural areas w
ith poorly drained soils or that experience frequent and/or intense rainfall events can have w
aterlogged soils that become hypoxic.
•The change in soil redox status under low
oxygen can lead to elemental toxicities
of Mn, Fe, B, N
i, which reduces crop yields and the production of phytotoxic
organic solutes that impair root grow
th and function. •
Hypoxia can also result in nutrient deficiency since the active transport of ions
into root cells is driven by ATP synthetized through the oxygen dependent m
itochondrial electron transport chain.

Wo
rksho
p, 2
01
8 N
ovi Sad
Effect of high temperature and elevated C
O2 level on m
icronutrient aquisition
• If under dry conditions higher temperatures result in extrem
e vapor pressure deficits that trigger stom
atal closure (reducing the water diffusion pathw
ay in leaves), then nutrient acquisition driven by m
ass flow w
ill decrease. • Tem
perature driven soil moisture deficit slow
s nutrient acquisition as the diffusion pathw
ay to roots becomes longer as ions travel around expanding soil air pockets.
• Projections to the end of this century suggest that atm
ospheric CO
2 will top 700 ppm
or m
ore, whereas global tem
perature will increase by 1.8–4.0 °C
, depending on the greenhouse em
ission scenario. • C
rops sense
and respond
directly to
rising C
O2
through photosynthesis
and stom
atal conductance.

Wo
rksho
p, 2
01
8 N
ovi Sad
•
The net effects of climate change w
ill be negative for agricultural production. •
Drought induced by higher tem
peratures and altered rainfall distribution would
reduce nutrient acquisition. •
More intense precipitation events w
ould reduce crop nutrition by causing short-term
root hypoxia, and in the long term by accelerating soil erosion.
•Increased tem
perature and elevated CO
2 level will reduce soil fertility by
increasing soil organic matter decom
position, and may have profound effects on
crop nutrition by altering plant phenology.

Wo
rksho
p, 2
01
8 N
ovi Sad
Ge
ne
ral con
clusio
n
•In previous sections, clim
ate change impact on different aspects of crop production
was
described. The
question w
hich arises
is how
can
crop productivity
be increased w
hile ensuring the sustainability of agriculture and the environment for
future generations? •
Changes in environm
ental conditions may substantially alter N
balance and cycling, w
hich links geosphere, biosphere and atmosphere, thus producing considerable
challenges in terms of nitrogen m
anagement.
•
Additional studies that investigate plant hydraulics over space and tim
e are greatly needed to assess the vulnerability of crops to clim
ate change and possibilities to im
prove plant resilience.
•The results suggest that the indices w
ill become even m
ore valuable tool for researches
to gain
better understanding
of global
climate
change effect
on agriculture.
•G
iven the potential adverse impacts on agriculture that could bring about clim
ate change, it is w
orthwhile to conduct m
ore in-depth studies and analyses to gauge the extent of problem
s that agriculture may face in the future.