Embed Size (px)
Citation preview
Growth and form of the mound in Gale Crater, Mars: Slope-1
wind enhanced erosion and transport 2
Authors: Edwin S. Kite1* and Kevin W. Lewis 2 3
Affiliations: 4
1Geological & Planetary Science, California Institute of Technology, MC 150-21, Pasadena CA 5
91125, USA. 6
2Department of Geosciences, Princeton University, Guyot Hall, Princeton NJ 08544, USA. 7
*Correspondence to: [email protected] 8
9
Abstract: Gale crater, the landing site of the Curiosity Mars rover, hosts a 5 kilometer high 10
layered mound of uncertain origin which may represent an important archive of the planet's past 11
climate. Although widely considered to be an erosional remnant of a once crater-filling unit, we 12
combine structural measurements and a new model of formation to show how this mound may 13
have grown in place near the center of the crater under the influence of topographic slope-14
induced winds. This mechanism implicates airfall-dominated deposition with a limited role for 15
lacustrine or fluvial activity in the formation of the Gale mound, and is not favorable for the 16
preservation of organic carbon. Slope-wind enhanced erosion and transport is widely applicable 17
to a range of similar sedimentary mounds found across the Martian surface. 18
19
Main text: In early August 2012 NASA’s Mars Science Laboratory (MSL) rover will land in 20
Gale Crater, Mars. MSL will target a 5km-tall layered sedimentary mound within Gale that is 21
believed to archive long-term climate change on Mars (1). Most of Mars’ sedimentary rocks are 22
in the form of intra-crater or canyon mounded deposits like the Gale mound. For example, in the 23
30km-diameter Endeavour Crater recently entered by the Mars Exploration Rover Opportunity 24
(2), a thin tongue of sedimentary sulfates is three-quarters encircled by a moat. Intra-crater 25
mound deposits are not restricted to low latitudes. Radar sounding of crater-filling ice mounds 26
near the north polar ice sheet shows that they grew from a central core, and are not relicts of a 27
formerly more extensive ice sheet (3). However, identifying the physical mechanism(s) that 28
explain the growth and form of equatorial crater mounds has been challenging, in part because 29
these deposits have no clear analog on Earth. The current prevailing view on the formation of 30
intra-crater mounds is that sedimentary layers completely filled each crater at least to the summit 31
of the present-day mound deposit. Subsequent erosion, decoupled from the deposition of the 32
layers, is invoked to explain the present-day topography. If the sedimentary rocks formed as 33
subhorizontal layers (4-5), in an evaporitic playa-like setting (6), then >>106 km3 must have been 34
removed to produce the modern moats and mounds (7-8). This may cause problems with global 35
S mass balance (9). This scenario predicts near-horizontal or slightly radially-inward dipping 36
layers controlled by surface or ground water levels. To test this prediction, we made multiple 37
measurements of bedding orientation from four separate 1-m scale stereo elevation models from 38
the High-resolution Imaging Science Experiment (HiRISE) camera, produced by Caltech and the 39
USGS via the method of Ref. 10. To the contrary, our new structural measurements from 40
multiple sites around the base of the Gale mound reveal layers with shallow but significant dips 41
oriented consistently outwards from the mound center (Figure 1; Table S1), suggesting a revised 42
formation mechanism. 43
Our goal in this paper is to develop the simplest possible model that can account for the 44
shape and stratigraphy of Mars' sedimentary rock mounds. We assume layers accumulate by the 45
accretion of atmospherically transported sediment, and are destroyed by slope-wind erosion 46
(Figure 2). Slope-wind enhanced erosion and transport (SWEET) of indurated or lithified 47
sedimentary materials cannot explain layer orientations at Gale unless the moat seen in Figure 1 48
was present during mound growth. This implies a coupling between mound primary layer 49
orientations, slope winds, and mound relief. 50
Mars is a windy place: saltating sand sized particles are in active motion (11), at rates that 51
predict aeolian erosion of bedrock at 10-50 µm/yr (12,13). Aeolian erosion of rock has occurred 52
within the last roughly 1-10 Ka (14) and is probably ongoing. The inability of General 53
Circulation Models (GCMs) to reproduce these observations shows that small-scale winds, not 54
the regional-to-global winds resolved by GCMs, are responsible for saltation. Because of Mars’ 55
thin atmosphere, slope winds dominate the circulation in craters and canyons (15,16). 56
Downslope-oriented yardangs, crater statistics, and hematite lags show that the mounds of Valles 57
Marineris are being actively eroded by slope winds. Slope-enhanced winds also define both the 58
large-scale and small-scale topography of the polar layered deposits (17,18). Aeolian processes 59
were also important on early Mars. Most of the observed sedimentary bedforms at the 60
Opportunity and Spirit landing sites are sand dune foresets (e.g. 19) and aeolianites likely 61
represent a volumetrically significant component of the ancient sedimentary rock record, 62
including within the strata of the Gale mound (20). In places like Becquerel Crater and the upper 63
portion of the Gale mound, bedding is quasi-periodic and bundled, indicating slow (~30 µm/yr) 64
orbitally-paced accumulation (21). These rates are comparable to the modern gross 65
atmospherically-transported sediment deposition rate (101-2 µm/yr ; e.g. 22) and to the inferred 66
modern aeolian-abrasion rate, suggesting that aeolian processes may be responsible for the 67
deposition of the layers. In addition, orbital images of deposits within Valles Marineris show 68

strata that are meters-to-decameters thick, laterally continuous, with horizontal-to-draping layer 69
orientations, and display very few angular unconformities (e.g., 23). Taken together, slow 70
accumulation, rarity of unconformities, and draping layer orientations suggest that sedimentary 71
deposits formed by the accretion of atmospherically-transported sediment (ash, dust, impact 72
ejecta, ice nuclei, or rapidly-saltating sand) were common on both modern and early Mars (24). 73
In one horizontal dimension (x), topographic change dz/dt is the balance of a net 74
atmospheric source term D and erosion E: 75
dz/dt = D(x,t) – E (1) 76
Initial model topography in Figure 2 is a basalt (nonerodible) crater/canyon with a flat 77
floor of half-width R and long, 20° slopes. To highlight the role of slope winds, we initially 78
assume D is constant and uniform (for example, uniform dust concentration multiplied by a 79
uniform settling velocity, with no remobilization). Sediment induration is probably required to 80
prevent the atmospheric source term from averaging to zero over long timescales. The necessary 81
degree of induration is not large: for example, 6-10 mg/g chloride salt increases the threshold 82
wind stress for saltation by a factor of e (25). Shallow diagenesis (26) could be driven by 83
surficial snowmelt or rainfall. 84
We assume that E depends on the maximum surface shear velocity magnitude, U: 85
E = kUα (2) 86
where k is an erodibility coefficient and α is an exponent parameterizing the exponent 87
relating erosive mass flux to shear velocity. For sand transport, soil erosion, and rock abrasion, α 88
~ 3-4 (27-29). We assume eroded material does not pile up in the moat but is instead removed 89
from the crater, for example through breakdown to easily-mobilized dust-sized particles (30). 90
Shear velocity at x is given by 91
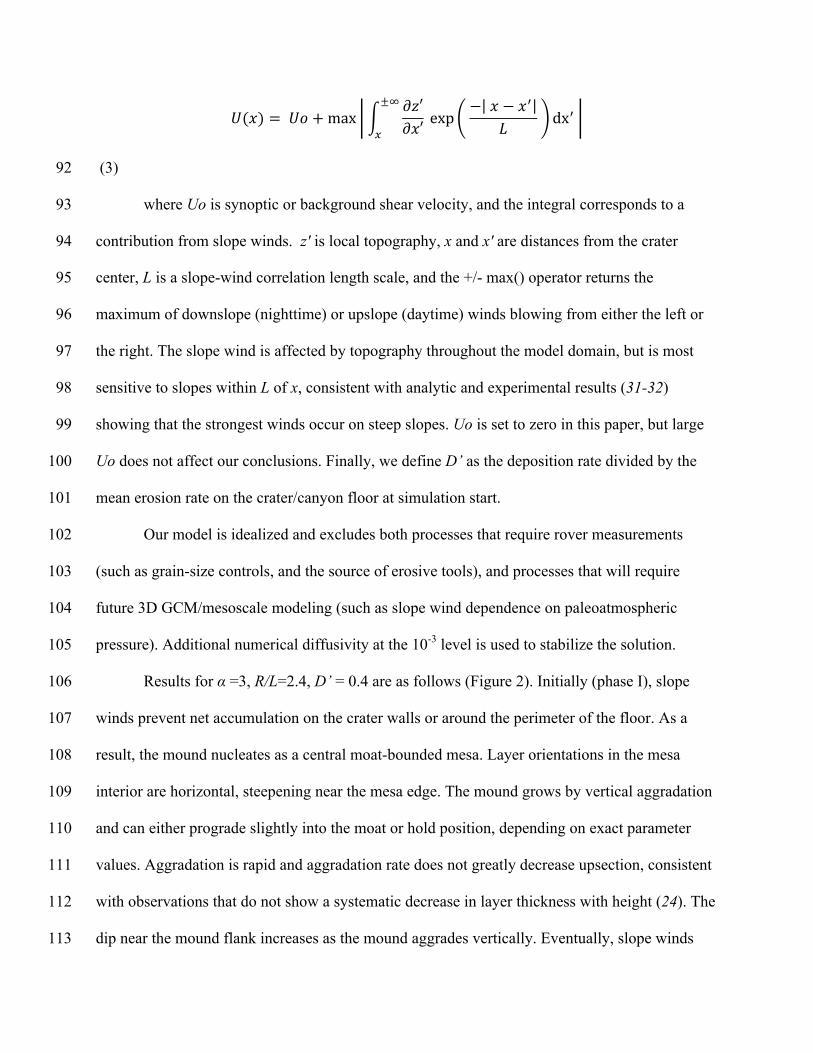
𝑈(𝑥) = 𝑈𝑜 +max 𝜕𝑧′𝜕𝑥′
±!
! exp
− 𝑥 − 𝑥!
𝐿 dx!
(3) 92
where Uo is synoptic or background shear velocity, and the integral corresponds to a 93
contribution from slope winds. z' is local topography, x and x' are distances from the crater 94
center, L is a slope-wind correlation length scale, and the +/- max() operator returns the 95
maximum of downslope (nighttime) or upslope (daytime) winds blowing from either the left or 96
the right. The slope wind is affected by topography throughout the model domain, but is most 97
sensitive to slopes within L of x, consistent with analytic and experimental results (31-32) 98
showing that the strongest winds occur on steep slopes. Uo is set to zero in this paper, but large 99
Uo does not affect our conclusions. Finally, we define D’ as the deposition rate divided by the 100
mean erosion rate on the crater/canyon floor at simulation start. 101
Our model is idealized and excludes both processes that require rover measurements 102
(such as grain-size controls, and the source of erosive tools), and processes that will require 103
future 3D GCM/mesoscale modeling (such as slope wind dependence on paleoatmospheric 104
pressure). Additional numerical diffusivity at the 10-3 level is used to stabilize the solution. 105
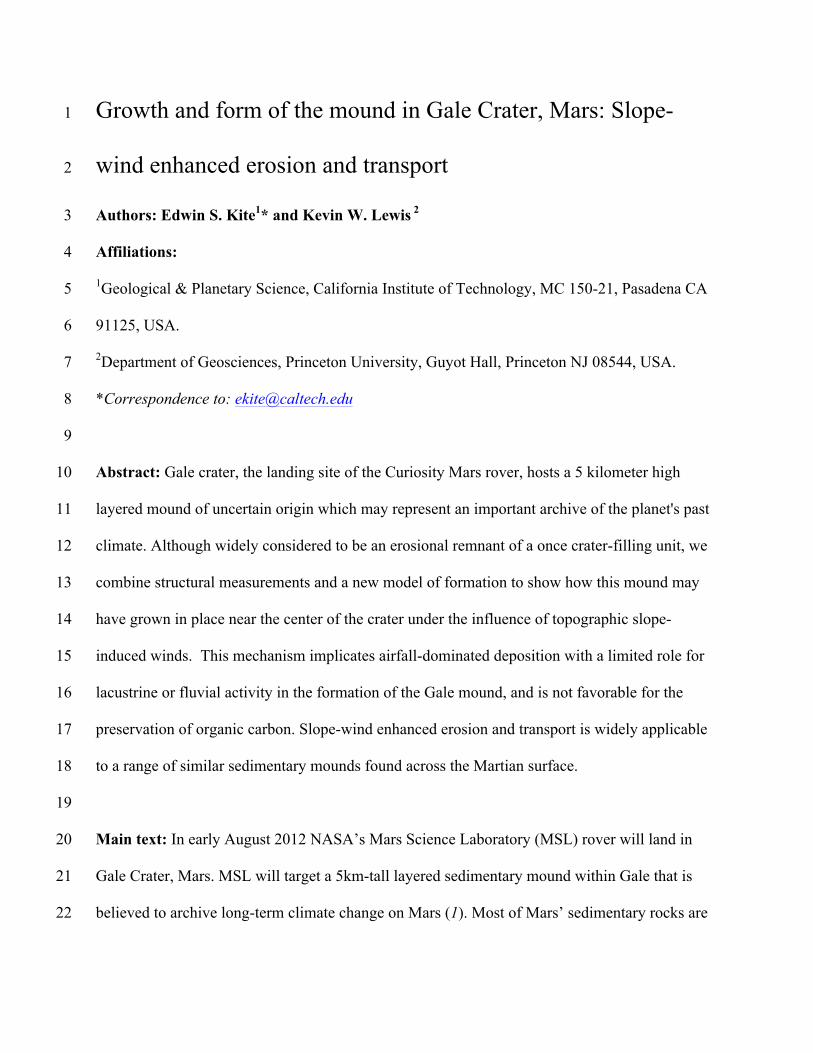
Results for α =3, R/L=2.4, D’ = 0.4 are as follows (Figure 2). Initially (phase I), slope 106
winds prevent net accumulation on the crater walls or around the perimeter of the floor. As a 107
result, the mound nucleates as a central moat-bounded mesa. Layer orientations in the mesa 108
interior are horizontal, steepening near the mesa edge. The mound grows by vertical aggradation 109
and can either prograde slightly into the moat or hold position, depending on exact parameter 110
values. Aggradation is rapid and aggradation rate does not greatly decrease upsection, consistent 111
with observations that do not show a systematic decrease in layer thickness with height (24). The 112
dip near the mound flank increases as the mound aggrades vertically. Eventually, slope winds 113
down the growing mound are sufficient to prevent net aggradation at the toe, leading to Phase II 114
(Figure 2b). During Phase II, mound height continues to increase but mound width decreases due 115
to flank erosion. Flank erosion is caused by katabatic winds flowing down the growing mound. 116
Erosion propagates updip, exposing beds deposited during Phase I. When erosion reaches the 117
mound top, the mound becomes entirely self-destructive (Phase III). Mound height decreases 118
because flank retreat leads to greater slopes and, therefore, stronger slope winds. Decreasing the 119
mound height reduces the maximum potential downslope wind. However erosion also decreases 120
mound width, which helps to maintain steep slopes and correspondingly destructive slope winds. 121
Topographic change is much slower during Phase III than during Phases I and II. 122
This evolution, which does not require any change in external forcing with time, 123
describes a clockwise trajectory on a moat width/mound height diagram (Figure 2b). The 124
systematic exposure of layering on the Gale mound’s flanks and upper surface shows that it has 125
entered Phase III. Flank erosion during later phases tends to remove any unconformities formed 126
near the edge of the mound, while exposing the stratigraphic record of earlier phases for rover 127
inspection. Exhumed layers are buried to kilometer depths, but relatively briefly, implying 128
limited diagenesis of clays and sulfates (1). During phase I, dz/dt is not much slower than D. If D 129
corresponds to vertical dust settling at rates similar to today, then we predict that the lower Gale 130
mound accumulated in 107-8 yr, consistent with dates suggesting that the time represented by the 131
lower Gale mound is a small fraction of Mars’ history (33). 132
Values of L and D’ on Early Mars are not known, but Gale-like shapes and stratigraphy 133
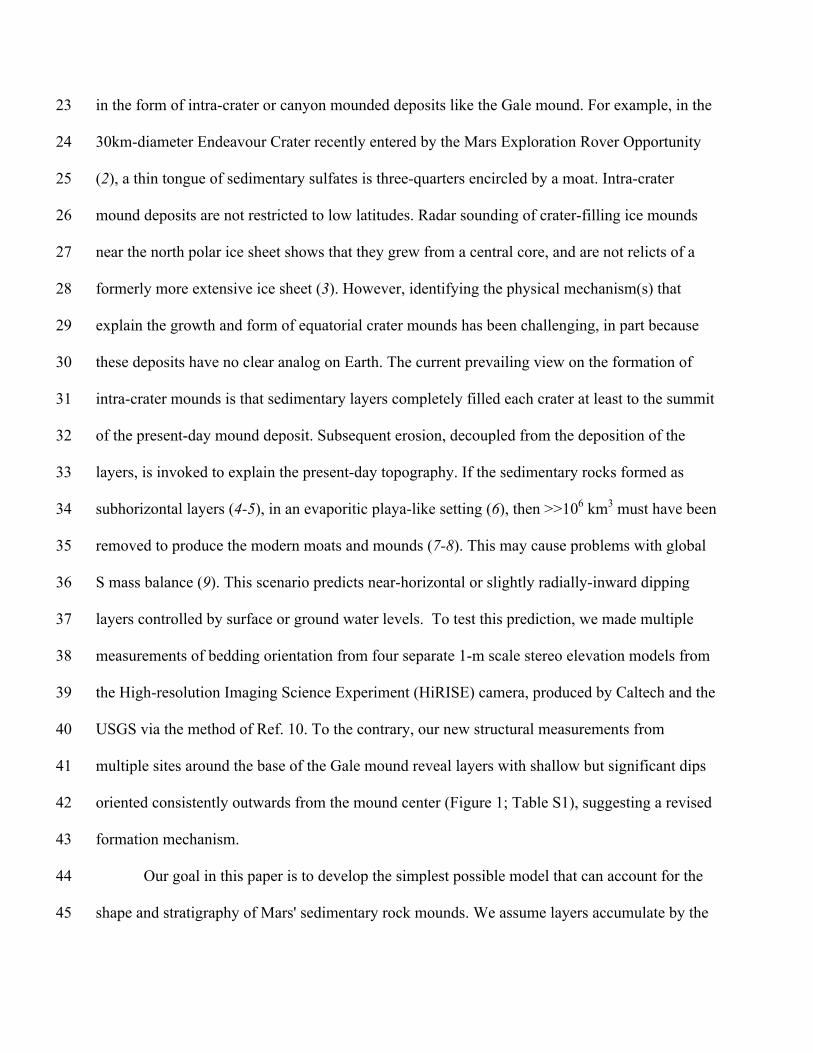
arise for a wide range of reasonable parameters (SM Text; Figure S1). Consistent with data 134
(Figure S2), moats do not extend to basement for small R/L, and for the largest R/L multiple 135
mounds can develop within a single crater. 136

D could vary on timescales that are much shorter than the time for growth of the mound, 137
for example if Milankovitch cycles set the availability of liquid water for cementation. We set 138
D(t) = D(t=0) + D(t=0)cos(nt), where the oscillation frequency n is chosen to be faster than the 139
mound growth timescale. Low-angle unconformities can now be preserved, and the likelihood of 140
unconformities increases upsection and towards the margin of the moat (Figure 2c). A late-stage 141
draping layer of sedimentary rock crosscuts layers within the mound core at a high angle, and is 142
itself broken up by further aeolian erosion. Thin mesa units mapped at Gale and more widely on 143
Mars have these characteristics (4,20). 144
Deposition at a constant long-term-average rate is unrealistic because the rate of 145
sedimentary rock formation on Mars is close to zero in the modern epoch, most likely because 146
atmospheric loss has restricted surface liquid water availability (34-37). Setting D’ to zero after 147
the crater is incompletely filled allows slope winds down the wall to expose layers and form a 148
moat, which expands the portion of parameter space that allows moats and mounds to form. 149
Because groundwater-limited evaporite deposition would infill moats and produce near-150
horizontal strata, SWEET is incompatible with a global-groundwater water source for early 151
diagenesis of sedimentary rocks, and with any deposition mechanism that preferentially fills 152
topographic lows (e.g., fluviodeltaic or lacustrine sedimentation). A top-down water source (ice 153
weathering, snowmelt, or rainfall) is predicted instead (9,37). Perennial surface liquid water 154
would shut down saltation and aeolian erosion. Similar to observations along the Opportunity 155
rover traverse (38), we predict long dry windy periods interspersed by brief wet periods at Gale. 156
We also predict that the outward-dipping layer orientations in the Gale mound are primary. 157
Alternative models for the formation of Gale’s mound involve landslides, preferential dissolution 158
of soluble layers near the crater edge, or tectonic tilting, to produce the observed outward dips. 159
When MSL lands in Gale Crater, it can immediately begin to collect observations that will test 160
our model’s predictions, as well as the alternative hypotheses for the mound’s formation. For 161
example, MSL will have the ability to observe evidence for subsurface dissolution within the 162
crater if it occurred, while measurements of river-deposit tilts and paleoflow directions (e.g., 163
from clast imbrication) may constrain post-depositional tilting. MSL can also measure present-164
day wind velocity using the Rover Environmental Monitoring System (REMS) instrument, and 165
image fossilized aeolian bedforms. Unconformities, if present, should be oriented away from the 166
center of the present mound and should be more frequent upsection. Slow, orbitally-paced 167
sedimentation and oscillation between reducing and oxidizing conditions would disfavor 168
preservation of organic carbon. 169
170
References and notes 171
1. Milliken, R.E., Grotzinger, J.P., Thomson, B.J., 2010, Paleoclimate of Mars as captured by the 172
stratigraphic record in Gale Crater. Geophysical Research Letters, 370, L04201, 173
doi:10.1029/2009GL041870. 174
175
2. Squyres, S.W., and the Athena Science Team, 2012, Ancient Impact and Aqueous Processes at 176
Endeavour Crater, Mars. Science, 336 (6081), 570-576, doi:10.1126/science.1220476. 177
178
3. Conway, S.J., et al., 2012, Climate-driven deposition of water ice and the formation of 179
mounds in craters in Mars’ North Polar Region. Icarus, (in press) 180
doi:10.1016/j.icarus.2012.04.021. 181
4. Malin, M.C. and Edgett, K.S., 2000, Sedimentary Rocks of Early Mars. Science, 290,1927-182
1937, doi:10.1126/science.290.5498.1927. 183
184
5. Montgomery, D.R. and Gillespie, A., 2005, Formation of Martian outflow channels by 185
catastrophic dewatering of evaporite deposits. Geology, 33, 625. 186
187
6. Andrews-Hanna, J.C., Phillips, R.J., Zuber, M.T., 2007, Meridiani Planum and the global 188
hydrology of Mars. Nature, 446, 163-166, doi:10.1038/nature05594. 189
190
7. Zabrusky, K. J., Andrews-Hanna, J. C., Wiseman, S. M., 2012, Reconstructing the 191
Distribution and Depositional History of the Sedimentary Deposits of Arabia Terra, Mars. Icarus 192
(in press), 10.1016/j.icarus.2012.05.007. 193
194
8. Andrews-Hanna, J.C.A., 2012, The formation of Valles Marineris: 3. Trough formation 195
through super-isostasy, stress, sedimentation, and subsidence. Journal of Geophysical Research – 196
Planets (in press), doi:10.1029/2012JE004059. 197
198
9. Michalski, J.R. and Niles, P.B., 2012, An atmospheric origin of Martian Interior Layered 199
Deposits (ILDs): Links to climate change and the global sulfur cycle. Geology, 40, 419-200
422, doi:10.1130/G32971.1. 201
202
10. Kirk, R.L., et al., 2008, Ultrahigh resolution topographic mapping of Mars with MRO 203
HiRISE stereo images: Meter-scale slopes of candidate Phoenix landing sites. Journal of 204
Geophysical Research, Volume 113, Issue E12, CiteID E00A24. 205
206
11. Bridges, N.T., et al., 2012a, Planet-wide sand motion on Mars. Geology, 40, 31-34, 207
doi:10.1130/G32373.1. 208
209
12. Bridges, N.T., et al., 2012b, Earth-like sand fluxes on Mars. Nature, 485, 339-342, 210
doi:10.1038/nature11022. 211
212
13. Greeley, R., Iversen, J.D., 1982, Wind as a geological process on Earth, Mars, Venus, and 213
Titan, Cambridge University Press. 214
215
14. Golombek, M., et al., 2010, Constraints on ripple migration at Meridiani Planum from 216
Opportunity and HiRISE observations of fresh craters. Journal of Geophysical Research 217
(Planets), 115, E00F08, doi:10.1029/2010JE003628. 218
219
15. Rafkin, S.C.R., Michaels, T.I., 2003, Meteorological predictions for 2003 Mars Exploration 220
Rover high-priority landing sites. Journal of Geophysical Research (Planets), 108, 8091, 221
doi:10.1029/2002JE002027. 222
223
16. Spiga, A. and Forget, F., 2009, A new model to simulate the Martian mesoscale and 224
microscale atmospheric circulation: Validation and first results. Journal of Geophysical Research 225
(Planets), 114(E13), E02009, doi:10.1029/2008JE003242. 226
227
17. Holt, J.W., et al., 2010, The construction of Chasma Boreale. Nature, 465, 446-449. 228
229
18. Smith, I.B., Holt, J.W., 2010, Onset and migration of spiral troughs on Mars revealed by 230
orbital radar. Nature, 465, 450-453. 231
232
19. Hayes, A.G., et al., 2011, Reconstruction of eolian bed forms and paleocurrents from cross-233
bedded strata at Victoria Crater, Meridiani Planum, Mars. Journal of Geophysical Research, 234
Volume 116, CiteID E00F21. 235
236
20. Anderson, R.B., Bell, J.F., 2010, Geologic mapping and characterization of Gale Crater and 237
implications for its potential as a Mars Science Laboratory landing site. Mars 5, 76-128, 238
doi:10.1555/mars.2010.0004. 239
240
21. Lewis, K.W., et al., 2008, Quasi-Periodic Bedding in the Sedimentary Rock Record of Mars. 241
Science, 322, 1532, doi:10.1126/science.1161870. 242
243
22. Drube, L., et al., 2010, Magnetic and optical properties of airborne dust and settling rates of 244
dust at the Phoenix landing site. Journal of Geophysical Research, 115, E00E23, 245
doi:10.1029/2009JE003419. 246
247
23. Fueten, F., et al., 2010, Structural analysis of interior layered deposits in Northern Coprates 248
Chasma, Mars. Earth and Planetary Science Letters, 294, 343-356, 249
doi:10.1016/j.epsl.2009.11.004. 250
251
24. Cadieux, S.B., Constraining Martian sedimentation via analysis of stratal packaging, 252
intracrater layered deposits, Arabia Terra, Mars, http://trace.tennessee.edu/utk gradthes/860. 253
254
25. Nickling, W.G., 1984, The stabilizing role of bonding agents on the entrainment of sediment 255
by wind. Sedimentology, 31(1), 111-117. doi: 10.1111/j.1365-3091.1984.tb00726.x. 256
257
26. McLennan, S.M., Grotzinger, J.P., 2008, The sedimentary rock cycle of Mars, in Bell, J., III, 258
editor, The Martian Surface - Composition, Mineralogy, and Physical Properties: volume 9 of 259
Cambridge Planetary Science Series, Cambridge University Press, 2008, p. 541. 260
261
27. Lu , H., and Shao, Y., 1999, A new model for dust emission by saltation bombardment. 262
Journal of Geophysical Research, 104, 16,827-16,842. 263
264
28. Wang, Z.-T., Wang, H.-T., Niu, Q.-H., Dong, Z.-B. and Wang, T., 2011, Abrasion of 265
yardangs. Physical Review E, 84, 031304. 266
267
29. Kok, J.F., Parteli, E.J.R., Michaels, T.I., and Karam, D. B., 2012, The physics of wind-blown 268
sand and dust. Reports on Progress in Physics, preprint available at: 269
http://sitemaker.umich.edu/jasperkok/files/kok_etal_2012_physics_of_windblown_sand_and_du270
st.pdf. 271
272
30. Sullivan, R., et al., Wind-driven particle mobility on Mars: Insights from Mars Exploration 273
Rover observations at ``El Dorado'' and surroundings at Gusev Crater. Journal of Geophysical 274
Research, 113(E6), E06S07. 275
276
31. Manins, P. C., Sawford, B. L., 1987, A model of katabatic winds. Journal of Atmospheric 277
Sciences, 36, 4, pp.619-630. 278
279
32. Parish, T.R., Bromwich, D.H., 1987, The surface windfield over the Antarctic ice sheets. 280
Nature 328, 51-54, doi: 10.1038/328051a0. 281
282
33. Zimbelman, J.R., Scheidt, S.P., 2012, Hesperian Age for Western Medusae Fossae 283
Formation, Mars. Science, doi: 10.1126/science.1221094. 284
285
34. Knoll, A.H., et al., 2008, Veneers, rinds, and fracture fills: Relatively late alteration of 286
sedimentary rocks at Meridiani Planum, Mars. Journal of Geophysical Research, Volume 113, 287
Issue E6, CiteID E06S16. 288
289
35. Tosca, N.J., Knoll, A.H., 2009. Juvenile chemical sediments and the long term persistence of 290
water at the surface of Mars. Earth and Planetary Science Letters 286(3-4): 379-386. 291
doi:10.1016/j.epsl.2009.07.004 292
293
36. Andrews-Hanna, J.C., Lewis, K.W., 2011, Early Mars Hydrology: 2. Hydrological evolution 294
in the Noachian and Hesperian epochs. J. Geophys. Res., 116, E02007, 295
doi:10.1029/2010JE003709. 296
297
37. Kite, E.S., Halevy, I., Kahre, M.A., Wolff, M.J., Manga, M., 2012, Seasonal melting and the 298
formation of sedimentary rocks on Mars, with predictions for the Gale Crater mound. Submitted 299
to Icarus, http://arxiv.org/abs/1205.6226. 300
301
38. Metz, J.M., et al., 2009, Sulfate-Rich Eolian and Wet Interdune Deposits, Erebus Crater, 302
Meridiani Planum, Mars. Journal of Sedimentary Research, 79, 247-264, 303
doi:10.2110/jsr.2009.033. 304
305
39. Thomson, B.J., et al., 2011, Constraints on the origin and evolution of the layered mound in 306
Gale Crater, Mars using Mars Reconnaissance Orbiter data. Icarus, 214, 413 – 432. 307
308
40. Trachte, K., Nauss, T., Bendix, J., 2010, The impact of different terrain configurations on the 309
formation and dynamics of katabatic flows: idealized case studies. Boundary-Layer 310
Meteorology, 134, 307-325. 311
312
41. Ye, Z.J., Segal, M., Pielke, R.A., 1990, A comparative study of daytime thermally induced 313
upslope flow on Mars and Earth. Journal of the Atmospheric Sciences, 47, 612-628. 314
315
42. Savijarvi, H., Siili, T., 1993, The Martian slope winds and the nocturnal PBL jet. Journal of 316
the Atmospheric Sciences, 50, 77-88. 317
318
43. Siili, T., Haberle, R.M., Murphy, J.R., Savijarvi, H., 1999, Modelling of the combined late-319
winter ice cap edge and slope winds in Mars’ Hellas and Argyre regions. Planetary and Space 320
Science, 47, 951-970. 321
322
44. Ellison, T.H., Turner, J.S., 1959, Turbidity entrainment in stratified flows. J. Fluid Mech. 6, 323
423-48. 324
325
45. Manins, P. C., Sawford, B. L., 1979, A Model of Katabatic Winds. Journal of Atmospheric 326
Sciences, 36, 619-630. 327
328
46. Horst, T. W., Doran, J. C., 1986, Nocturnal drainage flow on simple slopes. Boundary-Layer 329
Meteorology, 34, 263-286 330
331
332
Acknowledgements: We thank Mike Lamb, Claire Newman, Mark Richardson, Bill Dietrich, 333
Woody Fischer, and especially Kathryn Stack, for their intellectual contributions. 334
335
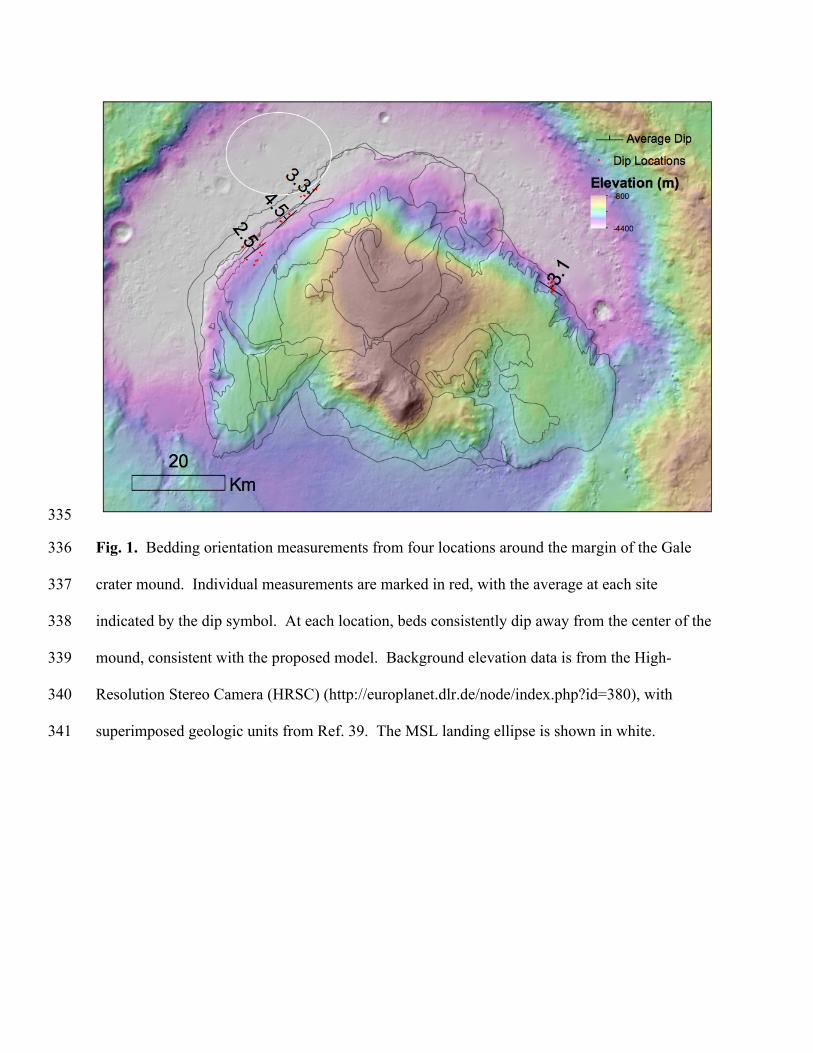
Fig. 1. Bedding orientation measurements from four locations around the margin of the Gale 336
crater mound. Individual measurements are marked in red, with the average at each site 337
indicated by the dip symbol. At each location, beds consistently dip away from the center of the 338
mound, consistent with the proposed model. Background elevation data is from the High-339
Resolution Stereo Camera (HRSC) (http://europlanet.dlr.de/node/index.php?id=380), with 340
superimposed geologic units from Ref. 39. The MSL landing ellipse is shown in white. 341
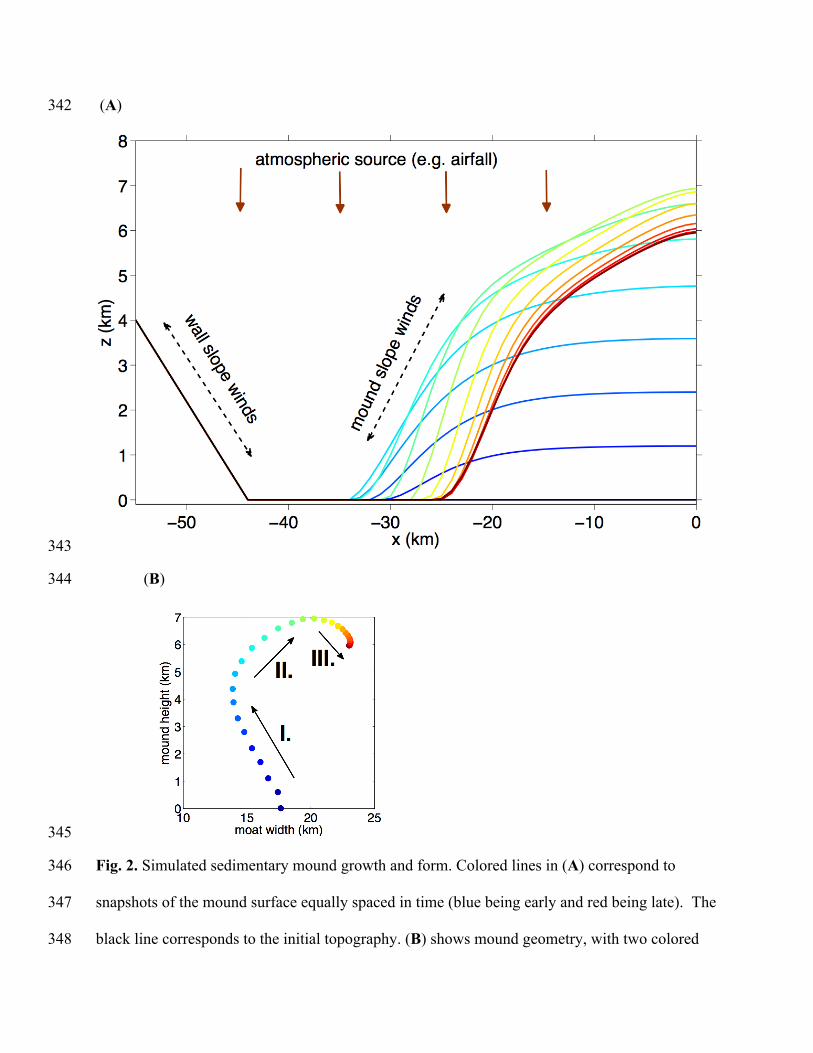
(A) 342
343
(B) 344
345
Fig. 2. Simulated sedimentary mound growth and form. Colored lines in (A) correspond to 346
snapshots of the mound surface equally spaced in time (blue being early and red being late). The 347
black line corresponds to the initial topography. (B) shows mound geometry, with two colored 348
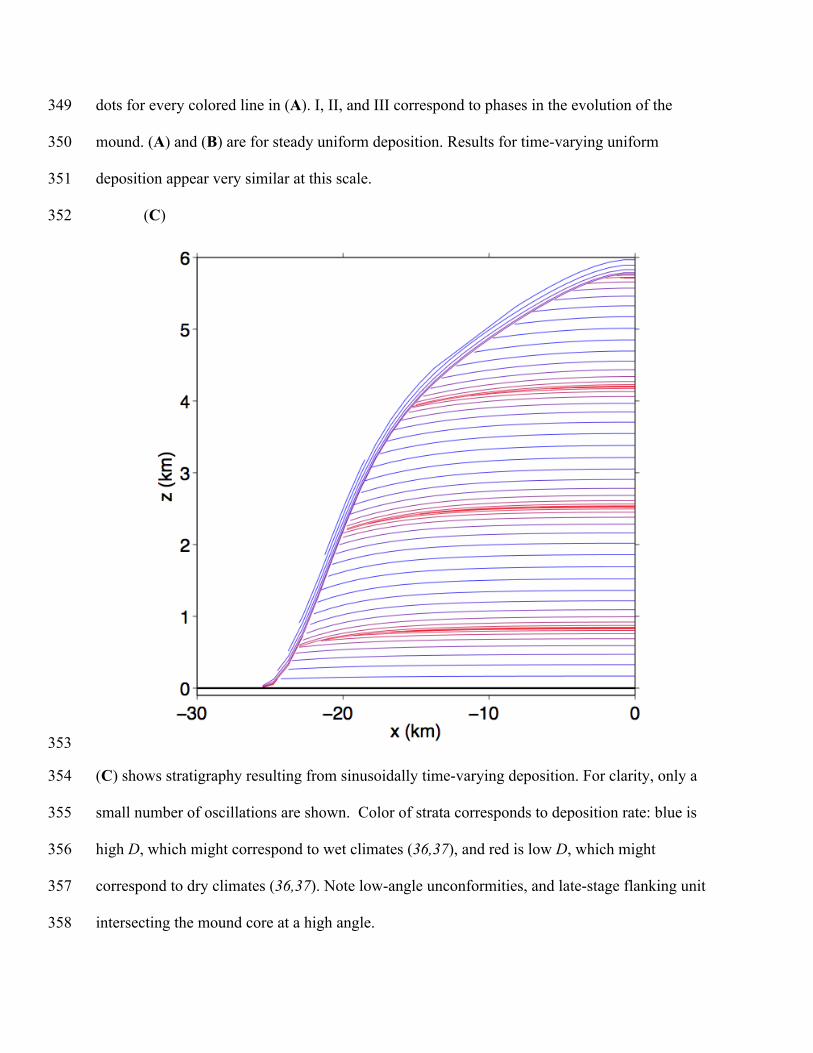
dots for every colored line in (A). I, II, and III correspond to phases in the evolution of the 349
mound. (A) and (B) are for steady uniform deposition. Results for time-varying uniform 350
deposition appear very similar at this scale. 351
(C) 352
353
(C) shows stratigraphy resulting from sinusoidally time-varying deposition. For clarity, only a 354
small number of oscillations are shown. Color of strata corresponds to deposition rate: blue is 355
high D, which might correspond to wet climates (36,37), and red is low D, which might 356
correspond to dry climates (36,37). Note low-angle unconformities, and late-stage flanking unit 357
intersecting the mound core at a high angle. 358
Supplementary materials 359
Controls on mound growth and form 360
L will vary across Mars because of changing 3D topography (40), and will vary in time because 361
of changing atmospheric density. Ref. 41 shows L ~ 20km for Mars slopes with negligible 362
geostrophic effects. Simulations of gentle Mars slope winds strongly affected by the Coriolis 363
force suggest L ~ 50-100 km (42-43). Entrainment acts as a drag coefficient with value 0.02-0.05 364
for Gale-relevant slopes (44-46), suggesting L = 20-50 km for a 1km thick cold boundary layer. 365
Therefore L ~ 101-2 km is reasonable, but there is considerable uncertainty, which we explore in 366
the next section using a parameter sweep. 367
To determine the effect of parameter choices on sedimentary rock mound shape, size, 368
stratigraphy and exposure, we carried out a parameter sweep in α, D’, and R/L (Figure S1). Weak 369
slope dependence (α = 0.05) is sufficient to produce strata that dip toward the foot of the 370
crater/canyon slope (like a sombrero hat). Similarly weak negative slope dependence (α = -0.05) 371
is sufficient to produce concave-up fill. 372
At low R/L (i.e., small craters) or at low α, D’ controls overall mound shape and slope 373
winds are unimportant. When D’ is high, layers fill the crater; when D’ is low, layers do not 374
accumulate. When either α or R/L or both are >~ O(1), slope wind enhanced erosion and 375
transport dominates the behavior. Thin layered crater floor deposits form at low D’, and large 376
mounds at high D’. At high R/L and high α (large craters and knickpointlike erosion), multiple 377
mounds form at late time. 378
If L is approximated as being constant across the planet, then R/L is proportional to 379
crater/canyon size. Moats do not extend to basement for small R/L, although there can be a small 380
trench at the break-in slope. For larger R/L, moats form, and for the largest craters/canyons, 381
multiple mounds can develop within a single crater because slope winds break up the deposits. 382
This is consistent with data which suggest a universal length scale for mound size (Figure S2). 383
Small exhumed craters in Meridiani show concentric layering consistent with concave-up dips. 384
Larger craters across Meridiani Planum, together with Gale and Nicholson Craters, the smaller 385
Valles Marineris chasmata, and the north polar ice mounds, show a single mound. The largest 386
canyon system on Mars (Ophir-Candor-Melas) shows multiple mounds per canyon. Steeper wall 387
slopes in the model tend to push mound break-up to larger sizes. Gale-like mounds (with erosion 388
both at the toe and the summit) are most likely for high R/L, high α, and intermediate D’ (high 389
enough for some accumulation, but not so high as to fill the crater) (Figure S1). These sensitivity 390
tests suggest that mounds with erosion both at the toe and the summit are a generic outcome of 391
steady uniform deposition modified by slope-wind enhanced erosion and transport for estimated 392
Early Mars parameter values. 393
394
Sequence stratigraphy on Mars 395
Sequence stratigraphy on Earth divides sedimentary deposits into genetically related packages 396
bounded by hiatuses controlled by sediment supply, subsidence, and changes in base level. On 397
the basis of our model results (Figure 2c), we suggest a Martian equivalent for the deposition of 398
layered deposits in which the primary control is not base-level change, but changes in the ability 399
of the climate system to indurate and cement atmospherically-transported sediment (e.g., 36-37). 400
Rare wet periods provide an opportunity for mound accumulation, and these sequences are 401
bounded by surfaces of nondeposition that represent mound degradation during more common 402
dry periods. These oscillations may be orbitally paced, although the time represented by each 403
sequence is unknown. 404
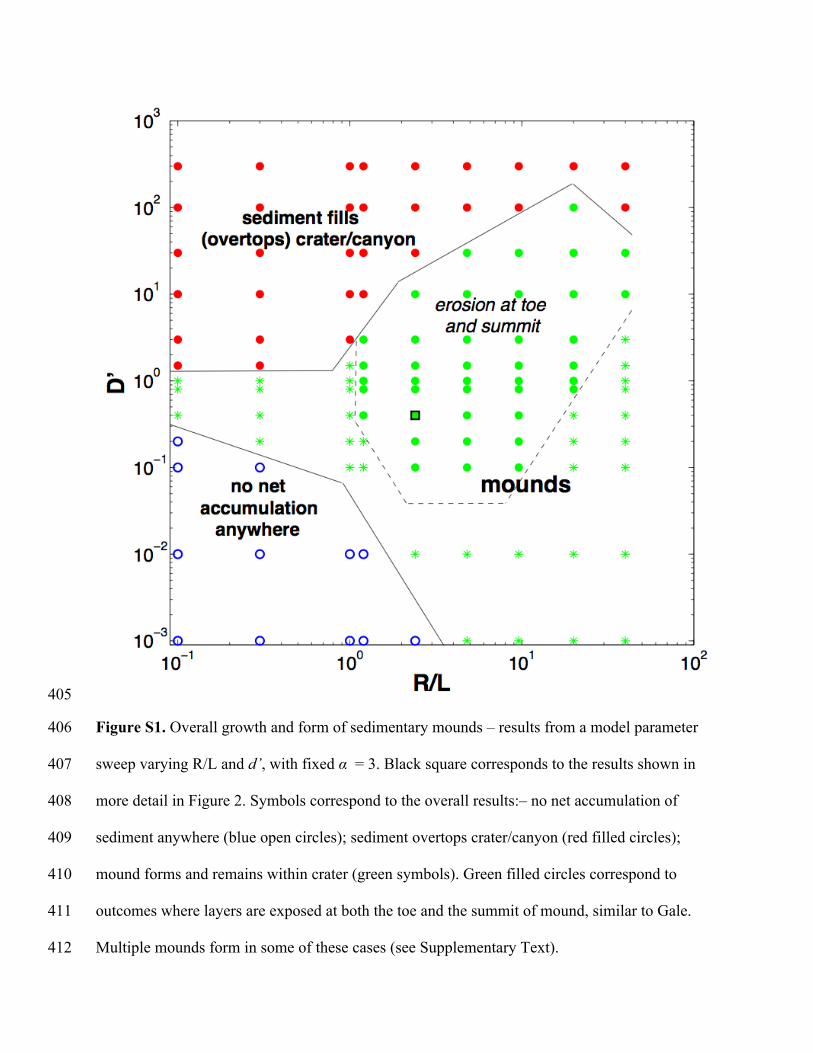
405
Figure S1. Overall growth and form of sedimentary mounds – results from a model parameter 406
sweep varying R/L and d’, with fixed α = 3. Black square corresponds to the results shown in 407
more detail in Figure 2. Symbols correspond to the overall results:– no net accumulation of 408
sediment anywhere (blue open circles); sediment overtops crater/canyon (red filled circles); 409
mound forms and remains within crater (green symbols). Green filled circles correspond to 410
outcomes where layers are exposed at both the toe and the summit of mound, similar to Gale. 411
Multiple mounds form in some of these cases (see Supplementary Text). 412
413
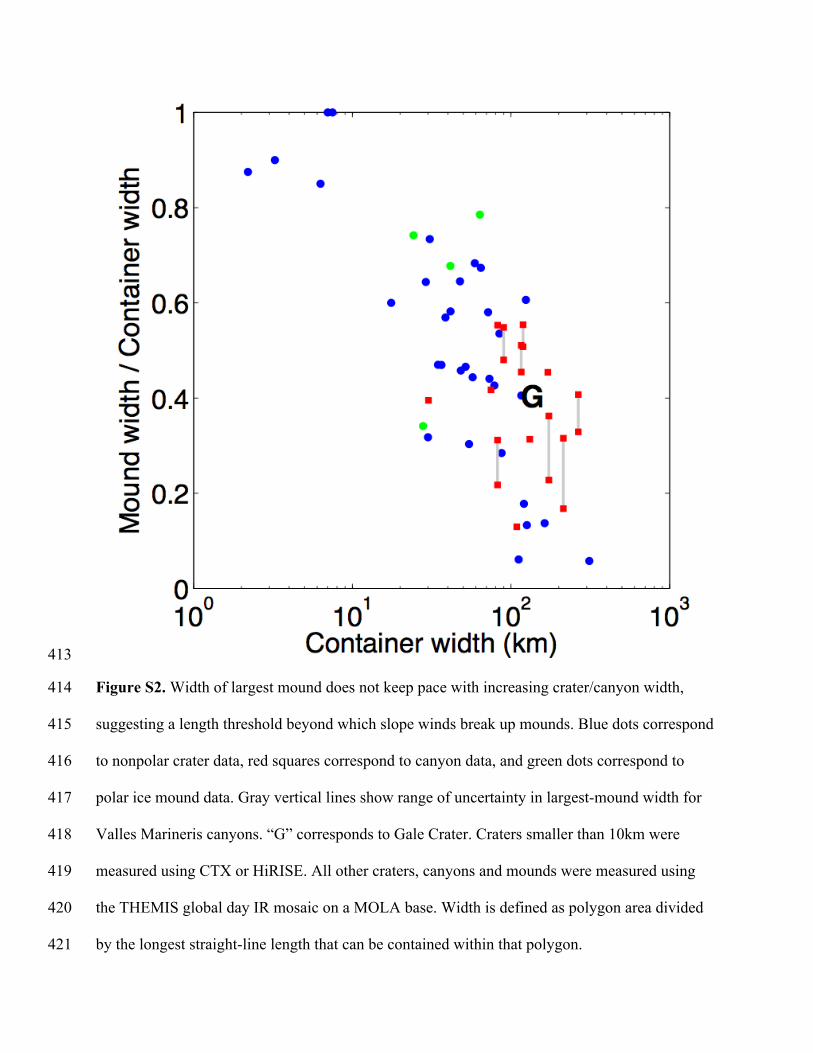
Figure S2. Width of largest mound does not keep pace with increasing crater/canyon width, 414
suggesting a length threshold beyond which slope winds break up mounds. Blue dots correspond 415
to nonpolar crater data, red squares correspond to canyon data, and green dots correspond to 416
polar ice mound data. Gray vertical lines show range of uncertainty in largest-mound width for 417
Valles Marineris canyons. “G” corresponds to Gale Crater. Craters smaller than 10km were 418
measured using CTX or HiRISE. All other craters, canyons and mounds were measured using 419
the THEMIS global day IR mosaic on a MOLA base. Width is defined as polygon area divided 420
by the longest straight-line length that can be contained within that polygon. 421
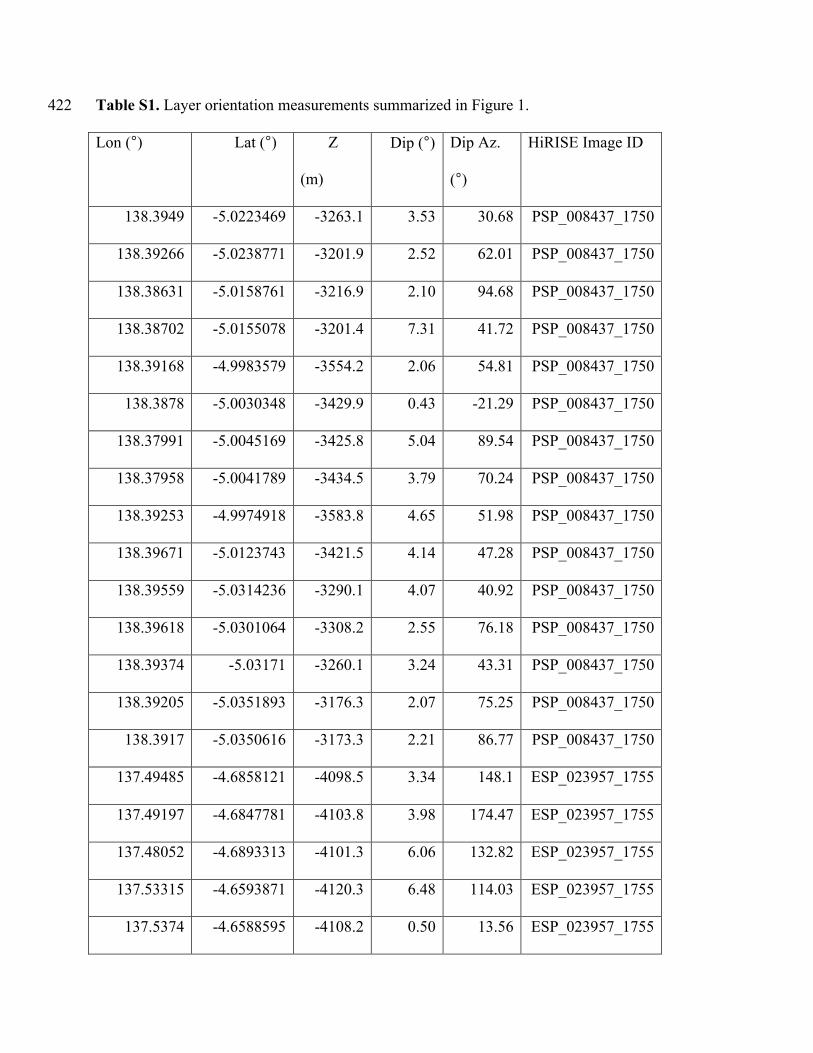
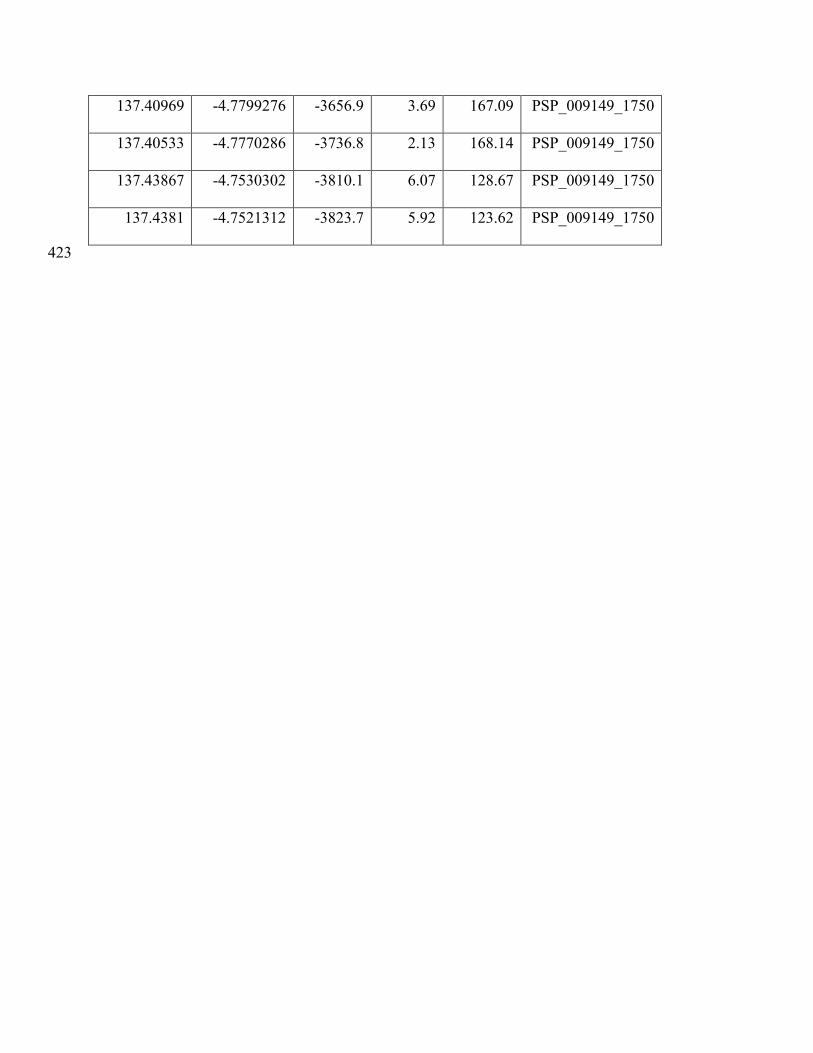
Table S1. Layer orientation measurements summarized in Figure 1. 422
Lon (°) Lat (°) Z
(m)
Dip (°) Dip Az.
(°)
HiRISE Image ID
138.3949 -5.0223469 -3263.1 3.53 30.68 PSP_008437_1750
138.39266 -5.0238771 -3201.9 2.52 62.01 PSP_008437_1750
138.38631 -5.0158761 -3216.9 2.10 94.68 PSP_008437_1750
138.38702 -5.0155078 -3201.4 7.31 41.72 PSP_008437_1750
138.39168 -4.9983579 -3554.2 2.06 54.81 PSP_008437_1750
138.3878 -5.0030348 -3429.9 0.43 -21.29 PSP_008437_1750
138.37991 -5.0045169 -3425.8 5.04 89.54 PSP_008437_1750
138.37958 -5.0041789 -3434.5 3.79 70.24 PSP_008437_1750
138.39253 -4.9974918 -3583.8 4.65 51.98 PSP_008437_1750
138.39671 -5.0123743 -3421.5 4.14 47.28 PSP_008437_1750
138.39559 -5.0314236 -3290.1 4.07 40.92 PSP_008437_1750
138.39618 -5.0301064 -3308.2 2.55 76.18 PSP_008437_1750
138.39374 -5.03171 -3260.1 3.24 43.31 PSP_008437_1750
138.39205 -5.0351893 -3176.3 2.07 75.25 PSP_008437_1750
138.3917 -5.0350616 -3173.3 2.21 86.77 PSP_008437_1750
137.49485 -4.6858121 -4098.5 3.34 148.1 ESP_023957_1755
137.49197 -4.6847781 -4103.8 3.98 174.47 ESP_023957_1755
137.48052 -4.6893313 -4101.3 6.06 132.82 ESP_023957_1755
137.53315 -4.6593871 -4120.3 6.48 114.03 ESP_023957_1755
137.5374 -4.6588595 -4108.2 0.50 13.56 ESP_023957_1755

137.53552 -4.6621189 -4073.1 3.90 -149.05 ESP_023957_1755
137.52567 -4.6641024 -4127.1 7.16 130.19 ESP_023957_1755
137.52487 -4.6636562 -4138.3 4.83 152.05 ESP_023957_1755
137.52653 -4.6655284 -4101.1 4.59 -153.08 ESP_023957_1755
137.50615 -4.676802 -4083.2 2.32 83.97 ESP_023957_1755
137.51028 -4.6721369 -4128.0 3.24 91.62 ESP_023957_1755
137.27098 -4.8715007 -3849.6 1.09 10.19 PSP_001488_1750
137.26671 -4.871837 -3857.7 5.19 85.97 PSP_001488_1750
137.27073 -4.8726906 -3833.2 2.61 -51.44 PSP_001488_1750
137.28434 -4.9179523 -3513.9 6.78 136.55 PSP_001488_1750
137.33063 -4.8310273 -3768.9 2.16 140.09 PSP_001488_1750
137.33036 -4.8285655 -3792.5 2.65 143.84 PSP_001488_1750
137.30338 -4.8466422 -3802.8 4.38 124.94 PSP_001488_1750
137.30307 -4.8457244 -3815.7 4.51 111.27 PSP_001488_1750
137.30442 -4.8455009 -3799.2 2.34 79.11 PSP_001488_1750
137.33242 -4.8638848 -3507.1 2.04 132.56 PSP_001488_1750
137.31164 -4.9369596 -3278.4 3.74 129.01 PSP_001488_1750
137.30984 -4.9389356 -3287.6 4.46 119.79 PSP_001488_1750
137.32216 -4.9201255 -3290.9 1.79 134.69 PSP_001488_1750
137.31702 -4.922859 -3306.6 4.20 160.7 PSP_001488_1750
137.33822 -4.901912 -3265.6 4.87 -174.83 PSP_001488_1750
137.3328 -4.8924006 -3389.9 6.71 117.93 PSP_001488_1750
137.3421 -4.8631512 -3464.4 5.66 105.35 PSP_001488_1750
137.40969 -4.7799276 -3656.9 3.69 167.09 PSP_009149_1750
137.40533 -4.7770286 -3736.8 2.13 168.14 PSP_009149_1750
137.43867 -4.7530302 -3810.1 6.07 128.67 PSP_009149_1750
137.4381 -4.7521312 -3823.7 5.92 123.62 PSP_009149_1750
423