Embed Size (px)
Citation preview

Growth & Decline of Growth & Decline of Resource UseResource Use
Understanding exponential Understanding exponential growthgrowthgrowthgrowth
Exponential Exponential vsvs linear growthlinear growthovershootovershoot
stocks stocks vsvs flowsflowsmodelsmodels

History of per History of per capita energy capita energy consumptionconsumption

Linear Linear vsvs exponential growthexponential growth
�� Stuffing mattress = linear growthStuffing mattress = linear growth�� E.g. $100 / yr x 50 yr = $5,000E.g. $100 / yr x 50 yr = $5,000
�� OneOne bank deposit + interest = bank deposit + interest = exponential growthexponential growth�� e.g. e.g. $100 $100 + 50 yrs @ 8.5% / yr gives + 50 yrs @ 8.5% / yr gives
$5,909 ( 100 x 1.085$5,909 ( 100 x 1.0855050 ))

Growth comparedGrowth comparedWhoa, where’d all that come from!??
Boringly predictable, slow politics/policies
Malthus: food area grows linearly, population exponentially
Doubling (halving) time = 70 yr / % annual rate
Barely perceptibleearly growth
agrarian society

Economist’s View of Consumptive Economist’s View of Consumptive GrowthGrowth
Phrase “7% annual growth” → flow rate doubles in 10 yr,the Doubling Time
Let’s see what happens to non-replenishing resource (oil)after each Doubling Time
How many doubling times from end would worries begin?

Surprising implicationsSurprising implications
e.g. told that resource will last 300 yr if consumed at present rate
But if our use grows by 5% annually, it will last only 56 yr!
e.g. US coal supply (yikes!)
Oops, wrong … 1000 yrs. Too bad, only 79 yr!
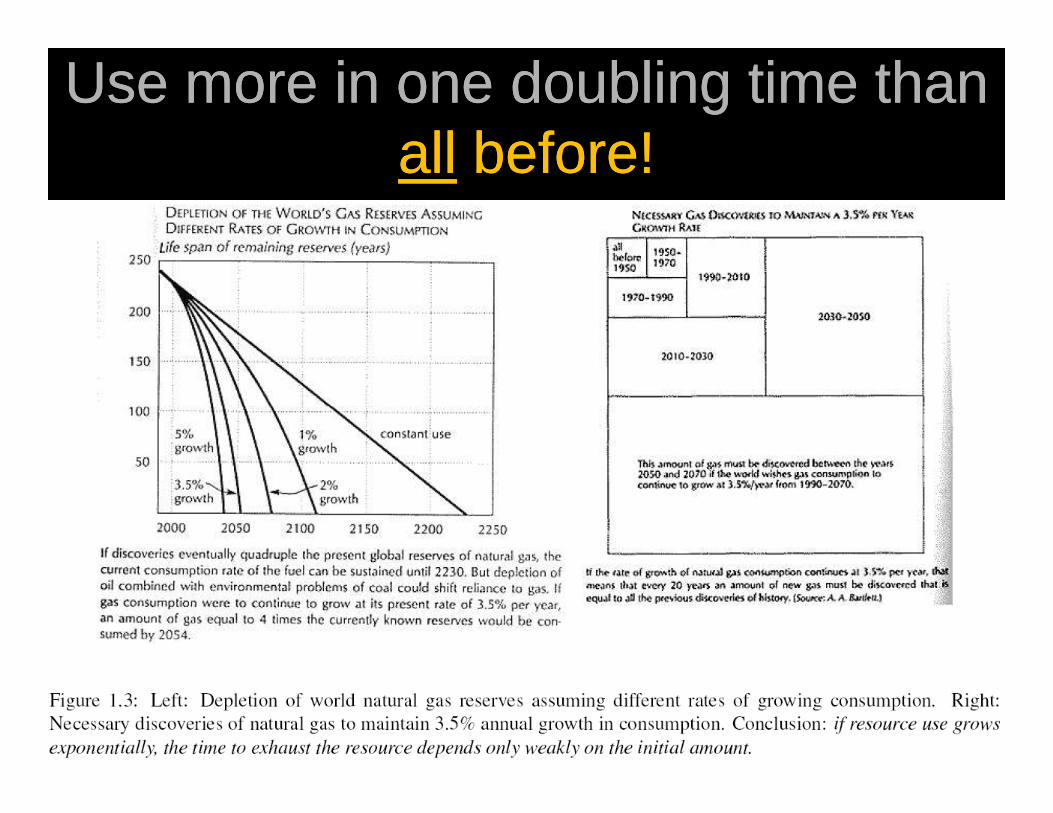
Use more in one doubling time than Use more in one doubling time than allall before!before!
Key points in Resource UseKey points in Resource Use
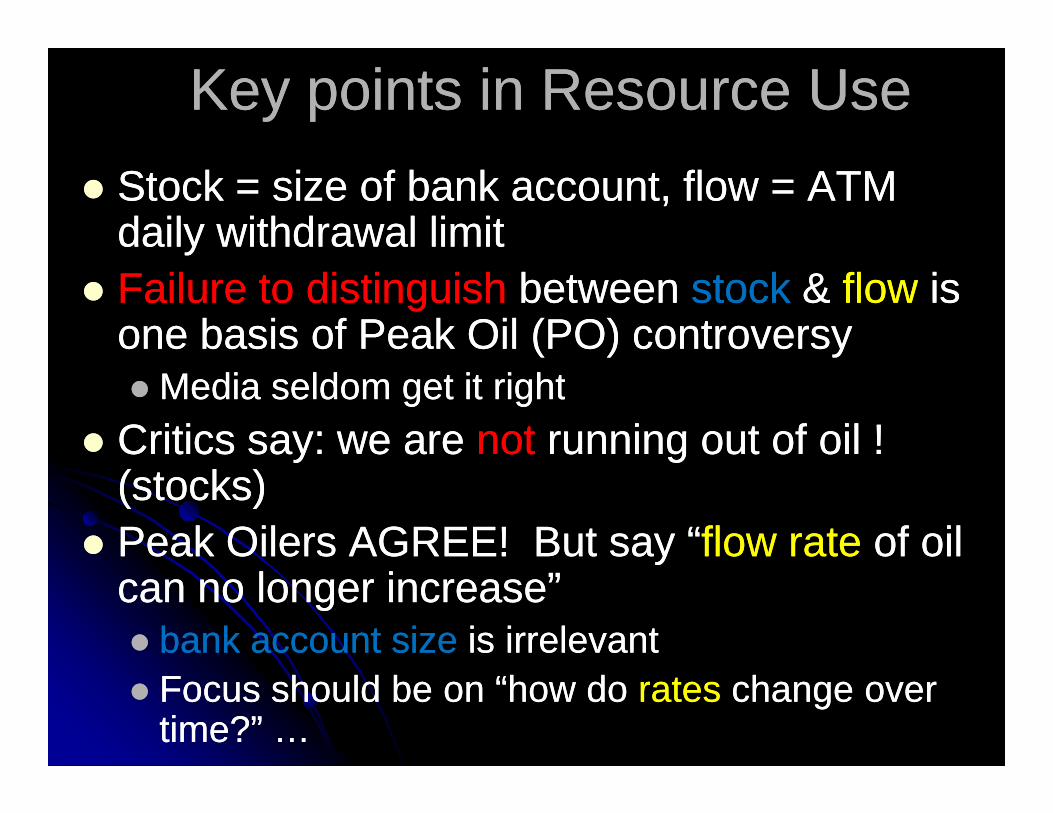
�� Stock = size of bank account, flow = ATM Stock = size of bank account, flow = ATM daily withdrawal limitdaily withdrawal limit�� Failure to distinguish Failure to distinguish between between stockstock & & flow flow is is
one basis of Peak Oil (PO) controversyone basis of Peak Oil (PO) controversy��Media seldom get it rightMedia seldom get it rightMedia seldom get it rightMedia seldom get it right
�� Critics say: we are Critics say: we are notnot running out of oil ! running out of oil ! (stocks)(stocks)�� Peak Oilers AGREE! But say “Peak Oilers AGREE! But say “flow rate flow rate of oil of oil
can no longer increase”can no longer increase”�� bank account size bank account size is irrelevantis irrelevant�� Focus should be on “how do Focus should be on “how do ratesrates change over change over
time?” …time?” …

Discovery rate & burn rateDiscovery rate & burn rate
�� ““logistical problemslogistical problems” inhibit discoveries” inhibit discoveries�� Initially economic, eventually Initially economic, eventually geologicalgeological�� These quickly These quickly end exponential growthend exponential growth!!
�� Discovery rateDiscovery rate ppeeaakkss,, is FLAT, then is FLAT, then ddeecclliinneess
�� Peak signals Peak signals urgent needurgent needto find new supply/fuelto find new supply/fuel�� Predicts future Predicts future extractionextraction
peak (peak (HubbertHubbert peak)peak)
�� Extraction peakExtraction peak signalssignalsimminent crisisimminent crisis
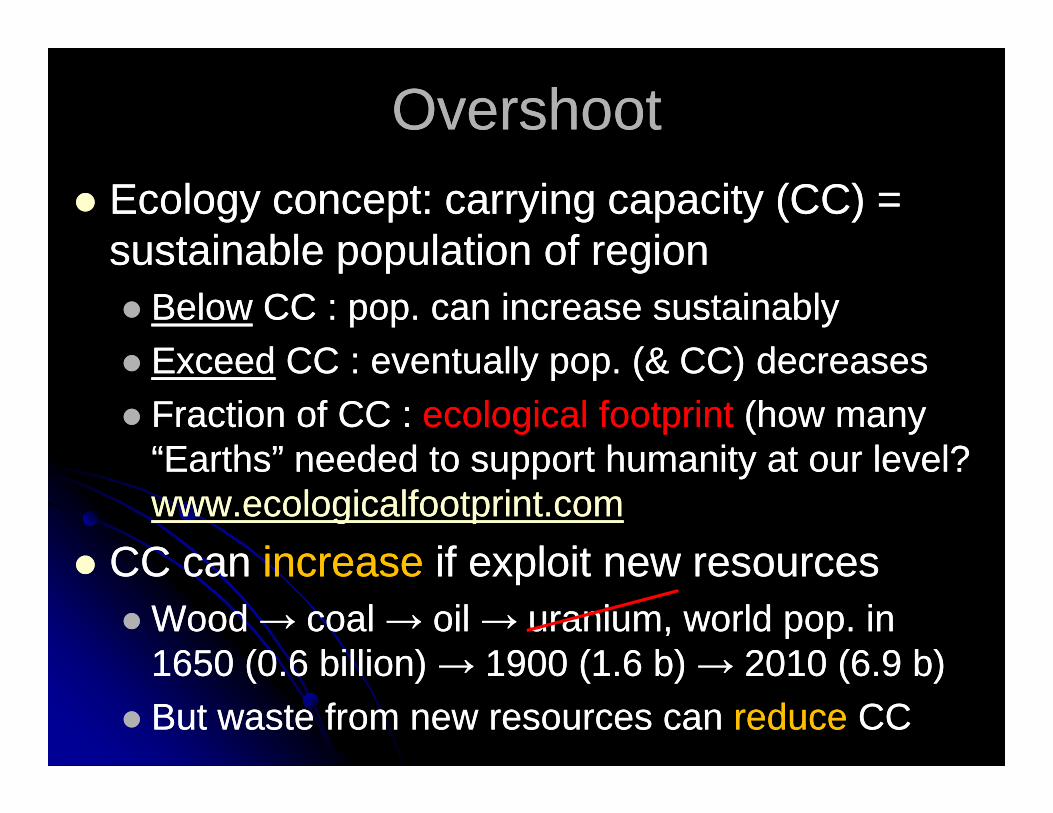
OvershootOvershoot�� Ecology concept: carrying capacity (CC) = Ecology concept: carrying capacity (CC) =
sustainable population of regionsustainable population of region�� BelowBelow CC : pop. can increase sustainablyCC : pop. can increase sustainably�� ExceedExceed CC : eventually pop. (& CC) decreasesCC : eventually pop. (& CC) decreases�� Fraction of CC : Fraction of CC : ecological footprint ecological footprint (how many (how many �� Fraction of CC : Fraction of CC : ecological footprint ecological footprint (how many (how many
“Earths” needed to support humanity at our level? “Earths” needed to support humanity at our level? www.ecologicalfootprint.comwww.ecologicalfootprint.com
�� CC can CC can increaseincrease if exploit new resourcesif exploit new resources��Wood → coal → oil → uranium, world pop. in Wood → coal → oil → uranium, world pop. in
1650 (0.6 billion) → 1900 (1.6 b) → 2010 (6.9 b)1650 (0.6 billion) → 1900 (1.6 b) → 2010 (6.9 b)�� But waste from new resources can But waste from new resources can reducereduce CCCC

Outcome depends entirely on the specific dynamics of growth Patterns are …

Attaining / Overshooting CCAttaining / Overshooting CC“Star trek” Planetary
�� Growth has momentumGrowth has momentum, sails past limits, sails past limits�� Which outcome depends on Which outcome depends on strengthstrength & &
timing timing of of feedbacksfeedbacks that that counter growthcounter growth�� What feedbacks would stop growth?What feedbacks would stop growth?�� Initial concerns were of Initial concerns were of
chemical pollutantschemical pollutants

Discovering chemical pollutantsDiscovering chemical pollutants�� LA smog from automobiles 1943LA smog from automobiles 1943�� catalytic converter 1975catalytic converter 1975
�� London UK smog from coal heating Dec 1952, London UK smog from coal heating Dec 1952, killed 12,000 peoplekilled 12,000 people�� Silent Spring (R. Carson) 1962 Silent Spring (R. Carson) 1962 �� DDT banned 1972DDT banned 1972
�� Global climate change midGlobal climate change mid--1960s 1960s �� Santa Barbara, CA oil spill 1969Santa Barbara, CA oil spill 1969�� Love Canal, Buffalo NY 1978Love Canal, Buffalo NY 1978�� Ozone hole 1985Ozone hole 1985�� CFC phaseCFC phase--out started 1987out started 1987
�� Chernobyl Chernobyl (& Three(& Three--mile Island) mile Island) nuke accidents 1986 nuke accidents 1986 (79)(79)
�� Abrupt climate change midAbrupt climate change mid--1990s CO1990s CO22

Late 1950’sLate 1950’s�� Govt studies : review oil suppliesGovt studies : review oil supplies�� US oil diminished to win World War 2US oil diminished to win World War 2�� USSR (Siberia): significant oil mostly untappedUSSR (Siberia): significant oil mostly untapped�� Lip service: others will want to industrializeLip service: others will want to industrialize�� GM & Ford pushed internal combustion engine, GM & Ford pushed internal combustion engine,
bought & dismantled electric trolley systems to force bought & dismantled electric trolley systems to force bought & dismantled electric trolley systems to force bought & dismantled electric trolley systems to force cities to busescities to buses
�� Resources for FutureResources for Future (Rockefeller Found.) (Rockefeller Found.) infinite atomic power = infinite economic powerinfinite atomic power = infinite economic power�� Harrison Brown: will deliver unlimited resourcesHarrison Brown: will deliver unlimited resources�� Rapid expansion of nuclear power 1973+Rapid expansion of nuclear power 1973+�� Handled electricity but Handled electricity but not US transportationnot US transportation

Early 1960sEarly 1960s
�� Hardin: Tragedy of the CommonsHardin: Tragedy of the Commons�� EhrlichsEhrlichs: The Population Bomb: The Population Bomb�� Pimentel & Pimentel & OdumOdum: quantified energy : quantified energy
inputs in agricultureinputs in agricultureinputs in agricultureinputs in agriculture

Late 1960sLate 1960s�� Club of RomeClub of Rome�� Businessmen: how does pop. growth modify Businessmen: how does pop. growth modify
environment by pollution & resource exhaustion?environment by pollution & resource exhaustion?�� Topics ignored by economists (“externalities”)Topics ignored by economists (“externalities”)��What impact on food, environment?What impact on food, environment?
�� Solicited MIT computer study 1970Solicited MIT computer study 1970--22
�� To stimulate discussion: Limits of Growth 1972 To stimulate discussion: Limits of Growth 1972 �� To stimulate discussion: Limits of Growth 1972 To stimulate discussion: Limits of Growth 1972 ��Backlash from “growth community” bankers/economistsBacklash from “growth community” bankers/economists�� “Oil shocks” shortly thereafter lent apparent support“Oil shocks” shortly thereafter lent apparent support�� Pres. Carter warned of exp. Growth & ME control of USPres. Carter warned of exp. Growth & ME control of US�� Lost reLost re--election to Reagan even after “Carter Doctrine”election to Reagan even after “Carter Doctrine”
��Most assumed Most assumed LoGLoG was invalidated after ME supply was invalidated after ME supply was restored (big US oil imports & ME militarization was restored (big US oil imports & ME militarization including Israeli nuclear weapons)including Israeli nuclear weapons)

Start of Systems DynamicsModel exponential & linear interactionsRediscovered overshoot dynamics evident in animal populations
Feedback loops

Obviously,highly simplified!

Evolving studies of Limits of GrowthEvolving studies of Limits of Growth
�� Note: Note: LoGLoG has been completely dismissed by has been completely dismissed by mainstream (1980 Ehrlich/Simon bet)mainstream (1980 Ehrlich/Simon bet)
�� World3World3--03 (1991, 2003)03 (1991, 2003)�� no distinction no distinction between different energy forms or between different energy forms or
regions regions --> worldwide collapse evident by ~2030> worldwide collapse evident by ~2030
�� New World (2009)… let’s run it!New World (2009)… let’s run it!�� distinguishesdistinguishes renewable / depleting energy forms renewable / depleting energy forms --
> transition to new forms only as old are > transition to new forms only as old are overwhelmed by constraints (oil soon, overwhelmed by constraints (oil soon, NR+coalNR+coalmuch later)much later)

Explore World3 & New World3Explore World3 & New World3

EEnergy nergy RReturn eturn OOn n IInvestmentnvestment�� Energy must be used to generate energyEnergy must be used to generate energy�� E.g. energy embodied in an offE.g. energy embodied in an off--shore drilling rigshore drilling rig�� Reduces net energy available for other thingsReduces net energy available for other things

Energy ReturnEnergy ReturnCurrently, a minor impact on efficiency compared to engineering
waste

Energy conversionsEnergy conversions
In practiceIn practice

Recall : 1Recall : 1stst Law ThermodynamicsLaw Thermodynamics
Heat In
Change ofInternal energy(T rise and/or phase change)
Mechanicalwork done
Q∆U
W
Q = ∆U + W
+Heat engine
∆U
�� Burn fuelBurn fuel : chemical : chemical --> heat energy> heat energy�� Working fluid Working fluid (e.g. water) (e.g. water) flowing hot flowing hot --> cold > cold
region does mechanical workregion does mechanical work

Closed cycle steam plantClosed cycle steam plant
Workingfluid
Minimize this forMaximum efficiency

22ndnd Law ThermodynamicsLaw Thermodynamics
�� No cycle No cycle converts all heat in converts all heat in --> same work out> same work out�� Why? Heat disorders working fluid. Why? Heat disorders working fluid. �� Energy into molecular disorder is Energy into molecular disorder is entropy entropy
(remainder into work is (remainder into work is exergyexergy))(remainder into work is (remainder into work is exergyexergy))��e.g. water e.g. water --> steam, molecules more mobile> steam, molecules more mobile��Unit is J/K, entropy increases with TUnit is J/K, entropy increases with T
�� Disorder is reduced in working fluid as steam Disorder is reduced in working fluid as steam condenses to water, but resulting heat condenses to water, but resulting heat QQcondensecondense is is released into environmentreleased into environment�� Hence, efficiency = 1 Hence, efficiency = 1 –– QQcondensecondense / / QQboilboil < 1< 1

�� Most efficient Most efficient work work fromfrom burning fuel burning fuel is (Carnot)is (Carnot)
TTHH and Tand TLL are are working fluid working fluid temps temps in Kin KBurningBurning fuel CANNOT BEAT this limitfuel CANNOT BEAT this limit
e.g. wood stove e.g. wood stove exhausts to exhausts to
so so max efficiency max efficiency = 1 = 1 –– 278 / 573 = 0.51 = 51%278 / 573 = 0.51 = 51%Min of 49% of input energy is Min of 49% of input energy is wasted, the entropywasted, the entropy“90% efficient” stove converts 0.9·0.51 = 46% wood “90% efficient” stove converts 0.9·0.51 = 46% wood chemical chemical
energy energy into into heat heat , 54% into waste, 54% into waste
300 273 573oHT C K= + =
5 273 278oC K+ =

Waste (entropy) streamsWaste (entropy) streams
Enter environment asEnter environment as�� Combustion products (gases, liquids, soot, ash)Combustion products (gases, liquids, soot, ash)�� Radioactivity (from coal ash, nuclear waste)Radioactivity (from coal ash, nuclear waste)�� Frictional heatFrictional heat
Can tap cascade to TCan tap cascade to T at each stage & reprocess at each stage & reprocess Can tap cascade to TCan tap cascade to TLL at each stage & reprocess at each stage & reprocess �� To reduce waste volumeTo reduce waste volume�� To extract useful heat (coTo extract useful heat (co--generation)generation)�� e.g. UNC coal plant :e.g. UNC coal plant :�� high pressure steam for hospitals, lower for food service, high pressure steam for hospitals, lower for food service,
lowest for building/water heat including dormslowest for building/water heat including dorms
EngineeringEngineering is is dumping entropy in clever waysdumping entropy in clever ways

Maximum (Carnot) EfficiencyMaximum (Carnot) EfficiencyCarnot requires Carnot requires TTHH constant, constant, but real working fluid but real working fluid
attains this only on attains this only on isobar isobar in itsin its liquid+vaporliquid+vapor statestate�� Its phase curve limits TIts phase curve limits THH
�� Material stress (soften at TMaterial stress (soften at TH H , typical turbine 565 , typical turbine 565 °°C)C)�� Environment (at TEnvironment (at TL L , typical 30 , typical 30 °°C)C)
condenser
2 stage boiler
turbine
compressor
Latent heat

Square box is Carnot. Others are less
efficient by fraction solid/dotted areas.
Faster cycle = more power out
Practical engine cycles 1-4
Phase change
s
more power out“cut corners” so
reducing efficiency
PowerPower & & efficiencyefficiency are are opposites!opposites!
Internal Combustion Engine
A powerful ICE A powerful ICE mustmust get get poorer gas mileagepoorer gas mileage
Internal Combustion Engine
Many simulated engine cycles

Energy ConversionsEnergy Conversions�� Low (directional motion) Low (directional motion) --> high (random) > high (random)
entropy are efficient & vice versaentropy are efficient & vice versa

PracticalPractical power plantpower plant
Entropy dumped here or here

Now, heat your home most efficientlyNow, heat your home most efficiently1) Using electricity from distant power plant:
2) Using heat from home furnace:
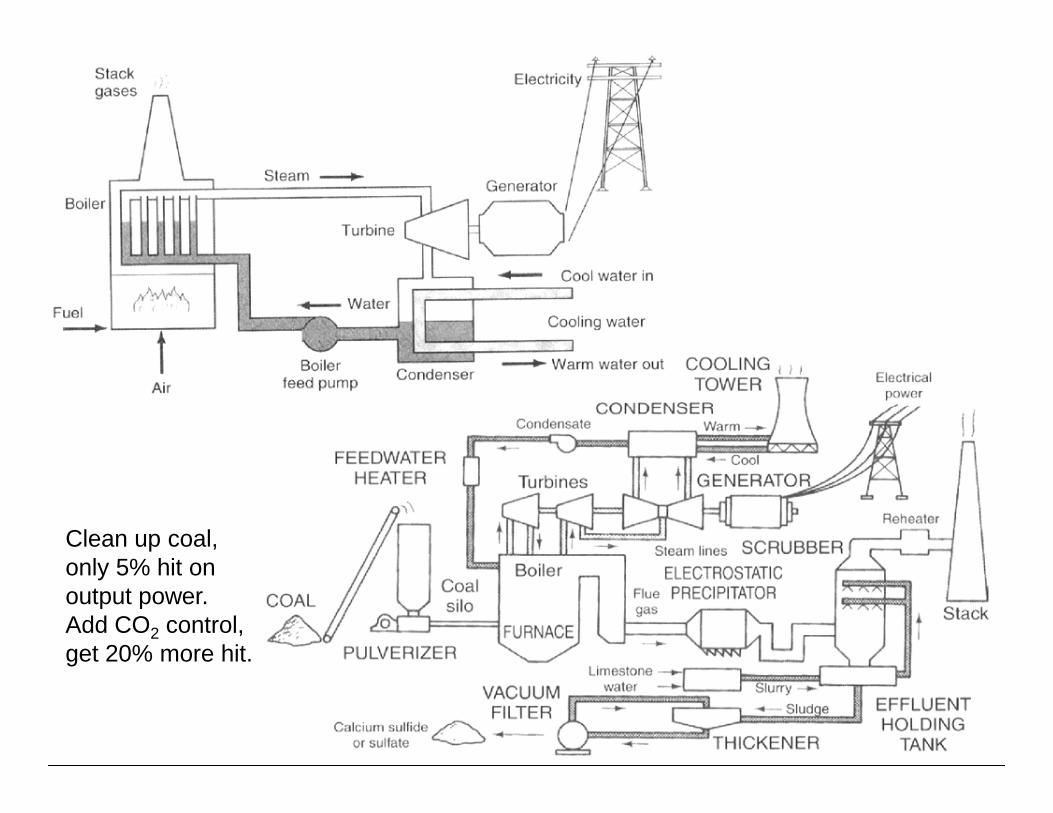
Clean up coal,only 5% hit onoutput power.Add CO2 control,get 20% more hit.

Combined
Gas turbine
41%
33%
CombinedGas + steamturbines +cogeneration

Types of electrical generationTypes of electrical generation
Agile = more costlyAgile = more costly Power companiesPower companies
�� May buy power from others May buy power from others form intermediate load, or form intermediate load, or may own themmay own themMore expensive fuel & more More expensive fuel & more
Most expensive
�� More expensive fuel & more More expensive fuel & more wear/tear so more wear/tear so more maintenancemaintenance�� Peak is usually bought from Peak is usually bought from
indepindep power producers at power producers at premium cost. Peak is in premium cost. Peak is in afternoon/evening so e.g. afternoon/evening so e.g. solar must shift a few hrssolar must shift a few hrs
Coal or nuclear power plantsCannot throttle
Cheapest
Power companies own these
Gas turbinecan throttle

Power companiesPower companiesBuild Build powerpower plants not plants not energyenergy plantsplants�� size plant by size plant by maximum maximum baseloadbaseload powerpower out (~GW)out (~GW)��when run @ fraction of optimum power, are when run @ fraction of optimum power, are less efficientless efficient
�� But, you But, you paypay for for energyenergy used ($/kW h)used ($/kW h)
NonNon--renewablerenewable co$tco$t set by set by energy energy stocks stocks (~MW)(~MW)�� Your bill = SUM ofYour bill = SUM of�� sunk cost sunk cost of plant (of plant (capital+interestcapital+interest paid over 40+ yrs)paid over 40+ yrs)�� Fuel costs (multiFuel costs (multi--year contracts)year contracts)
RenewableRenewable co$tco$t set by set by energyenergy flow flow == powerpower�� NO fuel cost, NO fuel cost, entirely entirely sunk costsunk cost�� Technology changes quickly, Technology changes quickly, so so �� more frequent upgrade $ capitalmore frequent upgrade $ capital, but less interest paid, but less interest paid

Work Work --> Heat : Rankine backwards > Heat : Rankine backwards = refrigerator (or heat pump)= refrigerator (or heat pump)
= constantpressurecompressor

Heat pump = heat moverHeat pump = heat mover
�� Low entropy Low entropy --> High is very efficient> High is very efficient�� EfficiencyEfficiency
�� When TWhen THH ~ T~ TLL gain 2gain 2--3x over electric heater3x over electric heater
1!H
H L
T
T Tη = >
−�� When TWhen THH ~ T~ TLL gain 2gain 2--3x over electric heater3x over electric heater�� So NGSo NG--fired fired powerplant+HPpowerplant+HP --> as efficient as home > as efficient as home
NG furnaceNG furnace�� Heat pump when run backwards is ACHeat pump when run backwards is AC�� Efficiency drops quickly as air TEfficiency drops quickly as air TLL drops to 0 drops to 0 °°C in C in
common units. Works best in moderate climate SCcommon units. Works best in moderate climate SC�� Ground source: in NC 1 ft into soil TGround source: in NC 1 ft into soil TLL ~ 15 ~ 15 °°C = 288 KC = 288 K

Ground loop & air loop heat pumpsGround loop & air loop heat pumps�� Expensive excavationExpensive excavation�� Very reliable & efficientVery reliable & efficient�� Being replaced with Being replaced with
supersuper--efficient air loopefficient air loop�� --10 to 24 10 to 24 °°CC

Wed: Critical thinking by mindWed: Critical thinking by mind--mappingmapping
�� Software structures a logical argumentSoftware structures a logical argument�� Allows easy elaboration of “argument tree”Allows easy elaboration of “argument tree”�� GuidesGuides you to make all assumptions explicityou to make all assumptions explicit
GuidesGuides you to assess reliability/authority of all you to assess reliability/authority of all �� GuidesGuides you to assess reliability/authority of all you to assess reliability/authority of all linkslinks�� Practice, practice, practice!Practice, practice, practice!

Analysis : trivial exampleAnalysis : trivial example
This is very useful Rationale® software,

Fossil fuelsFossil fuels
1.1. Petroleum & Natural GasPetroleum & Natural Gas
OriginOriginDiscoveryDiscoveryDiscoveryDiscovery
Extraction (depletion)Extraction (depletion)Predictive Model Predictive Model (Not my work!)(Not my work!)
“It is only out of pride or gross ignorance, or cowardice, that werefuse to see in the present the lineaments of times to come.“
Marguerite Yourcenar

Plenty of Fossil Fuels!Plenty of Fossil Fuels!
adequate to power all of humanity if not for CO2
Decline~2014
Decline~2030?
Peaking~2030?

Large, Large, formerlyformerly balanced CObalanced CO22 flowsflows
Depends on oceanT(depth) & acidity
Depends on deforestation,rainfall, CO2 level
Dwarfed byDwarfed byimmediateeffects

Global Carbon CycleGlobal Carbon Cycle

Fossil Fuels OriginFossil Fuels OriginAlmost completely biogenic (carbon cycle)�� Plants absorb COPlants absorb CO2 2 + water + sunlight to build + water + sunlight to build
organic Corganic C--H hydrocarbons H hydrocarbons (inorganic here is C w/o H)(inorganic here is C w/o H)
�� inefficient : photons too energetic for direct plant use → inefficient : photons too energetic for direct plant use → chemical energy (sugar & other metabolic molecules)chemical energy (sugar & other metabolic molecules)
�� Storage is Storage is chemical reductionchemical reductionSunlightSunlight + 6CO+ 6CO +6H+6H O O → C→ C HH OO +6O+6O�� SunlightSunlight + 6CO+ 6CO22+6H+6H22O O → C→ C66HH1212OO66+6O+6O22
�� Energy is held in CEnergy is held in C--C & CC & C--O & CO & C--H electron bondsH electron bonds
�� Cycle completes by Cycle completes by aerobic decay aerobic decay ((oxidation))�� CC66HH1212OO66+6O+6O2 2 → 6CO→ 6CO22+6H+6H22O + O + energy of old sunlight energy of old sunlight
�� If oxidation If oxidation interruptedinterrupted, get fossil fuel source rock, get fossil fuel source rock�� WeWe choose when to complete oxidation & so release choose when to complete oxidation & so release
bound energy as electrons redistributebound energy as electrons redistribute
!!! geological processes !!! geological processes concentrate fuels

For Abundant Growth, NeedFor Abundant Growth, Need�� Abundant light (photosynthesis)Abundant light (photosynthesis)�� Warmth (high Warmth (high bioproductivitybioproductivity))�� Moisture (good nutrient flow)Moisture (good nutrient flow)
Optimal environments: sub/tropical swamps, river deltas, lakes, reef lagoons, shallow seasdeltas, lakes, reef lagoons, shallow seas
Each produces unique type of fossil fuel 10s Myr later: Marine algae: oil Land biomass: coal Both: NG
+heat$$$ implications: distribution/concentration sets energy needed to extract fuel, & contaminants that complicate refining

Such regions in past formed Such regions in past formed all all oil/NG!oil/NG!Flooded continental shelves, many shallow seas
Note: Middle East & “Stans” were tropical, shallow, prolific in both intervals
Cretaceous Cretaceous (120(120--94 My)94 My)Alaskan &US48 oil
Today SE Asia, N. of Australia making oil ready 10s Myr from nowPaleocene Paleocene (55(55--45 My)45 My)

No oxidation → need No oxidation → need oceanic anoxic eventsoceanic anoxic events
�� ““supersuper--greenhousegreenhouse” eras” eras�� UnderUnder--sea volcanism 30sea volcanism 30--50x today boosted CO50x today boosted CO22
atmosphere levels 60% higher than today atmosphere levels 60% higher than today (650 (650 ppmppm))
�� ~twice our pre~twice our pre--industrial industrial �� ~twice our pre~twice our pre--industrial industrial ��At first enhanced bioAt first enhanced bio--productivity, then …productivity, then …��… over few thousand yrs raised sea T, attenuated major … over few thousand yrs raised sea T, attenuated major
ocean circulation currentsocean circulation currents�� Less vertical circulation: oceans were O starved deeper than Less vertical circulation: oceans were O starved deeper than
~200 m, few bottom dwellers to scavenge~200 m, few bottom dwellers to scavenge
��Volcanic hydrogen sulfide further poisoned oceansVolcanic hydrogen sulfide further poisoned oceans
�� Organic debris settled without oxidationOrganic debris settled without oxidation��Made widespread Made widespread black shale depositsblack shale deposits (oil source rock)(oil source rock)

In this picture, petroleum is In this picture, petroleum is rarerare�� ShaleShale (kerogen)(kerogen) buried, compressed, cooked buried, compressed, cooked
in crust. in crust. HigherHigher T + water T + water broke long C chains broke long C chains to smaller ones (>2 km burial)to smaller ones (>2 km burial)�� Kerogen in air = Kerogen in air = oil shaleoil shale, buried = , buried = bitumenbitumen
�� Regions that stay cool long enough form Regions that stay cool long enough form �� Regions that stay cool long enough form Regions that stay cool long enough form petroleum (80/90% oil/NG worldwide @ petroleum (80/90% oil/NG worldwide @ T = 60T = 60--120 120 °°C: C: golden zonegolden zone))�� If If faulted, can flow & pool. If , can flow & pool. If cap rock, NG+ , NG+
petroleum+waterpetroleum+water stratifies, pressurizing oilstratifies, pressurizing oil�� If T ever too high (>5 km), petroleum soon If T ever too high (>5 km), petroleum soon
crackscracks to NG, generally lost into atmosphereto NG, generally lost into atmosphere

Concentrating Oil in Rock Pores Concentrating Oil in Rock Pores
�� Oil/NG/water zones Oil/NG/water zones separateseparate (stratify) by densities:(stratify) by densities:�� NG NG capcap atop oil concentrate atop water atop oil concentrate atop water �� Oil Oil pressurizedpressurized by NG & slightly by waterby NG & slightly by water�� If If cap rock cap rock porous or surface erodes, NG escapes porous or surface erodes, NG escapes
and oil and oil strandedstranded ( = too expensive to pump out)( = too expensive to pump out)
�� Studied w/ 3D seismology :Studied w/ 3D seismology :

Less dense so rises Boundary folds
concentrate fluids
buoyant

Oil & NG ExtractionOil & NG Extraction�� “Wildcat” test wells (90% duds, lose $ “Wildcat” test wells (90% duds, lose $ but but writewrite--offoff))�� Drill bit, “mud”, casing, directional drilling, blockDrill bit, “mud”, casing, directional drilling, block--back back
control, cap wells, “control, cap wells, “frackingfracking””�� marginal wells marginal wells (bottom/sides) define extent (bottom/sides) define extent pay zonepay zone
�� Primary extraction Primary extraction gets <= 30% of gets <= 30% of oil in place oil in place (OIP)(OIP)
�� Repressurize field by Repressurize field by injecting water/gasinjecting water/gas. . Sweeps oil to wells Sweeps oil to wells (secondary extraction) (secondary extraction) increases to ~50% OIPincreases to ~50% OIP�� Tertiary recovery: inject detergents/steam/COTertiary recovery: inject detergents/steam/CO22
�� Finally remove NG cap, stranding 30Finally remove NG cap, stranding 30--40% OIP40% OIP
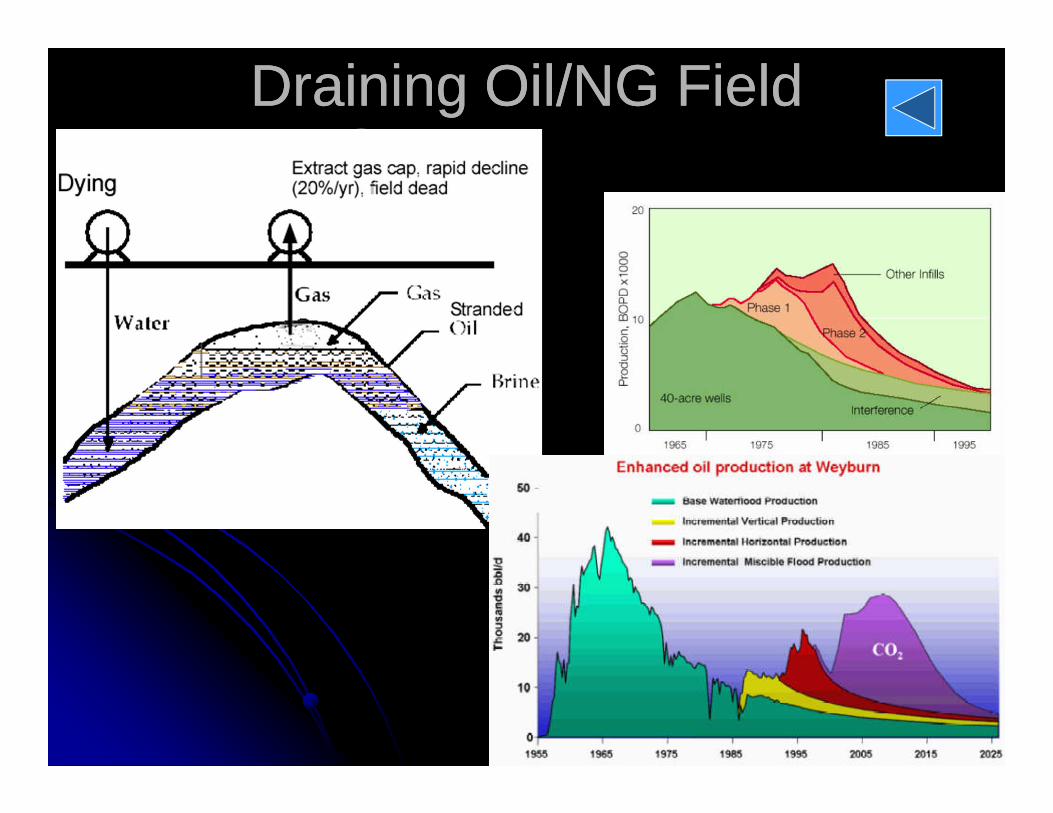
Draining Oil/NG FieldDraining Oil/NG Field
11’
3

Another exampleAnother example
Nitrogen injectionCollapse
Nitrogen injection

up to 1994
X

Petroleum & Petroleum & NG structureNG structure
Enough C atoms make molecule heavy enough at room T toform liquid (convenient)
Very reactive 2 & 3 bonds
petrochemicals
Gas requires heavyContainer (costly)
Energy is released as H-H & C-C bonds snap& electron clouds redistribute
Aromatics“100 octane” cut with n-heptane

Oil RefiningOil Refining
Vaporize crude oil @ 700 °F Molecules of different mass rise to different levels, repeat to increase
Flare lightest & NG (Iraq, done if no NG pipeline)
concentration.Coking removes C to increase H/CReforming improves octane #Crack & catalyze long chains to lighter
Goal: increase lighter, more widely useful & cleaner burning fraction

UsingUsingPetroleum Petroleum
ONE BARREL crude oil:

2 squeezes on oil supply2 squeezes on oil supply
Global per capita power Global per capita power decliningdeclining ((flatflat energy energy supply consumed by supply consumed by growinggrowing pop.)pop.)
ERoEI is ERoEI is decliningdeclining because we’ve drained most because we’ve drained most accessible accessible concentratedconcentrated oil reservoirsoil reservoirs
Larger effort expended extracting fuelsLarger effort expended extracting fuels�� Larger effort expended extracting fuelsLarger effort expended extracting fuels��More waste pollution preparing fuelsMore waste pollution preparing fuels�� Power infrastructure was Power infrastructure was optimizedoptimized for fossil fuels, for fossil fuels,
expensive in $, energy, & time to replaceexpensive in $, energy, & time to replace��Wasteful to junk so tend to refurbishWasteful to junk so tend to refurbish��Entrenched business hence political interests often Entrenched business hence political interests often
restrict scope of refurbishmentsrestrict scope of refurbishments

What Limits oil “Flow”?What Limits oil “Flow”?
�� Discovery (seismic, 2D 3D Discovery (seismic, 2D 3D
�� OffOff--shore drill rigs, complex so expensive so limited #shore drill rigs, complex so expensive so limited #

�� Investment bubblers & CartelsInvestment bubblers & Cartels�� Extreme weather damageExtreme weather damage
No new No new refinerysrefinerys (NIMBY)(NIMBY)• Inefficient use �� No new No new refinerysrefinerys (NIMBY)(NIMBY)

�� Export restrictions to maintain domestic Export restrictions to maintain domestic supply to consume “petrodollar” wealthsupply to consume “petrodollar” wealth
�� Financial constraintsFinancial constraints

What sets What sets oil $ & flow?oil $ & flow?�� Depleting supply of Depleting supply of
cheap to produce cheap to produce oiloil�� Inelastic demandInelastic demand
CERA
barrel price required to sustain flow
CERA

So many constraints! So many constraints! How to estimate when How to estimate when world flow will decline?world flow will decline?world flow will decline?world flow will decline?
If constraints don’t change much …If constraints don’t change much …

Hubbert’sHubbert’s “curve fitting”“curve fitting”Plot (annual extraction) / (total extracted to date) vs. total extracted to date.
Plot starts at (1st year,1st year), over time drops to (ultimate recoverable, 0)
After “noisy” start, curve settles to straight line, so perhaps can extrapolate to predict ultimate (total) recoverable resource (URR) in future
Stepping back halfway approximates year extraction starts to decline (= peak)
Texas Oil Depletion 1935-2003
0
0.02
0.04
0.06
0.08
0.1
0.12
0.14
0 10 20 30 40 50 60Millions
Cumulative Depletion
An
nu
al D
eple
tion
/Cu
mu
lativ
e
Texas Oil Depletion 1935-2003
0
0.02
0.04
0.06
0.08
0.1
0.12
0.14
0 10 20 30 40 50 60Millions
Cumulative Depletion
An
nu
al D
eple
tion
/Cu
mu
lativ
e
1935-1960
Texas Oil Depletion 1935-2003
0
0.02
0.04
0.06
0.08
0.1
0.12
0.14
0 10 20 30 40 50 60Millions
Cumulative Depletion
An
nu
al D
eple
tion
/Cu
mu
lativ
e
1935-1960 1961-1980
Texas Oil Depletion 1935-2003
0
0.02
0.04
0.06
0.08
0.1
0.12
0.14
0 10 20 30 40 50 60Millions
Cumulative Depletion
An
nu
al D
eple
tion
/Cu
mu
lativ
e
1935-1960 1961-1980 1981-2000
Texas Oil Depletion 1935-2003
0
0.02
0.04
0.06
0.08
0.1
0.12
0.14
0 10 20 30 40 50 60Millions
Cumulative Depletion
An
nu
al D
eple
tion
/Cu
mu
lativ
e
1935-1960 1961-1980 1981-2000 2001-2003
Shows that Texashas extracted 90% ofall its recoverable oil
1970
0
0.1
0.2
0.3
0.4
0.5
0.6
0.7
0.8
0.9
1
0 10 20 30 40 50 60Millions

USUS--48 & 48 & Saudi Saudi oil historiesoil histories
URR

Applied to World Oil Liquids SupplyApplied to World Oil Liquids Supply

ResultResult
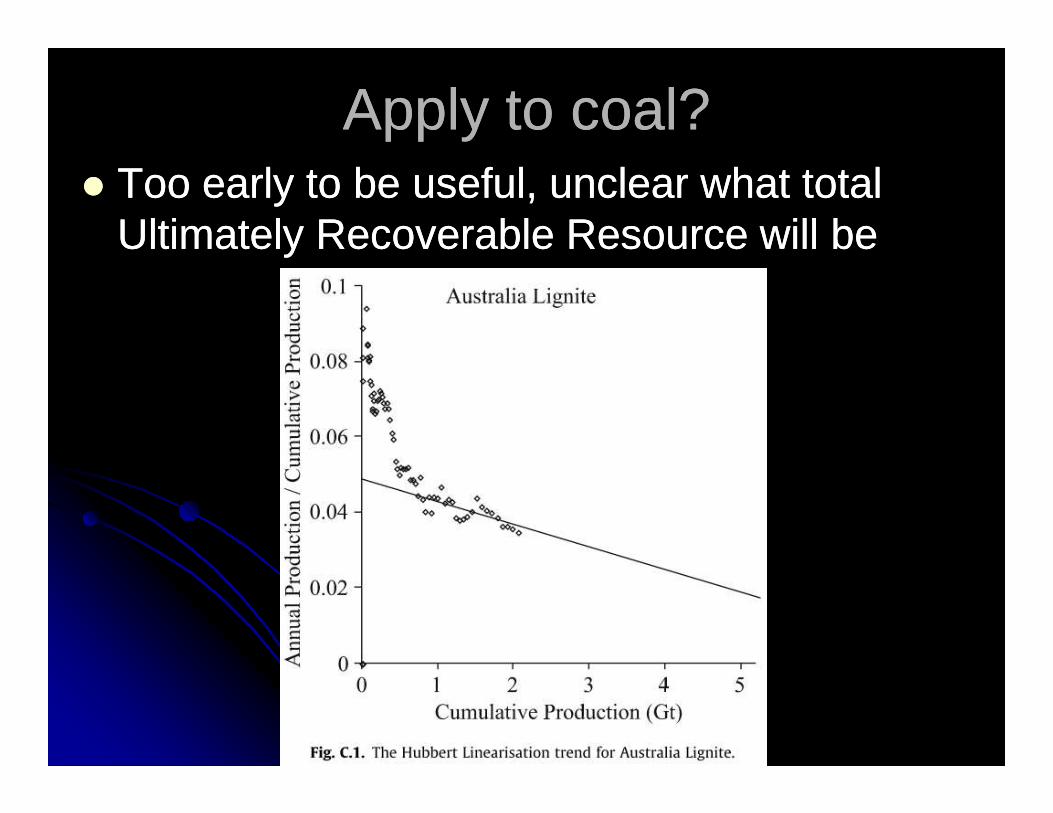
Apply to coal?Apply to coal?�� Too early to be useful, unclear what total Too early to be useful, unclear what total
Ultimately Recoverable Resource will beUltimately Recoverable Resource will be

Peak oil “Peak oil “rolloffrolloff timingtiming�� IRRELEVANT: Inflated IRRELEVANT: Inflated
OPEC reserves or OPEC reserves or technology?technology?
�� FACT: Too few largeFACT: Too few large--volume projects underway volume projects underway
Tar sandsvolume projects underway volume projects underway to overcome postto overcome post--2013 2013 depletiondepletion
�� FACT: New projects tap FACT: New projects tap nonnon--conventionalconventional oils, costly oils, costly & difficult, deliver & difficult, deliver smaller smaller flowsflows after delaysafter delays
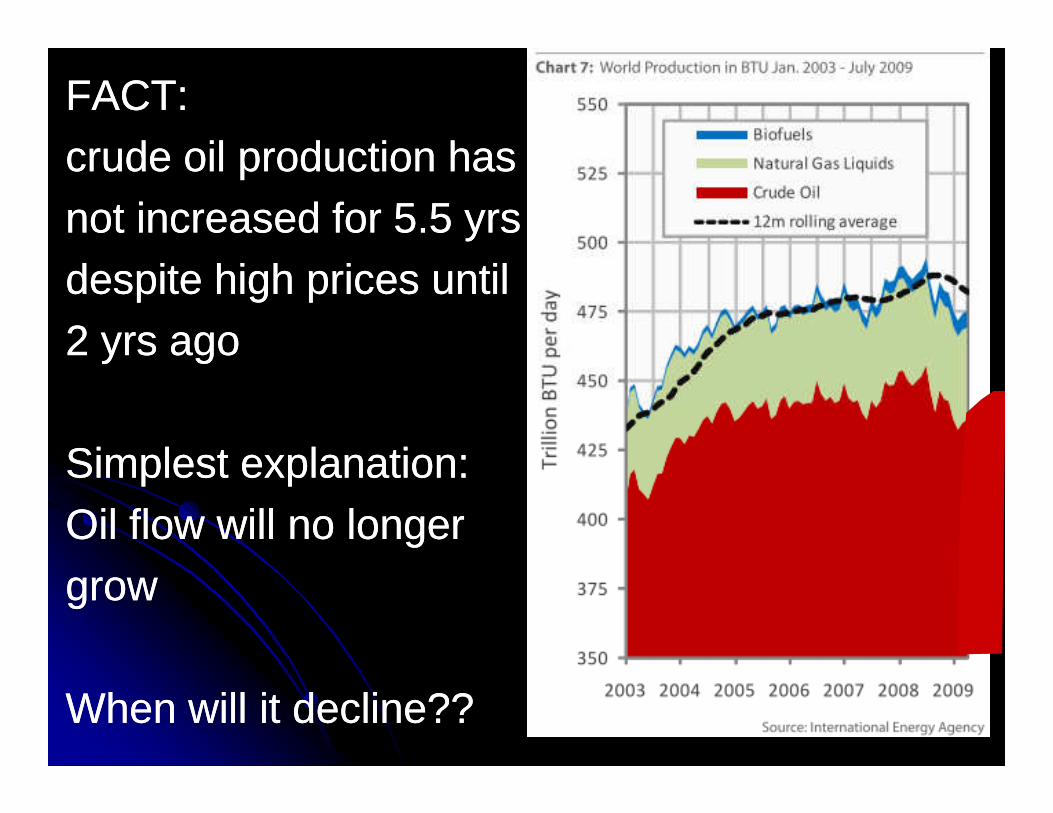
FACT: FACT: crude oil production has crude oil production has not increased for 5.5 yrsnot increased for 5.5 yrsdespite high prices untildespite high prices until2 yrs ago2 yrs ago
Simplest explanation:Simplest explanation:Oil flow will no longerOil flow will no longergrowgrow
When will it decline??When will it decline??
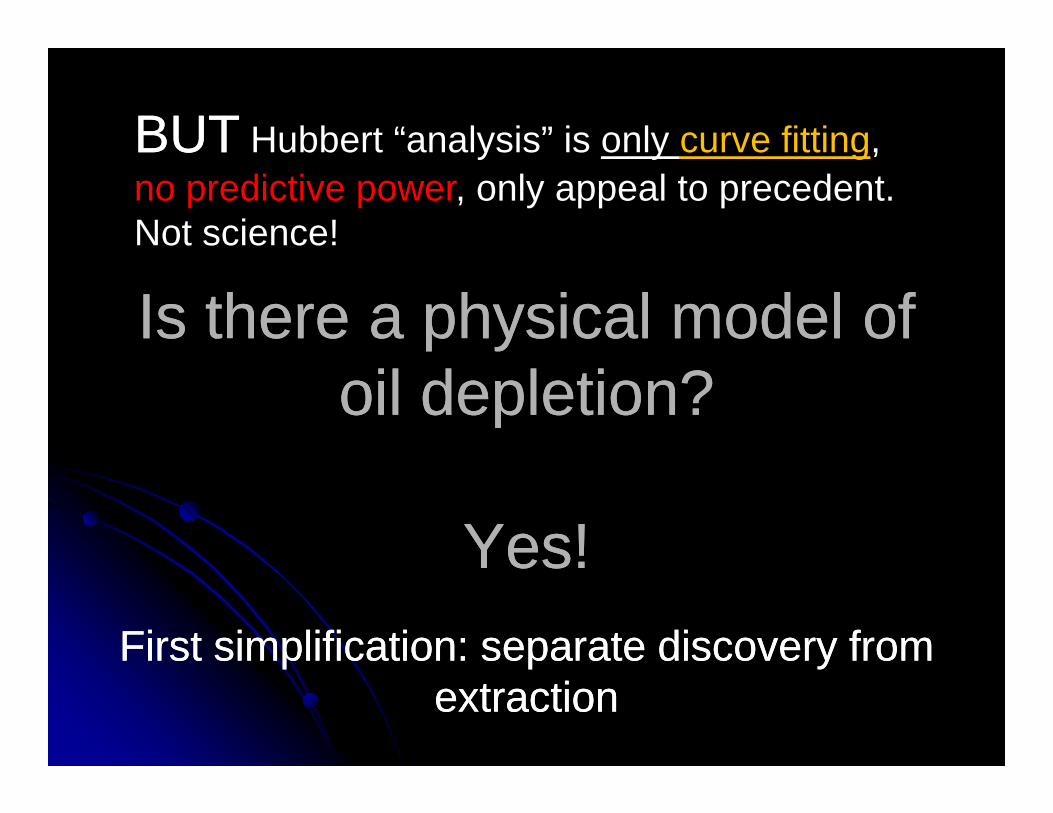
Is there a physical model of Is there a physical model of oil depletion?oil depletion?
BUTBUT Hubbert “analysis” is only curve fitting, no predictive power, only appeal to precedent.Not science!
oil depletion?oil depletion?
Yes!Yes!
First simplification: separate discovery from First simplification: separate discovery from extractionextraction

Volume of reservoir is RANDOM … like shoving pipe into ground.
Data: volume(time) discoveredData: volume(time) discovered
Cumulative distribution (= total volume found)
Randomness allows us to use probability distributions effectively.
This one isimpossible early on!

Sweep a “discovery box” thru depthSweep a “discovery box” thru depth
# of oil-containing spots found by sweeping container volume L(t) thru depth x follows exponential distribution
= constant probability / length (Poisson process).If the reservoir is V thick, then average oil discovery depth is
/
( )x Le
P xL
−
=
Assuming various exploration factors each increase L linearly with time (e.g. # of workers, technology improves), we get …
/
0
( ) (1 )V LN xP x dx L e∞
−= = −∫

… cumulative depth(t) of discovered oil… cumulative depth(t) of discovered oilSweep top to bottom while linearly increasing efficiency(depth) X linearly increasing # of workers(depth). So sweep discovery rate L(t) = t2 , and result resembles past US data:
depth = time2
Dep
th(t
ime)
/ /cumulative oil volume (1 ) (1 )nV L n V ktN L e kt e− −
= = − = −
1 /annual addition = (1 (1 / ))nn V kt ndN
nkt e V ktdt
− −= − +
But we search a volume not only depth,so plausible power is t2+2+2 = t6 For general power n we have

We match US annual We match US annual addition when addition when n = 6 n = 6
Family of curves in n
Instead of time on x-axis, here plot related total drill pipe used
Ann
ual d
isco
very
(t)
US oil discoveries as function of total drill pipe used
Good match to data!
Time

This smoothing is a This smoothing is a convolutionconvolution
Two distributions, one is viewed thru awindow that is slid over other to form window that is slid over other to form weighted average output.
Their instantaneous product (area) is plotted as line, usually smoothing (dispersing) the original distribution.

Model: field discovery is dispersed by latency (no field development), then infrastructure construction then full production
Reserve AdditionsReserve Additions
We apply a triple convolution of decliningexponentials to the field discovery curve D(t)
/2
3( )( ) ( )
(3)
Best fit to data with =3 yrs
t
build fallow mature
eh h h D t t D t
λ
λλ
−
⊗ ⊗ ⊗ = ⊗Γ
Each successive convolution smoothes D(t) more

Multiply reserve additions by an Multiply reserve additions by an extraction rateextraction rate
Extraction rate
to map discoveries toproduction
TexasRailroad
Opec
China
uncontrolled
Railroadcommission
Dynamics of oil productionseems to be very simple

A physical model makes testable A physical model makes testable predictions & gives uncertainties predictions & gives uncertainties
Work in progress by Foucher et al (Computer Research Inst. of Montreal)
Apparent convergence
Note: all projectionsfrom past rates converge
Apparent convergenceof models because no goodtreatment of reserve growthThat will be $$ constrained
Will future resemble the past??
e.g. assume constant shock rate infuture :

Our oil future depends on Our oil future depends on potential for reserve growthpotential for reserve growth
= reported reservoir estimate improves over time from 1) Drilling marginal wells
to better define reservoir volume2) Advanced tech to increase flow
3) Mergers & Acquisitions3) Mergers & Acquisitionsadjust financial reporting
rules (country specific).All murkier in past than today.
1) & 2) do not increase total• 5% boost from tech delays
Peak Oil by 5 yrs but tech increases flow not total
3) masks the oil decline !

Fake reserve growth?Fake reserve growth?�� National oil Co have National oil Co have
80% world oil reserves80% world oil reserves�� Self reportSelf report their reserves their reserves �� indepindep. check is $$$$. check is $$$$
�� OPEC country quota is OPEC country quota is set by its oil reservesset by its oil reservesset by its oil reservesset by its oil reserves�� Can sell % of remainder Can sell % of remainder �� Mysterious increasesMysterious increases�� No new discoveriesNo new discoveries�� Attracts investmentAttracts investment
�� USGS attributed such USGS attributed such “growth” just to tech“growth” just to tech�� Boosts global reservesBoosts global reserves

FieldField--byby--field depletion would field depletion would tell us the whole PO storytell us the whole PO story
�� That governments have not demanded these That governments have not demanded these data from ME suppliers is tellingdata from ME suppliers is telling�� Numbers provided to date are very suspiciousNumbers provided to date are very suspicious�� Numbers provided to date are very suspiciousNumbers provided to date are very suspicious�� There are no published contingency plans for There are no published contingency plans for
oil shortagesoil shortages�� US strategic petroleum reserve holds 20 days US strategic petroleum reserve holds 20 days
of full use crude oil of full use crude oil --> rationing> rationing�� We remain vulnerable to “oil shock” supply We remain vulnerable to “oil shock” supply
disruptions, and especially refinery sabotagedisruptions, and especially refinery sabotage


![[Paper] Italy Growth and Decline](https://img.pdfslide.us/doc/110x75/577cc8771a28aba711a2e721/paper-italy-growth-and-decline.jpg)