Embed Size (px)
Citation preview
Version: 10 February 2011.
GROWING TOGETHER: CROATIA AND LATVIA*
Thorvaldur Gylfason
University of Iceland
and
Eduard Hochreiter
Joint Vienna Institute
Abstract
We compare and contrast the economic growth performance of Croatia and Latvia
since the collapse of communism in 1991 in an attempt to understand better the extent
to which the output growth differential between the two countries can be traced to
increased efficiency in the use of capital and other resources (intensive growth) as
opposed to sheer accumulation of capital (extensive growth). On the basis of a simple
growth accounting model, we infer that advances in education at all levels, good
governance, and institutional reforms have played a significant role in raising
economic output and efficiency in both Croatia and Latvia. The EU perspective seems
to have made a more significant contribution to growth in Latvia than in Croatia, even
if Latvia’s immediate post-accession boom proved unsustainable.
Thorvaldur Gylfason
Professor of Economics
Department of Economics
University of Iceland
101 Reykjavík
Iceland
Tel: +354-525-4500
Fax: +354-552-6806
E-Mail: [email protected]
Eduard Hochreiter
Director
Joint Vienna Institute
Mariahilfer Strasse 97
1060 Wien
Austria
Tel.: +43-1-798 94 95
Fax: +43-1-798 05 25
E-Mail: [email protected]
Keywords: Economic growth, governance, transition economies
JEL numbers: O16
* This paper was presented at the 16
th Dubrovnik Economic Conference held at Hotel Grand
Villa Argentina in Dubrovnik, Croatia 23-26 June 2010 and organized by the Croatian
National Bank. We would like to thank our discussant, Zuzana Murgasova, David Moore,
Christoph Rosenberg, and two anonymous referees for helpful comments. Petra Vujakovic
provided excellent research assistance.

2
I. Historical Introduction
This paper aims to add to a growing strand of comparative studies of country pairs.1
At the time of the Soviet Union and Yugoslavia’s disintegration around 1991 Latvia
and Croatia’s relative economic positions within their federations were broadly
comparable. In both countries, real income per person was above the federal average.
At that time, in 1991, Croatia’s gross domestic product (GDP) per person was
appreciably higher than that of Latvia. During 1989-1993, Croatia and Latvia’s per
capita GDP sank by a third to a half in real terms, and thereafter grew together after
reversing the initial output decline at the beginning of the transition from plan to
market. Starting out with a lower level of initial per capita income, Latvia was on its
way to catching up with Croatia until the financial crisis hit the Baltic country hard in
2008. Thus, Croatia managed to stay ahead (Figure 1). Two intriguing questions that
arise in this context are why Latvia grew so much faster than Croatia and what role
the different timing of European Union (EU) accession of the two countries and their
concomitant institutional change may have played in their growth performance.
This paper aims to shed light on these questions by applying a simple version of
standard growth economics to a comparison of the recent growth record of the two
countries. In an earlier paper, we compared Estonia and Georgia by reviewing the
main determinants of their growth, and concluded that Estonia beat Georgia on
virtually every score. Unsurprisingly, therefore, Estonia and Georgia grew apart after
1991. Based on simple growth accounting, education and efficiency were found to
make similar contributions to growth, while investment made a relatively minor
contribution. Hence, growth was primarily intensive rather than extensive. In this
paper, we report by similar methods how Croatia and Latvia grew together after 1991,
how Latvia caught up, and how Croatia remains ahead.
As before, our choice of countries to compare is mainly dictated by the fact that
Latvia decided at the outset of its transition from plan to market to apply for EU
membership whereas Croatia took longer to make that decision. The two countries
differ in several respects. Therefore, our comparison between them will not be as
clear-cut as would be, for example, a comparison of North Korea and South Korea
1 Other examples include Gylfason (2006), Barry et al. (2009), and Henry and Miller (2009).
We draw heavily on Gylfason and Hochreiter (2009).

3
(identical twins with different institutional origins) or of Barbados and Jamaica
(similar institutions, inherited from Great Britain, but different policies as
demonstrated by Henry and Miller (2009)). Our story about Croatia and Latvia will
involve a number of moving parts. Our aim is to use a broad brush to paint a picture
of their growth performance after 1991 in view of the evolution of several well-
established determinants of growth without, however, pursuing the possible
interlinkages among those determinants.
Croatia and Latvia are both small (64,589 km², population 2.2 million and 56,594
km², population 4.5 million). Both are poorly endowed with natural resources, which
may be good for their long-run growth potential as suggested by Sachs and Warner
(1995) and many others, and both had cities or regions that prospered long ago. Latvia
prospered when Riga and other Latvian cities became part of the Hanseatic League
from 1282 onward. Croatia, or, more accurately, the Republic of Ragusa/Dubrovnik,
also thrived through vivacious trade from around 1360 onward.
Figure 1. Gross Domestic Product per capita 1991 and 2008
(Constant 2005 international dollars at purchasing power parity)
Source: World Bank, World Development Indicators 2010.
Data for the Republic of Kosovo are not available.
Both countries share a history of foreign rule and influence: Latvia, that of
Germany, Poland, Sweden, and Imperial Russia from 1710 onward, and Croatia as
0 5000 10000 15000 20000 25000 30000
Bosnia and Herzegovina
Macedonia, FYR
Montenegro
Serbia
Latvia
Croatia
Lithuania
Estonia
Slovenia
2008
1991

4
part of Austria and Hungary and as a tribute-obliged vassal state of Venice and the
Ottoman Empire. Yet, economically speaking, there were periods when foreign
dominance did not inhibit economic prosperity (e.g., Southern Latvia’s “golden age”
in the 17th
century and Ragusa/Dubrovnik under Ottoman vassalage in the 15th
and
16th
centuries). Overall, Latvia fared less well in economic terms during Russian rule
than Croatia did under Austrian, Hungarian and Ottoman supremacy.
Both countries became independent in 1918. Latvia, after a few chaotic years,
remained independent until it was occupied by Soviet Russia in 1940 under the Hitler-
Stalin Pact. After the collapse of the Austro-Hungarian Empire in 1918 Croatia chose
to form a new state with Serbia and Slovenia, the “Kingdom of Slovenes, Croats and
Serbs,” renamed as the “Kingdom of Yugoslavia.” Both countries were occupied by
Germany in 1941.
Between the end of World War II and renewed independence in the early 1990s
both countries were part of larger socialist or communist states. There were, however,
important differences. Latvia, one of the fifteen Socialist Soviet Republics, had her
economy organized along the lines of a classical socialist regime based on central
planning, “decreed prices,” monopolized foreign transactions, and absence of market
institutions and markets. Croatia was an integral part of the non-aligned Socialist
Federal Republic of Yugoslavia that was politically and economically more open than
eastern bloc countries. Private enterprise in agriculture, trade, and small business
played a much larger (and politically tolerated) role and larger (nationalized)
enterprises had more freedom and room for manoeuvre through the evolving system
of workers’ self management.
Latvia, after regaining independence in 1991, quickly embarked on bold and
decisive political, institutional, and economic reforms that were carried out by
successive governments. We surmise that the prospect of rapid EU integration, “the
EU perspective,” provided a critical anchor for sustained political, institutional, and
economic reforms across the political spectrum.2 Further, Latvia benefited from being
close to the Nordic countries as well as to Brussels. Croatia had less access.
2 The EU perspective is a key factor today behind economic, institutional, and political
developments in the Western Balkans as a whole as was the case in the Baltic countries
before the joined the EU in 2004.

5
Within less than fifteen years after regaining independence, Latvia was able to
accede to the EU. In 2004, Latvia also joined NATO. Until 2008, Latvia’s real growth
rate was the highest among the EU states but also one of the most volatile ones.
Purifield and Rosenberg (2010) describe the “EU Membership Boom” of Baltic
countries. Initially, the country had planned adopting the euro around 2007. Then the
financial crisis struck. Latvia was hit hardest of all, with real GDP declining by a
whopping 21.7 percent between 2007 and 2009. The country needed a substantial
coordinated multilateral financial support package totaling EUR 7.5 billion provided
by the IMF (~EUR 1.7 billion), the EU (~EUR 3.1 billion), the World Bank (EUR 0.4
billion), and the Nordic governments and other bilateral creditors (~EUR 2.3 billion)
to stabilize the economic and financial situation and to put into place structural
reforms.
Figure 2. Gross Domestic Product per capita 1980-2008
(Constant 2005 international dollars at purchasing power parity)
Source: World Bank, World Development Indicators 2010.
In contrast, Croatia, after seceding from Socialist Federal Republic of Yugoslavia
in 1991, suffered a four-year war of independence with the Federal Republic of
Yugoslavia, and only in 1995 could start with EU integration, which is expected to
lead to EU membership in 2012 or 2013. With an average real growth rate of around
0
2000
4000
6000
8000
10000
12000
14000
16000
18000
20000
Croatia
Latvia
Independence
6
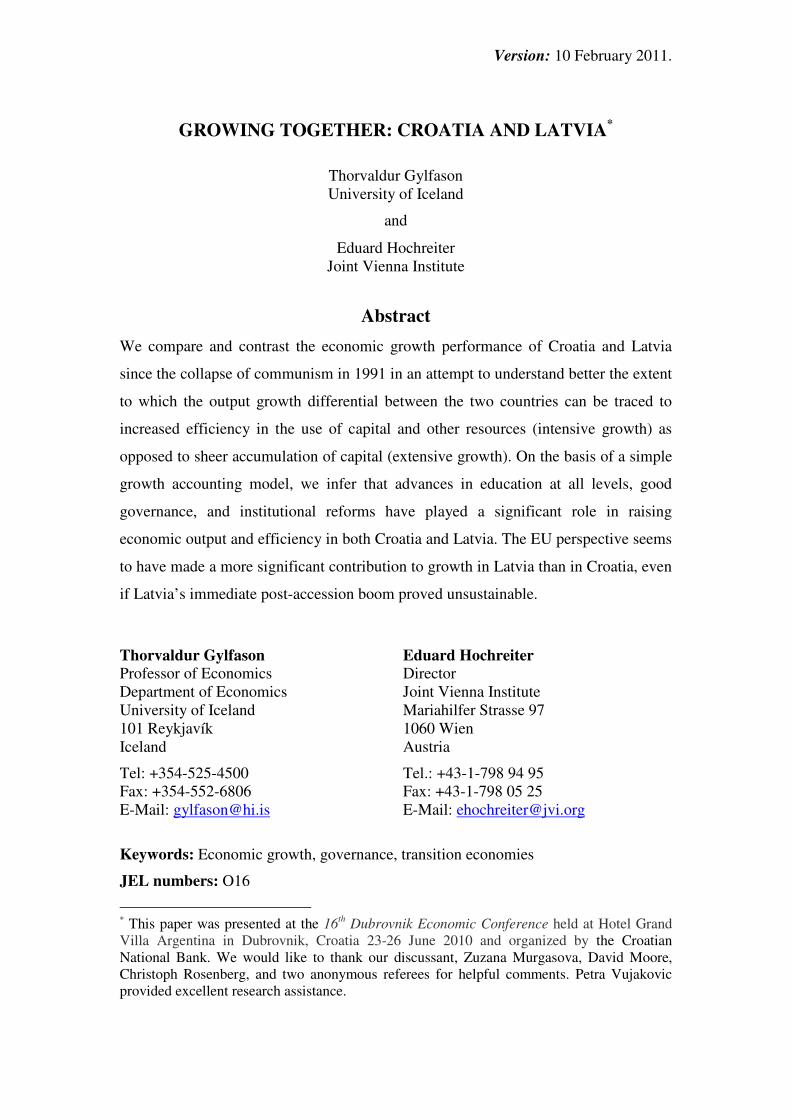
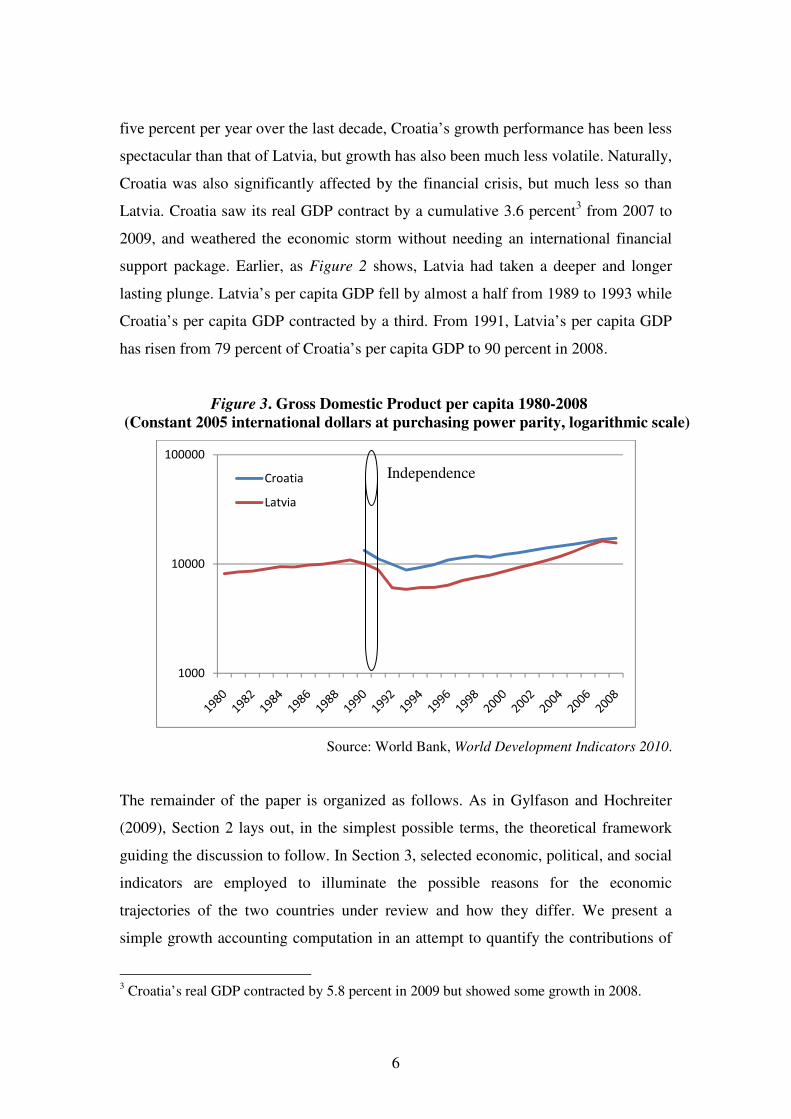
five percent per year over the last decade, Croatia’s growth performance has been less
spectacular than that of Latvia, but growth has also been much less volatile. Naturally,
Croatia was also significantly affected by the financial crisis, but much less so than
Latvia. Croatia saw its real GDP contract by a cumulative 3.6 percent3 from 2007 to
2009, and weathered the economic storm without needing an international financial
support package. Earlier, as Figure 2 shows, Latvia had taken a deeper and longer
lasting plunge. Latvia’s per capita GDP fell by almost a half from 1989 to 1993 while
Croatia’s per capita GDP contracted by a third. From 1991, Latvia’s per capita GDP
has risen from 79 percent of Croatia’s per capita GDP to 90 percent in 2008.
Figure 3. Gross Domestic Product per capita 1980-2008
(Constant 2005 international dollars at purchasing power parity, logarithmic scale)
Source: World Bank, World Development Indicators 2010.
The remainder of the paper is organized as follows. As in Gylfason and Hochreiter
(2009), Section 2 lays out, in the simplest possible terms, the theoretical framework
guiding the discussion to follow. In Section 3, selected economic, political, and social
indicators are employed to illuminate the possible reasons for the economic
trajectories of the two countries under review and how they differ. We present a
simple growth accounting computation in an attempt to quantify the contributions of
3 Croatia’s real GDP contracted by 5.8 percent in 2009 but showed some growth in 2008.
1000
10000
100000
Croatia
Latvia
Independence
7
investment, education, and efficiency, including labor market arrangements and
governance, to the income and growth differential between the two countries. In
Section 4, before summarizing our main findings, we briefly discuss the policy
implications of the output growth comparisons of the two countries and suggest
potential lessons for other countries that lag behind their erstwhile equals.
2. Analytical Background
Economic growth can be either extensive, driven forward by the accumulation of dead
capital, or it can be intensive, in which case growth springs from more efficient use of
existing capital and other resources. Among the numerous alternative ways of
promoting economic and social efficiency, one of the most obvious is the
accumulation of live capital – that is, human capital – through education, on-the-job
training, and health care. There are many other ways as well to increase efficiency and
economic growth. Adam Smith and David Ricardo showed how free trade can
empower individuals, firms, and countries to break outside the production frontiers
that, under autarky, would confine them to lower standards of life. Other examples
abound, as the theory of endogenous economic growth and the empirical growth
literature of recent years have made clear.
In the rapidly advancing literature on growth in formerly centrally planned
economies (see, e.g., Fischer and Sahay, 2000, and Campos and Coricelli, 2002),4 it is
now widely recognized that the quality of institutions and good governance can help
generate sustained growth and so can also various other factors that are closely related
to economic organization, institutions, and policy (Acemoglu and Johnson, 2005, and
Dixit, 2004).5 We want to understand whether the output growth differential between
Croatia and Latvia since 1991 can be traced mostly to efficiency (i.e., intensive
growth), as we suspect, rather than accumulation (i.e., extensive growth).
A. Why Per Capita Outputs Differ
To set the stage, consider this Cobb-Douglas-type production function with constant
returns to scale:
4 For an excellent survey, see Havrylyshyn (2001).
5 Klomp and Haan (2009) report that democracy also reduces economic volatility.
8
(1) � = ������������
We denote real GDP by Y, total factor productivity (TFP) – or, if you prefer,
efficiency – by A, human capital by H, real capital by K, natural capital, including
land, by N, and raw labor by L. The four exponents are the output elasticities of the
inputs, and lie between zero and one. By dividing through the production function by
labor, we obtain this standard expression for output per person:
(2) � = � ��
��� ����� ��
� �
Hence, output per capita depends on four factors: (a) Efficiency, (b) Human capital
per person, (c) Capital/labor ratio, and (d) Natural capital per person.
Two comments about this classification are in order. First, if it so happened that
human capital, real capital, and natural capital all grew at the same rate as the labor
force, then advances in efficiency (A) would remain as the sole source of economic
growth, that is, growth of output per person. Second, like plants, different types of
capital grow at different rates. While experience suggests that real capital grows at
approximately the same rate as output over long periods, leaving the capital/output
ratio roughly constant over time, human capital can easily grow more rapidly than real
capital, while natural capital – especially nonrenewable natural capital, but also some
renewable natural capital such as fish and timber – tends to grow less rapidly than real
capital. This, by the way – or think of fixed land, if you prefer – is why increased
population growth, against common intuition, tends to slow down economic growth in
per capita terms.
With different rates of growth of the different determinants of economic growth,
the rate of growth of per capita output must be a weighted combination of the growth
rates of the different inputs. We can simplify the story somewhat by acknowledging
that, apart from farmland, natural capital plays an insignificant macroeconomic role in
the two countries under review, allowing us to set c = 0 in the production function. If
we assume a = b = 1/3 in equations (1) and (2), the sum of the output elasticities of H
and L – that is, of total labor, if you like – is 2/3 compared with an output elasticity of
capital of 1/3, a familiar constellation of parameters (Mankiw, Romer, and Weil,
9
1992).6 Further, we can impose a constant capital/output ratio on the production
function, as is customary in parts of the growth literature. Those two modifications
reduce the number of the determinants of long-run growth in our model from four to
three: efficiency A, human capital per person H/L, and the capital/output ratio K/Y:
(3) � = � �
��� ����
���� ��
��
��� = ��.������ ��
�
Even so, our post-communist sample period 1991-2008 dictates an emphasis not so
much on the long-run growth of potential output as on the medium-term growth of the
actual level of output. Accordingly, our comparison of the two countries aims to focus
on their output levels at the end of the sample period which, had the initial conditions
in both countries been the same, would be analytically equivalent to a medium-term
growth comparison. In fact, however, initial conditions were not the same as Croatia
started out with higher levels of per capita output (Figures 1-3), physical capital, and
human capital. For that reason, Latvia could be expected to grow more rapidly than
Croatia since 1991 through catchup and convergence.
In our equations above, the efficiency parameter A comprises a variety of factors,
among them technological advances and other types of efficiency gains from various
sources, including internal as well as external trade, “good” institutions, “good”
policies, and “good” governance (see Williamson, 2005, and Marsiliani and
Renström, 2007). Governance, in turn, is a broad concept, and subsumes managerial,
fiscal, monetary, financial, and external governance, each of which comprises several
components. The examination of some of these “unbundled” governance factors is at
the core of our attempt to answer the question of why Latvia almost caught up with
Croatia. However, we also need to compare human capital per person in the two
countries as well as their capital/output ratios.
Human capital per person depends on education as measured by the number of
years u at school in the spirit of Mincer (1974):
6 Senhadji (2000) estimates aggregate production functions for 88 countries, but neither
Latvia nor Croatia is included in his sample.
10
(4) �� = ���
Here v is a positive number estimated from labor market data and u is the duration of
education measured in years at school. Without education (i.e., with u = 0), there
would be no need to distinguish human capital from raw labor, so H = L. Taking
logarithms and differentiating, we have
(5) �� !�
�� = "
Therefore, v measures the proportional increase in human capital resulting from each
additional year at school, a number like 0.1 according to several labor market and
growth studies of advanced economies (see, e.g., Bils and Klenow, 2000).
For simplicity, we take the capital/output ratio to be proportional to the investment
rate I/Y in accordance with standard capital theory where �# = %# + '1 − *+�#��, It
is gross investment in year t, and δ is the rate of depreciation:
(6) � = ��,!
!,-� .
Here g is the rate of growth of output and capital.
Substitution of equations (4) and (6) into equation (3) gives
(7) � = ��.����� ��,!
!,-� /
where s represents the investment rate I/Y. If we allow efficiency A, years of
schooling u, and investment rates s to differ between Croatia and Latvia while the
productivity of schooling v, the growth of the capital stock g, and depreciation δ are
assumed the same in the two countries, we can express the ratio of per capita output y
= Y/L in the two countries simply as follows:
(8) 0102 = �31
32��.� ���1��2 �4142�

11
B. From Output Per Person to Output Per Hour Worked
Our measure of economic performance, output per capita, differs from the ideal
conceptual measure, output per hour worked, which takes explicitly into consideration
the work effort behind the output produced. By definition,
(9) � =
5 5�
where Q is hours worked. Hours of work per person, Q/L, can be written as
(10) 5� = ��,6
� � �5�� �1 − 6
�,6�
where N is employment, U is unemployment, (N+U)/L is the labor force participation
rate, Q/N is hours of work per employed person, and U/(N+U) is the unemployment
rate. Replacing labor (i.e., population) L by hours worked Q in equation (3), we have
(11) 5 = � �
��� ��5�
���� ��
��
��� = ��.����5� ��
�
This means that
(12) � = ��.����
5� �� � ∙ 5
� = ��.������ ��
� / 5� ∙ 5
� = ��.������ ��
� �5��
This simple extension of our model shows that hours worked per person – and thus,
by equation (10), labor force participation, hours worked per employee, and
unemployment – make an independent contribution to per capita output. The
corresponding expression for output per hour worked, from equation (11), is
(13) 5 = ��.����
�� �� � / 5
�
Equation (13) suggests that an increase in hours worked per person reduces output per
hour worked, i.e., reduces labor productivity.

12
Our empirical strategy aims to provide a rudimentary quantitative assessment of
the contributions of education, investment, and labor market institutions to the relative
per capita incomes of Croatia and Latvia by evaluating the expressions under the
square root in equation (12). Subject to the potentially important qualification that our
method does not allow us to quantify the convergence effect, our approach will enable
us to attribute the rest of the income differential between the two countries to
differences in efficiency, the term outside the square root on the right-hand side of
equation (12). This strategy requires a comparative review of a number of different
economic, political, and social indicators to which we now turn.
3. Quantitative Evidence
We are aware that less than twenty years of macroeconomic data following the
collapse of the Soviet Union that started in 1989 is too short a period to be amenable
to a fully fledged long-run economic growth analysis in the spirit of, for example,
Hall and Jones (1999). This is why our empirical method does not permit us to assess
the contribution of initial income differences to subsequent economic growth in the
two countries under review. Instead, against the background provided in the preceding
section, we intend to ask whether the pattern of those macroeconomic variables that
recent growth research has identified as potentially important determinants of per
capita output and thereby also ultimately of long-run economic growth in cross-
country comparisons have behaved in ways that can shed some light on economic
developments in Croatia and Latvia since independence. To this we add a simple
growth accounting computation intended to suggest the relative contributions of
investment, education, labor market institutions, and efficiency to the income
differential between the two countries. Fully fledged growth accounting in which
output growth could be traced in quantifiable proportions to all underlying inputs and
to different aspects of the efficiency with which they were used as well as to different
initial conditions is beyond the scope of this paper.
A. Investment, Education, and Exports
Let us start with domestic investment, a key determinant of the capital/labor ratio and
13
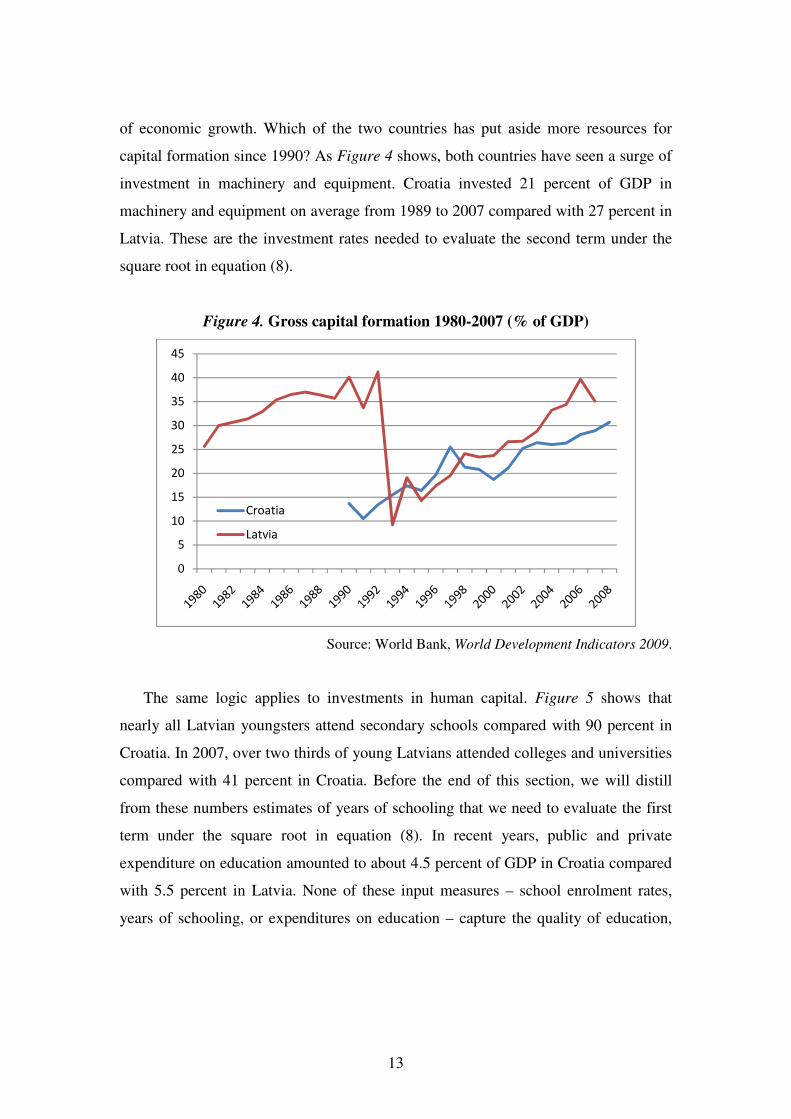
of economic growth. Which of the two countries has put aside more resources for
capital formation since 1990? As Figure 4 shows, both countries have seen a surge of
investment in machinery and equipment. Croatia invested 21 percent of GDP in
machinery and equipment on average from 1989 to 2007 compared with 27 percent in
Latvia. These are the investment rates needed to evaluate the second term under the
square root in equation (8).
Figure 4. Gross capital formation 1980-2007 (% of GDP)
Source: World Bank, World Development Indicators 2009.
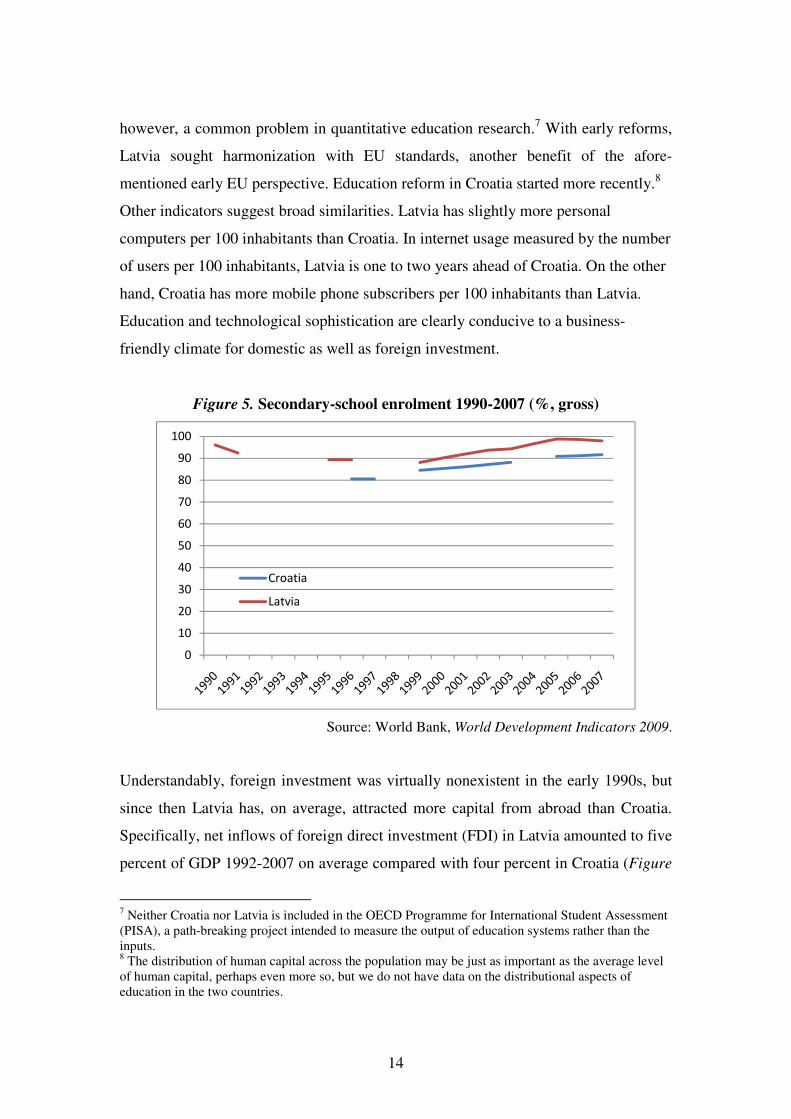
The same logic applies to investments in human capital. Figure 5 shows that
nearly all Latvian youngsters attend secondary schools compared with 90 percent in
Croatia. In 2007, over two thirds of young Latvians attended colleges and universities
compared with 41 percent in Croatia. Before the end of this section, we will distill
from these numbers estimates of years of schooling that we need to evaluate the first
term under the square root in equation (8). In recent years, public and private
expenditure on education amounted to about 4.5 percent of GDP in Croatia compared
with 5.5 percent in Latvia. None of these input measures – school enrolment rates,
years of schooling, or expenditures on education – capture the quality of education,
0
5
10
15
20
25
30
35
40
45
Croatia
Latvia
14
however, a common problem in quantitative education research.7 With early reforms,
Latvia sought harmonization with EU standards, another benefit of the afore-
mentioned early EU perspective. Education reform in Croatia started more recently.8
Other indicators suggest broad similarities. Latvia has slightly more personal
computers per 100 inhabitants than Croatia. In internet usage measured by the number
of users per 100 inhabitants, Latvia is one to two years ahead of Croatia. On the other
hand, Croatia has more mobile phone subscribers per 100 inhabitants than Latvia.
Education and technological sophistication are clearly conducive to a business-
friendly climate for domestic as well as foreign investment.
Figure 5. Secondary-school enrolment 1990-2007 (%, gross)
Source: World Bank, World Development Indicators 2009.
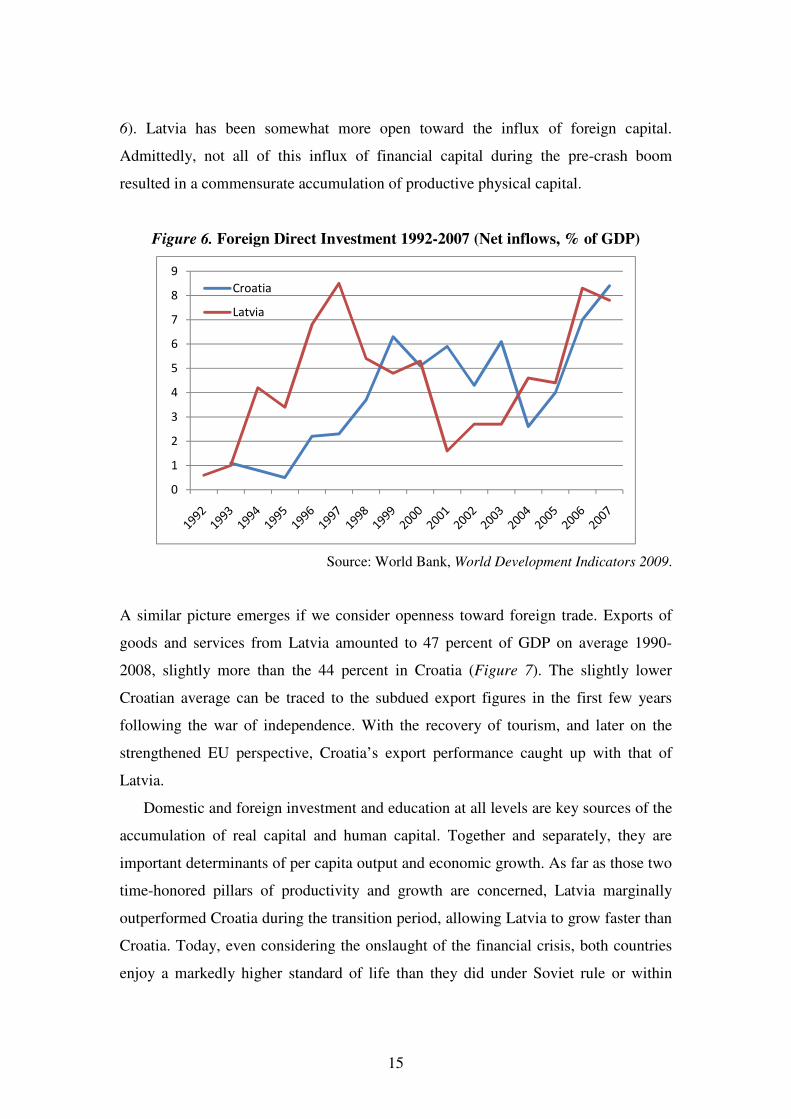
Understandably, foreign investment was virtually nonexistent in the early 1990s, but
since then Latvia has, on average, attracted more capital from abroad than Croatia.
Specifically, net inflows of foreign direct investment (FDI) in Latvia amounted to five
percent of GDP 1992-2007 on average compared with four percent in Croatia (Figure
7 Neither Croatia nor Latvia is included in the OECD Programme for International Student Assessment
(PISA), a path-breaking project intended to measure the output of education systems rather than the
inputs. 8 The distribution of human capital across the population may be just as important as the average level
of human capital, perhaps even more so, but we do not have data on the distributional aspects of
education in the two countries.
0
10
20
30
40
50
60
70
80
90
100
Croatia
Latvia
15
6). Latvia has been somewhat more open toward the influx of foreign capital.
Admittedly, not all of this influx of financial capital during the pre-crash boom
resulted in a commensurate accumulation of productive physical capital.
Figure 6. Foreign Direct Investment 1992-2007 (Net inflows, % of GDP)
Source: World Bank, World Development Indicators 2009.
A similar picture emerges if we consider openness toward foreign trade. Exports of
goods and services from Latvia amounted to 47 percent of GDP on average 1990-
2008, slightly more than the 44 percent in Croatia (Figure 7). The slightly lower
Croatian average can be traced to the subdued export figures in the first few years
following the war of independence. With the recovery of tourism, and later on the
strengthened EU perspective, Croatia’s export performance caught up with that of
Latvia.
Domestic and foreign investment and education at all levels are key sources of the
accumulation of real capital and human capital. Together and separately, they are
important determinants of per capita output and economic growth. As far as those two
time-honored pillars of productivity and growth are concerned, Latvia marginally
outperformed Croatia during the transition period, allowing Latvia to grow faster than
Croatia. Today, even considering the onslaught of the financial crisis, both countries
enjoy a markedly higher standard of life than they did under Soviet rule or within
0
1
2
3
4
5
6
7
8
9
Croatia
Latvia

16
Yugoslavia (recall Figures 1-3).9
Croatia and Latvia both embraced liberal trade policies around the mid-1990s but
to a lesser extent than Estonia did after regaining independence. Still, Latvia opened
up earlier than Croatia and started from a lower initial level of tariff incidence.
Likewise, import restrictions were dismantled in both countries, but, again, at a slower
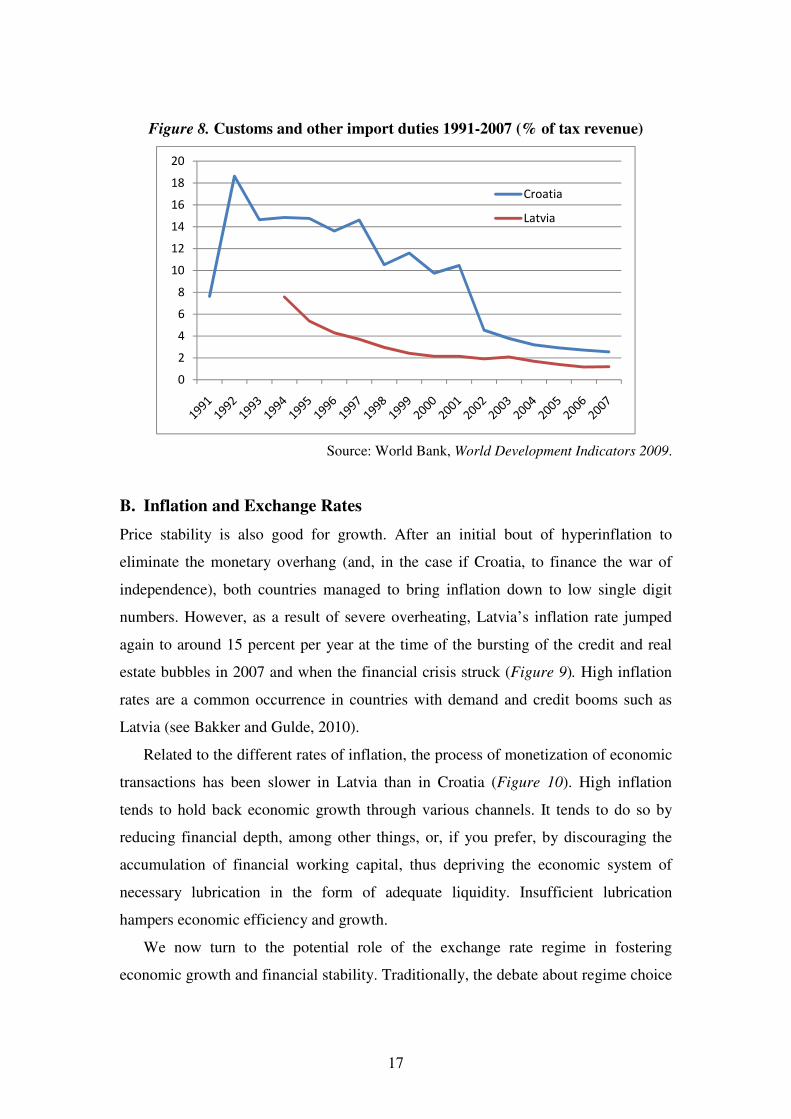
pace and starting from a higher initial level in Croatia than in Latvia. During the war
of independence Croatia had to rely to a considerable extent on import duties for
public revenue. More recently import duties have come down significantly, stabilizing
at less than two percent of tax revenue in Latvia and a bit more than two percent in
Croatia (Figure 8). Similarly, it takes, on average, somewhat longer for importers to
clear customs in Croatia (two days) than in Latvia (1.7 days). Free trade is good for
growth.
Figure 7. Exports of goods and services 1990-2007 (% of GDP)
Source: World Bank, World Development Indicators 2009.
9 Comparisons of data from the Soviet time with those of the post-Soviet period need to be
taken with a grain of salt. Hence, the statement in the text has to be interpreted with care,
especially if the cost of queuing, product range and quality, and so forth, is included in the
GDP measure.
0
10
20
30
40
50
60
70
80
90
Croatia
Latvia
17
Figure 8. Customs and other import duties 1991-2007 (% of tax revenue)
Source: World Bank, World Development Indicators 2009.
B. Inflation and Exchange Rates
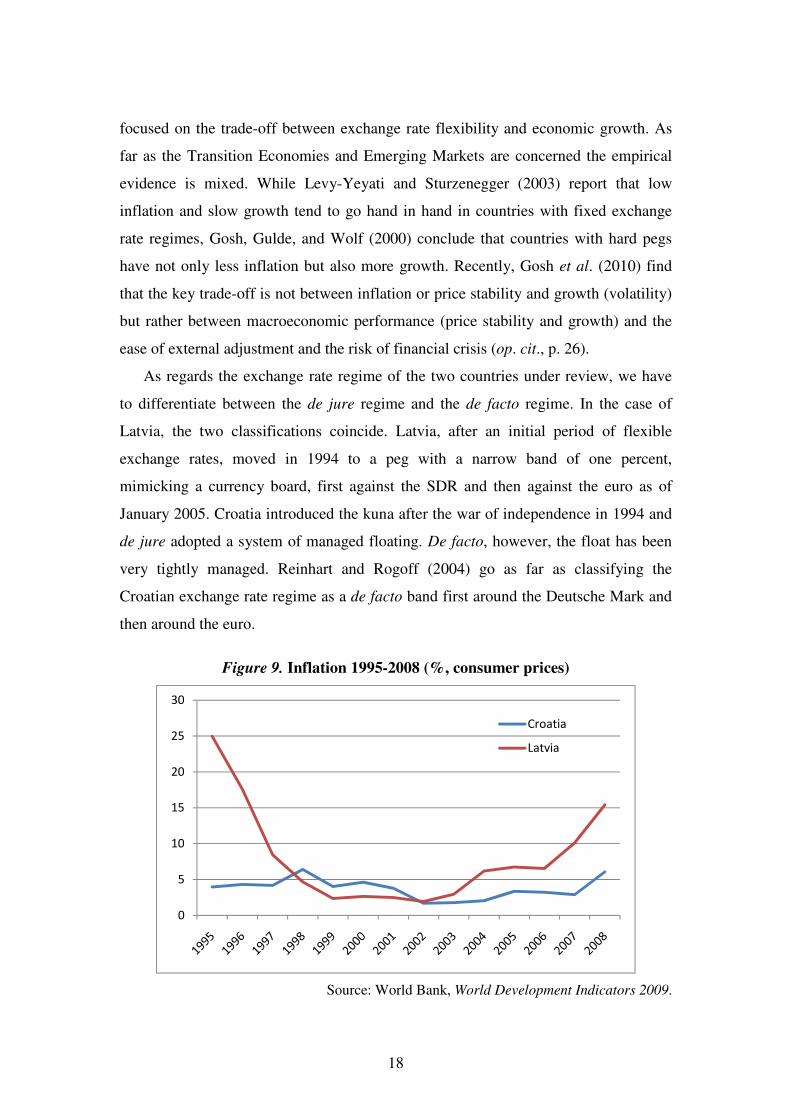
Price stability is also good for growth. After an initial bout of hyperinflation to
eliminate the monetary overhang (and, in the case if Croatia, to finance the war of
independence), both countries managed to bring inflation down to low single digit
numbers. However, as a result of severe overheating, Latvia’s inflation rate jumped
again to around 15 percent per year at the time of the bursting of the credit and real
estate bubbles in 2007 and when the financial crisis struck (Figure 9). High inflation
rates are a common occurrence in countries with demand and credit booms such as
Latvia (see Bakker and Gulde, 2010).
Related to the different rates of inflation, the process of monetization of economic
transactions has been slower in Latvia than in Croatia (Figure 10). High inflation
tends to hold back economic growth through various channels. It tends to do so by
reducing financial depth, among other things, or, if you prefer, by discouraging the
accumulation of financial working capital, thus depriving the economic system of
necessary lubrication in the form of adequate liquidity. Insufficient lubrication
hampers economic efficiency and growth.
We now turn to the potential role of the exchange rate regime in fostering
economic growth and financial stability. Traditionally, the debate about regime choice
0
2
4
6
8
10
12
14
16
18
20
Croatia
Latvia
18
focused on the trade-off between exchange rate flexibility and economic growth. As
far as the Transition Economies and Emerging Markets are concerned the empirical
evidence is mixed. While Levy-Yeyati and Sturzenegger (2003) report that low
inflation and slow growth tend to go hand in hand in countries with fixed exchange
rate regimes, Gosh, Gulde, and Wolf (2000) conclude that countries with hard pegs
have not only less inflation but also more growth. Recently, Gosh et al. (2010) find
that the key trade-off is not between inflation or price stability and growth (volatility)
but rather between macroeconomic performance (price stability and growth) and the
ease of external adjustment and the risk of financial crisis (op. cit., p. 26).
As regards the exchange rate regime of the two countries under review, we have
to differentiate between the de jure regime and the de facto regime. In the case of
Latvia, the two classifications coincide. Latvia, after an initial period of flexible
exchange rates, moved in 1994 to a peg with a narrow band of one percent,
mimicking a currency board, first against the SDR and then against the euro as of
January 2005. Croatia introduced the kuna after the war of independence in 1994 and
de jure adopted a system of managed floating. De facto, however, the float has been
very tightly managed. Reinhart and Rogoff (2004) go as far as classifying the
Croatian exchange rate regime as a de facto band first around the Deutsche Mark and
then around the euro.
Figure 9. Inflation 1995-2008 (%, consumer prices)
Source: World Bank, World Development Indicators 2009.
0
5
10
15
20
25
30
Croatia
Latvia

19
Figure 10. Financial depth 1994-2008 (Broad money as % of GDP)
Source: World Bank, World Development Indicators 2009.
The de facto similarity of the exchange rate regime (see Figure 11) should not be
surprising because, following renewed independence, both countries aspired to
reintegrate into the world economy, and the EU in particular. Further, both countries
needed to move toward the Maastricht requirements as one of the preconditions for
EU accession and euro adoption. In view of the war of independence and the ensuing
even greater need for structural adjustment, Croatia decided not to fully forgo the
exchange rate as an adjustment instrument and used interventions to build up official
reserves.
The difference in the timing of EU accession and the associated financial risks
may also explain a good part of the difference in the interest spread between the two
countries.10
Between 1994 and 2000 the spread collapsed from around 25 percent in
Latvia and 16 percent in Croatia to around 6 percent in both countries reflecting the
decline in inflation (see Figure 12) and the increasing efficiency of the banking sector
that accompanied the acquisition of nearly all local banks by foreign banks. Note that
the interest spread diverged in the first half of the 2000s as Latvia geared up for EU
accession in 2004 while Croatia fell behind. Thereafter, the interest spreads
10
By the interest spread is meant the interest rate charged by banks on loans to prime
customers minus the interest rate paid by commercial or similar banks for demand, time, or
savings deposits.
0
10
20
30
40
50
60
70
Croatia
Latvia

20
converged.
Figure 11. Exchange rate against DEM/EUR 1995–2010 (100 = 2001)
Source: National Banks.
Figure 12. Interest spread 1994–2008 (%)
Source: World Bank, World Development Indicators 2009.
C. Economic Structure
The dependence on agriculture as a source of income has declined rapidly in both
countries. Both Croatia and Latvia managed to diminish the share of their agriculture
0,00
0,20
0,40
0,60
0,80
1,00
1,20
1,40
LAT/DEM
LAT/EUR
HRK/DEM
HRK/EUR
0
5
10
15
20
25
30
Croatia
Latvia
21
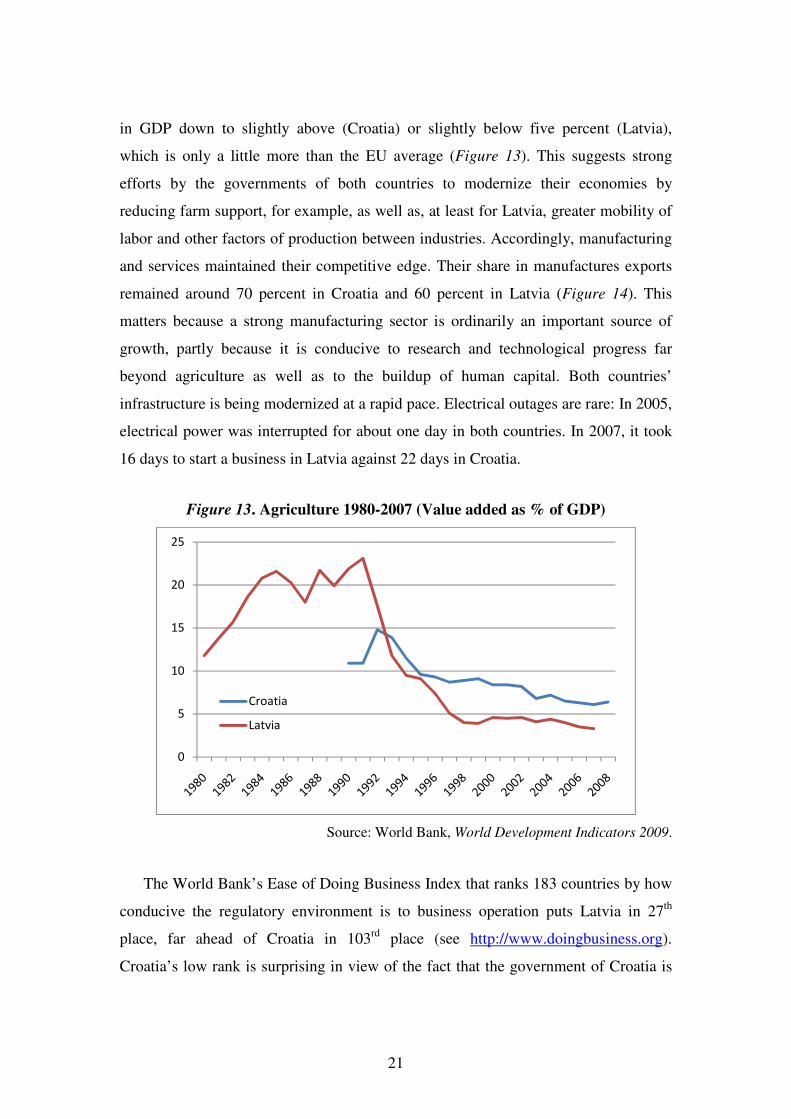
in GDP down to slightly above (Croatia) or slightly below five percent (Latvia),
which is only a little more than the EU average (Figure 13). This suggests strong
efforts by the governments of both countries to modernize their economies by
reducing farm support, for example, as well as, at least for Latvia, greater mobility of
labor and other factors of production between industries. Accordingly, manufacturing
and services maintained their competitive edge. Their share in manufactures exports
remained around 70 percent in Croatia and 60 percent in Latvia (Figure 14). This
matters because a strong manufacturing sector is ordinarily an important source of
growth, partly because it is conducive to research and technological progress far
beyond agriculture as well as to the buildup of human capital. Both countries’
infrastructure is being modernized at a rapid pace. Electrical outages are rare: In 2005,
electrical power was interrupted for about one day in both countries. In 2007, it took
16 days to start a business in Latvia against 22 days in Croatia.
Figure 13. Agriculture 1980-2007 (Value added as % of GDP)
Source: World Bank, World Development Indicators 2009.
The World Bank’s Ease of Doing Business Index that ranks 183 countries by how
conducive the regulatory environment is to business operation puts Latvia in 27th
place, far ahead of Croatia in 103rd
place (see http://www.doingbusiness.org).
Croatia’s low rank is surprising in view of the fact that the government of Croatia is
0
5
10
15
20
25
Croatia
Latvia

22
trying hard to prepare for EU accession. The low rank reflects, among other things,
the ongoing difficulties entrepreneurs have in gaining construction permits (114th
place) and processing the paper work for employing staff (163rd
place). We return to
this issue below.
Figure 14. Manufactures exports 1995-2007 (% of merchandise exports)
Source: World Bank, World Development Indicators 2009.
To recapitulate, economic growth requires capital to be accumulated and to be
efficiently used: real capital, human capital, foreign capital, and financial capital, all
of which we have covered thus far, and also social capital to which we now turn.
D. Labor Markets
Our model in Section 2 permits us to consider labor market institutions as an
independent potential determinant of growth (see Forteza and Rama, 2006). The key
is the distinction between labor and hours of work. More work increases output per
person as in equation (12), but the need for a lot of work may also be a sign of
inefficiency as in equation (13). By definition, as in equation (10), hours worked per
person reflect labor force participation, hours of work per employee, and
unemployment all of which, in turn, depend on prevailing labor market institutions,
0
10
20
30
40
50
60
70
80
90
Croatia
Latvia

23
among other things. Rigid labor markets tend to be conducive to high wage costs and
high unemployment.
Figure 15. Labor force participation rate 1980-2007
(% of total population ages 15+)
Source: World Bank, World Development Indicators 2009.
Figure 16. Hours of work per employee per week 1996-2008
Source: International Labor Organization, www.ilo.org.
0
10
20
30
40
50
60
70
80
Croatia
Latvia
34
35
36
37
38
39
40
41
42
43
1996 1997 1998 1999 2000 2001 2002 2003 2004 2005 2006 2007 2008
Croatia
Latvia
24
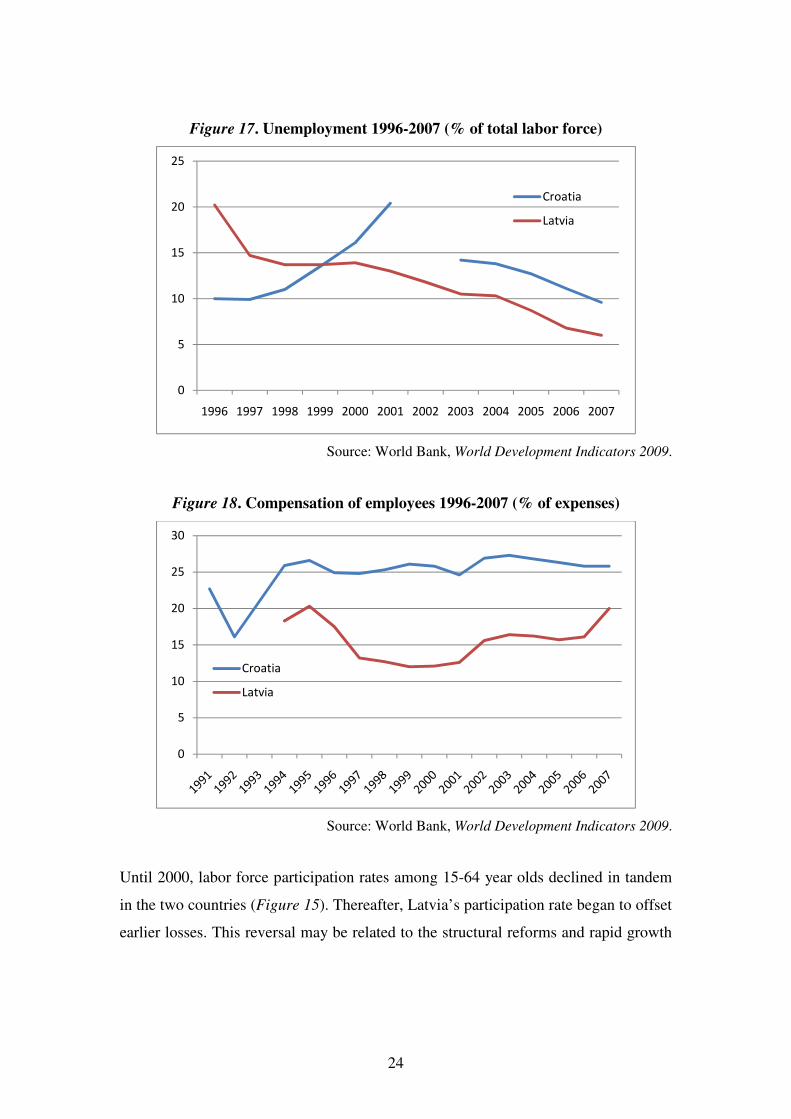
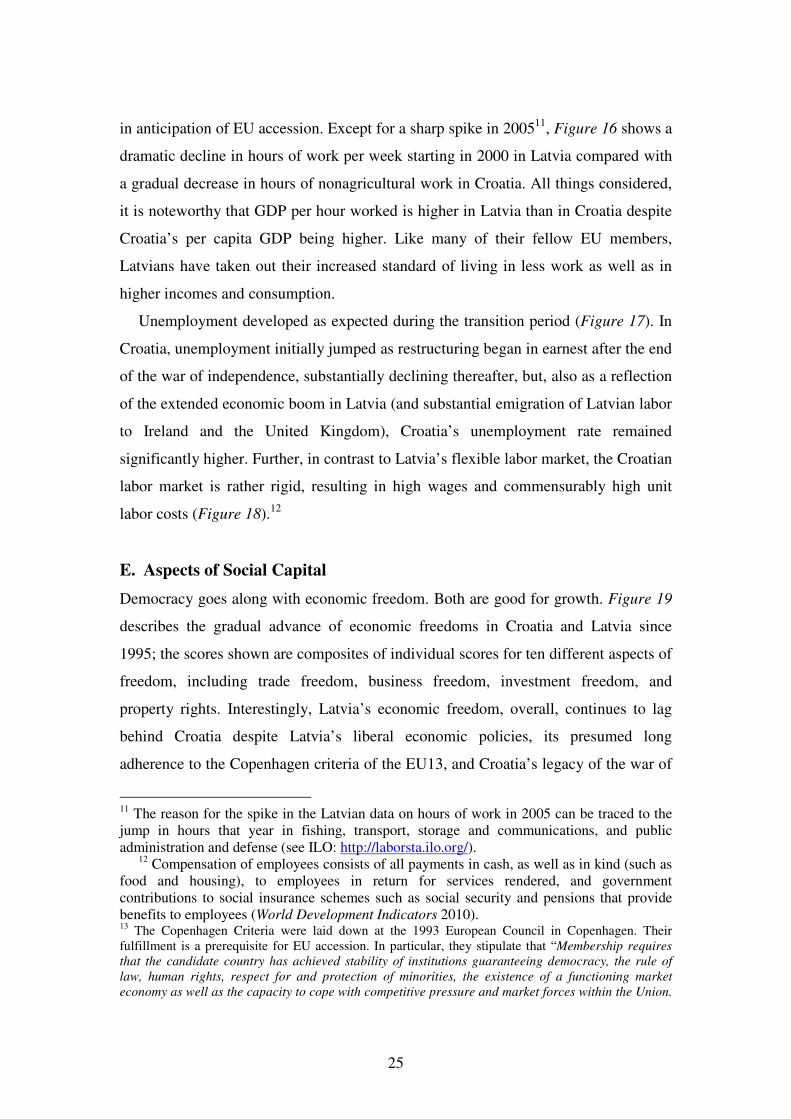
Figure 17. Unemployment 1996-2007 (% of total labor force)
Source: World Bank, World Development Indicators 2009.
Figure 18. Compensation of employees 1996-2007 (% of expenses)
Source: World Bank, World Development Indicators 2009.
Until 2000, labor force participation rates among 15-64 year olds declined in tandem
in the two countries (Figure 15). Thereafter, Latvia’s participation rate began to offset
earlier losses. This reversal may be related to the structural reforms and rapid growth
0
5
10
15
20
25
1996 1997 1998 1999 2000 2001 2002 2003 2004 2005 2006 2007
Croatia
Latvia
0
5
10
15
20
25
30
Croatia
Latvia
25
in anticipation of EU accession. Except for a sharp spike in 200511
, Figure 16 shows a
dramatic decline in hours of work per week starting in 2000 in Latvia compared with
a gradual decrease in hours of nonagricultural work in Croatia. All things considered,
it is noteworthy that GDP per hour worked is higher in Latvia than in Croatia despite
Croatia’s per capita GDP being higher. Like many of their fellow EU members,
Latvians have taken out their increased standard of living in less work as well as in
higher incomes and consumption.
Unemployment developed as expected during the transition period (Figure 17). In
Croatia, unemployment initially jumped as restructuring began in earnest after the end
of the war of independence, substantially declining thereafter, but, also as a reflection
of the extended economic boom in Latvia (and substantial emigration of Latvian labor
to Ireland and the United Kingdom), Croatia’s unemployment rate remained
significantly higher. Further, in contrast to Latvia’s flexible labor market, the Croatian
labor market is rather rigid, resulting in high wages and commensurably high unit
labor costs (Figure 18).12
E. Aspects of Social Capital
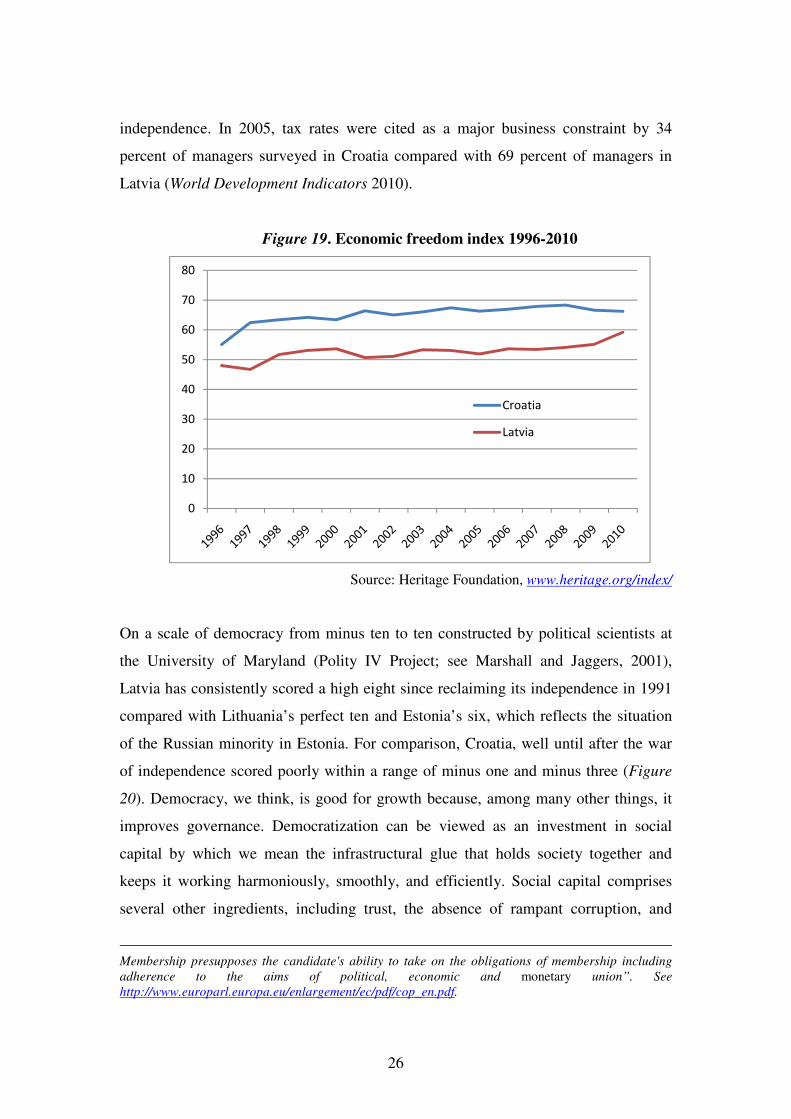
Democracy goes along with economic freedom. Both are good for growth. Figure 19
describes the gradual advance of economic freedoms in Croatia and Latvia since
1995; the scores shown are composites of individual scores for ten different aspects of
freedom, including trade freedom, business freedom, investment freedom, and
property rights. Interestingly, Latvia’s economic freedom, overall, continues to lag
behind Croatia despite Latvia’s liberal economic policies, its presumed long
adherence to the Copenhagen criteria of the EU13, and Croatia’s legacy of the war of
11
The reason for the spike in the Latvian data on hours of work in 2005 can be traced to the
jump in hours that year in fishing, transport, storage and communications, and public
administration and defense (see ILO: http://laborsta.ilo.org/). 12
Compensation of employees consists of all payments in cash, as well as in kind (such as
food and housing), to employees in return for services rendered, and government
contributions to social insurance schemes such as social security and pensions that provide
benefits to employees (World Development Indicators 2010). 13
The Copenhagen Criteria were laid down at the 1993 European Council in Copenhagen. Their
fulfillment is a prerequisite for EU accession. In particular, they stipulate that “Membership requires
that the candidate country has achieved stability of institutions guaranteeing democracy, the rule of
law, human rights, respect for and protection of minorities, the existence of a functioning market
economy as well as the capacity to cope with competitive pressure and market forces within the Union.
26
independence. In 2005, tax rates were cited as a major business constraint by 34
percent of managers surveyed in Croatia compared with 69 percent of managers in
Latvia (World Development Indicators 2010).
Figure 19. Economic freedom index 1996-2010
Source: Heritage Foundation, www.heritage.org/index/
On a scale of democracy from minus ten to ten constructed by political scientists at
the University of Maryland (Polity IV Project; see Marshall and Jaggers, 2001),
Latvia has consistently scored a high eight since reclaiming its independence in 1991
compared with Lithuania’s perfect ten and Estonia’s six, which reflects the situation
of the Russian minority in Estonia. For comparison, Croatia, well until after the war
of independence scored poorly within a range of minus one and minus three (Figure
20). Democracy, we think, is good for growth because, among many other things, it
improves governance. Democratization can be viewed as an investment in social
capital by which we mean the infrastructural glue that holds society together and
keeps it working harmoniously, smoothly, and efficiently. Social capital comprises
several other ingredients, including trust, the absence of rampant corruption, and
Membership presupposes the candidate's ability to take on the obligations of membership including
adherence to the aims of political, economic and monetary union”. See
http://www.europarl.europa.eu/enlargement/ec/pdf/cop_en.pdf.
0
10
20
30
40
50
60
70
80
Croatia
Latvia

27
reasonable equality in the distribution of income and wealth (see Paldam and
Svendsen, 2000). The idea here is that political oppression, corruption, and excessive
inequalities tend to diminish social cohesion and thereby also the quantity or quality
of social capital.
Figure 20. Democracy 1991-2003 (Index from -10 to 10)
Source: Marshall and Jaggers (2001).
According to the World Bank’s Enterprise Surveys, about the same proportion of
managers surveyed in 2005 said they lacked confidence in the court system to uphold
property rights (27 percent in Croatia, 21 percent in Latvia). Even so, in Croatia ten
percent of the managers surveyed described crime as a major business constraint
compared with a whopping 26 percent in Latvia. Further, according to Transparency
International, both countries have made progress against corruption as measured by
the corruption perceptions index, at least until the onset of the financial crisis (Figure
21). The World Bank reports a similar finding: in 2007, 19 percent of managers
surveyed in Croatia described corruption as a major constraint on their business
operations compared with 33 percent of managers in Latvia in 2009. A few years
earlier the ranking was the other way round: 27 percent of the managers in Croatia
and 16 percent in Latvia found corruption to be a major business constraint. The sharp
improvement should stimulate Croatian growth because corruption is not good for
-6
-4
-2
0
2
4
6
8
10
Croatia
Latvia

28
growth (Mauro, 1995; Bardhan, 1997). On the other hand, the sharp deterioration does
not bode well for Latvia.
The distribution of income affects social cohesion and thus may have an influence
of growth. While the Gini coefficients for the two countries suggest increased
inequality in both places since the final years of communism, inequality remains
broadly in line with the rest of continental Europe, with inequality in 2004-5 in Latvia
higher at 36 than in Croatia at 28.
Figure 21. Corruption 1998-2009 (Index from 1 to 10)
Source: Transparency International, www.transparency.org.
Figure 22 shows that both countries have suffered a collapse in fertility as
measured by the number of births per woman since the mid-1980s. The fertility rate in
both countries recovered somewhat more recently but remains well below the
reproduction rate. The population of both countries continues to decline. Even if
excessive fertility holds back economic growth in many developing countries,
population decline is not likely to increase per capita growth in Croatia and Latvia, on
the contrary. In contrast to Croatia, life expectancy at birth took a dive in Latvia in
1985-95, and only in the mid-2000s surpassed the long-term average of the 1960s-
1980s while still remaining about five years below that of Croatia (Figure 23). In the
2000s, public and private health expenditures in Croatia have exceeded those in
0
1
2
3
4
5
6
1998 1999 2000 2001 2002 2003 2004 2005 2006 2007 2008
Croatia
Latvia

29
Latvia. Still, Latvia could offer more hospital beds per 1000 inhabitants (7.5) in 2001
than Croatia (5.3). Even so, child mortality in Latvia, at 8.6 percent, was significantly
higher than Croatia’s 5.8 percent. Public health and fertility are closely related to
human capital accumulation and hence important to economic growth over time.
Figure 22. Fertility 1960-2007 (Births per woman)
Source: World Bank, World Development Indicators 2010.
Figure 23. Life expectancy at birth 1960-2007 (Years)
Source: World Bank, World Development Indicators 2010.
0
0,5
1
1,5
2
2,5
Croatia
Latvia
60
62
64
66
68
70
72
74
76
78
Croatia
Latvia

30
F. Accounting for the Income Differential
We now return to equation (12). We know the extent of the income differential that
we want to understand. In 2008, Croatia’s per capita GDP was 1.1 times larger than
that of Latvia (recall Figure 1). We have reported the average investment rates we
need for the second term under the square root in equation (12), 0.27 in Latvia and
0.21 in Croatia.
Next, we need to count years of schooling. To this end, we could use existing
measures of school life expectancy, defined by UNESCO as the total number of years
of schooling which a child can expect to receive, assuming that the probability of his
or her being enrolled in school at any particular future age is equal to the current
enrolment ratio at that age. According to UNESCO, school life expectancy in 2008
was fifteen years in Latvia and fourteen in Croatia. We prefer to reassess the
UNESCO measures of school life expectancy to cover the longest period for which
fairly continuous data are available, i.e., 1999-2007, rather than just the final year. We
do this by adding the number of years of primary, secondary, and tertiary education
(nine, three, and five, in Latvia and eight, four, and five in Croatia)14
, weighted by
average enrollment rates over the period. For Latvia, the imputed years of schooling
are 9 ∙ 0.93 + 3 ∙ 0.94 + 5 ∙ 0.67 = 14.5 and for Croatia, 8 ∙ 0.88 + 4 ∙ 0.88 + 5 ∙0.38 = 12.5.
15 This is the information we need to assess the first term under the
square root in equation (12).
At last, we need to quantify the third and last term under the square root in
equation (12), hours of work per person, B = C/, defined in equation (10) as a
multiple of the labor force participation rate, hours of work per employed person, and
one less the unemployment rate. Using averages from Figure 15 (1991-2007), Figure
14
Note that Latvia introduced obligatory preschool of two years in 2002. Nonetheless, we
continue to use the primary school data excluding the two preschool years. The Croatian
education system adopted the Bologna system for higher education in 2005, i.e., a three-year
bachelor and a two-year master. Prior to 2005 four years were needed to complete the first
university degree (diploma). Sources: Ministry of Education and Science of the Republic of
Latvia and Ministry of Science, Education and Sports of the Republic of Croatia. 15
The primary school-enrolment rates are net, and refer to the ratio of children of official
school age who are enrolled in school to the population of the corresponding official school
age. The secondary and tertiary rates are gross, and refer to the ratio of total enrollment,
regardless of age, to the population of the age group that officially corresponds to the level of
education in question. Source: World Development Indicators 2010.

31
16 (1996-2007), and Figure 17 (1996-2007), we get 0.543 ∙ 41.7 ∙ '1 − 0.129+ =19.72 for Croatia and 0.602 ∙ 40.3 ∙ '1 − 0.119+ = 21.37 for Latvia.
Now that we have the numbers we need, let us plug them into equation (12) and
solve for the implicit efficiency differential as a residual:
(14) 3132 = �01
02�DE '��2��1+�
E �4241�
�E �F2
F1��E = 1.10D
E '��G.���H.�+�E �I.HJH
I.H�K��E �H�.KJ
�L.JH��E
= 1.066 ∙ 1.948 ∙ 1.085 ∙ 1.027 = 2.314
To complete the computation, we substitute this solution for the efficiency
differential back into equation (12):
(15) 0102 = �31
32��.� ���1��2 �4142� �F1
F2� = 2.314�.� √��H.���G.� �I.H�KI.HJH ��L.JH
H�.KJ
= 3.520 ∙ 0.368 ∙ 0.885 ∙ 0.961 = 1.10
This back-of-the-envelope decomposition suggests that if the two-year difference
in education measured by years of schooling were the sole difference between the two
countries, education could by itself account for a 172 percent (i.e., 1/0.368 – 1)
difference in per-capita-output difference between Latvia and Croatia, in Latvia’s
favor. Hence, education has a powerful influence on economic outcomes in this
computation. By themselves, different investment rates suffice to explain no more
than a 13 percent income differential (i.e., 1/0.885 – 1). By the same token, the labor
market variables would suffice to account for only a four percent income differential
(i.e., 1/0.961 – 1). The labor market variables weigh Croatia down, but to a small
extent. On the other hand, fewer hours per person in Croatia than in Latvia may be
viewed as a sign of Croatian efficiency, but the difference is small. The main point is
that, in our simple model, education makes a much larger contribution to the income
differential than investment or labor market institutions, for that matter.
As shown in equation (14), this arithmetic leaves a 131 percent efficiency
difference between Croatia and Latvia as a residual explanation for the fact that we set
out with, namely, that there was in 2008 a ten percent per-capita-output differential in
equation (14), in Croatia’s favor, despite Latvia’s significant advantage on the

32
education front. Presumably, Croatia’s efficiency advantage vis-à-vis Latvia benefits
from less inflation (Figures 9 and 10), more manufacturing exports (Figure 14), more
economic freedom (Figure 15), and longer lives (Figure 23), as we have discussed.
To sum up, our computation suggests that education matters a good deal more
than investment or labor market arrangements for explaining the growth differential
between Latvia and Croatia from 1991 to 2008 while some advantages in efficiency
must be the reason why Croatia has managed to stay ahead. A decomposition of the
efficiency differential between the two countries is beyond the scope of this paper.
Suffice it to say that intensive growth is what counts.
Before concluding, we must repeat that our method does not permit us to assess
the contribution of different initial conditions to the two countries’ income
differential. Moreover, we must acknowledge the possibility that Latvia’s rapid
growth after 2000 was driven by excessive optimism fueled by unsustainable fiscal
and monetary policies and was, therefore, bound to be reversed as happened when the
financial crisis struck in 2008. The comparison of Croatia’s actual economic
trajectory and Latvia’s road not taken with a less rapid rise and fall could no doubt
result in a different decomposition of the income differential between the two
countries than the one that we have presented.
Table 1 summarizes our findings by listing the average values of the four sets of
determinants of the income differential in equation (15) as well as the international
dollar values of per capita GDP in 2008 in the last column.
Table 1. Parameter values in equation (15)
Investment
(% of GDP) School life
expectancy
(Years)
Hours of
work per
person
per week
Efficiency
(Latvia =
100)
Per capita
GDP 2008
(Dollars at
ppp)
Latvia 27 14.5 21.4 100 15,590
Croatia 21 12.5 19.7 231 17,220

33
4. Conclusion
Our comparison of the development trajectories of Croatia and Latvia since 1991
suggests policy implications that seem to be of general relevance for many countries,
but particularly for those that aspire to rapid economic growth to catch up with others.
In brief, rapid growth requires
(i) Public policies that foster education and training, free trade, and domestic
as well as foreign investment in a business-friendly environment.
(ii) Monetary and fiscal policies that support price stability and sound private
banking and other financial intermediation, sustainable government
budget positions, and international, consumer-friendly competition.
(iii) Sound and transparent societal institutions that support the rule of law.
(iv) Good governance in both the public sector and the private sector.
Further, in countries such as those under review, the prospect of EU membership
may create favorable conditions for sound economic policies, rapid structural change,
and institution building. Such an EU perspective may also help to forge a broad-based
political consensus on the policy actions required for change.
In the 2000s until the financial crisis hit the two countries in 2008, Latvia grew
nearly twice as rapidly as Croatia (around nine percent per year compared with close
to five percent on average). As a consequence, Latvia nearly caught up with Croatia in
terms of per capita GDP (recall Figure 2). As far as Latvia’s rapid growth is
concerned, it was driven by domestic demand (net exports were a major drag on
growth16
), fed by rapid credit expansion fueled by capital imports. Bakker and Gulde
(2010) suggest that countries with rapid credit growth and a boom in domestic
demand face massive current account deficits, and suffer mounting external debt and
soaring inflation. Latvia, in particular, was strongly affected, experiencing one of the
strongest capital inflows among the new EU members. Disaster struck in 2008 when it
became clear that the country’s growth rate and its composition were no longer
sustainable. Croatia’s growth was less rapid and better balanced, credit expansion was
more muted, and inflation was accordingly lower. It appears that a more cautious
16
Both countries’ exposure to the world economy (in particular, the EU) was nearly equal at
around 43 percent of goods and services

34
policy and, in a certain way, some rigidities in the banking system may be good for
economic stability.
What can account for the different growth performances? Returning to our
classification of the sources of growth based on the aggregate production function
presented in Section 2, we can summarize our main findings as follows:
First, Latvia has invested more relative to GDP than Croatia, thereby fostering
long-term growth. Net FDI, marginally higher in Latvia, could also have contributed.
Second, Latvia has invested more in education at all levels, thereby increasing the
human capital stock. The buildup of human capital in Latvia relative to Croatia
manifests itself in two extra years of schooling, and is reinforced by more intensive
use of personal computers and of the internet. Both support rapid human capital
accumulation.
Third, Latvia started earlier and more aggressively – even if it did so later and less
intensely than Estonia – to raise economic efficiency, that is, total factor productivity,
and thereby lay a basis for rapid long-run growth. These efforts started around the
middle of the 1990s after the initial output decline had been reversed and
hyperinflation had been brought down.17
These efforts were, in particular, driven by
Latvia’s EU integration process.18
To prepare for EU membership, Latvia liberalized
trade, restructured the economy, inter alia by a broad privatization of state assets, and
built market-friendly institutions to EU specifications. By the time of EU accession,
Latvia, along with the other Baltic countries, had built up a flexible market economy
and was catching up.
While Croatia moved more cautiously, it still suffers from rigidities, especially in
the labor market, and consequently high unit labor costs. Corruption, despite
improvements, remains a significant problem. Still, in view the main determinants of
growth, Croatia scores higher in terms of economic efficiency than Latvia. Moreover,
the higher share of manufacturing and higher importance of services exports,
dominated by tourism, an industry with good development potential, push Croatia’s
17
For Latvia an important caveat is appropriate. It is not clear how much of the TFP growth
was sustainable since disproportionate activity went into the non-tradable sector such as real
estate and contraction. We are grateful to David Moore for pointing this out. 18
The official accession process for the ten former communist countries in Europe was
formally launched at the end of March 1998.
35
economic efficiency hard. Croatians also enjoy more economic freedom and longer
lives. At last, EU accession, now expected in 2012 or 2013, should provide another
confidence boost, lifting investment, exports, consumption, and growth. So far, on
balance, Latvia caught up, but Croatia remains ahead.
References
Acemoglu, D., S. Johnson, and J. Robinson (2002), “Reversal of Fortune: Geography
and Development in the Making of the Modern World Income Distribution,”
Quarterly Journal of Economics, Vol. 117, No. 4, November, 1231-1294.
Acemoglu, D., and S. Johnson (2005), “Unbundling Institutions,” Journal of Political
Economy, Vol. 113, No. 5, October, 949–995.
Bakker, B. B., and A. Gulde (2010), “The Credit Boom in the EU New Member
States: Bad Luck or Bad Policies?”, IMF Working Paper WP 10/130. Washington
D.C.
Bardhan, P. (1997), “Corruption and Development: A Review of the Issues,” Journal
of Economic Literature, Vol. 35, No. 3, September, 1320-1346.
Barry, F., P. Honohan, and C. McIndoe Calder (2009), “Postcolonial Ireland and
Zimbabwe: Stagnation Before Convergence”, June 1, Institute for International
Integration Studies (IIIS) Discussion Paper No. 291. Available at SSRN:
http://ssrn.com/abstract=1610301.
Berengaut, J., E. De Vrijer, K. Elborgh-Woytek, M. Lewis, and B. Lissovolik (2002),
“An Interim Assessment of Output Developments in Ukraine, 2000-01,” IMF
Working Paper WP/02/97. Washington, DC.
Bils, M., and P. Klenow (2000), “Does Schooling Cause Growth or the Other Way
Around?,” American Economic Review, Vol. 90, No. 5, December, 1160-1183.
Campos, N. F., and F. Coricelli (2002), “Growth in Transition: What We Know, What
We Don’t, and What We Should,” Journal of Economic Literature, Vol. 40, No.
3, September, 793-836.
Dixit, A. (2004), “Lawlessness and Economics: Alternative Institutions of
Governance,” Princeton: Princeton University Press, Chapter 1. Available at
http://pup.princeton.edu/titles/7729.html.
36
Dreher, A., P.-G. Méon, and F. Schneider, (2008), “The Devil is in the Shadow: Do
Institutions Affect Income and Productivity or only Official Income and Official
Productivity?,” CESifo Working Paper No. 2150.
Fischer, S., and R. Sahay (2000), “The Transition Economies after Ten Years,” IMF
Working Paper WP/00/30, Washington, DC.
Forteza, A., and M. Rama (2006), “Labor Market 'Rigidity' and the Success of
Economic Reforms Across More Than 100 Countries,” Journal of Economic
Policy Reform, Vol. 9, No. 1, March, 75-105.
Funke, M. (2006), “Taxation, Growth and Welfare: Dynamic Effects of Estonia’s
2000 Income Tax Act,” Finnish Economic Papers, Vol. 19, No. 1, Spring, 25-38.
Gosh, A. R., A. Gulde, and H. C. Wolf (2000), “Currency Boards: More Than a Quick
Fix?,” Economic Policy, Vol. 15, No. 31, 269-335.
Gosh, A.R., J.D. Ostry, and C. Tsangarides (2010), “Exchange Rate Regimes and the
Stability of the International Monetary System,” Occasional Paper 270,
International Monetary Fund, Washington D.C.
Gylfason, T. (2006), “How do India and China Grow?” Challenge, Vol. 49, No. 1,
January-February, 74-89.
Gylfason, T., and E. Hochreiter (2009), “Growing apart? A Tale of Two Republics:
Estonia and Georgia,” European Journal of Political Economy, Vol. 25, No. 3,
September, 355-370.
Hall, R. E., and C. I. Jones (1999), “Why Do Some Countries Produce So Much More
Output Per Worker Than Others?,” Quarterly Journal of Economics, Vol. 114,
No. 1, February, 83-116.
Havrylyshyn, O. (2001), “Recovery and Growth in Transition: A Decade of
Evidence,” IMF Staff Papers, Vol. 48, Special Issue, 53-87.
Havrylyshyn, O. (2007), “Growth Recovery in CIS Countries: The Sufficient
Minimum Threshold of Reforms,” mimeo, University of Toronto.
Henry, P. B., and C. Miller (2009), “Institutions versus Policies: A Tale of Two
Islands,” American Economic Review: Papers & Proceedings 2009, 99:2, 261-
267. http://www.aeaweb.org/articles.php?doi=10.1257/aer.99.2.261.
Klomp, J., and J. de Haan (2009), “Political Institutions and Economic Volatility,”
European Journal of Political Economy, Vol. 25, No. 3, September, 311-326,..

37
Levy-Yeyati, E., and F. Sturzenegger (2003), “To Float or to Fix: Evidence on the
Impact of Exchange Rate Regimes,” American Economic Review, Vol. 93, No. 4,
December, 1173-1193.
Maliszewski, W. S. (2000), “Central Bank Independence in Transition Economies,”
Economics of Transition, Vol. 8, No. 3, November, 749-789.
Mankiw, N. G., D. Romer, and D. N. Weil (1992), “A contribution to the empirics of
economic growth,” Quarterly Journal of Economics, Vol. 107, No. 2, May, 407-
437.
Marshall, M. G., and K. Jaggers (2001), “Polity IV Project: Political Regime
Characteristics and Transitions, 1800-2000.” Available at
http://www.cidcm.umd.edu./inscr/polity/.
Marsiliani, L., and T. I. Renström (2007), “Political Institutions and Economic
Growth,” Economics of Governance, Vol. 8, No. 3, May, 233-261.
Mauro, P. (1995), “Corruption and Growth,” Quarterly Journal of Economics, Vol.
110, No. 3, August, 681-712.
Mincer, J. (1974), Schooling, Experience and Earnings, Columbia University Press,
New York.
Moore, D., and A. Vamvakidis (2008), Economic Growth in Croatia: Potential and
Constraints, Financial Theory and Practice 32 (1) 1-28 (2008).
Paldam, M., and G. T. Svendsen (2000), “An Essay on Social Capital: Looking at the
Fire behind the Smoke,” European Journal of Political Economy Vol. 16, No. 2,
June, 339-366.
Purifield, C., and C. Rosenberg (2010), “Adjustment under a Currency Peg: Estonia,
Latvia and Lithuania during the Global Financial Crisis 2008–09,” IMF Working
Paper WP 10/213. Washington, DC.
Reinhart, C.M, and K. S. Rogoff (2004), The Modern History of Exchange Rate
Arrangements: A Reinterpretation,” Quarterly Journal of Economics, Vol. 119,
No. 1, February, 1-48.
Sachs, J. D., and A. M. Warner (1995, revised 1997, 1999), “Natural Resource
Abundance and Economic Growth,” NBER Working Paper 5398, Cambridge,
Massachusetts.

38
Senhadji, A. (2000), “Sources of Economic Growth: An Extensive Growth Accounting
Exercise ,” IMF Staff Papers, Vol. 47, No. 1, November, 129-157.
Williamson, O. (2005), “The Economics of Governance,” American Economic Review,
Vol. 95, No. 2, May, 1-18.
World Bank (2010), Doing Business – Economy Rankings. Available at
http://www.doingbusiness.org. See also http://www.enterprisesurveys.org.