Embed Size (px)
Citation preview
1
Growing Turkish Manufacturing Base, Nearby –
Partners for automation
by H. Uran TiryakiogluBoard Member, Istanbul Chamber of Industry (ISO).General Manager, Entes Electronics, Istanbul.

2
Turkish Economy15
20
25
30
35
40
45
502000 2001 2002 2003 2004 2005 2006 2007 2008 2009 2010 2011Yıllar
Dün
ya'nın
Büy
ük P
azar
ları
Sıra
lam
ası
Importer
Econpmy Size
WTO
Exporter

3
Foreign Trade
Source : Ministry of Economy

4
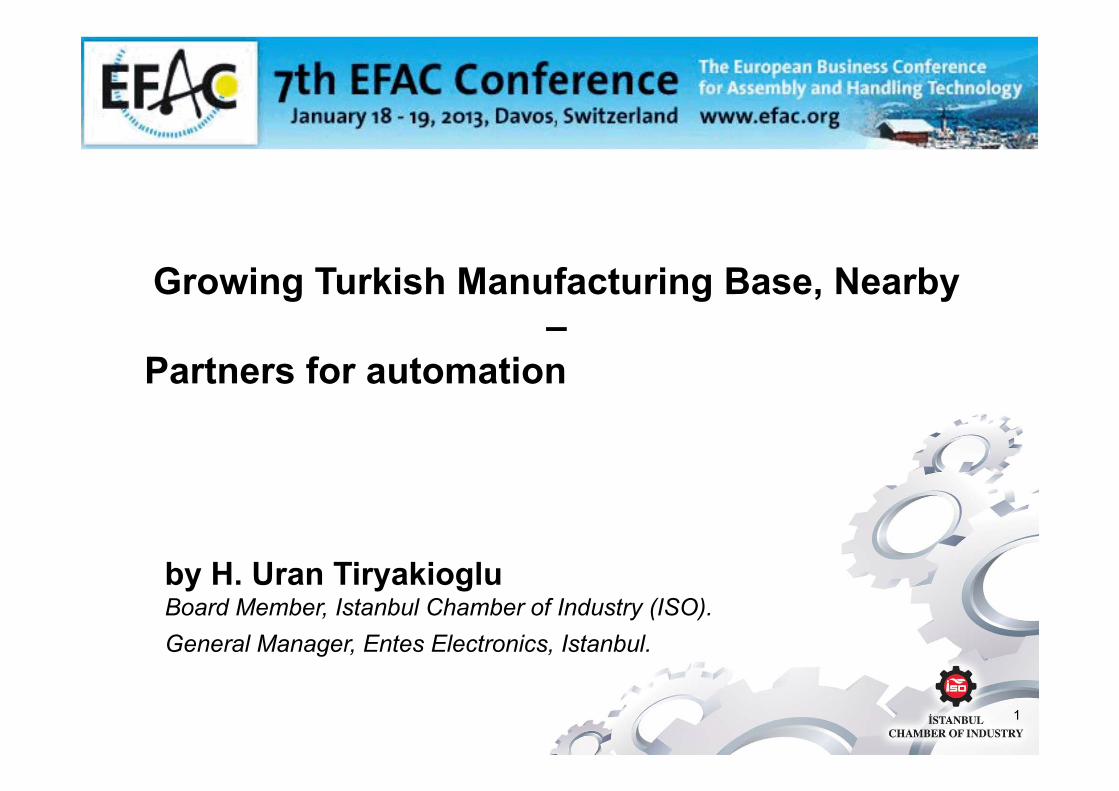
Investments to Increase
DPT, Uluslararası Ekonomik Göstergeler, 2010.
0
5
10
15
20
25
30
35
40
45
1980 1990 2000 2001 2002 2003 2004 2005 2006 2007 2008 2009Yıllar
%
MalaysiaThailandChinaKorea, Rep. ofTurkeyIndiaBrazilRussian Federation
5
0
5
10
15
20
25
30
35
40
45
1980 1990 2000 2001 2002 2003 2004 2005 2006 2007 2008 2009Yıllar
%
Turkey
France
United States
Canada
DPT, Uluslararası Ekonomik Göstergeler, 2010.
Investments to Increase

6
0
20
40
60
80
100
120
140
160
Creative Services Tourism Exports
20052006200720082009201020112012
B $
Kaynak: Türkiye İhracatçılar MeclisiKaynak: Kültür ve Turizm Bakanlığı
%11 CAGR
Exports and Income Trends
%4 CAGR
Kaynak: www.trademap.com
Creative Goods
UNCTAD

7
Cost of Minimum Wage is not so Low!
157 €
232 €
287 €
290 €
312 €
323 €
353 €
412 €
374 €
566 €
680 €684 €
748 €
763 €
1.244 €
1.426 €
1.456 €1.462 €
1.472 €
1.801 €
327 €
Cost Min. Wage (€)
GDP/capita($)
Romanya 157 8.875
Litvanya 232 13.618
Letonya 287 13.262
Estonya 290 16.568
Çek Cum. 312 20.436
Macaristan 323 14.050
Slovakya 327 17.644
Polonya 353 13.469
Hırvatistan 374 14.182
Türkiye 412 10.363
Portekiz 566 22.359
Malta 680 21.137
Yunanistan 684 26.735
İspanya 748 32.077
Slovenya 763 24.900
İngiltere 1.244 38.811
Fransa 1.426 44.077
Holanda 1.456 50.216
İrlanda 1.462 48.289
Belçika 1.472 46.989
Lüksemburg 1.801 115.809
ABD 998 48.328
Kaynak: Eurostat, http://epp.eurostat.ec.europa.eu/statistics_explained/index.php/Minimum_wage_statistics#Database1€=1,30”$

8
Population 76 Million, Ave. Age 28 yr. Turkey’s total workforce : 24,110,000. Total employed in manufacturing: 2,600,000 people. Labor cost is low but not much!
0 1 2 3 4 5 6 7 8 9 10
Availability of Skilled Labor
Force; 6,3
Availability of Qualified
Engineers; 7,6
Availability of Competent Senior
Managers; 6,8
Source: Investment Support and Promotion Agency, 2012
157 €
232 €
287 €
290 €
312 €
323 €
353 €
412 €
374 €
566 €
680 €684 €
748 €
763 €
1.244 €
1.426 €
1.456 €1.462 €
1.472 €
1.801 €
327 €
Cost Min. Wage (€)
GDP/capita($)
Romanya 157 8.875
Litvanya 232 13.618
Letonya 287 13.262
Estonya 290 16.568
Çek Cum. 312 20.436
Macaristan 323 14.050
Slovakya 327 17.644
Polonya 353 13.469
Hirvatistan 374 14.182
Türkiye 412 10.363
Portekiz 566 22.359
Malta 680 21.137
Yunanistan 684 26.735
Ispanya 748 32.077
Slovenya 763 24.900
Ingiltere 1.244 38.811
Fransa 1.426 44.077
Holanda 1.456 50.216
Irlanda 1.462 48.289
Belçika 1.472 46.989
Lüksemburg 1.801 115.809
ABD 998 48.328
Skilled Labor Force

9
Source: International Monetary Fund, World Economic Outlook Database, April 2012
High Growth
Turkey’s economic growth rate is typically above the EU average and one of the highest in Europe.
Turkey’s economic growth rate is typically above the EU average and one of the highest in Europe.

10
Growth Benchmarking BRIC
-10
-5
0
5
10
15
1992-2001
2002 2003 2004 2005 2006 2007 2008 2009 2010 2011 2015Yıllar
%
China
Turkey
India
Brazil
Russia
IMF, World Economic Outlook, October 2010.Not: 2010, 2011 ve 2015 verileri tahminidir.

11
Economic Freedom Index 2012
A Free Economy
0 10 20 30 40 50 60 70 80 90
Business Freedom
Trade Freedom
Fiscal Freedom
Gov't Spending
Monetary Freedom
Investment Freedom
Financial Freedom
Property Rights
Freedom from Corruption
Labor Freedom
62.5 % Free
73rd freesteconomy in the
worldout of 184.
62.5 % Free
73rd freesteconomy in the
worldout of 184.
Source: The Heritage Foundation, 2012 - www.heritage.org
12
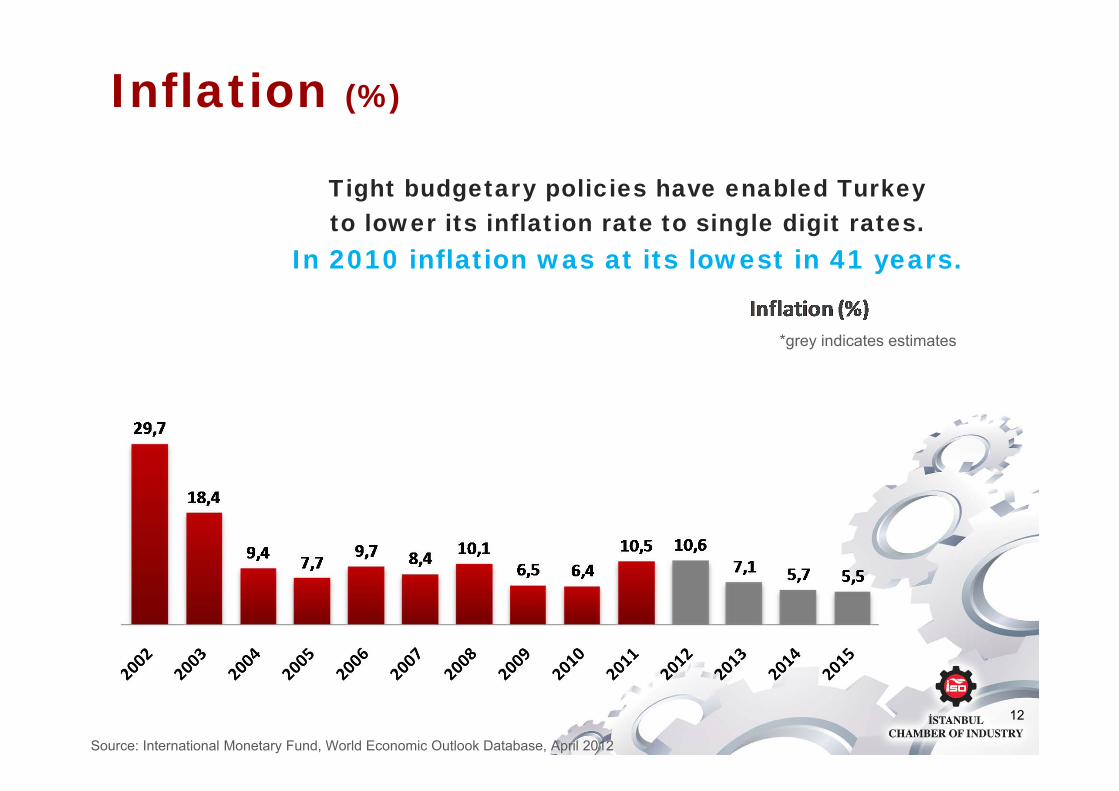
Inflation (%)
Source: International Monetary Fund, World Economic Outlook Database, April 2012
*grey indicates estimates
Tight budgetary policies have enabled Turkeyto lower its inflation rate to single digit rates.
In 2010 inflation was at its lowest in 41 years.
Tight budgetary policies have enabled Turkeyto lower its inflation rate to single digit rates.
In 2010 inflation was at its lowest in 41 years.

13
Free-Trade Agreements 19 Free Trade Agreements:
EFTA member countries (Iceland, Norway, Switzerland, Lichtenstein), Israel, Macedonia, Croatia, Bosnia and Herzegovina, Palestine, Tunisia, Morocco, Syria, Egypt, Albania, Georgia, South Korea, Montenegro, Jordan and Chile.
Free Trade Agreements under negotiation:Lebanon, South Africa, Mexico, and the Cooperation Council for Arab States.
Free Trade Agreements for which talks have been initiated:Algeria, Ukraine, Mercosur (Brazil, Argentina, Uruguay, Paraguay, Venezuela), ACP countries (Ethiopia, Congo, Djibouti, Cameroon, Kenya, Gabon).
19 Free Trade Agreements:EFTA member countries (Iceland, Norway, Switzerland, Lichtenstein), Israel, Macedonia, Croatia, Bosnia and Herzegovina, Palestine, Tunisia, Morocco, Syria, Egypt, Albania, Georgia, South Korea, Montenegro, Jordan and Chile.
Free Trade Agreements under negotiation:Lebanon, South Africa, Mexico, and the Cooperation Council for Arab States.
Free Trade Agreements for which talks have been initiated:Algeria, Ukraine, Mercosur (Brazil, Argentina, Uruguay, Paraguay, Venezuela), ACP countries (Ethiopia, Congo, Djibouti, Cameroon, Kenya, Gabon).

14
Prevention of Double Taxation Albania Estonia Khazakstan Oman Sweden
Algeria Ethiopia Kuwait Pakistan Syria
Austria Finland Kyrgyzystan Poland Tadjikistan
Azerbaijan France Latvia Portugal Thailand
Bahrain Georgia Lebanon Qatar Tunisia
Bangladesh Germany Lithuania Romania Turkmenistan
Belarus Greece Luxembourg Russian Federation Ukraine
Belgium Hungary Macedonia Saudi Arabia United Arab Emirates
Bosnia Herzegovina India Malaysia Serbia-Montenegro United Kingdom
Bulgaria Indonesia Moldova Singapore USA
Canada Iran Mongolia Slovakia Uzbekistan
China Ireland Morocoo Slovenia Yemen
Croatia Israel Netherlands Soudan
Czech Republic Italy New Zealand South Africa
Denmark Japan Northern Cyprus South Korea
Egypt Jordan Norway Spain

15
Exports by Region
Source : TUİK

16
Top Export Partners
Source : TUİK

17
Export (B$ 126 Industrial Goods)2011–USD millions
Vehicles other than Railway 15,805
Machineries, Mechanical Appliances 11,563
Iron & Steel 11,226
Electrical Machinery & Equipment 8,882
Articles of Apparel and Clothing Accessories Knitted 8,396
Mineral fuels, oils, distillation products, etc. 6,539
Articles of Iron & Steel 5,759
Articles of Apparel and Clothing Accessories Not Knitted 5,129
Plastics and Articles Thereof 4,581
Edible Fruits, nuts, etc. 3.910
Source : Ministry of Economy

18
Automotive Industry
0
100.000
200.000
300.000
400.000
Yıllar
Adet
Yerli 146.40 263.50 290.54 251.19 249.70 196.16 247.69 305.35 338.07 276.00
2000 2001 2002 2003 2004 2005 2006 2007 2008 2009 2010 2011 2012
Kaynak: Otomotiv Distribütörleri Derneği (ODD).
6th largest exporter of public transport type passenger
motor vehiclesin the world, 3rd in Europe
World’s 9th largest exporter oftrucks
5th in Europe

19
Top Import Partners
Source: TUİK

20
Top 10 Import Categories2011–USD millions
Mineral Fuels, Mineral Oils and Derivatives 54,115
Nuclear reactors, boilers, machinery, etc 27,107
Iron & Steel 20,424
Vehicles other than Railway 17,184
Electrical Machinery & Spare parts 16,836
Plastics and Articles Thereof 12,578
Pearls, Art. of Precious Stone & Metals, Metal Coins 7,022
Organic Chemicals 5,504
Pharmaceuticals 4,697
Copper and Articles Thereof 4,119
Source: Ministry of Economy

21
Foreign Direct Investment
(*) UNCTADSource: Ministry of Finance
Turkey was ranked the 15th most attractive country in the world in terms of FDI for 2008-2010. * Turkey was ranked the 15th most attractive country in the world in terms of FDI for 2008-2010. *
Austria 17.3%
Spain 17.3%
Netherlands 12.3%
USA 10.9%

22
Multinationals in Turkey3M CHEVRON GENERAL MOTORS MCKINSEY RENAULT
ABB HOLDING CITIBANK GILETTE MERCEDES- BENZ REUTERS
ABN AMRO CNN GLAXOSMITHKLINE MERCK SHARP DOHME ROCHE
AC NIELSEN ZET COCA COLA GOODYEAR MERLONI SERVIER
ACCENTURE COLGATE PALMOLIVE HENKEL METRO AG SHV GAS
AEG CREDIT LYONNAIS HEWLETT PACKARD MICROSOFT SIEMENS
ALCATEL- CREDIT AGRICOLE HSBC MOBIL OIL SOCIETE GENERALE
ALLIANZ CROWN CORK HYUNDAI CORPORATION NESTLE SODEXHO
AMERICAN EXPRESS DANONE IBM NIKE SONY EURASIA
AUTOLIV CANKOR DEUTSCHE BANK INTERGEN NISSHO IWAI TESCO KIPA
AVENTIS PHARMA DHL ITOCHU CORP NORTEL NETWORKS TETRA PAK
AXA DUPONT JOHNSON & JOHNSON NOVARTIS THAMES WATER
BANCA DI ROMA ERICSSON JP MORGAN CHASE ORACLEBANK OF TOKYO-MITSUBISHI
BARCLAYS BANK FIAT JTI PARS MCCANN THE SHELL COMPANY
BASF FMC LAFARGE PEPSI COLA TNT
BAT FORD LEVIS PERFETTI TOTAL
BAYER FORTIS LILLY PFIZER TOYOTA
BOSCH FOSTER WHEELER LOCKHEED-MARTIN PHILIP MORRIS UNILEVER
BP FOUR SEASONS MAN PHILIPS VOLKSWAGEN
BRIDGESTONE FRITO LAY MARSA KRAFT JAKOPS PIRELLI XEROX
BRISTOL MYERS SQUIBB GENERAL ELECTRIC MCDONALDS PROCTER & GAMBLE YAZAKI

23
1. Petrol Ofisi 6. BSH Home Appliances
41% (overall ranking: 2) 99,28% (overall ranking: 17)
2. Ford 7. Vestel
41,04% (overall ranking: 4) 74,69% (overall ranking: 16)
3. Tofas-Fiat 8. Unilever
37,86% (overall ranking:5) 99,98% (overall ranking: 18)
4. OYAK-Renault 9. Toyota
51% (overall ranking: 7) 100% (overall ranking: 21)
5. Mercedes-Benz 10. Hyundai Assan
85% (overall ranking: 11) 85% (overall ranking: 27)
Top 10 Foreign Capital Companiesin terms of Net Sales (2011)

24
Ratio of R&D Expenditures to GDP (%)
(%)
Year
0,48
0,54 0,53
0,48 0,52
0,59
0,60
0,72
0,73
0,85
0,84
-
0,10
0,20
0,30
0,40
0,50
0,60
0,70
0,80
0,90
2000 2001 2002 2003 2004 2005 2006 2007 2008 2009 2010
Data Source: TURKSTAT

25
Unemployment (%)
0
5
10
15
20
25
30
2000
2001
2002
2003
2004
2005
2006
2007
2008
2009
2010
2011
2012
(*)
Yıllar
%Total Unemloyment
Young Unemp. (15-24)
Non Agriculture
University Graduates
Kaynak: TÜİK.

26
Kaynak: TÜİK ve TOBB verileri.
Established and Terminated Companies
54.442
14.991
33.161
29.665
30.84232.259
40.91947.401
52.69955.350
49.003
44.472
51.971
2.464 1.887 3.667
5.436 7.660
8.886 9.471
9.954
9.578 10.395
13.442
0
10.000
20.000
30.000
40.000
50.000
60.000
2000 2001 2002 2003 2004 2005 2006 2007 2008 2009 2010 2011 Yıllar
Adet
KurulanKapanan

27
Economy of Istanbul
5196 km2. The primary city in the country’s GDP. Around 23% of Turkey's overall income. A much higher per capita income than the country average. Good place to live.
23%of
Turkey’s GDP
38%of
Turkey’s Industrial
Production
50%of
Turkey’s Services
47,5%of
Turkey’s Collected
Taxes
50%of
Turkey’s Foreign Trade
17,5%of
All Jobs

28
Distribution of Sectors in Istanbul
29
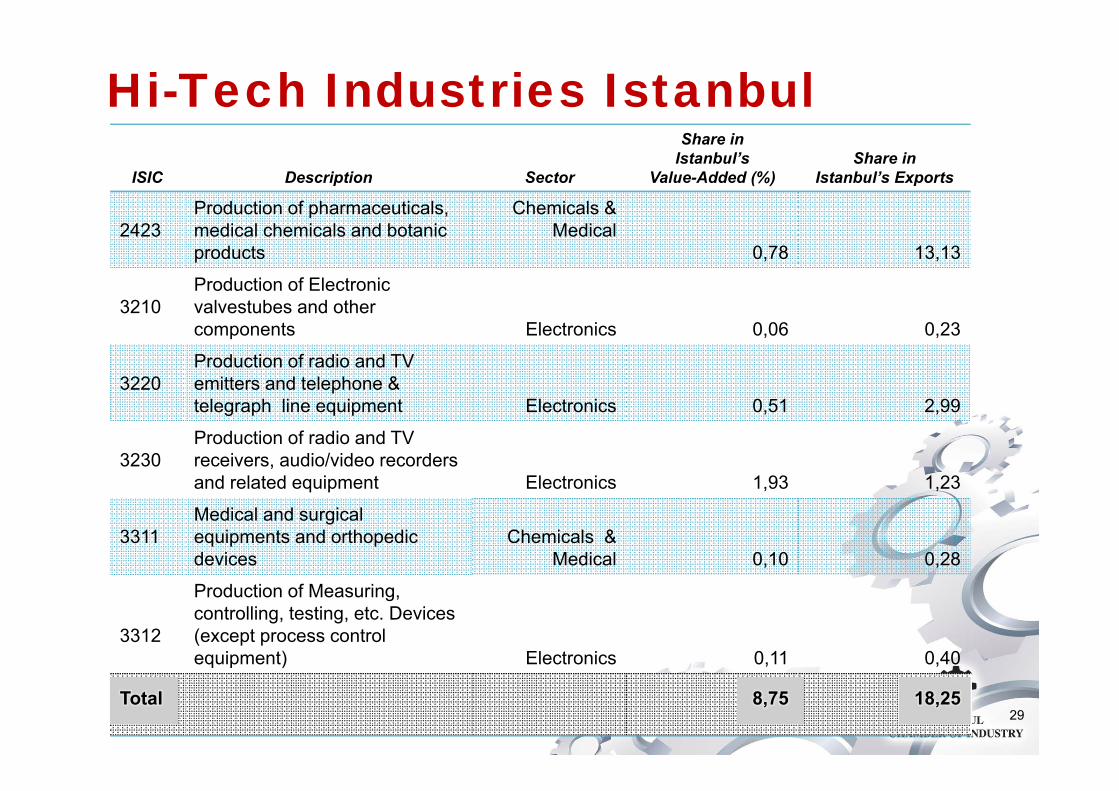
Hi-Tech Industries IstanbulISIC Description Sector
Share inIstanbul’s
Value-Added (%)Share in
Istanbul’s Exports
2423Production of pharmaceuticals, medical chemicals and botanic products
Chemicals & Medical
0,78 13,13
3210Production of Electronic valvestubes and other components Electronics 0,06 0,23
3220Production of radio and TV emitters and telephone & telegraph line equipment Electronics 0,51 2,99
3230Production of radio and TV receivers, audio/video recorders and related equipment Electronics 1,93 1,23
3311Medical and surgical equipments and orthopedicdevices
Chemicals & Medical 0,10 0,28
3312
Production of Measuring, controlling, testing, etc. Devices (except process control equipment) Electronics 0,11 0,40
Total 8,75 18,25

30
The Labor Market
Istanbul's total workforce : 4,211,000 (2011)
(Turkey’s total workforce : 24,110,000) (2011)

31
Foreign TradeHalf of Turkey’s foreign trade takes place in Istanbul.
• 45,5% of exports and 51,5% of Turkey’s imports in 2011.
37 42 4760
7356 54 6261
7081
99111
7998
124İstanbul's Foreign Trade (USD bn.)
Exports Imports

32
45% of Exports
Kaynak: TÜİK
0
50
100
150
Exports Turkey
Exports Istanbul
Exports Turkey 23,2 26,3 27,0 26,6 27,2 31,0 36,2 47,9 64,0 73,4 85,8 106,0 132,0 102,1 113,9 134,9
Exports Istanbul 13,8 15,8 15,8 15,2 16,4 17,6 21,0 27,6 36,2 39,3 44,4 55,3 66,1 45,8 51,4 59,0
1996 1997 1998 1999 2000 2001 2002 2003 2004 2005 2006 2007 2008 2009 2010 2011
B $
%16 CAGR
%12 CAGR

33
Foreign Capital Investment The number of foreign companies in Turkey was more
than 29,300 (2011.04)
– 3.234 new foreign companies were established in Istanbul between January - November 2011
More than 12,000 foreign companies operate in or are based Istanbul:
– Multinational and international companies
– In different areas such as the banking, insurance, ICT, motor vehicles, food & beverage industries.
– These companies benefit both from the city’s geographical location and its existing service facilities,
– Thus, these act as headquarters for regions covering Central Asia, the Mid & Near East, and North Africa.

34
Academic Institutions
Total enrollment: 2.868.992 students(14% of Turkey’ total) (2010-2011)
42 Universities (out of 165 overall Turkey)
– 345.574 students
Academic Institutions #Pre-schooling 2,734Primary Schools 1,644Junior Education 849High Schools 256Vocational & Technical Schools 31Universities 42

35
• Established in 1952 • 18,000 members
Contribution to Turkey's Total GDP 9,2%Contribution to the Total Value Added created by Turkey's industry 40%Share of ICI Members among Top 500 firms 39%Share of ICI Members in Net Pre-Tax Profits by Top 500 firms
37,6%
Share of ICI Members in Gross Revenues by Top 500 firms
45,2%
Share of SMEs among ICI Members 98%
Istanbul Chamber of Industry (ICI)

36
Growing Industry Requires Automation
Export RankingWorld Europe
Women cotton fabrics #2Cotton yarn #1Carpets, floor coverings #3 #2Knit or crocheted fabrics #5 #1Cotton denim #4 #1T-shirts #3 #1Singlets, panties, briefs, pyjamas etc. #1Fur apparel #5 #3Socks stockings etc. #3 #2Woven tufted fabric, lace #6 #3Houshold glassware #4 #3
All needs factory automation!
37
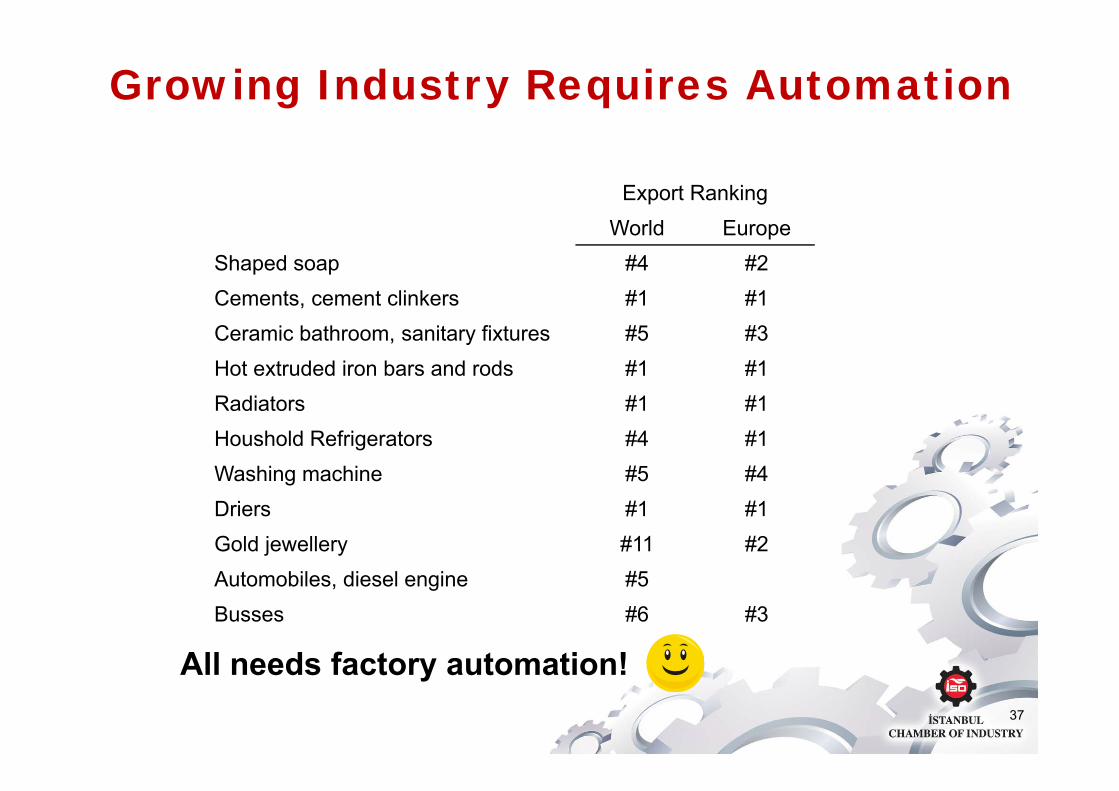
Growing Industry Requires Automation
Export RankingWorld Europe
Shaped soap #4 #2Cements, cement clinkers #1 #1Ceramic bathroom, sanitary fixtures #5 #3Hot extruded iron bars and rods #1 #1Radiators #1 #1Houshold Refrigerators #4 #1Washing machine #5 #4Driers #1 #1Gold jewellery #11 #2Automobiles, diesel engine #5Busses #6 #3
All needs factory automation!

38
• Electronics• Electromechanics• Cosmetics• Food and packaging
Growing Industry Requires Automation
All needs factory automation!
•İSO, Istanbul Chamber of Industry, www.iso.org.tr .•TESİD, Turkish Electronics Industrialists Association, www.tesid.org.tr .•TAYSAD, Association of Automotive Parts & Components Manufacturers,www.taysad.org.tr .•OSD, Automotive Manufacturers Association, www.osd.org.tr .

39
Project management System design Engineering System integration Aftersales Services
Panel building Machines, NC machines, Pneumatic Hydraulic Applications Robot applications ASRS constructions Conveyors, lifts Pick and Place devices Palletizers, packing machines Components
Partners for System Building
ENOSAD, Industrial Automation IndustrialistsAssociation, www.enosad.org.tr .

40
• Power Network Analysers
• Measurement Devices AC/DC
• Power Factor Correction Relays
• Contactors / Reactors
TESİD, Turkish Electronics Industrialists Association, www.tesid.org.tr .
Partners to supply components

41
• Industrial Power Supplies
• Time / Motor Protection Relays
• Modem RTU / GPRS Modem Ethernet Gateway
• Softwares• Remote Monitoring Software
• Current Transformers / Transducers
Partners to supply components• Softwares• Remote Monitoring Software• Softwares• Remote Monitoring Softwares
42
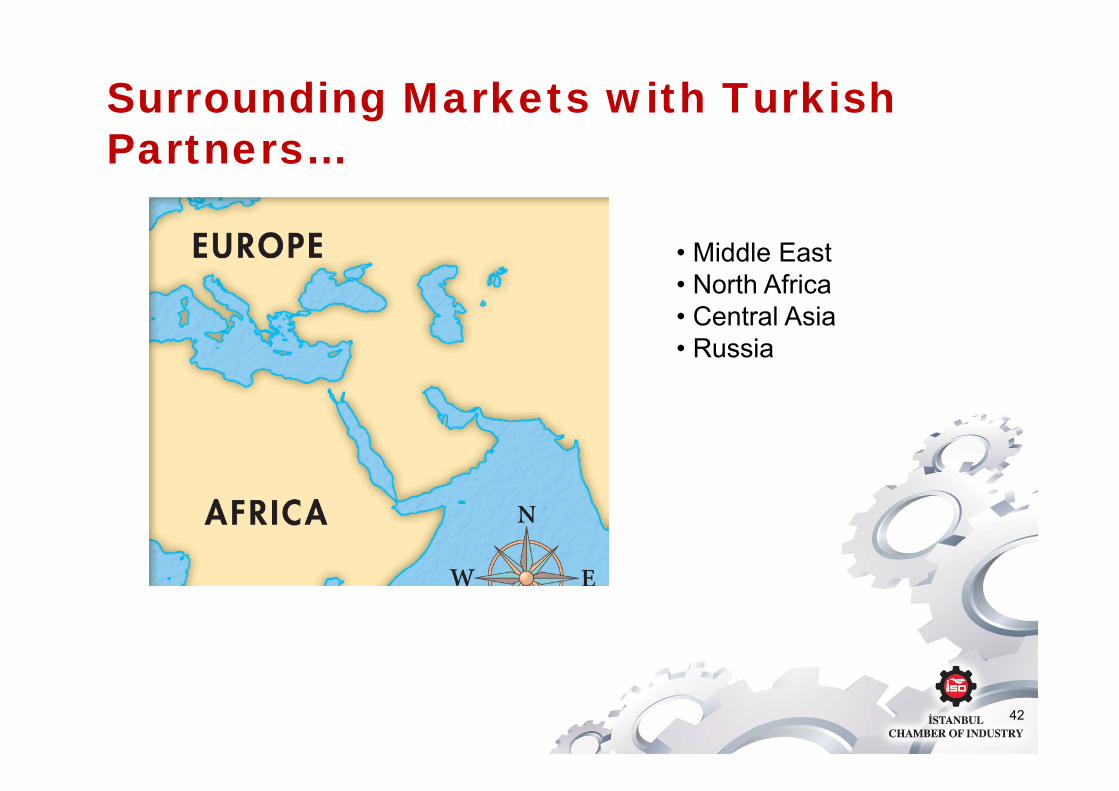
Surrounding Markets with Turkish Partners…
• Middle East• North Africa• Central Asia• Russia