Embed Size (px)
Citation preview
G R O W I N G I N N O VAT I O N A M E R I C A ’ S E N E R G Y F U T U R E S T A R T S A T H O M E
2009 Ethanol Industry OUTLOOK

Christopher Standlee, Chairman Abengoa Bioenergy Corp. www.abengoabioenergy.com
Nathan Kimpel, TreasurerNew Energy Corp.
Chuck Woodside, SecretaryKAAPA Ethanol, LLC www.kaapaethanol.com
Bob Dinneen, PresidentRenewable Fuels Association www.ethanolRFA.org
Bob SatherAce Ethanol, LLC www.aceethanol.com
Scott TrainumAdkins Energy, LLC www.adkinsenergy.com
Randall J. DoyalAl-Corn Clean Fuel www.al-corn.com
Ed HarjehausenArcher Daniels Midland Co. www.admworld.com
Ron MillerAventine Renewable Energy Holdings, Inc. www.aventinerei.com
Kevin MalchineBadger State Ethanol, LLC www.badgerstateethanol.com
Raymond DefenbaughBig River Resources West Burlington, LLC www.bigriverresources.com
Jeff ZuegerBlue Flint Ethanol www.blueflintethanol.com
Gary DrookCentral Indiana Ethanol, LLC www.cie.us
Kerry NixonCentral MN Ethanol Coop www.centralmnethanol.com
Bill LeeChippewa Valley Ethanol Co. www.cvec.com
Mick HendersonCommonwealth Agri-Energy, LLC www.commonwealthagrienergy.com
Scott MundtDakota Ethanol, LLC www.dakotaethanol.com
Gerald BachmeierDENCO, LLC www.dencollc.com
Steven GardnerEast Kansas Agri-Energy, LLC www.ekaellc.com
Jim SeurerGlacial Lakes Energy, LLC www.glaciallakesenergy.com
Dave NelsonGlobal Ethanol, LLC www.globalethanolservices.com
Dermot O’BrienGolden Cheese Company of California http://ourworld.compuserve.com/homepages/gccc/
Walter WendlandGolden Grain Energy, LLC www.goldengrainenergy.com
Tracey OlsonGranite Falls Energy, LLC www.granitefallsenergy.com
Richard RuebeGTL Resources USA Inc. www.gtlresources.com
Ben BrownHeartland Corn Products
Bill PaulsenHeartland Grain Fuels, LP
Keith GibsonIroquois Bio-Energy Company, LLCwww.ibecethanol.com
Eric MosbeyLincolnland Agri-Energy, LLC www.lincolnlandagrienergy.com
Steve RoeLittle Sioux Corn Processors, LP www.littlesiouxcornprocessors.com
Sean MartinLouis Dreyfus Commodities www.ldcommodities.com
Steven WagnerMerrick & Company www.merrick.com
Ryland UtlautMid-Missouri Energy, Inc. www.midmissourienergy.com
Glen PetersenNorth Country Ethanol Co.
Neil KoehlerPacific Ethanol, Inc. www.pacificethanol.net
Jim RottmanParallel Products www.parallelproducts.com
Mike JerkeQuad County Corn Processors www.quad-county.com
Lee ReeveReeve Agri Energy, Inc.
Bernie Punt Siouxland Energy and Livestock Coop www.siouxlandenergy.com
Doug MortensenTate & Lyle www.tateandlyle.com
Neill McKinstrayThe Andersons Inc. www.andersonsinc.com
Charles WilsonTrenton Agri Products, LLC www.trentonagriproducts.com
Jeff RobertsonUnited Wisconsin Grain Producers, LLC www.uwgp.com
Don EndresVeraSun Energy Corp. www.verasun.com
John Howe Verenium Corp. www.verenium.com
Michael Sawyer Western New York Energy, LLC www.wnyenergy.com
Steve Christensen Western Wisconsin Energy, LLC www.westernwisconsinenergy.com
Jim Stewart Xethanol BioFuels, LLC www.xethanol.com
RFA bOARd OF dIREcTORs

12009 Ethanol Industry OUTLOOK
For the U.S. ethanol industry, 2008 ushered in a year of historic production to meet
record demand as the industry continued to grow to meet America’s energy needs.
The industry can be proud of the milestones reached in 2008, including record production of
9 billion gallons, implementation of a new Renewable Fuels Standard (RFS), record exports of
distillers grains to feed the world’s livestock, building new infrastructure, moving to higher blends,
and last, but perhaps most importantly, technological innovations to improve both starch and
cellulose-based ethanol production.
It will take time to yield returns on these investments. This past year presented unique challenges
and economic difficulty, as producers faced record input costs, lower ethanol values and the
evaporation of credit in the market. But the industry will emerge stronger than ever.
2009 promises to be another exciting year. The RFS calls for blending 11.1 billion gallons of ethanol
and other biofuels in the U.S. motor fuels market. To ensure that America’s renewable fuels industry
continues to grow and evolve, the market for ethanol and other biofuels must expand. It is critical
that the arbitrary limit on ethanol blending – today capped at 10% of each gallon of gasoline – be
removed to allow gasoline blenders and refiners to take full advantage of the benefits of ethanol
blending. Increasing ethanol content reduces foreign oil consumption and our rising trade deficit,
and ensures a market will exist for the next generation of ethanol produced from cellulose.
We will continue to challenge ourselves to reduce our carbon footprint. More efficiently using our
natural resources is at the core of this nation’s efforts to secure a more sustainable energy future.
America’s ethanol producers are at the forefront of that effort, developing the technologies that
are constantly improving its green footprint.
The U.S. ethanol industry remains strong and steadfast in its resolve to provide domestically
produced renewable fuels because America’s energy future starts at home.
Sincerely,
Bob Dinneen, President & cEO
February 2009

In just the past year, America’s annual operating
capacity increased by 2.7 billion gallons, a 34%
increase over 2007. This growth in production capacity
was fueled by completion, start-up, and operation
of 31 new ethanol biorefineries and will ensure
America’s ethanol producers are capable of filling the
federal requirements for ethanol use outlined in the
Renewable Fuels Standard (RFS).
In addition, ethanol production has continued to
expand geographically, with ethanol biorefineries now
operating in 26 states, bringing economic opportunity
to tens of thousands of Americans, many of whom
live in rural areas. Dozens more biorefineries are
in the planning stages, including a number of
next generation facilities that will not only
expand the reach of traditional ethanol
production and use, but will broaden the array
of feedstocks from which ethanol is produced.
As a result of this kind of growth and innovation,
America’s ethanol industry produced a record 9
billion gallons of ethanol in 2008 and is poised to
produce well in excess of 10 billion gallons in 2009,
representing nearly 9% of America’s gasoline supply.
Jan 2000 Jan 2001 Jan 2002 Jan 2003 Jan 2004 Jan 2005 Jan 2006 Jan 2007 Jan 2008 Jan 2009
Biorefineries Online 54 56 61 68 72 81 95 110 139 170*
Capacity (mgy) 1,748.7 1,921.9 2,347.3 2,706.8 3,100.8 3,643.7 4,336.4 5,493.4 7,888.4 10,569.4
RECENT EThaNOl INDUSTRY EXPaNSIONS
There can be little doubt that 2008 will be a year
America’s ethanol industry will not soon forget.
In the face of manufactured baseless attacks, record
corn prices, undervalued ethanol, and an economic
crisis many say will rival the Great depression, America’s
ethanol producers continued to provide America with
a homegrown answer to its dependence on foreign oil.
GROWING TO MEET AMERICA’S ENERGY NEEDS
U.S. EThaNOl BIOREfINERY lOCaTIONS
2
* This figure represents operating ethanol biorefineries as of January 2009. It does not include those facilities that have been temporarily idled. For a complete list visit www.ethanolRFA.org.
Biorefineries in production (170*)
Biorefineries under construction (20)
Source: Renewable Fuels Association, January 2009

0
500
1000
1500
2000
2500
Mill
ions
of
gallo
ns
20082007200620052004200320022001200019991998199719961995199419931992199119901989198819871986198519841983198219811980
175
215
350
375
430
610
710
830
845
870
900
950
1100
1200
1350
1400
1100
1300
1400
1470
1630
1770
2130
2810
3000
35003410
4000
4500
5000
5500
6000
6500
7000
7500
8000
8500
9000
3900
4900
6500
9000*
An IndUsTRy EvOLvInGThe perfect storm of events in 2008, while
temporarily disruptive, is going to lead to a new and
more robust American ethanol industry in 2009 and
beyond. The challenges faced and currently being
addressed by this industry will make it stronger
and more successful far into the future.
Improved efficiencies at existing
biorefineries, new process technologies,
commercialization of cellulosic conversion
technologies, and yes, even some industry
consolidation, will provide a platform from
which this industry can launch and expand
into a new, sustainable, and renewably-
fueled era in American history.
U.S. EThaNOl PRODUCTION CaPaCITY BY STaTEIn Millions of Gallons
Nameplate OperatingUnder Con-struction/ Expansion
Total
Iowa 3,076.0 2,856.0 690 3,766.0
Nebraska 1,444.0 1,164.0 319 1,763.0
Illinois 1,190.0 1,190.0 293 1,483.0
Minnesota 1,081.6 837.6 50 1,131.6
South Dakota 1,016.0 799.0 33 1,049.0
Indiana 899.0 697.0 88 987.0
Ohio 470.0 246.0 65 535.0
Kansas 491.5 436.5 20 511.5
Wisconsin 498.0 498.0 498.0
Texas 250.0 140.0 115 365.0
North Dakota 353.0 233.0 353.0
Tennessee 267.0 267.0 38 305.0
Michigan 265.0 215.0 5 270.0
Missouri 261.0 261.0 261.0
California 136.5 96.5 105 241.5
New York 164.0 50.0 164.0
Oregon 148.0 148.0 148.0
Colorado 125.0 125.0 125.0
Georgia 100.4 100.4 20 120.4
Pennsylvania 110 110.0
North Carolina 60 60.0
Arizona 55.0 55.0 55.0
Washington 55 55.0
Idaho 54.0 54.0 54.0
Mississippi 54.0 54.0 54.0
Kentucky 38.4 38.4 38.4
New Mexico 30.0 30.0
Wyoming 6.5 6.5 6.5
Louisiana 1.5 1.5 1.5
Total 12,475.4 10,569.4 2,066 14,541.4
Source: Renewable Fuels Association, January 2009
hISTORIC U.S. fUEl EThaNOl PRODUCTION
32009 Ethanol industry OUTLOOK
Source: Renewable Fuels Association, January 2009 *Estimated

4
BUILDING FOR THE FUTURE
America’s ethanol producers have answered the
challenge put forth in the Renewable Fuels standard
(RFs) and are producing enough domestic ethanol
to fill the requirements. In so doing, this industry
has recognized new opportunities to expand the use
of ethanol and ensure the success of the RFs in the
years to come.
bREAKInG ThROUGh ThE bLEnd WALLAmerican ethanol production is quickly careening
toward the blend wall – that moment when ethanol
production and use is equal to 10% of the nation’s
gasoline supply. Without a change in federal
standards, that level of ethanol use will undermine
the goals of the RFS and become an unwarranted
cap on the growth of this industry and the
development of next generation technologies.
In 1979, the federal government determined that
the appropriate blend of ethanol in gasoline for use
in every vehicle on the road was 10%, commonly
referred to as E10. Following this guideline,
automakers extended warranty coverage
for the use of E10 in all their vehicles.
That made sense at the time because
ethanol was little more than a grain of
sand on the beach of American gasoline
consumption. Today, such an arbitrary
limit no longer makes sense.
In order to tear down the blend wall and ensure the
success of the RFS, comprehensive research and
sound scientific data must be at the core of this industry’s
efforts to achieve higher level ethanol blending. By
working with automakers, the federal government,
and other stakeholders, that research can be done
and the federal cap on ethanol use can be changed.
Whether it is 13, 15 or 20%, increasing the volume
of ethanol blended into each gallon of gasoline is
critical to the future of America’s ethanol industry.
E85 REfUElINg lOCaTIONS BY STaTE~1,900 stations across the country
150 or more
100 – 149
50 – 99
25 – 49
1 – 24
No E85 locations
Source: Alternative Fuels & Advanced Vehicles Data Center (AFDC), National Ethanol Vehicle Coalition (NEVC), Renewable Fuels Association
52009 Ethanol Industry OUTLOOK
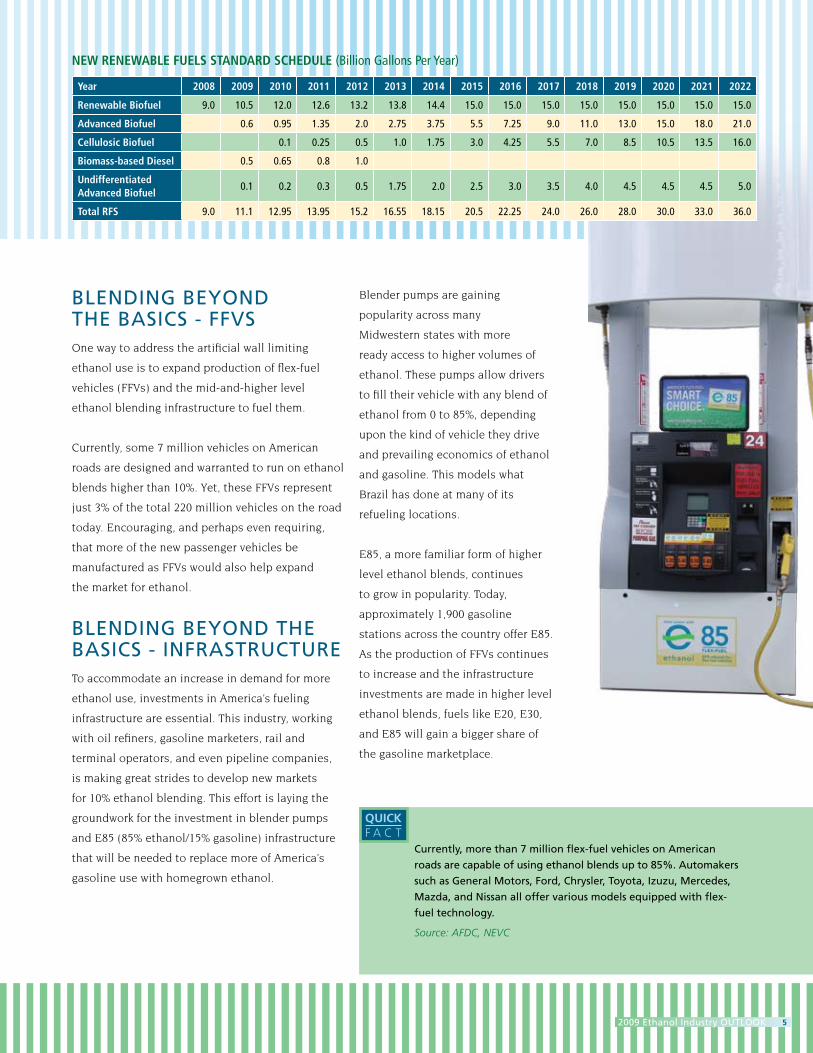
bLEndInG bEyOnd ThE bAsIcs - FFvsOne way to address the artificial wall limiting
ethanol use is to expand production of flex-fuel
vehicles (FFVs) and the mid-and-higher level
ethanol blending infrastructure to fuel them.
Currently, some 7 million vehicles on American
roads are designed and warranted to run on ethanol
blends higher than 10%. Yet, these FFVs represent
just 3% of the total 220 million vehicles on the road
today. Encouraging, and perhaps even requiring,
that more of the new passenger vehicles be
manufactured as FFVs would also help expand
the market for ethanol.
bLEndInG bEyOnd ThE bAsIcs - InFRAsTRUcTURETo accommodate an increase in demand for more
ethanol use, investments in America’s fueling
infrastructure are essential. This industry, working
with oil refiners, gasoline marketers, rail and
terminal operators, and even pipeline companies,
is making great strides to develop new markets
for 10% ethanol blending. This effort is laying the
groundwork for the investment in blender pumps
and E85 (85% ethanol/15% gasoline) infrastructure
that will be needed to replace more of America’s
gasoline use with homegrown ethanol.
Blender pumps are gaining
popularity across many
Midwestern states with more
ready access to higher volumes of
ethanol. These pumps allow drivers
to fill their vehicle with any blend of
ethanol from 0 to 85%, depending
upon the kind of vehicle they drive
and prevailing economics of ethanol
and gasoline. This models what
Brazil has done at many of its
refueling locations.
E85, a more familiar form of higher
level ethanol blends, continues
to grow in popularity. Today,
approximately 1,900 gasoline
stations across the country offer E85.
As the production of FFVs continues
to increase and the infrastructure
investments are made in higher level
ethanol blends, fuels like E20, E30,
and E85 will gain a bigger share of
the gasoline marketplace.
currently, more than 7 million flex-fuel vehicles on American
roads are capable of using ethanol blends up to 85%. Automakers
such as General Motors, Ford, chrysler, Toyota, Izuzu, Mercedes,
Mazda, and nissan all offer various models equipped with flex-
fuel technology.
Source: AFDC, NEVC
QUiCK F A C T
NEw RENEwaBlE fUElS STaNDaRD SChEDUlE (Billion Gallons Per Year)
Year 2008 2009 2010 2011 2012 2013 2014 2015 2016 2017 2018 2019 2020 2021 2022
Renewable Biofuel 9.0 10.5 12.0 12.6 13.2 13.8 14.4 15.0 15.0 15.0 15.0 15.0 15.0 15.0 15.0
advanced Biofuel 0.6 0.95 1.35 2.0 2.75 3.75 5.5 7.25 9.0 11.0 13.0 15.0 18.0 21.0
Cellulosic Biofuel 0.1 0.25 0.5 1.0 1.75 3.0 4.25 5.5 7.0 8.5 10.5 13.5 16.0
Biomass-based Diesel 0.5 0.65 0.8 1.0
Undifferentiated advanced Biofuel
0.1 0.2 0.3 0.5 1.75 2.0 2.5 3.0 3.5 4.0 4.5 4.5 4.5 5.0
Total RfS 9.0 11.1 12.95 13.95 15.2 16.55 18.15 20.5 22.25 24.0 26.0 28.0 30.0 33.0 36.0

6
EcOnOMIc cOnTRIbUTIOns In 2008The combination of spending for annual operations,
ethanol transportation and capital spending for new
plants under construction added more than $65 billion
to the nation’s Gross Domestic Product (GDP) in 2008.
Additionally, the production of ethanol provided an
additional $20 billion for American households in 2008.
Source: “Contribution of the Ethanol Industry to the Economy of the United States,” LECG, LLC, February 2009.
sTIMULATInG ThE EcOnOMy WhILE GEnERATInG REvEnUEThe combination of increased GDP and higher
household income in 2008 attributable to the U.S.
ethanol industry generated an estimated $12 billion
in federal tax revenue and $9 billion in state and local
government tax revenue. Given the shrinking tax base
in today’s economy, the ethanol industry’s contribu-
tion is a bright spot for federal, state and local coffers.
REENERGIzING THE ECONOMY & HELPING CONSUMERS
The growing U.s. ethanol industry continues to have
a profoundly positive impact on the U.s. economy,
particularly in the current economic climate.
America’s ethanol producers have long been at the
cutting edge of the green economy, helping support
more than 494,000 well paying jobs in 2008 alone.
Importantly, ethanol production provides a critical
stimulus for struggling rural economies, providing
farmers the most important value added market
for grains in more than a generation.
2008 EThAnOL EcOnOMIc cOnTRIbUTIOns:
Jobs = 494,177
contribution to GdP = $65.6 billion
household Incomes = $20 billion
Tax Revenue Generated
(federal, state and local) = $20.7 billion
QUiCK F A C T
72009 Ethanol Industry OUTLOOK
Assuming that all of the 9 billion gallons of ethanol
produced in 2008 were marketed, the estimated
cost of the two major federal incentives for the year
(VEETC and the Small Ethanol Producer Tax Credit),
totaled $4.7 billion. By comparison, the ethanol
industry generated $11.9 billion in new tax revenue
for the Federal Treasury, yielding a direct return on
investment to the federal government of 2.5 to 1.
Source: “Contribution of the Ethanol Industry to the Economy of the United States,” LECG, LLC, February 2009.
cREATInG GREEn JObs, EcOnOMIc OPPORTUnITy FOR ThE FUTUREAmerica’s ethanol industry is a significant economic
driver today and has even greater potential in the
future. Conservatively assuming that the Renewable
Fuels Standard serves as a ceiling and not a floor to
American ethanol production and use, this industry
would create on the order of 1 million new jobs
across the entire economy by 2022. In turn, these
jobs and economic opportunities would generate
$420 billion of increased household income, add
$1.6 trillion to the GDP, and provide more than
$500 billion of new tax revenue for federal,
state and local governments by 2022.
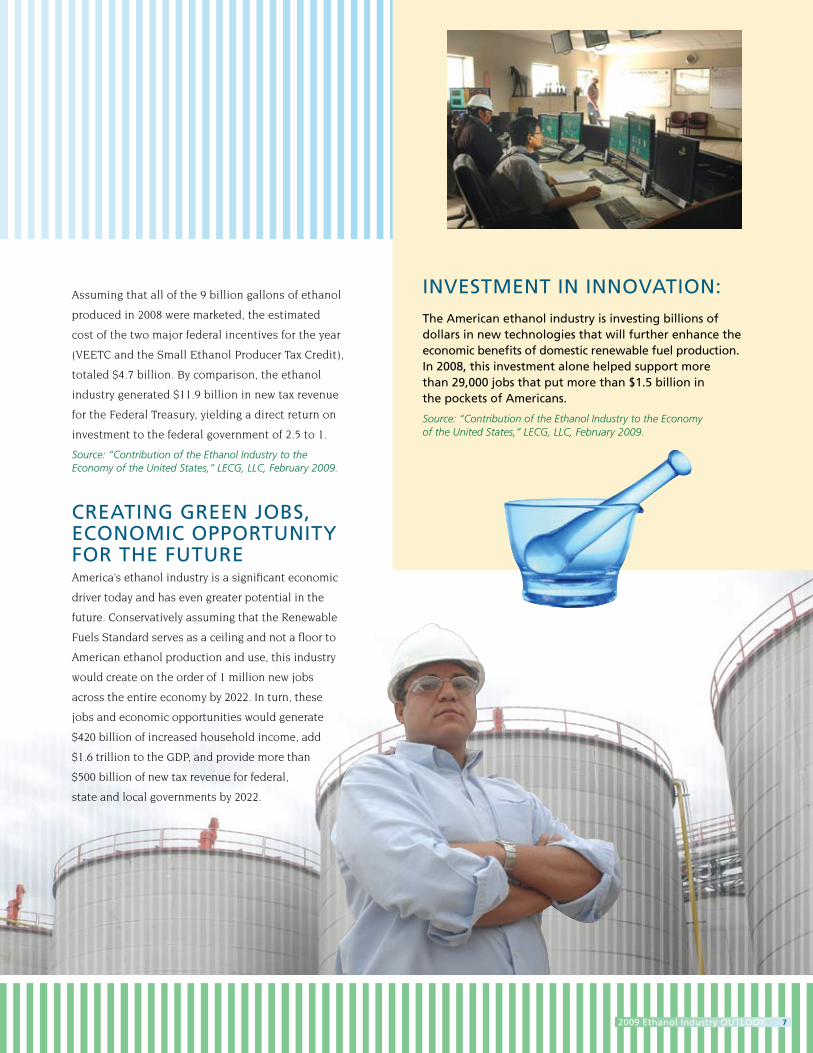
InvEsTMEnT In InnOvATIOn:The American ethanol industry is investing billions of dollars in new technologies that will further enhance the economic benefits of domestic renewable fuel production. In 2008, this investment alone helped support more than 29,000 jobs that put more than $1.5 billion in the pockets of Americans.
Source: “Contribution of the Ethanol Industry to the Economy of the United States,” LECG, LLC, February 2009.

8
BREAKING AMERICA’S FOREIGN OIL DEPENDENCE
On average, the world consumes some 86 million
barrels of oil per day. According to the International
Energy Agency (IEA), that number is slated to rise
to 116 million barrels by 2030. In a 2008 report, IEA
notes that in order to meet the world’s thirst for oil,
nonconventional sources of fuel must be found. By
IEA estimates, world biofuels production is the only
nonfossil fuel that is helping to reduce oil demand.
Were it not for the increasing production of world
biofuels producers, oil consumption would expand
by 1 million barrels per day.
A London-based analyst for Merrill Lynch has noted
that biofuels are keeping world oil prices 15% lower
than they would otherwise be and shaving $0.50 off
the price of a gallon of gas. “On a global scale, bio-
fuels are now the single largest contributor to world
oil supply growth. We estimate that retail gasoline
prices would be $21/bbl higher, on average, without
the incremental biofuel supply.”
Francisco Blanch, Senior Commodity Analyst, Merrill Lynch, in a June 6, 2008 investors report.
There is little question that the increased supply
of biofuels, including ethanol, worldwide is not only
lowering oil demand, but also helping to mitigate
the devastating impacts of volatile oil markets,
which reached a record $140/barrel in 2008.
The production and use of 9 billion
gallons of ethanol in 2008 displaced
the need for 321.4 million barrels of oil.
It also saved American consumers/
taxpayers $32 billion, an average of
more than $87 million a day.
Source: Energy Information Administration, LEGC, LLC.
QUiCK F A C T
92009 Ethanol Industry OUTLOOK
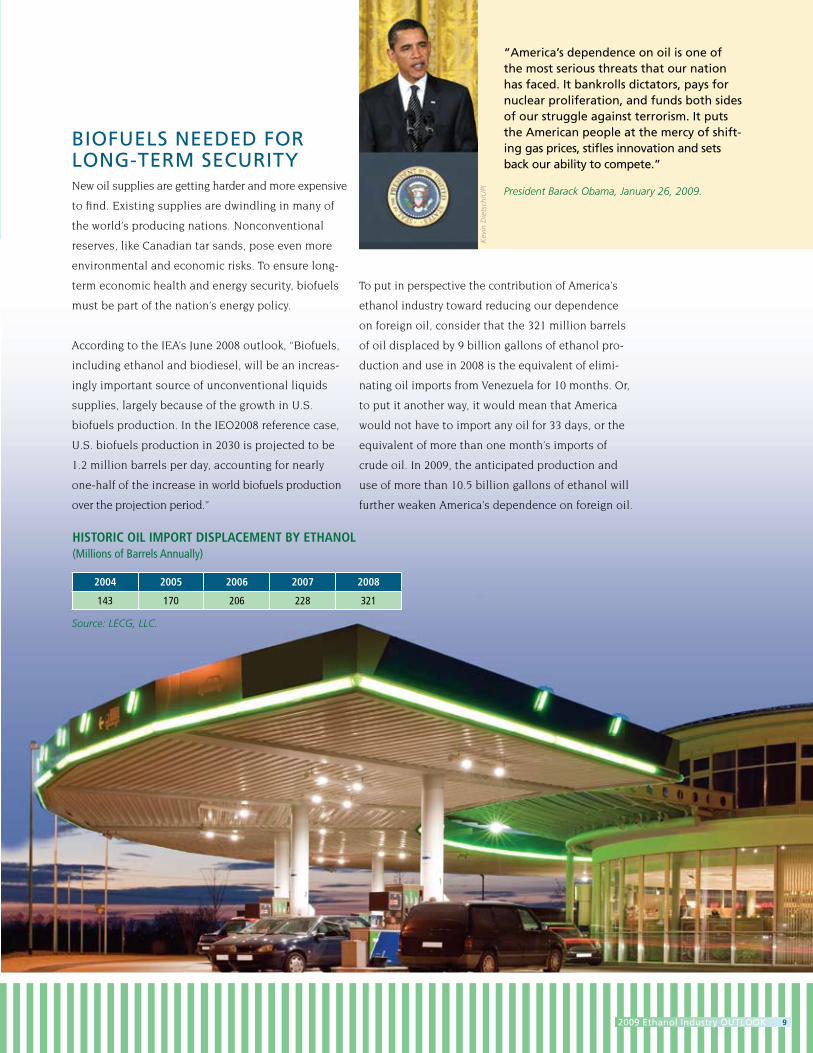
New oil supplies are getting harder and more expensive
to find. Existing supplies are dwindling in many of
the world’s producing nations. Nonconventional
reserves, like Canadian tar sands, pose even more
environmental and economic risks. To ensure long-
term economic health and energy security, biofuels
must be part of the nation’s energy policy.
According to the IEA’s June 2008 outlook, “Biofuels,
including ethanol and biodiesel, will be an increas-
ingly important source of unconventional liquids
supplies, largely because of the growth in U.S.
biofuels production. In the IEO2008 reference case,
U.S. biofuels production in 2030 is projected to be
1.2 million barrels per day, accounting for nearly
one-half of the increase in world biofuels production
over the projection period.”
To put in perspective the contribution of America’s
ethanol industry toward reducing our dependence
on foreign oil, consider that the 321 million barrels
of oil displaced by 9 billion gallons of ethanol pro-
duction and use in 2008 is the equivalent of elimi-
nating oil imports from Venezuela for 10 months. Or,
to put it another way, it would mean that America
would not have to import any oil for 33 days, or the
equivalent of more than one month’s imports of
crude oil. In 2009, the anticipated production and
use of more than 10.5 billion gallons of ethanol will
further weaken America’s dependence on foreign oil.
2004 2005 2006 2007 2008
143 170 206 228 321
hISTORIC OIl ImPORT DISPlaCEmENT BY EThaNOl (Millions of Barrels Annually)
bIOFUELs nEEdEd FOR LOnG-TERM sEcURITy
Source: LECG, LLC.
“America’s dependence on oil is one of the most serious threats that our nation has faced. It bankrolls dictators, pays for nuclear proliferation, and funds both sides of our struggle against terrorism. It puts the American people at the mercy of shift-ing gas prices, stifles innovation and sets back our ability to compete.” President Barack Obama, January 26, 2009.
Kev
in D
iets
ch/U
PI
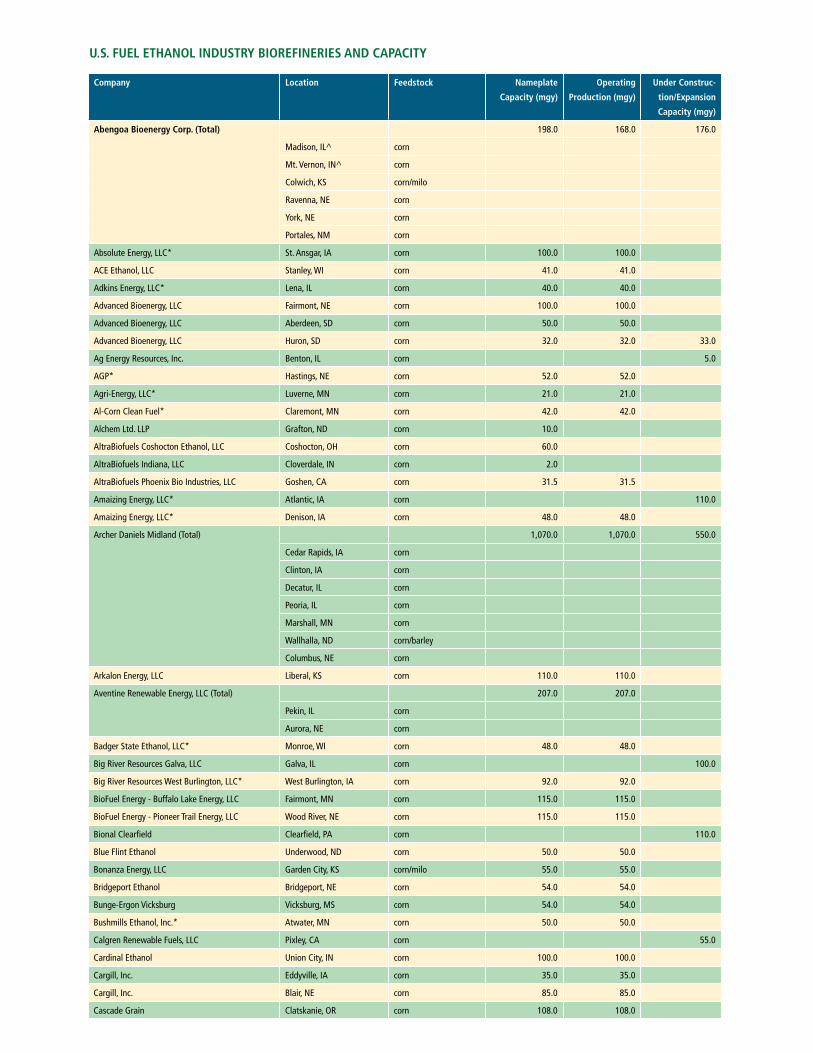
Company location feedstock Nameplate
Capacity (mgy)
Operating
Production (mgy)
Under Construc-
tion/Expansion
Capacity (mgy)
abengoa Bioenergy Corp. (Total) 198.0 168.0 176.0
Madison, IL^ corn
Mt. Vernon, IN^ corn
Colwich, KS corn/milo
Ravenna, NE corn
York, NE corn
Portales, NM corn
Absolute Energy, LLC* St. Ansgar, IA corn 100.0 100.0
ACE Ethanol, LLC Stanley, WI corn 41.0 41.0
Adkins Energy, LLC* Lena, IL corn 40.0 40.0
Advanced Bioenergy, LLC Fairmont, NE corn 100.0 100.0
Advanced Bioenergy, LLC Aberdeen, SD corn 50.0 50.0
Advanced Bioenergy, LLC Huron, SD corn 32.0 32.0 33.0
Ag Energy Resources, Inc. Benton, IL corn 5.0
AGP* Hastings, NE corn 52.0 52.0
Agri-Energy, LLC* Luverne, MN corn 21.0 21.0
Al-Corn Clean Fuel* Claremont, MN corn 42.0 42.0
Alchem Ltd. LLP Grafton, ND corn 10.0
AltraBiofuels Coshocton Ethanol, LLC Coshocton, OH corn 60.0
AltraBiofuels Indiana, LLC Cloverdale, IN corn 2.0
AltraBiofuels Phoenix Bio Industries, LLC Goshen, CA corn 31.5 31.5
Amaizing Energy, LLC* Atlantic, IA corn 110.0
Amaizing Energy, LLC* Denison, IA corn 48.0 48.0
Archer Daniels Midland (Total) 1,070.0 1,070.0 550.0
Cedar Rapids, IA corn
Clinton, IA corn
Decatur, IL corn
Peoria, IL corn
Marshall, MN corn
Wallhalla, ND corn/barley
Columbus, NE corn
Arkalon Energy, LLC Liberal, KS corn 110.0 110.0
Aventine Renewable Energy, LLC (Total) 207.0 207.0
Pekin, IL corn
Aurora, NE corn
Badger State Ethanol, LLC* Monroe, WI corn 48.0 48.0
Big River Resources Galva, LLC Galva, IL corn 100.0
Big River Resources West Burlington, LLC* West Burlington, IA corn 92.0 92.0
BioFuel Energy - Buffalo Lake Energy, LLC Fairmont, MN corn 115.0 115.0
BioFuel Energy - Pioneer Trail Energy, LLC Wood River, NE corn 115.0 115.0
Bional Clearfield Clearfield, PA corn 110.0
Blue Flint Ethanol Underwood, ND corn 50.0 50.0
Bonanza Energy, LLC Garden City, KS corn/milo 55.0 55.0
Bridgeport Ethanol Bridgeport, NE corn 54.0 54.0
Bunge-Ergon Vicksburg Vicksburg, MS corn 54.0 54.0
Bushmills Ethanol, Inc.* Atwater, MN corn 50.0 50.0
Calgren Renewable Fuels, LLC Pixley, CA corn 55.0
Cardinal Ethanol Union City, IN corn 100.0 100.0
Cargill, Inc. Eddyville, IA corn 35.0 35.0
Cargill, Inc. Blair, NE corn 85.0 85.0
Cascade Grain Clatskanie, OR corn 108.0 108.0
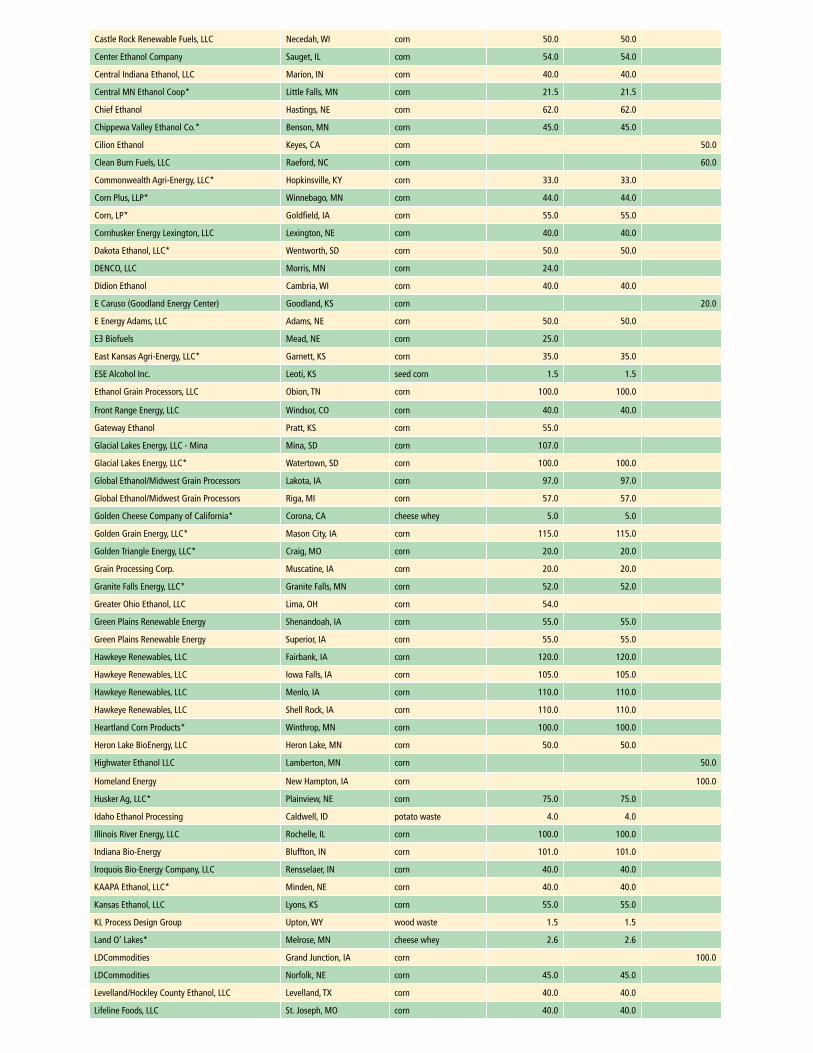
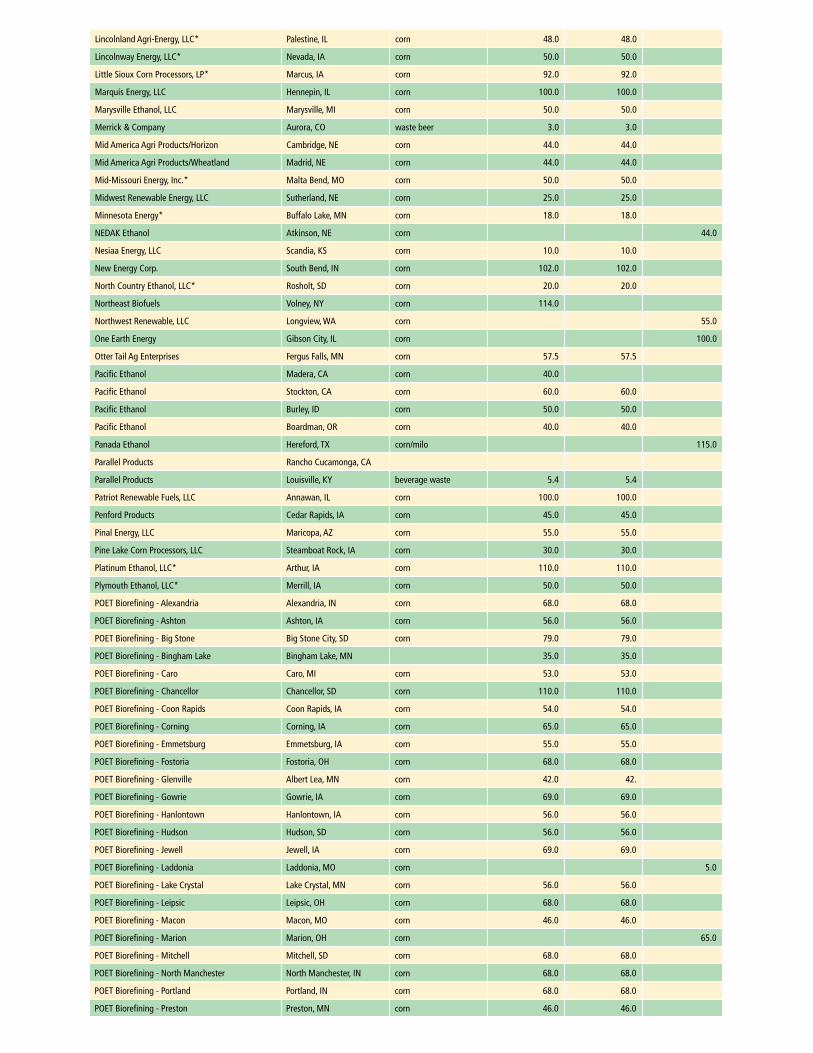
U.S. fUEl EThaNOl INDUSTRY BIOREfINERIES aND CaPaCITY
Castle Rock Renewable Fuels, LLC Necedah, WI corn 50.0 50.0
Center Ethanol Company Sauget, IL corn 54.0 54.0
Central Indiana Ethanol, LLC Marion, IN corn 40.0 40.0
Central MN Ethanol Coop* Little Falls, MN corn 21.5 21.5
Chief Ethanol Hastings, NE corn 62.0 62.0
Chippewa Valley Ethanol Co.* Benson, MN corn 45.0 45.0
Cilion Ethanol Keyes, CA corn 50.0
Clean Burn Fuels, LLC Raeford, NC corn 60.0
Commonwealth Agri-Energy, LLC* Hopkinsville, KY corn 33.0 33.0
Corn Plus, LLP* Winnebago, MN corn 44.0 44.0
Corn, LP* Goldfield, IA corn 55.0 55.0
Cornhusker Energy Lexington, LLC Lexington, NE corn 40.0 40.0
Dakota Ethanol, LLC* Wentworth, SD corn 50.0 50.0
DENCO, LLC Morris, MN corn 24.0
Didion Ethanol Cambria, WI corn 40.0 40.0
E Caruso (Goodland Energy Center) Goodland, KS corn 20.0
E Energy Adams, LLC Adams, NE corn 50.0 50.0
E3 Biofuels Mead, NE corn 25.0
East Kansas Agri-Energy, LLC* Garnett, KS corn 35.0 35.0
ESE Alcohol Inc. Leoti, KS seed corn 1.5 1.5
Ethanol Grain Processors, LLC Obion, TN corn 100.0 100.0
Front Range Energy, LLC Windsor, CO corn 40.0 40.0
Gateway Ethanol Pratt, KS corn 55.0
Glacial Lakes Energy, LLC - Mina Mina, SD corn 107.0
Glacial Lakes Energy, LLC* Watertown, SD corn 100.0 100.0
Global Ethanol/Midwest Grain Processors Lakota, IA corn 97.0 97.0
Global Ethanol/Midwest Grain Processors Riga, MI corn 57.0 57.0
Golden Cheese Company of California* Corona, CA cheese whey 5.0 5.0
Golden Grain Energy, LLC* Mason City, IA corn 115.0 115.0
Golden Triangle Energy, LLC* Craig, MO corn 20.0 20.0
Grain Processing Corp. Muscatine, IA corn 20.0 20.0
Granite Falls Energy, LLC* Granite Falls, MN corn 52.0 52.0
Greater Ohio Ethanol, LLC Lima, OH corn 54.0
Green Plains Renewable Energy Shenandoah, IA corn 55.0 55.0
Green Plains Renewable Energy Superior, IA corn 55.0 55.0
Hawkeye Renewables, LLC Fairbank, IA corn 120.0 120.0
Hawkeye Renewables, LLC Iowa Falls, IA corn 105.0 105.0
Hawkeye Renewables, LLC Menlo, IA corn 110.0 110.0
Hawkeye Renewables, LLC Shell Rock, IA corn 110.0 110.0
Heartland Corn Products* Winthrop, MN corn 100.0 100.0
Heron Lake BioEnergy, LLC Heron Lake, MN corn 50.0 50.0
Highwater Ethanol LLC Lamberton, MN corn 50.0
Homeland Energy New Hampton, IA corn 100.0
Husker Ag, LLC* Plainview, NE corn 75.0 75.0
Idaho Ethanol Processing Caldwell, ID potato waste 4.0 4.0
Illinois River Energy, LLC Rochelle, IL corn 100.0 100.0
Indiana Bio-Energy Bluffton, IN corn 101.0 101.0
Iroquois Bio-Energy Company, LLC Rensselaer, IN corn 40.0 40.0
KAAPA Ethanol, LLC* Minden, NE corn 40.0 40.0
Kansas Ethanol, LLC Lyons, KS corn 55.0 55.0
KL Process Design Group Upton, WY wood waste 1.5 1.5
Land O’ Lakes* Melrose, MN cheese whey 2.6 2.6
LDCommodities Grand Junction, IA corn 100.0
LDCommodities Norfolk, NE corn 45.0 45.0
Levelland/Hockley County Ethanol, LLC Levelland, TX corn 40.0 40.0
Lifeline Foods, LLC St. Joseph, MO corn 40.0 40.0
Lincolnland Agri-Energy, LLC* Palestine, IL corn 48.0 48.0
Lincolnway Energy, LLC* Nevada, IA corn 50.0 50.0
Little Sioux Corn Processors, LP* Marcus, IA corn 92.0 92.0
Marquis Energy, LLC Hennepin, IL corn 100.0 100.0
Marysville Ethanol, LLC Marysville, MI corn 50.0 50.0
Merrick & Company Aurora, CO waste beer 3.0 3.0
Mid America Agri Products/Horizon Cambridge, NE corn 44.0 44.0
Mid America Agri Products/Wheatland Madrid, NE corn 44.0 44.0
Mid-Missouri Energy, Inc.* Malta Bend, MO corn 50.0 50.0
Midwest Renewable Energy, LLC Sutherland, NE corn 25.0 25.0
Minnesota Energy* Buffalo Lake, MN corn 18.0 18.0
NEDAK Ethanol Atkinson, NE corn 44.0
Nesiaa Energy, LLC Scandia, KS corn 10.0 10.0
New Energy Corp. South Bend, IN corn 102.0 102.0
North Country Ethanol, LLC* Rosholt, SD corn 20.0 20.0
Northeast Biofuels Volney, NY corn 114.0
Northwest Renewable, LLC Longview, WA corn 55.0
One Earth Energy Gibson City, IL corn 100.0
Otter Tail Ag Enterprises Fergus Falls, MN corn 57.5 57.5
Pacific Ethanol Madera, CA corn 40.0
Pacific Ethanol Stockton, CA corn 60.0 60.0
Pacific Ethanol Burley, ID corn 50.0 50.0
Pacific Ethanol Boardman, OR corn 40.0 40.0
Panada Ethanol Hereford, TX corn/milo 115.0
Parallel Products Rancho Cucamonga, CA
Parallel Products Louisville, KY beverage waste 5.4 5.4
Patriot Renewable Fuels, LLC Annawan, IL corn 100.0 100.0
Penford Products Cedar Rapids, IA corn 45.0 45.0
Pinal Energy, LLC Maricopa, AZ corn 55.0 55.0
Pine Lake Corn Processors, LLC Steamboat Rock, IA corn 30.0 30.0
Platinum Ethanol, LLC* Arthur, IA corn 110.0 110.0
Plymouth Ethanol, LLC* Merrill, IA corn 50.0 50.0
POET Biorefining - Alexandria Alexandria, IN corn 68.0 68.0
POET Biorefining - Ashton Ashton, IA corn 56.0 56.0
POET Biorefining - Big Stone Big Stone City, SD corn 79.0 79.0
POET Biorefining - Bingham Lake Bingham Lake, MN 35.0 35.0
POET Biorefining - Caro Caro, MI corn 53.0 53.0
POET Biorefining - Chancellor Chancellor, SD corn 110.0 110.0
POET Biorefining - Coon Rapids Coon Rapids, IA corn 54.0 54.0
POET Biorefining - Corning Corning, IA corn 65.0 65.0
POET Biorefining - Emmetsburg Emmetsburg, IA corn 55.0 55.0
POET Biorefining - Fostoria Fostoria, OH corn 68.0 68.0
POET Biorefining - Glenville Albert Lea, MN corn 42.0 42.
POET Biorefining - Gowrie Gowrie, IA corn 69.0 69.0
POET Biorefining - Hanlontown Hanlontown, IA corn 56.0 56.0
POET Biorefining - Hudson Hudson, SD corn 56.0 56.0
POET Biorefining - Jewell Jewell, IA corn 69.0 69.0
POET Biorefining - Laddonia Laddonia, MO corn 5.0
POET Biorefining - Lake Crystal Lake Crystal, MN corn 56.0 56.0
POET Biorefining - Leipsic Leipsic, OH corn 68.0 68.0
POET Biorefining - Macon Macon, MO corn 46.0 46.0
POET Biorefining - Marion Marion, OH corn 65.0
POET Biorefining - Mitchell Mitchell, SD corn 68.0 68.0
POET Biorefining - North Manchester North Manchester, IN corn 68.0 68.0
POET Biorefining - Portland Portland, IN corn 68.0 68.0
POET Biorefining - Preston Preston, MN corn 46.0 46.0

POET Biorefining - Scotland Scotland, SD corn 11.0 11.0
POET Biorefining - Groton Groton, SD corn 53.0 53.0
Prairie Horizon Agri-Energy, LLC Phillipsburg, KS corn 40.0 40.0
Quad-County Corn Processors* Galva, IA corn 30.0 30.0
Range Fuels Soperton, GA wood waste 20.0
Red Trail Energy, LLC Richardton, ND corn 50.0 50.0
Redfield Energy, LLC * Redfield, SD corn 50.0 50.0
Reeve Agri-Energy Garden City, KS corn/milo 12.0 12.0
Renew Energy Jefferson Junction, WI corn 130.0 130.0
Renova Energy Torrington, WY corn 5.0 5.0
Riverland Biofuels Canton, IL corn 37.0 37.0
Show Me Ethanol Carrollton, MO corn 55.0 55.0
Siouxland Energy & Livestock Coop* Sioux Center, IA corn 60.0 60.0
Siouxland Ethanol, LLC Jackson, NE corn 50.0 50.0
Southwest Georgia Ethanol, LLC Mitchell Co., GA corn 100.0 100.0
Southwest Iowa Renewable Energy, LLC * Council Bluffs, IA corn 110.0 110.0
Sterling Ethanol, LLC Sterling, CO corn 42.0 42.0
Tate & Lyle Ft. Dodge, IA corn 105.0
Tate & Lyle Loudon, TN corn 67.0 67.0 38.0
Tharaldson Ethanol Casselton, ND corn 110.0 110.0
The Andersons Albion Ethanol LLC Albion, MI corn 55.0 55.0
The Andersons Clymers Ethanol, LLC Clymers, IN corn 110.0 110.0
The Andersons Marathon Ethanol, LLC Greenville, OH corn 110.0 110.0
Trenton Agri Products, LLC Trenton, NE corn 40.0 40.0
United Ethanol Milton, WI corn 52.0 52.0
United WI Grain Producers, LLC* Friesland, WI corn 49.0 49.0
Utica Energy, LLC Oshkosh, WI corn 48.0 48.0
VeraSun Energy Corporation (Total) 1,635.0 450.0
Albert City, IA corn
Charles City, IA corn
Dyersville, IA corn
Ft. Dodge, IA corn
Hartley, IA corn
Linden, IN corn
Lake Odessa, MI corn
Janesville, MN corn
Welcome, MN corn
Hankinson, ND corn
Albion, NE corn
Central City, NE corn
Ord, NE corn
Bloomingburg, OH corn
Aurora, SD corn
Verenium Jennings, LA Sugar Cane bagasse 1.5 1.5
Western New York Energy, LLC Shelby, NY corn 50.0 50.0
Western Plains Energy, LLC* Campus, KS corn 45.0 45.0
Western Wisconsin Renewable Energy, LLC* Boyceville, WI corn 40.0 40.0
White Energy Russell, KS milo/wheat starch 48.0 48.0
White Energy Hereford, TX corn/milo 100.0 100.0
White Energy Plainview, TX corn 110.0
Wind Gap Farms Baconton, GA brewery waste 0.4 0.4
Xethanol BioFuels, LLC Blairstown, IA corn 5.0 5.0
Yuma Ethanol Yuma, CO corn 40.0 40.0
TOTalS 12,475.4 10,569.4 2,066.0
* locally owned Updated: January 2009^ under construction or expanding

14
EThAnOLRFA.ORG: The homepage
for the RFA provides up to date information on federal
policies and regulations, industry statistics, and
current news events impacting this industry.
GOOdFUELs.ORG: Wanting to get
involved in the online discussion about renewable
fuels? GoodFuels offers a place to begin your dis-
cussion as well as links to other sites covering the
renewable fuels industry. In addition, daily emails
from GoodFuels alert subscribers to interesting and
important events of the day.
“OUR EnERGy FUTURE sTARTs AT hOME”: The RFA has
developed online video content that creatively fur-
thers our message of economic, environmental and
energy security through a green economy. View the
videos, download them for your use, or upload them
to your sites at www.EthanolRFA.org/energyfuture.
INNOVATING IN THE INFORMATION AGE
It is increasingly clear that Americans are getting
their information from sources other than the daily
newspaper and nightly news. To better educate the
public, America’s ethanol industry has recognized this
changing dynamic and is developing and improving
upon a number of online and digital tools to better
communicate our message.
152009 Ethanol Industry OUTLOOK
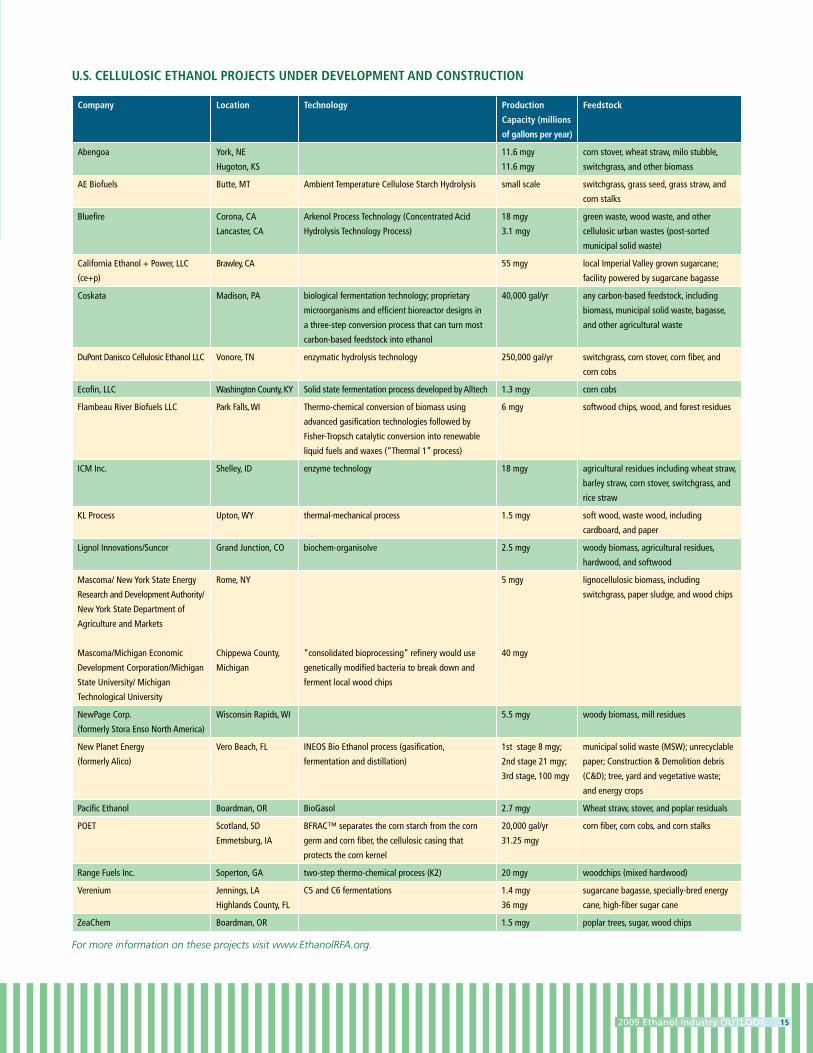
Company location Technology Production
Capacity (millions
of gallons per year)
feedstock
Abengoa York, NE
Hugoton, KS
11.6 mgy
11.6 mgy
corn stover, wheat straw, milo stubble,
switchgrass, and other biomass
AE Biofuels Butte, MT Ambient Temperature Cellulose Starch Hydrolysis small scale switchgrass, grass seed, grass straw, and
corn stalks
Bluefire Corona, CA
Lancaster, CA
Arkenol Process Technology (Concentrated Acid
Hydrolysis Technology Process)
18 mgy
3.1 mgy
green waste, wood waste, and other
cellulosic urban wastes (post-sorted
municipal solid waste)
California Ethanol + Power, LLC
(ce+p)
Brawley, CA 55 mgy local Imperial Valley grown sugarcane;
facility powered by sugarcane bagasse
Coskata Madison, PA biological fermentation technology; proprietary
microorganisms and efficient bioreactor designs in
a three-step conversion process that can turn most
carbon-based feedstock into ethanol
40,000 gal/yr any carbon-based feedstock, including
biomass, municipal solid waste, bagasse,
and other agricultural waste
DuPont Danisco Cellulosic Ethanol LLC Vonore, TN enzymatic hydrolysis technology 250,000 gal/yr switchgrass, corn stover, corn fiber, and
corn cobs
Ecofin, LLC Washington County, KY Solid state fermentation process developed by Alltech 1.3 mgy corn cobs
Flambeau River Biofuels LLC Park Falls, WI Thermo-chemical conversion of biomass using
advanced gasification technologies followed by
Fisher-Tropsch catalytic conversion into renewable
liquid fuels and waxes (“Thermal 1” process)
6 mgy softwood chips, wood, and forest residues
ICM Inc. Shelley, ID enzyme technology 18 mgy agricultural residues including wheat straw,
barley straw, corn stover, switchgrass, and
rice straw
KL Process Upton, WY thermal-mechanical process 1.5 mgy soft wood, waste wood, including
cardboard, and paper
Lignol Innovations/Suncor Grand Junction, CO biochem-organisolve 2.5 mgy woody biomass, agricultural residues,
hardwood, and softwood
Mascoma/ New York State Energy
Research and Development Authority/
New York State Department of
Agriculture and Markets
Mascoma/Michigan Economic
Development Corporation/Michigan
State University/ Michigan
Technological University
Rome, NY
Chippewa County,
Michigan
“consolidated bioprocessing” refinery would use
genetically modified bacteria to break down and
ferment local wood chips
5 mgy
40 mgy
lignocellulosic biomass, including
switchgrass, paper sludge, and wood chips
NewPage Corp.
(formerly Stora Enso North America)
Wisconsin Rapids, WI 5.5 mgy woody biomass, mill residues
New Planet Energy
(formerly Alico)
Vero Beach, FL INEOS Bio Ethanol process (gasification,
fermentation and distillation)
1st stage 8 mgy;
2nd stage 21 mgy;
3rd stage, 100 mgy
municipal solid waste (MSW); unrecyclable
paper; Construction & Demolition debris
(C&D); tree, yard and vegetative waste;
and energy crops
Pacific Ethanol Boardman, OR BioGasol 2.7 mgy Wheat straw, stover, and poplar residuals
POET Scotland, SD
Emmetsburg, IA
BFRAC™ separates the corn starch from the corn
germ and corn fiber, the cellulosic casing that
protects the corn kernel
20,000 gal/yr
31.25 mgy
corn fiber, corn cobs, and corn stalks
Range Fuels Inc. Soperton, GA two-step thermo-chemical process (K2) 20 mgy woodchips (mixed hardwood)
Verenium Jennings, LA
Highlands County, FL
C5 and C6 fermentations 1.4 mgy
36 mgy
sugarcane bagasse, specially-bred energy
cane, high-fiber sugar cane
ZeaChem Boardman, OR 1.5 mgy poplar trees, sugar, wood chips
U.S. CEllUlOSIC EThaNOl PROJECTS UNDER DEvElOPmENT aND CONSTRUCTION
For more information on these projects visit www.EthanolRFA.org.
16
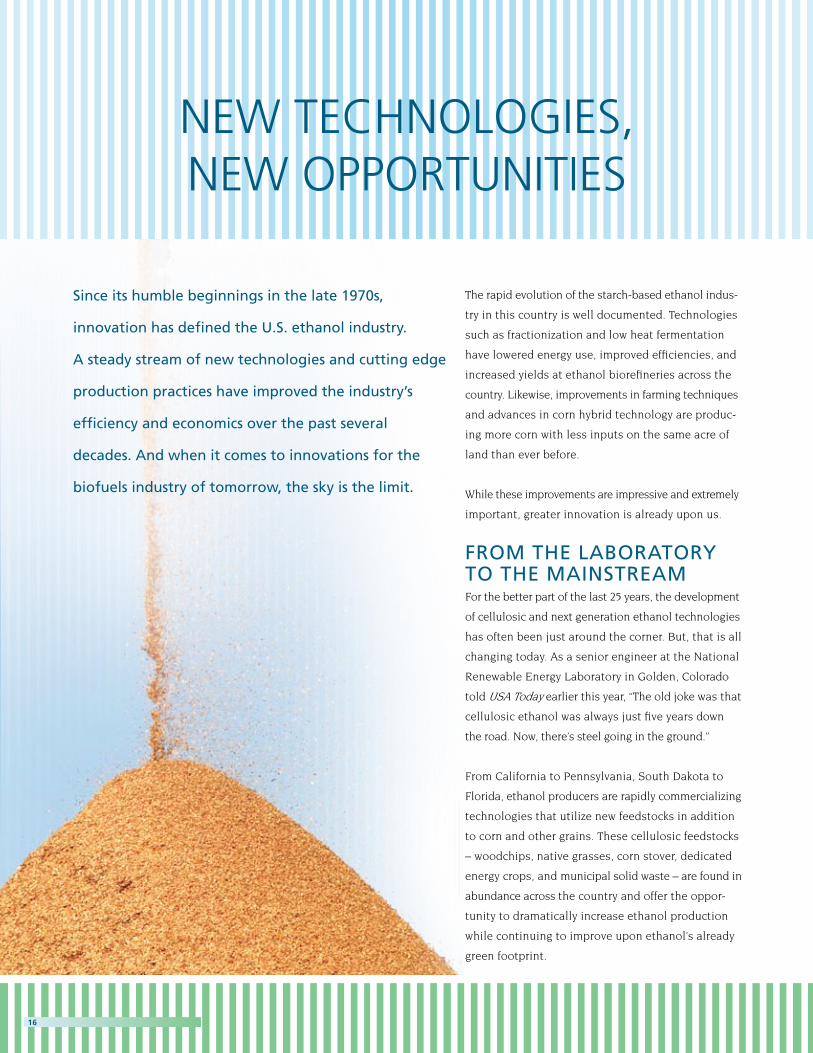
The rapid evolution of the starch-based ethanol indus-
try in this country is well documented. Technologies
such as fractionization and low heat fermentation
have lowered energy use, improved efficiencies, and
increased yields at ethanol biorefineries across the
country. Likewise, improvements in farming techniques
and advances in corn hybrid technology are produc-
ing more corn with less inputs on the same acre of
land than ever before.
While these improvements are impressive and extremely
important, greater innovation is already upon us.
FROM ThE LAbORATORy TO ThE MAInsTREAMFor the better part of the last 25 years, the development
of cellulosic and next generation ethanol technologies
has often been just around the corner. But, that is all
changing today. As a senior engineer at the National
Renewable Energy Laboratory in Golden, Colorado
told USA Today earlier this year, “The old joke was that
cellulosic ethanol was always just five years down
the road. Now, there’s steel going in the ground.”
From California to Pennsylvania, South Dakota to
Florida, ethanol producers are rapidly commercializing
technologies that utilize new feedstocks in addition
to corn and other grains. These cellulosic feedstocks
– woodchips, native grasses, corn stover, dedicated
energy crops, and municipal solid waste – are found in
abundance across the country and offer the oppor-
tunity to dramatically increase ethanol production
while continuing to improve upon ethanol’s already
green footprint.
NEW TECHNOLOGIES, NEW OPPORTUNITIES
since its humble beginnings in the late 1970s,
innovation has defined the U.s. ethanol industry.
A steady stream of new technologies and cutting edge
production practices have improved the industry’s
efficiency and economics over the past several
decades. And when it comes to innovations for the
biofuels industry of tomorrow, the sky is the limit.

172009 Ethanol Industry OUTLOOK
18Vero Beach, FL
25Highlands County, FL
24Jennings, LA
22Soperton, GA
8Vonore, TN
7Madison, PA
15Rome, NY
23Old Town, ME
11St. Joseph, MO
21Emmetsburg, IA
17Wisconsin Rapids, WI
10Park Falls, WI 16
Chippewa County, MI
2Hugoton, KS
1York, NE
5Lancaster, CA
4Corona, CA
6Brawley, CA
3Butte, MT
20Scotland, SD
14Grand Junction, CO
13Upton, WY
12Shelley, ID
19 | 26Boardman, OR
9Washington County, KY
U.S. CEllUlOSIC EThaNOl PROJECTS UNDER DEvElOPmENT aND CONSTRUCTION
1. ABENGOA Cornstover, wheat straw, milo stubble, switchgrass and other biomass.
2. ABENGOA
3. AE BiOfUELSSwitchgrass, grass seed, grass straw and corn stalks.
4. BLUEfiREGreen waste, wood waste, and other cellulosic urban wastes.
5. BLUEfiRE
6. CALifORNiA ETHANOL + POWER, LLCLocal Imperial Valley grown sugar-cane facility powered by sugarcane bagasse.
7. COSKATAAny carbon-based feedstock, including biomass, municipal solid waste, bagasse, and other agricultural waste.
8. DUPONT DANiSCO CELLULOSiC ETHANOL LLCSwitchgrass, corn stover and corn cobs.
9. ECOfiN, LLCCorn cobs.
10. fLAMBEAU RivER BiOfUELS LLCSoftwood chips, wood, and forest residues.
11. iCM iNC.Switchgrass, forage, sorghum, stover.
12. iOGEN CORP.Agricultural residues including wheat straw, barley straw, corn stover, switchgrass and rice straw.
13. KL PROCESSSoftwood, waste wood, including cardboard and paper.
14. LiGNOL iNNOvATiONSWoody biomass, agricultural resi-dues, hardwood and softwood.
15. MASCOMALignocellulosic biomass, including switchgrass, paper sludge, and wood chips.
16. MASCOMAConsolidated bioprocessing refinery using bacteria to break down and ferment local wood chips.
17. NEWPAGE CORP.Woody biomass, mill residues.
18. NEW PLANET ENERGyMunicipal solid waste (MSW); unrecyclable paper; construction & demolition debris; tree, yard and vegetative waste; and energy crops.
19. PACifiC ETHANOLWheat straw, stover, and poplar residuals.
20. POETCorn fiber, corn cobs and corn stalks.
21. POET
22. RANGE fUELS iNC.Wood residues and wood-based energy crops, grasses and corn stover.
23. RSE PULP & CHEMiCAL LLC Woodchips (mixed hardwood).
24. vERENiUMSugarcane bagasse and specially bred energy cane.
25. vERENiUM
26. ZEACHEMPoplar trees, sugar, and wood chips.
Examples of the innovation that defines
American ethanol production abound.
In Louisiana, cellulosic ethanol producer Verenium
has begun production of ethanol from sugar cane
bagasse. At just over one million gallons a year, this
demonstration facility is proving that the technology
works. In fact, Verenium has announced plans to
build a similar facility in south Florida.
In Nebraska, ethanol producer Abengoa is producing
ethanol from a wide variety of feedstocks including corn
stover, wheat straw, switchgrass, and other biomass.
The company is currently designing a full scale com-
mercial biorefinery to be located in Hugoton, Kansas.
In California, Indiana, and Pennsylvania, ethanol
companies Bluefire Ethanol and Coskata are devel-
oping technologies and choosing locations to build
large-scale ethanol production facilities that utilize
municipal solid waste as a feedstock.
In Georgia, Range Fuels has begun construction on
a commercial-scale ethanol biorefinery that will
utilize woodchips and other waste materials from
the state’s wood and paper industry to produce
clean-burning ethanol.
In dozens of other states across the country, com-
panies such as POET, Mascoma, New Planet Energy
and others are rapidly commercializing technologies
that will greatly expand the basket of feedstocks
from which ethanol is produced.
18
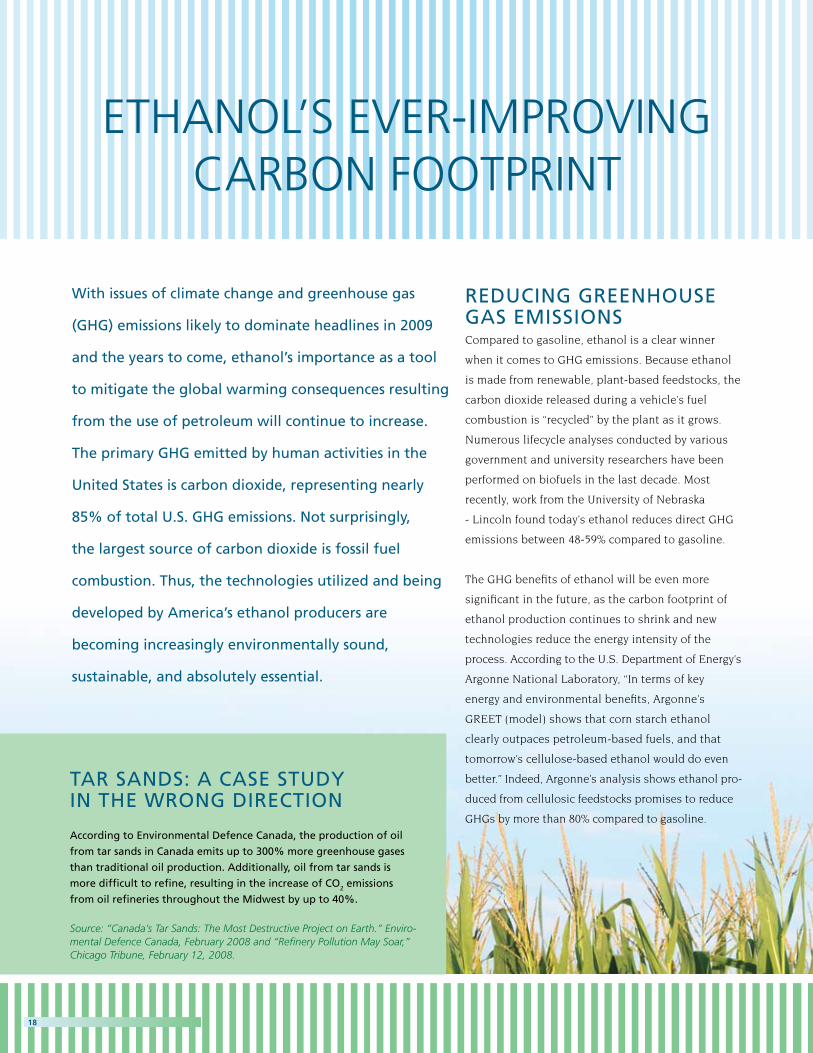
REdUcInG GREEnhOUsE GAs EMIssIOnsCompared to gasoline, ethanol is a clear winner
when it comes to GHG emissions. Because ethanol
is made from renewable, plant-based feedstocks, the
carbon dioxide released during a vehicle’s fuel
combustion is “recycled” by the plant as it grows.
Numerous lifecycle analyses conducted by various
government and university researchers have been
performed on biofuels in the last decade. Most
recently, work from the University of Nebraska
- Lincoln found today’s ethanol reduces direct GHG
emissions between 48-59% compared to gasoline.
The GHG benefits of ethanol will be even more
significant in the future, as the carbon footprint of
ethanol production continues to shrink and new
technologies reduce the energy intensity of the
process. According to the U.S. Department of Energy’s
Argonne National Laboratory, “In terms of key
energy and environmental benefits, Argonne’s
GREET (model) shows that corn starch ethanol
clearly outpaces petroleum-based fuels, and that
tomorrow’s cellulose-based ethanol would do even
better.” Indeed, Argonne’s analysis shows ethanol pro-
duced from cellulosic feedstocks promises to reduce
GHGs by more than 80% compared to gasoline.
ETHANOL’S EVER-IMPROVING CARBON FOOTPRINT
With issues of climate change and greenhouse gas
(GhG) emissions likely to dominate headlines in 2009
and the years to come, ethanol’s importance as a tool
to mitigate the global warming consequences resulting
from the use of petroleum will continue to increase.
The primary GhG emitted by human activities in the
United states is carbon dioxide, representing nearly
85% of total U.s. GhG emissions. not surprisingly,
the largest source of carbon dioxide is fossil fuel
combustion. Thus, the technologies utilized and being
developed by America’s ethanol producers are
becoming increasingly environmentally sound,
sustainable, and absolutely essential.
TAR sAnds: A cAsE sTUdy In ThE WROnG dIREcTIOn
According to Environmental defence canada, the production of oil
from tar sands in canada emits up to 300% more greenhouse gases
than traditional oil production. Additionally, oil from tar sands is
more difficult to refine, resulting in the increase of cO2 emissions
from oil refineries throughout the Midwest by up to 40%.
Source: “Canada’s Tar Sands: The Most Destructive Project on Earth.” Enviro-mental Defence Canada, February 2008 and “Refinery Pollution May Soar,” Chicago Tribune, February 12, 2008.
192009 Ethanol Industry OUTLOOK
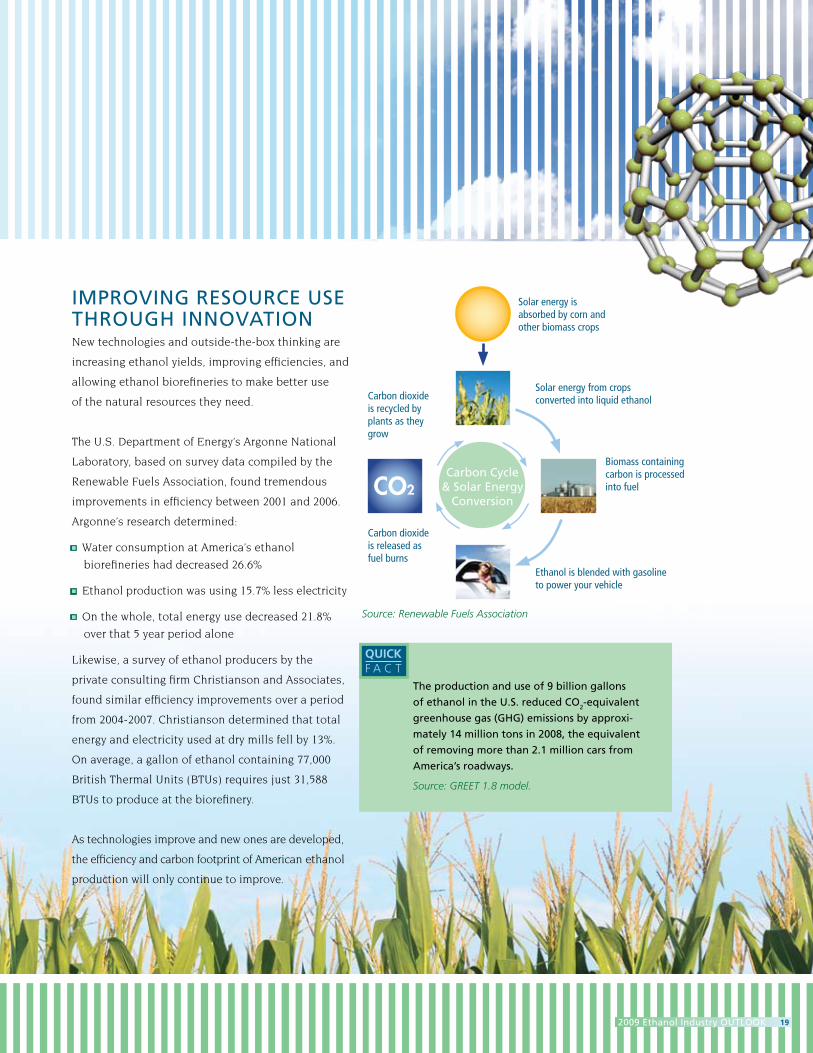
IMPROvInG REsOURcE UsE ThROUGh InnOvATIOnNew technologies and outside-the-box thinking are
increasing ethanol yields, improving efficiencies, and
allowing ethanol biorefineries to make better use
of the natural resources they need.
The U.S. Department of Energy’s Argonne National
Laboratory, based on survey data compiled by the
Renewable Fuels Association, found tremendous
improvements in efficiency between 2001 and 2006.
Argonne’s research determined:
n Water consumption at America’s ethanol
biorefineries had decreased 26.6%
n Ethanol production was using 15.7% less electricity
n On the whole, total energy use decreased 21.8%
over that 5 year period alone
Likewise, a survey of ethanol producers by the
private consulting firm Christianson and Associates,
found similar efficiency improvements over a period
from 2004-2007. Christianson determined that total
energy and electricity used at dry mills fell by 13%.
On average, a gallon of ethanol containing 77,000
British Thermal Units (BTUs) requires just 31,588
BTUs to produce at the biorefinery.
As technologies improve and new ones are developed,
the efficiency and carbon footprint of American ethanol
production will only continue to improve.
The production and use of 9 billion gallons
of ethanol in the U.s. reduced cO2-equivalent
greenhouse gas (GhG) emissions by approxi-
mately 14 million tons in 2008, the equivalent
of removing more than 2.1 million cars from
America’s roadways.
Source: GREET 1.8 model.
QUiCK F A C T
Source: Renewable Fuels Association
carbon cycle & solar Energy
conversion
Biomass containing carbon is processed into fuel
Carbon dioxide is recycled by plants as they grow
Carbon dioxide is released as fuel burns
Solar energy is absorbed by corn and other biomass crops
Solar energy from crops converted into liquid ethanol
Ethanol is blended with gasoline to power your vehicle
CO2

20
Known as land use change, this debate focuses on
whether using corn and other grains for ethanol pro-
duction in the U.S. and around the world is resulting
in the clearing of rain forests and other native lands.
Cultivation of these environmentally-sensitive lands
would release carbon into the atmosphere that has been
stored in the soil. Therefore, the question is to what
extent, if any, the production of ethanol in the U.S. is
responsible for the decisions to utilize these virgin
lands by people and governments around the world.
And, if it is responsible, how much of the carbon released
should be counted against U.S. ethanol production
as part of a lifecycle greenhouse gas emission analysis?
This debate over the causes and effects of land use
change has serious implications for the future of
the U.S. ethanol industry. As required by
the 2007 energy bill, the U.S. Environ-
mental Protection Agency (EPA)
is establishing a methodology
for determining the lifecycle
greenhouse gas (GHG) emis-
sions from the production of
various biofuels, including GHGs from so-called
indirect land use changes. Too often, sensationalism
supersedes science in this debate. Determining the
impact, if any, of ethanol production on land use de-
cisions elsewhere in the world is imprecise and must
include a comprehensive analysis and accounting of
a host of factors.
Minimal use of farmland for biofuels production.
“Despite increases in the amount of coarse grains being
used for ethanol, the amount of land dedicated to
coarse grains (corn, grain sorghum, barley, oats, rye,
and millet) production globally has decreased over
the past 30 years. Global area for coarse grains has
decreased 8 percent since 1980, while world grain
ethanol production has increased dramatically. Global
coarse grains area peaked at 349 million hectares in
1981 and is estimated at 313 million hectares in 2008,”
according to the U.S. Department of Agriculture.
In fact, the total net amount of cropland dedicated
to American ethanol production in 2007 was just
0.6% of total cropland worldwide, an area roughly
the size of West Virginia.
ETHANOL AND LAND USE
With carbon emissions front and center in the policy
debates in Washington, the role of ethanol and other
biofuels is a hot topic. In particular, the impact of
increasing ethanol production on land use decisions
by people in nations around the world has drawn
the spotlight.
The amount of agricultural land required to
produce 15 billion gallons of grain ethanol in
the United states by 2015, as required by the
2007 Energy Independence and security Act
(EIsA), is likely to be less than 1 percent of
total world cropland.
Source: “Understanding Land Use Change and U.S. Ethanol Expansion,” Renewable Fuels Association.
QUiCK F A C T

212009 Ethanol Industry OUTLOOK
Global agriculture’s increasing productivity
is meeting rising demand.
Production agriculture, particularly in the United
States, has dramatically increased its productivity
through the use of technology. For example, using
average global corn yields from 40 years ago (1967),
more than 330 million hectares would be required
to produce the world corn crop grown on 158 million
hectares in 2007. In other words, it would have taken
more than twice as much land in 1967 to grow a
crop equivalent in size to the 2007 world corn crop.
Arable farmland is available for sustainably
increased production.
Though it seems unlikely that significant amounts of
land will be needed to support future growth of the
U.S. biofuels industry, vast amounts of land are
available, if needed, for agricultural expansion.
A report by the Food and Agriculture Organization
(FAO) of the U.N. found:
“There is still potential agricultural land that is as
yet unused. At present some 1.5 billion [hectares] of
land is used for arable and permanent crops, around
11% of the world’s surface area. A new assessment
by FAO and the International Institute for Applied
Systems Analysis (IIASA) of soils, terrains and
climates compared with the needs of and for major
crops suggests that a further 2.8 billion [hectares]
are to some degree suitable for rainfed production.
This is almost twice as much as is currently farmed.”
Ethanol feed co-products contribute
substantially to the global feed market and
provide a considerable land use “credit.”
One hectare of corn used for ethanol produces more
than 1000 gallons of fuel as well as an amount of feed
equivalent to the volume of corn coming from 30%
of a corn dedicated hectare and the amount of soy-
bean meal from 50% of a soybean dedicated hectare.
2008 U.S. EThaNOl PRODUCTION REqUIRED lESS ThaN 1% Of glOBal CROPlaND (Million Acres)
ThE bOTTOM LInE On LAnd UsE chAnGE“based on available projections, we think crop yields will continue to improve (especially in the U.s., but also elsewhere), and that this should be properly incorporated into the land use change analysis. secondly, we believe new government analysis shows that the land use credit for feed co-products coming from corn-based ethanol production is much higher than 33%. When these factors are incorporated into land use change analysis, as we have done in this study, no new pasture or forest land will need to be converted in the U.s. or outside the U.s. to meet the 15 bgy RFs require-ment for corn ethanol in 2015. Thus, the GhG emissions from land use change due to expansion of U.s. corn-based ethanol to meet the RFs are likely zero.”
Source: “Land Use Effects of Corn-Based Ethanol in the United States,” Tom Darlington, Air Improvement Resource, Inc., 2009.
Global Arable Land Area (3,510 acres)
Global Major crop Area (2,160 acres)
U.s. crop Area (445 acres)
2008 U.s. corn Area (86 acres)
2008 U.s. corn Ethanol Area (net distillers Grains) (14.5 acres)
22
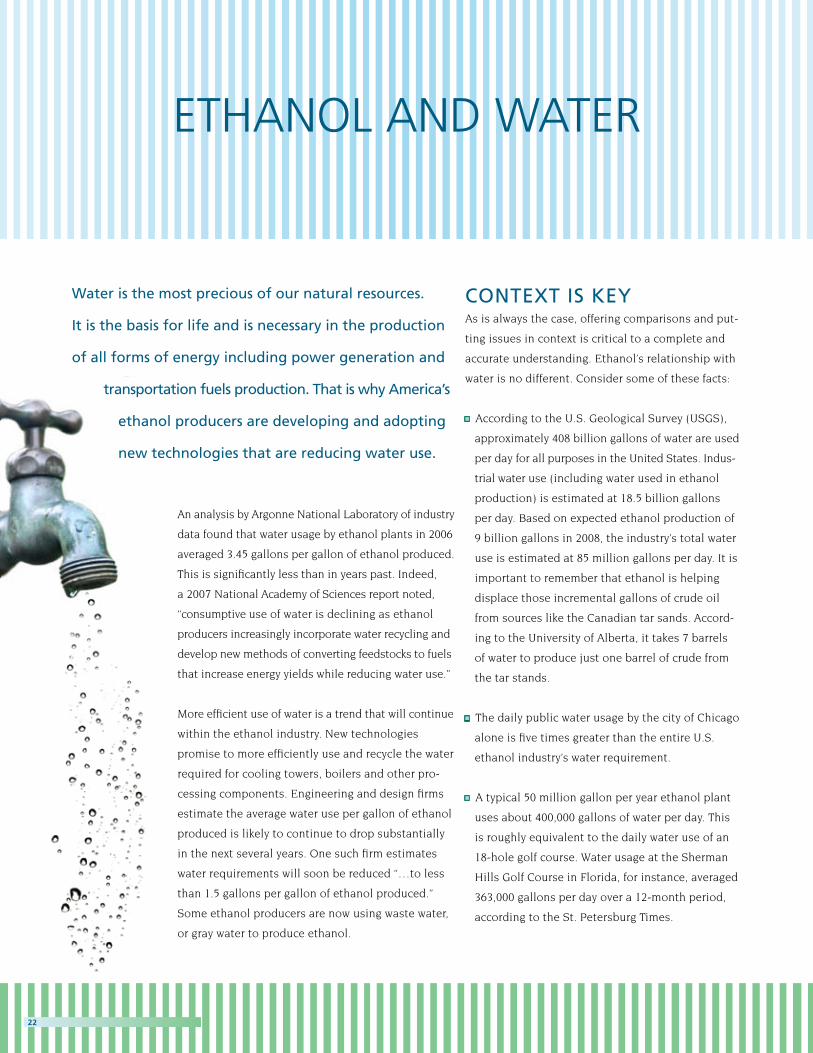
ETHANOL AND WATER
An analysis by Argonne National Laboratory of industry
data found that water usage by ethanol plants in 2006
averaged 3.45 gallons per gallon of ethanol produced.
This is significantly less than in years past. Indeed,
a 2007 National Academy of Sciences report noted,
“consumptive use of water is declining as ethanol
producers increasingly incorporate water recycling and
develop new methods of converting feedstocks to fuels
that increase energy yields while reducing water use.”
More efficient use of water is a trend that will continue
within the ethanol industry. New technologies
promise to more efficiently use and recycle the water
required for cooling towers, boilers and other pro-
cessing components. Engineering and design firms
estimate the average water use per gallon of ethanol
produced is likely to continue to drop substantially
in the next several years. One such firm estimates
water requirements will soon be reduced “…to less
than 1.5 gallons per gallon of ethanol produced.”
Some ethanol producers are now using waste water,
or gray water to produce ethanol.
Water is the most precious of our natural resources.
It is the basis for life and is necessary in the production
of all forms of energy including power generation and
transportation fuels production. That is why America’s
ethanol producers are developing and adopting
new technologies that are reducing water use.
cOnTExT Is KEyAs is always the case, offering comparisons and put-
ting issues in context is critical to a complete and
accurate understanding. Ethanol’s relationship with
water is no different. Consider some of these facts:
n According to the U.S. Geological Survey (USGS),
approximately 408 billion gallons of water are used
per day for all purposes in the United States. Indus-
trial water use (including water used in ethanol
production) is estimated at 18.5 billion gallons
per day. Based on expected ethanol production of
9 billion gallons in 2008, the industry’s total water
use is estimated at 85 million gallons per day. It is
important to remember that ethanol is helping
displace those incremental gallons of crude oil
from sources like the Canadian tar sands. Accord-
ing to the University of Alberta, it takes 7 barrels
of water to produce just one barrel of crude from
the tar stands.
n The daily public water usage by the city of Chicago
alone is five times greater than the entire U.S.
ethanol industry’s water requirement.
n A typical 50 million gallon per year ethanol plant
uses about 400,000 gallons of water per day. This
is roughly equivalent to the daily water use of an
18-hole golf course. Water usage at the Sherman
Hills Golf Course in Florida, for instance, averaged
363,000 gallons per day over a 12-month period,
according to the St. Petersburg Times.

232009 Ethanol Industry OUTLOOK
n According to the National Renewable Energy
Laboratory (NREL), “Water use ranges between
65 and 90 gallons per barrel of crude oil processed
and wastewater discharge ranges between 20 and
40 gallons, leaving 45 to 50 gallons of water con-
sumed per barrel, or 2 to 2.5 gallons of water per
gallon of gasoline.”1 Thus, using NREL’s conservative
estimate, the current per-gallon water requirement
for gasoline is similar to that of ethanol. But the
aggregate quantity of water required to produce
the gasoline consumed in the United States is
nearly 1 billion gallons per day.
n It is true that corn requires large amounts of water
to grow; a bushel of corn needs approximately 4,000
gallons of water in a growing season. But what often
goes unreported is that nearly nine out of every 10 corn
acres in the United States are rain-fed and require
no irrigation other than natural rainfall. Further,
because most ethanol production occurs in the
central Corn Belt where corn is primarily rain-fed,
NREL says “As much as 96% of the field corn used
for ethanol production is not irrigated at all.”2
n Additionally, much of the water taken into a corn
plant is released back into the air through transpira-
tion. In fact, one acre of corn gives off about 4,000
gallons of water per day through evapo-transpira-
tion, according to the USGS.
1 Aden. “Water Usage for Current and Future Ethanol Production.” http://epw.senate.gov/public/index.cfm?FuseAction=Files.View&FileStore_id=3d2f1427-d51d-4a54-8739-166853ee1c44
2 Aden.
IMPORTAnT WATER FAcTs
n 3 gallons of water are required to produce a gallon of ethanol.
n 2-2.5 gallons of water are required to produce a gallon of gasoline, which is similar to that of ethanol (3 gallons). some estimates suggest as much as 8 gallons of water are needed to refine a gallon of gasoline.
n 4 gallons of water are needed to produce a pound of hamburger.
n 11.6 gallons of water are needed to produce one pound of chicken.
n A typical 40 MGy ethanol plant uses an amount of water daily that is equivalent to the daily water use of a standard 18-hole golf course.
n 3/5 gallon of water is required per kilowatt hour at a coal fired power plant (1 kWh is required for a 100 watt light bulb to burn for 10 hours).
n 3/4 of a gallon of water is required per kilowatt hour at a nuclear power plant.
n 300 million gallons of water are needed to produce a single day’s supply of U.s. newsprint.
Source: U.S. Geological Survey, National Renewable Energy Laboratory.

nOT A byPROdUcT; A cO-PROdUcTFeed co-products represent an increasingly important
share of profit opportunities for ethanol producers.
The estimated market value of feed co-products from
ethanol production in 2007/08 was $3 billion. An
estimated additional $1.7 billion was realized through
sales of corn oil, a high value co-product of the wet mill
ethanol process. In recent years, ethanol co-product
feeds have typically been priced at a discount to the
feed ingredients they replace, meaning livestock and
poultry feeders often take advantage of the value of
these products in least-cost ration formulations.
FEEDING THE WORLD, FUELING A NATION
In 2008, U.s. ethanol producers utilized approximately
3.2 billion bushels of corn to produce nearly 27 million
tons of high quality livestock feed (23 million metric
tons of distillers grains, 3 million metric tons of corn
gluten feed, and 600,000 metric tons of corn gluten
meal) and 9 billion gallons of clean burning, renewable
ethanol. To put these production volumes in context,
consider that the amount of feed produced by the
ethanol industry in 2008 is roughly equivalent to the
combined annual amount of total feed consumed
by cattle on feed in Texas, Kansas, nebraska, and
colorado—the nation’s four largest fed cattle states.
Source: Renewable Fuels Association
24
0
5000
10000
15000
20000
25000
30000
Thou
sand
Met
ric T
ons
08-0
9*
07-0
8
06-0
7
05-0
6
04-0
5
03-0
4
02-0
3
01-0
2
00-0
1
99-0
0
98-9
9
97-9
8
96-9
7
95-9
6
94-9
5
93-9
4
92-9
3
91-9
2
90-9
1
Corn Gluten Meal
Corn Gluten Feed
Distillers Grains
PRODUCTION Of U.S. EThaNOl fEED CO-PRODUCTS
* Estimate

252009 Ethanol Industry OUTLOOK
In addition, ethanol producers are investing in new
technologies to improve the quality and quantity
of the livestock feed they produce. For instance, a
number of dry mills are installing technology that
allows them to separate crude corn oil from the still-
age on the back end of the process. This crude corn
oil can be sold into the feed market (particularly for
poultry), further refined and sold into the human
food market, or used as a feedstock for biodiesel.
Dry fractionation, a process to separate the corn germ
and other components from the starch on the front
end of the ethanol process, is another technology
that is emerging in the dry mill ethanol industry.
This separation allows ethanol producers more
flexibility in feed manufacturing and potentially
provides customers with products that are more
tailored to their specific nutritional needs.
Animal scientists and nutritionists are also participating
in the innovation process, continually studying the
feeding of ethanol feed co-products to animals.
Though beef, dairy, swine and poultry have been the
primary consumers of these co-products historically,
an increasing amount of research is being conducted
that examines the effects of feeding co-products to
other species, such as goats, sheep, and fish. The use
of ethanol co-products in human food applications
is another area of increasing scientific interest.
While new technologies and practices promise to
change the complexion of the ethanol co-products
market in the years ahead, one certainty exists
about the future of feed co-products: the ethanol
industry will continue to take very seriously its role
as a producer of safe, quality feed.
ThE EThaNOl PRODUCTION PROCESS (Dry Mill)
Corn Delivered to Plant Grinder Cookers
CO2 Scrubber
Fermenter
Distillation Columns
Molecular Sieve Ethanol Storage
Ethanol Transported to Market
Wet Stillage or Syrup to MarketThin Stillage or Syrup to Market
Centrifuge
Distillers Grain to Market Rotary Drum Dryer
Evaporation System

26
The facts surrounding the misnamed and emotionally
charged “food versus fuel” debate reveal there is no
need to choose between using grain for feed and
food or using grain for fuel. American farmers and
ethanol producers can do both.
The fallacy of the “food versus fuel” debate was fully
exposed by the end of 2008, a full year after the public
relations campaign against ethanol had been waged.
By late 2008, the prices of agricultural commodities
like corn had fallen by some 60% compared to highs
seen in June. At the same time, ethanol production
continued to increase. The fact that food prices con-
tinued to rise while agricultural commodity prices
plunged and ethanol production continued to increase
in the second half of 2008 is proof that grain and other
farm products play a minor role in retail food prices.
FOOD AND FUEL: DISPELLING THE MYTHS
Bu
shel
s/A
cre
170
160
150
140
130
120
110
100
90
80
70
60
50
1974
1976
1978
1980
1986
1988
1990
1994
1998
2000
2002
2004
2006
2008
hISTORIC U.S. CORN YIElD
driven by the American public’s demand for alternatives
to high-priced foreign oil, the production of ethanol in
the United states has more than tripled since 2003. This
dramatic increase led some to erroneously manufacture
hysteria and panic about the relationship between
ethanol production and food. This orchestrated public
relations hysteria sought to “obliterate” the well-
documented economic and environmental benefits of
expanded biofuels production by sensationally pitting
ethanol production against food prices in the grocery
store and feeding people around the world.
272009 Ethanol Industry OUTLOOK
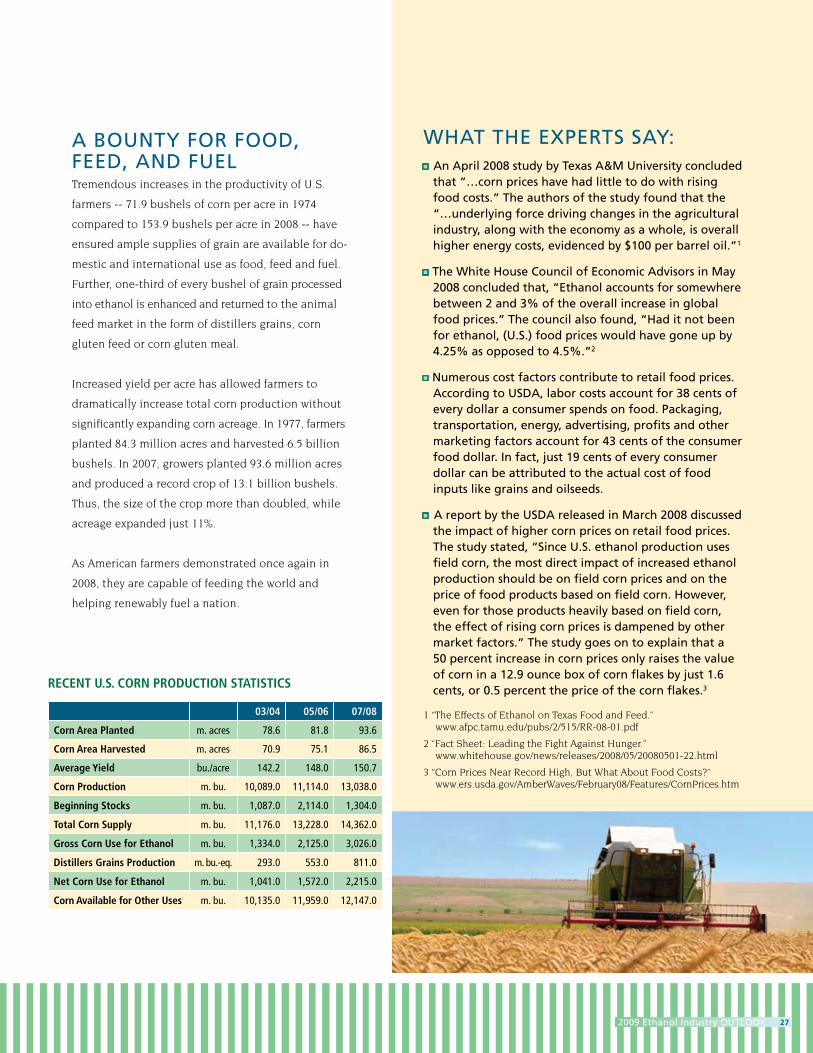
03/04 05/06 07/08
Corn area Planted m. acres 78.6 81.8 93.6
Corn area harvested m. acres 70.9 75.1 86.5
average Yield bu./acre 142.2 148.0 150.7
Corn Production m. bu. 10,089.0 11,114.0 13,038.0
Beginning Stocks m. bu. 1,087.0 2,114.0 1,304.0
Total Corn Supply m. bu. 11,176.0 13,228.0 14,362.0
gross Corn Use for Ethanol m. bu. 1,334.0 2,125.0 3,026.0
Distillers grains Production m. bu.-eq. 293.0 553.0 811.0
Net Corn Use for Ethanol m. bu. 1,041.0 1,572.0 2,215.0
Corn available for Other Uses m. bu. 10,135.0 11,959.0 12,147.0
RECENT U.S. CORN PRODUCTION STaTISTICS
A bOUnTy FOR FOOd, FEEd, And FUEL Tremendous increases in the productivity of U.S.
farmers -- 71.9 bushels of corn per acre in 1974
compared to 153.9 bushels per acre in 2008 -- have
ensured ample supplies of grain are available for do-
mestic and international use as food, feed and fuel.
Further, one-third of every bushel of grain processed
into ethanol is enhanced and returned to the animal
feed market in the form of distillers grains, corn
gluten feed or corn gluten meal.
Increased yield per acre has allowed farmers to
dramatically increase total corn production without
significantly expanding corn acreage. In 1977, farmers
planted 84.3 million acres and harvested 6.5 billion
bushels. In 2007, growers planted 93.6 million acres
and produced a record crop of 13.1 billion bushels.
Thus, the size of the crop more than doubled, while
acreage expanded just 11%.
As American farmers demonstrated once again in
2008, they are capable of feeding the world and
helping renewably fuel a nation.
WhAT ThE ExPERTs sAy:n An April 2008 study by Texas A&M University concluded
that “…corn prices have had little to do with rising food costs.” The authors of the study found that the “…underlying force driving changes in the agricultural industry, along with the economy as a whole, is overall higher energy costs, evidenced by $100 per barrel oil.”1
n The White house council of Economic Advisors in May 2008 concluded that, “Ethanol accounts for somewhere between 2 and 3% of the overall increase in global food prices.” The council also found, “had it not been for ethanol, (U.s.) food prices would have gone up by 4.25% as opposed to 4.5%.”2
n numerous cost factors contribute to retail food prices. According to UsdA, labor costs account for 38 cents of every dollar a consumer spends on food. Packaging, transportation, energy, advertising, profits and other marketing factors account for 43 cents of the consumer food dollar. In fact, just 19 cents of every consumer dollar can be attributed to the actual cost of food inputs like grains and oilseeds.
n A report by the UsdA released in March 2008 discussed the impact of higher corn prices on retail food prices. The study stated, “since U.s. ethanol production uses field corn, the most direct impact of increased ethanol production should be on field corn prices and on the price of food products based on field corn. however, even for those products heavily based on field corn, the effect of rising corn prices is dampened by other market factors.” The study goes on to explain that a 50 percent increase in corn prices only raises the value of corn in a 12.9 ounce box of corn flakes by just 1.6 cents, or 0.5 percent the price of the corn flakes.3
1 “The Effects of Ethanol on Texas Food and Feed.” www.afpc.tamu.edu/pubs/2/515/RR-08-01.pdf
2 “Fact Sheet: Leading the Fight Against Hunger.” www.whitehouse.gov/news/releases/2008/05/20080501-22.html
3 “Corn Prices Near Record High, But What About Food Costs?” www.ers.usda.gov/AmberWaves/February08/Features/CornPrices.htm

28
This increase in global production will find a home
as many nations this year implemented renewable
fuel use requirements. Even as ethanol’s opponents
were spending millions attempting to sully ethanol’s
reputation, Canada, the European Union and other
nations forged on adopting requirements for
renewable fuel use of their own.
According to the International Energy Agency, the
growth of ethanol production worldwide has led
to a 1 million barrel per day decrease in global oil
demand. As a result, as an analyst from Merrill
Lynch noted, the increasing reliance on ethanol
helped keep oil prices from spiking even more than
we experienced last year.
Clearly, the importance of robust, domestic
renewable fuels industries is being realized by
countries across the globe. As the world market for
ethanol expands, opportunities for increased trade,
technology development, and increased economic
activity will abound. U.S. ethanol producers remain
committed to working with our international
colleagues to ensure these opportunities come to
fruition. After all, there is much more that unites the
global biofuels community than divides us.
GLOBALIzING THE ETHANOL MARKETPLACE
Innovations in ethanol production technologies and
markets have led to an increasing role for ethanol
in fuel supplies around the globe. Governments from
Europe to canada to the Phillipines to India are
embracing domestic ethanol industries that promise
economic opportunities, environmental benefits and
greater energy (and therefore national) security.
The investments made by these nations in their
domestic renewable fuels industries can be seen in
the record volume of ethanol production in 2008:
17.3 billion gallons.
292009 Ethanol Industry OUTLOOK
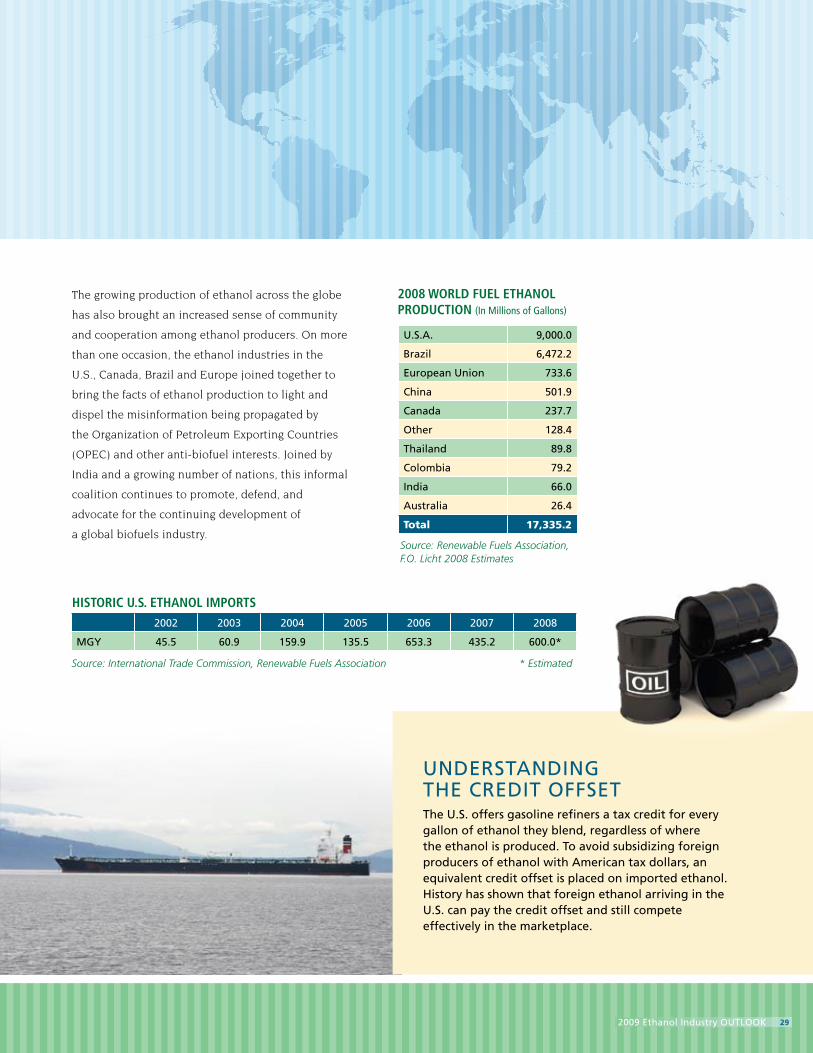
The growing production of ethanol across the globe
has also brought an increased sense of community
and cooperation among ethanol producers. On more
than one occasion, the ethanol industries in the
U.S., Canada, Brazil and Europe joined together to
bring the facts of ethanol production to light and
dispel the misinformation being propagated by
the Organization of Petroleum Exporting Countries
(OPEC) and other anti-biofuel interests. Joined by
India and a growing number of nations, this informal
coalition continues to promote, defend, and
advocate for the continuing development of
a global biofuels industry.
U.s.A. 9,000.0
brazil 6,472.2
European Union 733.6
china 501.9
canada 237.7
Other 128.4
Thailand 89.8
colombia 79.2
India 66.0
Australia 26.4
Total 17,335.2
2008 wORlD fUEl EThaNOl PRODUCTION (In Millions of Gallons)
Source: Renewable Fuels Association, F.O. Licht 2008 Estimates
2002 2003 2004 2005 2006 2007 2008
MGy 45.5 60.9 159.9 135.5 653.3 435.2 600.0*
hISTORIC U.S. EThaNOl ImPORTS
Source: International Trade Commission, Renewable Fuels Association * Estimated
UndERsTAndInG ThE cREdIT OFFsETThe U.s. offers gasoline refiners a tax credit for every gallon of ethanol they blend, regardless of where the ethanol is produced. To avoid subsidizing foreign producers of ethanol with American tax dollars, an equivalent credit offset is placed on imported ethanol. history has shown that foreign ethanol arriving in the U.s. can pay the credit offset and still compete effectively in the marketplace.

30
As the national trade association for the U.S. fuel
ethanol industry, the Renewable Fuels Association
(RFA) has been the “Voice of the Ethanol Industry”
since 1981. The RFA serves as a vital link between the
ethanol industry and the federal government, including
Congress and the administration, to promote increased
production and use of ethanol through supportive
policies, regulations, and research and development
initiatives. The RFA also works with state governments,
agriculture, petroleum, environmental and public inter-
est groups, and ethanol advocates across the country.
The RFA is recognized nationwide as a highly effective
and professional organization dedicated to the
continued vitality and growth of ethanol in the fuel
marketplace. The RFA hosts the annual National
Ethanol Conference: Policy & Marketing.
MEMbERshIPRFA membership includes a broad cross-section
of businesses and organizations dedicated to the
expansion of the U.S. fuel ethanol industry.
Membership includes:
n Producer Members (public and private companies
and farmer-owned cooperatives)
n Prospective Producer Members (plants under
construction and development)
n Associate Members (companies that provide prod-
ucts and services to the industry)
n Supporting Members (non-profit organizations,
academia and government entities)
The RFA is governed by a Board of Directors comprised of
a representative from each producer member. The Board
meets several times a year to set Association policy.
bEnEFITs OF MEMbERshIPBenefits of membership include providing input
on RFA policies, activities, and priorities through
participation in RFA meetings, timely industry alerts
and issue briefs, industry publications and studies,
access to technical guidelines and specifications for
plant operations and blending, reduced registration
fee for the National Ethanol Conference, and links
from the RFA web site at www.ethanolRFA.org.
RFA cOMMITTEEsWithin the association, the RFA has a host of
committees that address issues ranging from blending
and performance standards to safety concerns to
the development of cellulosic ethanol technology.
The committees include:
TEchnIcAL cOMMITTEE
EnvIROnMEnTAL cOMMITTEE
cELLULOsE cOMMITTEE
MEMbERshIP cOMMITTEE
cO-PROdUcTs cOMMITTEE
PLAnT & EMPLOyEE sAFETy cOMMITTEE
For membership information,
call 202.289.3835 or log on to
www.ethanolRfA.org.

312009 Ethanol Industry OUTLOOK
The Renewable Fuels Foundation (RFF) is dedicated
to meeting the educational, research, and strategic
planning needs of the U.S. fuel ethanol industry.
The goal is to assure a growing and healthy renewable
fuels industry well into the future. The focus of the
RFF is on academia, industry and public policy
makers as we address issues related to new uses,
new feedstocks, and new technologies that will
impact the future of ethanol.
To achieve its goals, the RFF is partnering with
the National FFA Organization to support the
establishment of a Renewable Energy Learning
Center for high school students. Additionally, the
RFF is working with two-and four-year colleges to
develop programs of study directly related to the
ethanol industry.
RFA sTAFFGeoff Cooper Vice President, Research and Analysis
Julia DaviesMembership Coordinator
Bob Dinneen President & CEO
Mary Giglio Special Assistant to the President
Matt HartwigCommunications Director
Jaclyn HellingCommunications Specialist
Edward S. Hubbard, Jr., Esq. Director, Government Affairs, Tax and International Trade
Christina MartinExecutive Vice President
Kristy Moore Director, Technical Services
Taryn MorganAdministrative Assistant
Alex ObuchowskiChief Financial Officer
Jim ReddingVice President, Industry Relations
Anne RhineOffice Manager
Missy RuffMarket Development Manager
Samantha SlaterVice President, Government Affairs
Robert White Director, Market Development
RFF OFFIcERsMike JerkeChairmanQuad County Corn Processors
Bob SatherVice ChairmanAce Ethanol, LLC
Mick HendersonTreasurerCommonwealth Agri-Energy, LLC
Neil KoehlerSecretaryPacific Ethanol, Inc.
Bob DinneenPresidentRenewable Fuels Association
Absolute Energy, LLC www.absenergy.org
Advanced BioEnergy, LLC www.advancedbioenergy.com
AE Biofuels, inc. www.aebiofuels.com
Alico inc. www.alicoinc.com
Alpha Holdings, LLC www.alphaholdingsllc.com
Alternative Energy Sources, inc. www.aensi.com
American Ethanol, inc. www.americasethanol.com
BioEnergy international, LLC www.bioenergyllc.com
Biofuel Energy, LLC www.bfenergy.com
Bioverda US Holdings LLC www.ntr.ie
Blue River Ethanol, LLC Bluefire Ethanol, inc. www.bluefireethanol.com
Buckeye Ethanol, LLC Buffalo Ridge Energy www.buffaloridgeenergy.com
Bunge North America www.bungenorthamerica.com
California Ethanol & Power, LLC www.californiaethanolpower.com
Cardinal Ethanol, LLC www.cardinalethanol.com
Cascade Grain Products, LLC www.cascadegrain.com
Central Bio-Energy, LLC www.centralbioenergy.com
Cilion www.cilion.com
Corn, LP www.cornlp.com
Didion Ethanol, LLC www.didionmilling.com
E85, inc. www.e85.com
Earth friendly fuels, LLC www.earthfriendlyfuels.net
Empire Biofuels, LLC www.empiregreenbiofuels.com
Empire State Ethanol & Energy, LLC www.ese2.us
Ethanex Energy, inc. www.ethanexenergy.com
first United Ethanol, LLC www.firstunitedethanol.com
Great Western Ethanol, LLC www.greatwesternethanol.com
Green Plains Renewable Energy, inc. www.gpreethanol.com
Gulf Coast Ethanol, inc.
GvE Management, inc. Harvest Biofuels LLC www.harvestbiofuels.net
Heron Lake BioEnergy, LLC www.heronlakebioenergy.com
illini Bio-Energy, LLC www.illinibioenergy.com
indiana Bio-Energy, LLC iogen Corp. www.iogen.ca
King & Taylor Losonoco inc. www.losonoco.com
Mid America Bio Energy & Commodities Midwest Ethanol Producers LLC www.midwestethanol.com
North American Alcohols, inc. North Eastern illinois Ethanol Developers LLC www.neiedethanol.com
Northern Ethanol inc. www.northern-ethanol.com
Osage Bio Energy www.osagebioenergy.com
Pacific West Energy, LLC www.pacificwestenergy.com
Panda Ethanol, inc. www.pandaethanol.com
Patriot Renewable fuels LLC www.patriotrenewablefuels.com
Penford Products Company www.penx.com
Permolex international LP www.permolex.com
Primesouth inc. www.primesouth.biz
Range fuels, inc. www.rangefuels.com
Rawhide Management www.rawhideenergy.com
River/Gulf Energy, LLC www.rivergulfenergy.com
Rocky Mountain Ethanol, LLC Sendero Matagorda Renewable Energy www.sendero.biz
Sumlin Holdings inc. SWi Energy, LLC www.greeninvgroup.com
Tharaldson Ethanol Plant i, LLC US Canadian Biofuels, inc. www.uscbiofuels.net
ZeaChem inc. www.zeachem.com
RFA PROsPEcTIvE PROdUcER MEMbERs
Bemidji State University www.bemidjistate.edu
Buckeye Renewable fuels Association City of Alma (Mi) www.ci.alma.mi.us
Clean fleets Coalition Coloradans for Clean Air Colorado farm Bureau www.colofb.com
Corn Marketing Program of Michigan www.micorn.org
Dfi Group, inc. www.dfigroup.com
Distillers Grains Technology Council www.distillersgrains.org
Downstream Alternatives Dumas Economic Development Corp. www.dumasedc.org
Ethanol General Corporation Ethanol Producers and Consumers www.ethanolmt.org
florida international University - Applied Research Center www.arc.fiu.edu
illinois Corn Growers Association www.ilcorn.org
illinois institute for Rural Affairs www.iira.org
indiana Biofuels Alliance www.inagribiz.org
iowa Lakes Community College www.iowalakes.edu
iowa State University www.iastate.edu
Jamestown/Stutsman Development Corp. www.growingjamestown.com
JETRO Houston www.jetro.org
Kansas Association of Ethanol Processors www.ethanolkansas.org
Maryland Grain Producers Utilization Board www.marylandgrain.com
Michigan State University - Department of Agricultural Economics www.aec.msu.edu/agecon
Mid-America Consultants international (MACi) www.maci.coop
Minnesota Department of Agriculture www.mda.state.mn.us
Mississippi State University - Department of forestry www.cfr.msstate.edu/
Missouri Corn Growers Association www.mocorn.org
Morton College National Corn-To-Ethanol Research Center www.ethanolresearch.com
Nebraska Corn Board www.nebraskacorn.org
New Madrid County Port Authority www.newmadridcountyport.com
Northwest Missouri State University www.nwmissouri.edu
Ohio Corn Marketing Program www.ohiocorn.org
Regional Economic Development District initiatives (REDDi) www.reddionline.com
Renewable fuels Australia www.renewablefuels.com.au
South Dakota Corn Growers Association www.sdcorn.org
Steele-Waseca Cooperative Electric www.swce.coop
Sugar Processing Research institute (SPRi) www.spriinc.org
Texas Renewable Energy industries Assn. www.treia.org
United AssociationUniversity of California - Davis Desert Research and Extension Center www.ucdavis.edu
virginia Clean Cities www.hrccc.org
Washington State University, School of Economic Sciences www.ses.wsu.edu
Water Assurance Technology Energy Resources www.waterc3.com
Western iowa Tech Community College – The National Boiler Training and Renewable Energy institute boiler.witcc.edu
Western Petroleum Company www.westernpetro.com
WestStart-CALSTART www.weststart.org
Wisconsin Pipe Trades Association www.wipipetrades.org
RFA sUPPORTInG MEMbERs
32

RFA AssOcIATE MEMbERsAGRA industries www.agraind.com
AgStar financial Services www.agstar.com
Aker Kvaerner www.akerkvaerner.com
Alfa Laval, inc. www.alfalaval.com
American Railcar industries www.americanrailcar.com
Antioch international inc. www.antioch-intl.com
Baker Petrolite Barr Engineering Company www.barr.com
BBi international www.bbibiofuels.com
BetaTec Hop Products www.betatechhopproducts.com
Biofields S.A.P.i de C.v. www.biofields.com
Bratney Companies www.bratney.com
Brown, Winick, Graves www.brownwinick.com
Ceres inc. www.ceres.net
Cf industries www.cfindustries.com
CH2M Hill www.ch2m.com
Chapman & Cutler LLP www.chapman.com
Christianson & Associates, PLLP www.christiansoncpa.com
CHS inc. www.chsinc.com
CME Group www.cmegroup.com
CoBank www.cobank.com
Codexis, inc www.codexis.com
Commodity Specialists Company www.csc-world.com
Consolidated Grain & Barge Co. www.cgb.com
CSX Transportation www.csx.com
CyC Construction, inc. www.cycconstruction.com
Delta-T Corporation www.deltatcorp.com
Dorsey & Whitney www.dorseylaw.com
DSM www.dsm.com
DTN www.dtn.com
Eco-Energy, inc. www.eco-energyinc.com
Eide Bailly LLP www.eidebailly.com
Emerald foam Control, LLC www.emeraldmaterials.com
Encore Business Solutions www.encorebusiness.com
ETH - BioEnergy inc Ethanol Capital Management www.ethanolinvestments.com
Ethanol Products, LLC www.ethanolproducts.com
Ethanol Technology www.ethanoltech.com
fagen, inc. www.fageninc.com
farm Credit Bank of Texas www.farmcreditbank.com
fCStone, LLC www.fcstone.com
fermentis - S.i. Lesaffre www.fermentis.com
first National Bank www.fnbo.com
ford Motor Company www.ford.com
fremont industries, inc. www.fremontind.com
fulbright & Jaworski L.L.P. www.fulbright.com
Garratt-Callahan Co. www.g-c.com
GATX Rail www.gatxrail.com
Gavilon, LLC www.gavilon.com
GCUBE insurance Services www.gcube-insurance.com
Genencor, A Danisco Division www.genencor.com
Grace Davison www.gracedavison.com
Greenberg Taurig, LLP www.gtlaw.com
Greene Holcomb & fisher www.ghf.net
Greenfield Ethanol inc. www.greenfieldethanol.com
Greenstock Resources, inc. www.greenstock.net
Growmark, inc. www.growmark.com
Harris Group inc. www.harrisgroup.com
Hydro-Klean, inc. www.hydro-klean.com
innospec fuel Specialties www.innospecinc.com
iowa Renewable fuels Association www.iowarfa.org
Jackson-Briner, LLC KATZEN international, inc. www.katzen.com
Kenan Advantage Group, inc. www.thekag.com
Kennedy and Coe, LLC www.kcoe.com
Kincannon & Reed www.krsearch.com
Kinder Morgan inc. www.kindermorgan.com
Knutson Construction Services www.knutsonconstruction.com
Kutak Rock LLP www.kutakrock.com
Lansing Ethanol Services, LLC www.lansingtradegroup.com
Leonard, Street and Deinard www.leonard.com
Lignol Energy Corp www.lignol.ca
Lincoln Energy Solutions www.lincolnenergysolutions.com
Lindquist & vennum PLLP www.lindquist.com
Lubrizol Corporation www.lubrizol.com
Lurgi inc. www.lurgipsi.com
Maize Processing innovators, inc. www.maizepi.com
Mascoma Corporation www.mascoma.com
McGladrey & Pullen www.mcgladrey.com
McGrath North Mullin & Kratz www.mcgrathnorth.com
McKinsey & Co. www.mckinsey.com
Mendel Biotechnology inc. www.mendelbio.com
Michael Best & friedrich, LLP www.michaelbest.com
Midwest Laboratories, inc. www.midwestlabs.com
Monsanto www.monsanto.com
Motiva Enterprses LLC www.motivaenterprises.com
Murex, N.A., Ltd. www.murexltd.com
Musket Corporation Nalco Company www.nalco.com
National Corn Growers Association www.ncga.com
National Grain Sorghum Producers www.sorghumgrowers.com
Natural Resource Group www.nrginc.com
NewMech Companies, inc. www.newmech.com
Nexen Marketing U.S.A. inc. www.nexenmarketing.com
Noble Americas Corp. www.thisisnoble.com
North American Bioproducts Corp. www.na-bio.com
Novozymes North America, inc. www.novozymes.com
NuStar Energy, L.P. www.nustarenergy.com
OPW fluid Transfer Group www.opwftg.com
Pavilion Technologies www.pavtech.com
Perdue farms www.perdue.com
Phibrochem www.lactrol.com
Pinnacle Engineering inc. www.pineng.com
Pioneer, A DuPont Company www.pioneer.com
Praj industries Ltd www.praj.net
Primafuel www.primafuel.com
Pursuit Dynamics www.pursuitdynamics.com
Qteros www.qteros.com
Renewable Products Marketing Group www.rpmgllc.com
Resonant Bio Sciences, LLC www.puremash.com
Ryan Companies US inc. www.ryancompanies.com
Safety Management, inc. www.safetymanagementinc.com
SGS www.sgs.com/alternativefuels
Siemens Energy & Automation www.siemens.com
Stanley Consultants, inc. www.stanleygroup.com
Stoel Rives LLP www.stoel.com
Summit Software, inc. www.summit-soft.com
SunOpta BioProcess www.sunopta.com/bioprocess
Syngenta www.syngenta.com
The Scoular Company www.scoular.com
Third inning Solutions www.thirdinningsolutions.com
TMO Renewables LTD www.tmo-group.com
Tombstone Energy Solutions LP TransMontaigne Product Services www.transmontaigne.com
Transportation fuels Consulting inc. TranSystems www.transystems.com
Tranter PHE, inc. www.tranter.com
Trinity Rail Group www.trinityrail.com
Union Pacific Railroad www.uprr.com
Union Tank Car Company www.utlx.com
U.S. Development Group www.us-dev.com
U.S. Energy Services www.usenergyservices.com
U.S. Water Services www.uswaterservices.com
valero L.P. www.valerolp.com
vertical North America www.vertical.bz
Weaver & Tidwell www.weaverandtidwell.com
Weitz industrial Services Group www.weitz.com
Wells fargo Securities, LLC Western Biofuels Company Wilson Sonsini Goodrich & Rosati www.wsgr.com

One Massachusetts Avenue, NW, Suite 820Washington, DC 20001
TEL: 202-289-3835 | FAX: 202-289-7519email: [email protected]
www.ethanolRFA.org