Embed Size (px)
Citation preview

Groupe Crédit Agricole Period January 1st to June 30 2014 This is a free translation into English of the statutory auditors' review report on the interim condensed
consolidated financial statements issued in French and it is provided solely for the convenience of English-speaking users. This report should be read in conjunction with and construed in accordance
with French law and professional standards applicable in France.
Dear Sirs,
In our capacity as Statutory Auditors of Crédit Agricole S.A. and in accordance with your request, we
have reviewed the accompanying interim condensed consolidated financial statements of Crédit
Agricole Group for the period January 1st to June 30, 2014.
As stated in the note “General framework” to the financial statements, the interim condensed
consolidated financial statements of Crédit Agricole Group reporting entity, which is a network with a
central body, are prepared on the basis of a community of interests encompassing all the Local Banks, Regional Banks and the central body Crédit Agricole S.A.
These interim condensed consolidated financial statements are the responsibility of the board of
directors. Our role is to express a conclusion on these financial statements based on our review.
We conducted our review in accordance with the professional standards applicable in France. A
review consists of making inquiries, primarily of persons responsible for financial and accounting matters, and applying analytical and other review procedures. A review is substantially less in scope
than an audit conducted in accordance with the professional standards applicable in France and
consequently does not enable us to obtain assurance that the financial statements, taken as a whole, are free from material misstatements, as we would not become aware of all significant matters that might
be identified in an audit. Accordingly, we do not express an audit opinion.
Based on our review, nothing has come to our attention that causes us to believe that the accompanying interim condensed consolidated financial statements are not prepared in all material
respects in accordance with IAS 34 – IFRS as adopted by the European Union applicable to interim
financial information.
Without qualifying our opinion, we draw your attention to the matters set out in the Notes 1 and 9 to
the interim condensed consolidated financial statements which describe the effects of the first
application of IFRS 10 related to consolidated financial statements and of IFRS 11 related to joint
arrangements.
Neuilly-sur-Seine and Paris-La Défense, August 07, 2014
The statutory auditors

French original signed by
PricewaterhouseCoopers Audit ERNST & YOUNG et Autres
Catherine Pariset Valérie Meeus

CRÉDIT AGRICOLE GROUP
CONDENSED INTERIM CONSOLIDATED FINANCIAL STATEMENTS AT 30 JUNE 2014
Examined by the Board of Directors of Crédit Agrico le S.A. on 4 August 2014

Interim condensed consolidated financial statements of Crédit Agricole Group - 30 June 2014
2
SOMMAIRE
GENERAL FRAMEWORK ................................. .................................................................................................... 4
>> CREDIT AGRICOLE GROUP................................................................................................................... 4
CONSOLIDATED FINANCIAL STATEMENTS ................. .................................................................................... 5
>> INCOME STATEMENT .................................................................................................................................... 5
>> NET INCOME AND OTHER COMPREHENSIVE INCOME ....................................................................................... 6
>> BALANCE SHEET - ASSETS .......................................................................................................................... 7
>> BALANCE SHEET - LIABILITIES ..................................................................................................................... 8
>> STATEMENT OF CHANGES IN EQUITY ............................................................................................................ 9
>> CASH FLOW STATEMENT ........................................................................................................................... 11
NOTES TO THE INTERIM CONDENSED CONSOLIDATED FINANCI AL STATEMENTS ................................ 14
1. GROUP ACCOUNTING POLICIES AND PRINCIPLES , ASSESSMENTS AND ESTIMATES .................................. 14
2. SIGNIFICANT INFORMATION RELATING TO THE FIRST HALF O F THE YEAR ................................................ 18
1.2. Main structural transactions and material events in the period .................................................. 18
1.3. Goodwill ...................................................................................................................................... 25
1.4. Related parties ........................................................................................................................... 25
3. NOTES TO THE INCOME STATEMENT AND COMPREHENSIVE INCOME ...................................................... 27
3.1. Interest income and expenses ................................................................................................... 27
3.2. Net fees and commissions ......................................................................................................... 27
3.3. Net gains (losses) on financial instruments at fair value through profit or loss .......................... 28
3.4. Net gains (losses) on available-for-sale financial assets ........................................................... 30
3.5. Net income (expenses) on other activities ................................................................................. 30
3.6. Operating expenses ................................................................................................................... 30
3.7. Depreciation, amortisation and impairment of property, plant & equipment and intangible assets ........................................................................................................................................ 31
3.8. Cost of risk .................................................................................................................................. 32
3.9. Net gains (losses) on other assets ............................................................................................. 32
3.10. Change in other comprehensive income .................................................................................... 33
4. SEGMENT REPORTING ........................................................................................................................ 36
4.1. Operating segment information .................................................................................................. 39
4.2. Insurance specificities ................................................................................................................ 41
5. NOTES TO THE BALANCE SHEET .......................................................................................................... 44
5.1. Financial assets and liabilities at fair value through profit or loss .............................................. 44
5.2. Available-for-sale financial assets .............................................................................................. 46
5.3. Loans and receivables due from credit institutions and from customers ................................... 47
5.4. Transferred assets not derecognised or derecognised with ongoing involvement .................... 49
5.5. Impairment deducted from financial assets ................................................................................ 51
5.6. Exposure to sovereign risk ......................................................................................................... 52
5.7. Due to credit institutions and to customers ................................................................................ 57
5.8. Debt securities and subordinated debt ....................................................................................... 58
5.9. Information on the offsetting of financial assets and financial liabilities ..................................... 59
5.10. Investment properties ................................................................................................................. 61
5.11. Property, plant & equipment and intangible assets (excluding goodwill) ................................... 62
5.12. Provisions ................................................................................................................................... 62
6. FINANCING AND GUARANTEE COMMITMENTS AND OTHER GUARANTEES ................................................ 65
7. RECLASSIFICATION OF FINANCIAL INSTRUMENTS ................................................................................. 68

Interim condensed consolidated financial statements of Crédit Agricole Group - 30 June 2014
3
8. FAIR VALUE OF FINANCIAL INSTRUMENTS ............................................................................................ 70
8.1. Fair value of financial assets and liabilities measured at amortised cost................................... 71
8.2. Information about financial instruments measured at fair value ................................................. 75
8.3. Estimated impact of inclusion of the margin at inception ........................................................... 87
9. IMPACT OF ACCOUNTING CHANGES (NEW CONSOLIDATION STANDARDS ) OR OTHER EVENTS ................... 88
10. EVENTS AFTER THE REPORTING PERIOD .............................................................................................. 97
11. SCOPE OF CONSOLIDATION AT 30 JUNE 2014 ..................................................................................... 98

Interim condensed consolidated financial statements of Crédit Agricole Group - 30 June 2014
4
General framework
>> CREDIT AGRICOLE GROUP Crédit Agricole Mutuel was established by the act of 5 November 1894, which introduced the principle of creating Crédit Agricole’s Local Banks; the act of 31 March 1899, which federated the Local Banks into Regional Banks; and the act of 5 August 1920, which created Office National du Crédit Agricole. This latter institution subsequently became Caisse Nationale de Crédit Agricole and then Crédit Agricole S.A., whose role as central body was confirmed and specified by the French Monetary and Financial Code. Crédit Agricole Group comprises 2,483 Local Banks, 39 Regional Banks and the Crédit Agricole S.A. central body, along with their subsidiaries. It is a banking group with a central body as defined by the European Union’s first directive (77/780/EEC): - the commitments of the central body and of the entities affiliated to it are joint and several; - the solvency and liquidity of all affiliated entities are monitored together on the basis of consolidated financial statements. For groups with a central body, directive 86/635 relating to the financial statements of European credit institutions stipulates that the whole group, consisting of the central body and its affiliated entities, must be covered by the consolidated financial statements prepared, audited and published in accordance with this directive. In line with this directive, the central body and its affiliated entities make up the reporting entity. This reporting entity represents the community of interests created in particular by the system of cross-guarantees, which ensure joint and several coverage of the commitments of the Crédit Agricole Group network. In addition, the various texts mentioned in the first paragraph explain and organise the community of interests that exists at the legal, financial, economic and political levels between Crédit Agricole S.A., the Regional Banks and the Local Banks of Crédit Agricole Mutuel. This community relies on a single financial relationship mechanism, a single economic and commercial policy and joint decision-making authorities which, for over a century, have formed the basis of Crédit Agricole Group. In accordance with European regulation 1606/02, the reporting entity’s consolidated financial statements are prepared under IFRS as adopted by the European Union. The reporting entity consists of the Local Banks, the Regional Banks and the Crédit Agricole S.A. central body.
Interim condensed consolidated financial statements of Crédit Agricole Group - 30 June 2014
5
Consolidated financial statements
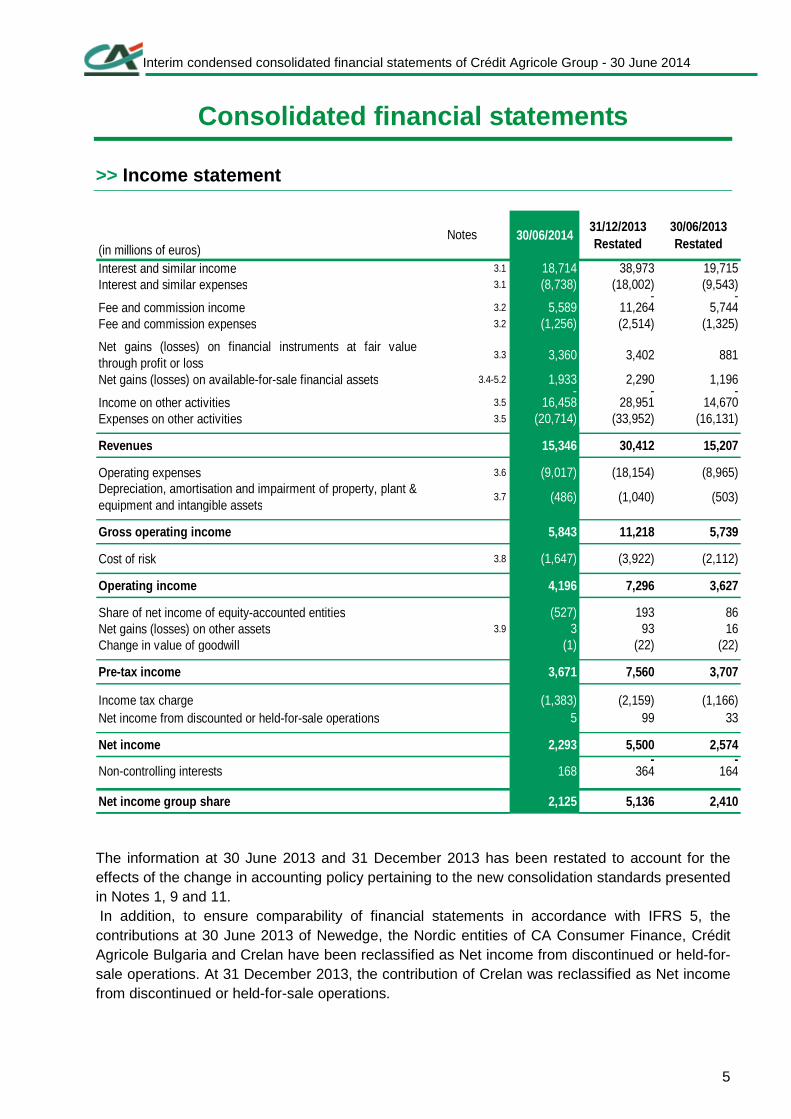
>> Income statement
(in millions of euros)Notes 30/06/2014
31/12/2013Restated
30/06/2013 Restated
Interest and similar income 3.1 18,714 38,973 19,715Interest and similar expenses 3.1 (8,738) (18,002) (9,543)
- -Fee and commission income 3.2 5,589 11,264 5,744Fee and commission expenses 3.2 (1,256) (2,514) (1,325)
Net gains (losses) on financial instruments at fair valuethrough profit or loss
3.3 3,360 3,402 881
Net gains (losses) on available-for-sale financial assets 3.4-5.2 1,933 2,290 1,196- - -
Income on other activities 3.5 16,458 28,951 14,670Expenses on other activities 3.5 (20,714) (33,952) (16,131)
Revenues 15,346 30,412 15,207
Operating expenses 3.6 (9,017) (18,154) (8,965)Depreciation, amortisation and impairment of property, plant &equipment and intangible assets
3.7 (486) (1,040) (503)
Gross operating income 5,843 11,218 5,739
Cost of risk 3.8 (1,647) (3,922) (2,112)
Operating income 4,196 7,296 3,627
Share of net income of equity-accounted entities (527) 193 86Net gains (losses) on other assets 3.9 3 93 16Change in value of goodwill (1) (22) (22)
Pre-tax income 3,671 7,560 3,707
Income tax charge (1,383) (2,159) (1,166)Net income from discounted or held-for-sale operations 5 99 33
Net income 2,293 5,500 2,574- -
Non-controlling interests 168 364 164
Net income group share 2,125 5,136 2,410
The information at 30 June 2013 and 31 December 2013 has been restated to account for the effects of the change in accounting policy pertaining to the new consolidation standards presented in Notes 1, 9 and 11. In addition, to ensure comparability of financial statements in accordance with IFRS 5, the contributions at 30 June 2013 of Newedge, the Nordic entities of CA Consumer Finance, Crédit Agricole Bulgaria and Crelan have been reclassified as Net income from discontinued or held-for-sale operations. At 31 December 2013, the contribution of Crelan was reclassified as Net income from discontinued or held-for-sale operations.

Interim condensed consolidated financial statements of Crédit Agricole Group - 30 June 2014
6
>> Net income and other comprehensive income
(in millions of euros) Notes 30/06/2014
31/12/2013Restated
30/06/2013Restated
Net income 2,293 5,500 2,574
Actuarial gains and losses on post-employment benefits 3.10 (140) 40 (5)
Gains and losses on non current-assets held for sale 3.10 - 2 -Pre-tax other comprehensive income on items that will not bereclassified to profit and loss excluding equity-ac counted entities
(140) 42 (5)
Pre-tax other comprehensive income on items that will not bereclassified to profit and loss on equity-accounted entities
3.10 (10) (40) (39)
Income tax related to items that will not be reclassified to p rofit andloss excluding equity-accounted entities
3.10 49 (17) 2
Income tax related to items that will not be reclassified to p rofit andloss on equity-accounted entities
3.10 (1) - 1
Other comprehensive income on items that will not be reclass ifiedsubsequently to profit and loss net of income tax
(102) (15) (41)
Gains and losses on translation adjustements 3.10 (11) (287) (108)
Gains and losses on available-for-sale financial assets (1) 3.10 1,281 (89) (681)
Gains and losses on hedging derivative instruments 3.10 340 (404) (248)
Gains and losses on non current-assets held for sale 3.10 43 15 (16)Pre-tax other comprehensive income on items that may bereclassified to profit and loss excluding equity-ac counted entities (1) 1,653 (765) (1,053)
Pre-tax other comprehensive income on items that may bereclassified to profit and loss on equity-accounted entiti es, GroupShare
3.10 27 (123) 15
Income tax related to items that may be reclassified to profit and lossexcluding equity-accounted entities (1) 3.10 (472) 241 371
Income tax related to items that may be reclassified to profi t and losson equity-accounted entities
3.10 - (4) (11)
Other comprehensive income on items that may be reclassifiedsubsequently to profit and loss net of income tax (1) 1,208 (651) (678)
-Other comprehensive income net of income tax 1,106 (666) (719)
Net income and other comprehensive income 3,399 4,834 1,855
of which Group share 3,233 4,563 1,705
of which non-controlling interests 166 271 150
The effects of the change in accounting policy related to new consolidation standards are presented in notes 1, 9 and 11. The reclassification of discontinued operations held for sale has no material impact on the presentation of other comprehensive income at 30 June 2013, 31 December 2013 and 30 June 2014.
Interim condensed consolidated financial statements of Crédit Agricole Group - 30 June 2014
7
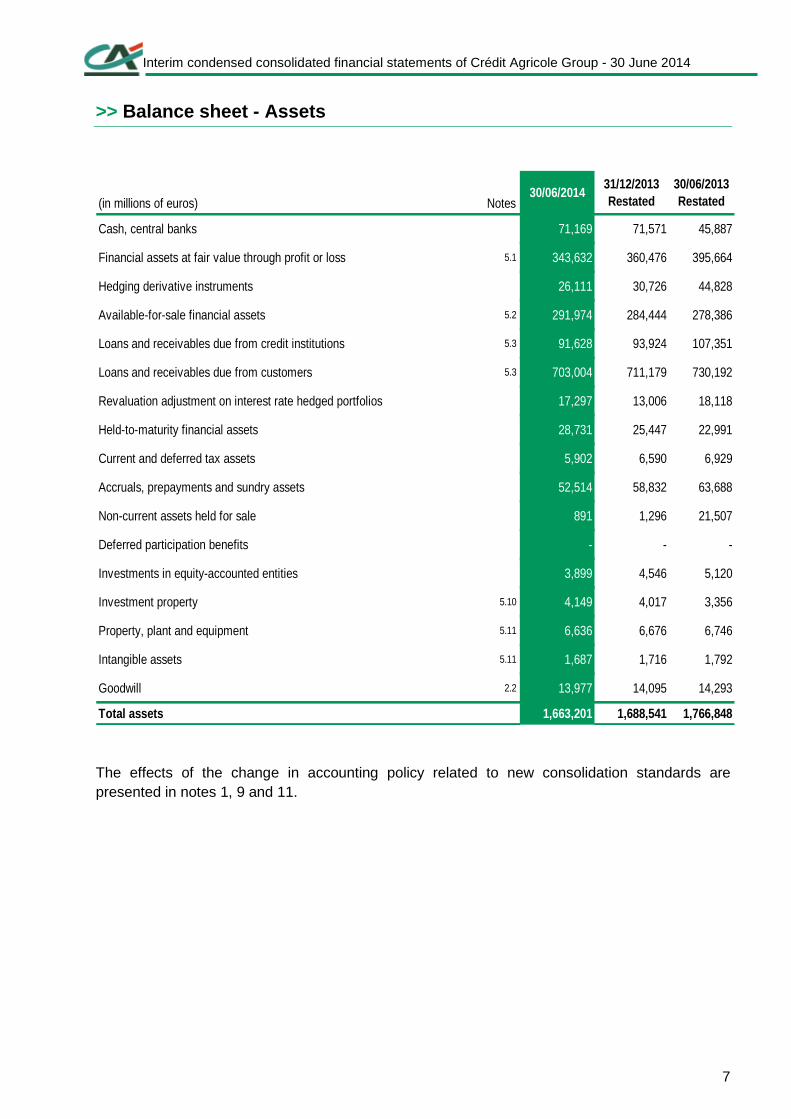
>> Balance sheet - Assets
(in millions of euros) Notes30/06/2014
31/12/2013Restated
30/06/2013Restated
Cash, central banks 71,169 71,571 45,887
Financial assets at fair value through profit or loss 5.1 343,632 360,476 395,664
Hedging derivative instruments 26,111 30,726 44,828
Available-for-sale financial assets 5.2 291,974 284,444 278,386
Loans and receivables due from credit institutions 5.3 91,628 93,924 107,351
Loans and receivables due from customers 5.3 703,004 711,179 730,192
Revaluation adjustment on interest rate hedged portfolios 17,297 13,006 18,118
Held-to-maturity financial assets 28,731 25,447 22,991
Current and deferred tax assets 5,902 6,590 6,929
Accruals, prepayments and sundry assets 52,514 58,832 63,688
Non-current assets held for sale 891 1,296 21,507
Deferred participation benefits - - -
Investments in equity-accounted entities 3,899 4,546 5,120
Investment property 5.10 4,149 4,017 3,356
Property, plant and equipment 5.11 6,636 6,676 6,746
Intangible assets 5.11 1,687 1,716 1,792
Goodwill 2.2 13,977 14,095 14,293
Total assets 1,663,201 1,688,541 1,766,848
The effects of the change in accounting policy related to new consolidation standards are presented in notes 1, 9 and 11.

Interim condensed consolidated financial statements of Crédit Agricole Group - 30 June 2014
8
>> Balance sheet - Liabilities
(in millions of euros) Notes 30/06/201431/12/2013Restated
30/06/2013Restated
Central banks 6.1 3,193 3,021 1,278
Financial liabilities at fair value through profit or loss 6.2 272,074 295,918 346,800
Hedging derivative instruments 3.2-3.4 28,487 34,762 47,476
Due to credit institutions 3.3-6.9 100,682 100,036 102,986
Due to customers 3.1-3.3-6.9 610,285 640,675 623,370
Debt securities 3.2-3.3-6.11 190,627 176,475 185,379
Revaluation adjustment on interest rate hedged portfolios - 15,029 8,793 15,382
Current and deferred tax liabilities 6.13 3,349 2,239 3,620
Accruals, deferred income and sundry liabilities 6.14 49,477 54,521 62,045
Liabilities associated with non-current assets held-for-sale 6.15 445 878 22,015
Insurance company technical reserves 6.18 271,967 256,542 245,526
Provisions 6.19 6,271 6,383 6,399
Subordinated debt 3.2-3.3-6.11 25,401 26,633 27,881
Total liabilities 1,577,287 1,606,876 1,690,157
Equity 85,914 81,665 76,691
Equity, Group share 81,971 76,282 71,399
Share capital and reserves 26,751 25,060 24,467
Consolidated reserves 49,357 43,457 47,457
Other comprehensive income 3,737 2,670 3,254
1 (40) (53)
Net income/ (loss) for the year 2,125 5,136 (3,726)
Non-controlling interests 3,943 5,383 5,292
Total equity and liabilities 1,663,201 1,688,541 1,766,848
Other comprehensive income on non-current assets held-for-sale and discontinued operations
The effects of the change in accounting policy related to new consolidation standards are presented in notes 1, 9 and 11.

Interim condensed consolidated financial statements of Crédit Agricole Group - 30 June 2014
9
>> Statement of changes in equity
(in millions of euros)
Share capital
Share premium and consolidated
reserves
Elimination of treasury
shares
Other equity instruments
Capital and consolidated reserves
Other comprehensive income
on items that may be reclassified to profit and
loss
Other comprehensive income
on items that will not
be reclassified to profit and
loss
Total other comprehensive income
Other comprehensive income
on items that may be reclassified to profit and
loss
Other comprehensive income
on items that will not
be reclassified to profit and
loss
Total other comprehensive income
Equity at 1st January 2013 restated 8,854 59,820 (476) - 68,198 3,633 (430) 3,203 - 71,401 5,351 (54) (6) (60) 5,291 76,692
Capital increase 215 (5) - - 210 - - - - 210 - - - - - 210
Changes in treasury shares held - - - - - - - - - - - - - - - -
Dividends paid during 1st half-year 2013 - (557) - - (557) - - - - (557) (227) - - - (227) (784)
Dividends received from Regional Banks and subsidiaries - 340 - - 340 - - - - 340 - - - - - 340
Impact of acquisitions/disposals on non-controlling interests - (6) - - (6) - - - - (6) 100 - - - 100 94
Changes due to share-based payments - (14) - - (14) - - - - (14) - - - - - (14)
Changes due to transactions with shareholders 215 (242) - - (27) - - - - (27) (127) - - - (127) (154)
Changes in other comprehensive income - - - - - (671) (3) (674) - (674) - (13) - (13) (13) (687)
Share of changes in equity of equity-accounted entities - 6 - - 6 5 (36) (31) - (25) - (1) - (1) (1) (26)
Net income 1st half-year 2013 - - - - - - - - 2,410 2,410 164 - - - 164 2,574
Other changes - 6 - - 6 - - - - 6 (2) - - - (2) 4
Equity at 30 June 2013 restated 9,069 59,590 (476) - 68,183 2,967 (469) 2,498 2,410 73,091 5,386 (68) (6) (74) 5,312 78,403
Capital increase 151 (15) - - 136 - - - - 136 - - - - - 136
Changes in treasury shares held - - 204 - 204 - - - - 204 - - - - - 204
Dividends paid during 2nd half-year 2013 - - - - - - - - - - (68) - - - (68) (68)
Dividends received from Regional Banks and subsidiaries - (1) - - (1) - - - - (1) - - - - - (1)
Impact of acquisitions/disposals on non-controlling interests - 59 - - 59 - - - - 59 16 - - - 16 75
Changes due to share-based payments - 3 - - 3 - - - - 3 - - - - - 3
Changes due to transactions with shareholders 151 46 204 - 401 - - - - 401 (52) - - - (52) 349
Changes in other comprehensive income - - - - - 238 28 266 - 266 - (78) - (78) (78) 188
Share of changes in equity-accounted entities - (14) - - (14) (130) (4) (134) - (148) - (1) - (1) (1) (149)
Net income during 2nd half-year 2013 - - - - - - - - 2,726 2,726 200 - - - 200 2,926
Other changes - (54) - - (54) - - - - (54) 2 - - - 2 (52)
Equity at 31 December 2013 restated 9,220 59,568 (272) - 68,516 3,075 (445) 2,630 5,136 76,282 5,536 (147) (6) (153) 5,383 81,665
Appropriation of 2013 net income - 5,136 - - 5,136 - - - (5,136) - - - - - - -
Equity at 1st January 2014 restated IFRS 5 9,220 64,704 (272) - 73,652 3,075 (445) 2,630 - 76,282 5,536 (147) (6) (153) 5,383 81,665
Capital increase 348 171 - - 519 - - - - 519 - - - - - 519
Changes in treasury shares held - - (11) - (11) - - - - (11) - - - - - (11)
Issuance of equity instruments - (18) - 2,890 2,872 - - - - 2,872 - - - - - 2,872
2014 remuneration of undated deeply subordinated notes (1) - (65) - - (65) - - - - (65) - - - - - (65)Dividends paid in the 1st half-year of 2013 - (1,436) - - (1,436) - - - - (1,436) (189) - - - (183) (1,619)
Dividends received from Regional Banks and subsidiaries - 831 - - 831 - - - - 831 - - - - - 831
Impact of acquisitions/disposals on non-controlling interests (2) - (251) - - (251) - - - - (251) (1,409) - - - (1,409) (1,660)
Changes due to share-based payments - 3 - - 3 - - - - 3 - - - - - 3
Changes due to transactions with shareholders 348 (765) (11) 2,890 2,462 - - - - 2,462 (1,592) - - - (1,592) 870
Changes in other comprehensive income - - - - - 1,183 (90) 1,094 - 1,094 - (2) (1) (3) (3) 1,091
Share of changes in equity-accounted entities - (6) - - (6) 26 (11) 15 - 9 - 1 - 1 1 10
Net income 1st half-year 2014 - - - - - - - - 2,125 2,125 168 - - - 168 2,293
Other changes - - - - - - - - - - (14) - - - (14) (14)
Equity at 30 June 2014 9,568 63,933 (283) 2,890 76,108 4,284 (546) 3,738 2,125 81,971 4,098 (148) (7) (155) 3,943 85,914
Total consolidate
d equityNet income Total equity
Other comprehensive incomeShare capital and reserves Other comprehensive incom e
Group share Non-controlling interests
Capital, associated reserves
and income
Total Equity

Interim condensed consolidated financial statements of Crédit Agricole Group - 30 June 2014
10
(1) In the framework of the reinforcement of the Group’s regulatory capital, on 15 January
2014 and on 1 April 2014 Crédit Agricole S.A. issued Additional Tier 1 deeply subordinated undated bonds (in USD, GBP and EUR) for €2,890 million (see note 2.1 Main structural transactions and material events in the period).
(2) The effect of acquisitions/disposals on non-controlling interests corresponds mainly to the loss of control of Crelan for -€820 million, the liquidation of a compartment of CA Preferred LLC for -€384 million and the acquisition of an additional 5% stake in Amundi for -€191 million.

Interim condensed consolidated financial statements of Crédit Agricole Group - 30 June 2014
11
>> Cash flow statement The cash flow statement is presented using the indirect method. Operating activities show the impact of cash inflows and outflows arising from Crédit Agricole S.A. Group’s income-generating activities, including those associated with assets classified as held-to-maturity financial assets. Tax inflows and outflows are included in full within operating activities. Investment activities show the impact of cash inflows and outflows associated with purchases and sales of investments in consolidated and non-consolidated companies, property, plant and equipment and intangible assets. This section includes strategic equity investments classified as available-for-sale financial assets. Financing activities show the impact of cash inflows and outflows associated with equity and long-term borrowing. The net cash flows attributable to the operating, investment and financing activities of discontinued operations are presented on separate lines in the cash flow statement. Net cash and cash equivalents include cash, debit and credit balances with central banks and debit and credit demand balances with credit institutions.

Interim condensed consolidated financial statements of Crédit Agricole Group - 30 June 2014
12
(in millions of euros) Notes 30/06/201431/12/2013Restated
30/06/2013Restated
Pre-tax income 3,671 7,560 3,707
Net depreciation and impairment of property, plant & equipment and intangible assets 493 1,055 513
Impairment of goodwill and other fixed assets 2.2 - 22 22Net depreciation charges to provisions 10,136 15,422 8,087Share of net income (loss) of equity-accounted entities 527 (193) (86)Net income (loss) from investment activities (8) (139) 2Net income (loss) from financing activities 2,013 4,059 2,145Other movements (2,240) (3,593) (1,575)Total non-cash and other adjustment items included in pre-tax income 10,921 16,633 9,108Change in interbank items 6,485 (9,137) 5,483Change in customer items (22,347) 43,013 23,779Change in financial assets and liabilities (829) (38,294) (32,160)Change in non-financial assets and liabilities 2,200 (3,941) (2,879)
Dividends received from equity-accounted entities (1) 43 47 23Tax paid (88) (2,812) (1,651)Net change in assets and liabilities used in operating activities (14,536) (11,124) (7,405)Cash provided (used) by discontinued operations 10 (1,045) 415TOTAL NET CASH FLOWS FROM (USED BY) OPERATING ACTIV ITIES (A) 66 12,024 5,825
Change in equity investments (2) (613) (82) (35)Change in property, plant & equipment and intangible assets (542) (999) (486)Cash provided (used) by discontinued operations (1,036) (74) (360)TOTAL NET CASH FLOWS FROM (USED BY) INVESTMENT ACTI VITIES (B) (2,191) (1,155) (881)
Cash received from (paid to) shareholders (3) 2,160 346 (553)
Other cash provided (used) by financing activities (4) 2,214 (3,587) (2,005)Cash provided (used) by discontinued operations (8) (206) (137)TOTAL NET CASH FLOWS FROM (USED BY) FINANCING ACTIV ITIES (C) 4,366 (3,447) (2,695)
Impact of exchange rate changes on cash and cash eq uivalent (D) 1,371 (2,951) (751)
Net increase/(decrease) in cash & cash equivalent ( A + B+ C + D) 3,612 4,472 1,498
Cash and cash equivalents at beginning of period 62,466 57,996 57,996Net cash accounts and accounts with central banks * 68,638 45,017 45,017Net demand loans and deposits with credit institutions ** (6,172) 12,979 12,979Cash and cash equivalents at end of period 66,077 62,468 59,493Net cash accounts and accounts with central banks * 67,978 68,639 57,325Net demand loans and deposits with credit institutions ** (1,901) (6,171) 2,168Net change in cash and cash equivalents 3,611 4,472 1,497 * Consisting of the net balance of the cash and central banks item, excluding accrued interest and including cash
from entities reclassified as activities held for sale. ** Consisting of the balance of performing current accounts in debit and performing overnight accounts and advances as detailed in Note 6.5 and Current accounts in credit and Current accounts and overdrafts as detailed in Note 6.9 (excluding accrued interest).

Interim condensed consolidated financial statements of Crédit Agricole Group - 30 June 2014
13
(1) Dividends received from equity-accounted entities: At 30 June 2014, this amount mainly includes dividend payments by FGA Capital Spa for €14 million, by Menafinance for €10 million and by Eurazeo for €11 million; (2) Change in equity investments: This line item reflects the net cash impact of acquisitions and disposals of equity investments. These external operations are described in Note 2.1 :
- The net impact on the Group's cash position of acquisitions and disposals of shares in consolidated companies (subsidiaries and equity accounted entities) at 30 June 2014 amounted to €164 million. The main transactions notably concern the acquisition of shares in Amundi reduced by shares disposals of Nordics entities of CACF, Semeru Asia Equity High Yield Fund for €34 million, BNI Madagascar and CA Bulgaria.
Furthermore, main disposals of equity investments relate to Newedge.
- Over the same period, the net impact on the Group's cash flow of the acquisitions and disposals of non-consolidated equity investments was -€767 million. It mainly concerns acquisitions/disposals made in connection with investments in insurance companies for -€755 million, minus the disposal of the interests in ESAF and Immobiliara Colonial and the IFUK cash outflow. Finally Crédit Agricole S.A. Group subscribed to the Caisse de Refinancement de l'Habitat (C.R.H.) capital increase.
(3) Cash received from (paid to) shareholders: This item includes €2,890 million in equity instrument issues and the liquidation of a CA Preferred LLC section for -€384 million. Also included are €523 million in dividends, excluding dividends paid as stock, paid by Crédit Agricole S.A. subsidiaries to minority shareholders. (4) Other cash from financing activities: At 30 June 2014, bond issues stood at €15,807 million and repayments at -€10,232 million. Issues of subordinated debt stood at €33 million and repayments at €1,208 million. This line also includes cash flows from interest payments on subordinated debt and bonds.

Interim condensed consolidated financial statements of Crédit Agricole Group - 30 June 2014
14
NOTES TO THE INTERIM CONDENSED CONSOLIDATED FINANCIAL STATEMENTS
1. Group accounting policies and principles, assessments and estimates
The condensed interim consolidated financial statements for the period ended 30 June 2014 were prepared and are presented in accordance with IAS 34 (Interim financial reporting), which defines the minimum information content and identifies the accounting and measurement principles that must be applied in an interim financial report. The standards and interpretations used to prepare the interim consolidated financial statements are identical to those used by Crédit Agricole Group in preparing the consolidated financial statements for the year ended 31 December 2013. Those statements were prepared, pursuant to EC regulation 1606/2002, in accordance with IASs, IFRSs and IFRIC interpretations as adopted by the European Union ("carve out" version), and so some provisions regarding the application of IAS 39 in relation to macro-hedging were not applied. These standards and interpretations have been supplemented by IFRSs adopted by the European Union at 30 June 2014 and of which application is mandatory for the first time in 2014. These cover the following:
Standards, Amendments or
Interpretations
Date published by the European
Union
Date of first time
application: financial years
from
Applicable in the Group
IFRS 10 on consolidated financial statements
11 December 2012 (EU No.
1254/2012)
1 January 2014 Yes
IFRS 11 on joint arrangements 11 December 2012 (EU No.
1254/2012)
1 January 2014 Yes
IFRS 12 on disclosure of interests in other entities
11 December 2012 (EU No.
1254/2012)
1 January 2014 Yes
Amended IAS 27 on parent company’s financial statements
11 December 2012 (EU No.
1254/2012)
1 January 2014 No
Amended IAS 28 on investments in associates and joint ventures
11 December 2012 (EU No.
1254/2012)
1 January 2014 Yes
Amendment to IAS 32: Presentation of financial assets and financial liabilities offsetting effects
13 December 2012 (EU No.
1256/2012)
1 January 2014 Yes

Interim condensed consolidated financial statements of Crédit Agricole Group - 30 June 2014
15
Amendments relating to transitional provisions for IFRS 10: Consolidation of financial statements, IFRS 11: Joint arrangements and IFRS 12: Disclosure of interests in other entities
4 April 2013 (EU No. 313/2013)
1 January 2014 Yes
Amendments to IFRS 10 and 12 relating to investment entities
20 November 2013 (EU No.
1174/2013)
1 January 2014 No
Amendment to IAS 36 on recoverable amount disclosures for non-financial assets
19 December 2013 (EU No.
1374/2013)
1 January 2014 Yes
Amendments to IAS 39 on financial instruments: recognition and measurement relating to the novation of derivatives and continuation of hedge accounting
19 December 2013 (EU No.
1375/2013)
1 January 2014 Yes
The consolidation standards IFRS 10, 11 and 12 and IAS 28 amended, came into effect on 1 January 2014 and apply retrospectively. They require the nature of equity interests to be reviewed in light of the new control model, changes to the consolidation method in the event of joint control, and disclosures in the notes.
IFRS 10 supersedes IAS 27 and SIC 12 and establishes a common analytical framework for control based on three cumulative criteria:
(1) the holding of power in the relevant activities of the investee ;
(2) exposure or rights to variable returns and;
(3) the ability to use the power over the investee to affect its returns.
The main impact of the first-time application of IFRS 10 is the inclusion of the following entities within the scope of consolidation:
- Two multi-seller ABCP conduits (LMA and Atlantic) and 16 SPV designed to refinance on the market securitisation transactions on behalf of customers, in Europe and in the United States. Indeed, the conduit sponsor and liquidity provider roles played by Crédit Agricole S.A. Group give it power directly connected with the variability of returns from the business. The liquidity facilities protect investors from credit risk and guarantee the liquidity of the conduits.
The inclusion of these entities within the scope of consolidation inflated the balance sheet by €8,270 million and did not have a material impact on income;
- 172 funds backing unit-linked insurance contracts.
Although the investment is done on behalf of the policyholders, Crédit Agricole S.A. Group nevertheless remains directly exposed to the variability of returns from the funds. Control is deemed when the percentage control is considered significant using the relative approach.
The inclusion of these entities within the scope of consolidation inflated the balance sheet by €2,814 million and had no impact on income.
Interim condensed consolidated financial statements of Crédit Agricole Group - 30 June 2014
16
For the asset management business, all managed funds were reviewed in light of the new decision-making criteria introduced by IFRS 10. Thus, when Crédit Agricole S.A. Group acts as fund manager, it may have decision-making powers that, combined with a certain level of exposure to the variability of returns, indicates that it is acting as principal and that it has control. Otherwise, Crédit Agricole S.A. Group acts as agent. This analysis did not result in a material change in the scope of consolidation of this business.
IFRS 11 supersedes IAS 31 and SIC 13. It outlines how joint control is exercised through two forms of arrangements: joint operation and joint venture.
In joint operations, the parties must recognise the assets and liabilities in proportion to their rights and obligations. Conversely, joint ventures in which the parties share the rights to the net assets are no longer proportionally consolidated, but are instead accounted for under the equity method in accordance with IAS 28 amended; at 30 June 2014, Crédit Agricole S.A. Group was a joint venturer in 55 entities.
The change in consolidation method associated with the first-time application of IFRS 11 and IAS 28 amended, means that the share of interests in such entities is presented on a single line in the balance sheet, income statement and other comprehensive income.
The balance sheet at 1 January 2013 was negatively affected to the tune of €26,647 million, while there was no impact on equity.
The main impacts of the new consolidation standards are presented in Note 9 Impact of accounting changes (new consolidation standards) or other events and changes to the scope of consolidation are presented in Note 11, Scope of consolidation at 30 June 2014.
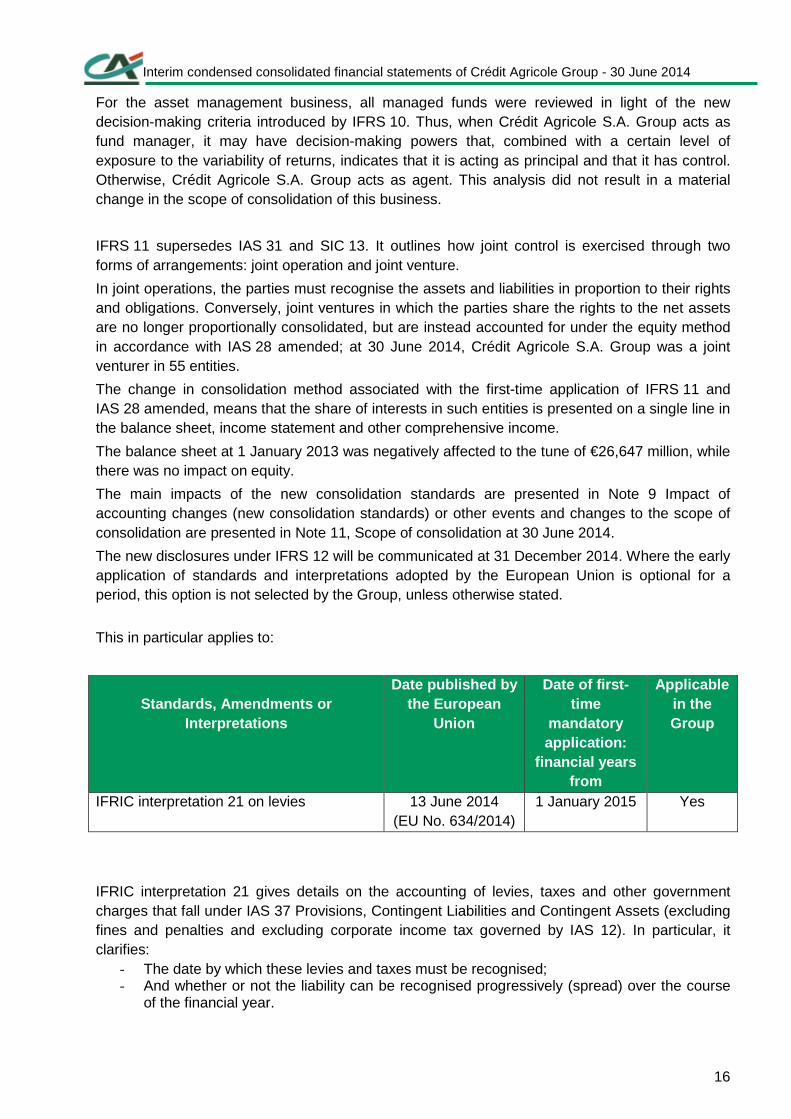
The new disclosures under IFRS 12 will be communicated at 31 December 2014. Where the early application of standards and interpretations adopted by the European Union is optional for a period, this option is not selected by the Group, unless otherwise stated.
This in particular applies to:
Standards, Amendments or
Interpretations
Date published by the European
Union
Date of first -time
mandatory application:
financial years from
Applicable in the Group
IFRIC interpretation 21 on levies 13 June 2014 (EU No. 634/2014)
1 January 2015 Yes
IFRIC interpretation 21 gives details on the accounting of levies, taxes and other government charges that fall under IAS 37 Provisions, Contingent Liabilities and Contingent Assets (excluding fines and penalties and excluding corporate income tax governed by IAS 12). In particular, it clarifies:
- The date by which these levies and taxes must be recognised; - And whether or not the liability can be recognised progressively (spread) over the course
of the financial year.

Interim condensed consolidated financial statements of Crédit Agricole Group - 30 June 2014
17
With respect to these clarifications, the application of IFRIC 21 may result in a change in the obligating event triggering the recognition of certain levies and taxes (deferment of the date of recognition from one year to another and/or end of spread over the duration of the financial year). The levies and taxes concerned and the costing of the associated impacts are currently being identified. Furthermore, standards and interpretations that have been published by the IASB, but not yet been adopted by the European Union, will become mandatory only as from the date of such adoption. The Group has not applied them at 30 June 2014. The condensed interim financial statements are designed to update the information contained in Crédit Agricole Group's consolidated financial statements for the year ended 31 December 2013 and must be read as supplementing those financial statements. As a result, only the most material information regarding the change in Crédit Agricole Group's financial position and performance is mentioned in these interim financial statements. By their nature, estimates have been made to prepare the consolidated financial statements. These estimates are based on certain assumptions and involve risks and uncertainties as to their actual achievement in the future. Accounting estimates that require the formulation of assumptions are used mainly in measuring financial instruments at fair value, non-consolidated equity investments, equity-accounted companies, pension plans, other future employee benefits and stock-option plans, permanent impairment of available-for-sale and held-to-maturity securities, irrecoverable debt write-downs, provisions, impairment of goodwill and deferred tax assets.
Interim condensed consolidated financial statements of Crédit Agricole Group - 30 June 2014
18
2. Significant information relating to the first half of the year The scope of consolidation and changes to it at 30 June 2014 are presented in detail at the end of the appended notes in Note 11 Scope of consolidation at 30 June 2014.
1.2. Main structural transactions and material events in the period I- Structural transactions over the period
• Proposed sale of Crelan (IFRS 5)
A sale agreement was signed on 22 April 2014 by Crédit Agricole Group for the sale of a 50% stake in the Belgian bank Crelan to Caisses coopératives belges, who currently hold a 50% joint shareholding with Crédit Agricole Group. The stake held by Crédit Agricole S.A. in Crelan is handled through SAS Belgium CA, in which both Caisse Régionale Nord Est and Caisse Régionale Nord de France hold a 45% stake, and Crédit Agricole S.A. holds a 10% stake. Considering these items, Crelan was fully consolidated until 31 March 2014. Changes in governance in Crelan, as described in the new agreement, lead to a change in the nature of the control exercised by Crédit Agricole Group, which is now limited to significant influence. Crelan is therefore consolidated in Crédit Agricole Group according to the equity method. In application of IFRS 5 and IFRS 11, Crelan shares are reclassified as Non-current assets held for sale at 1 January 2014. Further to this change in the consolidation method, Crelan’s contribution to non-current assets held for sale amounts to -€246 million at 30 June 2014. These accounting changes entail a decrease by -€21,342 million of the total balance sheet in comparison with the figures published at 31 December 2013. The operating results at 31 December 2013 and 30 June 2013 were reclassified in the restated accounts, as Net income from discontinued or held-for-sale operations. Given the sale price agreed, the projected income from this sale is not significant.
• Proposed sale of CAL Hellas (IFRS 5) Crédit Agricole S.A. and Crédit Agricole Leasing & Factoring signed exclusive sale agreements with an external purchaser during June 2014. These agreements provide for the sale of: - CAL Hellas equity interests by Crédit Agricole Leasing & Factoring for €1; - Debt securities issued by CAL Hellas held by Crédit Agricole S.A. and Lixxcrédit, a subsidiary of Crédit Agricole Leasing & Factoring. At 30 June 2014, given that the criteria for the application of IFRS 5 "Non-current assets held for sale and discontinued operations" had been met for the sale of equity interests and debt securities, the assets and liabilities of the subsidiary, the receivables held by the Group, the

Interim condensed consolidated financial statements of Crédit Agricole Group - 30 June 2014
19
operating profit of the subsidiary as well as the loss resulting from the adjustment to fair value of assets held for sale were classified under the appropriate entries on the balance sheet and income statement, i.e. €507 million in assets, €358 million in liabilities and -€14.5 million in the income statement.
• Sale of Nordic entities of CA Consumer Finance The sale of Finaref AB and DanAktiv, subsidiaries in Sweden, Norway, Finland and Denmark of CA Consumer Finance, was finalised after regulatory approvals were obtained. At 31 December 2013, the contribution of the entities to the consolidated financial statements was reclassified in accordance with IFRS 5:
• assets as non-current assets held for sale stood at €468 million and liabilities as liabilities associated with non-current assets held-for-sale stood at €331 million;
• the profit/loss for 2013 as Net income from discontinued or held-for-sale operations stood at -€76 million.
The Net income from discontinued or held-for-sale operations in the consolidated financial statements at 31 December 2012 from the operating income of these entities for 2012. The impacts of the completion of this transaction are not significant on the consolidated financial statements of Crédit Agricole S.A. Group at 30 June 2014.
• Sale of Newedge and acquisition of an additional 5% stake in Amundi Crédit Agricole S.A. announced the completion on 7 May of the transactions scheduled in the agreement signed on 20 December 2013 between Crédit Agricole CIB and Société Générale for the sale by Crédit Agricole CIB of its 50% stake in Newedge Group, their brokerage joint venture, and the acquisition by Crédit Agricole S.A. from Société Générale of a 5% stake in Amundi, their asset management joint venture. Sale of Newedge The sale of 50% of Newedge to Société Générale was announced on 7 May 2014. In view of the steps taken and negotiations entered into, Newedge had been subject to accounting classification in accordance with IFRS 5 and IAS 31 at 30 September 2013. In the financial statements at 31 December 2013, the contribution of Newedge to the dedicated accounts in the balance sheet and income statement at a rate proportional to the stake held by Crédit Agricole S.A. Group in Newedge, i.e. 50%, was as follows:
• Non-current assets held for sale stood at €24,438 million, and Liabilities associated with non-current assets held-for-sale at €24,189 million in the financial statements at 31 December 2013;

Interim condensed consolidated financial statements of Crédit Agricole Group - 30 June 2014
20
• the Net income from discontinued or held-for-sale operations, i.e. -€162 million, relating mainly to the difference between the fair value of the share of Newedge assets held by Crédit Agricole CIB and the carrying value of these assets.
In the financial statements at 31 December 2013 restated pursuant to IFRS 11, the interest in Newedge is no longer proportionally consolidated but done so according to the equity method on the balance sheet and income statement dedicated to discontinued operations. Given this change in the consolidation method, the contribution of Newedge to the Non-current assets held for sale item stood at €249 million, down €24,189 million compared to statements published at 31 December 2013. In the first half of 2014, completion of the sale generated an insignificant impact on the financial statements of Crédit Agricole CIB. Acquisition of an additional 5% stake in Amundi The acquisition by Crédit Agricole S.A. from Société Générale of a 5% stake in Amundi, which had no effect on the company’s governance structure, was performed on 6 May 2014. After this transaction, Crédit Agricole holds an 80% stake in Amundi. The impact of this is a reduction in Shareholders' equity - Group share of €162 million and a reduction in the share of Non-controlling interests of €191 million.
• Sale of Crédit Agricole Bulgaria The sale of Crédit Agricole Bulgaria, fully owned by IUB Holding, a subsidiary of Crédit Agricole, was begun in late 2013: the conditions of application of IFRS 5 were met at 31 December 2013. At this date, the assets, liabilities and net income after tax of Crédit Agricole Bulgaria are classified as Non-current assets and liabilities held for sale for €211 million and €232 million respectively. The impact on Net income from discontinued or held-for-sale operations was -€39 million at 31 December 2013. At 30 June 2014, given the date of completion of the transaction, a gain of €9 million was recognised in Net income from discontinued or held-for-sale operations.
• Sale of BNI Madagascar BNI Madagascar has been classified in IFRS 5 since 2012. The settlement/delivery transaction for shares held by IUB Holding, a fully-owned subsidiary of Crédit Agricole, to the IOFHL Consortium was agreed on 6 June 2013. At 30 June 2014, the impact of the sale of BNI Madagascar on Consolidated income - Group share of Crédit Agricole S.A. is a gain net of costs of €2.8 million. This impact includes a provision for guarantee of liabilities recognised by IUB Holding for €2.4 million.

Interim condensed consolidated financial statements of Crédit Agricole Group - 30 June 2014
21
At the request of the Malagasy Trustee Authorities, Crédit Agricole S.A. will continue to support this bank for two years via the provision of Group employees. II- Crédit Agricole S.A. Group transactions in Port ugal
• Dissolution of Bespar on 15 May 2014 On 15 May 2014, Crédit Agricole and Espirito Santo Financial Group S.A. announced the dissolution and division of the assets and liabilities of Bespar among shareholders in proportion to their holding. Consequently, Crédit Agricole S.A. and Predica received their share of Banco Espirito Santo shares previously held by Bespar. This transaction is accompanied by a provision forbidding the sale of Banco Espirito Santo shares received for 180 days from the date of settlement/delivery of shares issued in connection with the capital increase of Banco Espirito Santo, i.e. until 13 December 2014. Bespar was consolidated according to the equity method at an interest rate of 26.38%. After completing this transaction, Crédit Agricole Group held a 20.12% interest in Banco Espirito Santo.
• Dilutive capital increase of Banco Espirito Santo On 16 May 2014, Banco Espirito Santo conducted a capital increase for €1,045 million. The Group invested €10 million and sold its residual preferential subscription rights. As part of this capital increase, the Group was diluted by 5.48%; its holding rate in Banco Espirito Santo thus fell from 20.12% to 14.64%.
• Value according to the equity method of Banco Espir ito Santo The recent difficulties faced by Banco Espirito Santo and its shareholders led Crédit Agricole S.A. Group to consider that there was an objective index of the impairment of Banco Espirito Santo. The income for the 1st half of 2014 announced at the meeting of the Board of Directors of Banco Espirito Santo at 30 July 2014 was a loss of -€3,577 million. The consolidated financial statements of Crédit Agricole S.A. at 30 June 2014 therefore include a loss posted against its holding in Banco Espirito Santo of -€525 million for the half year. The auditors of Banco Espirito Santo, at the date of the Crédit Agricole S.A. Board of Directors' meeting, had not issued their opinion on the financial statements presented. Moreover, in view of the consequences of these results on the Banco Espirito Santo S.A. position, Banco do Portugal announced on 3 August 2014 that resolution measures would be applied to Banco Espirito Santo S.A.. Crédit Agricole S.A. Group accordingly wrote down the total value of this holding in its consolidated financial statements. At 30 June 2014, the residual carrying amount of its holding in Banco Espirito Santo S.A. is zero.

Interim condensed consolidated financial statements of Crédit Agricole Group - 30 June 2014
22
In the first half, the overall impact of the transactions and valuation items related to the interests of Crédit Agricole S.A. Group in Banco Espirito Santo was -€664 million on Net Income, Group share.
• Sale of Bes Seguros The sale of BES Seguros, which is 53.7% owned and consolidated via full consolidation, was started during the second quarter of 2014. In application of IFRS 5, pertaining to an activity held for sale:
• the contribution of the entity to the various interim management balances in the income statement was retained and no unrealised loss relating to the valuation of Bes Seguros was identified;
• At 30 June 2014, the assets of Bes Seguros were recognised on a separate line in the asset section of the consolidated balance sheet as Non-current assets held for sale for €119 million, and liabilities on a separate line in the liabilities section as Liabilities associated with non current assets held for sale for €87 million.
III- Analysis of the impacts of implementation of I FRS 10 and IFRS 11 Note 1 Accounting principles and methods within the Group, judgements and estimates used states that the consolidation standards IFRS 10, 11 and 12 and IAS 28 as amended, entered into force on 1 January 2014 with retrospective application. These developments in standards tend towards a review of the nature of the interests held in terms of the new control criteria and a change to the method of consolidation in the event of joint control as well as the information to provide in appendix. In addition to the information provided in note 1, the impacts relating to the implementation of new consolidation standards are set out in Note 9 Impact of accounting changes (new consolidation standards) or other events and Note 11 Scope of consolidation at 30 June 2014. IV- Equity interest in the Bank of Italy Legislative Decree No. 2013-133 of 30 November 2013, transposed, with amendments, into Law No. 2014-5 of 29 January 2014 introduced many new features in terms of the economic and administrative rights attached to the shares constituting the capital of the Bank of Italy. These changes were incorporated in the new articles of association of the Bank of Italy, validated by the extraordinary meeting of 23 December 2013 and approved by decree by the President of the Republic of Italy on 27 December 2013. These developments substantially changed the nature of the equity securities of the Bank of Italy, as seen by the opinion of independent professionals. On this basis, the Italian banks holding these shares, in accordance with the rules laid down by IAS 39, considered the new shares as separate financial instruments, distinct from those issued prior to Legislative Decree No. 2013-133, and consequently, organised an exchange of shares, with recognition of the new shares

Interim condensed consolidated financial statements of Crédit Agricole Group - 30 June 2014
23
based on their fair value. They also considered that these new shares had characteristics allowing them to be recorded as Available-for-sale financial assets, in accordance with IFRS requirements. It should be noted that some national and international authorities are currently conducting extensive analyses of the handling of this transaction in the international standards repository. The conclusions from these analyses could highlight a different interpretation of the IFRS accounting principles, which may call into question the processing adopted. The shareholding of the Cariparma group, i.e. 6,360 equity securities of the Bank of Italy, representing 2.12% of share capital, was recorded as Available-for-sale shares for €67 million in the consolidated financial statements of Crédit Agricole Group S.A. at 31 December 2013. The new shares of the Bank of Italy, each with a unit value of €25,000, subscribed by Cariparma, were recorded as Available-for-sale assets for €159 million, while maintaining the holding rate for capital of the Bank of Italy at 2.12%. This exchange of shares led to the recognition in the first half of 2014 of a capital gain of €92 million posted under Gains and losses on available-for-sale financial assets. The fair value of securities received falls under a special tax regime of 12% resulting from the law of 29 January 2014. In addition, on 24 April 2014 a decree was issued concerning various tax measures, which included an increase in the tax rate applicable to the exchange of shares in the Bank of Italy from 12% to 26%. A tax expense of €33 million, corresponding to a tax rate of 26%, was recorded in the financial statements at 30 June 2014. The impact of this transaction on Net income, Group share was €50 million. V- Specific guarantees provided by the Regional Ban ks to Crédit Agricole S.A. (Switch) By the amendment signed on 19 December 2013, Crédit Agricole S.A. and the Regional Banks decided to extend the guarantee base granted by the Regional Banks to Crédit Agricole S.A. on 23 December 2011 to Crédit Agricole S.A.’s equity investment in Crédit Agricole Assurances (CAA). The new guarantees took effect on 2 January 2014, now allowing a transfer of prudential requirements for the investments of Crédit Agricole S.A. in Crédit Agricole Assurances (CAA), the latter assessed according to the equity method for prudential purposes. The maturity of the total guarantees remains unchanged (1 March 2027), but some early termination options were introduced covering the beneficiary. Overall, the amount in respect of Switch guarantees stood at €23.9 billion or a risk-weighted-assets equivalent of €87 billion, corresponding to a saving in terms of regulatory capital requirements of €8.1 billion. Thus, in the event of a decrease in the equity-accounted value, the Regional Banks bear the loss in value for up to the maximum amount covered, i.e. €23.9 billion, with a clawback provision. If the guarantees are used, the corresponding compensation is deducted by Crédit Agricole S.A. from the security deposits, which are in turn replenished by the Regional Banks in line with new regulatory requirements.

Interim condensed consolidated financial statements of Crédit Agricole Group - 30 June 2014
24
The general mechanism for the system is similar to the first tranche of the transaction, but the substance of the contract is now treated as an insurance contract, due to the existence of an overall insurance risk, according to IFRS 4. In the accounts, the total guarantees are treated in the same way as financial guarantees received while remuneration of these is recorded in its entirety in Revenues. If the total guarantees are called in and, where applicable, upon a subsequent return to better fortunes, the loss-related proceeds and the repayment charge are recognised respectively in Cost of risk. VI- Issue by Crédit Agricole S.A. of deeply subordi nated perpetual bonds In connection with the strengthening of the Group’s regulatory capital, Crédit Agricole S.A. issued Additional Tier 1 deeply subordinated perpetual bonds at revisable fixed rates: An initial issue on 15 January 2014 for USD 1.75 billion; A second issue on 1 April 2014 for GBP 0.5 billion; A third issue on 1 April 2014 for EUR 1 billion. These deeply subordinated perpetual bonds, incorporating discretionary clauses relating to the payment of interest, are classified as equity instruments pursuant to IFRS standards and recognised as Capital and related reserves, for a total of €2,890 million at 30 June 2014 (see Statement of changes in equity). Interest paid and share premium are recognised as a deduction from equity. In accordance with IAS 12, the tax saving resulting from the payment of interest is recognised as income for the period to the extent that such tax does not constitute a withholding, and that the interest paid is deducted from the accumulated retained earnings of Crédit Agricole S.A. Under the new CRDIV/CRR European regulations applicable on 1 January 2014, these bonds are included in the calculation of the Additional Tier 1 equity capital of Crédit Agricole Group.

Interim condensed consolidated financial statements of Crédit Agricole Group - 30 June 2014
25
1.3. Goodwill
(in millions of euros)
31.12.2013RestatedGROSS
31.12.2013Restated
NET
Increases (Acquisitions)
Decreases (Divestments)
Impairment losses during
the period
Translation adjustments
Other movements
30.06.2014GROSS
30.06.2014NET
French Retail Banking 5,596 5,560 - - - - - 5,596 5,560
- o/w LCL Group 5,558 5,558 - - - - - 5,558 5,558
- o/w Regional Banks 38 2 - - - - - 38 2
Specialised financial services 2,748 1,024 - - - - - 2,748 1,024
- o/w Consumer finance (1) 1,715 954 - - - - - 1,715 954- o/w Consumer finance - Agos 569 - - - - - - 569 -- o/w Consumer finance - Car partnerships - - - - - - - - -
- o/w factoring 464 70 - - - - - 464 70
Savings management 4,710 4,710 13 - - 3 (3) 4,723 4,723
- o/w asset management 2,137 2,137 13 - - 2 - 2,152 2,152
- o/w investor services 655 655 - - - - - 655 655
- o/w insurance 1,262 1,262 - - - - (3) 1,259 1,259
- o/w international private banking 656 656 - - - 1 - 657 657Corporate and investment banking 1,807 487 - - - - - 1,807 487
- o/w corporate and investment banking (excluding brokers)
1,807 487 - - - - - 1,807 487
- o/w brokers, other (2)
International retail banking 3,724 2,241 - - - (1) (129) 3,561 2,111
- o/w Italy 3,042 1,761 - - - - - 3,042 1,761
- o/w Poland 265 265 - - - - - 265 265
- o/w Ukraine 115 - - - - - - 82 -
- o/w other countries 302 215 - - - (1) (129) 172 85
Corporate centre (3) 72 72 - - - - - 72 72
Total 18,657 14,094 13 - - 2 (132) 18,507 13,977
Group Share 18,363 13,907 10 - - 1 (96) 18,250 13,821
Non-controlling interests 294 188 3 - - 1 (36) 259 156
As part of the interim accounts closing process and in accordance with Group principles, given the absence of objective indications of impairment, no additional impairment of goodwill was recorded at 30 June 2014.
1.4. Related parties Parties related to Crédit Agricole Group are:
- companies that have the exclusive or joint control of the Group, or that have a significant influence over the Group, either directly or indirectly;
- companies controlled by the Group, either directly or indirectly, with exclusive control; - companies that are over significant influence from the Group; - companies that are directly or indirectly under joint control with the Group; - companies over which a physical person, related party to the Group, detains exclusive
control, significant influence, or significant voting right; - retirement, early retirement and end-of-career allowances that benefit to employees of the
Group or to employees of one of the related parties of the Group.

Interim condensed consolidated financial statements of Crédit Agricole Group - 30 June 2014
26
� Relationships between controlled companies affectin g the consolidated balance sheet
The list of Crédit Agricole Group companies can be found in Note 11 Scope of consolidation at 30 June 2014. Transactions and outstandings at the period end between fully consolidated companies are eliminated in full on consolidation. Therefore, the Group’s consolidated financial statements are only affected by those transactions between fully consolidated companies and proportionately consolidated companies, consolidated according to the equity method pursuant to IFRS 11. The main corresponding outstandings in the consolidated balance sheet at 30 June 2014 relate to the UBAF, Menafinance, FGA Capital and Forso Groups for the following amounts:
• loans and receivables due from customers: €3,433 million; • loans and receivables due from credit institutions: €1,800 million; • due to credit institutions: €597 million ;
The transactions entered into with these Groups did not have a material effect on the income statement for the period.
� Other shareholders’ agreements
No other shareholders’ agreement concerning Crédit Agricole S.A. had been made public or existed at 30 June 2014.

Interim condensed consolidated financial statements of Crédit Agricole Group - 30 June 2014
27
3. Notes to the income statement and comprehensive income To ensure the comparability of financial statements in accordance with IFRS 5, the contributions at 30 June 2013 of Newedge, the Nordic entities of CA Consumer Finance, Crédit Agricole Bulgaria and Crelan, and at 31 December 2013 of Crelan in the income statement of Crédit Agricole Group were reclassified as Net income from discontinued or held-for-sale operations.
3.1. Interest income and expenses
584 1,393 66612,406 26,018 13,016
3,566 7,099 3,578
463 913 4501,183 2,430 1,437
504 1,084 5458 36 23
(436) (917) (469)(3,812) (8,432) (4,457)(2,348) (4,634) (2,470)
(720) (1,426) (726)(1,368) (2,480) (1,370)
(124) (266) (133)70 153 82
Accrued interest receivable on hedging instruments
(in millions of euros)30/06/2014
Interbank transactionsCustomer transactionsAccrued interest receivable on available-for-sale financial assets
Accrued interest receivable on held-to-maturity investments
31/12/2013Restated
30/06/2013 Restated
Debt securities
Finance leasesOther interest income
Interest and similar income (1) 18,714
Interbank transactionsCustomer transactions
38,973 19,715
Subordinated debtAccrued interest receivable on hedging instrumentsFinance leasesOther interest expense
Interest and similar expenses (8,738) (18,002) (9,543)
(1) Including €241 million on receivables impaired individually at 30 June 2014 compared to €521 million at 30 June 2013 and €280 million at 31 December 2013.
3.2. Net fees and commissions
91 (31) 60 250 (60) 190 127 (37) 901,748 (111) 1,637 3,469 (200) 3,269 1,762 (97) 1,665
27 (40) (13) 184 (167) 17 156 (131) 2516 (6) 10 39 (13) 26 21 (7) 14
146 (88) 58 242 (125) 117 135 (79) 56
2,182 (750) 1,432 4,316 (1,402) 2,914 2,196 (786) 1,410
1,379 (230) 1,149 2,764 (547) 2,217 1,347 (188) 1,159
5,589 (1,256) 4,333 11,264 (2,514) 8,750 5,744 (1,325) 4,419
30/06/2013Restated
Payment instruments and other banking and financial servicesMutual funds management, fiduciary and similar operations
Net fees and commissions
Net
Foreign exchange transactionsDerivative instruments and other off-balance sheet items
Income Expense Net
Interbank transactionsCustomer transactionsSecurities transactions
Income Expense(in millions of euros)
30/06/2014
Income Expense Net
31/12/2013Restated

Interim condensed consolidated financial statements of Crédit Agricole Group - 30 June 2014
28
3.3. Net gains (losses) on financial instruments at fair value through profit or loss
(in millions of euros) 30/06/201431/12/2013 Restated
30/06/2013Restated
342 436 158
895 (32) (862)
2,178 2,538 342
(84) 566 1,332
29 (106) (89)
3,360 3,402 881
Dividends receivedUnrealised or realised gains (losses) on assets/liabilities at fair value through profit
or loss (1)
Unrealised or realised gains (losses) on assets/liabilities designated at fair value
through profit or loss (2)
Net gains (losses) on foreign exchange transactions and similar financial instruments (excluding gains or losses on hedges of net investments in foreign operations)Gains (losses) from hedge accountingNet gains (losses) on financial instruments at fair value through profit or loss(1) This entry mainly includes changes in the value of assets on unit-linked contracts/policies for €1,558 million (-€15 million at 30 June 2013 compared to €1,542 million at 30 June 2014) due to changes in the financial markets. An opposite movement was recognised on the change to the technical reserves for these contracts in "Net income from other activities."
The impacts relating to the issuer spreads resulted, in revenues, in an expense of -€99 million at 30 June 2014 compared to an expense of -€393 million at 30 June 2013 and to an expense of -€529 million at 31 December 2013. From 1 January 2014, the impact of the Fair Value Adjustment on unsecured derivative instruments has been recognised in the amount of -€167 million. The impact at 1 January 2013 of the first application of IFRS 13 regarding fair value measurement in Crédit Agricole S.A. Group came to -€138 million in Revenues (CVA = -€388 million/DVA = +€250 million).

Interim condensed consolidated financial statements of Crédit Agricole Group - 30 June 2014
29
Analysis of net gains (losses) from hedge accounting:
30/06/2014Gains Losses Net
4,781 (4,784) (3)2,450 (2,177) 2732,331 (2,607) (276)
- - -- - -- - -- - -
24,949 (24,956) (7)
11,687 (13,254) (1,567)13,262 (11,702) 1,560
52 (13) 39
52 (13) 39
29,782 (29,753) 29
Change in fair value of hedging derivatives
(in millions of euros)Fair value hedgesChange in fair value of hedged items attributable to hedged risksChange in fair value of hedging derivatives (including termination of hedges)Cash flow hedgesChange in fair value of hedging derivatives - ineffective portionHedges of net investments in foreign operationsChange in fair value of hedging derivatives - ineffective portionFair value hedge of the interest rate exposure of a portfolio of financial instrumentsChange in fair value of hedged items
Cash flow hedge of the interest rate exposure of a portfolio of financial instrumentsChange in fair value of hedging instrument - ineffective portion
Total gains (losses) from hedge accounting
31/12/2013 Restated
Gains Losses Net11,087 (11,112) (25)4,711 (6,249) (1,538)6,376 (4,863) 1,513
- - -- - -- - -- - -
34,396 (34,391) 5
17,458 (16,985) 47216,938 (17,405) (467)
10 (96) (86)
10 (96) (86)45,493 (45,599) (106)
(in millions of euros)Fair value hedgesChange in fair value of hedged items attributable to hedged risksChange in fair value of hedging derivatives (including termination of hedges)Cash flow hedgesChange in fair value of hedging derivatives - ineffective portionHedges of net investments in foreign operationsChange in fair value of hedging derivatives - ineffective portionFair value hedge of the interest rate exposure of a portfolio of financial instrumentsChange in fair value of hedged itemsChange in fair value of hedging derivativesCash flow hedge of the interest rate exposure of a portfolio of financial instrumentsChange in fair value of hedging instrument - ineffective portionTotal gains (losses) from hedge accounting
30/06/2013 Restated
Gains Losses Net6,853 (6,881) (28)3,538 (3,307) 2313,315 (3,574) (259)
- - -- - -- - -- - -
24,871 (24,855) 16
12,969 (12,031) 93811,902 (12,824) (922)
4 (80) (76)
4 (80) (76)31,727 32,152 (89)
Cash flow hedges
Fair value hedges
Change in fair value of hedging derivatives (including termination of hedges)Change in fair value of hedged items attributable to hedged risks
Change in fair value of hedging instrument - ineffective portionTotal gains (losses) from hedge accounting
Hedges of net investments in foreign operationsChange in fair value of hedging derivatives - ineffective portionFair value hedge of the interest rate exposure of a portfolio of financial instrumentsChange in fair value of hedged itemsChange in fair value of hedging derivativesCash flow hedge of the interest rate exposure of a portfolio of financial instruments
Change in fair value of hedging derivatives - ineffective portion
(in millions of euros)
Interim condensed consolidated financial statements of Crédit Agricole Group - 30 June 2014
30
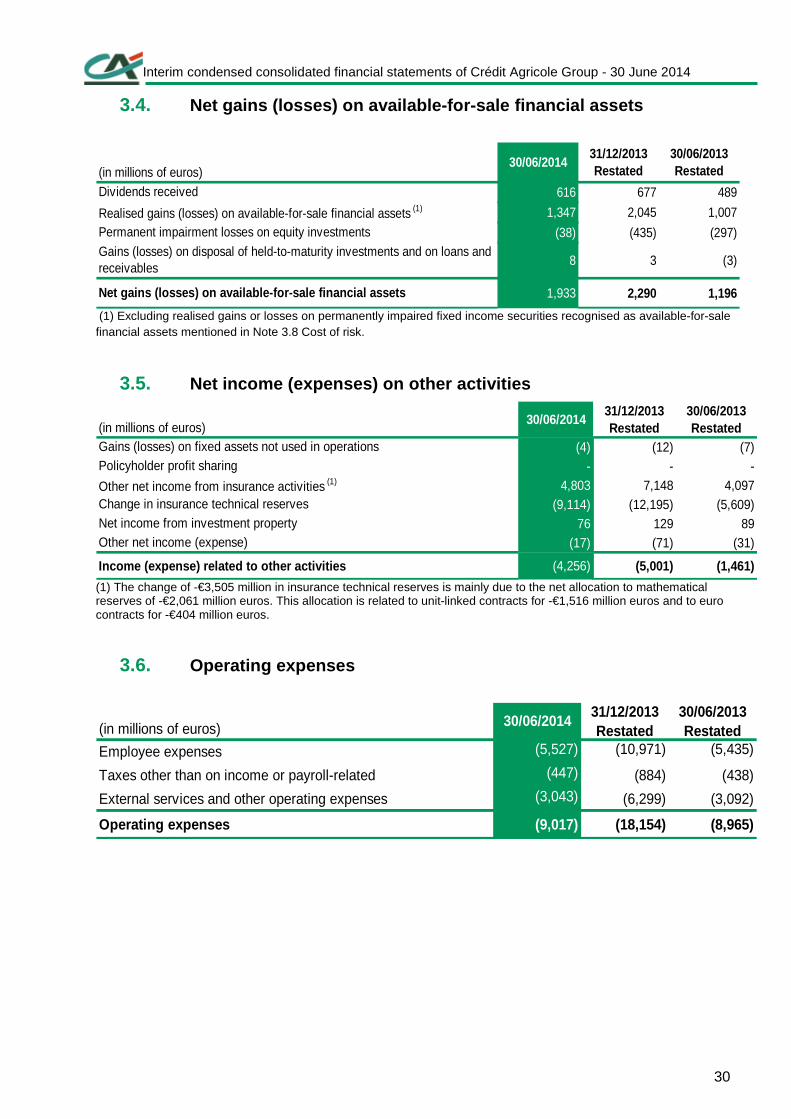
3.4. Net gains (losses) on available-for-sale financial assets
(in millions of euros)30/06/2014
31/12/2013Restated
30/06/2013 Restated
616 677 489
1,347 2,045 1,007
(38) (435) (297)
8 3 (3)
1,933 2,290 1,196
Dividends received
Realised gains (losses) on available-for-sale financial assets (1)
Permanent impairment losses on equity investments
Gains (losses) on disposal of held-to-maturity investments and on loans and receivables
Net gains (losses) on available-for-sale financial assets
(1) Excluding realised gains or losses on permanently impaired fixed income securities recognised as available-for-sale financial assets mentioned in Note 3.8 Cost of risk.
3.5. Net income (expenses) on other activities
(in millions of euros)30/06/2014
31/12/2013 Restated
30/06/2013 Restated
(4) (12) (7)- - -
4,803 7,148 4,097(9,114) (12,195) (5,609)
76 129 89(17) (71) (31)
Income (expense) related to other activities (4,256) (5,001) (1,461)
Other net income from insurance activities (1)
Change in insurance technical reserves Net income from investment propertyOther net income (expense)
Policyholder profit sharingGains (losses) on fixed assets not used in operations
(1) The change of -€3,505 million in insurance technical reserves is mainly due to the net allocation to mathematical reserves of -€2,061 million euros. This allocation is related to unit-linked contracts for -€1,516 million euros and to euro contracts for -€404 million euros.
3.6. Operating expenses
(in millions of euros) 30/06/201431/12/2013Restated
30/06/2013 Restated
Employee expenses (5,527) (10,971) (5,435)
Taxes other than on income or payroll-related (447) (884) (438)
External services and other operating expenses (3,043) (6,299) (3,092)
Operating expenses (9,017) (18,154) (8,965)

Interim condensed consolidated financial statements of Crédit Agricole Group - 30 June 2014
31
Analysis of employee expenses
(in millions of euros)30/06/2014
31/12/2013Restated
30/06/2013Restated
Salaries (1)(3,345) (6,666) (3,358)
Contributions to defined-contribution plans (314) (638) (314)Contributions to defined-benefit plans (89) (96) (23)Other social security expenses (969) (1,978) (987)Profit-sharing and incentive plans (379) (712) (341)Payroll-related tax (431) (881) (412)Total employees expenses (5,527) (10,971) (5,435) (1) Salaries include expenses relating to share-based payments for €27 million at 30 June 2014 compared to expenses of €57 million at 31 December 2013 and an expense of €30 million at 30 June 2013.
3.7. Depreciation, amortisation and impairment of proper ty, plant & equipment and intangible assets
(in millions of euros)30/06/2014
31/12/2013 Restated
30/06/2013 Restated
(489) (1,034) (504)(359) (753) (372)(130) (281) (132)
3 (6) 13 1 1
- (7) -
(486) (1,040) (503)
Intangible assetsDepreciation, amortisation and impairment of property, plant & equipment and intangible assets
Depreciation charges and amortisation Property, plant and equipmentIntangible assetsImpairment losses (reversals)Property, plant and equipment
Interim condensed consolidated financial statements of Crédit Agricole Group - 30 June 2014
32
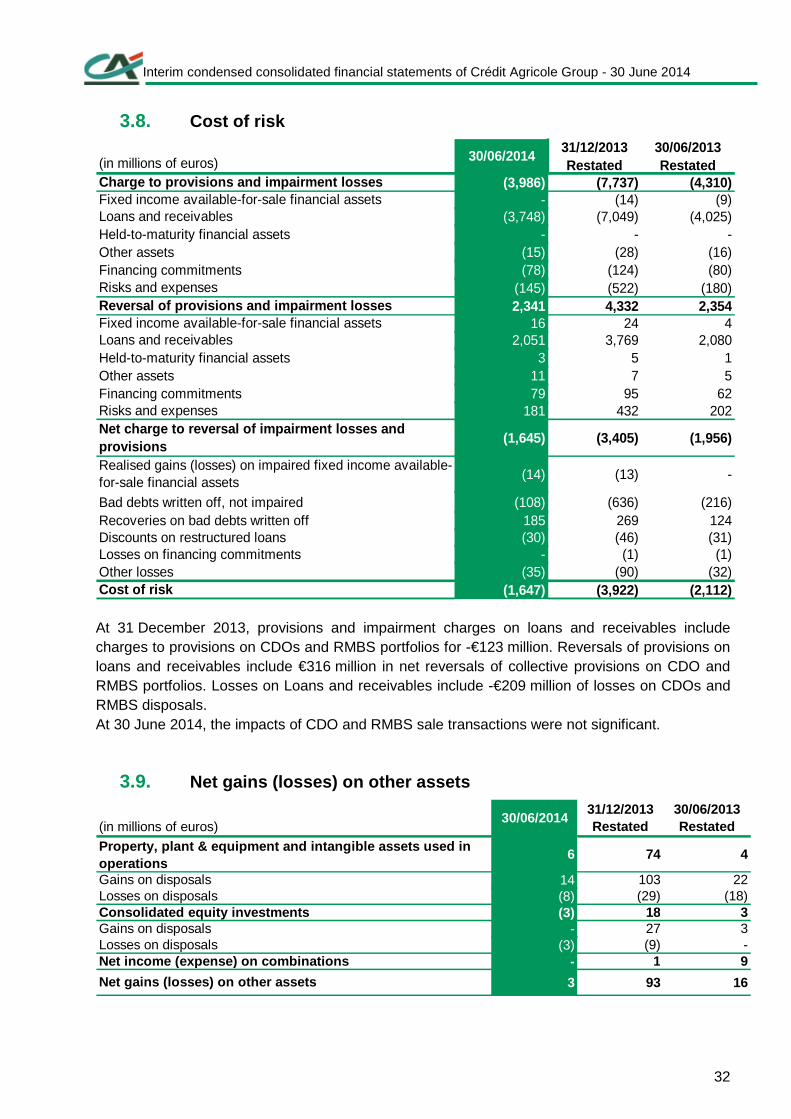
3.8. Cost of risk
(in millions of euros) 30/06/201431/12/2013 Restated
30/06/2013 Restated
(3,986) (7,737) (4,310)- (14) (9)
(3,748) (7,049) (4,025)Held-to-maturity financial assets - - -Other assets (15) (28) (16)Financing commitments (78) (124) (80)
(145) (522) (180)2,341 4,332 2,354
16 24 42,051 3,769 2,080
Held-to-maturity financial assets 3 5 1Other assets 11 7 5Financing commitments 79 95 62
181 432 202
(1,645) (3,405) (1,956)
(14) (13) -
Bad debts written off, not impaired (108) (636) (216)Recoveries on bad debts written off 185 269 124Discounts on restructured loans (30) (46) (31)Losses on financing commitments - (1) (1)Other losses (35) (90) (32)
(1,647) (3,922) (2,112)
Charge to provisions and impairment lossesFixed income available-for-sale financial assetsLoans and receivables
Cost of risk
Reversal of provisions and impairment lossesRisks and expenses
Fixed income available-for-sale financial assetsLoans and receivables
Risks and expensesNet charge to reversal of impairment losses and provisionsRealised gains (losses) on impaired fixed income available-for-sale financial assets
At 31 December 2013, provisions and impairment charges on loans and receivables include charges to provisions on CDOs and RMBS portfolios for -€123 million. Reversals of provisions on loans and receivables include €316 million in net reversals of collective provisions on CDO and RMBS portfolios. Losses on Loans and receivables include -€209 million of losses on CDOs and RMBS disposals. At 30 June 2014, the impacts of CDO and RMBS sale transactions were not significant.
3.9. Net gains (losses) on other assets
(in millions of euros)30/06/2014
31/12/2013 Restated
30/06/2013 Restated
6 74 4
14 103 22(8) (29) (18)(3) 18 3
- 27 3(3) (9) -
Net income (expense) on combinations - 1 9
3 93 16
Losses on disposals
Property, plant & equipment and intangible assets u sed in operationsGains on disposals
Consolidated equity investmentsGains on disposalsLosses on disposals
Net gains (losses) on other assets

Interim condensed consolidated financial statements of Crédit Agricole Group - 30 June 2014
33
3.10. Change in other comprehensive income
(in millions of euros)30/06/2014
31/12/2013Restated
30/06/2013Restated
Other comprehensive income on items that may be rec lassified subsequently to profit and loss Gains and losses on translation adjustements (11) (287) (108)Revaluation adjustment of the period - - -Reclassified to profit and loss - - -Other reclassifications (11) (287) (108)Gains and losses on available-for-sale financial assets 1,281 (89) (681)Revaluation adjustment of the period 1,941 581 (371)Reclassified to profit and loss (809) (680) (313)Other reclassifications 149 10 3Gains and losses on hedging derivative instruments 340 (404) (248)Revaluation adjustment of the period 311 (360) (278)Reclassified to profit and loss 2 6 3Other reclassifications 27 (50) 27Gains and losses on non-current assets held for sale 43 15 (16)Revaluation adjustment of the period - - (6)Reclassified to profit and loss - - -Other reclassifications 43 15 (10)Pre-tax other comprehensive income on items that may be reclassified to profit and loss on equity-accounted entities
27 (123) 15
Income tax related to items that may be reclassified to profit and loss excluding equity-
accounted entities (1) (472) 241 371
Income tax related to items that may be reclassified to profit and loss on equity-accounted entities
- (4) (11)
Other comprehensive income on items that may be rec lassified subsequently to profit and loss net of income tax
1,208 (651) (678)
Other comprehensive income on items that will not b e reclassified subsequently to profit and loss Actuarial gains and losses on post-employment benefits (140) 40 (5)Gains and losses on non-current assets held for sale - 2 -Other comprehensive income on items that will not be reclassified to profit and loss on equity-accounted entities
(10) (40) (39)
Income tax related to items that will not be reclassified excluding equity-accounted entities 49 (17) 2
Income tax related to items that will not be reclassified on equity-accounted entities (1) - 1Other comprehensive income on items that will not b e reclassified subsequently to profit and loss net of income tax
(102) (15) (41)
Other comprehensive income net of income tax 1,106 (666) (719)of which Group share 1,109 (573) (705)
of which non-controlling interests (3) (93) (14)

Interim condensed consolidated financial statements of Crédit Agricole Group - 30 June 2014
34
Details of tax effects relating to other comprehens ive income
(in millions of euros)
GrossIncome tax
chargesNet of
income tax
Net of income tax o/w Group
Share
GrossIncome tax
chargesNet of
income tax
Net of income tax o/w Group
Share
GrossIncome tax
chargesNet of
income tax
Net of income tax o/w Group
Share
Gains and losses on translation adjustements (441) - (441) (259) (11) - (11) (13) (452) - (452) (272)
Gains and losses on available-for-sale financial assets 4,161 (1,030) 3,131 3,090 1,281 (362) 919 931 5,442 (1,392) 4,050 4,021
Gains and losses on hedging derivative instruments 458 (133) 325 324 340 (111) 229 227 798 (244) 554 551
(40) (2) (42) (39) 43 1 44 40 3 (1) 2 1
4,138 (1,165) 2,973 3,116 1,653 (472) 1,181 1,185 5,791 (1,637) 4,154 4,301
(49) 4 (45) (41) 27 - 27 26 (22) 4 (18) (15)
4,089 (1,161) 2,928 3,075 1,680 (472) 1,208 1,211 5,769 (1,633) 4,136 4,286
(374) 113 (261) (254) (140) 49 (91) (90) (514) 162 (352) (344)
- - - - - - - - - - - -
(374) 113 (261) (254) (140) 49 (91) (90) (514) 162 (352) (344)
(193) 3 (190) (190) (10) (1) (11) (12) (203) 2 (201) (202)
(567) 116 (451) (444) (150) 48 (102) (102) (717) 164 (553) (546)
3,522 (1,045) 2,477 2,631 1,530 (424) 1,106 1,109 5,052 (1,469) 3,583 3,740
Other comprehensive income on items that may be reclassified to profit andloss excluding equity-accounted entities
Other comprehensive income on items that may be reclassified to profit andloss on equity-accounted entities
31/12/2013Restated
Changes 30/06/2014
Other comprehensive income on items that may be rec lassified subsequently to profit and loss
Gains and losses on non-current assets held for sale
Other comprehensive income
Other comprehensive income on items that may be rec lassified subsequently to profit and loss
Actuarial gains and losses on post-employment benefits
Gains and losses on non-current assets held for saleOther comprehensive income on items that will not be reclassified to profitand loss excluding equity-accounted entities
Other comprehensive income on items that will not be reclassified to profitand loss on equity-accounted entities
Other comprehensive income on items that will not be reclass ified toprofit and loss
Other comprehensive income on items that will not b e reclassified subsequently to profit and loss

Interim condensed consolidated financial statements of Crédit Agricole Group - 30 June 2014
35
(in millions of euros)
GrossIncome tax
chargesNet of
income tax
Net of income tax o/w which
Group Share
GrossIncome tax
chargesNet of
income tax
Net of income tax o/w which
Group Share
GrossIncome tax
chargesNet of
income tax
Net of income tax o/w which
Group Share
Gains and losses on translation adjustements (154) - (154) (75) (108) - (108) (108) (262) - (262) (183)Gains and losses on available-for-sale financial assets 4,250 (1,134) 3,116 3,086 (681) 276 (405) (395) 3,569 (858) 2,711 2,691
862 (271) 591 588 (248) 93 (155) (154) 614 (178) 436 434(55) (2) (57) (51) (16) 2 (14) (13) (71) - (71) (64)
4,903 (1,407) 3,496 3,548 (1,053) 371 (682) (670) 3,850 (1,036) 2,814 2,878
74 8 82 84 15 (11) 4 5 89 (3) 86 89
4,977 (1,399) 3,578 3,632 (1,038) 360 (678) (665) 3,939 (1,039) 2,900 2,967
(414) 130 (284) (279) (5) 2 (3) (3) (419) 132 (287) (282)(2) - (2) - - - - - (2) - (2) -
(416) 130 (286) (279) (5) 2 (3) (3) (421) 132 (289) (282)(153) 2 (151) (150) (39) 1 (38) (37) (192) 3 (189) (187)
(569) 132 (437) (429) (44) 3 (41) (40) (613) 135 (478) (469)
4,408 (1,267) 3,141 3,203 (1,082) 363 (719) (705) 3,326 (904) 2,422 2,498
30/06/2013Restated
Other comprehensive income on items that may be rec lassified to profit and loss
Gains and losses on non-current assets held-for-sale
Other comprehensive income on items that may be rec lassified to profit and loss
Other comprehensive income on items that may be reclassified to profit andloss on equity-accounted entities
Other comprehensive income on items that may be reclassified to profit andloss excluding equity-accounted entities
31/12/2012Restated
Changes
Gains and losses on hedging derivative instruments
Other comprehensive income
Other comprehensive income on items that will not be reclassified to profit Other comprehensive income on Items that will not be reclassified to profit Other comprehensive income on items that will not be reclass ified toprofit and loss
Other comprehensive income on items that will not b e reclassified to profit and loss Change in actuarial gains and losses on post-employment benefitsNon-current assets and disposal Groups held-for-sale
Interim condensed consolidated financial statements of Crédit Agricole Group - 30 June 2014
36
4. Segment reporting Definition of operating segments According to IFRS 8, information disclosed is based on the internal reporting that is used by the Executive Committee to manage Crédit Agricole S.A, to assess performance, and to make decisions about resources to be allocated to the identified operating segments. Operating segments according to the internal reporting consist of the business lines of the Group. Within Crédit Agricole, activities are organised into seven operating segments: • Six business lines:
• French retail banking – Regional Banks, • French retail banking – LCL Network, • International retail banking, • Savings management and Insurance • Specialised financial services, • Corporate and investment banking;
• and also the Corporate centre. Presentation of business lines
1. French retail banking – Regional Banks
This business line comprises the Regional Banks and their subsidiaries. The Regional Banks provide banking services for individual customers, farmers, small businesses, corporates and local authorities, with a very strong local presence. The Regional Banks of Crédit Agricole provide a comprehensive range of banking and financial services: savings facilities (monetary, bonds, shares), life insurance investment, granting of loans, particularly for housing and consumption, payment instruments offering. In addition to life insurance, they also provide a broad range of property and casualty and death & disability insurance, as well as life insurance.

Interim condensed consolidated financial statements of Crédit Agricole Group - 30 June 2014
37
2. French retail banking – LCL Network This business line comprises the LCL branch network in France, which has a strong focus on urban areas and a segmented customer approach (individual customers, small businesses and small and medium-sized enterprises). LCL offers a full range of banking products and services, together with asset management, insurance and wealth management products.
3. International retail banking This business line encompasses foreign subsidiaries and investments - fully consolidated or equity- accounted entities - that are mainly involved in retail banking. These subsidiaries and investments are primarily located in Europe: Cariparma FriulAdria and Carispezia in Italy, Crédit Agricole Polska in Poland, Banco Espirito Santo in Portugal, Bankoa in Spain, PJSC Credit Agricole Bank in Ukraine, Crédit Agricole Banka Srbija A.D. Novi Sad in Serbia, Crédit Agricole Romania, Crédit Agricole Bank Albania S.A. and Crelan S.A. in Belgium recognised under Net income from discontinued or held-for-sale operations, pursuant to IFRS 5. The subsidiaries are, to a lesser extent, in the Middle East and Africa (Crédit du Maroc, Crédit Agricole Egypt, etc.). Foreign subsidiaries covering consumer finance, leasing and factoring (subsidiaries of CA Consumer Finance, Crédit Agricole Leasing & Factoring and EFL in Poland, etc.) are however not included in this division, but rather assigned to the “Specialised Financial Services" division.
4. Savings management and insurance This business line encompasses: • the asset management activities of the Amundi Group, offering savings solutions for individuals
and investment solutions for institutions;
• financial services to institutional investors: Caceis Bank for custodial operations and Caceis Fund Administration for fund administration operations;
• life insurance and personal insurance (Predica and Médicale de France in France and CA Vita in Italy);
• property & casualty insurance (Pacifica and BES Seguros in Portugal);
• creditor insurance activities (conducted by Crédit Agricole Creditor Insurance); • private banking activities conducted mainly by CA Indosuez Private Banking and by Crédit
Agricole CIB subsidiaries (Crédit Agricole Suisse, Crédit Agricole Luxembourg and Crédit Foncier de Monaco, etc.).
Interim condensed consolidated financial statements of Crédit Agricole Group - 30 June 2014
38
5. Specialised financial services Specialised financial services comprises the Group subsidiaries that provide banking products and services to individual customers, small businesses, corporates and local authorities in France and abroad. These include: • consumer finance companies associated with Crédit Agricole Consumer Finance in France and
through its subsidiaries or partnerships abroad (Agos S.p.A. Forso, Credit-Plus, Ribank, Credibom, Interbank Group and FGA Capital S.p.A);
• specialised financial services for companies such as factoring and lease finance (Crédit Agricole Leasing & Factoring Group, EFL).
6. Corporate and investment banking Corporate and investment banking breaks down into three major businesses, most of which are carried out by Crédit Agricole CIB: • financing activities include commercial banking in France and internationally and structured
finance: project finance, aeronautical finance, shipping finance, acquisition finance, real estate finance, international trade;
• capital markets and investment activities cover capital market activities (cash, foreign exchange, interest-rate derivatives and debt markets) and investment banking activities (consulting on mergers and acquisitions and primary equity activities);
• since the new organisation of Crédit Agricole CIB was established in the third quarter of 2012, following the adjustment plan, businesses in run-off now include the correlation business, the CDO, CLO and ABS portfolios, the equity derivatives excluding corporates and convertibles, the exotic rate derivatives, and the impaired portfolios of residential underlyings.
7. Corporate Centre
This business line encompasses mainly Crédit Agricole S.A.’s central body function, asset and liability management and management of debt connected with acquisitions of subsidiaries or equity investments. It also includes the results of the private equity business and results of various other Crédit Agricole Group companies (Uni-Éditions, Foncaris, etc.). This segment also includes the income from resource pooling companies, real-estate companies holding properties used in operations by several business lines and activities undergoing reorganisation. Lastly, it also incorporates the net impact of tax consolidation for Crédit Agricole S.A. as well as the revaluation of structured debt issued by Crédit Agricole CIB.

Interim condensed consolidated financial statements of Crédit Agricole Group - 30 June 2014
39
4.1. Operating segment information Transactions between operating segments are effected at arm’s length. Segment assets are calculated on the basis of accounting items comprising the balance sheet for each operating segment.
(in millions of euros)
Regional Banks
LCL
Revenues 7,318 1,891 1,401 2,554 1,364 1,913 (1,095) 15,346
Operating expenses (3,980) (1,259) (758) (1,271) (664) (1,123) (448) (9,503)
Gross operating income 3,338 632 643 1,283 700 790 (1,543) 5,843Cost of risk (516) (125) (404) (45) (543) (105) 91 (1,647)
Operating income 2,822 507 239 1,238 157 685 (1,452) 4,196
Share of net income of equity-accounted entities - - (722) 7 68 86 34 (527)
Net gains (losses) on other assets - - (2) 6 - (1) - 3Change in value of goodwill (1) - - - - - - (1)
Pre-tax income 2,821 507 (485) 1,251 225 770 (1,418) 3,671
Income tax charge (1,012) (184) (71) (422) (48) (214) 568 (1,383)
Net gains (losses) on discontinued operations - - 12 - (9) 2 - 5
Net income for the period 1,809 323 (544) 829 168 558 (850) 2,293
Non-controlling interests - - 30 65 10 - 63 168
Net income Group share 1,809 323 (574) 764 158 558 (913) 2,125
30/06/2014French Retail Banking
International retail banking
Specialised financial services
Savings management
and Insurance
Corporate and
investment banking
Corporate
centre (1) Total
(1) The Crédit Agricole CIB issuer spread is classified under the Corporate Centre for -€99 million in Revenues, +€34 million in Income tax charge, -€65 million in Net income.
(in millions of euros)
Regional Banks
LCL
Revenues 14,873 3,811 2,515 5,130 2,902 3,569 (2,388) 30,412Operating expenses (8,025) (2,514) (1,572) (2,494) (1,422) (2,286) (881) (19,194)Gross operating income 6,848 1,297 943 2,636 1,480 1,283 ( 3,269) 11,218Cost of risk (1,024) (304) (609) (27) (1,459) (496) (3) (3,922)Operating income 5,824 993 334 2,609 21 787 (3,272) 7,296Share of net income of equity-accounted entities (11) - (106) 16 123 127 44 193Net gains (losses) on other assets (3) 5 9 2 - (1) 81 93Change in value of goodwill (22) - - - - - - (22)Pre-tax income 5,788 998 237 2,627 144 913 (3,147) 7,560Income tax charge (2,121) (368) (96) (901) (27) (278) 1,632 (2,159)Net gains (losses) on discontinued operations - - 19 - (76) 156 - 99Net income for the period 3,667 630 160 1,726 41 791 (1,51 5) 5,500Non-controlling interests 1 - 92 155 (43) (3) 162 364Net income Group share 3,666 630 68 1,571 84 794 (1,677) 5,136
31/12/2013Restated
French Retail BankingInternational retail banking
Savings management
and Insurance
Specialised financial services
Corporate and
investment banking
Corporate
centre (1) Total
(1) The Crédit Agricole CIB issuer spread is classified under the Corporate centre for -€529 million in Revenues, +€182 million in Income tax charge, -€347 million in Net income.

Interim condensed consolidated financial statements of Crédit Agricole Group - 30 June 2014
40
(in millions of euros)
Regional Banks
LCL
Revenues 7,449 1,935 1,242 2,552 1,454 1,960 (1,385) 15,207Operating expenses (3,939) (1,245) (785) (1,237) (694) (1,147) (421) (9,468)Gross operating income 3,510 690 457 1,315 760 813 (1,806) 5,739Cost of risk (704) (158) (318) (3) (779) (216) 66 (2,112)Operating income 2,806 532 139 1,312 (19) 597 (1,740) 3,627Share of net income of equity-accounted entities - - (44) 10 62 74 (16) 86Net gains (losses) on other assets 2 6 9 - - 3 (4) 16Charge in value of goodwill (22) - - - - - - (22)Pre-tax income 2,786 538 104 1,322 43 674 (1,760) 3,707Income tax charge (945) (187) (30) (427) (28) (171) 622 (1,166)Net gains (losses) on discontinued operations - - 28 - 12 (7) - 33Net income for the period 1,841 351 102 895 27 496 (1,138) 2,574Non-controlling interests - - 39 77 (39) (3) 90 164Net income Group share 1,841 351 63 818 66 499 (1,228) 2,410
Savings management
and Insurance
Specialised financial services
Corporate and
investment banking
Corporate
centre (1) Total
30/06/2013Restated
French Retail BankingInternational retail banking
(1) The Crédit Agricole CIB issuer spread is classified under the Corporate Centre for -€393 million in Revenues, +€135 million in Income tax charge, -€258 million in Net income.

Interim condensed consolidated financial statements of Crédit Agricole Group - 30 June 2014
41
4.2. Insurance specificities Gross income from insurance activities
(in millions of euros) 30/06/201431/12/2013Restated
30/06/2013Restated
Premium written 15,215 26,090 14,061Change in unearned premiums (418) (20) (399)Earned premiums 14,797 26,070 13,662
-Other operating income 7 111 61- - -Investment income 4,025 7,833 4,071Investment expenses (202) (250) (205)Gains (losses) on disposals of investments net of impairment and amortisation reversals 835 1,237 683
Change in fair value of investments at fair value through profit or loss 2,620 2,365 (60)
Change in impairment on investments (21) (311) (718)Investment income after expenses 7,257 10,874 3,771
- - -Claims paid (1) (19,196) (31,477) (14,979)Income on business ceded to reinsurers 298 390 165Expenses on business ceded to reinsurers (291) (507) (238)Net income (expense) on business ceded to reinsurer s 7 (117) (73)Contract acquisition costs (1,044) (2,013) (985)Amortisation of investment securities and similar (1) (3) (4)Administration costs (652) (1,227) (550)Other current operating income (expense) (191) (313) (69)Other operating income (expense) - - 3Operating income 984 1,905 837Financing costs (145) (270) (86)Share of net income of associates - - -Income tax charge (284) (633) (257)Consolidated net income 555 1,002 494Non-controlling interests 1 3 (3)Net income group share 554 999 497(1) Including -€9.8 billion of cost of claims at 30 June 2014 (-€18.6 billion at 31 December 2013), -€1.1 billion of change in the stake in policyholder participation at 30 June 2014 (-€0.8 billion at 31 December 2013) and -€8.2 billion of change in technical reserves at 30 June 2014 (-€11.6 billion at 31 December 2013).

Interim condensed consolidated financial statements of Crédit Agricole Group - 30 June 2014
42
Breakdown of insurance company investments
Carrying amount
Gains recognised in other
comprehensive income
Losses recognised in
other comprehensive
income
Carrying amount
Gains recognised in other
comprehensive income
Losses recognised in
other comprehensive
incomeAvailable-for-sale financial assets 176,944 19,190 (1,369) 169,094 12,600 (1,689)Treasury bills and similar securities 16,614 1,393 23 17,375 458 (240)Bonds and other fixed income securities 138,236 14,379 (1,300) 133,858 9,312 (1,254)Equities and other equity variable-income securities 17,074 2,457 (108) 13,967 2,148 (194)Non-consolidated equity investments 5,020 961 16 3,894 682 (1)
(in millions of euros)
30/06/201431/12/2013Restated
(in millions of euros)Carrying amount Market value
Carrying amount
Market value
Assets held-to-maturity 14,226 16,799 14,340 16,245Bonds and other fixed income securities 2,979 3,773 3,171 3,655Treasury bills and similar securities 11,247 13,026 11,169 12,590Impairment - - - -Loans and receivables 5,209 5,168 5,542 5,438Investment properties 3,647 5,733 3,500 5,538
30/06/201431/12/2013Restated
(in millions of euros)
83,956 70,235
Assets backing unit-linked contracts 35,889 34,619Securities bought under repurchase agreements - -Treasury bills and similar securities 13,426 5,941Bonds and other fixed income securities 20,673 19,957Equities and other equity variable-income securities 12,490 8,466Derivative instruments 1,478 1,252
(in millions of euros)
Total insurance company investments 283,982 262,711
Financial assets at fair value through profit or lo ss classified as held-for-trading and financial assets designated at fair value through profit or loss
30/06/201431/12/2013 Restated
Carrying amount
Carrying amount
30/06/201431/12/2013 Restated

Interim condensed consolidated financial statements of Crédit Agricole Group - 30 June 2014
43
Breakdown of insurance technical reserves
Life Non-life International Creditor Total
Insurance contracts 133,800 4,853 10,734 1,450 150,837Investment contracts with discretionary participation features 95,139 - 7,664 - 102,803
Investment contracts without discretionary participation features 2,081 - 713 - 2,794
Deferred participation benefits (liability) (1) 15,077 79 377 - 15,533Other technical reserves - - - - -Total technical reserves 246,097 4,932 19,488 1,450 271,967
Deferred participation benefits (asset) - - - - -Reinsurers' share of technical reserves (703) (267) (34) (310) (1,314)
NET TECHNICAL RESERVES (2) 245,394 4,665 19,454 1,140 270,653
(in millions of euros)
30/06/2014
(1) Including deferred liability on revaluation of available-for-sale securities of €15,167 million before tax, i.e. €9,994 million after tax (see Note 5.2 Available-for-sale financial assets). (2) Reinsurers’ share in technical reserves and other insurance liabilities are recognised under “Accruals, prepayments and sundry liabilities.”
Life Non-life International Creditor Total
Insurance contracts 126,890 4,287 10,363 1,437 142,977Investment contracts with discretionary participation features 95,531 - 6,683 - 102,214Investment contracts without discretionary participation features 1,928 - 785 - 2,713Deferred participation benefits (liability) (1) 8,437 55 146 - 8,638Other technical reserves - - - - -Total technical reserves 232,786 4,342 17,977 1,437 256,542Deferred participation benefits (asset) - - - - -Reinsurers' share of technical reserves (666) (218) (39) (298) (1,221)
Net technical reserves (2) 232,120 4,124 17,938 1,139 255,321
(in millions of euros)
31/12/2013 Restated
(1) Including deferred liability on revaluation of available-for-sale securities of €9,397 million before tax, i.e. €6,207 million after tax (see Note 5.2 Available-for-sale financial assets). (2) Reinsurers’ share in technical reserves and other insurance liabilities is recognised under “Accruals, prepayments and sundry liabilities.”
Deferred participation benefits at 30 June 2014 and 31 December 2013 breaks down as follows:
Deferred participation benefits
30/06/2014Deferred
participation benefits in liabilities
31/12/2013RestatedDeferred
participation benefits in liabilities
Deferred participation on revaluation of held-for-sale securities and hedging
derivatives (1) 15,764 9,782
Deferred participation on trading securities mark-to-market adjustment (804) (1,245)Other deferred participation (liquidity risk reserve cancellation) 573 101Total 15,533 8,638 (1) At 30 June 2014, deferred liability on revaluation of available-for-sale securities stood at €15,167 million before tax, i.e. €9,994 million net of tax. At 31 December 2013, deferred liability on revaluation of available-for-sale securities stood at €9,397 million before tax, i.e. €6,207 million net of tax (see Note 5.2 Available-for-sale financial assets).

Interim condensed consolidated financial statements of Crédit Agricole Group - 30 June 2014
44
5. Notes to the balance sheet
5.1. Financial assets and liabilities at fair value thro ugh profit or loss
Financial assets at fair value through profit or lo ss
(in millions of euros)30/06/2014
31/12/2013Restated
Financial assets held for trading 256,435 278,924
87,197 81,552Carrying amount 343,632 360,476
Of which lent securities 96 1
Financial assets designated at fair value through profit and loss
Financial assets held for trading
(in millions of euros) 30/06/201431/12/2013Restated
Loans and receivables due from customers 310 358Securities bought under repurchase agreements 72,273 85,157Securities held for trading 49,071 46,475
Treasury bills and similar securities 36,598 35,360 Bonds and other fixed-income securities 8,936 7,760 Equities and other variable-income securities 3,537 3,355
Derivative instruments (1) 134,781 146,934Carrying amount 256,435 278,924
Financial assets designated at fair value through p rofit or loss
(in millions of euros)30/06/2014
31/12/2013Restated
Loans and receivables due from credit institutions 1,096 1,087
Loans and receivables due from customers 193 211
Assets backing unit-linked contracts 35,889 34,619
Securities designated at fair value through profit and loss 50,019 45,635
Treasury bills and similar securities 13,431 5,948
Bonds and other fixed-income securities 22,850 27,147
Equities and other variable-income securities 13,738 12,540
Carrying amount 87,197 81,552

Interim condensed consolidated financial statements of Crédit Agricole Group - 30 June 2014
45
Financial liabilities at fair value through profit or loss
(in millions of euros)30/06/2014
31/12/2013Restated
240,955 263,087
31,119 32,831
Carrying amount 272,074 295,918
Financial liabilities designated at fair value through profit and loss
Financial liabilities held for trading
Financial liabilities held for trading
(in millions of euros)30/06/2014
31/12/2013Restated
Securities sold short 35,154 30,246Securities sold under repurchase agreements 73,694 87,007Debt securities - -
Derivative instruments (1) 132,107 145,834Carrying amount 240,955 263,087
Financial liabilities designated at fair value thro ugh profit or loss
(in millions of euros)
Fair value on balance sheet
Difference between carrying
amount and due at
maturity
Fair value on balance sheet
Difference between carrying
amount and due at
maturity Deposits from credit institutions - - - -Other deposits 3,521 - - -Debt securities 27,598 (109) 32,831 153Subordinated Debt - - - -Other financial liabilities - - - -
31,119 (109) 32,831 153Total Financial liabilities designated at fair valu e through profit and loss
30/06/201431/12/2013Restated

Interim condensed consolidated financial statements of Crédit Agricole Group - 30 June 2014
46
5.2. Available-for-sale financial assets
(in millions of euros)
Carrying amount
Gains recognised in
other comprehensive
income
Losses recognised in
other comprehensive
income
Carrying amount
Gains recognised in
other comprehensive
income
Losses recognised in
other comprehensive
incomeTreasury bills and similar securities 69,316 2,422 (239) 69,421 1,448 (590)
193,981 15,320 (1,437) 190,235 10,206 (1,365)Equities and other variable-income securities 19,805 2,919 (201) 17,220 2,647 (288)Non-consolidated equity investments 8,872 1,913 (40) 7,568 1,570 (269)Total available-for-sale securities 291,974 22,574 (1,917) 284,444 15,871 (2,512)Available-for-sale receivables - - - - - -Total available-for-sale receivables - - - - - -
291,974 22,574 (1,917) 284,444 15,871 (2,512)
Income tax charge - (7,249) 634 - (5,024) 755
-
15,325 (1,283) - 10,847 (1,757)
30/06/201431/12/2013Restated
Bonds and other fixed-income securities
Carrying amount of available-for-sale financial ass ets (1)
Gains and losses on available-for-sale financial as sets recognised in other comprehensive income (net of income tax) (2)
(1) The carrying amount of impaired available-for-sale debt securities is €194 million (€202 million at 31 December 2013) and the carrying amount of impaired variable-income available-for-sale securities is €2,958 million (€2,799 million at 31 December 2013). (2) At 30 June 2014, a net unrealised gain of €14,042 million (net unrealised gain of €9,090 million at 31 December 2013) is offset by the after-tax deferred profit-sharing liability of €9,994 million of Group insurance companies (€6,207 million at 31 December 2013); the balance of €4,048 million corresponds to net unrealised gains recognised in recyclable equity at 30 June 2014 (net unrealised gain of €2,884 million at 31 December 2013).

Interim condensed consolidated financial statements of Crédit Agricole Group - 30 June 2014
47
5.3. Loans and receivables due from credit institutions and from customers
Loans and receivables due from credit institutions
30/06/201431/12/2013Restated
57,558 59,374of which performing current accounts in debit 7,220 6,298of which performing overnight accounts and advances 2,904 4,552
132 200
28,306 29,157
451 584
5,565 5,007
7 1092,019 94,332
(391) (408)91,628 93,924
ImpairmentCarrying amount
Subordinated loansSecurities not traded in an active market Other loans and receivables
Gross amount
(in millions of euros)
Credit institutionsLoans and receivables
Pledged securitiesSecurities bought under repurchase agreements
Loans and receivables due from customers
30/06/201431/12/2013Restated
Customers
20,540 15,527
652,297 668,145
3,117 2,066
146 140
11,956 11,125
748 477284 277
1,022 1,02420,299 18,751
710,409 717,532Impairment (22,681) (22,044)
687,728 695,488Finance Leases
6,763 7,1958,845 9,118
15,608 16,313Impairment (332) (622)
15,276 15,691703,004 711,179Carrying amount
Securities not traded in an active market Insurance receivablesReinsurance receivablesAdvances in associates current accountsCurrent accounts in debit
Property leasingEquipment leases, operating leases and similar transactions
Gross amount
Net value of loans and receivables due from custome rs
Gross amount
Net value of lease financing operations
(in millions of euros)
Trade receivablesOther customer loansSecurities bought under repurchase agreementsSubordinated loans

Interim condensed consolidated financial statements of Crédit Agricole Group - 30 June 2014
48
Loans and receivables due from credit institutions and from customers by customer type (excluding Crédit Agricole internal transactions)
84,930 3,786 (1,725) (360) 82,84511,868 - - - 11,86880,190 522 (391) - 79,799
203,408 8,489 (5,197) (2,437) 195,774437,640 15,391 (9,476) (3,818) 424,346
818,036 28,188 (16,789) (6,615) 794,632Total loans and receivables due from credit institutions and due from customers (1)
(in millions of euros)
30/06/2014
o/w gross loans and
receivables individually
impaired
Individual impairment
Collective impairment
Central governmentsCentral banksCredit institutionsLarge corporatesRetail customers
Gross outstanding
Total
(1) of which €2,694 million in restructured (unimpaired) performing loans.
80,412 3,337 1,605 339 78,46813,513 - - - 13,51380,821 651 408 - 80,413
204,695 8,709 5,124 2,422 197,149448,736 15,554 9,407 3,769 435,560
828,177 28,251 16,544 6,530 805,103
Gross outstanding
TotalIndividual
impairmentCollective
impairment
Central governmentsCentral banksCredit institutionsLarge corporatesRetail customers
(in millions of euros)
31/12/2013Restated
Total loans and receivables due from credit institutions and due from customers (1)
o/w gross loans and
receivables individually
impaired
(1) of which €2,389 million in restructured (unimpaired) performing loans.

Interim condensed consolidated financial statements of Crédit Agricole Group - 30 June 2014
49
5.4. Transferred assets not derecognised or derecognised with ongoing involvement Transferred assets not fully derecognised at 30 Jun e 2014
Assets and associated liabilities
Nature of assets transferredCarrying amount
O/w securisation (non-
deconsolidating)
O/w securities sold/bought
under repurchase agreements
O/w other (1) Fair value (2) Carrying amount
O/w securisation (non-
deconsolidating)
O/w securities sold/bought
under repurchase agreements
O/w other Fair value (2) Net fair value*
Held-for-trading 31,697 - 31,697 - 31,697 30,494 - 30,494 - 30,494 1,203 - - - Equity instruments - - - - - - - - - - - - - -
Debt securities 31,697 - 31,697 - 31,697 30,494 - 30,494 - 30,494 1,203 - - -
Loans and advances - - - - - - - - - - - - - -
Designated at fair value through profit and loss
2,873 - 2,873 - 2,875 2,873 - 2,873 - 2,873 2 - - -
Equity instruments - - - - - - - - - - - - - -
Debt securities 2,873 - 2,873 - 2,875 2,873 - 2,873 - 2,873 2 - - - Loans and advances - - - - - - - - - - - - - - Available-for-sale 11,880 - 9,267 2,613 11,911 9,284 - 9,253 31 9,288 2,623 - - - Equity instruments 270 - - 270 270 31 - - 31 31 239 - - - Debt securities 11,610 - 9,267 2,343 11,641 9,253 - 9,253 - 9,257 2,384 - - - Loans and advances - - - - - - - - - - - - - - Loans and receivables 17,204 14,722 2,179 303 17,204 5,046 2,956 2,090 - 10,827 6,377 - - - Debt securities 2,482 - 2,179 303 2,482 2,090 - 2,090 - 2,090 392 - - - Loans and advances 14,722 14,722 - - 14,722 2,956 2,956 - - 8,737 5,985 - - - Held-to-maturity 1,089 - 1,089 - 1,072 1,089 - 1,089 - 1,089 (17) - - - Debt securities 1,089 - 1,089 - 1,072 1,089 - 1,089 - 1,089 (17) - - - Loans and advances - - - - - - - - - - - - - - Total financial assets 64,743 14,722 47,105 2,916 64,759 48,786 2,956 45,799 31 54,571 10,188 - - - Finance leases - - - - - - - - - - - - - -
Total transferred assets 64,743 14,722 47,105 2,916 64,7 59 48,786 2,956 45,799 31 54,571 10,188 - - -
Transferred assets not fully derecognised
Transferred assets still fully recognisedTransferred assets recognised to the extent
of the entity's continuing involvement
Transferred assets Associated liabilitiesInitial total carrying
amount of assets prior to transfer
Carrying amount of assets still recognised (continuing
involvement)
Carrying amount of associated liabilities
(1) Of which securities lending without cash collateral (2) In the case when the guarantee given by the related parties to the agreement leading to associated liabilities is limited to transferred financial assets (IFRS 7.42D.(d)).

Interim condensed consolidated financial statements of Crédit Agricole Group - 30 June 2014
50
Transferred assets not fully derecognised at 31 Dec ember 2013
Nature of transferred assets
Assets and associated liabilities
Nature of assets transferredCarrying amount
O/w securisation (non-
deconsolidating)
O/w securities sold/bought
under repurchase agreements
O/w other (1) Fair value (2) Carrying amount
O/w securisation (non-
deconsolidating)
O/w securities sold/bought
under repurchase agreements
O/w other Fair value (2) Net fair value*
Held-for-trading 25,902 - 25,902 - 25,902 25,838 - 25,838 - 25,838 64 - - - Equity instruments - - - - - - - - - - - - - - Debt securities 25,902 - 25,902 - 25,902 25,838 - 25,838 - 25,838 64 - - -
Loans and receivables - - - - - - - - - - - - - -
Designated at fair value through profit or loss
472 - 472 - 457 472 - 472 - 472 (15) - - -
Equity instruments - - - - - - - - - - - - - - Debt securities 472 - 472 - 457 472 - 472 - 472 (15) - - - Loans and receivables - - - - - - - - - - - - - - Available-for-sale 13,697 - 11,723 1,974 13,622 11,731 - 11,613 117 11,731 1,892 - - - Equity instruments 383 - - 383 383 74 - - 74 74 309 - - - Debt securities 13,314 - 11,723 1,591 13,239 11,657 - 11,613 43 11,657 1,583 - - - Loans and receivables - - - - - - - - - - - - - - Loans and receivables 16,899 14,359 2,404 136 16,899 9,980 7,685 2,295 - 9,980 6,920 563 - - Debt securities 2,540 - 2,404 136 2,540 2,295 - 2,295 - 2,295 245 - - - Loans and receivables 14,359 14,359 - - 14,359 7,685 7,685 - - 7,685 6,675 563 - - Held-to-maturity 1,915 - 1,915 - 1,869 1,915 - 1,915 - 1, 915 (46) - - - Debt securities 1,915 - 1,915 - 1,869 1,915 - 1,915 - 1,915 (46) - - - Loans and receivables - - - - - - - - - - - - - - Total financial assets 58,885 14,359 42,416 2,110 58,749 49,936 7,685 42,133 117 49,936 8,815 563 - - Finance leases - - - - - - - - - - - - - - Total transferred assets 58,885 14,359 42,416 2,110 58,749 4 9,936 7,685 42,133 117 49,936 8,815 563 - -
Transferred assets, but not fully derecognised
Transferred assets, but still fully recognisedTransferred assets, but recognised to the
extent of the entity's continuing involvement
Transferred assets Associated liabilitiesInitial total carrying
amount of assets prior to transfer
Carrying amount of asset still recognised
(continuing involvement)
Carrying amount of associated liabilities
(1) Of which Securities lending without cash collateral (2) In the case when the guarantee given by the related parties to the agreement leading to associated liabilities is limited to transferred financial assets (IFRS 7.42D.(d)).

Interim condensed consolidated financial statements of Crédit Agricole Group - 30 June 2014
51
5.5. Impairment deducted from financial assets
31/12/2013Restated
Changes in scope
DepreciationReversals and
utilisationsTranslation adjustment
Transfers in non-current assets held
for sale
Other movements
30/06/2014
409 - 1 (22) 2 - - 390
22,044 - 3,862 (3,064) 17 (177) (2) 22,680
of which collective impairment 6,530 - 570 (451) 9 (18) (25) 6,615
622 - 85 (220) - (154) (1) 332
10 - - (2) - - - 8
2,155 (2) 39 (293) 3 (3) (5) 1,894
178 - 18 (42) 5 - 1 160
(in millions of euros)Loans and receivables due from credit institutions
Loans and receivables due from customers
Finance leases
Securities held to maturity
Available-for-sale financial assets
Other financial assets
Total impairment of financial assets 25,418 (7)(2) 4,005 (3,643) 27 (334) 25,464
01/01/2013Restated
Changes in scope
DepreciationReversals and
utilisationsTranslation adjustment
Transfers in non-current assets held
for sale
Other movements
31/12/2013Restated
546 - 3 (121) (20) - 1 409
22,603 (6) 7,224 (7,571) (142) - (64) 22,044
of which collective impairment 6,562 - 876 (852) (55) - (1) 6,530
589 (2) 262 (229) (1) - 3 622
15 - - (5) - - - 10
2,560 48 450 (905) (12) - 14 2,155
180 (3) 31 (18) (12) - - 178
Loans and receivables due from credit institutions
Loans and receivables due from customers
Available-for-sale financial assets (1)
Other financial assets
Total impairment of financial assets 26,493
Finance leases
(in millions of euros)
25,4187,970 (46)37 (8,849) (187) -
Securities held to maturity

Interim condensed consolidated financial statements of Crédit Agricole Group - 30 June 2014
52
5.6. Exposure to sovereign risk Significant exposure to sovereign risk The scope of sovereign exposure identified covers exposure to States, excluding local authorities. Tax debt is excluded from these amounts. Exposure to sovereign debt corresponds to an exposure net of impairment (carrying amount) and disclosed gross and net of hedging. Banking activity
Held-to-maturity financial assets
Available-for-sale financial
assets
Financial assets at fair value
through profit and loss
Loans and receivables
Germany 229 907 3 10 - 1,149 (17) 1,132Belgium 155 1,448 2 - 628 2,233 (87) 2,146Spain 75 21 3 - - 99 - 99United States - 447 - 3 2,452 2,901 (9) 2,892France 6,446 37,584 5 1,727 419 46,181 (2,341) 43,840Greece - - - - - - - -Ireland 3 1 - - - 4 - 4Italy 48 5,413 - 112 - 5,573 (277) 5,296Japan - 2,473 2 - 422 2,897 - 2,897Portugal - - - 2 53 55 - 55Total (1) 6,955 48,294 15 1,853 3,974 61,091 (2,731) 58,360
Total Banking activity before
hedging
Hedging Available-for-sale financial
assets
Total banking activity after
hedging
30/06/2014(in millions of
euros)
Net exposures Banking activity net of impairment
O/w banking portfolio
O/w trading book (excluding derivatives)
(1) Exposure at 30 June 2014 does not include the accounts of entities reclassified pursuant to IFRS 5 (CAL Hellas and BES Seguros).
Held-to-maturity financial assets
Available-for-sale financial
assets
Financial assets at fair value
through profit and loss
Loans and receivables
Germany 183 575 2 27 1,650 2,437 3 2,440Belgium 91 2,159 5 - 304 2,559 - 2,559Spain 74 28 13 - - 115 - 115United States - 441 - - 2,994 3,435 (7) 3,428France 4,483 38,383 96 784 812 44,558 (2,254) 42,304Greece - - - - - - - -Ireland 3 91 - - - 94 - 94Italy 48 4,906 7 153 - 5,114 (192) 4,922Japan - 1,056 - 25 245 1,326 - 1,326Portugal - - - 1 - 1 - 1Total (1)
4,882 47,639 123 990 6,005 59,639 (2,450) 57,189
O/w banking portfolioO/w trading book
(excluding derivatives)
Total Banking activity before
hedging
Hedging Available-for-sale financial
assets
Total banking activity after
hedging
31/12/2013Restated
(in millions of euros)
Net exposures Banking activity net of impairment
(1) Exposure at 31 December 2013 does not include the accounts of entities reclassified pursuant to IFRS 5 (CA Bulgaria, Nordic entities of CA Consumer Finance and Newedge).

Interim condensed consolidated financial statements of Crédit Agricole Group - 30 June 2014
53
Insurance activity For the insurance activity, exposure to sovereign debt is presented as a value net of impairment, before hedging and corresponds to an exposure before application of sharing mechanisms between insurer and policyholder specific to life insurance.
Germany 265Belgium 878Spain 718United States 34France 28,789Greece -Ireland 610Italy 5,608Japan -Portugal 81Total exposure 36,984
30/06/2014(in millions of
euros)
Gross exposure Insurance activity
Germany 270Belgium 872Spain 592United States 51France 22,035Greece -Ireland 576Italy 4,920Japan -Portugal 954Total exposure 30,271
31/12/2013Restated
(in millions of euros)
Gross exposure Insurance activity
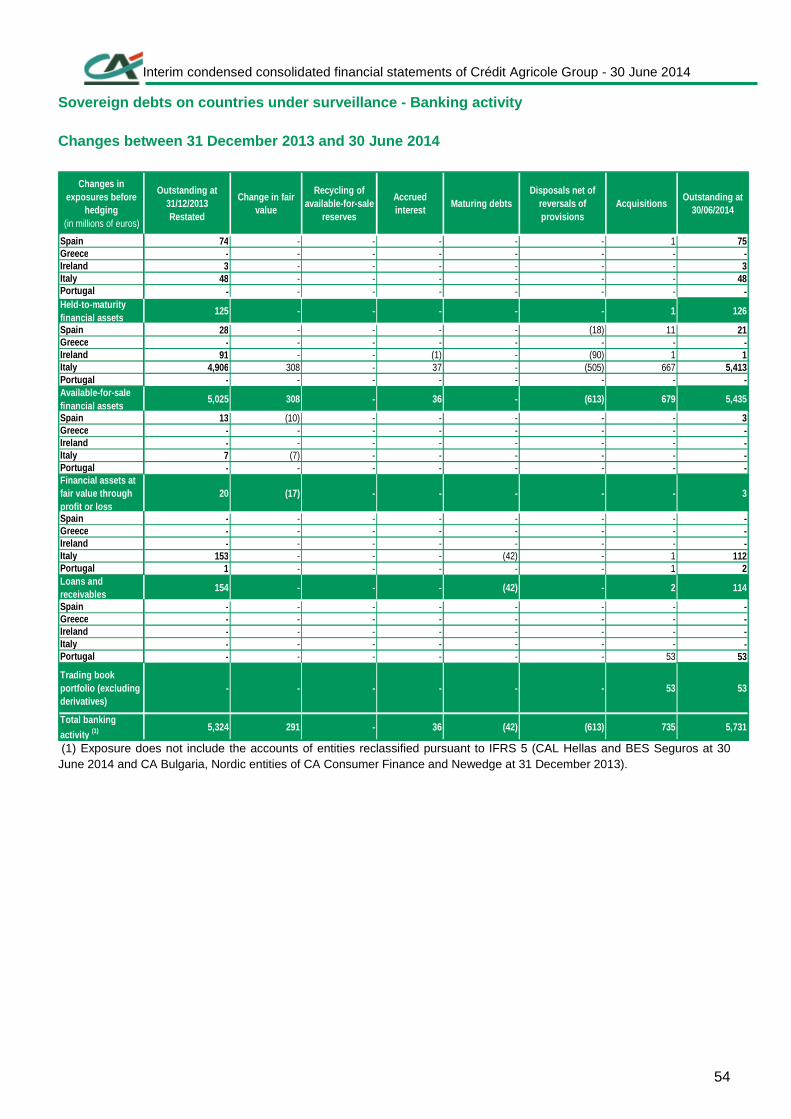
Interim condensed consolidated financial statements of Crédit Agricole Group - 30 June 2014
54
Sovereign debts on countries under surveillance - B anking activity Changes between 31 December 2013 and 30 June 2014
Changes in exposures before
hedging (in millions of euros)
Outstanding at 31/12/2013Restated
Change in fair value
Recycling of available-for-sale
reserves
Accrued interest
Maturing debtsDisposals net of
reversals of provisions
AcquisitionsOutstanding at
30/06/2014
Spain 74 - - - - - 1 75Greece - - - - - - - -Ireland 3 - - - - - - 3Italy 48 - - - - - - 48Portugal - - - - - - - -Held-to-maturity financial assets
125 - - - - - 1 126
Spain 28 - - - - (18) 11 21Greece - - - - - - - -Ireland 91 - - (1) - (90) 1 1Italy 4,906 308 - 37 - (505) 667 5,413Portugal - - - - - - - -Available-for-sale financial assets
5,025 308 - 36 - (613) 679 5,435
Spain 13 (10) - - - - - 3Greece - - - - - - - -Ireland - - - - - - - -Italy 7 (7) - - - - - -Portugal - - - - - - - -Financial assets at fair value through profit or loss
20 (17) - - - - - 3
Spain - - - - - - - -Greece - - - - - - - -Ireland - - - - - - - -Italy 153 - - - (42) - 1 112Portugal 1 - - - - - 1 2Loans and receivables
154 - - - (42) - 2 114
Spain - - - - - - - -Greece - - - - - - - -Ireland - - - - - - - -Italy - - - - - - - -Portugal - - - - - - 53 53
Trading book portfolio (excluding derivatives)
- - - - - - 53 53
Total banking activity (1) 5,324 291 - 36 (42) (613) 735 5,731
(1) Exposure does not include the accounts of entities reclassified pursuant to IFRS 5 (CAL Hellas and BES Seguros at 30 June 2014 and CA Bulgaria, Nordic entities of CA Consumer Finance and Newedge at 31 December 2013).

Interim condensed consolidated financial statements of Crédit Agricole Group - 30 June 2014
55
Changes between 1 January 2013 and 31 December 2013
Changes in exposures before
hedging (in millions of euros)
Outstanding at 1st january 2013
Restated
Change in fair value
Recycling of available-for-sale
reserves
Accrued interest
Maturing debtsDisposals net of
reversals of provisions
AcquisitionsOutstanding at 31 december
2013
Spain 71 - - - - - 3 74
Greece - - - - - - - -
Ireland 3 - - - - - - 3
Italy 54 - - - (6) - - 48
Portugal - - - - - - - -
Held-to-maturity financial assets
128 - - - (6) - 3 125
Spain 22 2 - - - - 4 28Greece - - - - - - - -Ireland 96 (2) - (3) - - - 91
Italy 4,266 84 - (19) (36) (642) 1,253 4,906
Portugal 146 (4) - (2) - (140) - -
Available-for-sale financial assets
4,530 80 - (24) (36) (782) 1,257 5,025
Spain - - - - - - 13 13Greece - - - - - - - -Ireland - - - - - - - -
Italy 11 - - - (1) (10) 7 7
Portugal - - - - - - - -Financial assets at fair value through profit or loss
11 - - - (1) (10) 20 20
Spain - - - - - - - -Greece - - - - - - - -Ireland - - - - - - - -
Italy 173 - - - (28) - 8 153
Portugal 1 - - - - - - 1
Loans and receivables
174 - - - (28) - 8 154
Spain 61 - - - - (61) - -Greece - - - - - - - -Ireland - - - - - - - -
Italy 47 - - - - (47) - -
Portugal 27 - - - - (27) - -
Trading book portfolio (excluding derivatives)
135 - - - - (135) - -
Total banking activity (1) 4,978 80 - (24) (71) (927) 1,289 5,325
(1) Exposure does not include the accounts of entities reclassified pursuant to IFRS 5 (CA Bulgaria, CA Consumer Finance Nordic entities and Newedge at 31 December 2013 and Emporiki, CA Cheuvreux and CLSA at 31 December 2012).

Interim condensed consolidated financial statements of Crédit Agricole Group - 30 June 2014
56
Sovereign debts on countries under surveillance - I nsurance activity Changes between 31 December 2013 and 30 June 2014
Changes in exposures before
hedging (in millions of
euros)
Outstanding at 31/12/2013Restated
Change in fair value
Recycling of available-for-sale
reserves
Accrued interest
Maturing debtsDisposals net of
reversals of provisions
AcquisitionsOutstanding at
30/06/2014
Spain 592 115 - 5 - (1) 7 718Greece - - - - - - - -Ireland 576 45 - (12) - (0) - 610Italy 4,920 295 13 7 (20) (419) 812 5,608Portugal 954 169 (50) (7) - (996) 12 81Total insurance activity
7,042 625 (37) (7) (20) (1,416) 831 7,018
Changes between 1 January 2013 and 31 December 2013
Changes in exposures before
hedging (in millions of
euros)
Outstanding at 1st january 2013
Restated
Change in fair value
Recycling of available-for-sale
reserves
Accrued interest
Maturing debtsDisposals net of
reversals of provisions
AcquisitionsOutstanding at 31 december
2013
Spain 979 114 (3) (21) - (494) 17 592Greece - - - - - - - -Ireland 1,045 70 (26) (16) - (497) - 576Italy 4,387 178 7 10 (21) (1,717) 2,076 4,920Portugal 1,572 82 90 (7) - (783) - 954Total insurance activity
7,983 444 68 (34) (21) (3,491) 2,093 7,042

Interim condensed consolidated financial statements of Crédit Agricole Group - 30 June 2014
57
5.7. Due to credit institutions and to customers Due to credit institutions
30/06/201431/12/2013Restated
65,789 66,506of which current accounts in credit 7,733 8,890of which overnight accounts and deposits 4,308 8,175
4334,893 33,487
100,682 100,036
(in millions of euros)
Credit institutionsAccounts and deposits
Pledged securities Securities sold under repurchase agreementsCarrying amount Due to customers
30/06/201431/12/2013Restated
213,447 213,289244,886 252,121139,178 162,10010,807 11,349
889 808
410 377
668 631
610,285 640,675
Current accounts in credit(in millions of euros)
Carrying amount
Special saving accountsOther amounts due to customersSecurities sold under repurchase agreementsInsurance liabilitiesReinsurance liabilitiesCash deposits received from cedants and retrocessionaires against technical insurance commitments

Interim condensed consolidated financial statements of Crédit Agricole Group - 30 June 2014
58
5.8. Debt securities and subordinated debt
30/06/201431/12/2013Restated
290 3,19620,321 20,37785,878 74,10080,573 75,4583,565 3,344
190,627 176,475
17,858 19,151Undated subordinated debt (3)
7,275 7,218Mutual security deposits 144 142Participating securities and loans 124 122
25,401 26,633Carrying amount
Dated subordinated debt (2)
(in millions of euros)Debt securities
Other debt securitiesCarrying amountSubordinated debt
Interest bearing notesMoney-market instrumentsNegotiable debt securitiesBonds (1)
(1) Includes some issues of Covered bonds. (2) Includes some issues of redeemable subordinated notes “TSR”. (3) Includes issues of deeply subordinated notes “TSS”, undated subordinated notes “TSDI”, hybrid capital instruments “T3CJ” and shareholder advances agreed by SAS Rue La Boétie.
At 30 June 2014, the balance of outstanding deeply subordinated notes was €5,372 million compared to €5,369 million at 31 December 2013. The debt instruments issued by Crédit Agricole S.A. and subscribed for by Crédit Agricole S.A. Group insurance companies were eliminated.

Interim condensed consolidated financial statements of Crédit Agricole Group - 30 June 2014
59
5.9. Information on the offsetting of financial assets a nd financial liabilities
Offsetting - Financial assets 30/06/2014
(in millions of euros)
Gross amounts of financial liabilities covered by master netting agreements
Amounts of other financial instruments received as
collateral, including security deposits
Derivatives (1) 270,164 116,400 153,764 137,808 2,994 12,962 160,892Reverse repurchase agreements (2)
59,16815,513 43,655 27,389 7,925 8,341 103,828
Securities lent (3)4,495 - 4,495 - 270 4,226 7,621
Other financial instruments - - - - - - -
Total financial assets subjects to offsetting
333,828 131,913 201,915 165,197 11,189 25,529
Offsetting effects on financial assets covered by m aster netting agreements and similar agreements
Net amounts of financial assets presented in the
financial statementsType of financial instrument
Gross amounts of recognised financial
assets before offsetting
Gross amounts of recognised financial liabilities set off in
the financial
statements (4)
Net amounts of financial assets presented in the
financial statements
Other amounts that can be offset under given conditions
Net amount after all offsetting
effects
(1) The amount of derivatives subject to offsetting represents 95.57% of the derivatives on the asset side of the balance sheet date at the end of the reporting period. (2) The amount of reverse repurchase agreements subject to offsetting represents 42.05% of the reverse repurchase agreements on the asset side of the balance sheet at the end of the reporting period. (3) The amount of securities lent subject to offsetting represents 58.98% of the securities lent on the asset side of the balance sheet at the end of the reporting period. (4) Including margin calls.
31/12/2013 Restated(in millions of euros)
Gross amounts of financial liabilities covered by master netting agreement
Amounts of other financial instruments received as
collateral, including security deposit
Derivatives (1) 328,782 158,731 170,051 155,105 5,413 9,533 177,642Reverse repurchase agreements (2) 53,101 - 53,101 43,156 1,332 8,613 116,579
Securities lent (3) 3,878 - 3,878 - 383 3,495 6,113
Other financial instruments - - - - - - -
Total financial assets subject to offsetting
385,761 158,731 227,030 198,261 7,128 21,641
Net amounts of financial assets presented in the
financial statementsType of financial instrument
Gross amounts of recognised financial
assets before offsetting
Gross amounts of recognised financial liabilities set off in
the financial statements (4)
Net amounts of financial assets presented in the
financial statements
Offsetting effects on financial assets covered by m aster netting agreement and similar agreements
Other amounts that can be offset under given conditions
Net amount after all offsetting
effects
(1) The amount of derivatives subject to offsetting represents 95.73% of the derivatives on the asset side of the balance sheet at the end of the reporting period. (2) The amount of reverse repurchase agreements subject to offsetting represents 45.55% of the reverse repurchase agreements on the asset side of the balance sheet at the end of the reporting period. (3) The amount of securities lent subject to offsetting represents 63.45% of the securities lent on the asset side of the balance sheet at the end of the reporting period. (4) Including margin calls.

Interim condensed consolidated financial statements of Crédit Agricole Group - 30 June 2014
60
Offsetting – Financial liabilities 30/06/2014
(in millions of euros)
Gross amounts of financial assets covered
by master netting agreements
Amounts of other financial instruments given as guarantee, including security
deposits
Derivatives (1) 275,562 116,402 159,160 137,816 3,554 17,790 160,594
Repurchase agreements (2) 72,721 15,513 57,208 27,180 14,169 15,859 119,394
Securities borrowed - - - - - - 14
Other financial instruments - - - - - - -
Total financial liabilities subject to offsetting
348,283 131,915 216,368 164,996 17,723 33,648
Offsetting effects on financial liabilities covered by master netting agreements and similar agreement s
Net amounts of financial liabilities presented in the
financial statementsType of financial instrument
Gross amounts of recognised financial
liabilities before offsetting
Gross amounts of recognised financial assets set off in the financial statements
(3)
Net amounts of financial liabilities presented in the
financial statements
Other amounts that can be offset under given conditions
Net amount after all offsetting effects
(1) The amount of derivatives subject to offsetting represents 99.11% of the derivatives on the asset side of the balance sheet at the end of the reporting period. (2) The amount of repurchase agreements subject to offsetting represents 47.92% of the repurchase agreements on the asset side of the balance sheet at the end of the reporting period. (3) Including margin calls.
31/12/2013 Restated(in millions of euros)
Gross amounts of financial assets covered
by master netting agreement
Amounts of other financial instruments given as guarantee, including security
deposits
Derivatives (1) 337,918 158,710 179,208 155,105 8,540 15,563 180,599
Repurchase agreements (2) 78,782 - 78,782 43,156 16,895 18,731 129,192
Securities borrowed - - - - - - 2
Other financial instruments - - - - - - -
Total financial liabilities subject to offsetting
416,700 158,710 257,990 198,261 25,435 34,294
Net amounts of financial liabilities presented in the
financial statementsType of financial instrument
Gross amounts of recognised financial
liabilities before offsetting
Gross amounts of recognised financial assets set off in the financial statements
(3)
Net amounts of financial liabilities presented in the
financial statements
Offsetting effects on financial liabilities covered by master netting agreement and similar agreements
Other amounts that can be offset under given conditions
Net amount after all offsetting effects
(1) The amount of derivatives subject to offsetting represents 99.23% of the derivatives on the asset side of the balance sheet at the end of the reporting period. (2) The amount of repurchase agreements subject to offsetting represents 60.98% of the repurchase agreements on the asset side of the balance sheet at the end of the reporting period. (3) Including margin calls.
Gross amounts effectively offset on the balance sheet relate to derivatives and to repurchase agreements handled with clearing houses meeting the two criteria required by IAS 32R :
• For derivatives, it relates to transactions handled with “LCH Clearnet Ltd Swapclear” offset by currency.
• For repurchase transactions, it relates to transactions handled with “LCH Clearnet Ltd (Repoclear)”, “LCH Clearnet SA”, and “Fixed Income Clearing Corporation (FICC)” offset by currency and by maturity.

Interim condensed consolidated financial statements of Crédit Agricole Group - 30 June 2014
61
5.10. Investment properties
(in millions of euros)
31/12/2013Restated
Changes in scope
Transfers in non-current assets held for sale
Increases (acquisitions)
Decreases (disposals and redemptions)
Translation adjustments
Other movements
30/06/2014
Gross amount 4,381 - (30) 184 (27) - 21 4,529
Amortisation and impairment (364) - - (13) 12 - (15) (380)
Net carrying amount (1) 4,017 - (30) 171 (15) - 6 4,149
(1) Including investment property let to third parties.
(in millions of euros)
01/01/2013Restated
Changes in scope
Transfers in non-current assets held for sale
Increases (acquisitions)
Decreases (disposals and redemptions)
Translation adjustments
Other movements
31/12/2013Restated
Gross amount 3,734 - (13) 633 (202) - 229 4,381Amortisation and impairment (379) - - (28) 82 - (39) (364)
Net carrying amount (1) 3,355 - (13) 605 (120) - 190 4,017 (1) Including investment property let to third parties.
Investment properties are valued by expert appraisers. The market value of investment property recorded at amortised cost, as valued by expert appraisers, was €6,507 million at 30 June 2014, compared to €6,301 million at 31 December 2013. Fair value of investment properties per valuation m odel
(in millions of euros)
Estimated market value at 30/06/2014
Quoted prices in active
markets for identical
instruments:Level 1
Valuation based on
observable data:
Level 2
Valuation based on
unobservable data:
Level 3
Investment property not measured at fair value in t he balance sheetInvestment property 6,507 8 6,449 50
Total investment property of which fair value is in dicated 6,507 8 6,449 50
(in millions of euros)
Estimated market value at 31/12/2013
Restated
Quoted prices in active
markets for identical
instruments :Level 1
Valuation based on
observable data :
Level 2
Valuation based on
unobservable data :
Level 3
Investment property not measured at fair value in t he balance sheetInvestment property 6,301 26 6,222 53
Total investment property of which fair value is in dicated 6,301 26 6,222 53
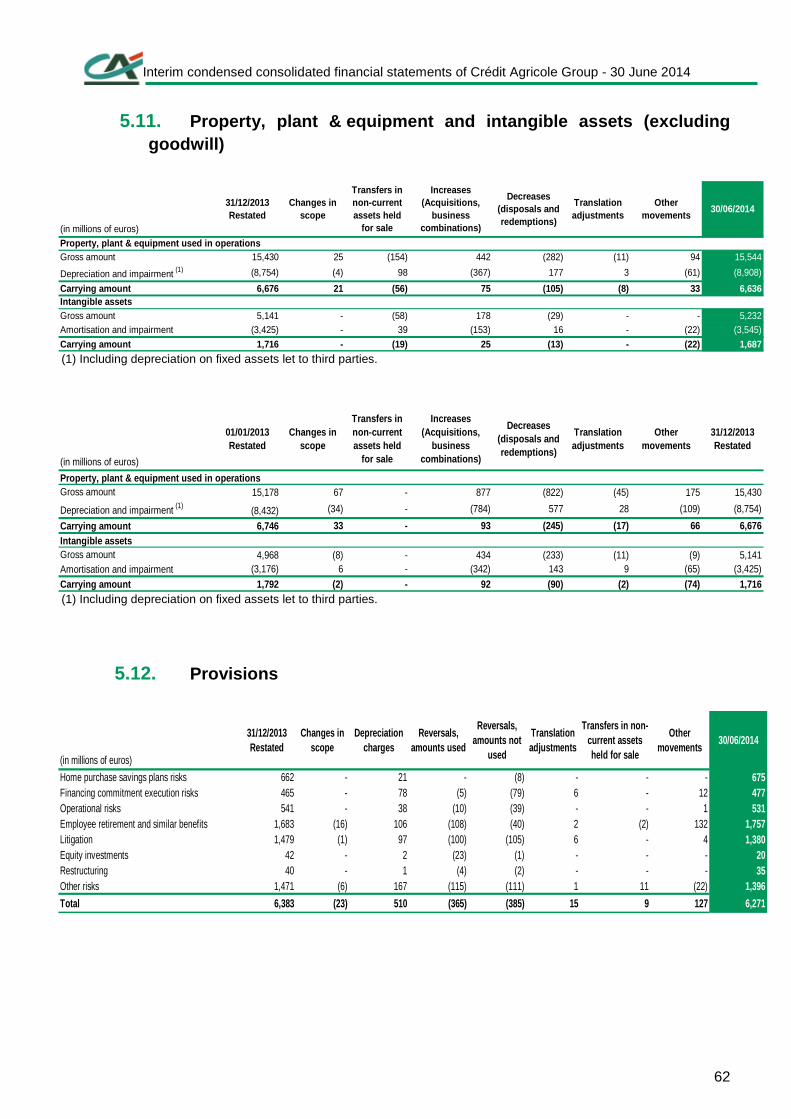
Interim condensed consolidated financial statements of Crédit Agricole Group - 30 June 2014
62
5.11. Property, plant & equipment and intangible assets ( excluding goodwill)
(in millions of euros)
31/12/2013Restated
Changes in scope
Transfers in non-current assets held
for sale
Increases (Acquisitions,
business combinations)
Decreases (disposals and redemptions)
Translation adjustments
Other movements
30/06/2014
Gross amount 15,430 25 (154) 442 (282) (11) 94 15,544
Depreciation and impairment (1) (8,754) (4) 98 (367) 177 3 (61) (8,908)
Carrying amount 6,676 21 (56) 75 (105) (8) 33 6,636
Gross amount 5,141 - (58) 178 (29) - - 5,232Amortisation and impairment (3,425) - 39 (153) 16 - (22) (3,545)
Carrying amount 1,716 - (19) 25 (13) - (22) 1,687
Property, plant & equipment used in operations
Intangible assets
(1) Including depreciation on fixed assets let to third parties.
(in millions of euros)
01/01/2013Restated
Changes in scope
Transfers in non-current assets held
for sale
Increases (Acquisitions,
business combinations)
Decreases (disposals and redemptions)
Translation adjustments
Other movements
31/12/2013 Restated
Gross amount 15,178 67 - 877 (822) (45) 175 15,430
Depreciation and impairment (1)(8,432) (34) - (784) 577 28 (109) (8,754)
Carrying amount 6,746 33 - 93 (245) (17) 66 6,676
Gross amount 4,968 (8) - 434 (233) (11) (9) 5,141Amortisation and impairment (3,176) 6 - (342) 143 9 (65) (3,425)
Carrying amount 1,792 (2) - 92 (90) (2) (74) 1,716
Intangible assets
Property, plant & equipment used in operations
(1) Including depreciation on fixed assets let to third parties.
5.12. Provisions
(in millions of euros)
31/12/2013Restated
Changes in scope
Depreciation charges
Reversals, amounts used
Reversals, amounts not
used
Translation adjustments
Transfers in non-current assets held for sale
Other movements
30/06/2014
Home purchase savings plans risks 662 - 21 - (8) - - - 675Financing commitment execution risks 465 - 78 (5) (79) 6 - 12 477Operational risks 541 - 38 (10) (39) - - 1 531Employee retirement and similar benefits 1,683 (16) 106 (108) (40) 2 (2) 132 1,757Litigation 1,479 (1) 97 (100) (105) 6 - 4 1,380Equity investments 42 - 2 (23) (1) - - - 20Restructuring 40 - 1 (4) (2) - - - 35Other risks 1,471 (6) 167 (115) (111) 1 11 (22) 1,396
Total 6,383 (23) 510 (365) (385) 15 9 127 6,271
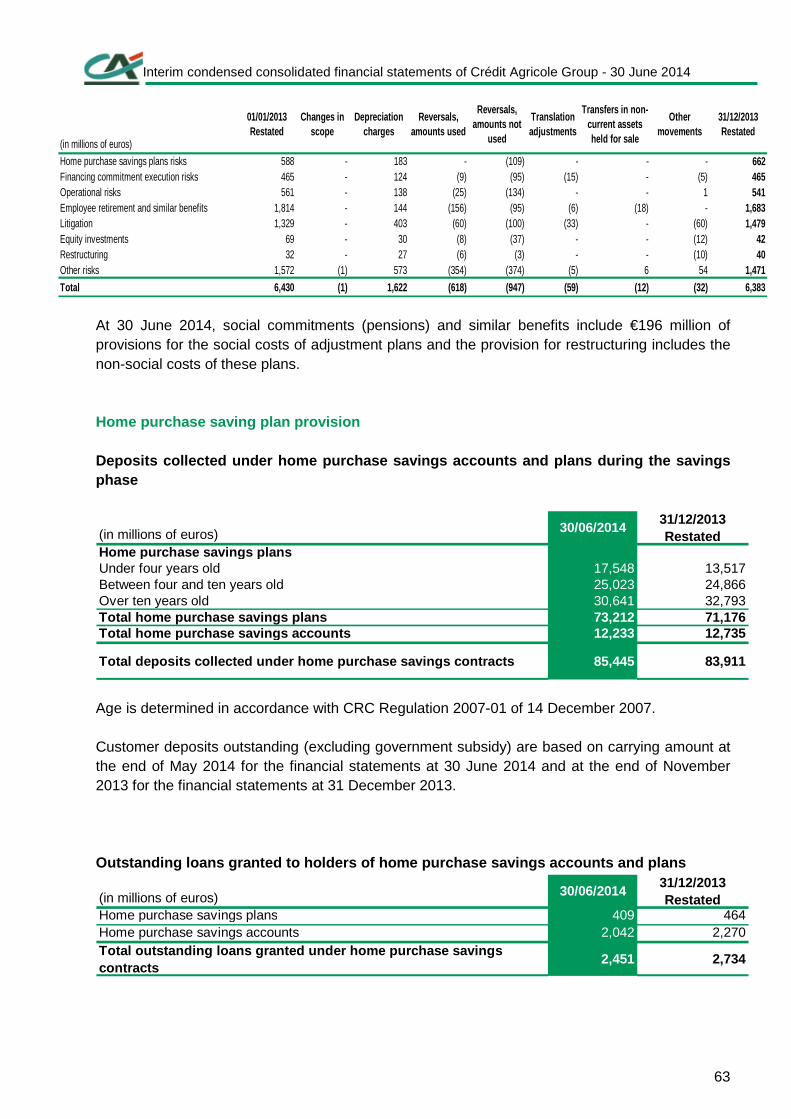
Interim condensed consolidated financial statements of Crédit Agricole Group - 30 June 2014
63
(in millions of euros)
01/01/2013Restated
Changes in scope
Depreciation charges
Reversals, amounts used
Reversals, amounts not
used
Translation adjustments
Transfers in non-current assets held for sale
Other movements
31/12/2013 Restated
Home purchase savings plans risks 588 - 183 - (109) - - - 662Financing commitment execution risks 465 - 124 (9) (95) (15) - (5) 465Operational risks 561 - 138 (25) (134) - - 1 541Employee retirement and similar benefits 1,814 - 144 (156) (95) (6) (18) - 1,683Litigation 1,329 - 403 (60) (100) (33) - (60) 1,479Equity investments 69 - 30 (8) (37) - - (12) 42Restructuring 32 - 27 (6) (3) - - (10) 40Other risks 1,572 (1) 573 (354) (374) (5) 6 54 1,471
Total 6,430 (1) 1,622 (618) (947) (59) (12) (32) 6,383
At 30 June 2014, social commitments (pensions) and similar benefits include €196 million of provisions for the social costs of adjustment plans and the provision for restructuring includes the non-social costs of these plans. Home purchase saving plan provision Deposits collected under home purchase savings acco unts and plans during the savings phase
(in millions of euros) 30/06/201431/12/2013Restated
Home purchase savings plans Under four years old 17,548 13,517Between four and ten years old 25,023 24,866Over ten years old 30,641 32,793Total home purchase savings plans 73,212 71,176Total home purchase savings accounts 12,233 12,735
Total deposits collected under home purchase saving s contracts 85,445 83,911
Age is determined in accordance with CRC Regulation 2007-01 of 14 December 2007. Customer deposits outstanding (excluding government subsidy) are based on carrying amount at the end of May 2014 for the financial statements at 30 June 2014 and at the end of November 2013 for the financial statements at 31 December 2013. Outstanding loans granted to holders of home purcha se savings accounts and plans
(in millions of euros) 30/06/201431/12/2013Restated
Home purchase savings plans 409 464Home purchase savings accounts 2,042 2,270Total outstanding loans granted under home purchase savings contracts
2,451 2,734

Interim condensed consolidated financial statements of Crédit Agricole Group - 30 June 2014
64
Provision for home purchase savings accounts and pl ans
(in millions of euros) 30/06/201431/12/2013Restated
Home purchase savings plans Under four years old 1 6Between four and ten years old 64 69Over ten years old 610 587Total home purchase savings plans 675 662Total home purchase savings accounts - -
Total provision for home purchase savings contracts 675 662
(in millions of euros)31/12/2013Restated
Depreciation charges
ReversalsOther
movements30/06/2014
Home purchase savings plans 662 13 - - 675
Home purchase savings accounts - - - -
Total provision for home purchase savings contracts 662 13 - - 675
Age plan is determined based on the date of the midway point in the generation of plans to which they belong.

Interim condensed consolidated financial statements of Crédit Agricole Group - 30 June 2014
65
6. Financing and guarantee commitments and other guarantees Financing and guarantee commitments and other guarantees include discontinued or held-for-sale operations. Commitments given and received
(in millions of euros) 30/06/201431/12/2013Restated
169,657 197,263
16,665 17,321
152,992 179,942
Confirmed credit lines 121,213 142,328
- Documentary credits 6,535 7,045
- Other confirmed credit lines 114,678 135,283
Other commitments given to customers 31,779 37,615
84,087 92,020
8,430 12,978
Confirmed documentary credit lines 2,134 2,409
Other 6,295 10,568
75,657 79,042
Property guarantees 4,011 4,833
Other customer guarantees 71,646 74,209
64,904 101,353
60,590 87,619
4,314 13,734
241,360 234,019
66,454 67,423
174,906 166,596
30,688 31,132
Other guarantees received 144,218 135,464
. Commitments received from credit institutions
. Commitments received from customers
Guarantees received from government bodies or similar institutions
Guarantee commitments
Commitments given Financing commitments
. Commitments given to credit institutions
. Commitments given to customers
Guarantee commitments
. Credit institutions
. Customers
Commitments received
Financing commitments
. Commitments received from credit institutions
. Commitments received from customers

Interim condensed consolidated financial statements of Crédit Agricole Group - 30 June 2014
66
Financial instruments pledged and received as colla teral
(in millions of euros) 30/06/201431/12/2013Restated
151,410 183,251
Securities lent 7,621 6,11117,545 20,171
119,394 129,192
295,970 338,725
Securities borrowed 14 2Securities bought under repurchase agreements 106,075 118,664Securities sold short 35,140 30,244
141,229 148,910
Fair value of instruments received as reusable and reused collateral
Total fair value of instruments received as reusabl e and reused collateral
Carrying amount of financial assets provided as col lateral (including transferred assets)Securities and receivables provided as collateral for the refinancing structures (SFEF, Banque de France, CRH, etc.)
Security deposits on market transactionsSecurities sold under repurchase agreements
Total carrying amount of financial assets provided as collateral
Guarantees held Guarantees held and assets received as collateral by Crédit Agricole S.A. Group which it is allowed to sell or to use as collateral amount to €107.7 billion, mostly within Crédit Agricole S.A. The majority of these are receivables pledged as collateral by the Regional Banks to Crédit Agricole S.A, as Crédit Agricole S.A. acts as the centralising body with regard to the external refinancing organisations. Crédit Agricole CIB also has €130.1 billion in assets received as collateral. The majority of these guarantees consist of mortgage loans, collateral or guarantees received, regardless of the quality of the assets guaranteed. They are mainly related to repurchase agreements and securities pledged to guarantee brokerage transactions. Crédit Agricole group policy is to sell seized collateral as soon as possible. Crédit Agricole Group had no such assets at 30 June 2014. Receivables received and pledged as collateral
At 30 June 2014, Crédit Agricole S.A. deposited €74,7 billion of receivables (mainly on behalf of Regional Banks) for refinancing transactions to the Banque de France, compared to €88.8 billion At 31 December 2013, and €14.8 billion of receivables were deposited directly by subsidiaries. At 30 June 2014, Crédit Agricole S.A. deposited €21.8 billion of receivables for refinancing transactions to the Caisse de Refinancement de l’Habitat on behalf of the Regional Banks, compared to €21.7 billion at 31 December 2013, and €7.2 billion of receivables were deposited directly by LCL.

Interim condensed consolidated financial statements of Crédit Agricole Group - 30 June 2014
67
At 30 June 2014, as part of refinancing transactions with SFEF in 2009, €4.6 billion of debt receivables remain pledged as collateral by Crédit Agricole S.A. Group (compared to €10.8 billion at 31 December 2013). At 30 June 2014, €31.5 billion of Regional Banks and LCL receivables had been pledged as collateral for the covered bond issues of Crédit Agricole Home Loan SFH, a financial company wholly owned by Crédit Agricole S.A. These transactions for which there is no transfer of contractual cash flows do not enter within the framework of the transfers of assets mentioned in the note 5.4 Transferred assets not derecognised or derecognised with ongoing involvement.

Interim condensed consolidated financial statements of Crédit Agricole Group - 30 June 2014
68
7. Reclassification of financial instruments
Principles applied by Crédit Agricole S.A. Group Reclassifications not included in the "Financial assets held for trading" or "Available-for-sale financial assets" categories were decided upon and implemented in accordance with the terms set forth by the amendment to IAS 39 adopted by the European Union on 15 October 2008. They were recorded in their new accounting category at fair value on the reclassification date.
Reclassifications carried out by Crédit Agricole S. A.
Pursuant to the amendment to IAS 39 published and adopted by the European Union on 15 October 2008, in the first half of 2014 Crédit Agricole CIB carried out reclassifications as permitted by the amendment to IAS 39. Information on these reclassifications and on prior year reclassifications is provided below.
Type, reason and amount of reclassifications carrie d out In the first half of 2014 the Group carried out a number of reclassifications from the "Available-for-sale financial assets" category to the "Loans and receivables" category. Reclassification between these two categories is made possible by IAS 39. They concern units in securitisation mutual funds subscribed in connection with financing activities and meeting the definition of the "Loans and receivables" category. These reclassifications were carried out at 30 June 2014. Reclassifications carried out in prior years concern reclassifications from "Financial assets at fair value through profit or loss" to "Loans and receivables" and relate to loan syndication operations or securitisation assets. For assets reclassified in the first half of 2014, the table below shows their value on the reclassification date, as well as the value, at 30 June 2014, of assets reclassified before and still included in the Group’s assets at that date:
(in millions of euros)
Carrying amount30/06/2014
Estimated market value at
30/06/2014
Reclassification value
Carrying amount
30/06/2014
Estimated market value30/06/2014
Carrying amount
30/06/2014
Estimated market value30/06/2014
Carrying amount
31/12/2013Restated
Estimated market value31/12/2013Restated
Financial assets at fair value through profit or loss reclassified as loans and receivables
2,236 2,220 - - - 2,236 2,220 2,786 2,755
Available-for-sale financial assets reclassified as loans and receivables
418 418 418 418 418 - - - -
Total reclassified assets 2,654 2,638 418 418 418 2,236 2,220 2,786 2,755
Total reclassified assets Assets reclassified in 201 4 Assets reclassified before

Interim condensed consolidated financial statements of Crédit Agricole Group - 30 June 2014
69
Change in fair value of reclassified assets recogni sed in profit and loss The change in fair value recognised in income or in equity of the assets reclassified in the first half of 2014 is shown in the table below. Contribution of reclassified assets to net income s ince the reclassification date The impact of the financial statements of the reclassified assests is as follows :
(in millions of euros)
Actual income and expenses
recognised
If asset had been retained in
its former category
(change in fair value)
Actual income and expenses
recognised
If asset had been
retained in its former category
(change in fair value)
Actual income and expenses
recognised
If asset had been
retained in its former category
(change in fair value)
Actual income and expenses
recognised
If asset had been
retained in its former category
(change in fair value)
Financial assets at fair value through profit or loss reclassified as loans and receivables
- - (104) (174) 2 - (102) (174)
Available-for-sale financial assets reclassified as loans and receivables
5 5 - - - - - -
Total reclassified assets 5 5 (104) (174) 2 - (102) (174)
Impact in 2014Cumulative impact at
31/12/2013Restated
Impact in 2013Cumulative impact at
30/06/2014
Reclassified assets in 2014 Assets reclassified before
Additional information As at the reclassification date, the financial assets reclassified in the first half of 2014 had an actual interest rate of 2.23%, with non-discounted future cash flows estimated at €428 million.

Interim condensed consolidated financial statements of Crédit Agricole Group - 30 June 2014
70
8. Fair value of financial instruments The fair value is the price that would be received for the disposal of an asset or paid for the transfer of a liability for an arm’s length transaction between market participants at the valuation date. Fair value is defined on the basis of an exit price. The fair values shown below are estimates made on the reporting date using observable market data wherever possible. They are subject to change in subsequent periods due to developments in market conditions or other factors. The calculations represent best estimates. They are based on a number of valuation models and assumptions. It is assumed that market participants act in their best economic interest. To the extent that these models contain uncertainties, the fair values shown may not be achieved upon actual sale or immediate settlement of the financial instruments concerned.

Interim condensed consolidated financial statements of Crédit Agricole Group - 30 June 2014
71
8.1. Fair value of financial assets and liabilities meas ured at amortised cost
Amounts presented below include accruals and prepayments and are net of impairment.
Financial assets recognised at cost on the balance sheet measured at fair value
Value at 30 june 2014
Estimated fair value at 30 june 2014
Quoted prices in
active markets for
identical instruments :
Level 1
Valuation based on
observable data : Level
2
Valuation based on
unobservable data : Level 3
Loans and receivables 779,356 801,742 25 334,577 467,140Loans and receivables due from credit institutions 91,627 92,915 - 91,898 1,017Current accounts and overnight loans 10,126 10,103 - 10,098 5Accounts and term deposits 47,040 48,381 - 48,053 328Pledged securities 132 135 - 12 123Securities bought under repurchase agreements 28,306 28,300 - 28,113 187Subordinated loans 451 432 - 134 298Securities not listed on an active market 5,565 5,558 - 5,482 76Other Loans and receivables 7 7 - 7 -
Loans and receivables due from customers 687,729 708,827 25 242,679 466,123Trade receivables 20,416 20,545 10 4,916 15,619Other customer loans 631,431 651,595 14 219,255 432,327Securities bought under repurchase agreements 3,117 3,113 - 3,100 13Subordinated loans 143 142 - 17 125Securities not listed on an active market 11,809 11,935 - 68 11,866Insurance receivables 748 749 - 38 711Reinsurance receivables 284 283 - 1 282Advances in associates current accounts 932 894 2 682 210Current accounts in debit 18,849 19,572 - 14,602 4,970
Held-to-maturity financial assets 28,731 31,900 31,628 272 -Treasury bills and similar securities 18,300 20,340 20,332 8 -Bonds and other fixed income securities 10,431 11,560 11,296 264 -
808,087 833,642 31,653 334,849 467,140
Financial assets not measured at fair value on bala nce sheet
Total financial assets of which fair value is discl osed
(in millions of euros)

Interim condensed consolidated financial statements of Crédit Agricole Group - 30 June 2014
72
Value at 31 December
2013Restated
Estimated fair value at
31 December
2013
Quoted prices in
active markets for
identical instruments :
Level 1
Valuation based on
observable data : Level
2
Valuation based on
unobservable data : Level 3
Loans and receivables 788,311 806,887 60 282,590 524,237Loans and receivables due from credit institutions 93,922 95,125 55 89,070 6,000Current accounts and overnight loans 10,848 11,012 - 11,006 6Accounts and term deposits 48,116 49,168 - 43,686 5,482Pledged securities 200 200 - 12 188Securities bought under repurchase agreements 29,158 29,133 - 29,133 -Subordinated loans 584 29 - 29 -Securities not listed on an active market 5,007 579 55 209 315Other Loans and receivables 9 5,003 - 4,995 8
Loans and receivables due from customers 694,389 711,763 5 193,520 518,238Trade receivables 15,438 15,444 - 1,264 14,180Other customer loans 647,821 671,330 5 172,096 499,229Securities bought under repurchase agreements 2,066 138 - 8 130Subordinated loans 137 2,065 - 2,031 34Securities not listed on an active market 9,876 2,865 - 50 2,815Insurance receivables 477 478 - 34 444Reinsurance receivables 277 277 - - 277Advances in associates current accounts 940 987 - 784 203Current accounts in debit 17,357 18,178 - 17,252 925
Held-to-maturity financial assets 25,447 27,614 25,634 1,980 -Treasury bills and similar securities 16,145 17,612 16,417 1,195 -Bonds and other fixed income securities 9,302 10,002 9,217 785 -
813,758 834,501 25,694 284,570 524,237
(in millions of euros)Financial assets not measured at fair value on bala nce
Total financial assets of which fair value is discl osed
Amounts have been changed as compared to those published at 31 december 2013. The fair value hierarchy of financial assets is broken down according to the general observability criteria of the valuation inputs, pursuant to the principles defined under IFRS 13. Level 1 applies to the fair value of financial assets quoted in active markets. Level 2 applies to the fair value of financial assets with observable inputs. This includes market data relating to interest rate risk or credit risk when the latter can be revalued based on Credit Default Swaps (CDS) prices. Repurchase agreements with underlyings quoted in an active market are also included in level 2 of the hierarchy, as are financial assets with a demand component for which fair value is measured at unadjusted amortised cost. Level 3 indicates the fair value of financial assets with unobservable inputs or for which some data can be revalued using internal models based on historical data. This mainly includes market data relating to credit risk or early redemption risk.

Interim condensed consolidated financial statements of Crédit Agricole Group - 30 June 2014
73
Financial liabilities recognised at cost on the bal ance sheet measured at fair value
Value at 30 june 2014
Estimated fair value at 30 june 2014
Quoted prices in
active markets for
identical Instruments :
Level 1
Valuation based on
observable data : Level
2
Valuation based on
unobservable data : Level 3
Due to credit institutions 100,682 101,314 733 100,559 22Current accounts and overnight loans 12,260 12,696 513 12,160 22Accounts and term deposits 53,529 53,734 220 53,514 -Pledged securities - - - - -Securities sold under repurchase agreements 34,893 34,885 - 34,885 -
Due to customers 610,285 607,886 1,959 513,888 92,039Current accounts in credit 213,447 213,538 5 213,268 265Special savings accounts 244,886 244,585 - 203,441 41,144Other amounts due to customers 139,178 136,969 293 88,025 48,651Securities sold under repurchase agreements 10,807 10,815 1,661 9,155 -Insurance liabilities 889 898 - - 898Reinsurance liabilities 410 412 - - 412
668 668 - - 668
Debt securities 190,627 195,040 91,913 101,376 1,751
Subordinated debt 25,401 25,399 23,680 1,636 84
926,995 929,639 118,284 717,459 93,896
(in millions of euros)Financial liabilities not measured at fair value on balance
Cash deposits received from cedants and retrocessionaires
Total financial liabilities of which fair value is disclosed
Value at 31 December
2013Restated
Estimated fair value at
31 December
2013
Quoted prices in
active markets for
identical Instruments :
Level 1
Valuation based on
observable data : Level
2
Valuation based on
unobservable data : Level 3
Due to credit institutions 100,036 100,384 1,380 97,878 1,126Current accounts and overnight loans 13,497 13,609 1,088 12,519 2Accounts and term deposits 53,009 53,365 292 51,949 1,124Pledged securities 43 43 - 43 -Securities sold under repurchase agreements 33,487 33,367 - 33,367 -
Due to customers 642,590 645,968 3,062 518,915 123,992Current accounts in credit 213,289 213,274 - 213,157 117Special savings accounts 252,121 252,073 - 201,238 50,835Other amounts due to customers 164,015 167,469 123 96,110 71,236Securities sold under repurchase agreements 11,350 11,349 2,939 8,410 -Insurance liabilities 808 804 - - 804Reinsurance liabilities 376 369 - - 369
631 631 - - 631
Debt securities 173,464 169,580 74,239 95,197 144
Subordinated debt 26,633 25,873 23,857 2,016 -
942,723 941,805 102,538 714,005 125,262
Cash deposits received from cedants and retrocessionaires against technical insurance commitments
Total financial liabilities of which fair value is disclosed
Financial liabilities not measured at fair value on balance sheet
(in millions of euros)
Amounts have been changed as compared to those published at 31 december 2013.

Interim condensed consolidated financial statements of Crédit Agricole Group - 30 June 2014
74
The fair value hierarchy of financial liabilities is broken down according to the general observability criteria of the valuation inputs, pursuant to the principles defined under IFRS 13. Level 1 applies to the fair value of financial liabilities quoted in active markets. Level 2 applies to the fair value of financial liabilities with relevant observable inputs. This includes market data relating to interest rate risk or credit risk when the latter can be revalued based on Credit Default Swaps (CDS) prices. Repurchase agreements with underlyings quoted in an active market are also included in level 2 of the hierarchy, as are financial liabilities with a demand component for which fair value is measured at unadjusted amortised cost. Level 3 indicates the fair value of financial liabilities with unobservable inputs or for which some data can be revalued using internal models based on historical data. This mainly includes market data relating to credit risk or early redemption risk. In some cases, market values are close to carrying amounts. This applies primarily to:
• assets or liabilities at variable rates for which interest rates changes do not have a significant influence on the fair value, since the rates on these instruments frequently correct themselves to the market rates;
• short-term assets or liabilities where the redemption value is considered to be
close to the market value;
• regulated instruments (e.g. regulated savings accounts) where prices are fixed by the government;
• assets or liabilities payable on request;
• transactions for which there are no reliable observable data.

Interim condensed consolidated financial statements of Crédit Agricole Group - 30 June 2014
75
8.2. Information about financial instruments measured at fair value Valuation methods Financial instruments are valued by management information systems and checked by a team that reports to the Risk Management department and is independent from the market operators. Valuations are based on the following:
• prices or inputs obtained from independent sources and/or validated by the Market Risk department using a series of available sources such as pricing service vendors, market consensus data and brokers;
• models validated by quantitative teams at the Market Risk department. The valuation produced for each instrument is a mid-market valuation, which does not take account of the direction of the trade, the bank’s aggregate exposure, market liquidity or counterparty quality. Adjustments are then made to the market valuations to incorporate those factors, as well as the potential uncertainties inherent in the models or inputs used. The main types of valuation adjustments are the following: Mark-to-Market adjustments: these adjustments correct any potential variance between the mid-market valuation of an instrument obtained using internal valuation models and the associated inputs and the valuation obtained from external sources or market consensus data. These adjustments can be positive or negative; Bid/ask reserves: these adjustments incorporate the bid/ask spread for a given instrument in order to reflect the price at which the position could be reversed. These adjustments are always negative; Reserves for uncertainty of parameters: these adjustments look to incorporate any uncertainty that may exist in terms of one or more of the parameters used into the valuation of an instrument . They differ from the mark-to-market adjustments described above in that they are not intended to correct an actual variance but to protect against an uncertainty. These adjustments are therefore always negative; Reserves for uncertainty of model: these adjustments look to incorporate any uncertainty that may exist because of the choice of model used into the valuation of an instrument. These adjustments are always negative. Furthermore, Crédit Agricole S.A. makes a Credit Valuation Adjustment (CVA) to its derivative assets to reflect counterparty risk and a Debit Valuation Adjustment or own credit risk (DVA) to its derivative liabilities to reflect the risk of non-execution.
Interim condensed consolidated financial statements of Crédit Agricole Group - 30 June 2014
76
The value adjustment relating to counterparty quality (Credit Value Adjustment - CVA) looks to incorporate the credit risk associated with the counterparty (risk of non-payment of sums due in the event of default) into the valuation of derivatives. It is calculated on an aggregate basis by counterparty according to the future exposure profile of the transactions after deducting any collateral. This adjustment is always negative and is deducted from the fair value of the financial assets. The value adjustment relating to our institution's own credit risk (Debt Value Adjustment - DVA) looks to incorporate the risk borne by our counterparties into the valuation of derivatives. It is calculated on an aggregate basis by counterparty according to the future exposure profile of the transactions. This adjustment is always positive and is deducted from the fair value of the financial liabilities. The CVA/DVA is calculated on the basis of an estimate of expected losses based on the probability of default and loss given default. The methodology used maximises the use of observable market inputs. It is based first and foremost on market inputs such as quoted CDSs when they are considered to be sufficiently liquid. In certain circumstances and in the absence of observable or relevant market inputs, historical default data may also be used. FVA (Funding Valuation Adjustment) The valuation of unsecured derivative instruments includes an FVA (Funding Valuation Adjustment) related to the funding of these instruments. Its first application at 30 June 2014 saw the recognition of a loss of -€167 million.

Interim condensed consolidated financial statements of Crédit Agricole Group - 30 June 2014
77
Financial instruments measured at fair value broken down into the fair value hierarchy Financial assets measured at fair value
30/06/2014
Quoted prices in active
markets for identical
instruments : Level 1
Valuation based on
observable data :
Level 2
Valuation based on
unobservable data :
Level 3
256,435 48,523 202,806 5,106Loans and receivables due from customers 310 - - 310Securities bought under repurchase agreements 72,273 - 72,273 -Securities held for trading 49,071 48,218 142 711
Treasury bills and similar securities 36,598 36,524 74 - Bonds and other fixed income securities 8,936 8,160 65 711 Equities and other equity variable income securities 3,537 3,534 3 -
Derivative instruments 134,781 305 130,391 4,085
Financial assets designated at fair value through p rofit and loss 87,197 53,885 29,154 4,158
Loans and receivables due from credit institutions 1,096 - 1,096 -Loans and receivables due from customers 193 - - 193Assets backing unit-linked contracts 35,889 22,066 13,763 60Securities designated at fair value through profit and loss 50,019 31,819 14,295 3,905
Treasury bills and similar securities 13,431 13,431 - - Bonds and other fixed income securities 22,850 17,072 5,761 17 Equities and other equity variable income securities 13,738 1,316 8,533 3,889
Available-for-sale financial assets 291,974 251,319 38,330 2,325Treasury bills and similar securities 69,316 68,133 1,183 -Bonds and other fixed income securities 193,981 166,158 27,612 211Equities and other equity variable income securities 28,677 17,028 9,535 2,114Available-for-sale receivables - - - -
Hedging derivative instruments 26,111 2,195 23,916 -
661,717 355,922 294,206 11,589
380 -1,049 1,986
- 1711,049 551 1,986
(in millions of euros)Financial assets held for trading
Transfers from level 1 : Quoted prices in active markets for identical instrumentsTransfers from level 2 : Valuation based on observable dataTransfers from level 3 : Valuation based on unobservable dataTotal transfers to each level
TOTAL FINANCIAL ASSETS MEASURED AT FAIR VALUE
Level 2 to Level 1 transfers mainly involve bonds whose characteristics meet the criteria specified for Level 1. Level 2 to Level 3 transfers mainly involve interest rate derivatives.

Interim condensed consolidated financial statements of Crédit Agricole Group - 30 June 2014
78
31/12/2013Restated
Quoted prices in active
markets for identical
instruments : Level 1
Valuation based on
observable data :
Level 2
Valuation based on
unobservable data :
Level 3
278,923 46,346 228,425 4,152Loans and receivables due from customers 358 - - 358Securities bought under repurchase agreements 85,155 - 85,155 -Securities held for trading 46,476 46,082 376 18
Treasury bills and similar securities 35,360 35,170 190 - Bonds and other fixed income securities 7,761 7,561 182 18 Equities and other equity variable income securities 3,355 3,351 4 -
Derivative instruments 146,934 264 142,894 3,776
Financial assets designated at fair value through p rofit and loss 81,552 50,198 27,346 4,008Loans and receivables due from credit institutions 1,087 - 1,087 -Loans and receivables due from customers 211 - - 211
Assets backing unit-linked contracts 34,619 21,537 13,023 59Securities designated at fair value through profit and loss 45,635 28,661 13,236 3,738
Treasury bills and similar securities 5,948 5,948 - - Bonds and other fixed income securities 27,146 21,536 5,592 18 Equities and other equity variable income securities 12,541 1,177 7,644 3,720
Available-for-sale financial assets 284,443 242,787 38,703 2,953Treasury bills and similar securities 69,422 67,947 1,475 -Bonds and other fixed income securities 190,234 160,792 28,481 961Equities and other equity variable income securities 24,787 14,048 8,747 1,992Available-for-sale receivables - - - -
Hedging derivative instruments 30,726 1,633 29,076 17
675,644 340,964 323,550 11,130
253 -
4,831 4,183
52 72
4,883 325 4,183
(in millions of euros)Financial assets held for trading
Transfers from level 1 : Quoted prices in active markets for identical instruments
Transfers from level 2 : Valuation based on observable data
Total financial assets measured at fair value
Transfers from level 3 : Valuation based on unobservable dataTotal transfers to each level
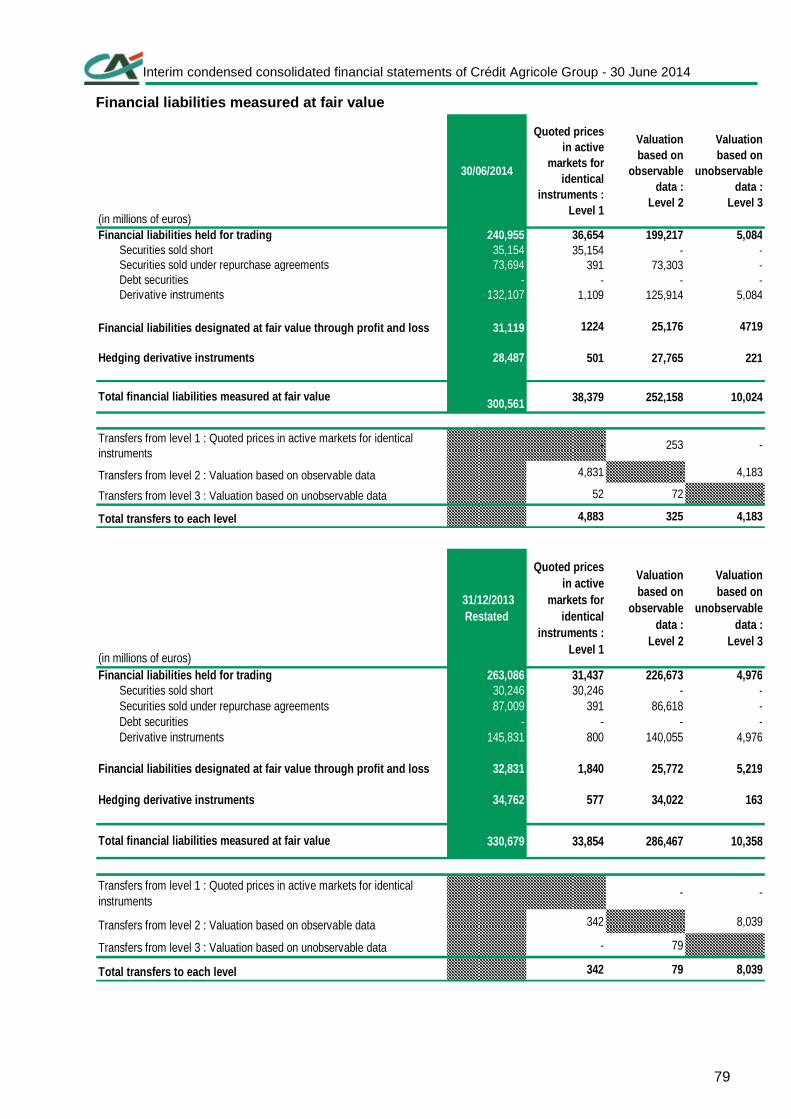
Interim condensed consolidated financial statements of Crédit Agricole Group - 30 June 2014
79
Financial liabilities measured at fair value
30/06/2014
Quoted prices in active
markets for identical
instruments : Level 1
Valuation based on
observable data :
Level 2
Valuation based on
unobservable data :
Level 3
240,955 36,654 199,217 5,084Securities sold short 35,154 35,154 - -Securities sold under repurchase agreements 73,694 391 73,303 -Debt securities - - - -Derivative instruments 132,107 1,109 125,914 5,084
Financial liabilities designated at fair value thro ugh profit and loss 31,119 1224 25,176 4719
Hedging derivative instruments 28,487 501 27,765 221
300,561 38,379 252,158 10,024
- 253 -
4,831 - 4,183
52 72 -
4,883 325 4,183
(in millions of euros)Financial liabilities held for trading
Transfers from level 1 : Quoted prices in active markets for identical instruments
Transfers from level 2 : Valuation based on observable data
Transfers from level 3 : Valuation based on unobservable data
Total transfers to each level
Total financial liabilities measured at fair value
31/12/2013Restated
Quoted prices in active
markets for identical
instruments : Level 1
Valuation based on
observable data :
Level 2
Valuation based on
unobservable data :
Level 3
263,086 31,437 226,673 4,976Securities sold short 30,246 30,246 - -Securities sold under repurchase agreements 87,009 391 86,618 -Debt securities - - - -Derivative instruments 145,831 800 140,055 4,976
Financial liabilities designated at fair value thro ugh profit and loss 32,831 1,840 25,772 5,219
Hedging derivative instruments 34,762 577 34,022 163
330,679 33,854 286,467 10,358
- -
342 8,039
- 79
342 79 8,039
Transfers from level 3 : Valuation based on unobservable data
Total transfers to each level
(in millions of euros)Financial liabilities held for trading
Total financial liabilities measured at fair value
Transfers from level 1 : Quoted prices in active markets for identical instruments
Transfers from level 2 : Valuation based on observable data
Interim condensed consolidated financial statements of Crédit Agricole Group - 30 June 2014
80
Level 2 to Level 3 transfers mainly involve interest rate derivatives and liabilities designated as at fair value through profit or loss with a Level 3 embedded derivative. Financial instruments classified in level 1 Level 1 comprises all derivatives quoted in an active market (options, futures, etc.), regardless of their underlying (interest rate, exchange rate, precious metals, key stock indices), as well as equities and bonds quoted in an active market. Corporate and government bonds and agencies that are valued on the basis of prices obtained from independent sources and updated regularly are classified in Level 1. This covers the bulk of all sovereign, agency and corporate bonds held. Issuers whose bonds are not quoted are classified in Level 3. Financial instruments classified in level 2 The main financial instruments recognised as level two are:
• Liabilities designated at fair value through profit or loss: Liabilities recognised at fair value through profit or loss are classified in Level 2 when their embedded derivative is considered to be classified in Level 2;
• OTC derivatives : The main OTC derivatives classified in Level 2 are those valued using inputs considered to be observable and where the valuation technique does not generate any significant exposure to a model risk. Level 2 therefore mainly includes:
• linear derivative products such as interest rate swaps, currency swaps and forward FX. They are valued using simple models widely used in the market, based either on directly observable inputs (foreign exchange rates, interest rates), or inputs derived from observable market prices (currency swaps);
• non-linear vanilla instruments such as caps, floors, swaptions, currency options,
equity options and credit default swaps, including digital options. These are valued using simple models widely used in the market, based on directly observable inputs (foreign exchange rates, interest rates, share prices), or that can be derived from the price of products observable on the market (volatilities).
• simple exotic single-underlying instruments such as cancellable swaps, currency
baskets of major currencies. They are valued using models that are sometimes slightly more complex but still widely used in the market. The inputs are mainly observable inputs and market prices, obtained notably from brokers and/or market consensus data, which can be used to corroborate internal valuations.

Interim condensed consolidated financial statements of Crédit Agricole Group - 30 June 2014
81
Financial instruments classified in level 3 Financial instruments classified in Level 3 are those which do not meet the conditions for classification in Level 1 or 2. They are therefore mainly financial instruments with a high model risk whose valuation requires substantial use of unobservable inputs. The initial margin on all new transactions classified in Level 3 is reserved at the date of initial recognition. It is reintegrated in the profit or loss account either spread over the period during which the inputs are considered to be unobservable or in full on the date when the inputs become observable. Level 3 therefore mainly comprises:
• Securities : Level 3 securities are mainly unquoted equities or bonds for which no independent valuation is available;
• Liabilities designated at fair value through profit or loss: Liabilities designated at fair value through profit or loss are classified in Level 3 when their embedded derivative is considered to be classified in Level 3;
• OTC derivatives : Unobservable products as a result of underlying factors: some products, which are mostly classified in Level 2, may be considered to fall within Level 3 due to their underlying currency or maturity. An observability table defines the maximum maturity considered to be observable for each instrument/currency pair. Observability is a function of the input’s liquidity and the availability of observable sources enabling its valuation. Level 3 mainly comprises:
• interest-rate exposures or very long-dated currency swaps; • exposures to non-linear long-dated, interest rate, currency or share products on
key currencies/indices. It also includes vanilla options and simple exotic derivatives such as cancellable swaps;
• non-linear exposures to emerging market currencies. Complex derivatives: classified in Level 3 as their valuation requires the use of unobservable inputs. The main exposures involved are:
• products whose underlying is the difference between two interest rates, such as Options, Binary Options or exotic products. These products are based on a correlation between the two rates, which is considered to be unobservable due to reduced liquidity. The valuation of these exposures is nonetheless adjusted at the month-end on the basis of correlation levels derived from market consensus data;
• securitisation swaps generating an exposure to the prepayment rate. The prepayment rate is determined on the basis of historical data on similar portfolios. The assumptions and inputs used are checked regularly on the basis of actual prepayments;
• hybrid long term interest rate/FX products, such as Power Reverse Dual Currency notes, which mainly involve the USD/JPY currency pair or products whose underlying is a basket of currencies.

Interim condensed consolidated financial statements of Crédit Agricole Group - 30 June 2014
82
The correlation parameters between interest rates and currencies as well as between the two interest rates are determined using an internal methodology based on historical data. Results are cross-checked against market consensus data to ensure that the overall method is coherent;
• multiple-underlying products generating an exposure to correlations, regardless of the underlyings concerned (interest rates, equities, credit, FX, inflation). This category includes cross-asset products such as dual range, emerging market currency baskets and Credit Default Baskets. Correlations are determined conservatively as a function of the bank’s aggregate exposure, based on historical data. If the diversity of correlations is high, exposures to each one remain measured;
• CDOs based on corporate credit baskets. The valuation model for these products uses both observable inputs (CDS prices) and unobservable inputs (default correlations). For the least liquid Senior tranches, the bank has introduced valuation inputs that are tailored to its assessment of the intrinsic risk of these exposures. Market risk of the CDO derivatives book was sold to a fund managed by Blue Mountain Capital in 2012;
• The market risk of complex equity derivative portfolios was transferred to an external counterparty at 31 December 2013.
For most of these products, the table below shows the valuation techniques and the main unobservable inputs with their value interval. This analysis has been carried out on CIB’s derivative instruments.
Assets Liabilities
Interest rate
derivatives
2,336 3,766 Long-dated cancellable products (cancellable swaps,
cancellable zero coupon swaps)
Interest rate options valuation model Forward volatility -
Options on interest rate differentials CMS correlations 0% / 100%
Securitisation swaps Prepayment modelling and discounted
future cash flows
Prepayment rate 0% / 50%
Interest rate/interest rate correlation 50% / 80%
Interest rate/FX correlation -50% / 50%
Multiple-underlying products (dual range, etc.) Valuation models for instruments with
multiple underlyings
Fx/equity correlation -50% / 75%
FX/FX correlation -20% / 50%
Interest rate/equity correlation -25% / 75%
Interest rate/interest rate correlation -10% / 100%
Interest rate/FX correlation -75% / 75%
Credit derivatives 746 816 CDOs indexed to corporate credit baskets Correlation projection techniques and
expected cash flow modelling
Default correlations 50% / 90%
Main unobservable inputsUnobservable
data interval
Long-dated hybrid interest rate/exchange rate
products (PRDC)
Interest rate/FX hybrid product valuation
model
Instrument
classes
Carrying amount (€m)
Main product types comprising Level 3 Valuation technique used

Interim condensed consolidated financial statements of Crédit Agricole Group - 30 June 2014
83
Change in balance of financial instruments measured at fair value according to level 3 Financial assets measured at fair value according t o level 3
Total
Loans and receivables
due from customers
Bonds and other fixed-income
securities
Equities and other variable-
income securities
Securities held for trading
Derivative instruments
Assets backing unit-
linked contracts
Loans and receivables
due from customers
Bonds and other fixed-
income securities
Equities and other variable-income
securities
Securities designated at
fair value through profit
and loss
Treasury bills and similar
securities
Bonds and other fixed-
income securities
Equities and other variable-
income securities
11,153 358 18 - 18 3,776 211 59 18 3,720 3,738 - 984 1,992 17Gains or losses for the period (388) 53 3 - 3 (552) - 7 (1) 65 64 - (60) 97 -
Recognised in profit and loss (1) (456) 53 3 - 3 (552) - 7 (1) 65 64 - 10 (41) -Recognised in other comprehensive
income (1) 68 - - - - - - - - - - - (70) 138 -
Purchases 1,148 - - - - 288 9 - - 380 380 - - 471 -Sales (1,228) (140) - - - (498) (22) (6) - (276) (276) - - (286) -Issues - - - - - - - - - - - - - - -Settlements (427) - - - - (133) - - - - - - (252) (42) -Reclassifications (430) 39 - - - - - - - - - - (418) (51) -Changes associated with scope for the period
(53) - - - - - (5) - - - - - (44) (4) -
Transfers 1,815 - 690 - 690 1,204 - - - - - - 1 (63) (17)Transfers to Level 3 1,986 - 690 - 690 1,238 - - - - - - 1 57 -Transfers from Level 3 (171) - - - - (34) - - - - - - - (120) (17)
Closing balance (30/06/2014) 11,590 310 711 - 711 4,085 193 60 17 3,889 3,906 - 211 2,114 -
(in millions of euros)
Financial assets held for trading
Opening balance (01/01/2014)
Hedging derivative
instruments
Available-for-sale financial assets
Financial assets designated at fair value through p rofit and loss
(1) Gains and losses from financial assets held on the balance sheet at the closing date stood at -€368 million.

Interim condensed consolidated financial statements of Crédit Agricole Group - 30 June 2014
84
Financial liabilities measured at fair value accord ing to level 3
Financial liabilities held for trading
Total Derivative instruments
10,358 4,976 5,219 163Gains or losses for the period (675) (558) (134) 17
Recognised in profit and loss (1) (675) (558) (134) 17Recognised in other comprehensive
income (1) -- - -
Purchases 90 90 - -Sales (729) (353) (376) -Issues 136 - 27 109Settlements (125) (65) (24) (36)Reclassifications - - - -Changes associated with scope for the period (32) - - (32)
Transfers 1,001 994 7 -Transfers to Level 3 1,031 998 33 -Transfers out of Level 3 (30) (4) (26) -
10,024 5,084 4,719 221Closing balance (30/06/2014)
(in millions of euros)Opening balance (01/01/2014)
Financial liabilities
designated at fair value
through profit and
loss
Hedging derivative
instruments
(1) Gains and losses on financial liabilities held in the balance sheet at the closing date stood at -€691 million. The net change in fair value of assets and liabilities classified in Level 3 amounts to +€794 million at 30 June 2014 and comprises, excluding changes in scope, the following :
• Change in gains and losses for the period of +€287 million; • Net purchases of +€1,058 million; • Net sales of -€499 million; • Net issues of -€136 million; • Net settlements for -€302 million, largely linked to the deleveraging plan in respect of
interest rate activities in run-off; • Net reclassifications for -€430 million;
Net transfers of financial instruments in the amount of +€814 million relating mainly to +€690 million of securities held for trading and + €240 millions million of tansaction derivatives.
The fair value amount (and variation) on these products alone is not however representative. Indeed, these products are largely hedged by others, more simple and individually valued, using data considered as observable. The valuations (and variations) of these hedging products, largely symmetrical with those of products valued on the basis of data considered as unobservable, do not appear in the table above.

Interim condensed consolidated financial statements of Crédit Agricole Group - 30 June 2014
85
Sensitivity analysis for financial instruments meas ured using Level 3 valuation techniques The use of unobservable inputs introduces uncertainty, which we have assessed below using a sensitivity calculation on instruments valued using these inputs. This analysis has been carried out on CIB’s derivative instruments. Within the scope of interest-rate derivatives, two main factors are considered as unobservable and thus entail the de facto classification of products whose valuation is typically used in Level 3: correlation and prepayment rates (i.e. early repayment).
• Correlation : Many products are sensitive to a correlation input. However, this input is not unique and there are many different types of correlation including: • forward correlation between successive indices in the same currency - e.g. 2-year CMS/10-
year CMS; • interest rate/interest rate correlation (different indices) - e.g. Libor 3M USD/Libor 3M EUR; • interest rate/FX correlation (or Quanto): e.g. USD/JPY – USD; • equity/equity correlation; • equity/FX correlation; • equity/interest rate correlation; • FX/FX correlation.
Although correlation positions involving equity indices have increased compared with end-2012, the two key exposures to correlation remain: • interest rate/FX correlation, mainly USD/JPY-USD, USD/JPY-JPY on the Long term FX book
(ex PRDC) and EUR/GBP-EUR on the Hybrid instruments book; • interest rate/interest rate correlation.
• Prepayment rate : The prepayment rate is the rate of early repayment on securitisation portfolios, whether voluntary or involuntary (default). As the nominal amount of securitisation swaps is adjusted automatically to the nominal amount of the underlying portfolio, with no mark-to-market payment, the prepayment rate plays a significant part in their valuation. However, although this input is not observable, the valuation model used is extremely conservative. The valuation used is defined as the lower of the valuation obtained using the fastest prepayment rate and that obtained using a slower than expected prepayment rate. A “normal” variation in the prepayment rate will therefore have no material impact on the valuation. The results presented below have been obtained by applying the following shocks: correlations between successive index in the same currency (i.e. CMS correlations): 3%;

Interim condensed consolidated financial statements of Crédit Agricole Group - 30 June 2014
86
cross-asset correlations (e.g. Equity/FX or IR/Equity) and between two interest-rate curves in different currencies: 5%; The result of the stress test is obtained by adding up the absolute values obtained. For each correlation type, we took the absolute values by currency and by book, therefore assuming that the correlations were not correlated among themselves. For the CMS correlations, we considered the various underlyings independently (e.g. 1y10y, 2y10y). As at 30 June 2014, sensitivity to the parameters used in interest rate derivatives models was +/- €7.9 million. The strong decrease compared to 31 December 2013 (€14.4 million) can be accounted for by a decrease of approximately €5.5 million in the CMS Correlation Euro position. Impact on the other scopes was significantly lower, particularly on the LTFX and Hybrid books. The main contributory factors are: - Long Term FX: €3.3 million (vs. €3.5 million); - Hybrid Instruments: €2.9 million (vs. €3.2 million); - Cross Assets: €1.2 million (stable). The contributions of the other scopes are irrelevant. The scope excluding interest rate derivatives concerns RMBS type securitisations, CLO and CDO mezzanine tranches: the magnitude of uncertainty is captured via a shock of 1 bp on the credit spreads. As at 30 June 2014, sensitivity to the parameters used to value these products is almost zero.

Interim condensed consolidated financial statements of Crédit Agricole Group - 30 June 2014
87
8.3. Estimated impact of inclusion of the margin at ince ption The deferred margin is the portion of the margin that is not booked upon initial recognition. It comprises the difference between the transaction price paid or received for a financial instrument upon initial recognition and its fair value on that date. It concerns Level 3 financial instruments for which fair value is determined on the basis of complex valuation models using unobservable inputs. The deferred margin is reintegrated in the profit or loss account either spread over the period during which the inputs are considered to be unobservable or in full on the date when the inputs become observable.
(in millions of euros) 30/06/201431/12/2013Restated
Deferred margin at 1 st January 62 102Margin generated by new transactions during the period 17 15Recognised in net income during the period - -Amortisation and cancelled / reimbursed / matured transactions (12) (55)Effects of inputs or products reclassified as observable during the period - -
67 62Deferred margin at the end of the period

Interim condensed consolidated financial statements of Crédit Agricole Group - 30 June 2014
88
9. Impact of accounting changes (new consolidation standards) or other events
Pursuant to IFRS 5, the contribution made to the Crédit Agricole Group income statements at 31 December 2013 and 30 June 2013 by Newedge Group, the Nordic entities of CA Consumer Finance, Crédit Agricole Bulgaria, CAL Hellas, BES Seguros, Crelan and BNI Madagascar was reclassified as Net income from discontinued or held-for-sale operations. Pursuant to IFRS 10 and IFRS 11, the contribution made to the income statements and balance sheets of Crédit Agricole Group at 31 December 2013 and 1 January 2013 by Newedge Group, FGA Capital, Forso Denmark, Forso Finland, Forso Norway, Forso Sweden, Menafinance and UBAF was reclassified in Share of net income from equity-accounted entities in the income statement, and in Investments in equity-accounted entities in the balance sheet. Financial statements Income statement at 31 December 2013
(in millions of euros)Notes
31/12/2013Restated
IFRS 10 Impact
IFRS 11 Impact
IFRS 5 Impact
31/12/2013Stated
Interest and similar income 38,974 111 (341) (750) 39,954Interest and similar expenses (18,002) (113) 143 422 (18,454)
Fee and commission income 11,264 - (63) (90) 11,417Fee and commission expenses (2,514) (4) 5 9 (2,524)
Net gains (losses) on financial instruments at fairvalue through profit or loss
3,402 7 - (4) 3,399
Net gains (losses) on available-for-sale financialassets
2,290 - - (5) 2,295
Income on other activities 28,951 - (364) (14) 29,329Expenses on other activities (33,952) - 279 7 (34,238)
Revenues 30,413 1 (341) (425) 31,178
Operating expenses (18,155) (1) 141 340 (18,635)
Depreciation, amortisation and impairment ofproperty, plant & equipment and intangible assets
(1,040) - 4 15 (1,059)
Gross operating income 11,218 - (196) (70) 11,484
Cost of risk (3,922) - 68 16 (4,006)
Operating income 7,296 - (128) (54) 7,478
Share of net income of equity-accounted entities 193 - 106 - 87Net gains (losses) on other assets 93 - (19) - 112Change in value of goodwill (22) - - - (22)
- - - - -Pre-tax income 7,560 - (41) (54) 7,655
Income tax charge (2,159) - 42 8 (2,209)Net income from discounted or held-for-saleoperations
99 - - 45 54
Net income 5,500 - 1 (1) 5,500
Non-controlling interests 364 - - - 364
Net income group share 5,136 - 1 (1) 5,136

Interim condensed consolidated financial statements of Crédit Agricole Group - 30 June 2014
89
Income statement at 30 June 2013
(in millions of euros)30/06/2013Restated
IFRS 10 Impact
IFRS 11 Impact
IFRS 5 Impact
30/06/2013Stated
Interest and similar income 19,715 - (175) (492) 20,382Interest and similar expenses (9,543) - 74 276 (9,893)
Fee and commission income 5,745 - (35) (403) 6,183Fee and commission expenses (1,326) - 10 233 (1,569)
Net gains (losses) on financial instruments at fairvalue through profit or loss
881 - - (32) 913
Net gains (losses) on available-for-sale financialassets
1,197 - - (2) 1,199
Income on other activities 14,670 - (180) (6) 14,856Expenses on other activities (16,131) - 135 6 (16,272)
Revenues 15,208 - (171) (420) 15,799
Operating expenses (8,966) - 70 347 (9,383)
Depreciation, amortisation and impairment ofproperty, plant & equipment and intangible assets
(503) - 2 17 (522)
Gross operating income 5,739 - (99) (56) 5,894- - - - -
Cost of risk (2,111) - 27 21 (2,159)- - - - -
Operating income 3,628 - (72) (35) 3,735
Share of net income of equity-accounted entities 86 - 52 - 34Net gains (losses) on other assets 15 - - (8) 23Change in value of goodwill (22) - - - (22)
Pre-tax income 3,707 - (20) (43) 3,770
Income tax charge (1,166) - 20 12 (1,198)Net income from discounted or held-for-saleoperations
33 - - 31 2
Net income 2,574 - - - 2,574
Non-controlling interests 164 - - - 164
Net income group share 2,410 - - - 2,410

Interim condensed consolidated financial statements of Crédit Agricole Group - 30 June 2014
90
Net income and other comprehensive income at 31 Dec ember 2013
(in millions of euros)31/12/2013Restated
IFRS 10 Impact
IFRS 11 Impact
31/12/2013Stated
Net income 5,500 - - 5,500Actuarial gains and losses on post-employment benefits 40 - - 40
Gains and losses on non current-assets held for sale 2 - (2) -
Pre-tax other comprehensive income on items that will not be reclassifiedto profit and loss excluding equity-accounted entit ies
42 - (2) 40
Pre-tax other comprehensive income on items that will not be reclassifiedto profit and loss on equity-accounted entities
(40) - 2 (38)
Income tax related to items that will not be reclassified to p rofit and lossexcluding equity-accounted entities
(17) - 1 (16)
Income tax related to items that will not be reclassified to p rofit and losson equity-accounted entities
- - - -
Other comprehensive income on items that will not be reclass ifiedsubsequently to profit and loss net of income tax
(15) - 1 (14)
Gains and losses on translation adjustements (287) - (61) (348)
Gains and losses on available-for-sale financial assets (89) - (4) (93)
Gains and losses on hedging derivative instruments (404) - 81 (323)
Gains and losses on non current-assets held for sale 15 - 2 17Pre-tax other comprehensive income on items that may be recl assified toprofit and loss excluding equity-accounted entities
(765) - 18 (747)
Pre-tax other comprehensive income on items that may be recl assified toprofit and loss on equity-accounted entities, Group Share
(123) - (19) (142)
Income tax related to items that may be reclassified to profi t and lossexcluding equity-accounted entities
241 - 1 242
Income tax related to items that may be reclassified to profi t and loss onequity-accounted entities
(4) - 1 (3)
Other comprehensive income on items that may be reclassifie dsubsequently to profit and loss net of income tax
(651) - 1 (650)
- - - -
Other comprehensive income net of income tax (666) - 2 (664)
- - - -
Net income and other comprehensive income 4,834 - 2 4,836
of which Group share 4,563 - 2 4,565
of which non-controlling interests 271 - - 271

Interim condensed consolidated financial statements of Crédit Agricole Group - 30 June 2014
91
Net income and other comprehensive income at 30 Jun e 2013
(in millions of euros)30/06/2013Restated
IFRS 10 Impact
IFRS 11 Impact
Other impacts (1)
30/06/2013Stated
Net income 2,574 - - - 2,574Actuarial gains and losses on post-employment benefits (5) - - - (5)
Gains and losses on non current-assets held for sale - - - - -
Pre-tax other comprehensive income on items that will not be reclassifiedto profit and loss excluding equity-accounted entit ies
(5) - - - (5)
Pre-tax other comprehensive income on items that will not be reclassifiedto profit and loss on equity-accounted entities
(39) - (1) - (38)
Income tax related to items that will not be reclassified to p rofit and lossexcluding equity-accounted entities
2 - 2 - -
Income tax related to items that will not be reclassified to p rofit and losson equity-accounted entities
1 - (1) - 2
Other comprehensive income on items that will not be reclass ifiedsubsequently to profit and loss net of income tax
(41) - (2) - (39)
Gains and losses on translation adjustements (108) - 20 - (128)
Gains and losses on available-for-sale financial assets (681) - 6 92 (595)
Gains and losses on hedging derivative instruments (248) - (2) - (246)
Gains and losses on non current-assets held for sale (16) - (16) - -
Pre-tax other comprehensive income on items that may be recl assified toprofit and loss excluding equity-accounted entities
(1,053) - 8 92 (969)
Pre-tax other comprehensive income on items that may be recl assified toprofit and loss on equity-accounted entities, Group Share
15 - (7) - 22
Income tax related to items that may be reclassified to profi t and lossexcluding equity-accounted entities
371 - 1 (32) 338
Income tax related to items that may be reclassified to profi t and loss onequity-accounted entities
(11) - (2) - (9)
Other comprehensive income on items that may be reclassifie dsubsequently to profit and loss net of income tax
(678) - - 60 (618)
- - - - -
Other comprehensive income net of income tax (719) - (2) 60 (657)
- - - - -
Net income and other comprehensive income 1,855 - (2) 60 1,917of which Group share 1,705 - (1) 60 1,766
of which non-controlling interests 150 - (1) - 151 (1) The 30 June 2013 correction of the fair value of Treasury bills and Unsubordinated fixed-interest securities had an impact on the section “Gains and losses on available-for-sale financial assets”, amounting to +€92 million, and on the section “Taxes on gains and losses on available-for-sale financial assets”, in the amount of -€32 million.

Interim condensed consolidated financial statements of Crédit Agricole Group - 30 June 2014
92
Balance sheet – Assets at 31 December 2013
(in millions of euros)31/12/2013Restated
IFRS 10 Impact
IFRS 11 Impact
31/12/2013Stated
Cash, central banks 71,571 - (33) 71,604
Financial assets at fair value through profit or loss 360,476 2,814 32 357,630
Hedging derivative instruments 30,726 - (14) 30,740Available-for-sale financial assets 284,444 - 390 284,054Loans and receivables due from credit institutions 93,924 2 249 93,673Loans and receivables due from customers 711,179 8,263 (5,536) 708,452Revaluation adjustment on interest rate hedgedportfolios
13,006 - (24) 13,030
Held-to-maturity financial assets 25,447 - - 25,447Current and deferred tax assets 6,590 - (87) 6,677Accruals, prepayments and sundry assets 58,832 5 (134) 58,961Non-current assets held for sale 1,296 - (24,189) 25,485Deferred participation benefits - - - -Investments in equity-accounted entities 4,546 - 1,487 3,059Investment property 4,017 - - 4,017Property, plant and equipment 6,676 - (567) 7,243Intangible assets 1,716 - (33) 1,749Goodwill 14,095 - (410) 14,505
Total assets 1,688,541 11,084 (28,869) 1,706,326 Balance sheet – Assets on 1 January 2013
(in millions of euros)01/01/2013Restated
IFRS 10 Impact
IFRS 11 Impact
01/01/2013Stated
Cash, central banks 45,887 - (246) 46,133
Financial assets at fair value through profit or loss 395,664 2,190 (3,094) 396,568
Hedging derivative instruments 44,828 - (19) 44,847
Available-for-sale financial assets 278,386 50 659 277,677
Loans and receivables due from credit institutions 107,351 2 (9,906) 117,255
Loans and receivables due from customers 730,192 8,025 (12,736) 734,903Revaluation adjustment on interest rate hedgedportfolios
18,118 - (56) 18,174
Held-to-maturity financial assets 22,991 - - 22,991
Current and deferred tax assets 6,929 - (116) 7,045
Accruals, prepayments and sundry assets 63,688 5 (1,781) 65,464
Non-current assets held for sale 21,507 - - 21,507
Deferred participation benefits - - - -
Investments in equity-accounted entities 5,120 - 1,812 3,308
Investment property 3,356 - (138) 3,494
Property, plant and equipment 6,746 - (560) 7,306
Intangible assets 1,792 - (53) 1,845
Goodwill 14,293 - (410) 14,703
Total assets 1,766,848 10,272 (26,644) 1,783,220

Interim condensed consolidated financial statements of Crédit Agricole Group - 30 June 2014
93
Balance sheet - Liabilities at 31 December 2013
(in millions of euros)31/12/2013Restated
IFRS 10 Impact
IFRS 11 Impact
31/12/2013Stated
Central banks 3,021 - - 3,021Financial liabilities at fair value through profit or loss 295,918 2,814 45 293,059Hedging derivative instruments 34,762 - (36) 34,798Due to credit institutions 100,036 - (1,563) 101,599Due to customers 640,675 (7,328) (29) 648,032Debt securities 176,475 15,588 (2,721) 163,608Revaluation adjustment on interest rate hedgedportfolios
8,792 - - 8,792
Current and deferred tax liabilities 2,239 - (60) 2,299Accruals, deferred income and sundry liabilities 54,521 10 (215) 54,726Liabilities associated with non-current assets held-for-sale
878 - (24,189) 25,067
Insurance company technical reserves 256,542 - - 256,542Provisions 6,383 - (100) 6,483Subordinated debt 26,633 - (1) 26,634
Total liabilities 1,606,875 11,084 (28,869) 1,624,660- - - -
Equity 81,666 - - 81,666Equity, Group share 76,283 - - 76,283 Share capital and reserves 25,060 - - 25,060 Consolidated reserves 43,457 - - 43,457
2,670 - - 2,670
(40) - - (40)
Net income/ (loss) for the year 5,136 - - 5,136
Non-controlling interests 5,383 - - 5,383
Total equity and liabilities 1,688,541 11,084 (28,869) 1,706,326
Other comprehensive income
Other comprehensive income on non-current assets held-for-sale and discontinued operations

Interim condensed consolidated financial statements of Crédit Agricole Group - 30 June 2014
94
Balance sheet - Liabilities on 1 January 2013
(in millions of euros)01/01/2013Restated
IFRS 10 Impact
IFRS 11 Impact
01/01/2013Stated
Central banks 1,278 - - 1,278Financial liabilities at fair value through profit or loss 346,800 2,190 (1,123) 345,733Hedging derivative instruments 47,476 - (82) 47,558Due to credit institutions 102,986 20 (5,706) 108,672Due to customers 623,370 (6,136) (9,505) 639,011Debt securities 185,379 14,108 (1,780) 173,051Revaluation adjustment on interest rate hedgedportfolios
15,382 - - 15,382
Current and deferred tax liabilities 3,620 - (75) 3,695Accruals, deferred income and sundry liabilities 62,045 90 (8,062) 70,017Liabilities associated with non-current assets held-for-sale
22,015 - - 22,015
Insurance company technical reserves 245,526 - - 245,526Provisions 6,399 - (115) 6,514Subordinated debt 27,881 - (196) 28,077Total liabilities 1,690,157 10,272 (26,644) 1,706,529
Equity 76,691 - - 76,691Equity, Group share 71,399 - - 71,399 Share capital and reserves 24,467 - - 24,467 Consolidated reserves 47,457 - - 47,457
3,254 - - 3,254
(53) - - (53)
Net income/ (loss) for the year (3,726) - - (3,726)
Non-controlling interests 5,292 - - 5,292
Total equity and liabilities 1,766,848 10,272 (26,644) 1,783,220
Other comprehensive income
Other comprehensive income on non-current assets held-for-sale and discontinued operations

Interim condensed consolidated financial statements of Crédit Agricole Group - 30 June 2014
95
Cash flow statement at 31 December 2013
(in millions of euros)31/12/2013Restated
IFRS 10 Impact
IFRS 11 Impact
Other impacts
31/12/2013Stated
Pre-tax income 7,560 - (42) (53) 7,655Net depreciation and impairment of property, plant & equipment andintangible assets
1,055 - (4) (15) 1,075
Impairment of goodwill and other fixed assets 22 - - - 22
Net depreciation charges to provisions 15,422 - (210) (16) 15,648
Share of net income (loss) of equity-accounted entities (193) - (106) - (87)
Net income (loss) from investment activities (139) - 19 - (158)
Net income (loss) from financing activities 4,059 113 (47) (15) 4,007
Other movements (3,593) - (49) (12) (3,531)Total non-cash and other adjustment items included in pre-taxincome
16,634 113 (397) (58) 16,976
Change in interbank items (9,137) - 725 700 (10,562)
Change in customer items 43,013 (1,450) 323 (792) 44,931
Change in financial assets and liabilities (38,293) 1,530 281 419 (40,524)
Change in non-financial assets and liabilities (3,941) (78) (34) 634 (4,464)
Dividends received from equity-accounted entities 47 - - - 47
Tax paid (2,812) - 39 14 (2,864)
Net change in assets and liabilities used in operating activities (11,126) 2 1,333 975 (13,436)
Cash provided (used) by discontinued operations (1,044) - (49) (864) (131)TOTAL NET CASH FLOWS FROM (USED BY) OPERATING ACTIVITIES (A)
12,024 115 845 - 11,064
Change in equity investments (82) - 1 (1) (81)
Change in property, plant & equipment and intangible assets (999) - (20) 21 (1,000)
Cash provided (used) by discontinued operations (74) - 4 (20) (59)TOTAL NET CASH FLOWS FROM (USED BY) INVESTMENTACTIVITIES (B)
(1,154) - (14) - (1,140)
Cash received from (paid to) shareholders 346 - 28 149 170
Other cash provided (used) by financing activities (3,587) (113) (711) 32 (2,795)
Cash provided (used) by discontinued operations (206) - 9 (181) (34)TOTAL NET CASH FLOWS FROM (USED BY) FINANCINGACTIVITIES (C)
(3,447) (113) (675) - (2,659)
Impact of exchange rate changes on cash and cash equivalent(D)
(2,951) - (2) - (2,949)
Net increase/(decrease) in cash & cash equivalent (A + B+ C + D) 4,473 2 155 - 4,316
Cash and cash equivalents at beginning of period 57,996 - (2,499) - 60,495
Net cash accounts and accounts with central banks * 45,017 - (246) - 45,263
Net demand loans and deposits with credit institutions ** 12,979 - (2,253) - 15,232
Cash and cash equivalents at end of period 62,468 2 (2,345) - 64,811
Net cash accounts and accounts with central banks * 68,639 - (37) 0 68676
Net demand loans and deposits with credit institutions ** (6,171) 2 (2,308) 0 (3,865)
Net change in cash and cash equivalents 4,472 2 154 - 4,316

Interim condensed consolidated financial statements of Crédit Agricole Group - 30 June 2014
96
Cash flow statement at 30 June 2013
(in millions of euros)30/06/2013Restated
IFRS 10 Impact
IFRS 11 Impact
Other impacts
30/06/2013Stated
Pre-tax income 3,707 - (20) (43) 3,770Net depreciation and impairment of property, plant & equipment andintangible assets
513 - (10) (9) 532
Impairment of goodwill and other fixed assets 22 - - - 22
Net depreciation charges to provisions 8,087 - (96) (27) 8,210
Share of net income (loss) of equity-accounted entities (86) - (52) - (34)
Net income (loss) from investment activities 2 - - - 2
Net income (loss) from financing activities 2,145 57 (29) (7) 2,125
Other movements (1,575) - (15) 21 (1,581)Total non-cash and other adjustment items included in pre-taxincome
9,108 57 (202) (23) 9,276
Change in interbank items 5,482 - (86) 10,574 (5,006)
Change in customer items 23,779 (725) (1,290) (1,089) 26,882
Change in financial assets and liabilities (32,160) 765 819 116 (33,861)
Change in non-financial assets and liabilities (2,879) (39) 1,131 233 (4,203)
Dividends received from equity-accounted entities 23 - - - 23
Tax paid (1,651) - 3 8 (1,661)
Net change in assets and liabilities used in operating activities (7,406) 1 577 9,842 (17,826)
Cash provided (used) by discontinued operations 415 - - 591 (176)TOTAL NET CASH FLOWS FROM (USED BY) OPERATING ACTIVITIES (A)
5,825 58 355 10,368 (4,956)
Change in equity investments (35) - - - (35)
Change in property, plant & equipment and intangible assets (486) - 5 14 (505)
Cash provided (used) by discontinued operations (360) - - (13) (347)TOTAL NET CASH FLOWS FROM (USED BY) INVESTMENTACTIVITIES (B)
(881) - 5 1 (887)
Cash received from (paid to) shareholders (553) - 28 159 (740)
Other cash provided (used) by financing activities (2,005) (57) (157) 25 (1,817)
Cash provided (used) by discontinued operations (137) - - (185) 48TOTAL NET CASH FLOWS FROM (USED BY) FINANCINGACTIVITIES (C)
(2,695) (57) (129) (1) (2,509)
Impact of exchange rate changes on cash and cash equivalent(D)
(751) - 35 - (786)
Net increase/(decrease) in cash & cash equivalent (A + B+ C + D) 1,498 1 267 10,368 (9,138)
Cash and cash equivalents at beginning of period 57,996 - (2,499) (10,367) 70,862
Net cash accounts and accounts with central banks * 45,017 - (246) - 45,263
Net demand loans and deposits with credit institutions ** 12,979 - (2,253) (10,367) 25,599
Cash and cash equivalents at end of period 59,493 1 (2,232) - 61,724
Net cash accounts and accounts with central banks * 57,325 - (28) 0 57,353
Net demand loans and deposits with credit institutions ** 2,168 1 (2,204) 0 4,371
Net change in cash and cash equivalents 1,497 1 267 10,367 (9,138)

Interim condensed consolidated financial statements of Crédit Agricole Group - 30 June 2014
97
10. Events after the reporting period On 3 August 2014 the Bank of Portugal announced that resolution measures would be applied to Banco Espirito Santo S.A. The information available to date on these measures is set out in a press release issued by the Bank of Portugal. As indicated on page 22, the holding of Crédit Agricole S.A. Group in Banco Espirito Santo S.A. was written down in full at 30 June 2014. Crédit Agricole S.A. Group will follow closely the application of the resolution measures announced by the Bank of Portugal.

Interim condensed consolidated financial statements of Crédit Agricole Group - 30 June 2014
98
11. Scope of consolidation at 30 June 2014
June 30th 2014
Dec 31st 2013
June 30th 2014
Dec 31st 2013
French retail banking
Banking and financial institutions2,483 Caisses locales France Parent company Parent company 100,0 100,0 100,0 100,0
39 Caisses régionales France Parent company Parent company 100,0 100,0 100,0 100,0
Banque Chalus France Subsidiary Full 100,0 100,0 100,0 100,0
Banque Thémis France Subsidiary Full 100,0 100,0 100,0 100,0
Bforbank S.A. France Subsidiary Full 100,0 100,0 100,0 100,0
Cofam France Subsidiary Full 100,0 100,0 100,0 100,0
CRCAM SUD MED. SUC Espagne France Branche Full 100,0 100,0 100,0 100,0
Interf imo France Subsidiary Full 99,0 99,0 99,0 99,0
LCL France Subsidiary Full 100,0 100,0 100,0 100,0
Mercagentes Espagne Subsidiary Full 82,4 82,4 82,4 82,4
Sircam France Subsidiary Full 100,0 100,0 100,0 100,0
Lease financing companiesLocam France Subsidiary Full 100,0 100,0 100,0 100,0
Investment companiesBercy Participations France Subsidiary Full 100,0 100,0 100,0 100,0
Ca Centre France Développement France Subsidiary Full 100,0 100,0 100,0 100,0
Cacf Immobilier France Subsidiary Full 100,0 100,0 100,0 100,0
Cads Développement France Subsidiary Full 100,0 100,0 100,0 100,0
Calixte Investissement France Subsidiary Full 100,0 100,0 100,0 100,0
CAM ENERGIE SAS France Subsidiary Full 100,0 100,0 100,0 100,0
Crédit Agricole Centre Est Immobilier France Subsidiary Full 100,0 100,0 100,0 100,0
Credit Agricole F.C. Investissement France Subsidiary Full 100,0 100,0 100,0 100,0
L'Immobilière D'A Côté France Subsidiary Full 100,0 100,0 100,0 100,0
Nord Capital Investissement France Subsidiary Full 98,4 98,4 98,4 98,4
Nord Est Champagne Agro Partenaires France Subsidiary Full 100,0 100,0 100,0 100,0
Nord Est Expansion France Subsidiary Full 100,0 100,0 100,0 100,0
Prestimmo France Subsidiary Full 100,0 100,0 100,0 100,0
Sepi France Subsidiary Full 100,0 100,0 100,0 100,0
Sequana France Subsidiary Full 100,0 100,0 100,0 100,0
Socadif France Subsidiary Full 100,0 100,0 100,0 100,0
InsuranceCamca Assurance Luxembourg Subsidiary Full 100,0 100,0 100,0 100,0
Camca Lux Finance Management Company Luxembourg Subsidiary Full 100,0 100,0 100,0 100,0
Camca Réassurance Luxembourg Subsidiary Full 100,0 100,0 100,0 100,0
Camca Vie Luxembourg Subsidiary Full 100,0 100,0 100,0 100,0
Groupe CAMCA France Subsidiary Full 100,0 100,0 100,0 100,0
Sci 32 Liberté Luxembourg Subsidiary Full 100,0 100,0 100,0 100,0
Tourism - property developmentAquitaine Immobilier Investissement France Subsidiary Full 100,0 100,0 100,0 100,0
Franche Comté Développement Foncier France Subsidiary Full 100,0 100,0 100,0 100,0
Franche Comté Développement Immobilier France Subsidiary Full 100,0 100,0 100,0 100,0
Nord Est Optimmo S.A.S. France Subsidiary Full 100,0 100,0 100,0 100,0
Normandie Seine Foncière France Subsidiary Full 100,0 100,0 100,0 100,0
S.A. Foncière de l'Erable France Subsidiary Full 100,0 100,0 100,0 100,0
S.A.S. Arcadim Fusion France Subsidiary Full 100,0 100,0 100,0 100,0
SCI Crystal Europe France Subsidiary Full 100,0 100,0 100,0 100,0
SCI Quartz Europe France Subsidiary Full 100,0 100,0 100,0 100,0
SCI 106 BD GL DE GAULLE E2 France Subsidiary Full 100,0 100,0
OtherAdret Gestion France Subsidiary Full 100,0 100,0 100,0 100,0
Alsace Elite France Subsidiary Full 94,9 94,9 94,9 94,9
Anjou Maine Gestion France Subsidiary Full 100,0 100,0 100,0 100,0
Aquitaux Rendement France Subsidiary Full 100,0 100,0 100,0 100,0
Armor Fonds Dédié E2 France Subsidiary Full 100,0 100,0
C.L. Verw altungs Und Beteiligungsgesellschaft Gmbh Allemagne Subsidiary Full 100,0 100,0 100,0 100,0
Ca Aquitaine Agences Immobilières France Subsidiary Full 100,0 100,0 100,0 100,0
Ca Aquitaine Immobilier France Subsidiary Full 100,0 100,0 100,0 100,0
Ca Participations France Subsidiary Full 100,0 100,0 100,0 100,0
Caapimmo 4 France Subsidiary Full 99,0 99,0 99,0 99,0
Caapimmo 6 France Subsidiary Full 100,0 100,0 100,0 100,0
Cap Actions 2 France Subsidiary Full 100,0 100,0 100,0 100,0
Cap Obligataire France Subsidiary Full 100,0 100,0 100,0 100,0
Cap Régulier 1 France Subsidiary Full 100,0 100,0 100,0 100,0
Capi Centre-Est France Subsidiary Full 100,0 100,0 100,0 100,0
Caryatides Finance S1 France Subsidiary Full 0,0 100,0 0,0 100,0
Centre France Location Immobilière France Subsidiary Full 100,0 100,0 100,0 100,0
Crédit Lyonnais Développement Économique (CLDE) France Subsidiary Full 100,0 100,0 100,0 100,0
CR Provence Cote d'Azur LCR E2 France Subsidiary Full 100,0 100,0
Emeraude Croissance France Subsidiary Full 100,0 100,0 100,0 100,0
Europimmo France Subsidiary Full 100,0 100,0 100,0 100,0
% control % interestCrédit Agricole Group
Scope of consolidation(a)
Principal place of business
Country of incorporation if
differentfrom the
principal place of business
Nature of control (b)
Consolidation method
June 30th 2014

Interim condensed consolidated financial statements of Crédit Agricole Group - 30 June 2014
99
June 30th 2014
Dec 31st 2013
June 30th 2014
Dec 31st 2013
Financière PCA France Subsidiary Full 100,0 100,0 100,0 100,0
Finarmor Gestion France Subsidiary Full 100,0 100,0 100,0 100,0
Fonds Dédié Elstar France Subsidiary Full 100,0 100,0 100,0 100,0
Force Alsace France Subsidiary Full 100,0 100,0 100,0 100,0
Force Charente Maritime Deux Sèvres France Subsidiary Full 100,0 100,0 100,0 100,0
Force Iroise France Subsidiary Full 100,0 100,0 100,0 100,0
Force Languedoc France Subsidiary Full 100,0 100,0 100,0 99,7
Force Lorraine Duo France Subsidiary Full 100,0 100,0 100,0 100,0
Force Profile 20 France Subsidiary Full 100,0 100,0 99,9 99,9
Force Run France Subsidiary Full 100,0 100,0 100,0 100,0
Force Toulouse Diversif ié France Subsidiary Full 100,0 100,0 100,0 100,0
Force 4 France Subsidiary Full 100,0 100,0 100,0 100,0
Green Island S2 France Subsidiary Full 0,0 100,0 0,0 100,0
Immobilière de Picardie France Subsidiary Full 100,0 100,0 100,0 100,0
Inforsud Gestion France Subsidiary Full 88,9 88,9 88,9 88,9
Morbihan Gestion France Subsidiary Full 100,0 100,0 100,0 100,0
Nacarat France Associate Equity 30,8 30,8 30,8 30,8
NMP Gestion France Subsidiary Full 100,0 100,0 100,0 100,0
Nord de France Immobilier France Subsidiary Full 100,0 100,0 100,0 100,0
NS Immobilier Finance France Subsidiary Full 100,0 100,0 100,0 100,0
Ozenne Institutionnel France Subsidiary Full 99,8 99,8 99,8 99,8
PCA Immo France Subsidiary Full 100,0 100,0 100,0 100,0
PG Immo France Subsidiary Full 100,0 100,0 100,0 100,0
PG Invest France Subsidiary Full 100,0 100,0 100,0 100,0
Pyrénées Gascogne Altitude France Subsidiary Full 100,0 100,0 100,0 100,0
Pyrénées Gascogne Gestion France Subsidiary Full 100,0 100,0 100,0 100,0
S.A.S. Immnord France Subsidiary Full 100,0 100,0 100,0 100,0
Sacam Immobilier France Subsidiary Full 100,0 100,0 100,0 100,0
SAS Brie Picardie Expansion France Subsidiary Full 100,0 100,0 100,0 100,0
SCI Euralliance Europe France Subsidiary Full 100,0 100,0 100,0 100,0
SCI Les Fauvins France Subsidiary Full 100,0 100,0 100,0 100,0
Scica HL France Subsidiary Full 100,0 100,0 100,0 100,0
SNC Kalliste Assur France Subsidiary Full 100,0 100,0 100,0 100,0
Sud Rhône Alpes Placement France Subsidiary Full 100,0 100,0 99,9 99,9
Toulouse 31 Court Terme France Subsidiary Full 100,0 100,0 100,0 100,0
Val de France Rendement France Subsidiary Full 100,0 100,0 100,0 100,0
Voix du Nord Investissement France Associate Equity 25,2 25,2 25,2 25,2
International retail banking
Banking and financial institutionsBanca Popolare Friuladria S.P.A. Italie Subsidiary Full 80,2 80,2 68,1 68,1
Bankoa Espagne Subsidiary Full 99,8 99,8 99,8 99,8
BES (Banco Espirito Santo) Portugal Associate Equity 14,6 10,8 14,6 20,1
BNI Madagascar D4 - S2 Madagascar Subsidiary Full 0,0 51,0 0,0 51,0
Cariparma Italie Subsidiary Full 85,0 85,0 85,0 85,0
Carispezia Italie Subsidiary Full 83,0 80,0 70,5 68,0
Credit Agricole Bank Albania S.A. Albanie Subsidiary Full 100,0 100,0 100,0 100,0
Crédit Agricole Bank Polska S.A. Pologne Subsidiary Full 100,0 100,0 100,0 100,0
Crédit Agricole Banka Srbija a.d. Novi Sad Serbie Subsidiary Full 100,0 100,0 100,0 100,0
Crédit Agricole Bulgaria D4 - S2 Bulgarie Subsidiary Full 0,0 100,0 0,0 100,0
Crédit Agricole Egypt S.A.E. Egypte Subsidiary Full 60,5 60,5 60,5 60,5
Crédit Agricole Financement Suisse Subsidiary Full 100,0 100,0 100,0 100,0
Crédit Agricole Polska S.A. Pologne Subsidiary Full 100,0 100,0 100,0 100,0
Credit Agricole Romania Roumanie Subsidiary Full 100,0 99,7 100,0 99,7
Credit Agricole Serivce sp z o.o. Pologne Subsidiary Full 100,0 100,0 100,0 100,0
Crédit du Maroc Maroc Subsidiary Full 78,6 78,6 78,6 78,6
Crelan Insurance SA D4 Belgique Subsidiary Equity 50,0 50,0 50,0 66,7
Crelan SA D4 Belgique Associate Equity 50,0 50,0 50,0 66,7
Europabank D4 Belgique Subsidiary Equity 50,0 50,0 50,0 66,7
Lukas Finanse S.A. Pologne Subsidiary Full 100,0 100,0 100,0 100,0
PJSC Crédit Agricole Ukraine Subsidiary Full 100,0 100,0 100,0 100,0
OtherBelgium CA S.A.S. France Subsidiary Full 100,0 100,0 100,0 100,0
Bespar S1 Portugal Associate Equity 0,0 26,4 0,0 26,4
IUB Holding France Subsidiary Full 100,0 100,0 100,0 100,0
Keytrade D4 Belgique Subsidiary Equity 50,0 50,0 50,0 66,7
Specialised financial services
Banking and financial institutionsAetran Administrative Dientverlening B.V. Pays-Bas Subsidiary Full 100,0 100,0 100,0 100,0
Agos S.p.A. Italie Subsidiary Full 61,0 61,0 61,0 61,0
Alsolia France Associate Equity 20,0 20,0 20,0 20,0
Antera Incasso B.V. Pays-Bas Subsidiary Full 100,0 100,0 100,0 100,0
Assfibo Financieringen B.V. Pays-Bas Subsidiary Full 100,0 100,0 100,0 100,0
BCC Credito Consumo Italie Associate Equity 40,0 40,0 24,4 24,4
% control % interestCrédit Agricole Group
Scope of consolidation(a)
Principal place of business
Country of incorporation if
differentfrom the
principal place of business
Nature of control (b)
Consolidation method
June 30th 2014
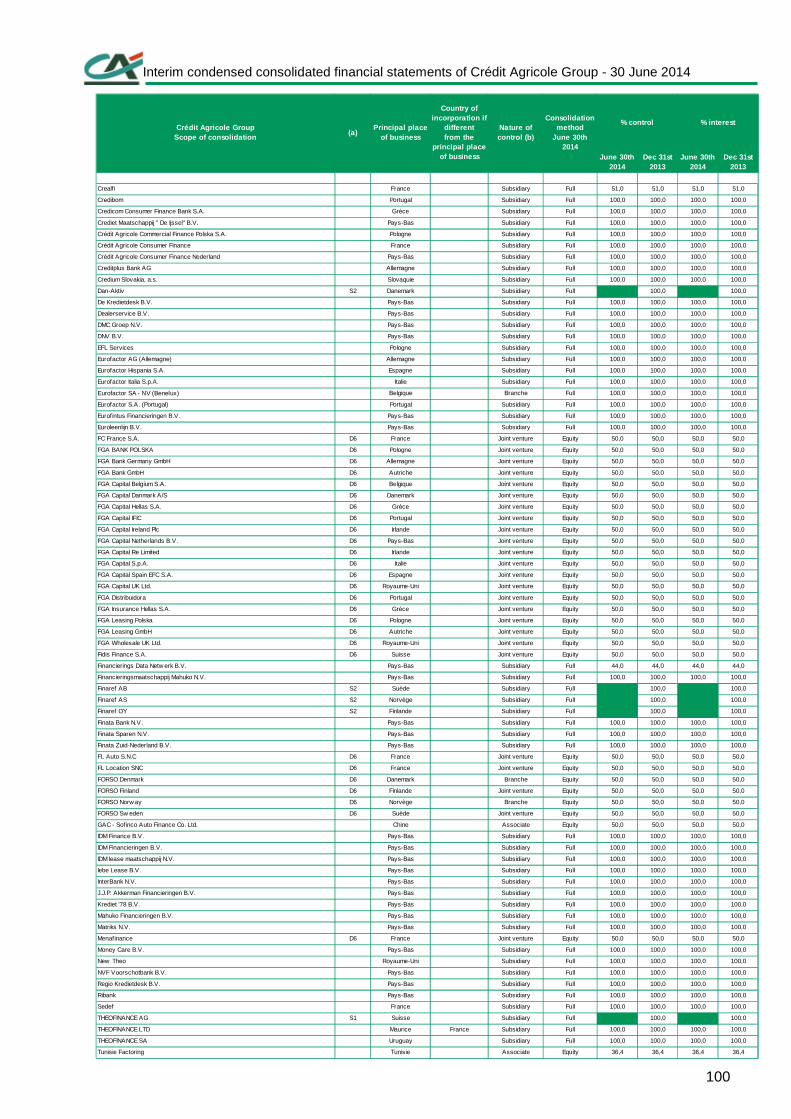
Interim condensed consolidated financial statements of Crédit Agricole Group - 30 June 2014
100
June 30th 2014
Dec 31st 2013
June 30th 2014
Dec 31st 2013
Crealfi France Subsidiary Full 51,0 51,0 51,0 51,0
Credibom Portugal Subsidiary Full 100,0 100,0 100,0 100,0
Credicom Consumer Finance Bank S.A. Grèce Subsidiary Full 100,0 100,0 100,0 100,0
Crediet Maatschappij " De Ijssel" B.V. Pays-Bas Subsidiary Full 100,0 100,0 100,0 100,0
Crédit Agricole Commercial Finance Polska S.A. Pologne Subsidiary Full 100,0 100,0 100,0 100,0
Crédit Agricole Consumer Finance France Subsidiary Full 100,0 100,0 100,0 100,0
Crédit Agricole Consumer Finance Nederland Pays-Bas Subsidiary Full 100,0 100,0 100,0 100,0
Creditplus Bank AG Allemagne Subsidiary Full 100,0 100,0 100,0 100,0
Credium Slovakia, a.s. Slovaquie Subsidiary Full 100,0 100,0 100,0 100,0
Dan-Aktiv S2 Danemark Subsidiary Full 0,0 100,0 0,0 100,0
De Kredietdesk B.V. Pays-Bas Subsidiary Full 100,0 100,0 100,0 100,0
Dealerservice B.V. Pays-Bas Subsidiary Full 100,0 100,0 100,0 100,0
DMC Groep N.V. Pays-Bas Subsidiary Full 100,0 100,0 100,0 100,0
DNV B.V. Pays-Bas Subsidiary Full 100,0 100,0 100,0 100,0
EFL Services Pologne Subsidiary Full 100,0 100,0 100,0 100,0
Eurofactor AG (Allemagne) Allemagne Subsidiary Full 100,0 100,0 100,0 100,0
Eurofactor Hispania S.A. Espagne Subsidiary Full 100,0 100,0 100,0 100,0
Eurofactor Italia S.p.A. Italie Subsidiary Full 100,0 100,0 100,0 100,0
Eurofactor SA - NV (Benelux) Belgique Branche Full 100,0 100,0 100,0 100,0
Eurofactor S.A. (Portugal) Portugal Subsidiary Full 100,0 100,0 100,0 100,0
Eurofintus Financieringen B.V. Pays-Bas Subsidiary Full 100,0 100,0 100,0 100,0
Euroleenlijn B.V. Pays-Bas Subsidiary Full 100,0 100,0 100,0 100,0
FC France S.A. D6 France Joint venture Equity 50,0 50,0 50,0 50,0
FGA BANK POLSKA D6 Pologne Joint venture Equity 50,0 50,0 50,0 50,0
FGA Bank Germany GmbH D6 Allemagne Joint venture Equity 50,0 50,0 50,0 50,0
FGA Bank GmbH D6 Autriche Joint venture Equity 50,0 50,0 50,0 50,0
FGA Capital Belgium S.A. D6 Belgique Joint venture Equity 50,0 50,0 50,0 50,0
FGA Capital Danmark A/S D6 Danemark Joint venture Equity 50,0 50,0 50,0 50,0
FGA Capital Hellas S.A. D6 Grèce Joint venture Equity 50,0 50,0 50,0 50,0
FGA Capital IFIC D6 Portugal Joint venture Equity 50,0 50,0 50,0 50,0
FGA Capital Ireland Plc D6 Irlande Joint venture Equity 50,0 50,0 50,0 50,0
FGA Capital Netherlands B.V. D6 Pays-Bas Joint venture Equity 50,0 50,0 50,0 50,0
FGA Capital Re Limited D6 Irlande Joint venture Equity 50,0 50,0 50,0 50,0
FGA Capital S.p.A. D6 Italie Joint venture Equity 50,0 50,0 50,0 50,0
FGA Capital Spain EFC S.A. D6 Espagne Joint venture Equity 50,0 50,0 50,0 50,0
FGA Capital UK Ltd. D6 Royaume-Uni Joint venture Equity 50,0 50,0 50,0 50,0
FGA Distribuidora D6 Portugal Joint venture Equity 50,0 50,0 50,0 50,0
FGA Insurance Hellas S.A. D6 Grèce Joint venture Equity 50,0 50,0 50,0 50,0
FGA Leasing Polska D6 Pologne Joint venture Equity 50,0 50,0 50,0 50,0
FGA Leasing GmbH D6 Autriche Joint venture Equity 50,0 50,0 50,0 50,0
FGA Wholesale UK Ltd. D6 Royaume-Uni Joint venture Equity 50,0 50,0 50,0 50,0
Fidis Finance S.A. D6 Suisse Joint venture Equity 50,0 50,0 50,0 50,0
Financierings Data Netw erk B.V. Pays-Bas Subsidiary Full 44,0 44,0 44,0 44,0
Financieringsmaatschappij Mahuko N.V. Pays-Bas Subsidiary Full 100,0 100,0 100,0 100,0
Finaref AB S2 Suède Subsidiary Full 0,0 100,0 0,0 100,0
Finaref AS S2 Norvège Subsidiary Full 0,0 100,0 0,0 100,0
Finaref OY S2 Finlande Subsidiary Full 0,0 100,0 0,0 100,0
Finata Bank N.V. Pays-Bas Subsidiary Full 100,0 100,0 100,0 100,0
Finata Sparen N.V. Pays-Bas Subsidiary Full 100,0 100,0 100,0 100,0
Finata Zuid-Nederland B.V. Pays-Bas Subsidiary Full 100,0 100,0 100,0 100,0
FL Auto S.N.C D6 France Joint venture Equity 50,0 50,0 50,0 50,0
FL Location SNC D6 France Joint venture Equity 50,0 50,0 50,0 50,0
FORSO Denmark D6 Danemark Branche Equity 50,0 50,0 50,0 50,0
FORSO Finland D6 Finlande Joint venture Equity 50,0 50,0 50,0 50,0
FORSO Norw ay D6 Norvège Branche Equity 50,0 50,0 50,0 50,0
FORSO Sw eden D6 Suède Joint venture Equity 50,0 50,0 50,0 50,0
GAC - Sof inco Auto Finance Co. Ltd. Chine Associate Equity 50,0 50,0 50,0 50,0
IDM Finance B.V. Pays-Bas Subsidiary Full 100,0 100,0 100,0 100,0
IDM Financieringen B.V. Pays-Bas Subsidiary Full 100,0 100,0 100,0 100,0
IDM lease maatschappij N.V. Pays-Bas Subsidiary Full 100,0 100,0 100,0 100,0
Iebe Lease B.V. Pays-Bas Subsidiary Full 100,0 100,0 100,0 100,0
InterBank N.V. Pays-Bas Subsidiary Full 100,0 100,0 100,0 100,0
J.J.P. Akkerman Financieringen B.V. Pays-Bas Subsidiary Full 100,0 100,0 100,0 100,0
Krediet '78 B.V. Pays-Bas Subsidiary Full 100,0 100,0 100,0 100,0
Mahuko Financieringen B.V. Pays-Bas Subsidiary Full 100,0 100,0 100,0 100,0
Matriks N.V. Pays-Bas Subsidiary Full 100,0 100,0 100,0 100,0
Menafinance D6 France Joint venture Equity 50,0 50,0 50,0 50,0
Money Care B.V. Pays-Bas Subsidiary Full 100,0 100,0 100,0 100,0
New Theo Royaume-Uni Subsidiary Full 100,0 100,0 100,0 100,0
NVF Voorschotbank B.V. Pays-Bas Subsidiary Full 100,0 100,0 100,0 100,0
Regio Kredietdesk B.V. Pays-Bas Subsidiary Full 100,0 100,0 100,0 100,0
Ribank Pays-Bas Subsidiary Full 100,0 100,0 100,0 100,0
Sedef France Subsidiary Full 100,0 100,0 100,0 100,0
THEOFINANCE AG S1 Suisse Subsidiary Full 100,0 100,0
THEOFINANCE LTD Maurice France Subsidiary Full 100,0 100,0 100,0 100,0
THEOFINANCE SA Uruguay Subsidiary Full 100,0 100,0 100,0 100,0
Tunisie Factoring Tunisie Associate Equity 36,4 36,4 36,4 36,4
% control % interestCrédit Agricole Group
Scope of consolidation(a)
Principal place of business
Country of incorporation if
differentfrom the
principal place of business
Nature of control (b)
Consolidation method
June 30th 2014
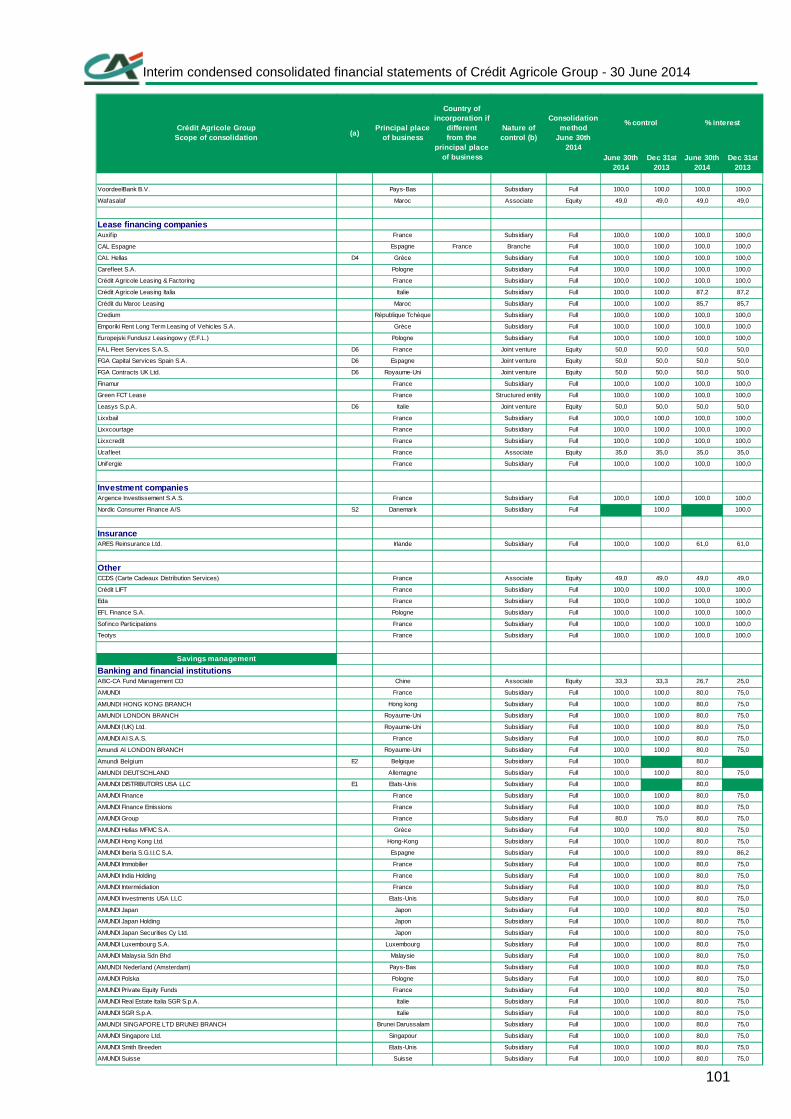
Interim condensed consolidated financial statements of Crédit Agricole Group - 30 June 2014
101
June 30th 2014
Dec 31st 2013
June 30th 2014
Dec 31st 2013
VoordeelBank B.V. Pays-Bas Subsidiary Full 100,0 100,0 100,0 100,0
Wafasalaf Maroc Associate Equity 49,0 49,0 49,0 49,0
Lease financing companiesAuxifip France Subsidiary Full 100,0 100,0 100,0 100,0
CAL Espagne Espagne France Branche Full 100,0 100,0 100,0 100,0
CAL Hellas D4 Grèce Subsidiary Full 100,0 100,0 100,0 100,0
Carefleet S.A. Pologne Subsidiary Full 100,0 100,0 100,0 100,0
Crédit Agricole Leasing & Factoring France Subsidiary Full 100,0 100,0 100,0 100,0
Crédit Agricole Leasing Italia Italie Subsidiary Full 100,0 100,0 87,2 87,2
Crédit du Maroc Leasing Maroc Subsidiary Full 100,0 100,0 85,7 85,7
Credium République Tchèque Subsidiary Full 100,0 100,0 100,0 100,0
Emporiki Rent Long Term Leasing of Vehicles S.A. Grèce Subsidiary Full 100,0 100,0 100,0 100,0
Europejski Fundusz Leasingow y (E.F.L.) Pologne Subsidiary Full 100,0 100,0 100,0 100,0
FAL Fleet Services S.A.S. D6 France Joint venture Equity 50,0 50,0 50,0 50,0
FGA Capital Services Spain S.A. D6 Espagne Joint venture Equity 50,0 50,0 50,0 50,0
FGA Contracts UK Ltd. D6 Royaume-Uni Joint venture Equity 50,0 50,0 50,0 50,0
Finamur France Subsidiary Full 100,0 100,0 100,0 100,0
Green FCT Lease France Structured entity Full 100,0 100,0 100,0 100,0
Leasys S.p.A. D6 Italie Joint venture Equity 50,0 50,0 50,0 50,0
Lixxbail France Subsidiary Full 100,0 100,0 100,0 100,0
Lixxcourtage France Subsidiary Full 100,0 100,0 100,0 100,0
Lixxcredit France Subsidiary Full 100,0 100,0 100,0 100,0
Ucafleet France Associate Equity 35,0 35,0 35,0 35,0
Unifergie France Subsidiary Full 100,0 100,0 100,0 100,0
Investment companiesArgence Investissement S.A.S. France Subsidiary Full 100,0 100,0 100,0 100,0
Nordic Consumer Finance A/S S2 Danemark Subsidiary Full 0,0 100,0 0,0 100,0
InsuranceARES Reinsurance Ltd. Irlande Subsidiary Full 100,0 100,0 61,0 61,0
OtherCCDS (Carte Cadeaux Distribution Services) France Associate Equity 49,0 49,0 49,0 49,0
Crédit LIFT France Subsidiary Full 100,0 100,0 100,0 100,0
Eda France Subsidiary Full 100,0 100,0 100,0 100,0
EFL Finance S.A. Pologne Subsidiary Full 100,0 100,0 100,0 100,0
Sof inco Participations France Subsidiary Full 100,0 100,0 100,0 100,0
Teotys France Subsidiary Full 100,0 100,0 100,0 100,0
Savings management
Banking and financial institutionsABC-CA Fund Management CO Chine Associate Equity 33,3 33,3 26,7 25,0
AMUNDI France Subsidiary Full 100,0 100,0 80,0 75,0
AMUNDI HONG KONG BRANCH Hong kong Subsidiary Full 100,0 100,0 80,0 75,0
AMUNDI LONDON BRANCH Royaume-Uni Subsidiary Full 100,0 100,0 80,0 75,0
AMUNDI (UK) Ltd. Royaume-Uni Subsidiary Full 100,0 100,0 80,0 75,0
AMUNDI AI S.A.S. France Subsidiary Full 100,0 100,0 80,0 75,0
Amundi Al LONDON BRANCH Royaume-Uni Subsidiary Full 100,0 100,0 80,0 75,0
Amundi Belgium E2 Belgique Subsidiary Full 100,0 80,0
AMUNDI DEUTSCHLAND Allemagne Subsidiary Full 100,0 100,0 80,0 75,0
AMUNDI DISTRIBUTORS USA LLC E1 Etats-Unis Subsidiary Full 100,0 80,0
AMUNDI Finance France Subsidiary Full 100,0 100,0 80,0 75,0
AMUNDI Finance Emissions France Subsidiary Full 100,0 100,0 80,0 75,0
AMUNDI Group France Subsidiary Full 80,0 75,0 80,0 75,0
AMUNDI Hellas MFMC S.A. Grèce Subsidiary Full 100,0 100,0 80,0 75,0
AMUNDI Hong Kong Ltd. Hong-Kong Subsidiary Full 100,0 100,0 80,0 75,0
AMUNDI Iberia S.G.I.I.C S.A. Espagne Subsidiary Full 100,0 100,0 89,0 86,2
AMUNDI Immobilier France Subsidiary Full 100,0 100,0 80,0 75,0
AMUNDI India Holding France Subsidiary Full 100,0 100,0 80,0 75,0
AMUNDI Intermédiation France Subsidiary Full 100,0 100,0 80,0 75,0
AMUNDI Investments USA LLC Etats-Unis Subsidiary Full 100,0 100,0 80,0 75,0
AMUNDI Japan Japon Subsidiary Full 100,0 100,0 80,0 75,0
AMUNDI Japan Holding Japon Subsidiary Full 100,0 100,0 80,0 75,0
AMUNDI Japan Securities Cy Ltd. Japon Subsidiary Full 100,0 100,0 80,0 75,0
AMUNDI Luxembourg S.A. Luxembourg Subsidiary Full 100,0 100,0 80,0 75,0
AMUNDI Malaysia Sdn Bhd Malaysie Subsidiary Full 100,0 100,0 80,0 75,0
AMUNDI Nederland (Amsterdam) Pays-Bas Subsidiary Full 100,0 100,0 80,0 75,0
AMUNDI Polska Pologne Subsidiary Full 100,0 100,0 80,0 75,0
AMUNDI Private Equity Funds France Subsidiary Full 100,0 100,0 80,0 75,0
AMUNDI Real Estate Italia SGR S.p.A. Italie Subsidiary Full 100,0 100,0 80,0 75,0
AMUNDI SGR S.p.A. Italie Subsidiary Full 100,0 100,0 80,0 75,0
AMUNDI SINGAPORE LTD BRUNEI BRANCH Brunei Darussalam Subsidiary Full 100,0 100,0 80,0 75,0
AMUNDI Singapore Ltd. Singapour Subsidiary Full 100,0 100,0 80,0 75,0
AMUNDI Smith Breeden Etats-Unis Subsidiary Full 100,0 100,0 80,0 75,0
AMUNDI Suisse Suisse Subsidiary Full 100,0 100,0 80,0 75,0
% control % interestCrédit Agricole Group
Scope of consolidation(a)
Principal place of business
Country of incorporation if
differentfrom the
principal place of business
Nature of control (b)
Consolidation method
June 30th 2014

Interim condensed consolidated financial statements of Crédit Agricole Group - 30 June 2014
102
June 30th 2014
Dec 31st 2013
June 30th 2014
Dec 31st 2013
AMUNDI Tenue de Comptes France Subsidiary Full 100,0 100,0 80,0 75,0
AMUNDI USA Inc Etats-Unis Subsidiary Full 100,0 100,0 80,0 75,0
BFT Gestion France Subsidiary Full 100,0 100,0 80,0 75,0
CA (Suisse) S.A. Suisse Subsidiary Full 100,0 100,0 100,0 100,0
CA Brasil DTVM Brésil Subsidiary Full 100,0 100,0 100,0 100,0
CA Indosuez Gestion France Subsidiary Full 100,0 100,0 100,0 100,0
CA Indosuez Private Banking France Subsidiary Full 100,0 100,0 100,0 100,0
CA Luxembourg Luxembourg Subsidiary Full 100,0 100,0 100,0 100,0
CA Suisse (Hong Kong) Hong kong Suisse Branche Full 100,0 100,0 100,0 100,0
CA Suisse (Singapour) Singapour Suisse Branche Full 100,0 100,0 100,0 100,0
CACEIS (Canada) Ltd. Canada Subsidiary Full 100,0 100,0 85,0 85,0
CACEIS (USA) Inc. Etats-Unis Subsidiary Full 100,0 100,0 85,0 85,0
CACEIS Bank Deutschland GmbH Allemagne Subsidiary Full 100,0 100,0 85,0 85,0
CACEIS BANK France France Subsidiary Full 100,0 100,0 85,0 85,0
CACEIS Bank Luxembourg Luxembourg Subsidiary Full 100,0 100,0 85,0 85,0
CACEIS Bank Luxembourg (Amsterdam) Pays-Bas Branche Full 100,0 100,0 85,0 85,0
CACEIS Bank Luxembourg (Brussels) Belgique Branche Full 100,0 100,0 85,0 85,0
CACEIS Bank Luxembourg (Dublin) Irlande Branche Full 100,0 100,0 85,0 85,0
CACEIS Bank Luxembourg (Milan) Italie Branche Full 100,0 100,0 85,0 85,0
CACEIS Belgium Belgique Subsidiary Full 100,0 100,0 85,0 85,0
CACEIS Corporate Trust France Subsidiary Full 100,0 100,0 85,0 85,0
CACEIS Fund Administration France Subsidiary Full 100,0 100,0 85,0 85,0
CACEIS Ireland Limited Irlande Subsidiary Full 100,0 100,0 85,0 85,0
CACEIS Sw itzerland S.A. Suisse Subsidiary Full 100,0 100,0 85,0 85,0
Clam Philadelphia France Subsidiary Full 100,0 100,0 80,0 75,0
CPR AM France Subsidiary Full 100,0 100,0 80,0 75,0
Crédit Agricole Luxembourg (Belgique) Belgique Luxembourg Branche Full 100,0 100,0 100,0 100,0
Crédit Agricole Luxembourg (Espagne) Espagne Luxembourg Branche Full 100,0 100,0 100,0 100,0
Crédit Agricole Suisse (Bahamas) Ltd. Bahamas Subsidiary Full 100,0 100,0 100,0 100,0
Crédit Foncier de Monaco Monaco Subsidiary Full 70,1 70,1 69,0 69,0
Etoile Gestion France Subsidiary Full 100,0 100,0 80,0 75,0
Finanziaria Indosuez International Ltd. Suisse Subsidiary Full 100,0 100,0 100,0 100,0
Fund Channel Luxembourg Associate Equity 50,0 50,0 40,0 37,5
IKS KB République Tchèque Subsidiary Full 100,0 100,0 80,0 75,0
Investor Service House S.A. Luxembourg Subsidiary Full 100,0 100,0 85,0 85,0
NH-CA Asset Management Ltd. Corée du sud Associate Equity 40,0 40,0 32,0 30,0
Partinvest S.A. Luxembourg Subsidiary Full 100,0 100,0 85,0 85,0
Société Générale Gestion (S2G) France Subsidiary Full 100,0 100,0 80,0 75,0
State Bank of India Fund Management Inde Associate Equity 37,0 37,0 29,6 27,7
WAFA Gestion Maroc Associate Equity 34,0 34,0 27,2 25,5
Investment companiesCACEIS S.A. France Subsidiary Full 85,0 85,0 85,0 85,0
InsuranceAssurances Mutuelles Fédérales France Subsidiary Full 100,0 100,0 100,0 100,0
BES Seguros Portugal Subsidiary Full 53,7 50,0 53,7 55,0
CA Assicurazioni Italie Subsidiary Full 100,0 100,0 100,0 100,0
CACI DANNI Italie Irlande Branche Full 100,0 100,0 100,0 100,0
CACI LIFE LIMITED Irlande Subsidiary Full 100,0 100,0 100,0 100,0
CACI NON LIFE LIMITED Irlande Subsidiary Full 100,0 100,0 100,0 100,0
CACI NON VIE France Irlande Branche Full 100,0 100,0 100,0 100,0
CACI Reinsurance Ltd. Irlande Subsidiary Full 100,0 100,0 100,0 100,0
CACI VIE France Irlande Branche Full 100,0 100,0 100,0 100,0
CACI VITA Italie Irlande Branche Full 100,0 100,0 100,0 100,0
CALI Europe Branche France France Branche Full 100,0 100,0 100,0 100,0
CALI Europe Branche pologne Pologne Luxembourg Branche Full 100,0 100,0 100,0 100,0
Crédit Agricole Assurances (CAA) France Subsidiary Full 100,0 100,0 100,0 100,0
Crédit Agricole Creditor Insurance (CACI) France Subsidiary Full 100,0 100,0 100,0 100,0
Crédit Agricole Life Grèce Subsidiary Full 100,0 100,0 100,0 100,0
Crédit Agricole Life Insurance Company Japan Ltd. Japon Subsidiary Full 100,0 100,0 100,0 100,0
Crédit Agricole Life Insurance Europe Luxembourg Subsidiary Full 100,0 100,0 100,0 100,0
Crédit Agricole Reinsurance S.A. Luxembourg Subsidiary Full 100,0 100,0 100,0 100,0
Crédit Agricole Vita S.p.A. Italie Subsidiary Full 100,0 100,0 100,0 100,0
Dolcea Vie S4 France Subsidiary Full 0,0 100,0 0,0 100,0
Finaref Assurances France Subsidiary Full 100,0 100,0 100,0 100,0
Finaref Risques Divers France Subsidiary Full 100,0 100,0 100,0 100,0
Finaref Vie France Subsidiary Full 100,0 100,0 100,0 100,0
Médicale de France France Subsidiary Full 99,9 99,8 99,9 99,8
Pacifica France Subsidiary Full 100,0 100,0 100,0 100,0
Predica France Subsidiary Full 100,0 100,0 100,0 100,0
Predica - Prévoyance dialogue du Crédit Agricole Espagne Branche Full 100,0 100,0 100,0 100,0
Space Holding (Ireland) Limited Irlande Subsidiary Full 100,0 100,0 100,0 100,0
Space Lux Luxembourg Subsidiary Full 100,0 100,0 100,0 100,0
Spirica France Subsidiary Full 100,0 100,0 100,0 100,0
% control % interestCrédit Agricole Group
Scope of consolidation(a)
Principal place of business
Country of incorporation if
differentfrom the
principal place of business
Nature of control (b)
Consolidation method
June 30th 2014

Interim condensed consolidated financial statements of Crédit Agricole Group - 30 June 2014
103
June 30th 2014
Dec 31st 2013
June 30th 2014
Dec 31st 2013
UCITSACACIA D3 France Subsidiary Full 100,0 100,0 80,0 75,0
ACAJOU France Subsidiary Full 100,0 100,0 80,0 75,0
AMUNDI ABSOLUTE CREDIT D5 France Subsidiary Full 30,0 24,0
AMUNDI Corporate 3 Anni Italie Structured entity Full 100,0 89,0 100,0 89,0
AMUNDI FUNDS EQUITY GLOBAL MINIMUM VARIANCE D5 Luxembourg Subsidiary Full 28,7 22,9
AMUNDI GRD 22 FCP France Structured entity Full 100,0 99,0 100,0 99,0
AMUNDI HK - GREEN PLANET FUND D3 Hong Kong Subsidiary Full 97,8 98,3 78,2 73,7
Amundi Money Market Fund - Short Term (GBP) D3 Luxembourg Subsidiary Full 100,0 100,0 80,0 75,0
Amundi Money Market Fund - Short Term (USD) - part OC D3 Luxembourg Subsidiary Full 100,0 100,0 80,0 75,0
Amundi Money Market Fund - Short Term (USD) - part OV D3 Luxembourg Subsidiary Full 57,9 52,5 46,3 39,4
AMUNDI PERFORMANCE ABSOLUE EQUILIBRE D3 France Subsidiary Full 100,0 100,0 80,0 75,0
BFT opportunité France Structured entity Full 86,7 100,0 86,7 100,0
CAA 2013 COMPARTIMENT 5 A5 E2 France Structured entity Full 100,0 100,0
CAA 2013-3 France Structured entity Full 100,0 100,0 100,0 100,0
CAA Priv.Financ. France Structured entity Full 100,0 100,0 100,0 100,0
CHORIAL ALLOCATION D3 France Subsidiary Full 99,9 99,9 79,9 74,9
Edram opportunités France Structured entity Full 100,0 100,0 100,0 100,0
FCPR CAA 2013 France Structured entity Full 100,0 100,0 100,0 100,0
FCPR CAA COMP France Structured entity Full 100,0 100,0 100,0 100,0
FCPR CAA France croissance 2 A France Structured entity Full 100,0 100,0 100,0 100,0
FCPR PREDICA 2007 France Structured entity Full 99,9 100,0 99,9 100,0
FCPR PREDICA 2008 France Structured entity Full 100,0 100,0 100,0 100,0
FCPR PREDICA SECONDAIRE I France Structured entity Full 100,0 100,0 100,0 100,0
FCPR PREDICA SECONDAIRES II France Structured entity Full 100,0 100,0 100,0 100,0
FCPR Roosevelt Investissements France Structured entity Full 100,0 100,0 100,0 100,0
FCPR UI CAP AGRO France Structured entity Full 100,0 100,0 100,0 100,0
FCPR UI CAP SANTE A France Structured entity Full 100,0 100,0 100,0 100,0
Federval France Structured entity Full 98,0 100,0 98,0 100,0
GENAVENT D3 France Subsidiary Full 48,1 52,1 38,5 39,1
GENAVENT PARTNERS LP D3 Etats-Unis Subsidiary Full 100,0 100,0 80,0 75,0
GRD 13 FCP France Structured entity Full 100,0 100,0 100,0 100,0
GRD 21 FCP France Structured entity Full 100,0 100,0 100,0 100,0
GRD1 France Structured entity Full 100,0 100,0 100,0 100,0
GRD10 France Structured entity Full 100,0 100,0 100,0 100,0
GRD11 France Structured entity Full 100,0 100,0 100,0 100,0
GRD12 France Structured entity Full 100,0 100,0 100,0 100,0
GRD14 France Structured entity Full 100,0 100,0 100,0 100,0
GRD16 France Structured entity Full 100,0 100,0 100,0 100,0
GRD17 France Structured entity Full 100,0 100,0 100,0 100,0
GRD18 France Structured entity Full 100,0 100,0 100,0 100,0
GRD19 France Structured entity Full 100,0 100,0 100,0 100,0
GRD2 France Structured entity Full 100,0 100,0 100,0 100,0
GRD23 E2 France Structured entity Full 100,0 0,0 100,0 0,0
GRD20 France Structured entity Full 100,0 100,0 100,0 100,0
GRD3 France Structured entity Full 100,0 100,0 100,0 100,0
GRD4 France Structured entity Full 100,0 100,0 100,0 100,0
GRD5 France Structured entity Full 100,0 100,0 100,0 100,0
GRD7 France Structured entity Full 100,0 100,0 100,0 100,0
GRD8 France Structured entity Full 100,0 94,7 100,0 94,7
GRD9 France Structured entity Full 97,4 98,5 97,4 98,5
LRP - CPT JANVIER 2013 0.30 13-21 11/01A Luxembourg Structured entity Full 84,2 84,2 84,2 84,2
OBJECTIF LONG TERME FCP France Structured entity Full 100,0 100,0 100,0 100,0
OPCI IMMANENS D3 France Subsidiary Full 100,0 100,0 80,0 75,0
OPCI IMMO EMISSIONS D3 France Subsidiary Full 100,0 100,0 80,0 75,0
PEG - PORTFOLIO EONIA GARANTI D3 France Subsidiary Full 89,2 85,2 71,4 63,9
Predica 2005 FCPR A France Structured entity Full 100,0 100,0 100,0 100,0
Predica 2006 FCPR A France Structured entity Full 100,0 100,0 100,0 100,0
Predica 2006-2007 FCPR France Structured entity Full 100,0 100,0 100,0 100,0
PREDICA 2010 France Structured entity Full 100,0 100,0 100,0 100,0
PREDICA SECONDAIRES III France Structured entity Full 100,0 100,0 100,0 100,0
Predicant A1 FCP France Structured entity Full 100,0 100,0 100,0 100,0
Predicant A2 FCP France Structured entity Full 100,0 100,0 100,0 100,0
Predicant A3 FCP France Structured entity Full 100,0 100,0 100,0 100,0
Prediquant opportunité France Structured entity Full 99,7 99,9 99,7 99,9
PREDIQUANT STRATEGIES France Structured entity Full 100,0 100,0 100,0 100,0
PREMIUM GR 0% 28 Irlande Structured entity Full 94,9 94,9 94,9 94,9
PREMIUM GREEN 4.52%06-21 EMTN Irlande Structured entity Full 100,0 100,0 100,0 100,0
PREMIUM GREEN 4.54%06-13.06.21 Irlande Structured entity Full 100,0 100,0 100,0 100,0
PREMIUM GREEN 4.5575%21 EMTN Irlande Structured entity Full 100,0 100,0 100,0 100,0
PREMIUM GREEN 4.56%06-21 Irlande Structured entity Full 100,0 100,0 100,0 100,0
PREMIUM GREEN 4.7% EMTN 08/08/21 Irlande Structured entity Full 100,0 100,0 100,0 100,0
PREMIUM GREEN 4.72%12-250927 Irlande Structured entity Full 78,9 78,9 78,9 78,9
PREMIUM GREEN PLC 4.30%2021 Irlande Structured entity Full 100,0 100,0 100,0 100,0
PREMIUM GREEN TV 06/22 Irlande Structured entity Full 100,0 100,0 100,0 100,0
PREMIUM GREEN TV 07/22 Irlande Structured entity Full 100,0 100,0 100,0 100,0
% control % interestCrédit Agricole Group
Scope of consolidation(a)
Principal place of business
Country of incorporation if
differentfrom the
principal place of business
Nature of control (b)
Consolidation method
June 30th 2014
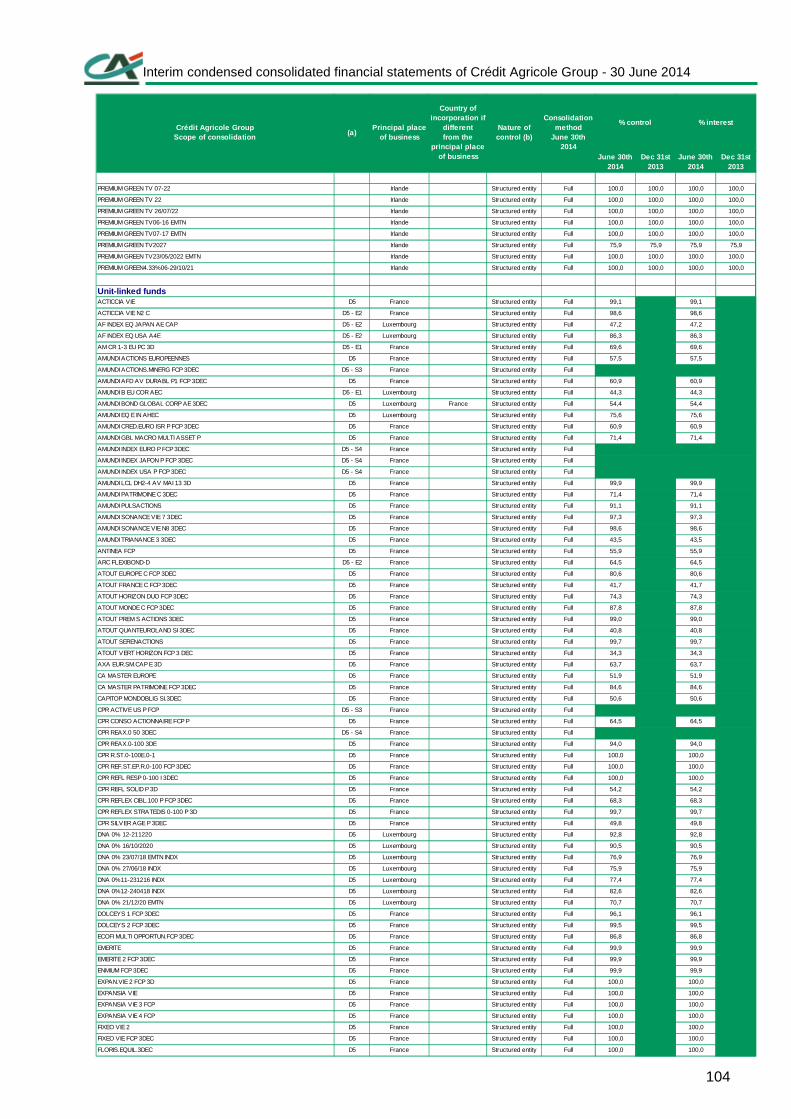
Interim condensed consolidated financial statements of Crédit Agricole Group - 30 June 2014
104
June 30th 2014
Dec 31st 2013
June 30th 2014
Dec 31st 2013
PREMIUM GREEN TV 07-22 Irlande Structured entity Full 100,0 100,0 100,0 100,0
PREMIUM GREEN TV 22 Irlande Structured entity Full 100,0 100,0 100,0 100,0
PREMIUM GREEN TV 26/07/22 Irlande Structured entity Full 100,0 100,0 100,0 100,0
PREMIUM GREEN TV06-16 EMTN Irlande Structured entity Full 100,0 100,0 100,0 100,0
PREMIUM GREEN TV07-17 EMTN Irlande Structured entity Full 100,0 100,0 100,0 100,0
PREMIUM GREEN TV2027 Irlande Structured entity Full 75,9 75,9 75,9 75,9
PREMIUM GREEN TV23/05/2022 EMTN Irlande Structured entity Full 100,0 100,0 100,0 100,0
PREMIUM GREEN4.33%06-29/10/21 Irlande Structured entity Full 100,0 100,0 100,0 100,0
Unit-linked fundsACTICCIA VIE D5 France Structured entity Full 99,1 99,1
ACTICCIA VIE N2 C D5 - E2 France Structured entity Full 98,6 98,6
AF INDEX EQ JAPAN AE CAP D5 - E2 Luxembourg Structured entity Full 47,2 47,2
AF INDEX EQ USA A4E D5 - E2 Luxembourg Structured entity Full 86,3 86,3
AM CR 1-3 EU PC 3D D5 - E1 France Structured entity Full 69,6 69,6
AMUNDI ACTIONS EUROPEENNES D5 France Structured entity Full 57,5 57,5
AMUNDI ACTIONS.MINERG FCP 3DEC D5 - S3 France Structured entity Full
AMUNDI AFD AV DURABL P1 FCP 3DEC D5 France Structured entity Full 60,9 60,9
AMUNDI B EU COR AEC D5 - E1 Luxembourg Structured entity Full 44,3 44,3
AMUNDI BOND GLOBAL CORP AE 3DEC D5 Luxembourg France Structured entity Full 54,4 54,4
AMUNDI EQ E IN AHEC D5 Luxembourg Structured entity Full 75,6 75,6
AMUNDI CRED.EURO ISR P FCP 3DEC D5 France Structured entity Full 60,9 60,9
AMUNDI GBL MACRO MULTI ASSET P D5 France Structured entity Full 71,4 71,4
AMUNDI INDEX EURO P FCP 3DEC D5 - S4 France Structured entity Full
AMUNDI INDEX JAPON P FCP 3DEC D5 - S4 France Structured entity Full
AMUNDI INDEX USA P FCP 3DEC D5 - S4 France Structured entity Full
AMUNDI LCL DH2-4 AV MAI 13 3D D5 France Structured entity Full 99,9 99,9
AMUNDI PATRIMOINE C 3DEC D5 France Structured entity Full 71,4 71,4
AMUNDI PULSACTIONS D5 France Structured entity Full 91,1 91,1
AMUNDI SONANCE VIE 7 3DEC D5 France Structured entity Full 97,3 97,3
AMUNDI SONANCE VIE N8 3DEC D5 France Structured entity Full 98,6 98,6
AMUNDI TRIANANCE 3 3DEC D5 France Structured entity Full 43,5 43,5
ANTINEA FCP D5 France Structured entity Full 55,9 55,9
ARC FLEXIBOND-D D5 - E2 France Structured entity Full 64,5 64,5
ATOUT EUROPE C FCP 3DEC D5 France Structured entity Full 80,6 80,6
ATOUT FRANCE C FCP 3DEC D5 France Structured entity Full 41,7 41,7
ATOUT HORIZON DUO FCP 3DEC D5 France Structured entity Full 74,3 74,3
ATOUT MONDE C FCP 3DEC D5 France Structured entity Full 87,8 87,8
ATOUT PREM S ACTIONS 3DEC D5 France Structured entity Full 99,0 99,0
ATOUT QUANTEUROLAND SI 3DEC D5 France Structured entity Full 40,8 40,8
ATOUT SERENACTIONS D5 France Structured entity Full 99,7 99,7
ATOUT VERT HORIZON FCP 3 DEC D5 France Structured entity Full 34,3 34,3
AXA EUR.SM.CAP E 3D D5 France Structured entity Full 63,7 63,7
CA MASTER EUROPE D5 France Structured entity Full 51,9 51,9
CA MASTER PATRIMOINE FCP 3DEC D5 France Structured entity Full 84,6 84,6
CAPITOP MONDOBLIG SI.3DEC D5 France Structured entity Full 50,6 50,6
CPR ACTIVE US P FCP D5 - S3 France Structured entity Full
CPR CONSO ACTIONNAIRE FCP P D5 France Structured entity Full 64,5 64,5
CPR REAX.0 50 3DEC D5 - S4 France Structured entity Full
CPR REAX.0-100 3DE D5 France Structured entity Full 94,0 94,0
CPR R.ST.0-100E.0-1 D5 France Structured entity Full 100,0 100,0
CPR REF.ST.EP.R.0-100 FCP 3DEC D5 France Structured entity Full 100,0 100,0
CPR REFL RESP 0-100 I 3DEC D5 France Structured entity Full 100,0 100,0
CPR REFL SOLID P 3D D5 France Structured entity Full 54,2 54,2
CPR REFLEX CIBL.100 P FCP 3DEC D5 France Structured entity Full 68,3 68,3
CPR REFLEX STRATEDIS 0-100 P 3D D5 France Structured entity Full 99,7 99,7
CPR SILVER AGE P 3DEC D5 France Structured entity Full 49,8 49,8
DNA 0% 12-211220 D5 Luxembourg Structured entity Full 92,8 92,8
DNA 0% 16/10/2020 D5 Luxembourg Structured entity Full 90,5 90,5
DNA 0% 23/07/18 EMTN INDX D5 Luxembourg Structured entity Full 76,9 76,9
DNA 0% 27/06/18 INDX D5 Luxembourg Structured entity Full 75,9 75,9
DNA 0%11-231216 INDX D5 Luxembourg Structured entity Full 77,4 77,4
DNA 0%12-240418 INDX D5 Luxembourg Structured entity Full 82,6 82,6
DNA 0% 21/12/20 EMTN D5 Luxembourg Structured entity Full 70,7 70,7
DOLCEYS 1 FCP 3DEC D5 France Structured entity Full 96,1 96,1
DOLCEYS 2 FCP 3DEC D5 France Structured entity Full 99,5 99,5
ECOFI MULTI OPPORTUN.FCP 3DEC D5 France Structured entity Full 86,8 86,8
EMERITE D5 France Structured entity Full 99,9 99,9
EMERITE 2 FCP 3DEC D5 France Structured entity Full 99,9 99,9
ENMIUM FCP 3DEC D5 France Structured entity Full 99,9 99,9
EXPAN.VIE 2 FCP 3D D5 France Structured entity Full 100,0 100,0
EXPANSIA VIE D5 France Structured entity Full 100,0 100,0
EXPANSIA VIE 3 FCP D5 France Structured entity Full 100,0 100,0
EXPANSIA VIE 4 FCP D5 France Structured entity Full 100,0 100,0
FIXEO VIE 2 D5 France Structured entity Full 100,0 100,0
FIXEO VIE FCP 3DEC D5 France Structured entity Full 100,0 100,0
FLORIS.EQUIL.3DEC D5 France Structured entity Full 100,0 100,0
% control % interestCrédit Agricole Group
Scope of consolidation(a)
Principal place of business
Country of incorporation if
differentfrom the
principal place of business
Nature of control (b)
Consolidation method
June 30th 2014

Interim condensed consolidated financial statements of Crédit Agricole Group - 30 June 2014
105
June 30th 2014
Dec 31st 2013
June 30th 2014
Dec 31st 2013
FLORIS.PRUDEN.3DEC D5 France Structured entity Full 100,0 100,0
FLORISS.DYNAM.3DEC D5 France Structured entity Full 100,0 100,0
FLORISS.EXPAN.3DEC D5 France Structured entity Full 100,0 100,0
FONDS AV ECHUS N°1 D5 - E2 France Structured entity Full 95,9 95,9
GRD CAR 39 FCP D5 France Structured entity Full 100,0 100,0
GRD FCR 99 FCP D5 France Structured entity Full 100,0 100,0
GRD IFC 97 FCP D5 France Structured entity Full 100,0 100,0
INDOCAM FLAMME FCP 3DEC D5 France Structured entity Full 100,0 100,0
INDOS.EUROP.P.3DEC D5 - S3 France Structured entity Full
INDOSUEZ CRESCENDO FCP D5 France Structured entity Full 46,5 46,5
INDOSUEZ EUROPE EXPENSION FCP D5 France Structured entity Full 57,0 57,0
INDO.FLEX.100 -C-3D D5 France Structured entity Full 95,4 0,0 95,4 0,0
JAYANNE 2 FCP 3DEC D5 France Structured entity Full 100,0 100,0
JAYANNE 3 FCP 3DEC D5 France Structured entity Full 100,0 100,0
JAYANNE 4 3DEC FCP D5 France Structured entity Full 100,0 100,0
JAYANNE 5 FCP 3DEC D5 France Structured entity Full 100,0 100,0
JAYANNE 6 FCP D5 France Structured entity Full 100,0 100,0
JAYANNE 7 FCP 3DEC D5 France Structured entity Full 100,0 100,0
JAYANNE FCP 3DEC D5 France Structured entity Full 100,0 100,0
JPM-US S E P-AEURA D5 - E2 Luxembourg Structured entity Full 95,6 95,6
LCL 5 HORIZONS AV FEV2013 D5 - S1 France Structured entity Full
LCL ACT.USA ISR 3D D5 - E1 France Structured entity Full 40,1 40,1
LCL ALLOCATION DYNAMIQUE 3D FCP D5 France Structured entity Full 48,8 48,8
LCL ALLOCATION EQUILIBRE 3DEC D5 France Structured entity Full 48,9 48,9
LCL AUT 11 VIE SW 7.5 3DEC D5 - S3 France Structured entity Full
LCL AUT VIE 11 PR 10 3DEC D5 France Structured entity Full 98,3 98,3
LCL AUT.VIE 2011 SW.10/20 FCP D5 France Structured entity Full 97,7 97,7
LCL CAPTURE 40 VIE FCP 3DEC D5 France Structured entity Full 99,0 99,0
LCL D.H.2-4 ANS AV NOV 13 D5 France Structured entity Full 100,0 100,0
LCL DEVELOPPEM.PME C D5 - E2 France Structured entity Full 93,9 93,9
LCL FLEX 30 D5 France Structured entity Full 68,6 68,6
LCL FO.SE.FR.AV(AV11) FCP 3DEC D5 France Structured entity Full 100,0 100,0
LCL FOR S F AV (FEV11) 3DEC D5 France Structured entity Full 100,0 100,0
LCL FOR SEC AV SEPT10 3DEC D5 France Structured entity Full 100,0 100,0
LCL GAR.100 AV3DEC D5 France Structured entity Full 100,0 100,0
LCL HOR.AV.FEV11 3 D5 - S1 France Structured entity Full
LCL MGEST 60 3DEC D5 France Structured entity Full 89,0 89,0
LCL MGEST FL.0-100 D5 France Structured entity Full 80,6 80,6
LCL OBLIGATIONS INFLATION C EUR D5 France Structured entity Full 43,8 43,8
LCL ORIENTATION DYNAM FCP3D D5 France Structured entity Full 89,0 89,0
LCL ORIENTATION EQUIL.FCP 3DEC D5 France Structured entity Full 90,4 90,4
LCL ORIENTATION PRUDENT D5 France Structured entity Full 92,2 92,2
LCL PERSP. 3DEC FCP D5 France Structured entity Full 85,1 85,1
LCL PREMIUM J VIE 2014 D5 France Structured entity Full 96,0 96,0
LCL PREMIUM VIE 14 C D5 - E2 France Structured entity Full 99,1 99,1
LCL SEC 100 AV(JUIN08)FCP 3D D5 France Structured entity Full 100,0 100,0
LCL SEC 106(MARS 10)FCP 3DEC D5 France Structured entity Full 99,7 99,7
LCL SECU.100(JUIL.11) D5 France Structured entity Full 49,1 49,1
LCL STRATEGIE 100 D5 France Structured entity Full 60,2 60,2
LCL T.H. AV(04/14) C D5 - E2 France Structured entity Full 99,7 99,7
LCL TR.HORIZ.AV(AV11)FCP 3DEC D5 France Structured entity Full 100,0 100,0
LCL TRIPLE H 2013 D5 France Structured entity Full 100,0 100,0
LCL TRIPLE HORIZ AV 09/12 3DEC D5 - S3 France Structured entity Full
LCL TRIPLE HORIZ AV JANV 14 C 3D D5 France Structured entity Full 100,0 100,0
LCL TRIPLE HORIZON AV 09/13 C 3D D5 France Structured entity Full 100,0 100,0
LCL V.RDM 8 AV(FEV.10) FCP3DEC D5 France Structured entity Full 100,0 100,0
LCL VOCATION RENDEMENT NOV 12 3D D5 France Structured entity Full 78,8 78,8
M.D.F.89 FCP D5 France Structured entity Full 100,0 100,0
OBJECTIF DYNAMISME FCP D5 France Structured entity Full 100,0 100,0
OBJECTIF MEDIAN FCP D5 France Structured entity Full 99,3 99,3
OBJECTIF PRUDENCE FCP D5 France Structured entity Full 99,2 99,2
OBJECTIF RENDEMENT 1 3DEC FCP D5 Luxembourg Structured entity Full 100,0 100,0
OCELIA 2 FCP 3DEC D5 France Structured entity Full 100,0 100,0
OCELIA FCP 3DEC D5 France Structured entity Full 100,0 100,0
OPALIA VIE 2 FCP 3DEC D5 France Structured entity Full 99,9 99,9
OPALIA VIE 3 3DEC D5 France Structured entity Full 99,9 99,9
OPALIA VIE 3DEC D5 France Structured entity Full 100,0 100,0
OPCIMMO LCL SPPICAV 5DEC D5 France Structured entity Full 92,6 92,6
OPCIMMO PREM SPPICAV 5DEC D5 France Structured entity Full 95,7 95,7
OPTALIME FCP 3DEC D5 France Structured entity Full 100,0 100,0
OPTALIS DYNAMIQUE C FCP 3DEC D5 France Structured entity Full 92,6 92,6
OPTALIS EQUILIBRE C FCP 3DEC D5 France Structured entity Full 83,2 83,2
OPTALIS EXPANSION C FCP 3DEC D5 France Structured entity Full 44,4 44,4
OPTALIS SERENITE C FCP 3DEC D5 France Structured entity Full 84,9 84,9
OPTIMANCE FCP 3DEC D5 France Structured entity Full 98,7 98,7
OPTIMIZ BES TIMING II 3DEC D5 France Structured entity Full 81,9 81,9
ORIANCE VIE FCP 3DEC D5 France Structured entity Full 100,0 100,0
% control % interestCrédit Agricole Group
Scope of consolidation(a)
Principal place of business
Country of incorporation if
differentfrom the
principal place of business
Nature of control (b)
Consolidation method
June 30th 2014
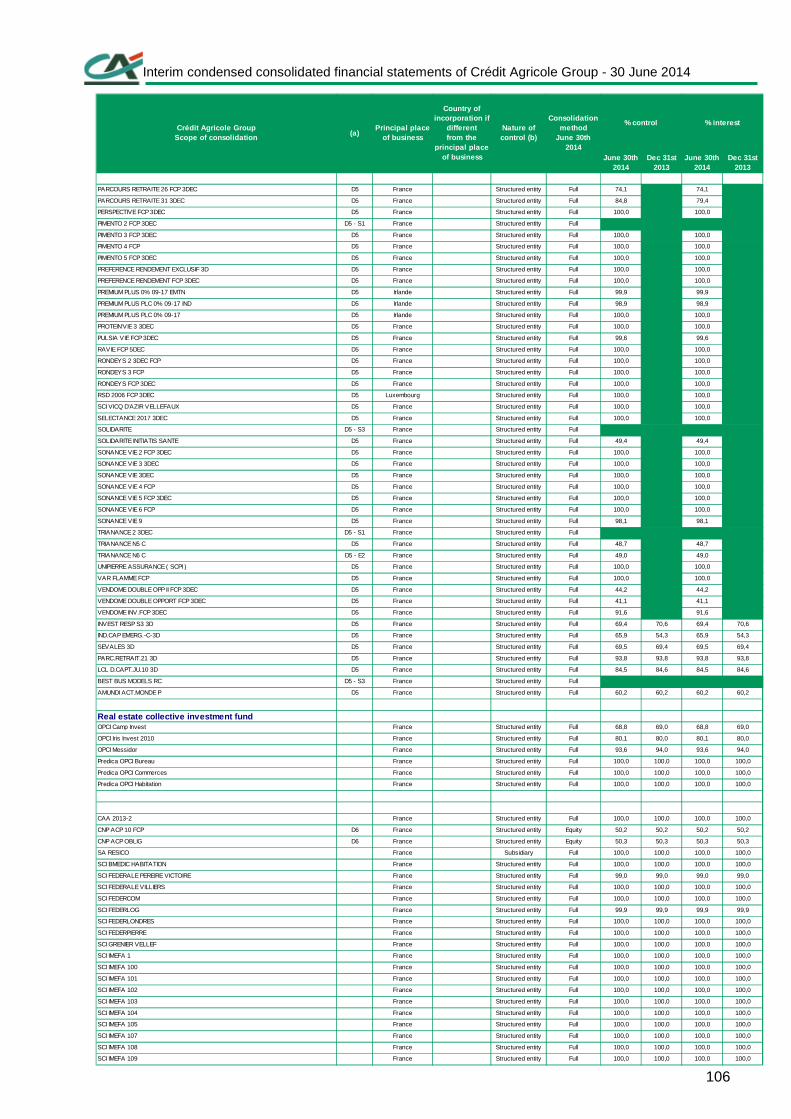
Interim condensed consolidated financial statements of Crédit Agricole Group - 30 June 2014
106
June 30th 2014
Dec 31st 2013
June 30th 2014
Dec 31st 2013
PARCOURS RETRAITE 26 FCP 3DEC D5 France Structured entity Full 74,1 74,1
PARCOURS RETRAITE 31 3DEC D5 France Structured entity Full 84,8 79,4
PERSPECTIVE FCP 3DEC D5 France Structured entity Full 100,0 100,0
PIMENTO 2 FCP 3DEC D5 - S1 France Structured entity Full
PIMENTO 3 FCP 3DEC D5 France Structured entity Full 100,0 100,0
PIMENTO 4 FCP D5 France Structured entity Full 100,0 100,0
PIMENTO 5 FCP 3DEC D5 France Structured entity Full 100,0 100,0
PREFERENCE RENDEMENT EXCLUSIF 3D D5 France Structured entity Full 100,0 100,0
PREFERENCE RENDEMENT FCP 3DEC D5 France Structured entity Full 100,0 100,0
PREMIUM PLUS 0% 09-17 EMTN D5 Irlande Structured entity Full 99,9 99,9
PREMIUM PLUS PLC 0% 09-17 IND D5 Irlande Structured entity Full 98,9 98,9
PREMIUM PLUS PLC 0% 09-17 D5 Irlande Structured entity Full 100,0 100,0
PROTEIN'VIE 3 3DEC D5 France Structured entity Full 100,0 100,0
PULSIA VIE FCP 3DEC D5 France Structured entity Full 99,6 99,6
RAVIE FCP 5DEC D5 France Structured entity Full 100,0 100,0
RONDEYS 2 3DEC FCP D5 France Structured entity Full 100,0 100,0
RONDEYS 3 FCP D5 France Structured entity Full 100,0 100,0
RONDEYS FCP 3DEC D5 France Structured entity Full 100,0 100,0
RSD 2006 FCP 3DEC D5 Luxembourg Structured entity Full 100,0 100,0
SCI VICQ D'AZIR VELLEFAUX D5 France Structured entity Full 100,0 100,0
SELECTANCE 2017 3DEC D5 France Structured entity Full 100,0 100,0
SOLIDARITE D5 - S3 France Structured entity Full
SOLIDARITE INITIATIS SANTE D5 France Structured entity Full 49,4 49,4
SONANCE VIE 2 FCP 3DEC D5 France Structured entity Full 100,0 100,0
SONANCE VIE 3 3DEC D5 France Structured entity Full 100,0 100,0
SONANCE VIE 3DEC D5 France Structured entity Full 100,0 100,0
SONANCE VIE 4 FCP D5 France Structured entity Full 100,0 100,0
SONANCE VIE 5 FCP 3DEC D5 France Structured entity Full 100,0 100,0
SONANCE VIE 6 FCP D5 France Structured entity Full 100,0 100,0
SONANCE VIE 9 D5 France Structured entity Full 98,1 98,1
TRIANANCE 2 3DEC D5 - S1 France Structured entity Full
TRIANANCE N5 C D5 France Structured entity Full 48,7 48,7
TRIANANCE N6 C D5 - E2 France Structured entity Full 49,0 49,0
UNIPIERRE ASSURANCE ( SCPI ) D5 France Structured entity Full 100,0 100,0
VAR FLAMME FCP D5 France Structured entity Full 100,0 100,0
VENDOME DOUBLE OPP II FCP 3DEC D5 France Structured entity Full 44,2 44,2
VENDOME DOUBLE OPPORT FCP 3DEC D5 France Structured entity Full 41,1 41,1
VENDOME INV.FCP 3DEC D5 France Structured entity Full 91,6 91,6
INVEST RESP S3 3D D5 France Structured entity Full 69,4 70,6 69,4 70,6
IND.CAP EMERG.-C-3D D5 France Structured entity Full 65,9 54,3 65,9 54,3
SEVALES 3D D5 France Structured entity Full 69,5 69,4 69,5 69,4
PARC.RETRAIT.21 3D D5 France Structured entity Full 93,8 93,8 93,8 93,8
LCL D.CAPT.JU.10 3D D5 France Structured entity Full 84,5 84,6 84,5 84,6
BEST BUS MODELS RC D5 - S3 France Structured entity Full
AMUNDI ACT.MONDE P D5 France Structured entity Full 60,2 60,2 60,2 60,2
Real estate collective investment fundOPCI Camp Invest France Structured entity Full 68,8 69,0 68,8 69,0
OPCI Iris Invest 2010 France Structured entity Full 80,1 80,0 80,1 80,0
OPCI Messidor France Structured entity Full 93,6 94,0 93,6 94,0
Predica OPCI Bureau France Structured entity Full 100,0 100,0 100,0 100,0
Predica OPCI Commerces France Structured entity Full 100,0 100,0 100,0 100,0
Predica OPCI Habitation France Structured entity Full 100,0 100,0 100,0 100,0
CAA 2013-2 France Structured entity Full 100,0 100,0 100,0 100,0
CNP ACP 10 FCP D6 France Structured entity Equity 50,2 50,2 50,2 50,2
CNP ACP OBLIG D6 France Structured entity Equity 50,3 50,3 50,3 50,3
SA RESICO France Subsidiary Full 100,0 100,0 100,0 100,0
SCI BMEDIC HABITATION France Structured entity Full 100,0 100,0 100,0 100,0
SCI FEDERALE PEREIRE VICTOIRE France Structured entity Full 99,0 99,0 99,0 99,0
SCI FEDERALE VILLIERS France Structured entity Full 100,0 100,0 100,0 100,0
SCI FEDERCOM France Structured entity Full 100,0 100,0 100,0 100,0
SCI FEDERLOG France Structured entity Full 99,9 99,9 99,9 99,9
SCI FEDERLONDRES France Structured entity Full 100,0 100,0 100,0 100,0
SCI FEDERPIERRE France Structured entity Full 100,0 100,0 100,0 100,0
SCI GRENIER VELLEF France Structured entity Full 100,0 100,0 100,0 100,0
SCI IMEFA 1 France Structured entity Full 100,0 100,0 100,0 100,0
SCI IMEFA 100 France Structured entity Full 100,0 100,0 100,0 100,0
SCI IMEFA 101 France Structured entity Full 100,0 100,0 100,0 100,0
SCI IMEFA 102 France Structured entity Full 100,0 100,0 100,0 100,0
SCI IMEFA 103 France Structured entity Full 100,0 100,0 100,0 100,0
SCI IMEFA 104 France Structured entity Full 100,0 100,0 100,0 100,0
SCI IMEFA 105 France Structured entity Full 100,0 100,0 100,0 100,0
SCI IMEFA 107 France Structured entity Full 100,0 100,0 100,0 100,0
SCI IMEFA 108 France Structured entity Full 100,0 100,0 100,0 100,0
SCI IMEFA 109 France Structured entity Full 100,0 100,0 100,0 100,0
% control % interestCrédit Agricole Group
Scope of consolidation(a)
Principal place of business
Country of incorporation if
differentfrom the
principal place of business
Nature of control (b)
Consolidation method
June 30th 2014

Interim condensed consolidated financial statements of Crédit Agricole Group - 30 June 2014
107
June 30th 2014
Dec 31st 2013
June 30th 2014
Dec 31st 2013
SCI IMEFA 11 France Structured entity Full 100,0 100,0 100,0 100,0
SCI IMEFA 110 France Structured entity Full 100,0 100,0 100,0 100,0
SCI IMEFA 112 France Structured entity Full 100,0 100,0 100,0 100,0
SCI IMEFA 113 France Structured entity Full 100,0 100,0 100,0 100,0
SCI IMEFA 115 France Structured entity Full 100,0 100,0 100,0 100,0
SCI IMEFA 116 France Structured entity Full 100,0 100,0 100,0 100,0
SCI IMEFA 117 France Structured entity Full 100,0 100,0 100,0 100,0
SCI IMEFA 118 France Structured entity Full 100,0 100,0 100,0 100,0
SCI IMEFA 120 France Structured entity Full 100,0 100,0 100,0 100,0
SCI IMEFA 121 France Structured entity Full 100,0 100,0 100,0 100,0
SCI IMEFA 122 France Structured entity Full 100,0 100,0 100,0 100,0
SCI IMEFA 123 France Structured entity Full 100,0 100,0 100,0 100,0
SCI IMEFA 126 France Structured entity Full 100,0 100,0 100,0 100,0
SCI IMEFA 128 France Structured entity Full 100,0 100,0 100,0 100,0
SCI IMEFA 129 France Structured entity Full 100,0 100,0 100,0 100,0
SCI IMEFA 13 France Structured entity Full 100,0 100,0 100,0 100,0
SCI IMEFA 131 France Structured entity Full 100,0 100,0 100,0 100,0
SCI IMEFA 132 France Structured entity Full 100,0 100,0 100,0 100,0
SCI IMEFA 139 France Structured entity Full 100,0 100,0 100,0 100,0
SCI IMEFA 17 France Structured entity Full 100,0 100,0 100,0 100,0
SCI IMEFA 18 France Structured entity Full 100,0 100,0 100,0 100,0
SCI IMEFA 20 France Structured entity Full 100,0 100,0 100,0 100,0
SCI IMEFA 22 E1 France Structured entity Full 100,0 100,0
SCI IMEFA 32 France Structured entity Full 100,0 100,0 100,0 100,0
SCI IMEFA 33 France Structured entity Full 100,0 100,0 100,0 100,0
SCI IMEFA 34 France Structured entity Full 100,0 100,0 100,0 100,0
SCI IMEFA 35 France Structured entity Full 100,0 100,0 100,0 100,0
SCI IMEFA 36 France Structured entity Full 100,0 100,0 100,0 100,0
SCI IMEFA 37 France Structured entity Full 100,0 100,0 100,0 100,0
SCI IMEFA 38 France Structured entity Full 100,0 100,0 100,0 100,0
SCI IMEFA 39 France Structured entity Full 100,0 100,0 100,0 100,0
SCI IMEFA 4 France Structured entity Full 100,0 100,0 100,0 100,0
SCI IMEFA 42 France Structured entity Full 100,0 100,0 100,0 100,0
SCI IMEFA 43 France Structured entity Full 100,0 100,0 100,0 100,0
SCI IMEFA 44 France Structured entity Full 100,0 100,0 100,0 100,0
SCI IMEFA 47 France Structured entity Full 100,0 100,0 100,0 100,0
SCI IMEFA 48 France Structured entity Full 100,0 100,0 100,0 100,0
SCI IMEFA 5 France Structured entity Full 100,0 100,0 100,0 100,0
SCI IMEFA 51 France Structured entity Full 100,0 100,0 100,0 100,0
SCI IMEFA 52 France Structured entity Full 100,0 100,0 100,0 100,0
SCI IMEFA 54 France Structured entity Full 100,0 100,0 100,0 100,0
SCI IMEFA 57 France Structured entity Full 100,0 100,0 100,0 100,0
SCI IMEFA 58 France Structured entity Full 100,0 100,0 100,0 100,0
SCI IMEFA 6 France Structured entity Full 100,0 100,0 100,0 100,0
SCI IMEFA 60 France Structured entity Full 100,0 100,0 100,0 100,0
SCI IMEFA 61 France Structured entity Full 100,0 100,0 100,0 100,0
SCI IMEFA 62 France Structured entity Full 100,0 100,0 100,0 100,0
SCI IMEFA 63 France Structured entity Full 100,0 100,0 100,0 100,0
SCI IMEFA 64 France Structured entity Full 100,0 100,0 100,0 100,0
SCI IMEFA 67 France Structured entity Full 100,0 100,0 100,0 100,0
SCI IMEFA 68 France Structured entity Full 100,0 100,0 100,0 100,0
SCI IMEFA 69 France Structured entity Full 100,0 100,0 100,0 100,0
SCI IMEFA 72 France Structured entity Full 100,0 100,0 100,0 100,0
SCI IMEFA 73 France Structured entity Full 100,0 100,0 100,0 100,0
SCI IMEFA 74 France Structured entity Full 100,0 100,0 100,0 100,0
SCI IMEFA 76 France Structured entity Full 100,0 100,0 100,0 100,0
SCI IMEFA 77 France Structured entity Full 100,0 100,0 100,0 100,0
SCI IMEFA 78 France Structured entity Full 100,0 100,0 100,0 100,0
SCI IMEFA 79 France Structured entity Full 100,0 100,0 100,0 100,0
SCI IMEFA 80 France Structured entity Full 100,0 100,0 100,0 100,0
SCI IMEFA 82 France Structured entity Full 100,0 100,0 100,0 100,0
SCI IMEFA 83 E1 France Structured entity Full 100,0 100,0
SCI IMEFA 84 France Structured entity Full 100,0 100,0 100,0 100,0
SCI IMEFA 85 France Structured entity Full 100,0 100,0 100,0 100,0
SCI IMEFA 89 France Structured entity Full 100,0 100,0 100,0 100,0
SCI IMEFA 91 France Structured entity Full 100,0 100,0 100,0 100,0
SCI IMEFA 92 France Structured entity Full 100,0 100,0 100,0 100,0
SCI IMEFA 94 E1 France Structured entity Full 100,0 100,0
SCI IMEFA 96 France Structured entity Full 100,0 100,0 100,0 100,0
SCI LE VILLAGE VICTOR HUGO France Structured entity Full 96,4 96,4 96,4 96,4
SCI MEDI BUREAUX France Structured entity Full 100,0 100,0 100,0 100,0
SCI PACIFICA HUGO France Structured entity Full 100,0 100,0 100,0 100,0
SCI PORTE DES LILAS - FRERES FLAVIEN France Structured entity Full 100,0 100,0 100,0 100,0
SCI VALHUBERT France Structured entity Full 100,0 100,0 100,0 100,0
OtherAMUNDI Informatique Technique Services France Subsidiary Full 99,8 99,8 81,2 77,1
% control % interestCrédit Agricole Group
Scope of consolidation(a)
Principal place of business
Country of incorporation if
differentfrom the
principal place of business
Nature of control (b)
Consolidation method
June 30th 2014

Interim condensed consolidated financial statements of Crédit Agricole Group - 30 June 2014
108
June 30th 2014
Dec 31st 2013
June 30th 2014
Dec 31st 2013
CACI Gestion France Subsidiary Full 82,0 100,0 82,0 99,0
Crédit Agricole Private Banking France Subsidiary Full 100,0 100,0 100,0 100,0
SAS Caagis France Subsidiary Full 100,0 100,0 100,0 100,0
SCI La Baume France Subsidiary Full 100,0 100,0 100,0 100,0
Via Vita France Subsidiary Full 100,0 100,0 100,0 100,0
Corporate and investment banking
Banking and financial institutionsAl BK Saudi Al Fransi - BSF Arabie Saoudite Associate Equity 31,1 31,1 31,1 31,1
Altura Markets S2 - D4 - D6 Espagne Joint venture Equity 50,0 50,0
Citic Calyon Financial Brokerage Corp, Ltd S2 - D4 - D6 Chine Joint venture Equity 42,0 42,0
Crédit Agriciole CIB (Belgique) Belgique France Branche Full 100,0 100,0 100,0 100,0
Credit Agricole CIB (ABU DHABI) D3 Emirats Arabes Unis France Branche Full 100,0 100,0 100,0 100,0
Crédit Agricole CIB (Chicago) D3 Etats-Unis France Branche Full 100,0 100,0 100,0 100,0
Credit Agricole CIB (Dubai DIFC) D3 Emirats Arabes Unis France Branche Full 100,0 100,0 100,0 100,0
Credit Agricole CIB (Dubai) D3 Emirats Arabes Unis France Branche Full 100,0 100,0 100,0 100,0
Crédit Agricole CIB (Espagne) Espagne France Branche Full 100,0 100,0 100,0 100,0
Crédit Agricole CIB (Finland) Finlande France Branche Full 100,0 100,0 100,0 100,0
Crédit Agricole CIB (Germany) Allemagne France Branche Full 100,0 100,0 100,0 100,0
Crédit Agricole CIB (Hong-Kong) Hong-kong France Branche Full 100,0 100,0 100,0 100,0
Crédit Agricole CIB (Iles-Caymans) D3 Iles Cayman France Branche Full 100,0 100,0 100,0 100,0
Crédit Agricole CIB (India) Inde France Branche Full 100,0 100,0 100,0 100,0
Crédit Agricole CIB (Italie) Italie France Branche Full 100,0 100,0 100,0 100,0
Crédit Agricole CIB (Japan) Japon France Branche Full 100,0 100,0 100,0 100,0
Crédit Agricole CIB (Luxembourg) Luxembourg France Branche Full 100,0 100,0 100,0 100,0
Crédit Agricole CIB (Miami) Etats-Unis France Branche Full 100,0 100,0 100,0 100,0
Crédit Agricole CIB (New-York) Etats-Unis France Branche Full 100,0 100,0 100,0 100,0
Crédit Agricole CIB (Singapore) Singapour France Branche Full 100,0 100,0 100,0 100,0
Crédit Agricole CIB (South Korea) Corée du sud France Branche Full 100,0 100,0 100,0 100,0
Crédit Agricole CIB (Sweden) Suede France Branche Full 100,0 100,0 100,0 100,0
Crédit Agricole CIB (Taipei) Taiw an France Branche Full 100,0 100,0 100,0 100,0
Crédit Agricole CIB (UK) Royaume-uni France Branche Full 100,0 100,0 100,0 100,0
Crédit Agricole CIB (Vietnam) Vietnam France Branche Full 100,0 100,0 100,0 100,0
Crédit Agricole CIB Algérie Bank Spa Algérie Subsidiary Full 100,0 100,0 100,0 100,0
Crédit Agricole CIB Australia Ltd. Australie Subsidiary Full 100,0 100,0 100,0 100,0
Crédit Agricole CIB China Ltd. Chine Subsidiary Full 100,0 100,0 100,0 100,0
Crédit Agricole CIB S.A. France Subsidiary Full 100,0 100,0 100,0 100,0
Crédit Agricole CIB Services Private Ltd. Inde Subsidiary Full 100,0 100,0 100,0 100,0
Crédit Agricole CIB ZAO Russia Russie Subsidiary Full 100,0 100,0 100,0 100,0
Cube Financial Holding Ltd. S1 - D4 - D6 Royaume-uni Joint venture Equity 0,0 50,0 0,0 50,0
Himalia Plc Royaume-Uni Structured entity Full 100,0 100,0 100,0 100,0
Newedge (Dubai) S2 - D4 - D6 Emirats Arabes Unis France Joint venture Equity 50,0 50,0
Newedge (Francfort) S2 - D3 - D4 - D6 Allemagne France Joint venture Equity 50,0 50,0
Newedge (Genève) S2 - D4 - D6 Suisse France Joint venture Equity 50,0 50,0
Newedge (Honk-Kong) S2 - D4 - D6 Hong-kong France Joint venture Equity 50,0 50,0
Newedge (UK) S2 - D3 - D4 - D6 Royaume-uni France Joint venture Equity 50,0 50,0
Newedge (Zurich) S2 - D4 - D6 Suisse France Joint venture Equity 50,0 50,0
New edge Australia PTY Ltd. S2 - D4 - D6 Australie Joint venture Equity 50,0 50,0
New edge Broker Hong-Kong Ltd. S2 - D4 - D6 Hong-kong Joint venture Equity 50,0 50,0
New edge Broker India PTE Ltd. S2 - D4 - D6 Inde Joint venture Equity 50,0 50,0
New edge Canada Inc. S2 - D4 - D6 Canada Joint venture Equity 50,0 50,0
New edge Facilities Management Inc. S2 - D4 - D6 Etats-Unis Joint venture Equity 50,0 50,0
New edge Financial Hong-Kong Ltd. S2 - D4 - D6 Hong-kong Joint venture Equity 50,0 50,0
New edge Financial Singapore Pte Ltd. S2 - D4 - D6 Singapour Joint venture Equity 50,0 50,0
New edge Group S2 - D4 - D6 France Joint venture Equity 50,0 50,0
New edge Japan Inc. S2 - D4 - D6 Japon Joint venture Equity 50,0 50,0
New edge Representações Ltda. S2 - D4 - D6 Brésil Joint venture Equity 50,0 50,0
New edge UK Financial Ltd. S2 - D4 - D6 Royaume-uni Joint venture Equity 50,0 50,0
New edge USA LLC S2 - D4 - D6 Etats-Unis Joint venture Equity 50,0 50,0
StockbrokersCrédit Agricole Securities Asia BV (Tokyo) Japon Pays-Bas Branche Full 100,0 100,0 100,0 100,0
Investment companiesBanco Crédit Agricole Brasil S.A. Brésil Subsidiary Full 100,0 100,0 100,0 100,0
Calyce Plc Royaume-Uni Structured entity Full 100,0 100,0 100,0 100,0
Clifap France Subsidiary Full 100,0 100,0 100,0 100,0
CLSA Financial Products Ltd Bermudes Structured entity Full 100,0 100,0 100,0 100,0
Compagnie Française de l’Asie (CFA) France Subsidiary Full 100,0 100,0 100,0 100,0
Crédit Agricole CIB Air Finance S.A. France Subsidiary Full 100,0 100,0 100,0 100,0
Crédit Agricole CIB Finance (Guernsey) Ltd. Guernesey Structured entity Full 99,9 99,9 99,9 99,9
Crédit Agricole CIB Financial Prod. (Guernsey) Ltd. Guernesey Structured entity Full 99,9 99,9 99,9 99,9
Crédit Agricole CIB Global Banking France Subsidiary Full 100,0 100,0 100,0 100,0
Crédit Agricole CIB Holdings Ltd. Royaume-Uni Subsidiary Full 100,0 100,0 100,0 100,0
Crédit Agricole Global Partners Inc. Etats-Unis Subsidiary Full 100,0 100,0 100,0 100,0
Crédit Agricole North America Inc. Etats-Unis Subsidiary Full 100,0 100,0 100,0 100,0
Crédit Agricole Securities Asia BV Pays-Bas Subsidiary Full 100,0 100,0 100,0 100,0
% control % interestCrédit Agricole Group
Scope of consolidation(a)
Principal place of business
Country of incorporation if
differentfrom the
principal place of business
Nature of control (b)
Consolidation method
June 30th 2014

Interim condensed consolidated financial statements of Crédit Agricole Group - 30 June 2014
109
June 30th 2014
Dec 31st 2013
June 30th 2014
Dec 31st 2013
Crédit Agricole Securities Taiw an (CAST) Taiw an Subsidiary Full 100,0 100,0 100,0 100,0
Crédit Agricole Securities USA Inc. Etats-Unis Subsidiary Full 100,0 100,0 100,0 100,0
Doumer Finance S.A.S. France Subsidiary Full 100,0 100,0 100,0 100,0
Ester Finance France Subsidiary Full 100,0 100,0 100,0 100,0
Fininvest France Subsidiary Full 98,3 98,3 98,3 98,3
Fletirec France Subsidiary Full 100,0 100,0 100,0 100,0
I.P.F.O. France Subsidiary Full 100,0 100,0 100,0 100,0
Indosuez CM II Inc. Etats-Unis Subsidiary Full 100,0 100,0 100,0 100,0
L.F. Investment Inc. Etats-Unis Subsidiary Full 100,0 100,0 100,0 100,0
L.F. Investment L.P. Etats-Unis Subsidiary Full 100,0 100,0 100,0 100,0
InsuranceCAIRS Assurance S.A. France Subsidiary Full 100,0 100,0 100,0 100,0
OtherAcier Alliage EUR FCC D5 France Structured entity Full 100,0 0,0
Acier Alliage USD FCC D5 Etats-Unis Structured entity Full 100,0 0,0
Armo-Invest France Subsidiary Full 100,0 100,0 99,5 99,5
Atlantic Asset Securitization LLC D5 Etats-Unis Structured entity Full 100,0 0,0
Benelpart Belgique Subsidiary Full 99,0 99,0 98,5 98,5
CAL Conseil Luxembourg Subsidiary Full 100,0 100,0 100,0 100,0
Calciphos France Subsidiary Full 100,0 100,0 99,5 99,5
Calixis Finance France Structured entity Full 100,0 100,0 100,0 100,0
Calliope SRL Italie Structured entity Full 100,0 100,0 100,0 100,0
Crédit Agricole America Services Inc. Etats-Unis Subsidiary Full 100,0 100,0 100,0 100,0
Crédit Agricole Asia Shipf inance Ltd. Hong-Kong Subsidiary Full 100,0 100,0 100,0 100,0
Crédit Agricole CIB Financial Solutions France Structured entity Full 99,6 99,7 99,6 99,7
Crédit Agricole Leasing (USA) Corp. Etats-Unis Subsidiary Full 100,0 100,0 100,0 100,0
Crédit Agricole Private Banking Management Company E2 Luxembourg Subsidiary Full 100,0 100,0
DGAD International SARL Luxembourg Subsidiary Full 100,0 100,0 100,0 100,0
Elipso Finance S.r.l D6 Italie Joint venture Equity 50,0 50,0
ESNI (compartiment Cédit Agricole CIB) E2 France Structured entity Full 100,0 100,0
Eucalyptus FCT D5 France Structured entity Full 100,0 0,0
FCT Cablage FCT D5 France Structured entity Full 100,0 0,0
FIC-FIDC D3 Brésil Structured entity Full 100,0 100,0 100,0 100,0
Financière des Scarabées Belgique Subsidiary Full 100,0 100,0 99,8 99,8
Héphaïstos EUR FCC D5 France Structured entity Full 100,0 0,0
Héphaïstos GBP FCT D5 France Structured entity Full 100,0 0,0
Héphaïstos Multidevises FCT D5 France Structured entity Full 100,0 0,0
Héphaïstos USD FCT D5 France Structured entity Full 100,0 0,0
Immobilière Sirius S.A. Luxembourg Subsidiary Full 100,0 100,0 100,0 100,0
Indosuez Holding SCA II Luxembourg Structured entity Full 100,0 100,0 100,0 100,0
Indosuez Management Luxembourg II Luxembourg Structured entity Full 100,0 100,0 100,0 100,0
Island Ref inancing SRL Italie Structured entity Full 100,0 100,0 100,0 100,0
Lafina Belgique Subsidiary Full 100,0 100,0 98,8 98,8
LMA SA D5 France Structured entity Full 100,0 0,0
Merisma France Structured entity Full 100,0 100,0 100,0 100,0
Miladim France Subsidiary Full 99,0 99,0 99,1 99,1
Molinier Finances France Subsidiary Full 100,0 100,0 98,7 98,7
Pacif ic EUR FCC D5 France Structured entity Full 100,0 0,0
Pacif ic IT FCT D5 France Structured entity Full 100,0 0,0
Pacif ic USD FCT D5 France Structured entity Full 100,0 0,0
Placements et réalisations immobilières (SNC) France Subsidiary Full 100,0 100,0 99,5 99,5
Sagrantino Italy SRL Italie Structured entity Full 100,0 100,0 100,0 100,0
Segemil Luxembourg Subsidiary Full 100,0 100,0 99,5 99,5
Semeru Asia Equity High Yield Fund S2 Iles Cayman Singapour Structured entity Full 0,0 70,9 0,0 70,9
Shark FCC D5 France Structured entity Full 100,0 0,0
SNGI France Subsidiary Full 100,0 100,0 100,0 100,0
SNGI Belgium Belgique Subsidiary Full 100,0 100,0 100,0 100,0
Sococlabecq Belgique Subsidiary Full 100,0 100,0 98,8 98,8
Sof ipac Belgique Subsidiary Full 99,0 99,0 99,5 99,5
TCB France Subsidiary Full 86,5 86,5 99,7 99,7
Transpar Belgique Subsidiary Full 100,0 100,0 99,5 99,5
Triple P FCC D5 France Structured entity Full 100,0 0,0
UBAF D6 France Joint venture Equity 47,0 47,0 47,0 47,0
UBAF (Corée du Sud) D6 Coree du sud France Joint venture Equity 47,0 47,0 47,0 47,0
UBAF (Singapour) D6 Singapour France Joint venture Equity 47,0 47,0 47,0 47,0
UBAF(Japon) D6 Japon France Joint venture Equity 47,0 47,0 47,0 47,0
Vulcain EUR FCT D5 France Structured entity Full 100,0 0,0
Vulcain GBP FCT D5 France Structured entity Full 100,0 0,0
Vulcain USD FCT D5 France Structured entity Full 100,0 0,0
Corporate Centre
Crédit AgricoleCrédit Agricole S.A. France Parent company Parent company 100,0 100,0 100,0 100,0
Branche Credit Agricole SA Royaume uni France Branche Full 100,0 100,0 100,0 100,0
% control % interestCrédit Agricole Group
Scope of consolidation(a)
Principal place of business
Country of incorporation if
differentfrom the
principal place of business
Nature of control (b)
Consolidation method
June 30th 2014

Interim condensed consolidated financial statements of Crédit Agricole Group - 30 June 2014
110
June 30th 2014
Dec 31st 2013
June 30th 2014
Dec 31st 2013
Banking and financial institutionsBFC Antilles Guyane France Subsidiary Full 100,0 100,0 100,0 100,0
Crédit Agricole Home Loan SFH France Subsidiary Full 100,0 100,0 100,0 100,0
Fia-Net France Subsidiary Full 100,0 100,0 100,0 100,0
Foncaris France Subsidiary Full 100,0 100,0 100,0 100,0
Radian France Subsidiary Full 100,0 100,0 100,0 100,0
Sacam Developpement France Subsidiary Full 100,0 100,0 100,0 100,0
Sacam International France Subsidiary Full 100,0 100,0 100,0 100,0
SNC Courcelles S3 France Subsidiary Full 0,0 100,0 0,0 100,0
Investment companiesCrédit Agricole Capital Investissement et Finance (CACIF) France Subsidiary Full 100,0 100,0 100,0 100,0
Delfinances France Subsidiary Full 100,0 100,0 100,0 100,0
Eurazeo France Associate Equity 21,6 21,4 14,8 14,8
S.A.S. La Boetie France Subsidiary Full 100,0 100,0 100,0 100,0
Sacam Assurances Cautions France Subsidiary Full 100,0 100,0 100,0 100,0
Sacam Fia Net Europe France Subsidiary Full 100,0 100,0 100,0 100,0
Sacam Participations France Subsidiary Full 100,0 100,0 100,0 100,0
Sodica France Subsidiary Full 100,0 100,0 100,0 100,0
OtherCA Grands Crus France Subsidiary Full 100,0 100,0 100,0 100,0
CA Preferred Funding LLC Etats-Unis Subsidiary Full 100,0 100,0 6,5 6,5
CPR Holding (CPRH) S5 France Subsidiary Full 100,0 100,0
Crédit Agricole Cards & Payments France Subsidiary Full 100,0 100,0 100,0 100,0
Crédit Agricole Immobilier D2 France Subsidiary Full 100,0 100,0 100,0 100,0
Crédit Agricole Immobilier Facilities D2 France Subsidiary Full 100,0 100,0 100,0 100,0
Crédit Agricole Public Sector SCF France Subsidiary Full 100,0 100,0 100,0 100,0
FCT Evergreen HL 1 France Subsidiary Full 100,0 100,0 100,0 100,0
Fia Net Europe Luxembourg Subsidiary Full 100,0 100,0 100,0 100,0
Finasic France Subsidiary Full 100,0 100,0 100,0 100,0
S.A.S. Evergreen Montrouge France Subsidiary Full 100,0 100,0 100,0 100,0
S.A.S. Sacam Avenir France Subsidiary Full 100,0 100,0 100,0 100,0
SCI D2 CAM France Subsidiary Full 100,0 100,0 100,0 100,0
SCI Quentyvel France Subsidiary Full 100,0 100,0 100,0 100,0
SILCA France Subsidiary Full 100,0 100,0 99,4 99,4
SIS (Société Immobilière de la Seine) France Subsidiary Full 100,0 100,0 100,0 100,0
UI Vavin 1 France Subsidiary Full 100,0 100,0 100,0 100,0
Unibiens France Subsidiary Full 100,0 100,0 100,0 100,0
Uni-Edition France Subsidiary Full 100,0 100,0 100,0 100,0
Tourism - property developmentCrédit Agricole Immobilier Entreprise France Subsidiary Full 100,0 100,0 100,0 100,0
Crédit Agricole Immobilier Résidentiel France Subsidiary Full 100,0 100,0 100,0 100,0
Monné-Decroix Gestion S.A.S. France Subsidiary Full 100,0 100,0 100,0 100,0
Monné-Decroix Résidences S.A.S. France Subsidiary Full 100,0 100,0 100,0 100,0
Selexia S.A.S. France Subsidiary Full 100,0 100,0 100,0 100,0
SNC Alsace France Subsidiary Full 100,0 100,0 100,0 100,0
SNC Eole France Subsidiary Full 100,0 100,0 100,0 100,0
Branches are mentioned in italic
(a) Scope changes
Inclusions (E) into the scope of consolidation :
E1 : Breach of threshold
E2 : Creation
E3 : Acquisition (including controlling interests)
Exclusions (S) from the scope of consolidation :
S1 : Discontinuation of business (including dissolution and liquidation)
S2 : Sale to non-Group companies or deconsolidation following loss of control
S3 : Deconsolidated due to non-materiality
S4 : Merger or takeover
S5 : Transfer of all assets and liabilities
Other :
D1 : Change of company name
D2 : Change in consolidation method
D3 : First time listed in the Note on scope of consolidation
D4 : IFRS 5 entities
D5 : Inclusion into the scope in application of IFRS 10
D6 : Change in the consolidation method in application of IFRS 11
(b) Nature of control
Subsidiary
Structured entity
Joint venture
Structured joint venture
Joint operation
Associate
Branche
Structured associate
% control % interestCrédit Agricole Group
Scope of consolidation(a)
Principal place of business
Country of incorporation if
differentfrom the
principal place of business
Nature of control (b)
Consolidation method
June 30th 2014