Embed Size (px)
Citation preview

Group
Group
level
weightage
S. No Dimension KPI Weightage TargetTarget
Achieved
Marks
Achieved
Weighted
Score
Good Very Good Excellent
1Financial CFA Revenue - Basic (LL, PCO,IN,USO rural phones/VPT subsidy in lieu of
ADC, VAS, etc.) (Rs. Cr.)20%
7.400 4.44 5.92 7.40
2 Financial CFA Revenue - Broadband (including VAS, IPTV) (Rs. Cr.) 20% 4.00 2.40 3.20 4.00
3Customer / Market Net adds - (by number of subscribers) Basic (in 000's)
5%0.395 0.24 0.32 0.40
4Customer / Market Net adds - (by number of subscribers) Broadband (in 000's)
7.5%2 1.20 1.60 2
5Customer / Market Customer satisfaction level (including QoS) (Scale of 1 to 5)
7.5%5 3 4 5
6Operations
CCR rate for Landline – local 2% 66.90% 60.00% 63.10% 66.90%
7Operations
CCR rate for Landline – Junction 2% 63.50% 56.90% 59.90% 63.50%
8Operations
CCR rate for Landline – STD 2% 53.40% 48.30% 50.80% 53.40%
9Operations
Fault rate (LL) 2.0% 4.00% 4.80% 4.60% 4.00%
10Operations
Fault rate (BB) 2.0% 5% 6% 5.25% 5%
11Operations
% of faults cleared on same day (LL) 1% 80% 71.40% 75.2% 80%
12Operations
% of faults cleared by the following day (LL) 1% 91.5% 82.70% 87.10% 91.50%
13Operations
% of faults cleared within 3 days (LL) 1% 100% 92.15% 98.00% 100%
14Operations
% of faults cleared on same day (BB) 1% 50% 46% 49% 50%
15Operations
% of faults cleared by the following day (BB) 1% 90% 82% 88% 90%
16Operations % of new services (LL,) provisioned in area on demand within the norm (7
days for LL)2% 100% 93.10% 98.00% 100%
17 Operations % LL local shift with in 3 days 1% 100% 91.10% 96.00% 100%
18Operations
% LL Inter-exchange shift with in 5 days 1% 100% 90.25% 95.00% 100%
19Operations % of new services ( BB) provisioned within the ( 7 days for BB)(Subject To
technical feasibility)5% 77% 70.00% 75.00% 77%
20 Operations CDR system based Customer care and monitoring mechanism 5.0% 5 3 4 5
21 Operations Acessibility of call centre 1.0% 99.75 93 98 99.75
22Overall
performance Overall performance (on scale of 1 to 5 - to be assessed by CMD) 10% 5 3 4 5
Group Performance Management System (2011-12)
A & N Territorial Circle
Scorecard
Performance Levels1
Consumer
Fixed Access20%
A&N Territorial Circle Page 1 of 52

Group
Group
level
weightage
S. No Dimension KPI Weightage TargetTarget
Achieved
Marks
Achieved
Weighted
Score
Good Very Good Excellent
Performance Levels1
23 Financial CM revenue (Rs. Cr.) 40% 55.07 33.04 44.06 55.07
24Customer / Market CM Net adds - GSM (by number of subscribers) (in 000's) 13% 53.00 31.80 42.40 53.00
25Customer / Market CM Net adds - CDMA (by number of subscribers) (in 000's) 2% 42.2 25.32 33.76 42.20
26Customer / Market CM Net adds - WiMAX (by number of subscribers) (in 000's) 5% 0.00 0.00 0.00 0.00
27 Operations BTS availability (%) 10% 98% 96% 97% 98%
28 Operations Call drop rate (%) 10% 2% 2.5% 2.2% 2%
29 Operations Blocked call rate - TCH congestion (%) 10% 2% 2.5% 2.2% 2%
30Operations Overall performance (on scale of 1 to 5 - to be assessed by Director - CM) 10% 5 3 4 5
31Financial Enterprise BU revenue (Rs. Cr.) 40% 5.92 3.55 4.74 5.92
32Customer / Market Number of new Enterprise Gold accounts penetrated 20% 0 0 0 0
33Operations MLLN / MPLS network uptime (%) 15% 98% 96% 97% 98%
34Operations Average provisioning time for leased circuits(no. of days) 15% 30 90 60 30
35Operations Overall performance (on scale of 1 to 5 - to be assessed by Director -
Enterprise)
10% 5 3 4 5
36 Financial Gross margin 20%
37 Financial Gross sales 30%
38 Financial PBIT/Employment 20%
39 Financial Operating ratio (%) 20%
40Financial Budget adherence on opex (% actual spend vs. budgeted) (on items
excluding those in schedule P)
10%
41 Financial New Businesses revenue (Rs. Cr.) 15% 0.01 0.005 0.0075 0.01
42Customer / Market Customer satisfaction level (including QoS) (Scale of 1 to 5) 20% 5 3 4 5
43
Financial Overall assessment on Finance related issues, including budget adherence,
financial planning, accounting, revenue assurance etc. (on scale of 1 to 5 - to
be assessed by Dir-Finance)
15% 5 3 4 5
44Employee
development
Overall assessment on HR related issues, including training, recruiting,
promotion, transfers etc. (on scale of 1 to 5 - to be assessed by Dir-HR)
20% 5 3 4 5
45Overall
assessment
Overall performance (on scale of 1 to 5 - to be assessed by CMD) 30% 5 3 4 5
1. Marks for Good rating = 60, Very Good = 80, Excellent = 100. Marks achieved for rating below Good = 0. Achievement between Good and Very Good and between Very Good and Excellent would be linearly scaled
CFA - CO Nodal designate: Mr. Tarun Kumar (Sr.GM, BP - CFA)
CA- CO Nodal designate: Mr. H. N. Singh (Sr. GM, MM-CA)
New Businesses - CO Nodal designate: Mr. Abdul Mazid (Sr.GM, TF - NB)
HR - CO Nodal designate: Mr. Neeraj Verma (GM, Training)
Finance - CO Nodal designate: Mr. KCGK Pillai (PGM,PF & Finance Personnel)
Note: i) Assessment by CMD and all directors of the BSNL board will be based on qualitative measures defined for the parameters
Consumer
Mobility25%
Overall
Financial
Performance
30%
Others 10%
CM - CO Nodal designate: Mr. B.N. Mishra (Sr.GM, Product & Pricing)
Enterprise - CO Nodal designate: Mr. S. K. Seth
(Sr. GM, Business Planning)
Enterprise 15%
A&N Territorial Circle Page 2 of 52

Group
Group
level
weightage
S. No. Dimension KPI Weightage TargetTarget
Achieved
Marks
Achieved
Weighted
Score
Good Very Good Excellent
60 80 100
1 Financial CFA Revenue - Basic (LL, PCO,IN,USO rural phones/VPT subsidy in lieu
of ADC, VAS, etc.) (Rs. Cr.)
20% 661.000 396.60 528.80 661.00
2 Financial CFA Revenue - Broadband (including VAS, IPTV) (Rs. Cr.) 20% 489.00 293.40 391.20 489.00
3 Customer /
Market
Net adds - (by number of subscribers) Basic (in 000's) 5% 47.499 28.50 38.00 47.50
4 Customer /
Market
Net adds - (by number of subscribers) Broadband (in 000's) 7.5% 410 246.00 328.00 410
5 Customer / Customer satisfaction level (including QoS) (Scale of 1 to 5) 7.5% 5 3 4 5
6Customer /
Market
Survey of Customers by an indepenedent agency in Hyderabad, Banglore,
Chennai & Kolkata having landline from BSNL& Broadband from any
other agency by 31st Jan 2012(Delay in Days)
2.5%31/01/12 31/03/12 31/01/12
7 Operations CCR rate for Landline – local 2% 70.80% 63.50% 66.80% 70.80%
8 Operations CCR rate for Landline – Junction 2% 62.50% 56.00% 59.00% 62.50%
9 Operations CCR rate for Landline – STD 2% 56.50% 51.10% 53.80% 56.50%
10 Operations Fault rate (LL) 2.0% 4.10% 5.00% 4.70% 4.10%
11 Operations Fault rate (BB) 2.0% 4% 4.50 4.25 4.00
12 Operations % of faults cleared on same day (LL) 1% 81% 72.30% 76.1% 81%
13 Operations % of faults cleared by the following day (LL) 1% 95.5% 86.30% 90.90% 95.50%
14 Operations % of faults cleared within 3 days (LL) 1% 100% 92.15% 98.00% 100%
15 Operations % of faults cleared on same day (BB) 1% 60% 56% 59% 60%
16 Operations % of faults cleared by the following day (BB) 1% 92% 85% 90% 92%
17Operations % of new services (LL,) provisioned in area on demand within the norm (7
days for LL)2% 100% 92.00% 98.00% 100%
18 Operations % LL local shift with in 3 days 1% 100% 92.00% 98.00% 100%
19 Operations % LL Inter-exchange shift with in 5 days 1% 100% 92.00% 98.00% 100%
20Operations % of new services ( BB) provisioned within the ( 7 days for BB)(Subject To
technical feasibility)5% 87% 80.00% 85.00% 87%
21 Operations Establisment of Data centers 2% 5% 3.00% 4.00% 5%
22 Operations CDR system based Customer care and monitoring mechanism 5.0% 5 3 4 5
23 Operations Acessibility of call centre 1.0% 99.75 93 98 99.75
24Operations
% of Calls answered by the operator (voice to voice ) within 60 seconds 1.0% 99.75 93 98 99.75
25Overall
performance Overall performance (on scale of 1 to 5 - to be assessed by CMD) 10% 5 3 4 5
23 Financial CM revenue (Rs. Cr.) 40% 1384.65 830.79 1107.72 1384.65
24 Customer /
Market
CM Net adds - GSM (by number of subscribers) (in 000's) 13% 1894.00 1136.40 1515.20 1894.00
25 Customer /
Market
CM Net adds - CDMA (by number of subscribers) (in 000's) 2% 27.03 16.22 21.62 27.03
26 Customer / CM Net adds - WiMAX (by number of subscribers) (in 000's) 5% 56.40 33.84 45.12 56.40
27 Operations BTS availability (%) 10% 98% 96% 97% 98%
28 Operations Call drop rate (%) 10% 2% 2.5% 2.2% 2%
29 Operations Blocked call rate - TCH congestion (%) 10% 2% 2.5% 2.2% 2%
30Operations Overall performance (on scale of 1 to 5 - to be assessed by Director - CM) 10% 5 3 4 5
Consumer
Mobility25%
Group Performance Management System (2011-12)
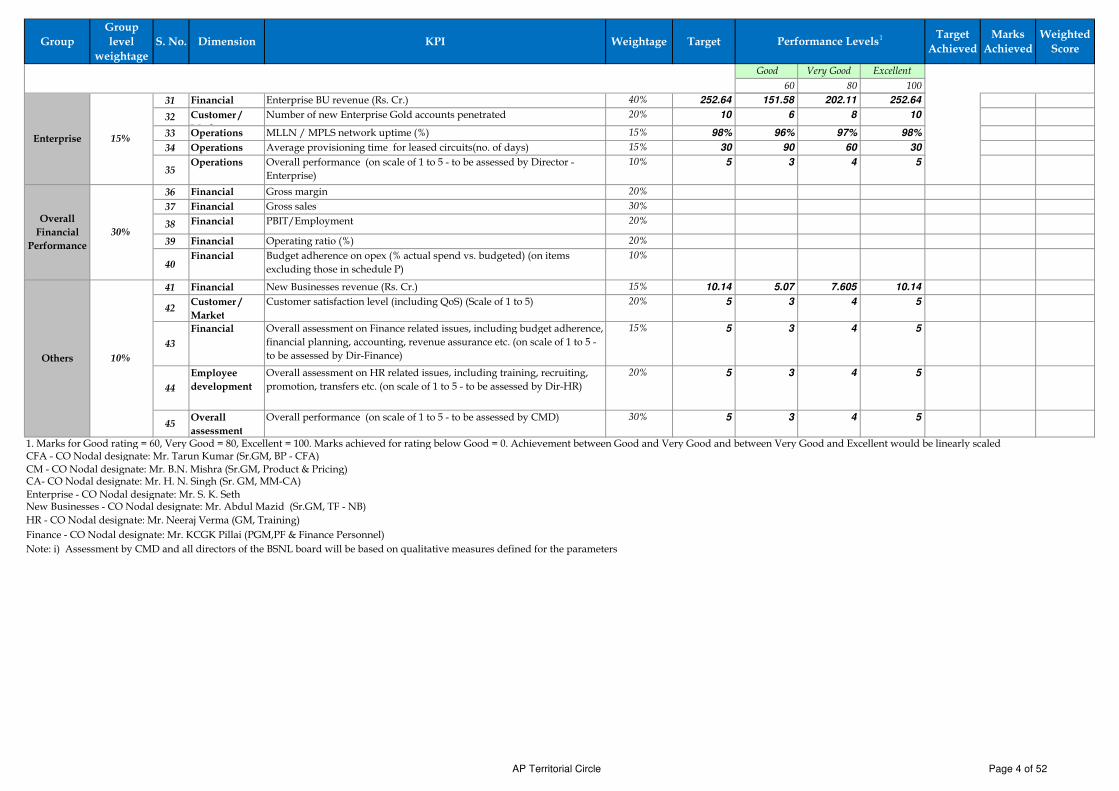
AP Territorial Circle
Scorecard
Performance Levels1
Consumer
Fixed Access20%
AP Territorial Circle Page 3 of 52
Group
Group
level
weightage
S. No. Dimension KPI Weightage TargetTarget
Achieved
Marks
Achieved
Weighted
Score
Good Very Good Excellent
60 80 100
Performance Levels1
31 Financial Enterprise BU revenue (Rs. Cr.) 40% 252.64 151.58 202.11 252.64
32 Customer /
Market
Number of new Enterprise Gold accounts penetrated 20% 10 6 8 10
33 Operations MLLN / MPLS network uptime (%) 15% 98% 96% 97% 98%
34 Operations Average provisioning time for leased circuits(no. of days) 15% 30 90 60 30
35Operations Overall performance (on scale of 1 to 5 - to be assessed by Director -
Enterprise)
10% 5 3 4 5
36 Financial Gross margin 20%
37 Financial Gross sales 30%
38 Financial PBIT/Employment 20%
39 Financial Operating ratio (%) 20%
40Financial Budget adherence on opex (% actual spend vs. budgeted) (on items
excluding those in schedule P)
10%
41 Financial New Businesses revenue (Rs. Cr.) 15% 10.14 5.07 7.605 10.14
42Customer /
Market
Customer satisfaction level (including QoS) (Scale of 1 to 5) 20% 5 3 4 5
43
Financial Overall assessment on Finance related issues, including budget adherence,
financial planning, accounting, revenue assurance etc. (on scale of 1 to 5 -
to be assessed by Dir-Finance)
15% 5 3 4 5
44
Employee
development
Overall assessment on HR related issues, including training, recruiting,
promotion, transfers etc. (on scale of 1 to 5 - to be assessed by Dir-HR)
20% 5 3 4 5
45Overall
assessment
Overall performance (on scale of 1 to 5 - to be assessed by CMD) 30% 5 3 4 5
1. Marks for Good rating = 60, Very Good = 80, Excellent = 100. Marks achieved for rating below Good = 0. Achievement between Good and Very Good and between Very Good and Excellent would be linearly scaled CFA - CO Nodal designate: Mr. Tarun Kumar (Sr.GM, BP - CFA)
CA- CO Nodal designate: Mr. H. N. Singh (Sr. GM, MM-CA)
New Businesses - CO Nodal designate: Mr. Abdul Mazid (Sr.GM, TF - NB)
HR - CO Nodal designate: Mr. Neeraj Verma (GM, Training)
Finance - CO Nodal designate: Mr. KCGK Pillai (PGM,PF & Finance Personnel)
Note: i) Assessment by CMD and all directors of the BSNL board will be based on qualitative measures defined for the parameters
Others 10%
CM - CO Nodal designate: Mr. B.N. Mishra (Sr.GM, Product & Pricing)
Enterprise - CO Nodal designate: Mr. S. K. Seth
Enterprise 15%
Overall
Financial
Performance
30%
AP Territorial Circle Page 4 of 52

Group
Group
level
weightage
S. No. Dimension KPI Weightage TargetTarget
Achieved
Marks
Achieved
Weighted
Score
Good Very Good Excellent
60 80 100
1 Financial CFA Revenue - Basic (LL, PCO,IN,USO rural phones/VPT subsidy in
lieu of ADC, VAS, etc.) (Rs. Cr.)
20% 79.000 47.40 63.20 79.00
2 Financial CFA Revenue - Broadband (including VAS, IPTV) (Rs. Cr.) 20% 55.00 33.00 44.00 55.00
3Customer /
Market
Net adds - (by number of subscribers) Basic (in 000's)5%
6.043 3.63 4.83 6.04
4Customer /
Market
Net adds - (by number of subscribers) Broadband (in 000's)7.5%
36 21.60 28.80 36
5Customer /
Market
Customer satisfaction level (including QoS) (Scale of 1 to 5)7.5%
5 3 4 5
6 Operations CCR rate for Landline – local 2% 68.80% 61.70% 64.00% 68.80%
7 Operations CCR rate for Landline – Junction 2% 60.00% 53.80% 56.60% 60.00%
8 Operations CCR rate for Landline – STD 2% 55.00% 49.70% 52.30% 55.00%
9 Operations Fault rate (LL) 2.0% 4.50% 5.40% 5.20% 4.50%
10 Operations Fault rate (BB) 2.0% 4.50 5.00 4.75 4.50
11 Operations % of faults cleared on same day (LL) 1% 90% 80.30% 84.6% 90%
12Operations
% of faults cleared by the following day (LL) 1% 97.0% 87.70% 92.30% 97.00%
13 Operations % of faults cleared within 3 days (LL) 1% 100% 92.15% 98.00% 100%
14 Operations % of faults cleared on same day (BB) 1% 55% 50% 54% 55%
15 Operations % of faults cleared by the following day (BB) 1% 92% 85% 90% 92%
16Operations % of new services (LL,) provisioned in area on demand within the norm
(7 days for LL)2% 100% 93.10% 98.00% 100%
17 Operations % LL local shift with in 3 days 1% 100% 91.10% 96.00% 100%
18 Operations % LL Inter-exchange shift with in 5 days 1% 100% 90.25% 95.00% 100%
19Operations % of new services ( BB) provisioned within the ( 7 days for BB)(Subject
To technical feasibility)5% 82% 75.00% 80.00% 82%
20 Operations CDR system based Customer care and monitoring mechanism 4.0% 5 3 4 5
21 Operations Acessibility of call centre 1.0% 99.75% 93.00% 98.00% 99.75%
22 Operations % of Calls answered by the operator(voice to voice ) within 60 seconds 1.0% 99.75% 93.00% 98.00% 99.75%
23Overall
performance Overall performance (on scale of 1 to 5 - to be assessed by CMD) 10% 5 3 4 5
24 Financial CM revenue (Rs. Cr.) 40% 445.73 267.44 356.58 445.73
25Customer /
Market
CM Net adds - GSM (by number of subscribers) (in 000's) 13% 277.00 166.20 221.60 277.00
26Customer /
Market
CM Net adds - CDMA (by number of subscribers) (in 000's) 2% 17.63 10.58 14.10 17.63
27Customer /
Market
CM Net adds - WiMAX (by number of subscribers) (in 000's) 5% 12.50 7.50 10.00 12.50
28 Operations BTS availability (%) 10% 98% 96% 97% 98%
29 Operations Call drop rate (%) 10% 2% 2.5% 2.2% 2%
30 Operations Blocked call rate - TCH congestion (%) 10% 2% 2.5% 2.2% 2%
31Operations Overall performance (on scale of 1 to 5 - to be assessed by Director - CM) 10% 5 3 4 5
Consumer
Mobility25%
Group Performance Management System ( 2011-12)
Assam Territorial Circle
Scorecard
Performance Levels1
Consumer
Fixed Access20%
Assam Territorial Circle Page 5 of 52

Group
Group
level
weightage
S. No. Dimension KPI Weightage TargetTarget
Achieved
Marks
Achieved
Weighted
Score
Good Very Good Excellent
60 80 100
Performance Levels1
32 Financial Enterprise BU revenue (Rs. Cr.) 40% 23.57 14.14 18.86 23.57
33Customer /
Market
Number of new Enterprise Gold accounts penetrated 20% 2 1 1 2
34Operations MLLN / MPLS network uptime (%) 15% 98% 96% 97% 98%
35 Operations Average provisioning time for leased circuits(no. of days) 15% 30 90 60 30
36Operations Overall performance (on scale of 1 to 5 - to be assessed by Director -
Enterprise)
10% 5 3 4 5
37 Financial Gross margin 20%
38 Financial Gross sales 30%
39 Financial PBIT/Employment 20%
40 Financial Operating ratio (%) 20%
41Financial Budget adherence on opex (% actual spend vs. budgeted) (on items
excluding those in schedule P)
10%
42 Financial New Businesses revenue (Rs. Cr.) 15% 4.01 2.005 3.0075 4.01
43Customer /
Market
Customer satisfaction level (including QoS) (Scale of 1 to 5) 20% 5 3 4 5
44
Financial Overall assessment on Finance related issues, including budget
adherence, financial planning, accounting, revenue assurance etc. (on
scale of 1 to 5 - to be assessed by Dir-Finance)
15% 5 3 4 5
45
Employee
development
Overall assessment on HR related issues, including training, recruiting,
promotion, transfers etc. (on scale of 1 to 5 - to be assessed by Dir-HR)
20% 5 3 4 5
46Overall
assessment
Overall performance (on scale of 1 to 5 - to be assessed by CMD) 30% 5 3 4 5
1. Marks for Good rating = 60, Very Good = 80, Excellent = 100. Marks achieved for rating below Good = 0. Achievement between Good and Very Good and between Very Good and Excellent would be linearly scaled CFA - CO Nodal designate: Mr. Tarun Kumar (Sr.GM, BP - CFA)
CA- CO Nodal designate: Mr. H. N. Singh (Sr. GM, MM-CA)
New Businesses - CO Nodal designate: Mr. Abdul Mazid (Sr.GM, TF - NB)
HR - CO Nodal designate: Mr. Neeraj Verma (GM, Training)
Finance - CO Nodal designate: Mr. KCGK Pillai (PGM,PF & Finance Personnel)
Note: i) Assessment by CMD and all directors of the BSNL board will be based on qualitative measures defined for the parameters
Others 10%
CM - CO Nodal designate: Mr. B.N. Mishra (Sr.GM, Product & Pricing)
Enterprise - CO Nodal designate: Mr. S. K. Seth
(Sr. GM, Business Planning)
Enterprise 15%
Overall
Financial
Performance
30%
Assam Territorial Circle Page 6 of 52

Group
Group
level
weightage
S. No. Dimension KPI Weightage TargetTarget
Achieved
Marks
Achieved
Weighted
Score
Good Very Good Excellent
60 80 100
1 Financial CFA Revenue - Basic (LL, PCO,IN,USO rural phones/VPT subsidy in lieu
of ADC, VAS, etc.) (Rs. Cr.)
20% 98.000 58.80 78.40 98.00
2 Financial CFA Revenue - Broadband (including VAS, IPTV) (Rs. Cr.) 20% 51.00 30.60 40.80 51.00
3Customer /
Market
Net adds - (by number of subscribers) Basic (in 000's)5%
22.758 13.65 18.21 22.76
4Customer /
Market
Net adds - (by number of subscribers) Broadband (in 000's)7.5%
53.50 32.10 42.80 54
5Customer /
Market
Customer satisfaction level (including QoS) (Scale of 1 to 5)7.5%
5 3 4 5
6 Operations CCR rate for Landline – local 2% 69.00% 61.90% 65.10% 69.00%
7 Operations CCR rate for Landline – Junction 2% 62.50% 56.00% 59.00% 62.50%
8 Operations CCR rate for Landline – STD 2% 53.40% 48.30% 50.80% 53.40%
9 Operations Fault rate (LL) 2.0% 3.40% 4.10% 3.90% 3.40%
10 Operations Fault rate (BB) 2.0% 4.50 5.00 4.75 4.50
11 Operations % of faults cleared on same day (LL) 1% 86% 76.80% 80.8% 86%
12 Operations % of faults cleared by the following day (LL) 1% 94.5% 85.40% 89.90% 94.50%
13 Operations % of faults cleared within 3 days (LL) 1% 100% 92.15% 98.00% 100%
14 Operations % of faults cleared on same day (BB) 1% 55% 50% 54% 55%
15 Operations % of faults cleared by the following day (BB) 1% 92% 85% 90% 92%
16Operations % of new services (LL,) provisioned in area on demand within the norm (7
days for LL)2% 100% 93.10% 98.00% 100%
17 Operations % LL local shift with in 3 days 1% 100% 91.10% 96.00% 100%
18 Operations % LL Inter-exchange shift with in 5 days 1% 100% 90.25% 95.00% 100%
19Operations % of new services ( BB) provisioned within the ( 7 days for BB)(Subject To
technical feasibility)5% 82% 75.00% 80.00% 82%
20 Operations CDR system based Customer care and monitoring mechanism 4.0% 5 3 4 5
21 Operations Acessibility of call centre 1.0% 99.75% 93.00% 98.00% 99.75%
22 Operations % of Calls answered by the operator(voice to voice ) within 60 seconds 1.0% 99.75% 93.00% 98.00% 99.75%
23Overall
performance Overall performance (on scale of 1 to 5 - to be assessed by CMD) 10% 5 3 4 5
17 Financial CM revenue (Rs. Cr.) 40% 464.90 278.94 371.92 464.90
18Customer /
Market
CM Net adds - GSM (by number of subscribers) (in 000's) 13% 928 556.80 742.40 928.00
19Customer /
Market
CM Net adds - CDMA (by number of subscribers) (in 000's) 2% 28.84 17.30 23.07 28.84
20Customer /
Market
CM Net adds - WiMAX (by number of subscribers) (in 000's) 5% 34.15 20.49 27.32 34.15
21 Operations BTS availability (%) 10% 98% 96% 97% 98%
22 Operations Call drop rate (%) 10% 2.0% 2.5% 2.2% 2.0%
23 Operations Blocked call rate - TCH congestion (%) 10% 2.0% 2.5% 2.2% 2.0%
24Operations Overall performance (on scale of 1 to 5 - to be assessed by Director - CM) 10% 5 3 4 5
Consumer
Mobility25%
Group Performance Management System (2011-12)
Bihar Territorial CircleScorecard
Performance Levels1
Consumer
Fixed Access20%
Bihar Territorial Circle Page 7 of 52

Group
Group
level
weightage
S. No. Dimension KPI Weightage TargetTarget
Achieved
Marks
Achieved
Weighted
Score
Good Very Good Excellent
60 80 100
Performance Levels1
25 Financial Enterprise BU revenue (Rs. Cr.) 40% 55.84 33.29 44.38 55.48
26Customer /
Market
Number of new Enterprise Gold accounts penetrated 20% 3 1 2 3
27 Operations MLLN / MPLS network uptime (%) 15% 98% 96% 97% 98%
28 Operations Average provisioning time for leased circuits(no. of days) 15% 30 90 60 30
29Operations Overall performance (on scale of 1 to 5 - to be assessed by Director -
Enterprise)
10% 5 3 4 5
37 Financial Gross margin 20%
38 Financial Gross sales 30%
39 Financial PBIT/Employment 20%
40 Financial Operating ratio (%) 20%
41Financial Budget adherence on opex (% actual spend vs. budgeted) (on items
excluding those in schedule P)
10%
42 Financial New Businesses revenue (Rs. Cr.) 15% 4.81 2.405 3.6075 4.81
43Customer /
Market
Customer satisfaction level (including QoS) (Scale of 1 to 5) 20% 5 3 4 5
44
Financial Overall assessment on Finance related issues, including budget adherence,
financial planning, accounting, revenue assurance etc. (on scale of 1 to 5 -
to be assessed by Dir-Finance)
15% 5 3 4 5
45Employee
development
Overall assessment on HR related issues, including training, recruiting,
promotion, transfers etc. (on scale of 1 to 5 - to be assessed by Dir-HR)
20% 5 3 4 5
46Overall
assessment
Overall performance (on scale of 1 to 5 - to be assessed by CMD) 30% 5 3 4 5
1. Marks for Good rating = 60, Very Good = 80, Excellent = 100. Marks achieved for rating below Good = 0. Achievement between Good and Very Good and between Very Good and Excellent would be linearly scaled CFA - CO Nodal designate: Mr. Tarun Kumar (Sr.GM, BP - CFA)
CA- CO Nodal designate: Mr. H. N. Singh (Sr. GM, MM-CA)
New Businesses - CO Nodal designate: Mr. Abdul Mazid (Sr.GM, TF - NB)
HR - CO Nodal designate: Mr. Neeraj Verma (GM, Training)
Finance - CO Nodal designate: Mr. KCGK Pillai (PGM,PF & Finance Personnel)
Note: i) Assessment by CMD and all directors of the BSNL board will be based on qualitative measures defined for the parameters
Others 10%
CM - CO Nodal designate: Mr. B.N. Mishra (Sr.GM, Product & Pricing)
Enterprise - CO Nodal designate: Mr. S. K. Seth
Enterprise 15%
Overall
Financial
Performance
30%
Bihar Territorial Circle Page 8 of 52

Group
Group
level
weightage
S. No. Dimension KPI Weightage Target
Performa
nce
Levels1
Target
Achieved
Marks
Achieved
Weighted
Score
Good Very Good Excellent
60% 80% 100%
1Financial CFA Revenue - Basic (LL, PCO,IN,USO rural phones/VPT subsidy in lieu
of ADC, VAS, etc.) (Rs. Cr.)20%
60.000 36.00 48.00 60.00
2 Financial CFA Revenue - Broadband (including VAS, IPTV) (Rs. Cr.) 20% 48.00 28.80 38.40 48.00
3Customer /
Market
Net adds - (by number of subscribers) Basic (in 000's)5%
3.612 2.17 2.89 3.61
4Customer /
Market
Net adds - (by number of subscribers) Broadband (in 000's)7.5%
28 16.80 22.40 28
5Customer /
Market
Customer satisfaction level (including QoS) (Scale of 1 to 5)7.5%
5 3 4 5
6 Operations CCR rate for Landline – local 2% 69.50% 62.30% 65.60% 69.50%
7 Operations CCR rate for Landline – Junction 2% 60.00% 53.80% 56.60% 60.00%
8 Operations CCR rate for Landline – STD 2% 53.40% 48.30% 50.80% 53.40%
9 Operations Fault rate (LL) 2.0% 5.00% 6.00% 5.80% 5.00%
10 Operations Fault rate (BB) 2.0% 4.50 5.00 4.75 4.50
11 Operations % of faults cleared on same day (LL) 1% 92% 82.10% 86.4% 92%
12 Operations % of faults cleared by the following day (LL) 1% 97.5% 88.10% 92.80% 97.50%
13 Operations % of faults cleared within 3 days (LL) 1% 100% 92.15% 98.00% 100%
14 Operations % of faults cleared on same day (BB) 1% 55% 50% 54% 55%
15 Operations % of faults cleared by the following day (BB) 1% 92% 85% 90% 92%
16Operations % of new services (LL,) provisioned in area on demand within the norm (7
days for LL)2% 100% 93.10% 98.00% 100%
17 Operations % LL local shift with in 3 days 1% 100% 91.10% 96.00% 100%
18 Operations % LL Inter-exchange shift with in 5 days 1% 100% 90.25% 95.00% 100%
19Operations % of new services ( BB) provisioned within the ( 7 days for BB)(Subject To
technical feasibility)5% 82% 75.00% 80.00% 82%
20 Operations CDR system based Customer care and monitoring mechanism 4.0% 5 3 4 5
21 Operations Acessibility of call centre 1.0% 99.75% 93.00% 98.00% 99.75%
22 Operations % of Calls answered by the operator(voice to voice ) within 60 seconds 1.0% 99.75% 93.00% 98.00% 99.75%
23Overall
performance Overall performance (on scale of 1 to 5 - to be assessed by CMD) 5% 5 3 4 5
24 Financial CM revenue (Rs. Cr.) 40% 235.75 141.45 188.60 235.75
25Customer /
Market
CM Net adds - GSM (by number of subscribers) (in 000's) 13% 262 366.30 386.65 407
26Customer /
Market
CM Net adds - CDMA (by number of subscribers) (in 000's) 2% 12.85 30.60 32.30 34
27Customer /
Market
CM Net adds -WiMAX (by number of subscribers) (in 000's) 7% 16.20 9.72 12.96 16.20
28 Operations BTS availability (%) 10% 98% 96% 97% 98%
29 Operations Call drop rate (%) 10% 2% 2.5% 2.2% 2%
30 Operations Blocked call rate - TCH congestion (%) 10% 2% 2.5% 2.2% 2%
31Operations Overall performance (on scale of 1 to 5 - to be assessed by Director - CM) 10% 5 3 4 5
Group Performance Management System (2011-12)
Chattisgarh Territorial Circle
Scorecard
Consumer
Fixed Access20%
Consumer
Mobility25%
Chattisgarh Territorial Circle Page 9 of 52

Group
Group
level
weightage
S. No. Dimension KPI Weightage Target
Performa
nce
Levels1
Target
Achieved
Marks
Achieved
Weighted
Score
Good Very Good Excellent
60% 80% 100%
32 Financial Enterprise BU revenue (Rs. Cr.) 40% 20 12 16 20
33Customer /
Market
Number of new Enterprise Gold accounts penetrated 20% 5 3 4 5
34Operations MLLN / MPLS network uptime (%) 15% 98% 96% 97% 98%
35Operations Average provisioning time for leased circuits(no. of days) 15% 30 90 60 30
36Operations Overall performance (on scale of 1 to 5 - to be assessed by Director -
Enterprise)
10% 5 3 4 5
37Financial Gross margin 20%
38Financial Gross sales 30%
39Financial PBIT/Employment 20%
40 Financial Operating ratio (%) 20%
41Financial Budget adherence on opex (% actual spend vs. budgeted) (on items
excluding those in schedule P)
10%
42Financial New Businesses revenue (Rs. Cr.) 15% 3.73 1.865 2.7975 3.73
43Customer /
Market
Customer satisfaction level (including QoS) (Scale of 1 to 5) 20% 5 3 4 5
44
Financial Overall assessment on Finance related issues, including budget
adherence, financial planning, accounting, revenue assurance etc. (on
scale of 1 to 5 - to be assessed by Dir-Finance)
15% 5 3 4 5
45
Employee
development
Overall assessment on HR related issues, including training, recruiting,
promotion, transfers etc. (on scale of 1 to 5 - to be assessed by Dir-HR)
20% 5 3 4 5
46Overall
assessment
Overall performance (on scale of 1 to 5 - to be assessed by CMD) 30% 5 3 4 5
1. Marks for Good rating = 60, Very Good = 80, Excellent = 100. Marks achieved for rating below Good = 0. Achievement between Good and Very Good and between Very Good and Excellent would be linearly scaled CFA - CO Nodal designate: Mr. Tarun Kumar (Sr.GM, BP - CFA)
CA- CO Nodal designate: Mr. H. N. Singh (Sr. GM, MM-CA)
New Businesses - CO Nodal designate: Mr. Abdul Mazid (Sr.GM, TF - NB)
HR - CO Nodal designate: Mr. Neeraj Verma (GM, Training)
Finance - CO Nodal designate: Mr. KCGK Pillai (PGM,PF & Finance Personnel)
Note: i) Assessment by CMD and all directors of the BSNL board will be based on qualitative measures defined for the parameters
CM - CO Nodal designate: Mr. B.N. Mishra (Sr.GM, Product & Pricing)
Enterprise - CO Nodal designate: Mr. S. K. Seth
Enterprise 15%
Overall
Financial
Performance
30%
Others 10%
Chattisgarh Territorial Circle Page 10 of 52
Group
Group
level
weightage
S. No. Dimension KPI Weightage TargetTarget
Achieved
Marks
Achieved
Weighted
Score
Good Very Good Excellent
60 80 100
1 Financial CFA Revenue - Basic (LL, PCO,IN,USO rural phones/VPT subsidy in
lieu of ADC, VAS, etc.) (Rs. Cr.)
20% 414.000 248.40 331.20 414.00
2 Financial CFA Revenue - Broadband (including VAS, IPTV) (Rs. Cr.) 20% 370.00 222.00 296.00 370.00
3 Customer /
Market
Net adds - (by number of subscribers) Basic (in 000's) 5% 23.561 33.93 28.74 23.56
4 Customer / Net adds - (by number of subscribers) Broadband (in 000's) 7.5% 186 111.60 148.80 186
5 Customer /
Market
Customer satisfaction level (including QoS) (Scale of 1 to 5) 7.5% 5 3 4 5
6
Customer /
MarketSurvey of Customers by an indepenedent agency in Hyderabad,
Banglore, Chennai & Kolkata having landline from BSNL& Broadband
from any other agency by 31st Jan 2012(Delay in Days)
2.5%
31/01/2012 31/03/12 31/01/12
7 Operations CCR rate for Landline – local 2% 83.00% 74.00% 78.30% 83.00%
8 Operations CCR rate for Landline – Junction 2% 71.50% 61.40% 67.40% 71.50%
9 Operations CCR rate for Landline – STD 2% 63.50% 57.40% 60.40% 63.50%
10 Operations Fault rate (LL) 2.0% 2.80% 3.40% 3.20% 2.80%
11 Operations Fault rate (BB) 2.0% 4% 4.50 4.25% 4%
12 Operations % of faults cleared on same day (LL) 1% 87% 77.70% 81.7% 87%
13 Operations % of faults cleared by the following day (LL) 1% 98.5% 89.00% 93.70% 98.50%
14 Operations % of faults cleared within 3 days (LL) 1% 100% 92.15% 98.00% 100%
15 Operations % of faults cleared on same day (BB) 1% 65% 60% 64% 65%
16 Operations % of faults cleared by the following day (BB) 1% 87% 92% 94% 87%
17Operations % of new services (LL,) provisioned in area on demand within the norm
(7 days for LL)2% 100% 93.10% 98.00% 100%
18 Operations % LL local shift with in 3 days 1% 100% 91.10% 96.00% 100%
19 Operations % LL Inter-exchange shift with in 5 days 1% 100% 90.25% 95.00% 100%
20Operations % of new services ( BB) provisioned within the ( 7 days for BB)(Subject
To technical feasibility)5% 87% 80.00% 85.00% 87%
21 Operations CDR system based Customer care and monitoring mechanism 4.0% 5 3 4 5
22 Operations Acessibility of call centre 1.0% 99.75% 93.00% 98.00% 99.75%
23Operations % of Calls answered by the operator(voice to voice ) within 60 seconds 1.0% 99.75% 93.00% 98.00% 99.75%
24Overall
performance Overall performance (on scale of 1 to 5 - to be assessed by CMD) 10% 5 3 4 5
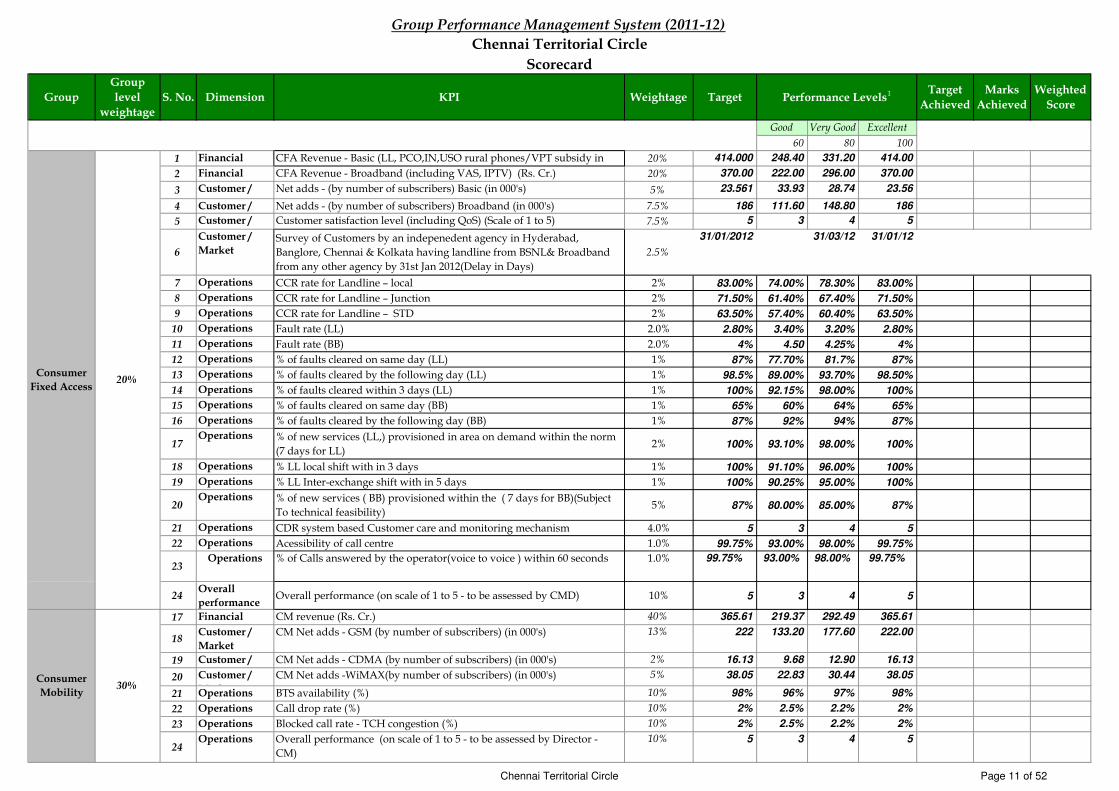
17 Financial CM revenue (Rs. Cr.) 40% 365.61 219.37 292.49 365.61
18Customer /
Market
CM Net adds - GSM (by number of subscribers) (in 000's) 13% 222 133.20 177.60 222.00
19 Customer /
Market
CM Net adds - CDMA (by number of subscribers) (in 000's) 2% 16.13 9.68 12.90 16.13
20 Customer /
Market
CM Net adds -WiMAX(by number of subscribers) (in 000's) 5% 38.05 22.83 30.44 38.05
21 Operations BTS availability (%) 10% 98% 96% 97% 98%
22 Operations Call drop rate (%) 10% 2% 2.5% 2.2% 2%
23 Operations Blocked call rate - TCH congestion (%) 10% 2% 2.5% 2.2% 2%
24Operations Overall performance (on scale of 1 to 5 - to be assessed by Director -
CM)
10% 5 3 4 5
Consumer
Mobility30%
Group Performance Management System (2011-12)
Chennai Territorial Circle
Scorecard
Performance Levels1
Consumer
Fixed Access20%
Chennai Territorial Circle Page 11 of 52

Group
Group
level
weightage
S. No. Dimension KPI Weightage TargetTarget
Achieved
Marks
Achieved
Weighted
Score
Good Very Good Excellent
60 80 100
Performance Levels1
25 Financial Enterprise BU revenue (Rs. Cr.) 40% 183.93 110.36 147.14 183.93
26Customer /
Market
Number of new Enterprise Gold accounts penetrated 20% 5 3 4 5
27 Operations MLLN / MPLS network uptime (%) 15% 98% 96% 97% 98%
28 Operations Average provisioning time for leased circuits(no. of days) 15% 30 90 60 30
29Operations Overall performance (on scale of 1 to 5 - to be assessed by Director -
Enterprise)
10% 5 3 4 5
37 Financial Gross margin 20%
38 Financial Gross sales 30%
39 Financial PBIT/Employment 20%
40 Financial Operating ratio (%) 20%
41Financial Budget adherence on opex (% actual spend vs. budgeted) (on items
excluding those in schedule P)
10%
42 Financial New Businesses revenue (Rs. Cr.) 15% 4.17 2.085 3.1275 4.17
43Customer /
Market
Customer satisfaction level (including QoS) (Scale of 1 to 5) 20% 5 3 4 5
44
Financial Overall assessment on Finance related issues, including budget
adherence, financial planning, accounting, revenue assurance etc. (on
scale of 1 to 5 - to be assessed by Dir-Finance)
15% 5 3 4 5
45
Employee
development
Overall assessment on HR related issues, including training, recruiting,
promotion, transfers etc. (on scale of 1 to 5 - to be assessed by Dir-HR)
20% 5 3 4 5
46Overall
assessment
Overall performance (on scale of 1 to 5 - to be assessed by CMD) 30% 5 3 4 5
1. Marks for Good rating = 60, Very Good = 80, Excellent = 100. Marks achieved for rating below Good = 0. Achievement between Good and Very Good and between Very Good and Excellent would be linearly scaled CFA - CO Nodal designate: Mr. Tarun Kumar (Sr.GM, BP - CFA)
CA- CO Nodal designate: Mr. H. N. Singh (Sr. GM, MM-CA)
New Businesses - CO Nodal designate: Mr. Abdul Mazid (Sr.GM, TF - NB)
HR - CO Nodal designate: Mr. Neeraj Verma (GM, Training)
Finance - CO Nodal designate: Mr. KCGK Pillai (PGM,PF & Finance Personnel)
Note: i) Assessment by CMD and all directors of the BSNL board will be based on qualitative measures defined for the parameters
Others 10%
CM - CO Nodal designate: Mr. B.N. Mishra (Sr.GM, Product & Pricing)
Enterprise - CO Nodal designate: Mr. S. K. Seth
Enterprise 15%
Overall
Financial
Performance
30%
Chennai Territorial Circle Page 12 of 52
Group
Group
level
weightage
S.
No.Dimension KPI Weightage Target
Performa
nce
Levels1
Target
Achieved
Marks
Achieved
Weighted
Score
Good Very Good Excellent
60 80 100
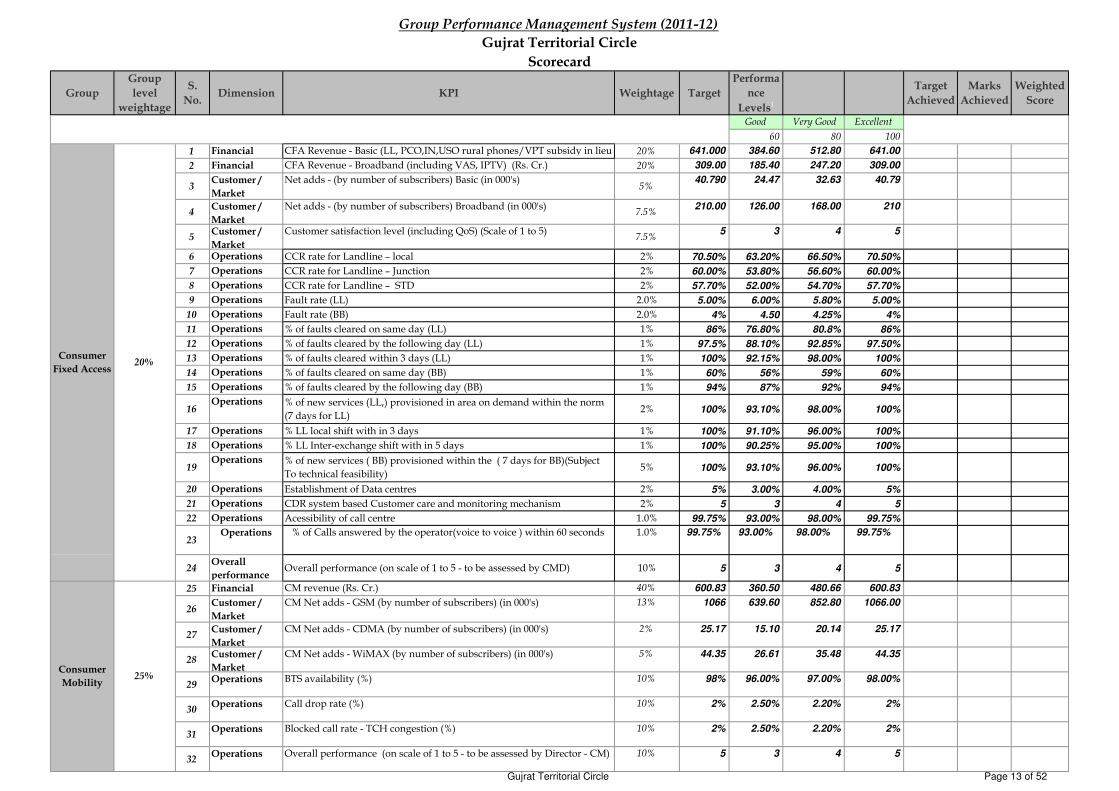
1 Financial CFA Revenue - Basic (LL, PCO,IN,USO rural phones/VPT subsidy in lieu
of ADC, VAS, etc.) (Rs. Cr.)
20% 641.000 384.60 512.80 641.00
2 Financial CFA Revenue - Broadband (including VAS, IPTV) (Rs. Cr.) 20% 309.00 185.40 247.20 309.00
3Customer /
Market
Net adds - (by number of subscribers) Basic (in 000's)5%
40.790 24.47 32.63 40.79
4Customer /
Market
Net adds - (by number of subscribers) Broadband (in 000's)7.5%
210.00 126.00 168.00 210
5Customer /
Market
Customer satisfaction level (including QoS) (Scale of 1 to 5)7.5%
5 3 4 5
6 Operations CCR rate for Landline – local 2% 70.50% 63.20% 66.50% 70.50%
7 Operations CCR rate for Landline – Junction 2% 60.00% 53.80% 56.60% 60.00%
8 Operations CCR rate for Landline – STD 2% 57.70% 52.00% 54.70% 57.70%
9 Operations Fault rate (LL) 2.0% 5.00% 6.00% 5.80% 5.00%
10 Operations Fault rate (BB) 2.0% 4% 4.50 4.25% 4%
11 Operations % of faults cleared on same day (LL) 1% 86% 76.80% 80.8% 86%
12 Operations % of faults cleared by the following day (LL) 1% 97.5% 88.10% 92.85% 97.50%
13 Operations % of faults cleared within 3 days (LL) 1% 100% 92.15% 98.00% 100%
14 Operations % of faults cleared on same day (BB) 1% 60% 56% 59% 60%
15 Operations % of faults cleared by the following day (BB) 1% 94% 87% 92% 94%
16Operations % of new services (LL,) provisioned in area on demand within the norm
(7 days for LL)2% 100% 93.10% 98.00% 100%
17 Operations % LL local shift with in 3 days 1% 100% 91.10% 96.00% 100%
18 Operations % LL Inter-exchange shift with in 5 days 1% 100% 90.25% 95.00% 100%
19Operations % of new services ( BB) provisioned within the ( 7 days for BB)(Subject
To technical feasibility)5% 100% 93.10% 96.00% 100%
20 Operations Establishment of Data centres 2% 5% 3.00% 4.00% 5%
21 Operations CDR system based Customer care and monitoring mechanism 2% 5 3 4 5
22 Operations Acessibility of call centre 1.0% 99.75% 93.00% 98.00% 99.75%
23Operations % of Calls answered by the operator(voice to voice ) within 60 seconds 1.0% 99.75% 93.00% 98.00% 99.75%
24Overall
performance Overall performance (on scale of 1 to 5 - to be assessed by CMD) 10% 5 3 4 5
25 Financial CM revenue (Rs. Cr.) 40% 600.83 360.50 480.66 600.83
26Customer /
Market
CM Net adds - GSM (by number of subscribers) (in 000's) 13% 1066 639.60 852.80 1066.00
27Customer /
Market
CM Net adds - CDMA (by number of subscribers) (in 000's) 2% 25.17 15.10 20.14 25.17
28Customer /
Market
CM Net adds - WiMAX (by number of subscribers) (in 000's) 5% 44.35 26.61 35.48 44.35
29Operations BTS availability (%) 10% 98% 96.00% 97.00% 98.00%
30Operations Call drop rate (%) 10% 2% 2.50% 2.20% 2%
31Operations Blocked call rate - TCH congestion (%) 10% 2% 2.50% 2.20% 2%
32Operations Overall performance (on scale of 1 to 5 - to be assessed by Director - CM) 10% 5 3 4 5
Group Performance Management System (2011-12)
Gujrat Territorial Circle
Scorecard
Consumer
Fixed Access20%
Consumer
Mobility25%
Gujrat Territorial Circle Page 13 of 52

Group
Group
level
weightage
S.
No.Dimension KPI Weightage Target
Performa
nce
Levels1
Target
Achieved
Marks
Achieved
Weighted
Score
Good Very Good Excellent
60 80 100
33Financial Enterprise BU revenue (Rs. Cr.) 40% 90 54 72 90
34Customer /
Market
Number of new Enterprise Gold accounts penetrated 20% 12 8 10 12
35Operations MLLN / MPLS network uptime (%) 15% 98% 96% 97% 98%
36Operations Average provisioning time for leased circuits(no. of days) 15% 30 90 60 30
37Operations Overall performance (on scale of 1 to 5 - to be assessed by Director -
Enterprise)
10% 5 3 4 5
38Financial Gross margin 20%
39Financial Gross sales 30%
40Financial PBIT/Employment 20%
41 Financial Operating ratio (%) 20%
42Financial Budget adherence on opex (% actual spend vs. budgeted) (on items
excluding those in schedule P)
10%
43 Financial New Businesses revenue (Rs. Cr.) 15% 11.15 5.575 8.3625 11.15
44Customer /
Market
Customer satisfaction level (including QoS) (Scale of 1 to 5) 20% 5 3 4 5
45
Financial Overall assessment on Finance related issues, including budget
adherence, financial planning, accounting, revenue assurance etc. (on
scale of 1 to 5 - to be assessed by Dir-Finance)
15% 5 3 4 5
46
Employee
development
Overall assessment on HR related issues, including training, recruiting,
promotion, transfers etc. (on scale of 1 to 5 - to be assessed by Dir-HR)
20% 5 3 4 5
47Overall
assessment
Overall performance (on scale of 1 to 5 - to be assessed by CMD) 30% 5 3 4 5
1. Marks for Good rating = 60, Very Good = 80, Excellent = 100. Marks achieved for rating below Good = 0. Achievement between Good and Very Good and between Very Good and Excellent would be linearly scaled CFA - CO Nodal designate: Mr. Tarun Kumar (Sr.GM, BP - CFA)
CA- CO Nodal designate: Mr. H. N. Singh (Sr. GM, MM-CA)
New Businesses - CO Nodal designate: Mr. Abdul Mazid (Sr.GM, TF - NB)
HR - CO Nodal designate: Mr. Neeraj Verma (GM, Training)
Finance - CO Nodal designate: Mr. KCGK Pillai (PGM,PF & Finance Personnel)
Note: i) Assessment by CMD and all directors of the BSNL board will be based on qualitative measures defined for the parameters
CM - CO Nodal designate: Mr. B.N. Mishra (Sr.GM, Product & Pricing)
Enterprise - CO Nodal designate: Mr. S. K. Seth
Enterprise 15%
Overall
Financial
Performance
30%
Others 10%
Gujrat Territorial Circle Page 14 of 52

Group Group level
weightage S. No. Dimension KPI Weightage Target
Performance
Levels1Target
Achieved
Marks
Achieved
Weighted
Score
Good Very Good Excellent
60 80 100
1 Financial CFA Revenue - Basic (LL, PCO,IN,USO rural phones/VPT subsidy in
lieu of ADC, VAS, etc.) (Rs. Cr.)
20% 216.000 129.60 172.80 216.00
2 Financial CFA Revenue - Broadband (including VAS, IPTV) (Rs. Cr.) 20% 118.00 70.80 94.40 118.00
3Customer /
Market
Net adds - (by number of subscribers) Basic (in 000's)5%
14.858 8.91 11.89 14.86
4Customer /
Market
Net adds - (by number of subscribers) Broadband (in 000's)7.5%
110 66.00 88.00 110
5Customer /
Market
Customer satisfaction level (including QoS) (Scale of 1 to 5)7.5%
5 3 4 5
6 Operations CCR rate for Landline – local 2% 78.00% 69.90% 73.60% 78.00%
7 Operations CCR rate for Landline – Junction 2% 60.00% 53.80% 56.60% 60.00%
8 Operations CCR rate for Landline – STD 2% 53.40% 48.30% 50.80% 53.40%
9 Operations Fault rate (LL) 2.0% 4.60% 5.60% 5.30% 4.60%
10 Operations Fault rate (BB) 2.0% 4% 4.50 4.25 4%
11 Operations % of faults cleared on same day (LL) 1% 88% 78.50% 82.7% 88%
12 Operations % of faults cleared by the following day (LL) 1% 98.5% 89.00% 93.70% 98.50%
13 Operations % of faults cleared within 3 days (LL) 1% 100% 92.15% 98.00% 100%
14 Operations % of faults cleared on same day (BB) 1% 60% 56% 59% 60%
15 Operations % of faults cleared by the following day (BB) 1% 93% 86% 91% 93%
16Operations % of new services (LL,) provisioned in area on demand within the norm
(7 days for LL)2% 100% 93.10% 98.00% 100%
17 Operations % LL local shift with in 3 days 1% 100% 91.10% 96.00% 100%
18 Operations % LL Inter-exchange shift with in 5 days 1% 100% 90.25% 95.00% 100%
19Operations % of new services ( BB) provisioned within the ( 7 days for BB)(Subject
To technical feasibility)5% 77% 70.00% 75.00% 77%
20 Operations Establishment of Data centres 2% 5% 3.00% 4.00% 5%
21 Operations CDR system based Customer care and monitoring mechanism 2% 5 3 4 5
22 Operations Acessibility of call centre 1.0% 99.75% 93.00% 98.00% 99.75%
23Operations % of Calls answered by the operator(voice to voice ) within 60 seconds 1.0% 99.75% 93.00% 98.00% 99.75%
24Overall
performance Overall performance (on scale of 1 to 5 - to be assessed by CMD) 10% 5 3 4 5
25 Financial CM revenue (Rs. Cr.) 40% 509.74 305.84 407.79 509.74
26Customer /
Market
CM Net adds - GSM (by number of subscribers) (in 000's) 13% 555 333 444 555
27Customer /
Market
CM Net adds - CDMA (by number of subscribers) (in 000's) 2% 14.29 8.57 11.43 14.29
28Customer /
Market
CM Net adds - WiMAX (by number of subscribers) (in 000's) 5% 16.05 9.63 12.84 16.05
29 Operations BTS availability (%) 10% 98% 96% 97% 98%
30 Operations Call drop rate (%) 10% 2% 2.5% 2.2% 2%
31 Operations Blocked call rate - TCH congestion (%) 10% 2% 2.5% 2.2% 2%
32Operations Overall performance (on scale of 1 to 5 - to be assessed by Director - CM) 10% 5 3 4 5
Group Performance Management System (2010-11)
Haryana Territorial Circle
Scorecard
Consumer
Fixed Access20%
Consumer
Mobility25%
Haryana Territorial Circle Page 15 of 52

Group Group level
weightage S. No. Dimension KPI Weightage Target
Performance
Levels1Target
Achieved
Marks
Achieved
Weighted
Score
Good Very Good Excellent
60 80 100
33 Financial Enterprise BU revenue (Rs. Cr.) 40% 48.06 28.84 38.45 48.06
34Customer /
Market
Number of new Enterprise Gold accounts penetrated 20% 12 8 10 12
35 Operations MLLN / MPLS network uptime (%) 15% 98% 96% 97% 98%
36 Operations Average provisioning time for leased circuits(no. of days) 15% 30 90 60 30
37Operations Overall performance (on scale of 1 to 5 - to be assessed by Director -
Enterprise)
10% 5 3 4 5
38 Financial Gross margin 20%
39 Financial Gross sales 30%
40 Financial PBIT/Employment 20%
41 Financial Operating ratio (%) 20%
42Financial Budget adherence on opex (% actual spend vs. budgeted) (on items
excluding those in schedule P)
10%
43 Financial New Businesses revenue (Rs. Cr.) 15% 5.55 2.775 4.1625 5.55
44Customer /
Market
Customer satisfaction level (including QoS) (Scale of 1 to 5) 20% 5 3 4 5
45
Financial Overall assessment on Finance related issues, including budget
adherence, financial planning, accounting, revenue assurance etc. (on
scale of 1 to 5 - to be assessed by Dir-Finance)
15% 5 3 4 5
46
Employee
development
Overall assessment on HR related issues, including training, recruiting,
promotion, transfers etc. (on scale of 1 to 5 - to be assessed by Dir-HR)
20% 5 3 4 5
47Overall
assessment
Overall performance (on scale of 1 to 5 - to be assessed by CMD) 30% 5 3 4 5
1. Marks for Good rating = 60, Very Good = 80, Excellent = 100. Marks achieved for rating below Good = 0. Achievement between Good and Very Good and between Very Good and Excellent would be linearly scaled CFA - CO Nodal designate: Mr. Tarun Kumar (Sr.GM, BP - CFA)
CA- CO Nodal designate: Mr. H. N. Singh (Sr. GM, MM-CA)
New Businesses - CO Nodal designate: Mr. Abdul Mazid (Sr.GM, TF - NB)
HR - CO Nodal designate: Mr. Neeraj Verma (GM, Training)
Finance - CO Nodal designate: Mr. KCGK Pillai (PGM,PF & Finance Personnel)
Note: i) Assessment by CMD and all directors of the BSNL board will be based on qualitative measures defined for the parameters
CM - CO Nodal designate: Mr. B.N. Mishra (Sr.GM, Product & Pricing)
Enterprise - CO Nodal designate: Mr. S. K. Seth
Enterprise 15%
Overall
Financial
Performance
30%
Others 10%
Haryana Territorial Circle Page 16 of 52

Group Group level
weightage S. No. Dimension KPI Weightage Target
Performan
ce Levels1
Target
Achieved
Marks
Achieved
Weighted
Score
Good Very Good Excellent
60 80 100
1Financial CFA Revenue - Basic (LL, PCO,IN,USO rural phones/VPT subsidy in lieu
of ADC, VAS, etc.) (Rs. Cr.)20%
67.000 40.20 53.60 67.00
2 Financial CFA Revenue - Broadband (including VAS, IPTV) (Rs. Cr.) 20% 42.00 25.20 33.60 42.00
3Customer /
Market
Net adds - (by number of subscribers) Basic (in 000's)5%
7.896 4.74 6.32 7.90
4Customer /
Market
Net adds - (by number of subscribers) Broadband (in 000's)7.5%
35 21.00 28.00 35
5Customer /
Market
Customer satisfaction level (including QoS) (Scale of 1 to 5)7.5%
5 3 4 5
6 Operations CCR rate for Landline – local 2% 72.00% 64.50% 67.90% 72.00%
7 Operations CCR rate for Landline – Junction 2% 60.00% 53.80% 56.60% 60.00%
8 Operations CCR rate for Landline – STD 2% 53.40% 48.30% 50.80% 53.40%
9 Operations Fault rate (LL) 2.0% 5.00% 6.00% 5.80% 5.00%
10 Operations Fault rate (BB) 2.0% 5% 6.00 5.80 5.00
11 Operations % of faults cleared on same day (LL) 1% 83% 74.10% 78.0% 83%
12 Operations % of faults cleared by the following day (LL) 1% 94.5% 85.40% 89.90% 94.50%
13 Operations % of faults cleared within 3 days (LL) 1% 100% 92.15% 98.00% 100%
14 Operations % of faults cleared on same day (BB) 1% 92% 85% 90% 92%
15 Operations % of faults cleared by the following day (BB) 1% 92% 85% 90% 92%
16Operations % of new services (LL,) provisioned in area on demand within the norm (7
days for LL)2% 100% 93.10% 98.00% 100%
17 Operations % LL local shift with in 3 days 1% 100% 91.10% 96.00% 100%
18 Operations % LL Inter-exchange shift with in 5 days 1% 100% 90.25% 95.00% 100%
19Operations % of new services ( BB) provisioned within the ( 7 days for BB)(Subject To
technical feasibility)5% 77% 70.00% 75.00% 77%
20Operations
CDR system based Customer care and monitoring mechanism 4.0% 5 3 4 5
21Operations
Acessibility of call centre 1.0% 99.75% 93.00% 98.00% 99.75%
22 Operations % of Calls answered by the operator(voice to voice ) within 60 seconds 1.0% 99.75% 93.00% 98.00% 99.75%
23Overall
performance Overall performance (on scale of 1 to 5 - to be assessed by CMD) 10% 5 3 4 5
24 Financial CM revenue (Rs. Cr.) 40% 274.50 164.70 219.60 274.50
25Customer /
Market
CM Net adds - GSM (by number of subscribers) (in 000's) 13% 303 181.80 242.40 303.00
26 Customer /
Market
CM Net adds - CDMA (by number of subscribers) (in 000's) 2% 12.61 7.57 10.09 12.61
27Customer /
Market
CM Net adds - WiMAX (by number of subscribers) (in 000's) 5% 18.35 11.01 14.68 18.35
28 Operations BTS availability (%) 10% 98% 96% 97% 98%
29 Operations Call drop rate (%) 10% 2% 2.5% 2.2% 2%
30 Operations Blocked call rate - TCH congestion (%) 10% 2% 2.5% 2.2% 2%
31 Operations Overall performance (on scale of 1 to 5 - to be assessed by Director - CM) 10% 5 3 4 5
Group Performance Management System (2011-12)
Himachal Pardesh Territorial Circle
Scorecard
Consumer
Fixed Access20%
Consumer
Mobility25%
HP Territorial Circle Page 17 of 52

Group Group level
weightage S. No. Dimension KPI Weightage Target
Performan
ce Levels1
Target
Achieved
Marks
Achieved
Weighted
Score
Good Very Good Excellent
60 80 100
32 Financial Enterprise BU revenue (Rs. Cr.) 40% 19.92 11.95 15.93 19.92
33Customer /
Market
Number of new Enterprise Gold accounts penetrated 20% 10 6 8 10
34 Operations MLLN / MPLS network uptime (%) 15% 98% 96% 97% 98%
35Operations Average provisioning time for leased circuits(no. of days) 15% 30 90 60 30
36 Operations Overall performance (on scale of 1 to 5 - to be assessed by Director -
Enterprise)
10% 5 3 4 5
37Financial Gross margin 20%
38 Financial Gross sales 30%
39Financial PBIT/Employment 20%
40 Financial Operating ratio (%) 20%
41Financial Budget adherence on opex (% actual spend vs. budgeted) (on items
excluding those in schedule P)
10%
42 Financial New Businesses revenue (Rs. Cr.) 15% 3.49 1.745 2.6175 3.49
43Customer /
Market
Customer satisfaction level (including QoS) (Scale of 1 to 5) 20% 5 3 4 5
44 Financial Overall assessment on Finance related issues, including budget
adherence, financial planning, accounting, revenue assurance etc. (on
scale of 1 to 5 - to be assessed by Dir-Finance)
15% 5 3 4 5
45Employee
development
Overall assessment on HR related issues, including training, recruiting,
promotion, transfers etc. (on scale of 1 to 5 - to be assessed by Dir-HR)
20% 5 3 4 5
46 Overall
assessment
Overall performance (on scale of 1 to 5 - to be assessed by CMD) 30% 5 3 4 5
1. Marks for Good rating = 60, Very Good = 80, Excellent = 100. Marks achieved for rating below Good = 0. Achievement between Good and Very Good and between Very Good and Excellent would be linearly scaled CFA - CO Nodal designate: Mr. Tarun Kumar (Sr.GM, BP - CFA)
CA- CO Nodal designate: Mr. H. N. Singh (Sr. GM, MM-CA)
New Businesses - CO Nodal designate: Mr. Abdul Mazid (Sr.GM, TF - NB)
HR - CO Nodal designate: Mr. Neeraj Verma (GM, Training)
Finance - CO Nodal designate: Mr. KCGK Pillai (PGM,PF & Finance Personnel)
Note: i) Assessment by CMD and all directors of the BSNL board will be based on qualitative measures defined for the parameters
CM - CO Nodal designate: Mr. B.N. Mishra (Sr.GM, Product & Pricing)
Enterprise - CO Nodal designate: Mr. S. K. Seth
(Sr. GM, Business Planning)
Enterprise 15%
Overall
Financial
Performance
30%
Others 10%
HP Territorial Circle Page 18 of 52

Group Group level
weightage S. No. Dimension KPI Weightage Target
Performan
ce Levels1
Target
Achieved
Marks
Achieved
Weighted
Score
Good Very Good Excellent
60 80 100
1 Financial CFA Revenue - Basic (LL, PCO,IN,USO rural phones/VPT subsidy in lieu
of ADC, VAS, etc.) (Rs. Cr.)
20% 83.000 49.80 66.40 83.00
2 Financial CFA Revenue - Broadband (including VAS, IPTV) (Rs. Cr.) 20% 39.00 23.40 31.20 39.00
3Customer /
Market
Net adds - (by number of subscribers) Basic (in 000's)5%
5.103 3.06 4.08 5.10
4Customer /
Market
Net adds - (by number of subscribers) Broadband (in 000's)7.5%
25 15.00 20.00 25
5Customer /
Market
Customer satisfaction level (including QoS) (Scale of 1 to 5)7.5%
5 3 4 5
6 Operations CCR rate for Landline – local 2% 66.90% 60.00% 63.10% 66.90%
7 Operations CCR rate for Landline – Junction 2% 60.00% 53.80% 56.60% 60.00%
8 Operations CCR rate for Landline – STD 2% 53.40% 48.30% 50.80% 53.40%
9 Operations Fault rate (LL) 2.0% 5.00% 6.00% 5.80% 5.00%
10 Operations Fault rate (BB) 2.0% 5% 5.50 5.25% 5%
11 Operations % of faults cleared on same day (LL) 1% 80% 71.40% 75.2% 80%
12 Operations % of faults cleared by the following day (LL) 1% 91.5% 82.70% 87.10% 91.50%
13 Operations % of faults cleared within 3 days (LL) 1% 100% 92.15% 98.00% 100%
14 Operations % of faults cleared on same day (BB) 1% 92% 85% 90% 92%
15 Operations % of faults cleared by the following day (BB) 1% 92% 85% 90% 92%
16Operations % of new services (LL,) provisioned in area on demand within the norm (7
days for LL)2% 100% 93.10% 98.00% 100%
17 Operations % LL local shift with in 3 days 1% 100% 91.10% 96.00% 100%
18 Operations % LL Inter-exchange shift with in 5 days 1% 100% 90.00% 95.00% 100%
19Operations % of new services ( BB) provisioned within the ( 7 days for BB)(Subject To
technical feasibility)5% 77% 70.00% 75.00% 77%
20 Operations CDR system based Customer care and monitoring mechanism 4.0% 5 3 4 5
21 Operations Acessibility of call centre 1.0% 99.75% 93.00% 98.00% 99.75%
22 Operations % of Calls answered by the operator(voice to voice ) within 60 seconds 1.0% 99.75% 93.00% 98.00% 99.75%
23Overall
performance Overall performance (on scale of 1 to 5 - to be assessed by CMD) 10% 5 3 4 5
24 Financial CM revenue (Rs. Cr.) 40% 344.05 206.43 275.24 344.05
25Customer /
Market
CM Net adds - GSM (by number of subscribers) (in 000's) 13% 310 186 248 310
26Customer /
Market
CM Net adds - CDMA (by number of subscribers) (in 000's) 2% 13.58 8.15 10.86 13.58
27 Customer /
Market
CM Net adds - WiMAX (by number of subscribers) (in 000's) 7% 8.85 5.31 7.08 8.85
28 Operations BTS availability (%) 10% 98% 96% 97% 98%
29 Operations Call drop rate (%) 10% 2% 2.5% 2.2% 2%
30 Operations Blocked call rate - TCH congestion (%) 10% 2% 2.5% 2.2% 2%
31Operations Overall performance (on scale of 1 to 5 - to be assessed by Director - CM) 10% 5 3 4 5
Group Performance Management System (2011-12)
J & K Territorial Circle
Scorecard
Consumer
Fixed Access20%
Consumer
Mobility25%
J & K Territorial Circle Page 19 of 52

Group Group level
weightage S. No. Dimension KPI Weightage Target
Performan
ce Levels1
Target
Achieved
Marks
Achieved
Weighted
Score
Good Very Good Excellent
60 80 100
32 Financial Enterprise BU revenue (Rs. Cr.) 40% 13.06 7.84 10.45 13.06
33Customer /
Market
Number of new Enterprise Gold accounts penetrated 20% 2 1 1 2
34Operations MLLN / MPLS network uptime (%) 15% 98% 96% 97% 98%
35Operations Average provisioning time for leased circuits(no. of days) 15% 30 90 60 30
36Operations Overall performance (on scale of 1 to 5 - to be assessed by Director -
Enterprise)
10% 5 3 4 5
37 Financial Gross margin 20%
38Financial Gross sales 30%
39Financial PBIT/Employment 20%
40 Financial Operating ratio (%) 20%
41Financial Budget adherence on opex (% actual spend vs. budgeted) (on items
excluding those in schedule P)
10%
42 Financial New Businesses revenue (Rs. Cr.) 15% 3.27 1.635 2.4525 3.27
43Customer /
Market
Customer satisfaction level (including QoS) (Scale of 1 to 5) 20% 5 3 4 5
44
Financial Overall assessment on Finance related issues, including budget adherence,
financial planning, accounting, revenue assurance etc. (on scale of 1 to 5 - to
be assessed by Dir-Finance)
15% 5 3 4 5
45
Employee
development
Overall assessment on HR related issues, including training, recruiting,
promotion, transfers etc. (on scale of 1 to 5 - to be assessed by Dir-HR)
20% 5 3 4 5
46Overall
assessment
Overall performance (on scale of 1 to 5 - to be assessed by CMD) 30% 5 3 4 5
1. Marks for Good rating = 60, Very Good = 80, Excellent = 100. Marks achieved for rating below Good = 0. Achievement between Good and Very Good and between Very Good and Excellent would be linearly scaled
CFA - CO Nodal designate: Mr. Tarun Kumar (Sr.GM, BP - CFA)
CA- CO Nodal designate: Mr. H. N. Singh (Sr. GM, MM-CA)
New Businesses - CO Nodal designate: Mr. Abdul Mazid (Sr.GM, TF - NB)
CM - CO Nodal designate: Mr. B.N. Mishra (Sr.GM, Product & Pricing)
Enterprise - CO Nodal designate: Mr. S. K. Seth
(Sr. GM, Business Planning)
Enterprise 15%
Overall
Financial
Performance
30%
Others 10%
J & K Territorial Circle Page 20 of 52

Group Group level
weightage S. No. Dimension KPI Weightage Target
Target
Achieved
Marks
Achieved
Weighted
Score
Good Very Good Excellent
60 80 100
1Financial CFA Revenue - Basic (LL, PCO,IN,USO rural phones/VPT subsidy in lieu
of ADC, VAS, etc.) (Rs. Cr.)20%
82.000 49.20 65.60 82.00
2Financial CFA Revenue - Broadband (including VAS, IPTV) (Rs. Cr.)
20%51.00 30.60 40.80 51.00
3Customer /
Market
Net adds - (by number of subscribers) Basic (in 000's)5%
5.830 3.50 4.66 5.83
4Customer /
Market
Net adds - (by number of subscribers) Broadband (in 000's)7.5%
31 18.60 24.80 31
5Customer /
Market
Customer satisfaction level (including QoS) (Scale of 1 to 5)7.5%
5 3 4 5
6 Operations CCR rate for Landline – local 2% 66.90% 60.00% 63.10% 66.90%
7 Operations CCR rate for Landline – Junction 2% 60.00% 53.80% 56.60% 60.00%
8 Operations CCR rate for Landline – STD 2% 56.00% 50.60% 53.30% 56.00%
9 Operations Fault rate (LL) 2.0% 3.30% 4.00% 3.80% 3.30%
10 Operations Fault rate (BB) 2.0% 4.50 5.00 4.75 5%
11 Operations % of faults cleared on same day (LL) 1% 87% 77.70% 81.7% 87%
12 Operations % of faults cleared by the following day (LL) 1% 97.5% 88.10% 92.80% 97.50%
13 Operations % of faults cleared within 3 days (LL) 1% 100% 92.15% 98.00% 100%
14 Operations % of faults cleared on same day (BB) 1% 55% 50% 54% 55%
15 Operations % of faults cleared by the following day (BB) 1% 55% 50% 54% 55%
16Operations % of new services (LL,) provisioned in area on demand within the norm
(7 days for LL)2% 82% 75.00% 80.00% 82%
17 Operations % LL local shift with in 3 days 1% 100% 91.10% 96.00% 100%
18 Operations % LL Inter-exchange shift with in 5 days 1% 100% 90.25% 95.00% 100%
19Operations % of new services ( BB) provisioned within the ( 7 days for BB)(Subject
To technical feasibility)5% 82% 75.00% 80.00% 82%
20 Operations CDR system based Customer care and monitoring mechanism 4.0% 5 3 4 5
21 Operations Acessibility of call centre 1.0% 99.75% 93.00% 98.00% 99.75%
22 Operations % of Calls answered by the operator(voice to voice ) within 60 seconds 1.0% 99.75% 93.00% 98.00% 99.75%
23Overall
performance Overall performance (on scale of 1 to 5 - to be assessed by CMD) 10% 5 3 4 5
24 Financial CM revenue (Rs. Cr.) 40% 264.54 158.72 211.63 264.54
25Customer /
Market
CM Net adds - GSM (by number of subscribers) (in 000's) 13% 352 211.20 281.60 352.00
26 Customer /
Market
CM Net adds - CDMA (by number of subscribers) (in 000's) 2% 18.52 11.11 14.82 18.52
27Customer /
Market
CM Net adds - WiMAX (by number of subscribers) (in 000's) 5% 25.30 15.18 20.24 25.30
28 Operations BTS availability (%) 10% 98% 96% 97% 98%
29 Operations Call drop rate (%) 10% 2% 2.5% 2.2% 2%
30 Operations Blocked call rate - TCH congestion (%) 10% 2% 2.5% 2.2% 2%
31Operations Overall performance (on scale of 1 to 5 - to be assessed by Director - CM) 10% 5 3 4 5
Consumer
Mobility25%
Group Performance Management System (2011-12)
Jharkhand Territorial Circle
Scorecard
Performance Levels1
Consumer
Fixed Access20%
Jharkhand Territorial Circle Page 21 of 52

Group Group level
weightage S. No. Dimension KPI Weightage Target
Target
Achieved
Marks
Achieved
Weighted
Score
Good Very Good Excellent
60 80 100
Performance Levels1
32 Financial Enterprise BU revenue (Rs. Cr.) 40% 29.74 17.84 23.79 29.74
33Customer /
Market
Number of new Enterprise Gold accounts penetrated 20% 5 3 4 5
34 Operations MLLN / MPLS network uptime (%) 15% 98% 96% 97% 98%
35Operations Average provisioning time for leased circuits(no. of days) 15% 30 90 60 30
36 Operations Overall performance (on scale of 1 to 5 - to be assessed by Director -
Enterprise)
10% 5 3 4 5
37 Financial Gross margin 20%
38 Financial Gross sales 30%
39Financial PBIT/Employment 20%
40 Financial Operating ratio (%) 20%
41Financial Budget adherence on opex (% actual spend vs. budgeted) (on items
excluding those in schedule P)
10%
42 Financial New Businesses revenue (Rs. Cr.) 15% 3.08 1.54 2.31 3.08
43Customer /
Market
Customer satisfaction level (including QoS) (Scale of 1 to 5) 20% 5 3 4 5
44
Financial Overall assessment on Finance related issues, including budget
adherence, financial planning, accounting, revenue assurance etc. (on
scale of 1 to 5 - to be assessed by Dir-Finance)
15% 5 3 4 5
45
Employee
development
Overall assessment on HR related issues, including training, recruiting,
promotion, transfers etc. (on scale of 1 to 5 - to be assessed by Dir-HR)
20% 5 3 4 5
46Overall
assessment
Overall performance (on scale of 1 to 5 - to be assessed by CMD) 30% 5 3 4 5
1. Marks for Good rating = 60, Very Good = 80, Excellent = 100. Marks achieved for rating below Good = 0. Achievement between Good and Very Good and between Very Good and Excellent would be linearly scaled CFA - CO Nodal designate: Mr. Tarun Kumar (Sr.GM, BP - CFA)
CA- CO Nodal designate: Mr. H. N. Singh (Sr. GM, MM-CA)
New Businesses - CO Nodal designate: Mr. Abdul Mazid (Sr.GM, TF - NB)
HR - CO Nodal designate: Mr. Neeraj Verma (GM, Training)
Finance - CO Nodal designate: Mr. KCGK Pillai (PGM,PF & Finance Personnel)
Note: i) Assessment by CMD and all directors of the BSNL board will be based on qualitative measures defined for the parameters
Others 10%
CM - CO Nodal designate: Mr. B.N. Mishra (Sr.GM, Product & Pricing)
Enterprise - CO Nodal designate: Mr. S. K. Seth
Enterprise 15%
Overall
Financial
Performance
30%
Jharkhand Territorial Circle Page 22 of 52
Group Group level
weightage S. No. Dimension KPI Weightage Target
Performanc
e Levels1Target
Achieved
Marks
Achieved
Weighted
Score
Good Very Good Excellent
60 80 100
1Financial CFA Revenue - Basic (LL, PCO,IN,USO rural phones/VPT subsidy in lieu of
ADC, VAS, etc.) (Rs. Cr.)20%
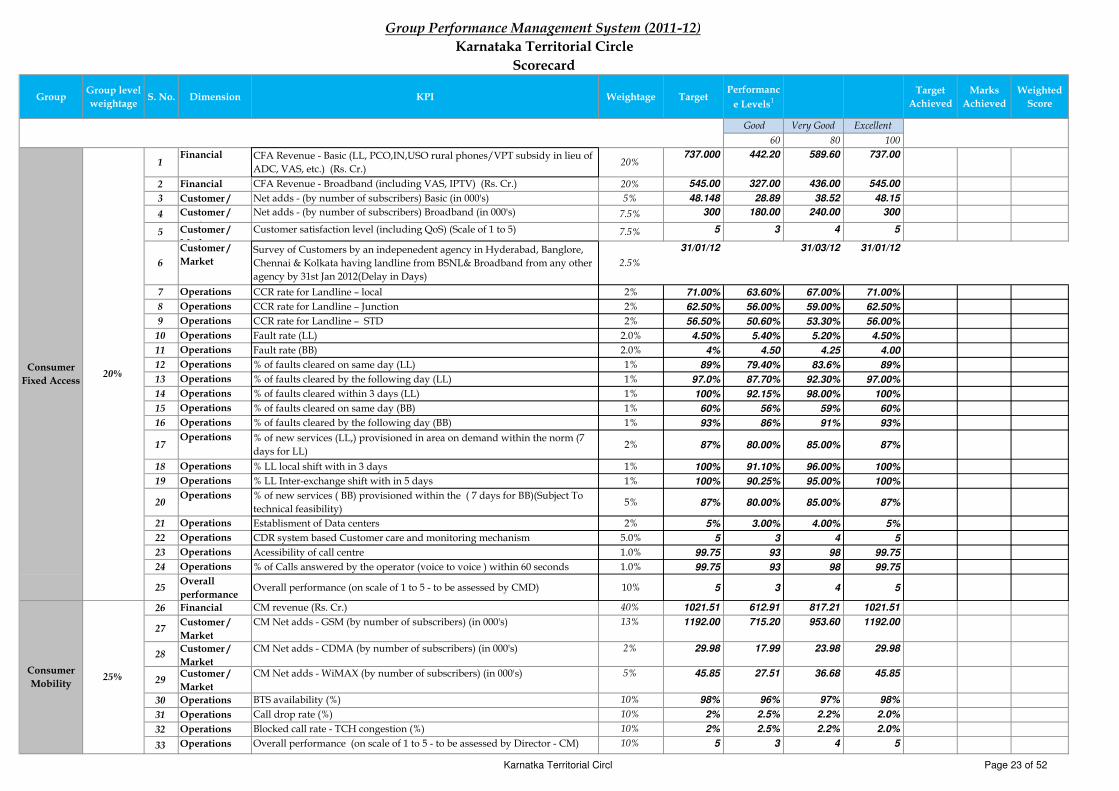
737.000 442.20 589.60 737.00
2 Financial CFA Revenue - Broadband (including VAS, IPTV) (Rs. Cr.) 20% 545.00 327.00 436.00 545.00
3 Customer / Net adds - (by number of subscribers) Basic (in 000's) 5% 48.148 28.89 38.52 48.15
4 Customer /
Market
Net adds - (by number of subscribers) Broadband (in 000's) 7.5% 300 180.00 240.00 300
5 Customer /
Market
Customer satisfaction level (including QoS) (Scale of 1 to 5) 7.5% 5 3 4 5
6
Customer /
MarketSurvey of Customers by an indepenedent agency in Hyderabad, Banglore,
Chennai & Kolkata having landline from BSNL& Broadband from any other
agency by 31st Jan 2012(Delay in Days)
2.5%
31/01/12 31/03/12 31/01/12
7 Operations CCR rate for Landline – local 2% 71.00% 63.60% 67.00% 71.00%
8 Operations CCR rate for Landline – Junction 2% 62.50% 56.00% 59.00% 62.50%
9 Operations CCR rate for Landline – STD 2% 56.50% 50.60% 53.30% 56.00%
10 Operations Fault rate (LL) 2.0% 4.50% 5.40% 5.20% 4.50%
11 Operations Fault rate (BB) 2.0% 4% 4.50 4.25 4.00
12 Operations % of faults cleared on same day (LL) 1% 89% 79.40% 83.6% 89%
13 Operations % of faults cleared by the following day (LL) 1% 97.0% 87.70% 92.30% 97.00%
14 Operations % of faults cleared within 3 days (LL) 1% 100% 92.15% 98.00% 100%
15 Operations % of faults cleared on same day (BB) 1% 60% 56% 59% 60%
16 Operations % of faults cleared by the following day (BB) 1% 93% 86% 91% 93%
17Operations % of new services (LL,) provisioned in area on demand within the norm (7
days for LL)2% 87% 80.00% 85.00% 87%
18 Operations % LL local shift with in 3 days 1% 100% 91.10% 96.00% 100%
19 Operations % LL Inter-exchange shift with in 5 days 1% 100% 90.25% 95.00% 100%
20Operations % of new services ( BB) provisioned within the ( 7 days for BB)(Subject To
technical feasibility)5% 87% 80.00% 85.00% 87%
21 Operations Establisment of Data centers 2% 5% 3.00% 4.00% 5%
22 Operations CDR system based Customer care and monitoring mechanism 5.0% 5 3 4 5
23 Operations Acessibility of call centre 1.0% 99.75 93 98 99.75
24 Operations % of Calls answered by the operator (voice to voice ) within 60 seconds 1.0% 99.75 93 98 99.75
25Overall
performance Overall performance (on scale of 1 to 5 - to be assessed by CMD) 10% 5 3 4 5
26 Financial CM revenue (Rs. Cr.) 40% 1021.51 612.91 817.21 1021.51
27Customer /
Market
CM Net adds - GSM (by number of subscribers) (in 000's) 13% 1192.00 715.20 953.60 1192.00
28Customer /
Market
CM Net adds - CDMA (by number of subscribers) (in 000's) 2% 29.98 17.99 23.98 29.98
29Customer /
Market
CM Net adds - WiMAX (by number of subscribers) (in 000's) 5% 45.85 27.51 36.68 45.85
30 Operations BTS availability (%) 10% 98% 96% 97% 98%
31 Operations Call drop rate (%) 10% 2% 2.5% 2.2% 2.0%
32 Operations Blocked call rate - TCH congestion (%) 10% 2% 2.5% 2.2% 2.0%
33 Operations Overall performance (on scale of 1 to 5 - to be assessed by Director - CM) 10% 5 3 4 5
Group Performance Management System (2011-12)
Karnataka Territorial Circle
Scorecard
Consumer
Fixed Access20%
Consumer
Mobility25%
Karnatka Territorial Circl Page 23 of 52

Group Group level
weightage S. No. Dimension KPI Weightage Target
Performanc
e Levels1Target
Achieved
Marks
Achieved
Weighted
Score
Good Very Good Excellent
60 80 100
34 Financial Enterprise BU revenue (Rs. Cr.) 40% 435.21 261.13 348.17 435.21
35Customer /
Market
Number of new Enterprise Gold accounts penetrated 20% 18 12 14 18
36Operations MLLN / MPLS network uptime (%) 15% 98% 96% 97% 98%
37Operations Average provisioning time for leased circuits(no. of days) 15% 30 90 60 30
38Operations Overall performance (on scale of 1 to 5 - to be assessed by Director -
Enterprise)
10% 5 3 4 5
39Financial Gross margin 20%
40Financial Gross sales 30%
41Financial PBIT/Employment 20%
42 Financial Operating ratio (%) 20%
43Financial Budget adherence on opex (% actual spend vs. budgeted) (on items
excluding those in schedule P)
10%
44 Financial New Businesses revenue (Rs. Cr.) 15% 6.77 3.385 5.0775 6.77
45Customer /
Market
Customer satisfaction level (including QoS) (Scale of 1 to 5) 20% 5 3 4 5
46
Financial Overall assessment on Finance related issues, including budget adherence,
financial planning, accounting, revenue assurance etc. (on scale of 1 to 5 - to
be assessed by Dir-Finance)
15% 5 3 4 5
47Employee
development
Overall assessment on HR related issues, including training, recruiting,
promotion, transfers etc. (on scale of 1 to 5 - to be assessed by Dir-HR)
20% 5 3 4 5
48Overall
assessment
Overall performance (on scale of 1 to 5 - to be assessed by CMD) 30% 5 3 4 5
1. Marks for Good rating = 60, Very Good = 80, Excellent = 100. Marks achieved for rating below Good = 0. Achievement between Good and Very Good and between Very Good and Excellent would be linearly scaled CFA - CO Nodal designate: Mr. Tarun Kumar (Sr.GM, BP - CFA)
CA- CO Nodal designate: Mr. H. N. Singh (Sr. GM, MM-CA)
New Businesses - CO Nodal designate: Mr. Abdul Mazid (Sr.GM, TF - NB)
HR - CO Nodal designate: Mr. Neeraj Verma (GM, Training)
Finance - CO Nodal designate: Mr. KCGK Pillai (PGM,PF & Finance Personnel)
Note: i) Assessment by CMD and all directors of the BSNL board will be based on qualitative measures defined for the parameters
CM - CO Nodal designate: Mr. B.N. Mishra (Sr.GM, Product & Pricing)
Enterprise - CO Nodal designate: Mr. S. K. Seth
Enterprise 15%
Overall
Financial
Performance
30%
Others 10%
Karnatka Territorial Circl Page 24 of 52
Group
Group
level
weightage
S. No. Dimension KPI Weightage TargetTarget
Achieved
Marks
Achieved
Weighted
Score
Good Very Good Excellent
60 80 100
1 Financial CFA Revenue - Basic (LL, PCO,IN,USO rural phones/VPT subsidy in lieu
of ADC, VAS, etc.) (Rs. Cr.)
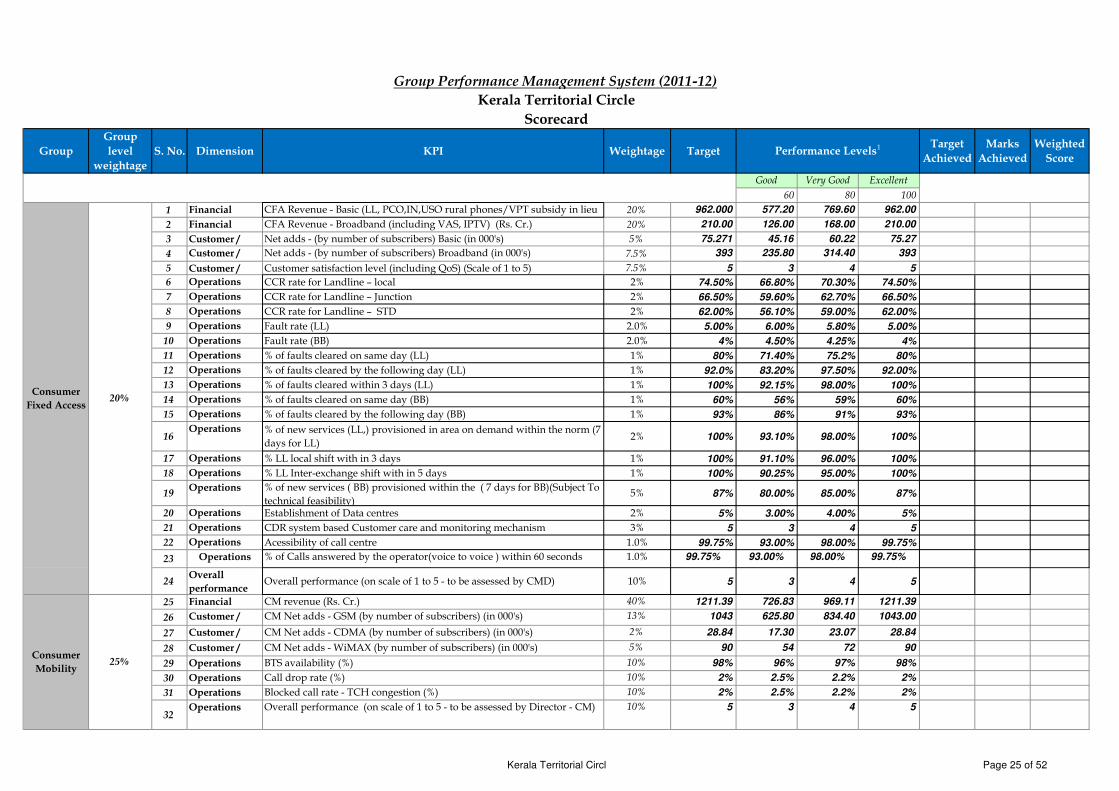
20% 962.000 577.20 769.60 962.00
2 Financial CFA Revenue - Broadband (including VAS, IPTV) (Rs. Cr.) 20% 210.00 126.00 168.00 210.00
3 Customer / Net adds - (by number of subscribers) Basic (in 000's) 5% 75.271 45.16 60.22 75.27
4 Customer /
Market
Net adds - (by number of subscribers) Broadband (in 000's) 7.5% 393 235.80 314.40 393
5 Customer / Customer satisfaction level (including QoS) (Scale of 1 to 5) 7.5% 5 3 4 5
6 Operations CCR rate for Landline – local 2% 74.50% 66.80% 70.30% 74.50%
7 Operations CCR rate for Landline – Junction 2% 66.50% 59.60% 62.70% 66.50%
8 Operations CCR rate for Landline – STD 2% 62.00% 56.10% 59.00% 62.00%
9 Operations Fault rate (LL) 2.0% 5.00% 6.00% 5.80% 5.00%
10 Operations Fault rate (BB) 2.0% 4% 4.50% 4.25% 4%
11 Operations % of faults cleared on same day (LL) 1% 80% 71.40% 75.2% 80%
12 Operations % of faults cleared by the following day (LL) 1% 92.0% 83.20% 97.50% 92.00%
13 Operations % of faults cleared within 3 days (LL) 1% 100% 92.15% 98.00% 100%
14 Operations % of faults cleared on same day (BB) 1% 60% 56% 59% 60%
15 Operations % of faults cleared by the following day (BB) 1% 93% 86% 91% 93%
16Operations % of new services (LL,) provisioned in area on demand within the norm (7
days for LL)2% 100% 93.10% 98.00% 100%
17 Operations % LL local shift with in 3 days 1% 100% 91.10% 96.00% 100%
18 Operations % LL Inter-exchange shift with in 5 days 1% 100% 90.25% 95.00% 100%
19Operations % of new services ( BB) provisioned within the ( 7 days for BB)(Subject To
technical feasibility)5% 87% 80.00% 85.00% 87%
20 Operations Establishment of Data centres 2% 5% 3.00% 4.00% 5%
21 Operations CDR system based Customer care and monitoring mechanism 3% 5 3 4 5
22 Operations Acessibility of call centre 1.0% 99.75% 93.00% 98.00% 99.75%
23 Operations % of Calls answered by the operator(voice to voice ) within 60 seconds 1.0% 99.75% 93.00% 98.00% 99.75%
24Overall
performance Overall performance (on scale of 1 to 5 - to be assessed by CMD) 10% 5 3 4 5
25 Financial CM revenue (Rs. Cr.) 40% 1211.39 726.83 969.11 1211.39
26 Customer /
Market
CM Net adds - GSM (by number of subscribers) (in 000's) 13% 1043 625.80 834.40 1043.00
27 Customer /
Market
CM Net adds - CDMA (by number of subscribers) (in 000's) 2% 28.84 17.30 23.07 28.84
28 Customer /
Market
CM Net adds - WiMAX (by number of subscribers) (in 000's) 5% 90 54 72 90
29 Operations BTS availability (%) 10% 98% 96% 97% 98%
30 Operations Call drop rate (%) 10% 2% 2.5% 2.2% 2%
31 Operations Blocked call rate - TCH congestion (%) 10% 2% 2.5% 2.2% 2%
32Operations Overall performance (on scale of 1 to 5 - to be assessed by Director - CM) 10% 5 3 4 5
Consumer
Mobility25%
Group Performance Management System (2011-12)
Kerala Territorial Circle
Scorecard
Performance Levels1
Consumer
Fixed Access20%
Kerala Territorial Circl Page 25 of 52

Group
Group
level
weightage
S. No. Dimension KPI Weightage TargetTarget
Achieved
Marks
Achieved
Weighted
Score
Good Very Good Excellent
60 80 100
Performance Levels1
33Financial Enterprise BU revenue (Rs. Cr.) 40% 67.81 40.69 54.25 67.81
34Customer /
Market
Number of new Enterprise Gold accounts penetrated 20% 8 5 6 8
35Operations MLLN / MPLS network uptime (%) 15% 98% 96% 97% 98%
36Operations Average provisioning time for leased circuits(no. of days) 15% 30 90 60 30
37Operations Overall performance (on scale of 1 to 5 - to be assessed by Director -
Enterprise)
10% 5 3 4 5
38Financial Gross margin 20%
39Financial Gross sales 30%
40Financial PBIT/Employment 20%
41 Financial Operating ratio (%) 20%
42Financial Budget adherence on opex (% actual spend vs. budgeted) (on items
excluding those in schedule P)
10%
43 Financial New Businesses revenue (Rs. Cr.) 15% 6.4 3.2 4.8 6.4
44Customer /
Market
Customer satisfaction level (including QoS) (Scale of 1 to 5) 20% 5 3 4 5
45
Financial Overall assessment on Finance related issues, including budget adherence,
financial planning, accounting, revenue assurance etc. (on scale of 1 to 5 -
to be assessed by Dir-Finance)
15% 5 3 4 5
46
Employee
development
Overall assessment on HR related issues, including training, recruiting,
promotion, transfers etc. (on scale of 1 to 5 - to be assessed by Dir-HR)
20% 5 3 4 5
47Overall
assessment
Overall performance (on scale of 1 to 5 - to be assessed by CMD) 30% 5 3 4 5
1. Marks for Good rating = 60, Very Good = 80, Excellent = 100. Marks achieved for rating below Good = 0. Achievement between Good and Very Good and between Very Good and Excellent would be linearly scaled CFA - CO Nodal designate: Mr. Tarun Kumar (Sr.GM, BP - CFA)
CA- CO Nodal designate: Mr. H. N. Singh (Sr. GM, MM-CA)
New Businesses - CO Nodal designate: Mr. Abdul Mazid (Sr.GM, TF - NB)
HR - CO Nodal designate: Mr. Neeraj Verma (GM, Training)
Finance - CO Nodal designate: Mr. KCGK Pillai (PGM,PF & Finance Personnel)
Note: i) Assessment by CMD and all directors of the BSNL board will be based on qualitative measures defined for the parameters
Others 10%
CM - CO Nodal designate: Mr. B.N. Mishra (Sr.GM, Product & Pricing)
Enterprise - CO Nodal designate: Mr. S. K. Seth
Enterprise 15%
Overall
Financial
Performance
30%
Kerala Territorial Circl Page 26 of 52

Group
Group
level
weightage
S. No. Dimension KPI Weightage TargetTarget
Achieved
Marks
Achieved
Weighted
Score
Good Very Good Excellent
60 80 100
1 Financial CFA Revenue - Basic (LL, PCO,IN,USO rural phones/VPT subsidy in lieu
of ADC, VAS, etc.) (Rs. Cr.)
20% 383.000 229.80 306.40 383.00
2 Financial CFA Revenue - Broadband (including VAS, IPTV) (Rs. Cr.) 20% 210.00 126.00 168.00 210.00
3 Customer / Net adds - (by number of subscribers) Basic (in 000's) 5% 284.950 170.97 227.96 284.95
4 Customer / Net adds - (by number of subscribers) Broadband (in 000's) 7.5% 106 63.60 84.80 106
5 Customer /
Market
Customer satisfaction level (including QoS) (Scale of 1 to 5) 7.5% 5 3 4 5
6
Customer /
MarketSurvey of Customers by an indepenedent agency in Hyderabad, Banglore,
Chennai & Kolkata having landline from BSNL& Broadband from any
other agency by 31st Jan 2012(Delay in Days)
2.5%
31/01/12 31/03/12 31/01/12
7 Operations CCR rate for Landline – local 2% 68.00% 61.00% 64.20% 68.00%
8 Operations CCR rate for Landline – Junction 2% 60.00% 53.80% 56.60% 60.00%
9 Operations CCR rate for Landline – STD 2% 53.40% 48.30% 50.80% 53.40%
10 Operations Fault rate (LL) 2.0% 4.40% 5.30% 5.10% 4.40%
11 Operations Fault rate (BB) 2.0% 4% 5% 4.25% 4%
12 Operations % of faults cleared on same day (LL) 1% 82% 73.20% 77.0% 82%
13 Operations % of faults cleared by the following day (LL) 1% 93.5% 84.50% 89.00% 93.50%
14 Operations % of faults cleared within 3 days (LL) 1% 100% 92.15% 98.00% 100%
15 Operations % of faults cleared on same day (BB) 1% 65% 60% 64% 65%
16 Operations % of faults cleared by the following day (BB) 1% 93% 86% 91% 93%
17Operations % of new services (LL,) provisioned in area on demand within the norm (7
days for LL)2% 100% 93.10% 98.00% 100%
18 Operations % LL local shift with in 3 days 1% 100% 91.10% 96.00% 100%
19 Operations % LL Inter-exchange shift with in 5 days 1% 100% 90.25% 95.00% 100%
20Operations % of new services ( BB) provisioned within the ( 7 days for BB)(Subject To
technical feasibility)5% 87% 80.00% 85.00% 87%
21 Operations CDR system based Customer care and monitoring mechanism 4% 5 3 4 5
22 Operations Acessibility of call centre 1.0% 99.75% 93.00% 98.00% 99.75%
23 Operations % of Calls answered by the operator(voice to voice ) within 60 seconds 1.0% 99.75% 93.00% 98.00% 99.75%
24Overall
performance Overall performance (on scale of 1 to 5 - to be assessed by CMD) 10% 5 3 4 5
26 Financial CM revenue (Rs. Cr.) 40% 294.57 176.74 235.66 294.57
27Customer /
Market
CM Net adds - GSM (by number of subscribers) (in 000's) 13% 602 361.20 481.60 602.00
28Customer /
Market
CM Net adds - CDMA (by number of subscribers) (in 000's) 2% 22.86 13.72 18.29 22.86
29Customer /
Market
CM Net adds -WiMAX (by number of subscribers) (in 000's) 5% 19 11.40 15.20 19.00
30 Operations BTS availability (%) 10% 98% 96% 97% 98%
31 Operations Call drop rate (%) 10% 2.0% 2.5% 2.2% 2.0%
32 Operations Blocked call rate - TCH congestion (%) 10% 2.0% 2.5% 2.2% 2.0%
33Operations Overall performance (on scale of 1 to 5 - to be assessed by Director - CM) 10% 5 3 4 5
Consumer
Mobility25%
Group Performance Management System (2011-12)
Kolkatta Territorial Circle
Scorecard
Performance Levels1
Consumer
Fixed Access20%
Kolkatta Territorial Circle Page 27 of 52

Group
Group
level
weightage
S. No. Dimension KPI Weightage TargetTarget
Achieved
Marks
Achieved
Weighted
Score
Good Very Good Excellent
60 80 100
Performance Levels1
34 Financial Enterprise BU revenue (Rs. Cr.) 40% 122.32 73.51 98.02 122.52
35Customer /
Market
Number of new Enterprise Gold accounts penetrated 20% 9 6 7 9
36 Operations MLLN / MPLS network uptime (%) 15% 98% 96% 97% 98%
37 Operations Average provisioning time for leased circuits(no. of days) 15% 30 90 60 30
38Operations Overall performance (on scale of 1 to 5 - to be assessed by Director -
Enterprise)
10% 5 3 4 5
39 Financial Gross margin 20%
40 Financial Gross sales 30%
41 Financial PBIT/Employment 20%
42 Financial Operating ratio (%) 20%
43Financial Budget adherence on opex (% actual spend vs. budgeted) (on items
excluding those in schedule P)
10%
44 Financial New Businesses revenue (Rs. Cr.) 15% 4.64 2.32 3.48 4.64
45Customer /
Market
Customer satisfaction level (including QoS) (Scale of 1 to 5) 20% 5 3 4 5
46
Financial Overall assessment on Finance related issues, including budget adherence,
financial planning, accounting, revenue assurance etc. (on scale of 1 to 5 -
to be assessed by Dir-Finance)
15% 5 3 4 5
47
Employee
development
Overall assessment on HR related issues, including training, recruiting,
promotion, transfers etc. (on scale of 1 to 5 - to be assessed by Dir-HR)
20% 5 3 4 5
48Overall
assessment
Overall performance (on scale of 1 to 5 - to be assessed by CMD) 30% 5 3 4 5
1. Marks for Good rating = 60, Very Good = 80, Excellent = 100. Marks achieved for rating below Good = 0. Achievement between Good and Very Good and between Very Good and Excellent would be linearly scaled
CFA - CO Nodal designate: Mr. Tarun Kumar (Sr.GM, BP - CFA)
CA- CO Nodal designate: Mr. H. N. Singh (Sr. GM, MM-CA)
New Businesses - CO Nodal designate: Mr. Abdul Mazid (Sr.GM, TF - NB)
HR - CO Nodal designate: Mr. Neeraj Verma (GM, Training)
Finance - CO Nodal designate: Mr. KCGK Pillai (PGM,PF & Finance Personnel)
Note: i) Assessment by CMD and all directors of the BSNL board will be based on qualitative measures defined for the parameters
Others 10%
CM - CO Nodal designate: Mr. B.N. Mishra (Sr.GM, Product & Pricing)
Enterprise - CO Nodal designate: Mr. S. K. Seth
(Sr. GM, Business Planning)
Enterprise 15%
Overall
Financial
Performance
30%
Kolkatta Territorial Circle Page 28 of 52

Group
Group
level
weightage
S. No. Dimension KPI Weightage TargetTarget
Achieved
Marks
Achieved
Weighted
Score
Good Very Good Excellent
60 80 100
1Financial CFA Revenue - Basic (LL, PCO,IN,USO rural phones/VPT subsidy in lieu
of ADC, VAS, etc.) (Rs. Cr.)20%
947.000 568.20 757.60 947.00
2Financial CFA Revenue - Broadband (including VAS, IPTV) (Rs. Cr.)
20%443.00 265.80 354.40 443.00
3 Customer / Net adds - (by number of subscribers) Basic (in 000's) 5% 59.000 35.40 47.20 59.00
4 Customer /
Market
Net adds - (by number of subscribers) Broadband (in 000's) 7.5% 331 198.60 264.80 331
5Customer /
Market
Customer satisfaction level (including QoS) (Scale of 1 to 5)7.5%
5 3 4 5
6 Operations CCR rate for Landline – local 2% 70.50% 63.20% 66.50% 70.50%
7 Operations CCR rate for Landline – Junction 2% 66.00% 59.10% 62.30% 66.00%
8 Operations CCR rate for Landline – STD 2% 55.00% 49.70% 52.30% 55.00%
9 Operations Fault rate (LL) 2.0% 5.00% 6.00% 5.80% 5.00%
10 Operations Fault rate (BB) 2.0% 4% 5% 4.25% 4%
11 Operations % of faults cleared on same day (LL) 1% 80% 71.40% 75.2% 80%
12 Operations % of faults cleared by the following day (LL) 1% 92.0% 83.20% 87.50% 92.00%
13 Operations % of faults cleared within 3 days (LL) 1% 100% 92.15% 98.00% 100%
14 Operations % of faults cleared on same day (BB) 1% 60% 56% 59% 60%
15 Operations % of faults cleared by the following day (BB) 1% 93% 86% 91% 93%
16Operations % of new services (LL,) provisioned in area on demand within the norm
(7 days for LL)2% 100% 93.10% 98.00% 100%
17 Operations % LL local shift with in 3 days 1% 100% 91.10% 96.00% 100%
18 Operations % LL Inter-exchange shift with in 5 days 1% 100% 90.25% 95.00% 100%
19Operations % of new services ( BB) provisioned within the ( 7 days for BB)(Subject
To technical feasibility)5% 87% 80.00% 85.00% 87%
20 Operations Establishment of Data centres 2% 5% 3.00% 4.00% 5%
21 Operations CDR system based Customer care and monitoring mechanism 2% 5 3 4 5
22 Operations Acessibility of call centre 1.0% 99.75% 93.00% 98.00% 99.75%
23Operations % of Calls answered by the operator(voice to voice ) within 60 seconds 1.0% 99.75% 93.00% 98.00% 99.75%
24Overall
performance Overall performance (on scale of 1 to 5 - to be assessed by CMD) 10% 5 3 4 5
25 Financial CM revenue (Rs. Cr.) 40% 1168.10 700.86 934.48 1168.10
26Customer /
Market
CM Net adds - GSM (by number of subscribers) (in 000's) 13% 1724 1034.40 1379.20 1724.00
27Customer /
Market
CM Net adds - CDMA (by number of subscribers) (in 000's) 2% 51.83 31.10 41.46 51.83
28Customer /
Market
CM Net adds - WiMAX (by number of subscribers) (in 000's) 5% 59.90 35.94 47.92 59.90
29 Operations BTS availability (%) 10% 98% 96% 97% 98%
30 Operations Call drop rate (%) 10% 2% 2.5% 2.2% 2%
31Operations Blocked call rate - TCH congestion (%) 10% 2% 2.5% 2.2% 2%
32Operations Overall performance (on scale of 1 to 5 - to be assessed by Director - CM) 10% 5 3 4 5
Consumer
Mobility25%
Group Performance Management System (2011-12)
Maharastra Territorial Circle
Scorecard
Performance Levels1
Consumer
Fixed Access20%
Maharastra Territorial Circle Page 29 of 52

Group
Group
level
weightage
S. No. Dimension KPI Weightage TargetTarget
Achieved
Marks
Achieved
Weighted
Score
Good Very Good Excellent
60 80 100
Performance Levels1
33Financial Enterprise BU revenue (Rs. Cr.) 40% 799.74 478.65 638.20 799.74
34Customer /
Market
Number of new Enterprise Gold accounts penetrated 20% 30 21 24 30
35Operations MLLN / MPLS network uptime (%) 15% 98% 96% 97% 98%
36Operations Average provisioning time for leased circuits(no. of days) 15% 30 90 60 30
37Operations Overall performance (on scale of 1 to 5 - to be assessed by Director -
Enterprise)
10% 5 3 4 5
38Financial Gross margin 20%
39 Financial Gross sales 30%
40Financial PBIT/Employment 20%
41 Financial Operating ratio (%) 20%
42Financial Budget adherence on opex (% actual spend vs. budgeted) (on items
excluding those in schedule P)
10%
43 Financial New Businesses revenue (Rs. Cr.) 15% 13.92 6.96 10.44 13.92
44Customer /
Market
Customer satisfaction level (including QoS) (Scale of 1 to 5) 20% 5 3 4 5
45
Financial Overall assessment on Finance related issues, including budget
adherence, financial planning, accounting, revenue assurance etc. (on
scale of 1 to 5 - to be assessed by Dir-Finance)
15% 5 3 4 5
46
Employee
development
Overall assessment on HR related issues, including training, recruiting,
promotion, transfers etc. (on scale of 1 to 5 - to be assessed by Dir-HR)
20% 5 3 4 5
47Overall
assessment
Overall performance (on scale of 1 to 5 - to be assessed by CMD) 30% 5 3 4 5
1. Marks for Good rating = 60, Very Good = 80, Excellent = 100. Marks achieved for rating below Good = 0. Achievement between Good and Very Good and between Very Good and Excellent would be linearly scaled CFA - CO Nodal designate: Mr. Tarun Kumar (Sr.GM, BP - CFA)
CA- CO Nodal designate: Mr. H. N. Singh (Sr. GM, MM-CA)
New Businesses - CO Nodal designate: Mr. Abdul Mazid (Sr.GM, TF - NB)
HR - CO Nodal designate: Mr. Neeraj Verma (GM, Training)
Finance - CO Nodal designate: Mr. KCGK Pillai (PGM,PF & Finance Personnel)
Note: i) Assessment by CMD and all directors of the BSNL board will be based on qualitative measures defined for the parameters
Others 10%
CM - CO Nodal designate: Mr. B.N. Mishra (Sr.GM, Product & Pricing)
Enterprise - CO Nodal designate: Mr. S. K. Seth
Enterprise 15%
Overall
Financial
Performance
30%
Maharastra Territorial Circle Page 30 of 52

Group
Group
level
weightage
S. No. Dimension KPI Weightage TargetTarget
Achieved
Marks
Achieved
Weighted
Score
Good Very Good Excellent
60 80 100
1 Financial CFA Revenue - Basic (LL, PCO,IN,USO rural phones/VPT subsidy in lieu
of ADC, VAS, etc.) (Rs. Cr.)
20% 282.000 169.20 225.60 282.00
2 Financial CFA Revenue - Broadband (including VAS, IPTV) (Rs. Cr.) 20% 131.00 78.60 104.80 131.00
3Customer /
Market
Net adds - (by number of subscribers) Basic (in 000's)5%
21.360 12.82 17.09 21.36
4Customer /
Market
Net adds - (by number of subscribers) Broadband (in 000's)7.5%
115 69.00 92.00 115
5Customer /
Market
Customer satisfaction level (including QoS) (Scale of 1 to 5)7.5%
5 3 4 5
6 Operations CCR rate for Landline – local 2% 75.00% 67.20% 70.80% 75.00%
7 Operations CCR rate for Landline – Junction 2% 65.50% 58.70% 61.80% 65.50%
8 Operations CCR rate for Landline – STD 2% 60.00% 54.20% 57.10% 60.00%
9 Operations Fault rate (LL) 2.0% 3.40% 4.10% 3.90% 3.40%
10 Operations Fault rate (BB) 2.0% 4.50 5.00 4.75 4.50
11 Operations % of faults cleared on same day (LL) 1% 93% 83.00% 87.4% 93%
12 Operations % of faults cleared by the following day (LL) 1% 98.0% 88.60% 93.30% 98.00%
13 Operations % of faults cleared within 3 days (LL) 1% 100% 92.15% 98.00% 100%
14 Operations % of faults cleared on same day (BB) 1% 55% 50% 54% 55%
15 Operations % of faults cleared by the following day (BB) 1% 93% 86% 91% 93%
16Operations % of new services (LL,) provisioned in area on demand within the norm
(7 days for LL)2% 100% 93.10% 98.00% 100%
17 Operations % LL local shift with in 3 days 1% 100% 91.10% 96.00% 100%
18 Operations % LL Inter-exchange shift with in 5 days 1% 100% 90.25% 95.00% 100%
19Operations % of new services ( BB) provisioned within the ( 7 days for BB)(Subject
To technical feasibility)5% 82% 75.00% 80.00% 82%
20 Operations CDR system based Customer care and monitoring mechanism 4.0% 5 3 4 5
21 Operations Acessibility of call centre 1.0% 99.75% 93.00% 98.00% 99.75%
22 Operations % of Calls answered by the operator(voice to voice ) within 60 seconds 1.0% 99.75% 93.00% 98.00% 99.75%
23Overall
performance Overall performance (on scale of 1 to 5 - to be assessed by CMD) 10% 5 3 4 5
24 Financial CM revenue (Rs. Cr.) 40% 554.93 332.96 443.94 554.93
25Customer /
Market
CM Net adds - GSM (by number of subscribers) (in 000's) 13% 654 392.40 523.20 654.00
26 Customer /
Market
CM Net adds - CDMA (by number of subscribers) (in 000's) 2% 75.73 45.44 60.58 75.73
27Customer /
Market
CM Net adds - Wi- Max (by number of subscribers) (in 000's) 5% 45.10 27.06 36.08 45.10
28 Operations BTS availability (%) 10% 98% 96% 97% 98%
29 Operations Call drop rate (%) 10% 2.0% 2.5% 2.2% 2.0%
30 Operations Blocked call rate - TCH congestion (%) 10% 2.0% 2.5% 2.2% 2.0%
31Operations Overall performance (on scale of 1 to 5 - to be assessed by Director - CM) 10% 5 3 4 5
Consumer
Mobility25%
Group Performance Management System - (2011-12)
Madhya Pradesh Territorial Circle
Scorecard
Performance Levels1
Consumer
Fixed Access20%
MP Territorial Circle Page 31 of 52

Group
Group
level
weightage
S. No. Dimension KPI Weightage TargetTarget
Achieved
Marks
Achieved
Weighted
Score
Good Very Good Excellent
60 80 100
Performance Levels1
32 Financial Enterprise BU revenue (Rs. Cr.) 40% 42.52 19.76 22.58 28.23
33Customer /
Market
Number of new Enterprise Gold accounts penetrated 20% 8 5 6 8
34 Operations MLLN / MPLS network uptime (%) 15% 98% 96% 97% 98%
35Operations Average provisioning time for leased circuits(no. of days) 15% 30 90 60 30
36 Operations Overall performance (on scale of 1 to 5 - to be assessed by Director -
Enterprise)
10% 5 3 4 5
37Financial Gross margin 20%
38 Financial Gross sales 30%
39Financial PBIT/Employment 20%
40 Financial Operating ratio (%) 20%
41Financial Budget adherence on opex (% actual spend vs. budgeted) (on items
excluding those in schedule P)
10%
42 Financial New Businesses revenue (Rs. Cr.) 15% 6.1 3.05 4.575 6.1
43Customer /
Market
Customer satisfaction level (including QoS) (Scale of 1 to 5) 20% 5 3 4 5
44 Financial Overall assessment on Finance related issues, including budget
adherence, financial planning, accounting, revenue assurance etc. (on
scale of 1 to 5 - to be assessed by Dir-Finance)
15% 5 3 4 5
45
Employee
development
Overall assessment on HR related issues, including training, recruiting,
promotion, transfers etc. (on scale of 1 to 5 - to be assessed by Dir-HR)
20% 5 3 4 5
46Overall
assessment
Overall performance (on scale of 1 to 5 - to be assessed by CMD) 30% 5 3 4 5
1. Marks for Good rating = 60, Very Good = 80, Excellent = 100. Marks achieved for rating below Good = 0. Achievement between Good and Very Good and between Very Good and Excellent would be linearly scaled CFA - CO Nodal designate: Mr. Tarun Kumar (Sr.GM, BP - CFA)
CA- CO Nodal designate: Mr. H. N. Singh (Sr. GM, MM-CA)
New Businesses - CO Nodal designate: Mr. Abdul Mazid (Sr.GM, TF - NB)
HR - CO Nodal designate: Mr. Neeraj Verma (GM, Training)
Finance - CO Nodal designate: Mr. KCGK Pillai (PGM,PF & Finance Personnel)
Note: i) Assessment by CMD and all directors of the BSNL board will be based on qualitative measures defined for the parameters
Others 10%
CM - CO Nodal designate: Mr. B.N. Mishra (Sr.GM, Product & Pricing)
Enterprise - CO Nodal designate: Mr. S. K. Seth
Enterprise 15%
Overall
Financial
Performance
30%
MP Territorial Circle Page 32 of 52

Group
Group
level
weightage
S. No. Dimension KPI Weightage TargetTarget
Achieved
Marks
Achieved
Weighted
Score
Good Very Good Excellent
60 80 100
1 Financial CFA Revenue - Basic (LL, PCO,IN,USO rural phones/VPT subsidy in lieu
of ADC, VAS, etc.) (Rs. Cr.)
20% 20.000 12.00 16.00 20.00
2 Financial CFA Revenue - Broadband (including VAS, IPTV) (Rs. Cr.) 20% 23.00 13.80 18.40 23.00
3 Customer / Net adds - (by number of subscribers) Basic (in 000's) 5% 3.461 2.08 2.77 3.46
4 Customer /
Market
Net adds - (by number of subscribers) Broadband (in 000's) 7.5% 15 9.00 12.00 15
5 Customer /
Market
Customer satisfaction level (including QoS) (Scale of 1 to 5) 7.5% 5 3 4 5
6 Operations CCR rate for Landline – local 2% 66.90% 60.00% 63.10% 66.90%
7 Operations CCR rate for Landline – Junction 2% 60.00% 53.80% 56.60% 60.00%
8 Operations CCR rate for Landline – STD 2% 53.40% 48.30% 50.80% 53.40%
9 Operations Fault rate (LL) 2.0% 4.50% 5.40% 5.20% 4.50%
10 Operations Fault rate (BB) 2.0% 5% 6% 5.25% 5%
11 Operations % of faults cleared on same day (LL) 1% 80% 71.40% 75.2% 80%
12 Operations % of faults cleared by the following day (LL) 1% 93.5% 84.50% 89.00% 93.50%
13 Operations % of faults cleared within 3 days (LL) 1% 100% 92.15% 98.00% 100%
14Operations
% of faults cleared on same day (BB) 1% 50% 46% 49% 50%
15 Operations % of faults cleared by the following day (BB) 1% 90% 82% 88% 90%
16Operations % of new services (LL,) provisioned in area on demand within the norm
(7 days for LL)2% 100% 93.10% 98.00% 100%
17 Operations % LL local shift with in 3 days 1% 100% 91.10% 96.00% 100%
18 Operations % LL Inter-exchange shift with in 5 days 1% 100% 90.25% 95.00% 100%
19Operations % of new services ( BB) provisioned within the ( 7 days for BB)(Subject
To technical feasibility)5% 77% 70.00% 75.00% 77%
21 Operations CDR system based Customer care and monitoring mechanism 4% 5 3 4 5
22 Operations Acessibility of call centre 1.0% 99.75% 93.00% 98.00% 99.75%
23Operations % of Calls answered by the operator(voice to voice ) within 60 seconds 1.0% 99.75% 93.00% 98.00% 99.75%
24Overall
performance Overall performance (on scale of 1 to 5 - to be assessed by CMD) 10% 5 3 4 5
25 Financial CM revenue (Rs. Cr.) 40% 99.69 59.81 79.75 99.69
26Customer /
Market
CM Net adds - GSM (by number of subscribers) (in 000's) 13% 97 58.20 77.60 97.00
27Customer /
Market
CM Net adds - CDMA (by number of subscribers) (in 000's) 2% 3.81 2.29 3.05 3.81
28Customer /
Market
CM Net adds - Wi Max(by number of subscribers) (in 000's) 5% 6.30 3.78 5.04 6.30
29 Operations BTS availability (%) 10% 98% 96% 97% 98%
30 Operations Call drop rate (%) 10% 2% 2.5% 2.2% 2%
31 Operations Blocked call rate - TCH congestion (%) 10% 2% 2.5% 2.2% 2%
32Operations Overall performance (on scale of 1 to 5 - to be assessed by Director - CM) 10% 5 3 4 5
Consumer
Mobility25%
Group Performance Management System - (2011-12)
NE-I Territorial Circle
Scorecard
Performance Levels1
Consumer
Fixed Access20%
NE-I Telecom Circle Page 33 of 52

Group
Group
level
weightage
S. No. Dimension KPI Weightage TargetTarget
Achieved
Marks
Achieved
Weighted
Score
Good Very Good Excellent
60 80 100
Performance Levels1
33Financial Enterprise BU revenue (Rs. Cr.) 40% 13.46 8.08 10.77 13.46
34Customer /
Market
Number of new Enterprise Gold accounts penetrated 20% 1 - - 1
35Operations MLLN / MPLS network uptime (%) 15% 98% 96% 97% 98%
36Operations Average provisioning time for leased circuits(no. of days) 15% 30 90 60 30
37Operations Overall performance (on scale of 1 to 5 - to be assessed by Director -
Enterprise)
10% 5 3 4 5
38Financial Gross margin 20%
39Financial Gross sales 30%
40Financial PBIT/Employment 20%
41 Financial Operating ratio (%) 20%
42Financial Budget adherence on opex (% actual spend vs. budgeted) (on items
excluding those in schedule P)
10%
43Financial New Businesses revenue (Rs. Cr.) 15% 1.52 0.76 1.14 1.52
44Customer /
Market
Customer satisfaction level (including QoS) (Scale of 1 to 5) 20% 5 3 4 5
45
Financial Overall assessment on Finance related issues, including budget
adherence, financial planning, accounting, revenue assurance etc. (on
scale of 1 to 5 - to be assessed by Dir-Finance)
15% 5 3 4 5
46
Employee
development
Overall assessment on HR related issues, including training, recruiting,
promotion, transfers etc. (on scale of 1 to 5 - to be assessed by Dir-HR)
20% 5 3 4 5
47Overall
assessment
Overall performance (on scale of 1 to 5 - to be assessed by CMD) 30% 5 3 4 5
1. Marks for Good rating = 60, Very Good = 80, Excellent = 100. Marks achieved for rating below Good = 0. Achievement between Good and Very Good and between Very Good and Excellent would be linearly scaled CFA - CO Nodal designate: Mr. Tarun Kumar (Sr.GM, BP - CFA)
CA- CO Nodal designate: Mr. H. N. Singh (Sr. GM, MM-CA)
New Businesses - CO Nodal designate: Mr. Abdul Mazid (Sr.GM, TF - NB)
HR - CO Nodal designate: Mr. Neeraj Verma (GM, Training)
Finance - CO Nodal designate: Mr. KCGK Pillai (PGM,PF & Finance Personnel)
Note: i) Assessment by CMD and all directors of the BSNL board will be based on qualitative measures defined for the parameters
Others 10%
CM - CO Nodal designate: Mr. B.N. Mishra (Sr.GM, Product & Pricing)
Enterprise - CO Nodal designate: Mr. S. K. Seth
Enterprise 15%
Overall
Financial
Performance
30%
NE-I Telecom Circle Page 34 of 52

Group
Group
level
weightage
S. No. Dimension KPI Weightage TargetTarget
Achieved
Marks
Achieved
Weighted
Score
Good Very Good Excellent
60 80 100
1 Financial CFA Revenue - Basic (LL, PCO,IN,USO rural phones/VPT subsidy in
lieu of ADC, VAS, etc.) (Rs. Cr.)
20% 33.600 6.00 26.88 33.60
2 Financial CFA Revenue - Broadband (including VAS, IPTV) (Rs. Cr.) 20% 11.00 6.60 8.80 11.00
3 Customer /
Market
Net adds - (by number of subscribers) Basic (in 000's) 5% 2.905 1.74 2.32 2.91
4 Customer /
Market
Net adds - (by number of subscribers) Broadband (in 000's) 7.5% 6.50 3.90 5.20 7
5 Customer /
Market
Customer satisfaction level (including QoS) (Scale of 1 to 5) 7.5% 5 3 4 5
6 Operations CCR rate for Landline – local 2% 66.90% 60.00% 63.10% 66.90%
7 Operations CCR rate for Landline – Junction 2% 60.00% 53.80% 56.60% 60.00%
8 Operations CCR rate for Landline – STD 2% 53.40% 48.30% 50.80% 53.40%
9 Operations Fault rate (LL) 2.0% 2.10% 2.50% 2.40% 2.10%
10 Operations Fault rate (BB) 2.0% 5% 6% 5.25% 5%
11 Operations % of faults cleared on same day (LL) 1% 86% 76.30% 80.3% 86%
12 Operations % of faults cleared by the following day (LL) 1% 97.0% 87.70% 92.30% 97.00%
13 Operations % of faults cleared within 3 days (LL) 1% 100% 92.15% 98.00% 100%
14 Operations % of faults cleared on same day (BB) 1% 50% 46% 49% 50%
15 Operations % of faults cleared by the following day (BB) 1% 92% 85% 90% 90%
16Operations % of new services (LL,) provisioned in area on demand within the norm
(7 days for LL)2% 100% 93.10% 98.00% 100%
17Operations
% LL local shift with in 3 days 1% 100% 91.10% 96.00% 100%
18Operations
% LL Inter-exchange shift with in 5 days 1% 100% 90.25% 95.00% 100%
19Operations % of new services ( BB) provisioned within the ( 7 days for BB)(Subject
To technical feasibility)5% 77% 70.00% 75.00% 77%
20Operations
CDR system based Customer care and monitoring mechanism 4.0% 5 3 4 5
21Operations
Acessibility of call centre 1.0% 99.75% 93.00% 98.00% 99.75%
22 Operations % of Calls answered by the operator(voice to voice ) within 60 seconds 1.0% 99.75% 93.00% 98.00% 99.75%
23Overall
performance Overall performance (on scale of 1 to 5 - to be assessed by CMD) 10% 5 3 4 5
24 Financial CM revenue (Rs. Cr.) 40% 214.20 128.52 171.36 214.20
25 Customer /
Market
CM Net adds - GSM (by number of subscribers) (in 000's) 13% 116 69.60 92.80 116.00
26 Customer /
Market
CM Net adds - CDMA (by number of subscribers) (in 000's) 2% 5 3 4 5
27 Customer /
Market
CM Net adds - Wi Max(by number of subscribers) (in 000's) 5% 5.9 3.54 4.72 5.9
28 Operations BTS availability (%) 10% 98% 96% 97% 98%
29 Operations Call drop rate (%) 10% 2.0% 2.5% 2.2% 2.0%
30 Operations Blocked call rate - TCH congestion (%) 10% 2.0% 2.5% 2.2% 2.0%
31Operations Overall performance (on scale of 1 to 5 - to be assessed by Director -
CM)
10% 5 3 4 5
Consumer
Mobility25%
Group Performance Management System - 2010-11)
NE-II Territorial Circle
Scorecard
Performance Levels1
Consumer
Fixed Access20%
NE-II Territorial Circle Page 35 of 52
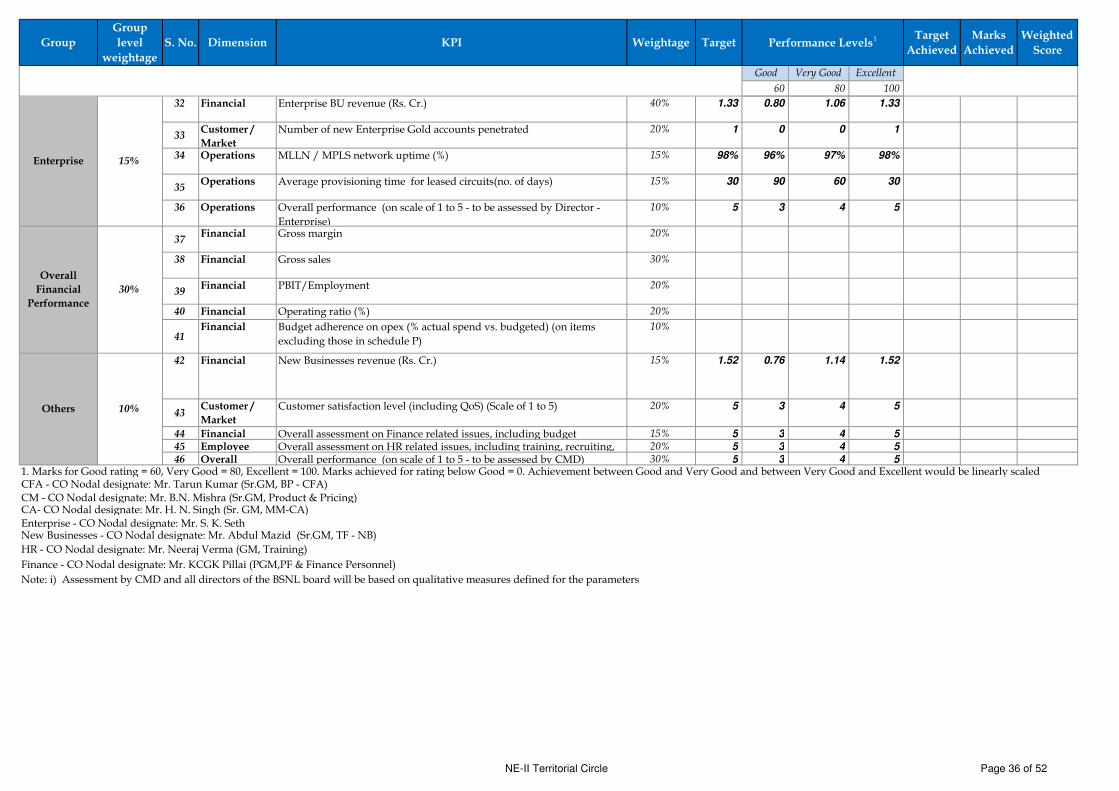
Group
Group
level
weightage
S. No. Dimension KPI Weightage TargetTarget
Achieved
Marks
Achieved
Weighted
Score
Good Very Good Excellent
60 80 100
Performance Levels1
32 Financial Enterprise BU revenue (Rs. Cr.) 40% 1.33 0.80 1.06 1.33
33Customer /
Market
Number of new Enterprise Gold accounts penetrated 20% 1 0 0 1
34 Operations MLLN / MPLS network uptime (%) 15% 98% 96% 97% 98%
35Operations Average provisioning time for leased circuits(no. of days) 15% 30 90 60 30
36 Operations Overall performance (on scale of 1 to 5 - to be assessed by Director -
Enterprise)
10% 5 3 4 5
37Financial Gross margin 20%
38 Financial Gross sales 30%
39Financial PBIT/Employment 20%
40 Financial Operating ratio (%) 20%
41Financial Budget adherence on opex (% actual spend vs. budgeted) (on items
excluding those in schedule P)
10%
42 Financial New Businesses revenue (Rs. Cr.) 15% 1.52 0.76 1.14 1.52
43Customer /
Market
Customer satisfaction level (including QoS) (Scale of 1 to 5) 20% 5 3 4 5
44 Financial Overall assessment on Finance related issues, including budget 15% 5 3 4 5
45 Employee Overall assessment on HR related issues, including training, recruiting, 20% 5 3 4 5
46 Overall Overall performance (on scale of 1 to 5 - to be assessed by CMD) 30% 5 3 4 5
1. Marks for Good rating = 60, Very Good = 80, Excellent = 100. Marks achieved for rating below Good = 0. Achievement between Good and Very Good and between Very Good and Excellent would be linearly scaled CFA - CO Nodal designate: Mr. Tarun Kumar (Sr.GM, BP - CFA)
CA- CO Nodal designate: Mr. H. N. Singh (Sr. GM, MM-CA)
New Businesses - CO Nodal designate: Mr. Abdul Mazid (Sr.GM, TF - NB)
HR - CO Nodal designate: Mr. Neeraj Verma (GM, Training)
Finance - CO Nodal designate: Mr. KCGK Pillai (PGM,PF & Finance Personnel)
Note: i) Assessment by CMD and all directors of the BSNL board will be based on qualitative measures defined for the parameters
Others 10%
CM - CO Nodal designate: Mr. B.N. Mishra (Sr.GM, Product & Pricing)
Enterprise - CO Nodal designate: Mr. S. K. Seth
Enterprise 15%
Overall
Financial
Performance
30%
NE-II Territorial Circle Page 36 of 52

Group
Group
level
weightage
S. No. Dimension KPI Weightage TargetTarget
Achieved
Marks
Achieved
Weighted
Score
Good Very Good Excellent
60 80 100
1 Financial CFA Revenue - Basic (LL, PCO,IN,USO rural phones/VPT subsidy in
lieu of ADC, VAS, etc.) (Rs. Cr.)
20% 115.000 69.00 92.00 115.00
2 Financial CFA Revenue - Broadband (including VAS, IPTV) (Rs. Cr.) 20% 100.00 60.00 80.00 100.00
3 Customer /
Market
Net adds - (by number of subscribers) Basic (in 000's) 5% 13.178 7.91 10.54 13.18
4 Customer /
Market
Net adds - (by number of subscribers) Broadband (in 000's) 7.5% 90 54.00 72.00 90
5 Customer /
Market
Customer satisfaction level (including QoS) (Scale of 1 to 5) 7.5% 5 3 4 5
6 Operations CCR rate for Landline – local 2% 66.90% 60.00% 63.10% 66.90%
7 Operations CCR rate for Landline – Junction 2% 60.00% 53.80% 56.60% 60.00%
8 Operations CCR rate for Landline – STD 2% 53.40% 48.30% 50.80% 53.40%
9 Operations Fault rate (LL) 2.0% 4.30% 5.20% 5.00% 4.30%
10 Operations Fault rate (BB) 2.0% 5% 5% 4.75% 5%
11 Operations % of faults cleared on same day (LL) 1% 87% 77.70% 81.7% 87%
12 Operations % of faults cleared by the following day (LL) 1% 95.5% 86.30% 90.90% 95.50%
13 Operations % of faults cleared within 3 days (LL) 1% 100% 92.15% 98.00% 100%
14 Operations % of faults cleared on same day (BB) 1% 55% 50% 54% 55%
15 Operations % of faults cleared by the following day (BB) 1% 92% 85% 90% 92%
16Operations % of new services (LL,) provisioned in area on demand within the norm
(7 days for LL)2% 100% 93.10% 98.00% 100%
17 Operations % LL local shift with in 3 days 1% 100% 91.10% 96.00% 100%
18 Operations % LL Inter-exchange shift with in 5 days 1% 100% 90.25% 95.00% 100%
19Operations % of new services ( BB) provisioned within the ( 7 days for BB)(Subject
To technical feasibility)5% 82% 75.00% 80.00% 82%
20 Operations CDR system based Customer care and monitoring mechanism 4.0% 5 3 4 5
21 Operations Acessibility of call centre 1.0% 99.75% 93.00% 98.00% 99.75%
22 Operations % of Calls answered by the operator(voice to voice ) within 60 seconds 1.0% 99.75% 93.00% 98.00% 99.75%
23Overall
performance Overall performance (on scale of 1 to 5 - to be assessed by CMD) 10% 5 3 4 5
24 Financial CM revenue (Rs. Cr.) 40% 762.82 457.69 610.26 762.82
25Customer /
Market
CM Net adds - GSM (by number of subscribers) (in 000's) 13% 920 552.00 736.00 920.00
26 Customer /
Market
CM Net adds - CDMA (by number of subscribers) (in 000's) 2% 16.73 10.04 13.38 16.73
27 Customer /
Market
CM Net adds -WiMAX (by number of subscribers) (in 000's) 5% 32.85 19.71 26.28 32.85
28 Operations BTS availability (%) 10% 98% 96% 97% 98%
29 Operations Call drop rate (%) 10% 2% 2.5% 2.2% 2%
30 Operations Blocked call rate - TCH congestion (%) 10% 2% 2.5% 2.2% 2%
31Operations Overall performance (on scale of 1 to 5 - to be assessed by Director -
CM)
10% 5 3 4 5
Consumer
Mobility25%
Group Performance Management System (2011-12)
Orissa Territorial Circle
Scorecard
Performance Levels1
Consumer
Fixed Access20%
Orissa Territorial Circle Page 37 of 52

Group
Group
level
weightage
S. No. Dimension KPI Weightage TargetTarget
Achieved
Marks
Achieved
Weighted
Score
Good Very Good Excellent
60 80 100
Performance Levels1
32 Financial Enterprise BU revenue (Rs. Cr.) 40% 37.67 22.60 30.13 37.67
33Customer /
Market
Number of new Enterprise Gold accounts penetrated 20% 5 3 4 f
34 Operations MLLN / MPLS network uptime (%) 15% 98% 96% 97% 98%
35Operations Average provisioning time for leased circuits(no. of days) 15% 30 90 60 30
36 Operations Overall performance (on scale of 1 to 5 - to be assessed by Director -
Enterprise)
10% 5 3 4 5
37Financial Gross margin 20%
38 Financial Gross sales 30%
39Financial PBIT/Employment 20%
40 Financial Operating ratio (%) 20%
41Financial Budget adherence on opex (% actual spend vs. budgeted) (on items
excluding those in schedule P)
10%
42 Financial New Businesses revenue (Rs. Cr.) 15% 5.01 2.505 3.7575 5.01
43Customer /
Market
Customer satisfaction level (including QoS) (Scale of 1 to 5) 20% 5 3 4 5
44 Financial Overall assessment on Finance related issues, including budget
adherence, financial planning, accounting, revenue assurance etc. (on
scale of 1 to 5 - to be assessed by Dir-Finance)
15% 5 3 4 5
45
Employee
development
Overall assessment on HR related issues, including training, recruiting,
promotion, transfers etc. (on scale of 1 to 5 - to be assessed by Dir-HR)
20% 5 3 4 5
46 Overall
assessment
Overall performance (on scale of 1 to 5 - to be assessed by CMD) 30% 5 3 4 5
1. Marks for Good rating = 60, Very Good = 80, Excellent = 100. Marks achieved for rating below Good = 0. Achievement between Good and Very Good and between Very Good and Excellent would be linearly scaled CFA - CO Nodal designate: Mr. Tarun Kumar (Sr.GM, BP - CFA)
CA- CO Nodal designate: Mr. H. N. Singh (Sr. GM, MM-CA)
New Businesses - CO Nodal designate: Mr. Abdul Mazid (Sr.GM, TF - NB)
HR - CO Nodal designate: Mr. Neeraj Verma (GM, Training)
Finance - CO Nodal designate: Mr. KCGK Pillai (PGM,PF & Finance Personnel)
Note: i) Assessment by CMD and all directors of the BSNL board will be based on qualitative measures defined for the parameters
Others 10%
CM - CO Nodal designate: Mr. B.N. Mishra (Sr.GM, Product & Pricing)
Enterprise - CO Nodal designate: Mr. S. K. Seth
Enterprise 15%
Overall
Financial
Performance
30%
Orissa Territorial Circle Page 38 of 52

Group
Group
level
weightage
S. No. Dimension KPI Weightage TargetTarget
Achieved
Marks
Achieved
Weighted
Score
Good Very Good Excellent
60 80 100
1 Financial CFA Revenue - Basic (LL, PCO,IN,USO rural phones/VPT subsidy in
lieu of ADC, VAS, etc.) (Rs. Cr.)20% 345.000 207.00 276.00 345.00
2 Financial CFA Revenue - Broadband (including VAS, IPTV) (Rs. Cr.) 20% 238.00 142.80 190.40 238.00
3 Customer /
Market
Net adds - (by number of subscribers) Basic (in 000's) 5% 29.078 17.45 23.26 29.08
4 Customer /
Market
Net adds - (by number of subscribers) Broadband (in 000's) 7.5% 220 132.00 176.00 220
5 Customer /
Market
Customer satisfaction level (including QoS) (Scale of 1 to 5) 7.5% 5 3 4 5
6 Operations CCR rate for Landline – local 2% 72.00% 64.50% 67.90% 72.00%
7 Operations CCR rate for Landline – Junction 2% 60.00% 53.80% 56.60% 60.00%
8 Operations CCR rate for Landline – STD 2% 53.40% 48.30% 50.80% 53.40%
9 Operations Fault rate (LL) 2.0% 5.00% 6.00% 5.80% 5.00%
10 Operations Fault rate (BB) 2.0% 4% 5% 4.25% 4%
11 Operations % of faults cleared on same day (LL) 1% 80% 71.40% 75.2% 80%
12 Operations % of faults cleared by the following day (LL) 1% 94.5% 85.40% 89.90% 94.50%
13 Operations % of faults cleared within 3 days (LL) 1% 100% 92.15% 98.00% 100%
14 Operations % of faults cleared on same day (BB) 1% 60% 56% 59% 60%
15 Operations % of faults cleared by the following day (BB) 1% 93% 86% 91% 93%
16Operations % of new services (LL,) provisioned in area on demand within the norm
(7 days for LL)2% 100% 93.10% 98.00% 100%
17 Operations % LL local shift with in 3 days 1% 100% 91.10% 96.00% 100%
18 Operations % LL Inter-exchange shift with in 5 days 1% 100% 90.25% 95.00% 100%
19Operations % of new services ( BB) provisioned within the ( 7 days for BB)(Subject
To technical feasibility)5% 87% 80.00% 85.00% 87%
20 Operations Establishment of Data centres 2% 5% 3.00% 4.00% 5%
21 Operations CDR system based Customer care and monitoring mechanism 2% 5 3 4 5
22 Operations Acessibility of call centre 1.0% 99.75% 93.00% 98.00% 99.75%
23Operations % of Calls answered by the operator(voice to voice ) within 60 seconds 1.0% 99.75% 93.00% 98.00% 99.75%
24Overall
performance Overall performance (on scale of 1 to 5 - to be assessed by CMD) 10% 5 3 4 5
17 Financial CM revenue (Rs. Cr.) 40% 735.37 441.222 588.296 735.37
18 Customer /
Market
CM Net adds - GSM (by number of subscribers) (in 000's) 13% 781 468.6 624.8 781
19 Customer /
Market
CM Net adds - CDMA (by number of subscribers) (in 000's) 2% 12.6 7.56 10.08 12.6
20 Customer /
Market
CM Net adds - WiMAX (by number of subscribers) (in 000's) 5% 71.05 42.63 56.84 71.05
21Operations BTS availability (%) 10% 98% 96% 97% 98%
22 Operations Call drop rate (%) 10% 2% 2.5% 2.2% 2%
23 Operations Blocked call rate - TCH congestion (%) 10% 2% 2.5% 2.2% 2%
24Operations Overall performance (on scale of 1 to 5 - to be assessed by Director - CM) 10% 5 3 4 5
Consumer
Mobility25%
Group Performance Management System (2010-11)
Punjab Territorial Circle
Scorecard
Performance Levels1
Consumer
Fixed Access20%
Punjab Territorial Circle Page 39 of 52
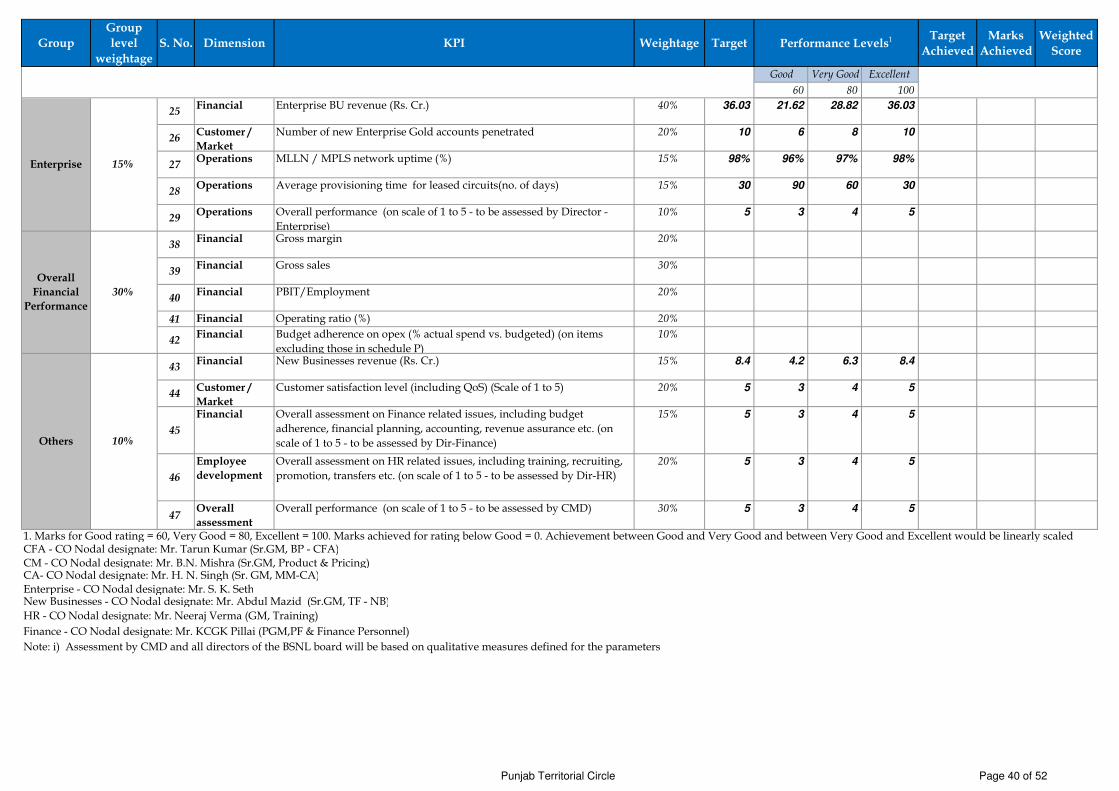
Group
Group
level
weightage
S. No. Dimension KPI Weightage TargetTarget
Achieved
Marks
Achieved
Weighted
Score
Good Very Good Excellent
60 80 100
Performance Levels1
25Financial Enterprise BU revenue (Rs. Cr.) 40% 36.03 21.62 28.82 36.03
26Customer /
Market
Number of new Enterprise Gold accounts penetrated 20% 10 6 8 10
27Operations MLLN / MPLS network uptime (%) 15% 98% 96% 97% 98%
28Operations Average provisioning time for leased circuits(no. of days) 15% 30 90 60 30
29Operations Overall performance (on scale of 1 to 5 - to be assessed by Director -
Enterprise)
10% 5 3 4 5
38Financial Gross margin 20%
39Financial Gross sales 30%
40Financial PBIT/Employment 20%
41 Financial Operating ratio (%) 20%
42Financial Budget adherence on opex (% actual spend vs. budgeted) (on items
excluding those in schedule P)
10%
43Financial New Businesses revenue (Rs. Cr.) 15% 8.4 4.2 6.3 8.4
44Customer /
Market
Customer satisfaction level (including QoS) (Scale of 1 to 5) 20% 5 3 4 5
45
Financial Overall assessment on Finance related issues, including budget
adherence, financial planning, accounting, revenue assurance etc. (on
scale of 1 to 5 - to be assessed by Dir-Finance)
15% 5 3 4 5
46
Employee
development
Overall assessment on HR related issues, including training, recruiting,
promotion, transfers etc. (on scale of 1 to 5 - to be assessed by Dir-HR)
20% 5 3 4 5
47Overall
assessment
Overall performance (on scale of 1 to 5 - to be assessed by CMD) 30% 5 3 4 5
1. Marks for Good rating = 60, Very Good = 80, Excellent = 100. Marks achieved for rating below Good = 0. Achievement between Good and Very Good and between Very Good and Excellent would be linearly scaled CFA - CO Nodal designate: Mr. Tarun Kumar (Sr.GM, BP - CFA)
CA- CO Nodal designate: Mr. H. N. Singh (Sr. GM, MM-CA)
New Businesses - CO Nodal designate: Mr. Abdul Mazid (Sr.GM, TF - NB)
HR - CO Nodal designate: Mr. Neeraj Verma (GM, Training)
Finance - CO Nodal designate: Mr. KCGK Pillai (PGM,PF & Finance Personnel)
Note: i) Assessment by CMD and all directors of the BSNL board will be based on qualitative measures defined for the parameters
Others 10%
CM - CO Nodal designate: Mr. B.N. Mishra (Sr.GM, Product & Pricing)
Enterprise - CO Nodal designate: Mr. S. K. Seth
Enterprise 15%
Overall
Financial
Performance
30%
Punjab Territorial Circle Page 40 of 52
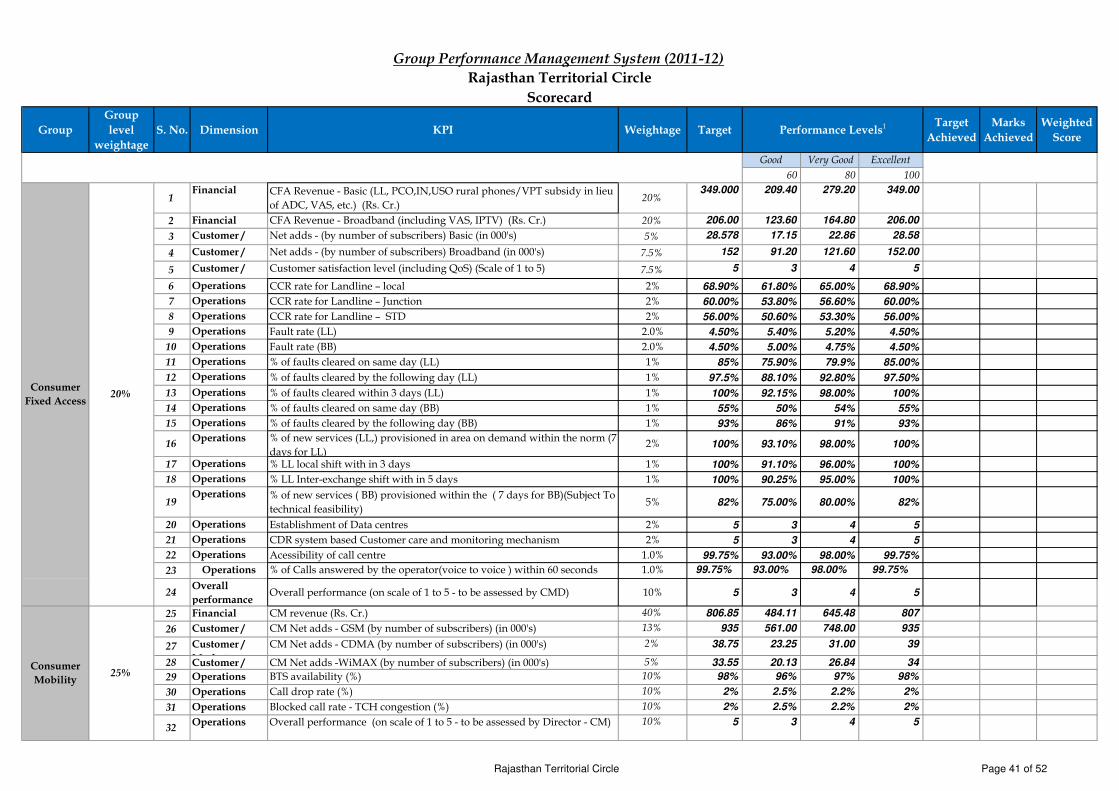
Group
Group
level
weightage
S. No. Dimension KPI Weightage TargetTarget
Achieved
Marks
Achieved
Weighted
Score
Good Very Good Excellent
60 80 100
1Financial CFA Revenue - Basic (LL, PCO,IN,USO rural phones/VPT subsidy in lieu
of ADC, VAS, etc.) (Rs. Cr.)20%
349.000 209.40 279.20 349.00
2 Financial CFA Revenue - Broadband (including VAS, IPTV) (Rs. Cr.) 20% 206.00 123.60 164.80 206.00
3 Customer /
Market
Net adds - (by number of subscribers) Basic (in 000's) 5% 28.578 17.15 22.86 28.58
4 Customer /
Market
Net adds - (by number of subscribers) Broadband (in 000's) 7.5% 152 91.20 121.60 152.00
5 Customer /
Market
Customer satisfaction level (including QoS) (Scale of 1 to 5) 7.5% 5 3 4 5
6 Operations CCR rate for Landline – local 2% 68.90% 61.80% 65.00% 68.90%
7 Operations CCR rate for Landline – Junction 2% 60.00% 53.80% 56.60% 60.00%
8 Operations CCR rate for Landline – STD 2% 56.00% 50.60% 53.30% 56.00%
9 Operations Fault rate (LL) 2.0% 4.50% 5.40% 5.20% 4.50%
10 Operations Fault rate (BB) 2.0% 4.50% 5.00% 4.75% 4.50%
11 Operations % of faults cleared on same day (LL) 1% 85% 75.90% 79.9% 85.00%
12 Operations % of faults cleared by the following day (LL) 1% 97.5% 88.10% 92.80% 97.50%
13 Operations % of faults cleared within 3 days (LL) 1% 100% 92.15% 98.00% 100%
14 Operations % of faults cleared on same day (BB) 1% 55% 50% 54% 55%
15 Operations % of faults cleared by the following day (BB) 1% 93% 86% 91% 93%
16Operations % of new services (LL,) provisioned in area on demand within the norm (7
days for LL)2% 100% 93.10% 98.00% 100%
17 Operations % LL local shift with in 3 days 1% 100% 91.10% 96.00% 100%
18 Operations % LL Inter-exchange shift with in 5 days 1% 100% 90.25% 95.00% 100%
19Operations % of new services ( BB) provisioned within the ( 7 days for BB)(Subject To
technical feasibility)5% 82% 75.00% 80.00% 82%
20 Operations Establishment of Data centres 2% 5 3 4 5
21 Operations CDR system based Customer care and monitoring mechanism 2% 5 3 4 5
22 Operations Acessibility of call centre 1.0% 99.75% 93.00% 98.00% 99.75%
23 Operations % of Calls answered by the operator(voice to voice ) within 60 seconds 1.0% 99.75% 93.00% 98.00% 99.75%
24Overall
performance Overall performance (on scale of 1 to 5 - to be assessed by CMD) 10% 5 3 4 5
25 Financial CM revenue (Rs. Cr.) 40% 806.85 484.11 645.48 807
26 Customer /
Market
CM Net adds - GSM (by number of subscribers) (in 000's) 13% 935 561.00 748.00 935
27 Customer /
Market
CM Net adds - CDMA (by number of subscribers) (in 000's) 2% 38.75 23.25 31.00 39
28 Customer / CM Net adds -WiMAX (by number of subscribers) (in 000's) 5% 33.55 20.13 26.84 34
29 Operations BTS availability (%) 10% 98% 96% 97% 98%
30 Operations Call drop rate (%) 10% 2% 2.5% 2.2% 2%
31 Operations Blocked call rate - TCH congestion (%) 10% 2% 2.5% 2.2% 2%
32Operations Overall performance (on scale of 1 to 5 - to be assessed by Director - CM) 10% 5 3 4 5
Consumer
Mobility25%
Group Performance Management System (2011-12)
Rajasthan Territorial Circle
Scorecard
Performance Levels1
Consumer
Fixed Access20%
Rajasthan Territorial Circle Page 41 of 52
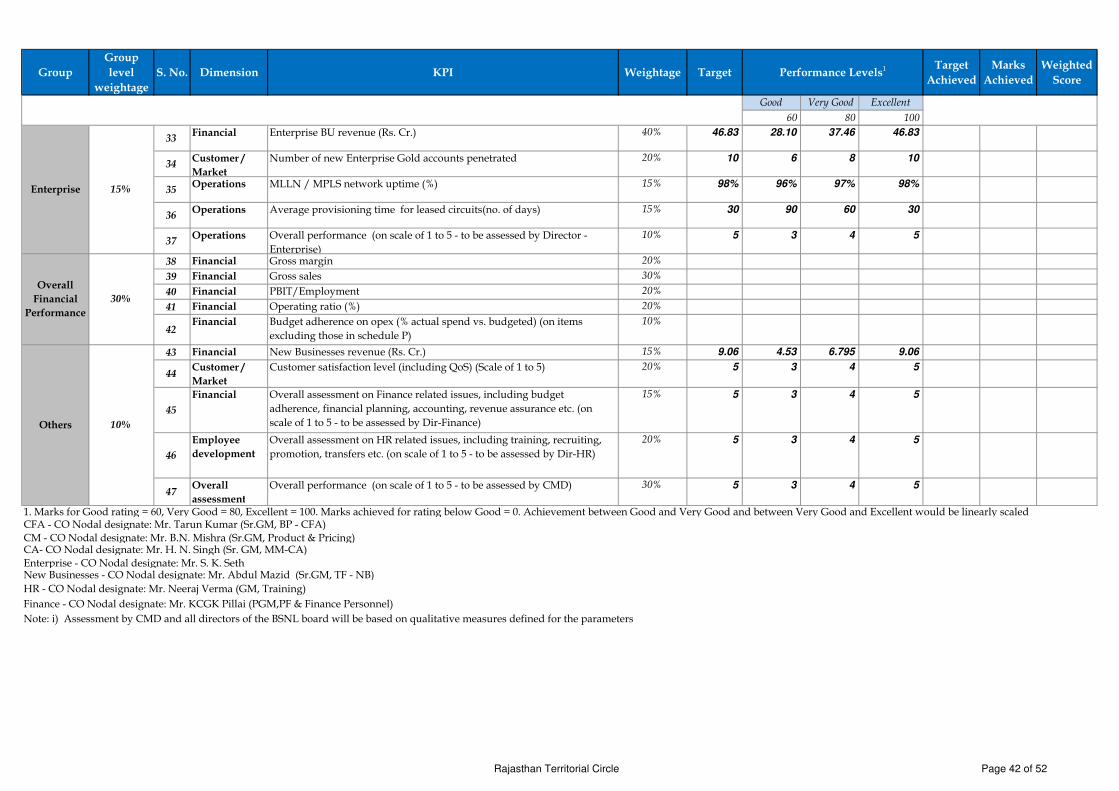
Group
Group
level
weightage
S. No. Dimension KPI Weightage TargetTarget
Achieved
Marks
Achieved
Weighted
Score
Good Very Good Excellent
60 80 100
Performance Levels1
33Financial Enterprise BU revenue (Rs. Cr.) 40% 46.83 28.10 37.46 46.83
34Customer /
Market
Number of new Enterprise Gold accounts penetrated 20% 10 6 8 10
35Operations MLLN / MPLS network uptime (%) 15% 98% 96% 97% 98%
36Operations Average provisioning time for leased circuits(no. of days) 15% 30 90 60 30
37Operations Overall performance (on scale of 1 to 5 - to be assessed by Director -
Enterprise)
10% 5 3 4 5
38 Financial Gross margin 20%
39 Financial Gross sales 30%
40 Financial PBIT/Employment 20%
41 Financial Operating ratio (%) 20%
42Financial Budget adherence on opex (% actual spend vs. budgeted) (on items
excluding those in schedule P)
10%
43 Financial New Businesses revenue (Rs. Cr.) 15% 9.06 4.53 6.795 9.06
44Customer /
Market
Customer satisfaction level (including QoS) (Scale of 1 to 5) 20% 5 3 4 5
45
Financial Overall assessment on Finance related issues, including budget
adherence, financial planning, accounting, revenue assurance etc. (on
scale of 1 to 5 - to be assessed by Dir-Finance)
15% 5 3 4 5
46
Employee
development
Overall assessment on HR related issues, including training, recruiting,
promotion, transfers etc. (on scale of 1 to 5 - to be assessed by Dir-HR)
20% 5 3 4 5
47Overall
assessment
Overall performance (on scale of 1 to 5 - to be assessed by CMD) 30% 5 3 4 5
1. Marks for Good rating = 60, Very Good = 80, Excellent = 100. Marks achieved for rating below Good = 0. Achievement between Good and Very Good and between Very Good and Excellent would be linearly scaled CFA - CO Nodal designate: Mr. Tarun Kumar (Sr.GM, BP - CFA)
CA- CO Nodal designate: Mr. H. N. Singh (Sr. GM, MM-CA)
New Businesses - CO Nodal designate: Mr. Abdul Mazid (Sr.GM, TF - NB)
HR - CO Nodal designate: Mr. Neeraj Verma (GM, Training)
Finance - CO Nodal designate: Mr. KCGK Pillai (PGM,PF & Finance Personnel)
Note: i) Assessment by CMD and all directors of the BSNL board will be based on qualitative measures defined for the parameters
Others 10%
CM - CO Nodal designate: Mr. B.N. Mishra (Sr.GM, Product & Pricing)
Enterprise - CO Nodal designate: Mr. S. K. Seth
Enterprise 15%
Overall
Financial
Performance
30%
Rajasthan Territorial Circle Page 42 of 52

Group
Group
level
weightage
S. No. Dimension KPI Weightage TargetTarget
Achieved
Marks
Achieved
Weighted
Score
Good Very Good Excellent
60 80 100
1 Financial CFA Revenue - Basic (LL, PCO,IN,USO rural phones/VPT subsidy in
lieu of ADC, VAS, etc.) (Rs. Cr.)
20% 564.000 338.40 451.20 564.00
2 Financial CFA Revenue - Broadband (including VAS, IPTV) (Rs. Cr.) 20% 435.00 261.00 348.00 435.00
3 Customer /
Market
Net adds - (by number of subscribers) Basic (in 000's) 5% 42.763 25.66 34.21 42.76
4Customer /
Market
Net adds - (by number of subscribers) Broadband (in 000's)7.5%
350 210.00 280.00 350
5 Customer /
Market
Customer satisfaction level (including QoS) (Scale of 1 to 5) 7.5% 5 3 4 5
6 Operations CCR rate for Landline – local 2% 81.00% 72.60% 76.40% 81.00%
7 Operations CCR rate for Landline – Junction 2% 73.00% 65.40% 68.90% 73.00%
8 Operations CCR rate for Landline – STD 2% 71.00% 64.20% 67.60% 71.00%
9 Operations Fault rate (LL) 2.0% 2.90% 3.50% 3.30% 2.90%
10 Operations Fault rate (BB) 2.0% 4.00% 4.50% 4.25% 4.00%
11 Operations % of faults cleared on same day (LL) 1% 89% 79.40% 83.6% 89.00%
12 Operations % of faults cleared by the following day (LL) 1% 97.5% 88.10% 92.80% 97.50%
13 Operations % of faults cleared within 3 days (LL) 1% 100% 92.15% 98.00% 100%
14 Operations % of faults cleared on same day (BB) 1% 60% 56% 59% 60%
15 Operations % of faults cleared by the following day (BB) 1% 93% 86% 91% 93%
16Operations % of new services (LL,) provisioned in area on demand within the norm
(7 days for LL)2% 100% 93.10% 98.00% 100%
17 Operations % LL local shift with in 3 days 1% 100% 91.10% 96.00% 100%
18 Operations % LL Inter-exchange shift with in 5 days 1% 100% 90.25% 95.00% 100%
19Operations % of new services ( BB) provisioned within the ( 7 days for BB)(Subject
To technical feasibility)5% 87% 80.00% 85.00% 87%
20 Operations CDR system based Customer care and monitoring mechanism 4.0% 5 3 4 5
21 Operations Acessibility of call centre 1.0% 99.75% 93.00% 98.00% 99.75%
22 Operations % of Calls answered by the operator(voice to voice ) within 60 seconds 1.0% 99.75% 93.00% 98.00% 99.75%
23Overall
performance Overall performance (on scale of 1 to 5 - to be assessed by CMD) 10% 5 3 4 5
24 Financial CM revenue (Rs. Cr.) 40% 1290.64 774.38 1032.51 1290.64
25 Customer / CM Net adds - GSM (by number of subscribers) (in 000's) 13% 1909 1145.40 1527.20 1909.00
26 Customer /
Market
CM Net adds - CDMA (by number of subscribers) (in 000's) 2% 35.85 21.51 28.68 35.85
27 Customer /
Market
CM Net adds - Wi Max(by number of subscribers) (in 000's) 5% 49.15 29.49 39.32 49.15
28 Operations BTS availability (%) 10% 98% 96% 97% 98%
29 Operations Call drop rate (%) 10% 2.0% 2.5% 2.2% 2.0%
30 Operations Blocked call rate - TCH congestion (%) 10% 2.0% 2.5% 2.2% 2.0%
31Operations Overall performance (on scale of 1 to 5 - to be assessed by Director -
CM)
10% 5 3 4 5
Consumer
Mobility25%
Group Performance Management System - (2010-11)
Tamil Nadu Territorial Circle
Scorecard
Performance Levels1
Consumer
Fixed Access20%
Tamil Nadu Territorial Circle Page 43 of 52
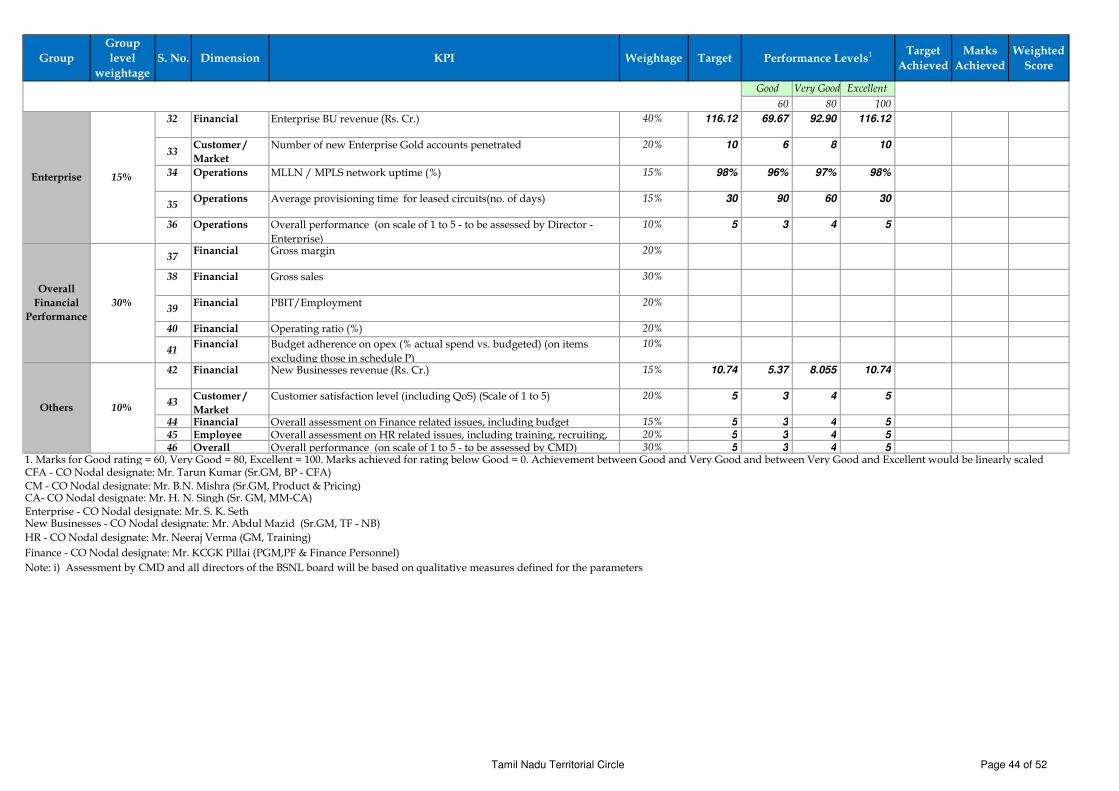
Group
Group
level
weightage
S. No. Dimension KPI Weightage TargetTarget
Achieved
Marks
Achieved
Weighted
Score
Good Very Good Excellent
60 80 100
Performance Levels1
32 Financial Enterprise BU revenue (Rs. Cr.) 40% 116.12 69.67 92.90 116.12
33Customer /
Market
Number of new Enterprise Gold accounts penetrated 20% 10 6 8 10
34 Operations MLLN / MPLS network uptime (%) 15% 98% 96% 97% 98%
35Operations Average provisioning time for leased circuits(no. of days) 15% 30 90 60 30
36 Operations Overall performance (on scale of 1 to 5 - to be assessed by Director -
Enterprise)
10% 5 3 4 5
37Financial Gross margin 20%
38 Financial Gross sales 30%
39Financial PBIT/Employment 20%
40 Financial Operating ratio (%) 20%
41Financial Budget adherence on opex (% actual spend vs. budgeted) (on items
excluding those in schedule P)
10%
42 Financial New Businesses revenue (Rs. Cr.) 15% 10.74 5.37 8.055 10.74
43Customer /
Market
Customer satisfaction level (including QoS) (Scale of 1 to 5) 20% 5 3 4 5
44 Financial Overall assessment on Finance related issues, including budget 15% 5 3 4 5
45 Employee Overall assessment on HR related issues, including training, recruiting, 20% 5 3 4 5
46 Overall Overall performance (on scale of 1 to 5 - to be assessed by CMD) 30% 5 3 4 5
1. Marks for Good rating = 60, Very Good = 80, Excellent = 100. Marks achieved for rating below Good = 0. Achievement between Good and Very Good and between Very Good and Excellent would be linearly scaled CFA - CO Nodal designate: Mr. Tarun Kumar (Sr.GM, BP - CFA)
CA- CO Nodal designate: Mr. H. N. Singh (Sr. GM, MM-CA)
New Businesses - CO Nodal designate: Mr. Abdul Mazid (Sr.GM, TF - NB)
HR - CO Nodal designate: Mr. Neeraj Verma (GM, Training)
Finance - CO Nodal designate: Mr. KCGK Pillai (PGM,PF & Finance Personnel)
Note: i) Assessment by CMD and all directors of the BSNL board will be based on qualitative measures defined for the parameters
Others 10%
CM - CO Nodal designate: Mr. B.N. Mishra (Sr.GM, Product & Pricing)
Enterprise - CO Nodal designate: Mr. S. K. Seth
Enterprise 15%
Overall
Financial
Performance
30%
Tamil Nadu Territorial Circle Page 44 of 52

Group
Group
level
weightage
S. No. Dimension KPI Weightage TargetTarget
Achieved
Marks
Achieved
Weighted
Score
Good Very Good Excellent
60 80 100
1 Financial CFA Revenue - Basic (LL, PCO,IN,USO rural phones/VPT subsidy in
lieu of ADC, VAS, etc.) (Rs. Cr.)20% 239.000 143.40 191.20 239.00
2 Financial CFA Revenue - Broadband (including VAS, IPTV) (Rs. Cr.) 20% 173.00 103.80 138.40 173.00
3 Customer /
Market
Net adds - (by number of subscribers) Basic (in 000's) 5% 32.483 19.49 25.99 32.48
4 Customer /
Market
Net adds - (by number of subscribers) Broadband (in 000's) 7.5% 105 63.00 84.00 105
5 Customer /
Market
Customer satisfaction level (including QoS) (Scale of 1 to 5) 7.5% 5 3 4 5
6 Operations CCR rate for Landline – local 2% 72.00% 64.50% 67.90% 72.00%
7 Operations CCR rate for Landline – Junction 2% 60.50% 54.20% 57.10% 60.50%
8 Operations CCR rate for Landline – STD 2% 56.00% 50.60% 53.30% 56.00%
9 Operations Fault rate (LL) 2.0% 4.30% 5.20% 5.00% 4.30%
10 Operations Fault rate (BB) 2.0% 4.50% 5% 4.75% 4.50%
11 Operations % of faults cleared on same day (LL) 1% 88% 78.50% 82.7% 88.00%
12 Operations % of faults cleared by the following day (LL) 1% 96.5% 87.20% 91.80% 96.50%
13 Operations % of faults cleared within 3 days (LL) 1% 100% 92.15% 98.00% 100%
14 Operations % of faults cleared on same day (BB) 1% 55% 50% 54% 55%
15 Operations % of faults cleared by the following day (BB) 1% 92% 85% 90% 92%
16Operations % of new services (LL,) provisioned in area on demand within the norm
(7 days for LL)2% 100% 93.10% 98.00% 100%
17 Operations % LL local shift with in 3 days 1% 100% 91.10% 96.00% 100%
18 Operations % LL Inter-exchange shift with in 5 days 1% 100% 90.25% 95.00% 100%
19Operations % of new services ( BB) provisioned within the ( 7 days for BB)(Subject
To technical feasibility)5% 82% 75.00% 80.00% 82%
20 Operations CDR system based Customer care and monitoring mechanism 4.0% 5 3 4 5
21 Operations Acessibility of call centre 1.0% 99.75% 93.00% 98.00% 99.75%
22 Operations % of Calls answered by the operator(voice to voice ) within 60 seconds 1.0% 99.75% 93.00% 98.00% 99.75%
23Overall
performance Overall performance (on scale of 1 to 5 - to be assessed by CMD) 10% 5 3 4 5
24 Financial CM revenue (Rs. Cr.) 40% 1261.83 757.10 1009.46 1261.83
25 Customer /
Market
CM Net adds - GSM (by number of subscribers) (in 000's) 13% 1837 1102.20 1469.60 1837.00
26 Customer /
Market
CM Net adds - CDMA (by number of subscribers) (in 000's) 2% 39.30 23.58 31.44 39.30
27 Customer /
Market
CM Net adds -WiMAX (by number of subscribers) (in 000's) 5% 20.20 12.12 16.16 20.20
28 Operations BTS availability (%) 10% 98% 96% 97% 98%
29 Operations Call drop rate (%) 10% 2.0% 2.5% 2.2% 2.0%
30 Operations Blocked call rate - TCH congestion (%) 10% 2.0% 2.5% 2.2% 2.0%
31Operations Overall performance (on scale of 1 to 5 - to be assessed by Director - CM) 10% 5 3 4 5
Consumer
Mobility25%
Group Performance Management System (2011-12)
UP(East) Territorial Circle
Scorecard
Performance Levels1
Consumer
Fixed Access20%
UP (East)Telecom Circle Page 45 of 52

Group
Group
level
weightage
S. No. Dimension KPI Weightage TargetTarget
Achieved
Marks
Achieved
Weighted
Score
Good Very Good Excellent
60 80 100
Performance Levels1
32 Financial Enterprise BU revenue (Rs. Cr.) 40% 59.75 35.85 47.80 59.75
33Customer /
Market
Number of new Enterprise Gold accounts penetrated 20% 10 6 8 10
34 Operations MLLN / MPLS network uptime (%) 15% 98% 96% 97% 98%
35Operations Average provisioning time for leased circuits(no. of days) 15% 30 90 60 30
36 Operations Overall performance (on scale of 1 to 5 - to be assessed by Director -
Enterprise)
10% 5 3 4 5
37Financial Gross margin 20%
38 Financial Gross sales 30%
39Financial PBIT/Employment 20%
40 Financial Operating ratio (%) 20%
41Financial Budget adherence on opex (% actual spend vs. budgeted) (on items
excluding those in schedule P)
10%
42 Financial New Businesses revenue (Rs. Cr.) 15% 12.31 6.155 9.2325 12.31
43Customer /
Market
Customer satisfaction level (including QoS) (Scale of 1 to 5) 20% 5 3 4 5
44 Financial Overall assessment on Finance related issues, including budget
adherence, financial planning, accounting, revenue assurance etc. (on
scale of 1 to 5 - to be assessed by Dir-Finance)
15% 5 3 4 5
45
Employee
development
Overall assessment on HR related issues, including training, recruiting,
promotion, transfers etc. (on scale of 1 to 5 - to be assessed by Dir-HR)
20% 5 3 4 5
46 Overall
assessment
Overall performance (on scale of 1 to 5 - to be assessed by CMD) 30% 5 3 4 5
1. Marks for Good rating = 60, Very Good = 80, Excellent = 100. Marks achieved for rating below Good = 0. Achievement between Good and Very Good and between Very Good and Excellent would be linearly scaled CFA - CO Nodal designate: Mr. Tarun Kumar (Sr.GM, BP - CFA)
CA- CO Nodal designate: Mr. H. N. Singh (Sr. GM, MM-CA)
New Businesses - CO Nodal designate: Mr. Abdul Mazid (Sr.GM, TF - NB)
HR - CO Nodal designate: Mr. Neeraj Verma (GM, Training)
Finance - CO Nodal designate: Mr. KCGK Pillai (PGM,PF & Finance Personnel)
Note: i) Assessment by CMD and all directors of the BSNL board will be based on qualitative measures defined for the parameters
Others 10%
CM - CO Nodal designate: Mr. B.N. Mishra (Sr.GM, Product & Pricing)
Enterprise - CO Nodal designate: Mr. S. K. Seth
Enterprise 15%
Overall
Financial
Performance
30%
UP (East)Telecom Circle Page 46 of 52

Group
Group
level
weightage
S.
No.Dimension KPI Weightage Target
Target
Achieved
Marks
Achieved
Weighted
Score
Good Very Good Excellent
60 80 100
1 Financial CFA Revenue - Basic (LL, PCO,IN,USO rural phones/VPT subsidy in 20% 200.000 120.00 160.00 200.00
2 Financial CFA Revenue - Broadband (including VAS, IPTV) (Rs. Cr.) 20% 113.00 67.80 90.40 113.00
3 Customer /
Market
Net adds - (by number of subscribers) Basic (in 000's) 5% 13.676 19.69 16.68 13.68
4 Customer / Net adds - (by number of subscribers) Broadband (in 000's) 7.5% 90 54.00 72.00 90
5 Customer / Customer satisfaction level (including QoS) (Scale of 1 to 5) 7.5% 5 3 4 5
6 Operations CCR rate for Landline – local 2% 70.00% 62.80% 66.10% 70.00%
7 Operations CCR rate for Landline – Junction 2% 60.50% 54.25% 57.10% 60.50%
8 Operations CCR rate for Landline – STD 2% 57.50% 52.00% 54.70% 57.50%
9 Operations Fault rate (LL) 2.0% 5.00% 6.00% 5.80% 5.00%
10 Operations Fault rate (BB) 2.0% 4% 4.50 4.25% 4%
11 Operations % of faults cleared on same day (LL) 1% 86% 76.80% 80.8% 86%
12 Operations % of faults cleared by the following day (LL) 1% 96.5% 87.20% 91.80% 96.50%
13 Operations % of faults cleared within 3 days (LL) 1% 100% 92.15% 98.00% 100%
14 Operations % of faults cleared on same day (BB) 1% 60% 56% 59% 60%
15 Operations % of faults cleared by the following day (BB) 1% 93% 86% 91% 93%
16Operations % of new services (LL,) provisioned in area on demand within the norm
(7 days for LL)2% 100% 93.10% 98.00% 100%
17 Operations % LL local shift with in 3 days 1% 100% 91.10% 96.00% 100%
18 Operations % LL Inter-exchange shift with in 5 days 1% 100% 90.25% 95.00% 100%
19Operations % of new services ( BB) provisioned within the ( 7 days for BB)(Subject
To technical feasibility)5% 87% 80.00% 85.00% 87%
20 Operations Establishment of Data centres 2% 5% 3.00% 4.00% 5%
21 Operations CDR system based Customer care and monitoring mechanism 200% 5 3 4 5
22 Operations Acessibility of call centre 1.0% 99.75% 93.00% 98.00% 99.75%
23 Operations % of Calls answered by the operator(voice to voice ) within 60 seconds 1.0% 99.75% 93.00% 98.00% 99.75%
24Overall
performance Overall performance (on scale of 1 to 5 - to be assessed by CMD) 10% 5 3 4 5
25 Financial CM revenue (Rs. Cr.) 40% 473.14 283.88 378.51 473.14
26 Customer /
Market
CM Net adds - GSM (by number of subscribers) (in 000's) 13% 697 418.20 557.60 697.00
27 Customer /
Market
CM Net adds - CDMA (by number of subscribers) (in 000's) 2% 19.49 11.69 15.59 19.49
28 Customer /
Market
CM Net adds - WiMAX (by number of subscribers) (in 000's) 5% 27.65 16.59 22.12 27.65
29 Operations BTS availability (%) 10% 98% 96% 97% 98%
30 Operations Call drop rate (%) 10% 2% 2.5% 2.2% 2%
31 Operations Blocked call rate - TCH congestion (%) 10% 2% 2.5% 2.2% 2%
32Operations Overall performance (on scale of 1 to 5 - to be assessed by Director -
CM)
10% 5 3 4 5
Consumer
Mobility25%
Group Performance Management System (2011-12)
UP (West) Territorial Circle
Scorecard
Performance Levels1
Consumer
Fixed Access20%
UP (West) Territorial Circle Page 47 of 52

Group
Group
level
weightage
S.
No.Dimension KPI Weightage Target
Target
Achieved
Marks
Achieved
Weighted
Score
Good Very Good Excellent
60 80 100
Performance Levels1
33Financial Enterprise BU revenue (Rs. Cr.) 40% 50.67 30.4 40.53 50.67
34Customer /
Market
Number of new Enterprise Gold accounts penetrated 20% 10 6 8 10
35Operations MLLN / MPLS network uptime (%) 15% 98% 96% 97% 98%
36Operations Average provisioning time for leased circuits(no. of days) 15% 30 90 60 30
37Operations Overall performance (on scale of 1 to 5 - to be assessed by Director -
Enterprise)
10% 5 3 4 5
38Financial Gross margin 20%
39Financial Gross sales 30%
40Financial PBIT/Employment 20%
41 Financial Operating ratio (%) 20%
42Financial Budget adherence on opex (% actual spend vs. budgeted) (on items
excluding those in schedule P)
10%
43 Financial New Businesses revenue (Rs. Cr.) 15% 6.56 3.28 4.92 6.56
44Customer /
Market
Customer satisfaction level (including QoS) (Scale of 1 to 5) 20% 5 3 4 5
45
Financial Overall assessment on Finance related issues, including budget
adherence, financial planning, accounting, revenue assurance etc. (on
scale of 1 to 5 - to be assessed by Dir-Finance)
15% 5 3 4 5
46
Employee
development
Overall assessment on HR related issues, including training, recruiting,
promotion, transfers etc. (on scale of 1 to 5 - to be assessed by Dir-HR)
20% 5 3 4 5
47Overall
assessment
Overall performance (on scale of 1 to 5 - to be assessed by CMD) 30% 5 3 4 5
1. Marks for Good rating = 60, Very Good = 80, Excellent = 100. Marks achieved for rating below Good = 0. Achievement between Good and Very Good and between Very Good and Excellent would be linearly scaled CFA - CO Nodal designate: Mr. Tarun Kumar (Sr.GM, BP - CFA)
CA- CO Nodal designate: Mr. H. N. Singh (Sr. GM, MM-CA)
New Businesses - CO Nodal designate: Mr. Abdul Mazid (Sr.GM, TF - NB)
HR - CO Nodal designate: Mr. Neeraj Verma (GM, Training)
Finance - CO Nodal designate: Mr. KCGK Pillai (PGM,PF & Finance Personnel)
Note: i) Assessment by CMD and all directors of the BSNL board will be based on qualitative measures defined for the parameters
Others 10%
CM - CO Nodal designate: Mr. B.N. Mishra (Sr.GM, Product & Pricing)
Enterprise - CO Nodal designate: Mr. S. K. Seth
Enterprise 15%
Overall
Financial
Performance
30%
UP (West) Territorial Circle Page 48 of 52

Group
Group
level
weightage
S. No. Dimension KPI Weightage TargetTarget
Achieved
Marks
Achieved
Weighted
Score
Good Very Good Excellent
60 80 100
1 Financial CFA Revenue - Basic (LL, PCO,IN,USO rural phones/VPT subsidy in lieu
of ADC, VAS, etc.) (Rs. Cr.)
20% 82.000 49.20 65.60 82.00
2 Financial CFA Revenue - Broadband (including VAS, IPTV) (Rs. Cr.) 20% 57.00 34.20 45.60 57.00
3 Customer /
Market
Net adds - (by number of subscribers) Basic (in 000's) 5% 5.724 3.43 4.58 5.72
4 Customer /
Market
Net adds - (by number of subscribers) Broadband (in 000's) 7.5% 30 18.00 24.00 30
5 Customer /
Market
Customer satisfaction level (including QoS) (Scale of 1 to 5) 7.5% 5 3 4 5
6 Operations CCR rate for Landline – local 2% 70.50% 63.20% 66.50% 70.50%
7 Operations CCR rate for Landline – Junction 2% 63.50% 56.90% 59.90% 63.50%
8 Operations CCR rate for Landline – STD 2% 56.00% 50.60% 53.30% 56.00%
9 Operations Fault rate (LL) 2.0% 3.80% 4.60% 4.40% 3.80%
10 Operations Fault rate (BB) 2.0% 5% 5.50% 5.25% 5%
11 Operations % of faults cleared on same day (LL) 1% 88% 78.50% 82.7% 88%
12 Operations % of faults cleared by the following day (LL) 1% 97.0% 87.70% 92.30% 97.00%
13 Operations % of faults cleared within 3 days (LL) 1% 100% 92.15% 98.00% 100%
14 Operations % of faults cleared on same day (BB) 1% 50% 46% 49% 50%
15 Operations % of faults cleared by the following day (BB) 1% 93% 86% 91% 93%
16Operations % of new services (LL,) provisioned in area on demand within the norm (7
days for LL)2% 100% 93.10% 98.00% 100%
17 Operations % LL local shift with in 3 days 1% 100% 91.10% 96.00% 100%
18 Operations % LL Inter-exchange shift with in 5 days 1% 100% 90.25% 95.00% 100%
19Operations % of new services ( BB) provisioned within the ( 7 days for BB)(Subject To
technical feasibility)5% 77% 70.00% 75.00% 77%
20 Operations CDR system based Customer care and monitoring mechanism 4.0% 5 3 4 5
21 Operations Acessibility of call centre 1.0% 99.75% 93.00% 98.00% 99.75%
22 Operations % of Calls answered by the operator(voice to voice ) within 60 seconds 1.0% 99.75% 93.00% 98.00% 99.75%
23Overall
performance Overall performance (on scale of 1 to 5 - to be assessed by CMD) 10% 5 3 4 5
24 Financial CM revenue (Rs. Cr.) 40% 220.32 132.19 176.26 220.32
25 Customer /
Market
CM Net adds - GSM (by number of subscribers) (in 000's) 13% 307 184.20 245.60 307.00
27 Customer /
Market
CM Net adds - WiMAX (by number of subscribers) (in 000's) 5% 8 4.80 6.40 8.00
28 Operations BTS availability (%) 10% 98% 96% 97% 98%
29 Operations Call drop rate (%) 10% 2% 2.5% 2.2% 2%
30 Operations Blocked call rate - TCH congestion (%) 10% 2% 2.5% 2.2% 2%
31 Operations Overall performance (on scale of 1 to 5 - to be assessed by Director - CM) 10% 5 3 4 5
Consumer
Mobility25%
Group Performance Management System (2011-12)
Uttaranchal Territorial Circle
Scorecard
Performance Levels1
Consumer
Fixed Access20%
Uttaranchal Terr. Circle Page 49 of 52

Group
Group
level
weightage
S. No. Dimension KPI Weightage TargetTarget
Achieved
Marks
Achieved
Weighted
Score
Good Very Good Excellent
60 80 100
Performance Levels1
32Financial Enterprise BU revenue (Rs. Cr.) 40% 30.79 18.47 24.63 30.79
33Customer /
Market
Number of new Enterprise Gold accounts penetrated 20% 5 3 4 5
34 Operations MLLN / MPLS network uptime (%) 15% 98% 96% 97% 98%
35Operations Average provisioning time for leased circuits(no. of days) 15% 30 90 60 30
36Operations Overall performance (on scale of 1 to 5 - to be assessed by Director -
Enterprise)
10% 5 3 4 5
38Financial Gross margin 20%
39Financial Gross sales 30%
40Financial PBIT/Employment 20%
41 Financial Operating ratio (%) 20%
42Financial Budget adherence on opex (% actual spend vs. budgeted) (on items
excluding those in schedule P)
10%
43Financial New Businesses revenue (Rs. Cr.) 15% 3.29 1.645 2.4675 3.29
44Customer /
Market
Customer satisfaction level (including QoS) (Scale of 1 to 5) 20% 5 3 4 5
45
Financial Overall assessment on Finance related issues, including budget
adherence, financial planning, accounting, revenue assurance etc. (on
scale of 1 to 5 - to be assessed by Dir-Finance)
15% 5 3 4 5
46
Employee
development
Overall assessment on HR related issues, including training, recruiting,
promotion, transfers etc. (on scale of 1 to 5 - to be assessed by Dir-HR)
20% 5 3 4 5
47Overall
assessment
Overall performance (on scale of 1 to 5 - to be assessed by CMD) 30% 5 3 4 5
1. Marks for Good rating = 60, Very Good = 80, Excellent = 100. Marks achieved for rating below Good = 0. Achievement between Good and Very Good and between Very Good and Excellent would be linearly scaled
CFA - CO Nodal designate: Mr. Tarun Kumar (Sr.GM, BP - CFA)
CA- CO Nodal designate: Mr. H. N. Singh (Sr. GM, MM-CA)
New Businesses - CO Nodal designate: Mr. Abdul Mazid (Sr.GM, TF - NB)
HR - CO Nodal designate: Mr. Neeraj Verma (GM, Training)
Finance - CO Nodal designate: Mr. KCGK Pillai (PGM,PF & Finance Personnel)
Note: i) Assessment by CMD and all directors of the BSNL board will be based on qualitative measures defined for the parameters
Others 10%
CM - CO Nodal designate: Mr. B.N. Mishra (Sr.GM, Product & Pricing)
Enterprise - CO Nodal designate: Mr. S. K. Seth
Enterprise 15%
Overall
Financial
Performance
30%
Uttaranchal Terr. Circle Page 50 of 52

Group
Group
level
weightage
S. No. Dimension KPI Weightage TargetTarget
Achieved
Marks
Achieved
Weighted
Score
Good Very Good Excellent
60 80 100
1Financial CFA Revenue - Basic (LL, PCO,IN,USO rural phones/VPT subsidy in lieu
of ADC, VAS, etc.) (Rs. Cr.)20%
152.000 91.20 121.60 152.00
2 Financial CFA Revenue - Broadband (including VAS, IPTV) (Rs. Cr.) 20% 73.00 43.80 58.40 73.00
3 Customer /
Market
Net adds - (by number of subscribers) Basic (in 000's) 5% 17.537 10.52 14.03 17.54
4 Customer /
Market
Net adds - (by number of subscribers) Broadband (in 000's) 7.5% 70 42.00 56.00 70.00
5 Customer /
Market
Customer satisfaction level (including QoS) (Scale of 1 to 5) 7.5% 4 2.00 3.00 4.00
6 Operations CCR rate for Landline – local 2% 68.00% 61.00% 64.20% 68.00%
7 Operations CCR rate for Landline – Junction 2% 60.00% 53.85% 56.60% 60.00%
8 Operations CCR rate for Landline – STD 2% 53.40% 48.30% 50.80% 53.40%
9 Operations Fault rate (LL) 2.0% 5.00% 6.00% 5.80% 6.00%
10 Operations Fault rate (BB) 2.0% 4.5% 5% 4.75% 4.50%
11 Operations % of faults cleared on same day (LL) 1% 80% 71.40% 75.2% 80%
12 Operations % of faults cleared by the following day (LL) 1% 94.5% 85.40% 89.90% 94.50%
13 Operations % of faults cleared within 3 days (LL) 1% 100% 92.15% 98.00% 100%
14 Operations % of faults cleared on same day (BB) 1% 55% 50% 54% 55%
15 Operations % of faults cleared by the following day (BB) 1% 92% 85% 90% 92%
16Operations % of new services (LL,) provisioned in area on demand within the norm (7
days for LL)2% 100% 93.10% 98.00% 100%
17 Operations % LL local shift with in 3 days 1% 100% 91.10% 96.00% 100%
18 Operations % LL Inter-exchange shift with in 5 days 1% 100% 90.25% 95.00% 100%
19Operations % of new services ( BB) provisioned within the ( 7 days for BB)(Subject To
technical feasibility)5% 82% 75.00% 80.00% 82%
20 Operations CDR system based Customer care and monitoring mechanism 4.0% 5 3 4 5
21 Operations Acessibility of call centre 1.0% 99.75% 93.00% 98.00% 99.75%
22 Operations % of Calls answered by the operator(voice to voice ) within 60 seconds 1.0% 99.75% 93.00% 98.00% 99.75%
23Overall
performance Overall performance (on scale of 1 to 5 - to be assessed by CMD) 10% 5 3 4 5
24 Financial CM revenue (Rs. Cr.) 40% 481.22 288.73 384.98 481.22
25 Customer /
Market
CM Net adds - GSM (by number of subscribers) (in 000's) 13% 964 578.40 771.20 964.00
26 Customer /
Market
CM Net adds - CDMA (by number of subscribers) (in 000's) 2% 13.59 8.15 10.87 13.59
27 Customer /
Market
CM Net adds -WiMAX (by number of subscribers) (in 000's) 5% 17 10.20 13.60 17.00
28 Operations BTS availability (%) 10% 98% 96% 97% 98%
29 Operations Call drop rate (%) 10% 2.0% 2.5% 2.2% 2.0%
30 Operations Blocked call rate - TCH congestion (%) 10% 2.0% 2.5% 2.2% 2.0%
31Operations Overall performance (on scale of 1 to 5 - to be assessed by Director - CM) 10% 5 3 4 5
Consumer
Mobility30%
Group Performance Management System (2011-12)
West Bangal Territorial Circle
Scorecard
Performance Levels1
Consumer
Fixed Access20%
WB Territorial Circle Page 51 of 52

Group
Group
level
weightage
S. No. Dimension KPI Weightage TargetTarget
Achieved
Marks
Achieved
Weighted
Score
Good Very Good Excellent
60 80 100
Performance Levels1
32 Financial Enterprise BU revenue (Rs. Cr.) 40% 31.84 19.10 25.47 31.84
33Customer /
Market
Number of new Enterprise Gold accounts penetrated 20% 10 6 8 10
34 Operations MLLN / MPLS network uptime (%) 15% 98% 96% 97% 98%
35Operations Average provisioning time for leased circuits(no. of days) 15% 30 90 60 30
36 Operations Overall performance (on scale of 1 to 5 - to be assessed by Director -
Enterprise)
10% 5 3 4 5
38Financial Gross margin 20%
39Financial Gross sales 30%
40Financial PBIT/Employment 20%
41 Financial Operating ratio (%) 20%
42Financial Budget adherence on opex (% actual spend vs. budgeted) (on items
excluding those in schedule P)
10%
43Financial New Businesses revenue (Rs. Cr.) 15% 6 3 4.5 6
44Customer /
Market
Customer satisfaction level (including QoS) (Scale of 1 to 5) 20% 5 3 4 5
45
Financial Overall assessment on Finance related issues, including budget
adherence, financial planning, accounting, revenue assurance etc. (on
scale of 1 to 5 - to be assessed by Dir-Finance)
15% 5 3 4 5
46
Employee
development
Overall assessment on HR related issues, including training, recruiting,
promotion, transfers etc. (on scale of 1 to 5 - to be assessed by Dir-HR)
20% 5 3 4 5
47Overall
assessment
Overall performance (on scale of 1 to 5 - to be assessed by CMD) 30% 5 3 4 5
1. Marks for Good rating = 60, Very Good = 80, Excellent = 100. Marks achieved for rating below Good = 0. Achievement between Good and Very Good and between Very Good and Excellent would be linearly scaled CFA - CO Nodal designate: Mr. Tarun Kumar (Sr.GM, BP - CFA)
CA- CO Nodal designate: Mr. H. N. Singh (Sr. GM, MM-CA)
New Businesses - CO Nodal designate: Mr. Abdul Mazid (Sr.GM, TF - NB)
HR - CO Nodal designate: Mr. Neeraj Verma (GM, Training)
Finance - CO Nodal designate: Mr. KCGK Pillai (PGM,PF & Finance Personnel)
Note: i) Assessment by CMD and all directors of the BSNL board will be based on qualitative measures defined for the parameters
Others 10%
CM - CO Nodal designate: Mr. B.N. Mishra (Sr.GM, Product & Pricing)
Enterprise - CO Nodal designate: Mr. S. K. Seth
Enterprise 15%
Overall
Financial
Performance
30%
WB Territorial Circle Page 52 of 52