Embed Size (px)
Citation preview
Storage and pipelines Refining and petrochemicals
Offshore production Offshorewind
Oil and gas processing facilities
Oil and gas development
and production
Group revenue contribution
75%
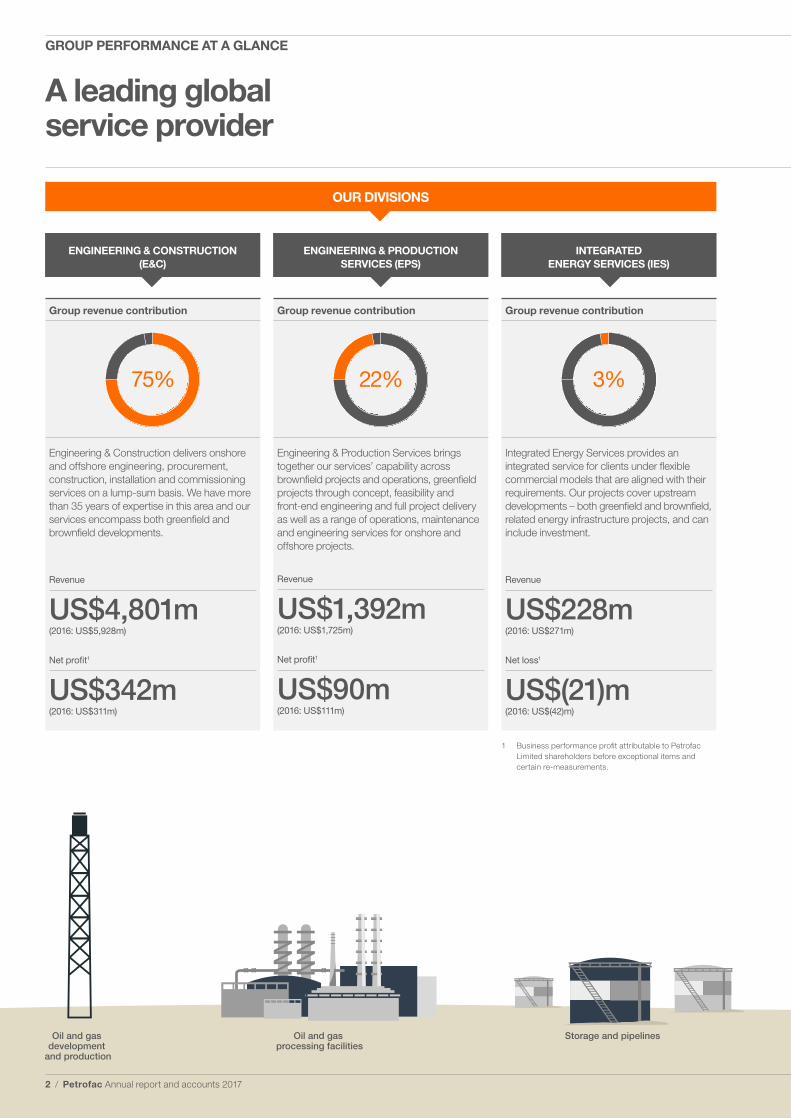
Engineering & Construction delivers onshore and offshore engineering, procurement, construction, installation and commissioning services on a lump-sum basis. We have more than 35 years of expertise in this area and our services encompass both greenfield and brownfield developments.
Revenue
US$4,801m(2016: US$5,928m)
Net profit1
US$342m(2016: US$311m)
Group revenue contribution
22%
Engineering & Production Services brings together our services’ capability across brownfield projects and operations, greenfield projects through concept, feasibility and front-end engineering and full project delivery as well as a range of operations, maintenance and engineering services for onshore and offshore projects.
Revenue
US$1,392m(2016: US$1,725m)
Net profit1
US$90m(2016: US$111m)
Group revenue contribution
3%
Integrated Energy Services provides an integrated service for clients under flexible commercial models that are aligned with their requirements. Our projects cover upstream developments – both greenfield and brownfield, related energy infrastructure projects, and can include investment.
Revenue
US$228m(2016: US$271m)
Net loss1
US$(21)m(2016: US$(42)m)
1 Business performance profit attributable to Petrofac Limited shareholders before exceptional items and certain re-measurements.
A leading global service provider
ENGINEERING & CONSTRUCTION (E&C)
ENGINEERING & PRODUCTION SERVICES (EPS)
INTEGRATED ENERGY SERVICES (IES)
OUR DIVISIONS
2 / Petrofac Annual report and accounts 2017
GROUP PERFORMANCE AT A GLANCE
Storage and pipelines Refining and petrochemicals
Offshore production Offshorewind
Oil and gas processing facilities
Oil and gas development
and production
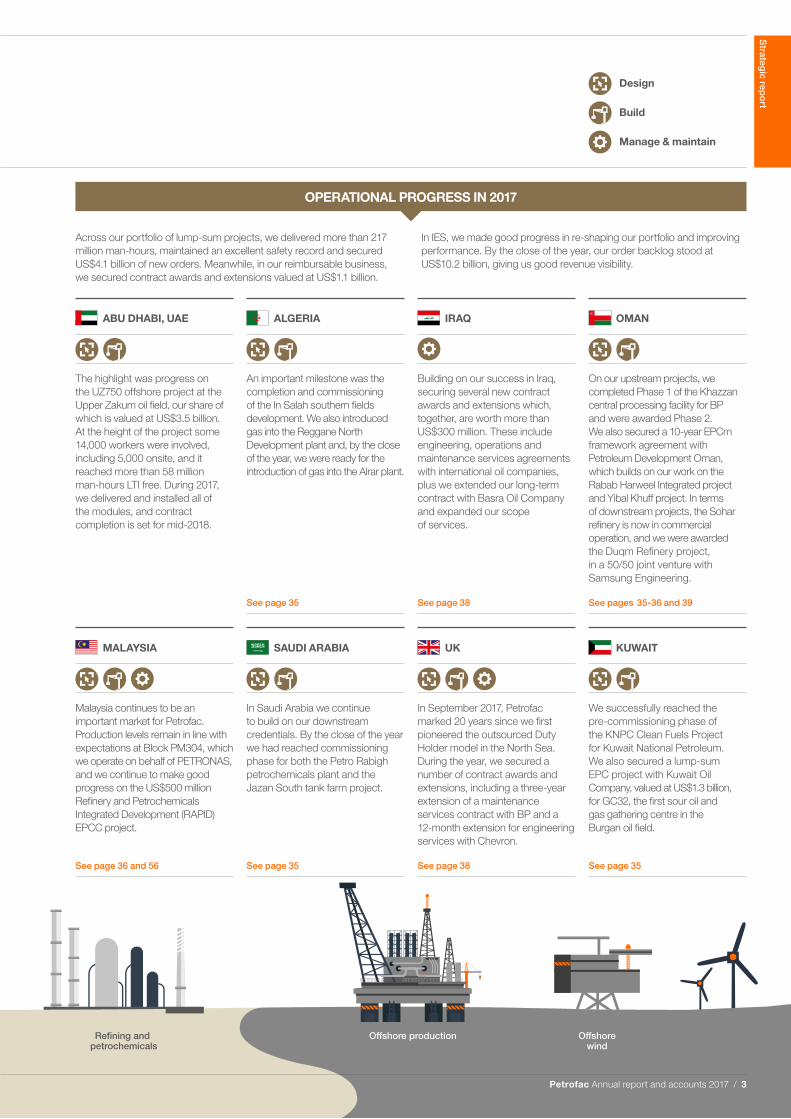
ABU DHABI, UAE ALGERIA IRAQ OMAN
The highlight was progress on the UZ750 offshore project at the Upper Zakum oil field, our share of which is valued at US$3.5 billion. At the height of the project some 14,000 workers were involved, including 5,000 onsite, and it reached more than 58 million man-hours LTI free. During 2017, we delivered and installed all of the modules, and contract completion is set for mid-2018.
An important milestone was the completion and commissioning of the In Salah southern fields development. We also introduced gas into the Reggane North Development plant and, by the close of the year, we were ready for the introduction of gas into the Alrar plant.
Building on our success in Iraq, securing several new contract awards and extensions which, together, are worth more than US$300 million. These include engineering, operations and maintenance services agreements with international oil companies, plus we extended our long-term contract with Basra Oil Company and expanded our scope of services.
On our upstream projects, we completed Phase 1 of the Khazzan central processing facility for BP and were awarded Phase 2. We also secured a 10-year EPCm framework agreement with Petroleum Development Oman, which builds on our work on the Rabab Harweel Integrated project and Yibal Khuff project. In terms of downstream projects, the Sohar refinery is now in commercial operation, and we were awarded the Duqm Refinery project, in a 50/50 joint venture with Samsung Engineering.
See page 35 See page 38 See pages 35-36 and 39
MALAYSIA SAUDI ARABIA UK KUWAIT
Malaysia continues to be an important market for Petrofac. Production levels remain in line with expectations at Block PM304, which we operate on behalf of PETRONAS, and we continue to make good progress on the US$500 million Refinery and Petrochemicals Integrated Development (RAPID) EPCC project.
In Saudi Arabia we continue to build on our downstream credentials. By the close of the year we had reached commissioning phase for both the Petro Rabigh petrochemicals plant and the Jazan South tank farm project.
In September 2017, Petrofac marked 20 years since we first pioneered the outsourced Duty Holder model in the North Sea. During the year, we secured a number of contract awards and extensions, including a three-year extension of a maintenance services contract with BP and a 12-month extension for engineering services with Chevron.
We successfully reached the pre-commissioning phase of the KNPC Clean Fuels Project for Kuwait National Petroleum. We also secured a lump-sum EPC project with Kuwait Oil Company, valued at US$1.3 billion, for GC32, the first sour oil and gas gathering centre in the Burgan oil field.
See page 36 and 56 See page 35 See page 38 See page 35
OPERATIONAL PROGRESS IN 2017
Across our portfolio of lump-sum projects, we delivered more than 217 million man-hours, maintained an excellent safety record and secured US$4.1 billion of new orders. Meanwhile, in our reimbursable business, we secured contract awards and extensions valued at US$1.1 billion.
In IES, we made good progress in re-shaping our portfolio and improving performance. By the close of the year, our order backlog stood at US$10.2 billion, giving us good revenue visibility.
Design
Build
Manage & maintain
Strateg
ic repo
rt
Petrofac Annual report and accounts 2017 / 3
Quality &
cost conscious
Responsive Innovative
Eth
ical
OPERATIONALEXCELLENCE
OPERATIONALEXCELLENCE
DESIGN
MANAGEAND MAINTAIN
BUILD
ENGINEERINGEXPERTISE
Driv
en to
d
elive
r
Our values
Safe
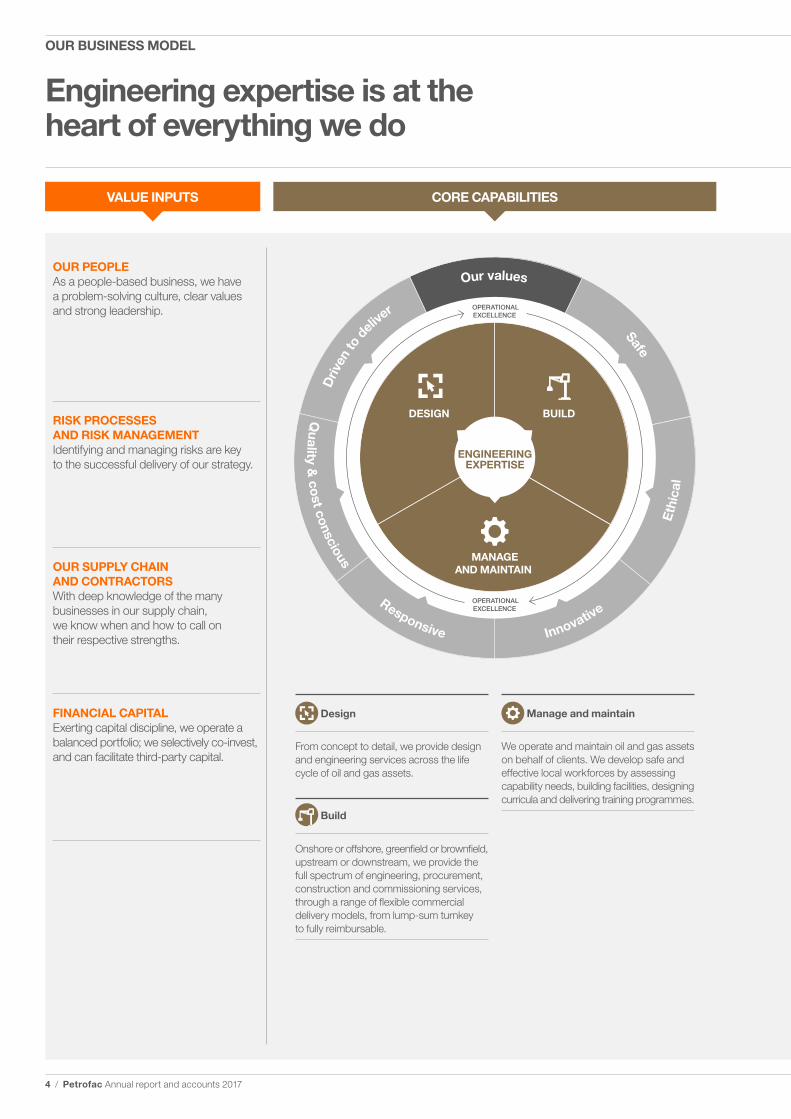
Engineering expertise is at the heart of everything we do
CORE CAPABILITIES
OUR PEOPLEAs a people-based business, we have a problem-solving culture, clear values and strong leadership.
RISK PROCESSES AND RISK MANAGEMENTIdentifying and managing risks are key to the successful delivery of our strategy.
OUR SUPPLY CHAIN AND CONTRACTORSWith deep knowledge of the many businesses in our supply chain, we know when and how to call on their respective strengths.
FINANCIAL CAPITALExerting capital discipline, we operate a balanced portfolio; we selectively co-invest, and can facilitate third-party capital.
VALUE INPUTS
Design
From concept to detail, we provide design and engineering services across the life cycle of oil and gas assets.
Build
Onshore or offshore, greenfield or brownfield, upstream or downstream, we provide the full spectrum of engineering, procurement, construction and commissioning services, through a range of flexible commercial delivery models, from lump-sum turnkey to fully reimbursable.
Manage and maintain
We operate and maintain oil and gas assets on behalf of clients. We develop safe and effective local workforces by assessing capability needs, building facilities, designing curricula and delivering training programmes.
4 / Petrofac Annual report and accounts 2017
OUR BUSINESS MODEL
Storage and pipelines Refining and petrochemicals
Offshore production Offshorewind
Oil and gas processing facilities
OUTCOMESGROUP DIVISIONS COMMERCIAL MODELS
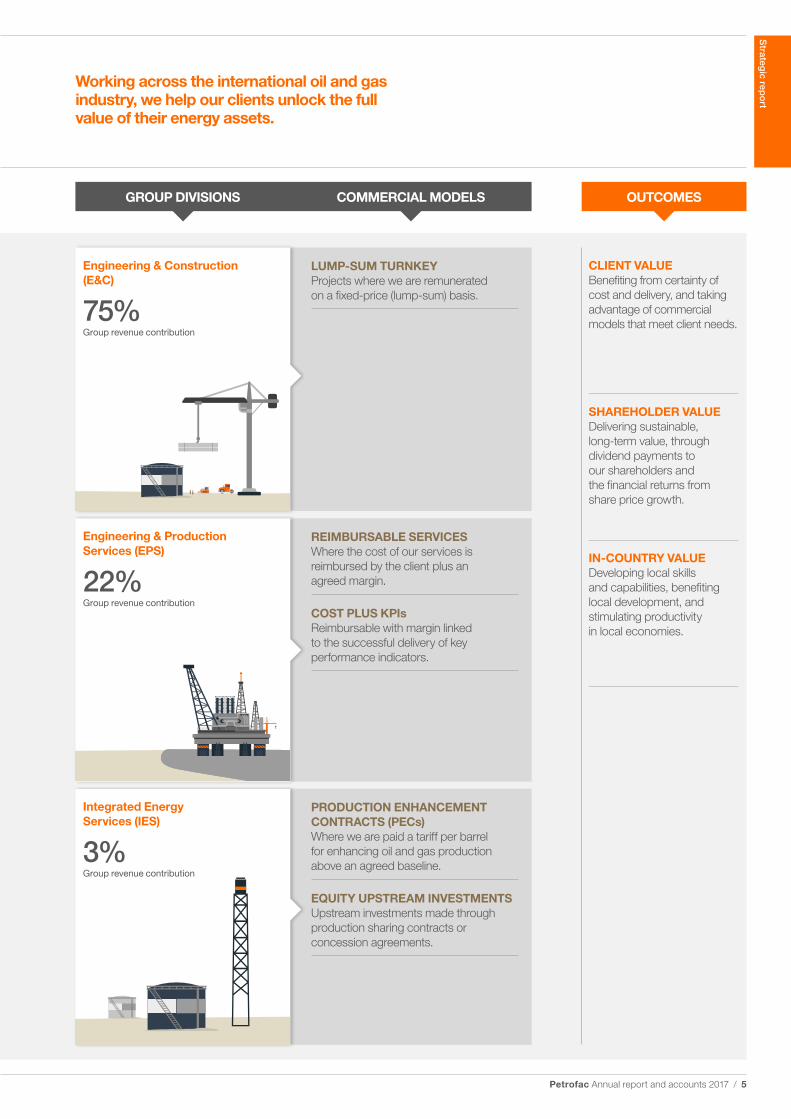
Working across the international oil and gas industry, we help our clients unlock the full value of their energy assets.
PRODUCTION ENHANCEMENT CONTRACTS (PECs) Where we are paid a tariff per barrel for enhancing oil and gas production above an agreed baseline.
EQUITY UPSTREAM INVESTMENTSUpstream investments made through production sharing contracts or concession agreements.
REIMBURSABLE SERVICESWhere the cost of our services is reimbursed by the client plus an agreed margin.
COST PLUS KPIsReimbursable with margin linked to the successful delivery of key performance indicators.
LUMP-SUM TURNKEYProjects where we are remunerated on a fixed-price (lump-sum) basis.
CLIENT VALUEBenefiting from certainty of cost and delivery, and taking advantage of commercial models that meet client needs.
SHAREHOLDER VALUEDelivering sustainable, long-term value, through dividend payments to our shareholders and the financial returns from share price growth.
IN-COUNTRY VALUEDeveloping local skills and capabilities, benefiting local development, and stimulating productivity in local economies.
Engineering & Production Services (EPS)
22%Group revenue contribution
Integrated Energy Services (IES)
3%Group revenue contribution
Engineering & Construction (E&C)
75%Group revenue contribution
Strateg
ic repo
rt
Petrofac Annual report and accounts 2017 / 5
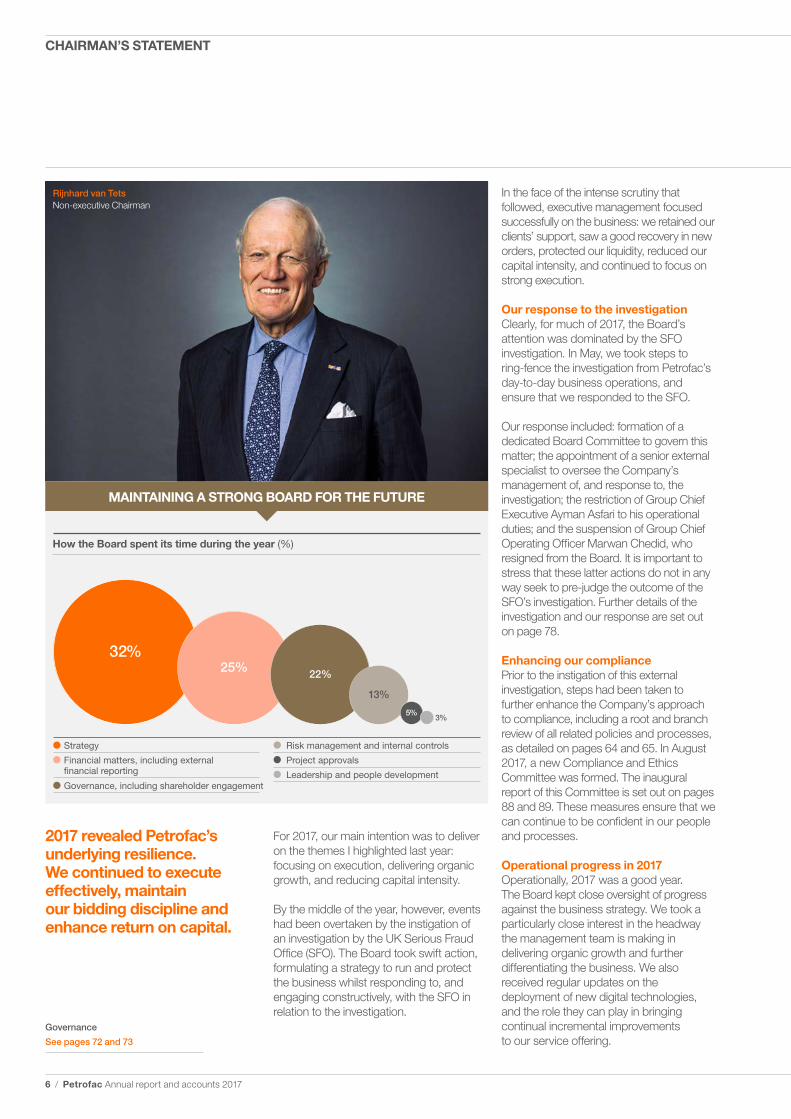
Strategy
Financial matters, including external �nancial reporting
Governance, including shareholder engagement
Risk management and internal controls
Project approvals
Leadership and people development
How the Board spent its time during the year (%)
25% 22%
5%3%
32%
13%
In the face of the intense scrutiny that followed, executive management focused successfully on the business: we retained our clients’ support, saw a good recovery in new orders, protected our liquidity, reduced our capital intensity, and continued to focus on strong execution.
Our response to the investigationClearly, for much of 2017, the Board’s attention was dominated by the SFO investigation. In May, we took steps to ring-fence the investigation from Petrofac’s day-to-day business operations, and ensure that we responded to the SFO.
Our response included: formation of a dedicated Board Committee to govern this matter; the appointment of a senior external specialist to oversee the Company’s management of, and response to, the investigation; the restriction of Group Chief Executive Ayman Asfari to his operational duties; and the suspension of Group Chief Operating Officer Marwan Chedid, who resigned from the Board. It is important to stress that these latter actions do not in any way seek to pre-judge the outcome of the SFO’s investigation. Further details of the investigation and our response are set out on page 78.
Enhancing our compliancePrior to the instigation of this external investigation, steps had been taken to further enhance the Company’s approach to compliance, including a root and branch review of all related policies and processes, as detailed on pages 64 and 65. In August 2017, a new Compliance and Ethics Committee was formed. The inaugural report of this Committee is set out on pages 88 and 89. These measures ensure that we can continue to be confident in our people and processes.
Operational progress in 2017Operationally, 2017 was a good year. The Board kept close oversight of progress against the business strategy. We took a particularly close interest in the headway the management team is making in delivering organic growth and further differentiating the business. We also received regular updates on the deployment of new digital technologies, and the role they can play in bringing continual incremental improvements to our service offering.
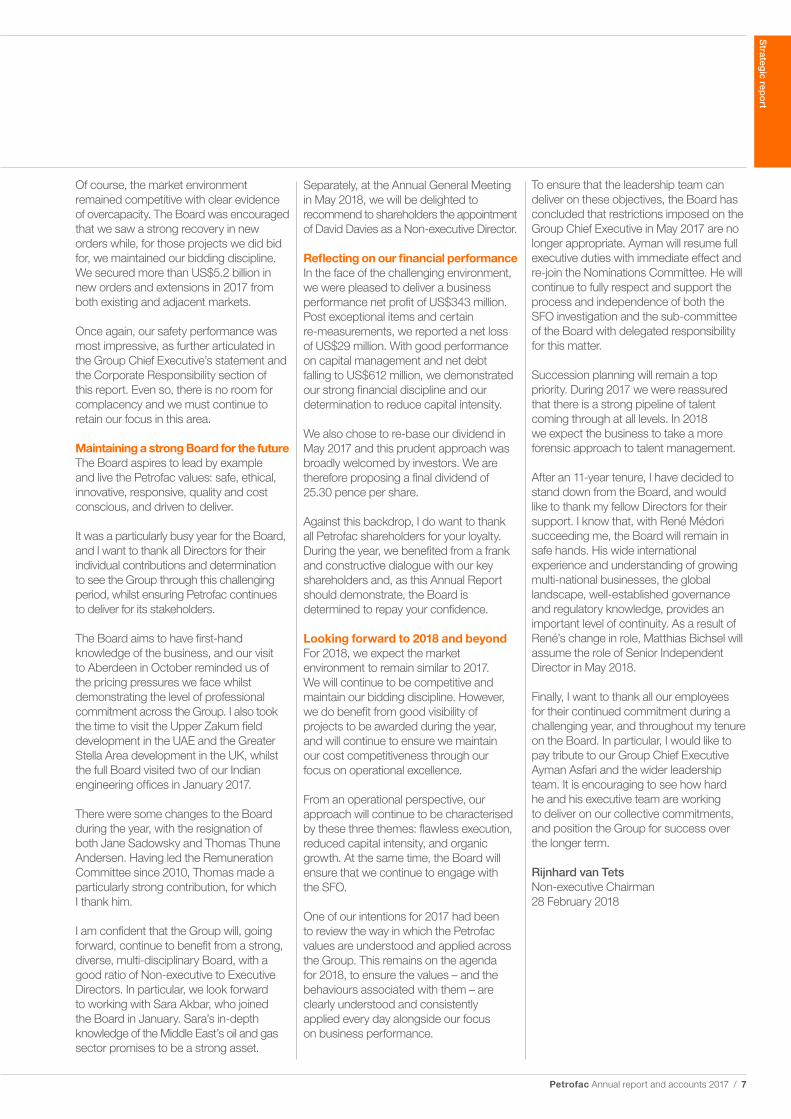
Rijnhard van TetsNon-executive Chairman
MAINTAINING A STRONG BOARD FOR THE FUTURE
2017 revealed Petrofac’s underlying resilience. We continued to execute effectively, maintain our bidding discipline and enhance return on capital.
For 2017, our main intention was to deliver on the themes I highlighted last year: focusing on execution, delivering organic growth, and reducing capital intensity.
By the middle of the year, however, events had been overtaken by the instigation of an investigation by the UK Serious Fraud Office (SFO). The Board took swift action, formulating a strategy to run and protect the business whilst responding to, and engaging constructively, with the SFO in relation to the investigation.
Governance
See pages 72 and 73
6 / Petrofac Annual report and accounts 2017
CHAIRMAN’S STATEMENT
Separately, at the Annual General Meeting in May 2018, we will be delighted to recommend to shareholders the appointment of David Davies as a Non-executive Director.
Reflecting on our financial performanceIn the face of the challenging environment, we were pleased to deliver a business performance net profit of US$343 million. Post exceptional items and certain re-measurements, we reported a net loss of US$29 million. With good performance on capital management and net debt falling to US$612 million, we demonstrated our strong financial discipline and our determination to reduce capital intensity.
We also chose to re-base our dividend in May 2017 and this prudent approach was broadly welcomed by investors. We are therefore proposing a final dividend of 25.30 pence per share.
Against this backdrop, I do want to thank all Petrofac shareholders for your loyalty. During the year, we benefited from a frank and constructive dialogue with our key shareholders and, as this Annual Report should demonstrate, the Board is determined to repay your confidence.
Looking forward to 2018 and beyondFor 2018, we expect the market environment to remain similar to 2017. We will continue to be competitive and maintain our bidding discipline. However, we do benefit from good visibility of projects to be awarded during the year, and will continue to ensure we maintain our cost competitiveness through our focus on operational excellence.
From an operational perspective, our approach will continue to be characterised by these three themes: flawless execution, reduced capital intensity, and organic growth. At the same time, the Board will ensure that we continue to engage with the SFO.
One of our intentions for 2017 had been to review the way in which the Petrofac values are understood and applied across the Group. This remains on the agenda for 2018, to ensure the values – and the behaviours associated with them – are clearly understood and consistently applied every day alongside our focus on business performance.
Of course, the market environment remained competitive with clear evidence of overcapacity. The Board was encouraged that we saw a strong recovery in new orders while, for those projects we did bid for, we maintained our bidding discipline. We secured more than US$5.2 billion in new orders and extensions in 2017 from both existing and adjacent markets.
Once again, our safety performance was most impressive, as further articulated in the Group Chief Executive’s statement and the Corporate Responsibility section of this report. Even so, there is no room for complacency and we must continue to retain our focus in this area.
Maintaining a strong Board for the futureThe Board aspires to lead by example and live the Petrofac values: safe, ethical, innovative, responsive, quality and cost conscious, and driven to deliver.
It was a particularly busy year for the Board, and I want to thank all Directors for their individual contributions and determination to see the Group through this challenging period, whilst ensuring Petrofac continues to deliver for its stakeholders.
The Board aims to have first-hand knowledge of the business, and our visit to Aberdeen in October reminded us of the pricing pressures we face whilst demonstrating the level of professional commitment across the Group. I also took the time to visit the Upper Zakum field development in the UAE and the Greater Stella Area development in the UK, whilst the full Board visited two of our Indian engineering offices in January 2017.
There were some changes to the Board during the year, with the resignation of both Jane Sadowsky and Thomas Thune Andersen. Having led the Remuneration Committee since 2010, Thomas made a particularly strong contribution, for which I thank him.
I am confident that the Group will, going forward, continue to benefit from a strong, diverse, multi-disciplinary Board, with a good ratio of Non-executive to Executive Directors. In particular, we look forward to working with Sara Akbar, who joined the Board in January. Sara’s in-depth knowledge of the Middle East’s oil and gas sector promises to be a strong asset.
To ensure that the leadership team can deliver on these objectives, the Board has concluded that restrictions imposed on the Group Chief Executive in May 2017 are no longer appropriate. Ayman will resume full executive duties with immediate effect and re-join the Nominations Committee. He will continue to fully respect and support the process and independence of both the SFO investigation and the sub-committee of the Board with delegated responsibility for this matter.
Succession planning will remain a top priority. During 2017 we were reassured that there is a strong pipeline of talent coming through at all levels. In 2018 we expect the business to take a more forensic approach to talent management.
After an 11-year tenure, I have decided to stand down from the Board, and would like to thank my fellow Directors for their support. I know that, with René Médori succeeding me, the Board will remain in safe hands. His wide international experience and understanding of growing multi-national businesses, the global landscape, well-established governance and regulatory knowledge, provides an important level of continuity. As a result of René’s change in role, Matthias Bichsel will assume the role of Senior Independent Director in May 2018.
Finally, I want to thank all our employees for their continued commitment during a challenging year, and throughout my tenure on the Board. In particular, I would like to pay tribute to our Group Chief Executive Ayman Asfari and the wider leadership team. It is encouraging to see how hard he and his executive team are working to deliver on our collective commitments, and position the Group for success over the longer term.
Rijnhard van TetsNon-executive Chairman 28 February 2018
Strateg
ic repo
rt
Petrofac Annual report and accounts 2017 / 7
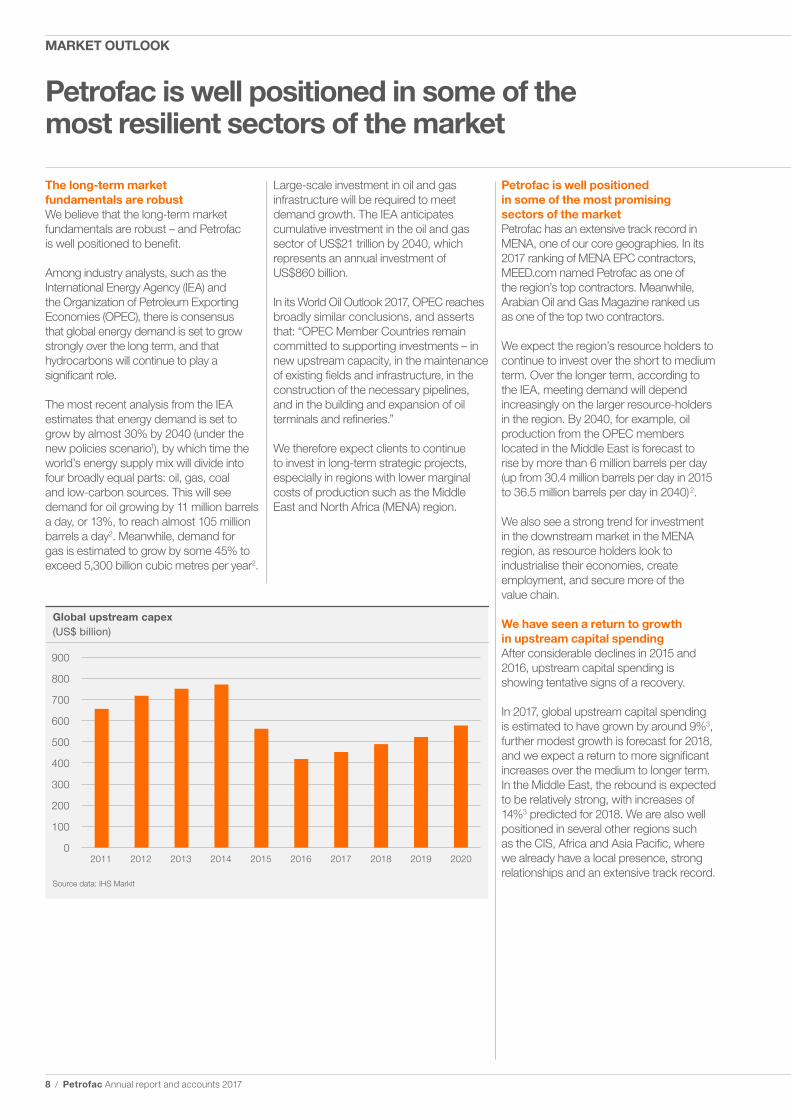
Global upstream capex(US$ billion)
2011 2012 2013 2014 2015 2016 2017 2018 2019 2020
900
800
700
600
500
400
300
200
100
0
Source data: IHS Markit
The long-term market fundamentals are robustWe believe that the long-term market fundamentals are robust – and Petrofac is well positioned to benefit.
Among industry analysts, such as the International Energy Agency (IEA) and the Organization of Petroleum Exporting Economies (OPEC), there is consensus that global energy demand is set to grow strongly over the long term, and that hydrocarbons will continue to play a significant role.
The most recent analysis from the IEA estimates that energy demand is set to grow by almost 30% by 2040 (under the new policies scenario1), by which time the world’s energy supply mix will divide into four broadly equal parts: oil, gas, coal and low-carbon sources. This will see demand for oil growing by 11 million barrels a day, or 13%, to reach almost 105 million barrels a day2. Meanwhile, demand for gas is estimated to grow by some 45% to exceed 5,300 billion cubic metres per year2.
Large-scale investment in oil and gas infrastructure will be required to meet demand growth. The IEA anticipates cumulative investment in the oil and gas sector of US$21 trillion by 2040, which represents an annual investment of US$860 billion.
In its World Oil Outlook 2017, OPEC reaches broadly similar conclusions, and asserts that: “OPEC Member Countries remain committed to supporting investments – in new upstream capacity, in the maintenance of existing fields and infrastructure, in the construction of the necessary pipelines, and in the building and expansion of oil terminals and refineries.”
We therefore expect clients to continue to invest in long-term strategic projects, especially in regions with lower marginal costs of production such as the Middle East and North Africa (MENA) region.
Petrofac is well positioned in some of the most promising sectors of the marketPetrofac has an extensive track record in MENA, one of our core geographies. In its 2017 ranking of MENA EPC contractors, MEED.com named Petrofac as one of the region’s top contractors. Meanwhile, Arabian Oil and Gas Magazine ranked us as one of the top two contractors.
We expect the region’s resource holders to continue to invest over the short to medium term. Over the longer term, according to the IEA, meeting demand will depend increasingly on the larger resource-holders in the region. By 2040, for example, oil production from the OPEC members located in the Middle East is forecast to rise by more than 6 million barrels per day (up from 30.4 million barrels per day in 2015 to 36.5 million barrels per day in 2040) 2.
We also see a strong trend for investment in the downstream market in the MENA region, as resource holders look to industrialise their economies, create employment, and secure more of the value chain.
We have seen a return to growth in upstream capital spendingAfter considerable declines in 2015 and 2016, upstream capital spending is showing tentative signs of a recovery.
In 2017, global upstream capital spending is estimated to have grown by around 9%3, further modest growth is forecast for 2018, and we expect a return to more significant increases over the medium to longer term. In the Middle East, the rebound is expected to be relatively strong, with increases of 14%3 predicted for 2018. We are also well positioned in several other regions such as the CIS, Africa and Asia Pacific, where we already have a local presence, strong relationships and an extensive track record.
Petrofac is well positioned in some of the most resilient sectors of the market
8 / Petrofac Annual report and accounts 2017
MARKET OUTLOOK
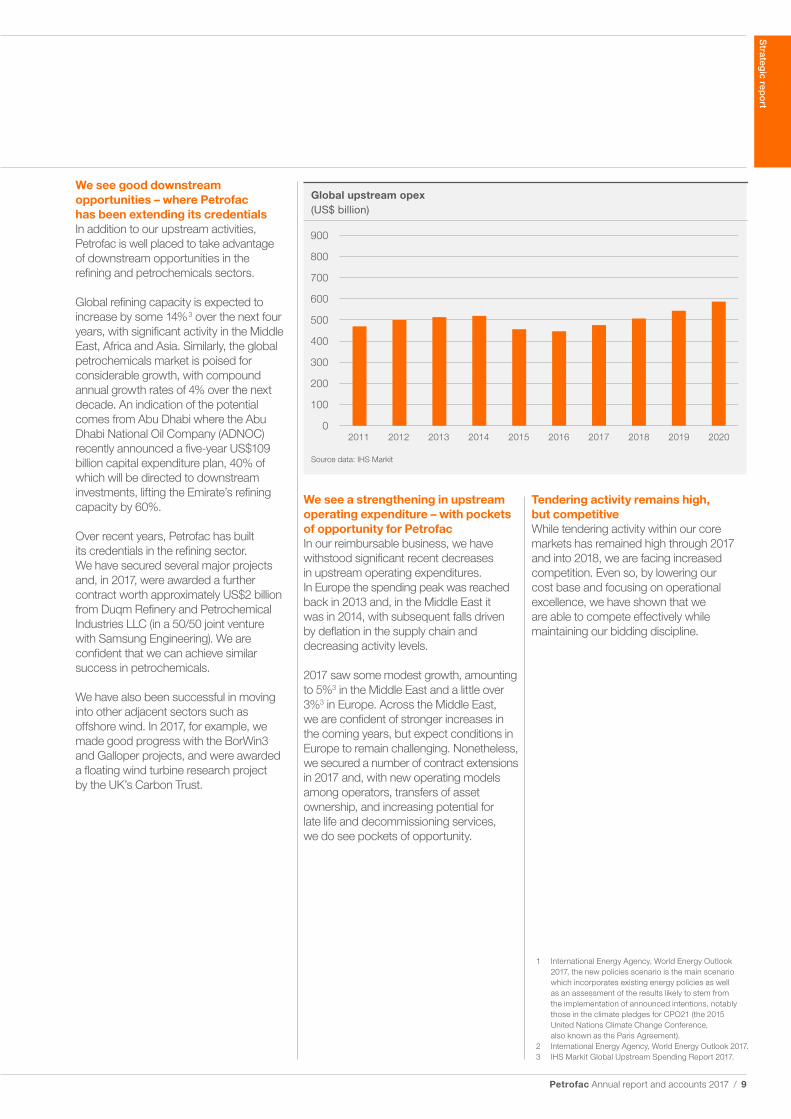
Global upstream opex(US$ billion)
2011 2012 2013 2014 2015 2016 2017 2018 2019 2020
900
800
700
600
500
400
300
200
100
0
Source data: IHS Markit
We see good downstream opportunities – where Petrofac has been extending its credentialsIn addition to our upstream activities, Petrofac is well placed to take advantage of downstream opportunities in the refining and petrochemicals sectors.
Global refining capacity is expected to increase by some 14% 3 over the next four years, with significant activity in the Middle East, Africa and Asia. Similarly, the global petrochemicals market is poised for considerable growth, with compound annual growth rates of 4% over the next decade. An indication of the potential comes from Abu Dhabi where the Abu Dhabi National Oil Company (ADNOC) recently announced a five-year US$109 billion capital expenditure plan, 40% of which will be directed to downstream investments, lifting the Emirate’s refining capacity by 60%.
Over recent years, Petrofac has built its credentials in the refining sector. We have secured several major projects and, in 2017, were awarded a further contract worth approximately US$2 billion from Duqm Refinery and Petrochemical Industries LLC (in a 50/50 joint venture with Samsung Engineering). We are confident that we can achieve similar success in petrochemicals.
We have also been successful in moving into other adjacent sectors such as offshore wind. In 2017, for example, we made good progress with the BorWin3 and Galloper projects, and were awarded a floating wind turbine research project by the UK’s Carbon Trust.
We see a strengthening in upstream operating expenditure – with pockets of opportunity for PetrofacIn our reimbursable business, we have withstood significant recent decreases in upstream operating expenditures. In Europe the spending peak was reached back in 2013 and, in the Middle East it was in 2014, with subsequent falls driven by deflation in the supply chain and decreasing activity levels.
2017 saw some modest growth, amounting to 5%3 in the Middle East and a little over 3%3 in Europe. Across the Middle East, we are confident of stronger increases in the coming years, but expect conditions in Europe to remain challenging. Nonetheless, we secured a number of contract extensions in 2017 and, with new operating models among operators, transfers of asset ownership, and increasing potential for late life and decommissioning services, we do see pockets of opportunity.
Tendering activity remains high, but competitiveWhile tendering activity within our core markets has remained high through 2017 and into 2018, we are facing increased competition. Even so, by lowering our cost base and focusing on operational excellence, we have shown that we are able to compete effectively while maintaining our bidding discipline.
1 International Energy Agency, World Energy Outlook 2017, the new policies scenario is the main scenario which incorporates existing energy policies as well as an assessment of the results likely to stem from the implementation of announced intentions, notably those in the climate pledges for CPO21 (the 2015 United Nations Climate Change Conference, also known as the Paris Agreement).
2 International Energy Agency, World Energy Outlook 2017.3 IHS Markit Global Upstream Spending Report 2017.
Strateg
ic repo
rt
Petrofac Annual report and accounts 2017 / 9
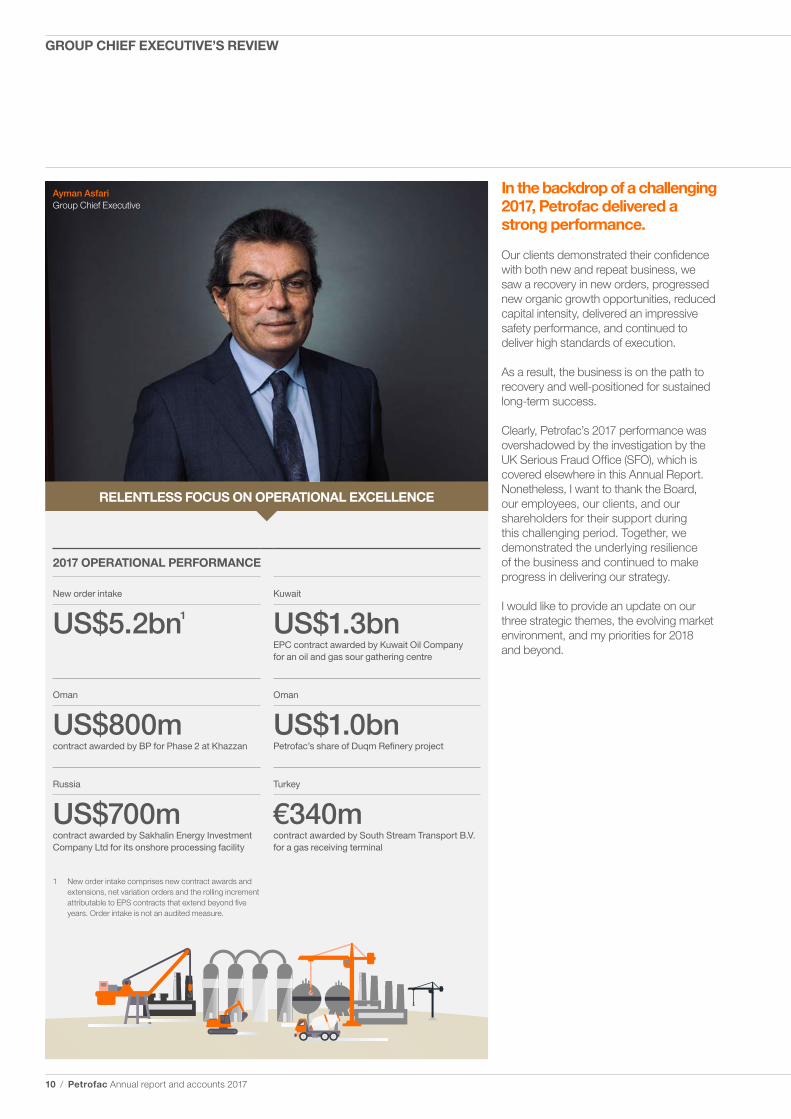
Ayman AsfariGroup Chief Executive
RELENTLESS FOCUS ON OPERATIONAL EXCELLENCE
2017 OPERATIONAL PERFORMANCE
New order intake
US$5.2bn¹
Kuwait
US$1.3bnEPC contract awarded by Kuwait Oil Company for an oil and gas sour gathering centre
Oman
US$800mcontract awarded by BP for Phase 2 at Khazzan
Oman
US$1.0bnPetrofac’s share of Duqm Refinery project
Russia
US$700mcontract awarded by Sakhalin Energy Investment Company Ltd for its onshore processing facility
Turkey
€340mcontract awarded by South Stream Transport B.V. for a gas receiving terminal
In the backdrop of a challenging 2017, Petrofac delivered a strong performance.
Our clients demonstrated their confidence with both new and repeat business, we saw a recovery in new orders, progressed new organic growth opportunities, reduced capital intensity, delivered an impressive safety performance, and continued to deliver high standards of execution.
As a result, the business is on the path to recovery and well-positioned for sustained long-term success.
Clearly, Petrofac’s 2017 performance was overshadowed by the investigation by the UK Serious Fraud Office (SFO), which is covered elsewhere in this Annual Report. Nonetheless, I want to thank the Board, our employees, our clients, and our shareholders for their support during this challenging period. Together, we demonstrated the underlying resilience of the business and continued to make progress in delivering our strategy.
I would like to provide an update on our three strategic themes, the evolving market environment, and my priorities for 2018 and beyond.
1 New order intake comprises new contract awards and extensions, net variation orders and the rolling increment attributable to EPS contracts that extend beyond five years. Order intake is not an audited measure.
10 / Petrofac Annual report and accounts 2017
GROUP CHIEF EXECUTIVE’S REVIEW
Delivering organic growthWe progressed organic growth opportunities in both complementary geographies and adjacent sectors.
For example, we are bidding actively – and executing projects – in India, South East Asia, Turkey and Russia, where we have a full understanding of the risks and the capacity to deliver, and can build on existing client relationships and/or draw on previous experience. Indicative successes include our first ever Turkish project, for a new €340 million gas receiving terminal, and a return to EPC work in Russia with the award of a US$700 million contract on Sakhalin Island by Sakhalin Energy Investment Company Ltd.
In terms of adjacent sectors, we continue to extend our downstream credentials. In recent years, we secured several major refinery projects and, in 2017, were awarded a US$2 billion contract from Duqm Refinery and Petrochemical Industries LLC where we are a 50/50 joint venture partner with Samsung Engineering. We are confident that, by replicating this approach, we can achieve similar success in downstream markets, such as petrochemicals, and win a share of the substantial capital investments that are planned in this sector.
We have also had some success in offshore wind. In 2017, we made progress with the BorWin3 and Galloper projects, and were awarded a floating wind turbine research project by the UK’s Carbon Trust.
Reducing capital intensityWe made significant progress in reducing the capital intensity of the business.
We have concluded the sale of our interest in the Pánuco field in Mexico and have converted Santuario, the largest of our three remaining Mexican service contracts, into a Production Sharing Contract, where we have ownership of the underlying reserves. We have also driven further significant reductions in capital spending, and are bringing increased visibility to our cash management. Going forward, we expect to continue to divest non-core assets, but will be measured in our approach, in a way that protects shareholder value.
The Board has confirmed its intention to exit the deep-water market and the JSD6000 installation vessel has been reclassified as an asset held for sale.
A reassuring new order intake, providing good revenue visibilityI regard our 2017 new order intake of US$5.2 billion as a good outcome in a challenging environment, giving us a healthy order book and good revenue visibility.
Tendering activity remains high and we continue to maintain our bidding discipline to protect our margins in a competitive market. Upstream, there is the beginning of a recovery in capital spending plans and, downstream, we see a flow of opportunities and strong political will in several countries to expand capacity and play a wider role in the hydrocarbons value chain.
In the UK, conditions remain difficult. Contract extensions for Chevron and BP were welcome and our Memorandum of Understanding with Danos in the US demonstrates our determination to pursue selected opportunities in those markets which we consider to be attractive and have knowledge of.
Focusing on our core Operational excellence continues to be a key theme for Petrofac and, in 2017, we continued our focus on best-in-class project delivery. This was achieved in tandem with an excellent safety performance which saw us outperform industry averages and receive several safety accolades from clients.
We completed more than 239 million man-hours across the Group, handing over several projects to our clients. A good example is the Khazzan project for BP in Oman, where we celebrated first gas on Phase 1, extended an exemplary site safety record beyond 43 million man-hours, and secured a US$800 million contract for Phase 2.
A highlight in our EPS East business was the securement of a 10-year Framework Agreement for Petroleum Development Oman (PDO). While the market remains challenging for the EPS West business, ongoing consolidation in our sector is expected to bring new opportunities.
By building on our existing strengths, we are able to deepen our competitive position and deliver more value to clients. During 2017, we continued to reduce our cost base whilst maintaining our delivery capability.
I should stress that this approach to incremental improvement extends well beyond our operational capability: our environmental management systems were further refined, we brought more discipline to the way we manage and develop our people, and we continued to further develop and highlight our compliance agenda throughout the organisation.
Meanwhile, the events of 2017 forced a refresh of the senior leadership teams, with several internal promotions and a few external appointments, including John Pearson as Chief Corporate Development Officer and Group Managing Director, Western Hemisphere. This demonstrated the strength of our succession planning as well as our ability to attract external candidates of the very highest calibre – all without missing a beat in our delivery.
Strateg
ic repo
rt
Petrofac Annual report and accounts 2017 / 11
Read more
See page 36
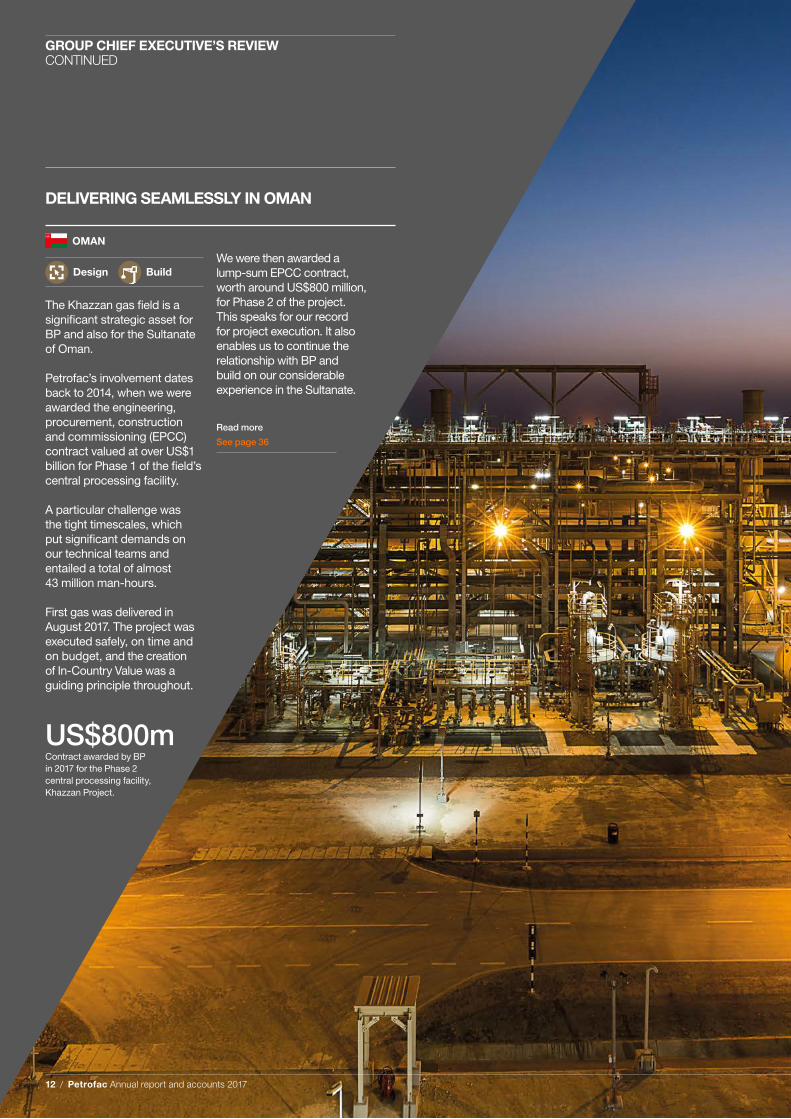
OMAN
Design Build
The Khazzan gas field is a significant strategic asset for BP and also for the Sultanate of Oman.
Petrofac’s involvement dates back to 2014, when we were awarded the engineering, procurement, construction and commissioning (EPCC) contract valued at over US$1 billion for Phase 1 of the field’s central processing facility.
A particular challenge was the tight timescales, which put significant demands on our technical teams and entailed a total of almost 43 million man-hours.
First gas was delivered in August 2017. The project was executed safely, on time and on budget, and the creation of In-Country Value was a guiding principle throughout.
We were then awarded a lump-sum EPCC contract, worth around US$800 million, for Phase 2 of the project. This speaks for our record for project execution. It also enables us to continue the relationship with BP and build on our considerable experience in the Sultanate.
US$800mContract awarded by BP in 2017 for the Phase 2 central processing facility, Khazzan Project.
DELIVERING SEAMLESSLY IN OMAN
12 / Petrofac Annual report and accounts 2017
GROUP CHIEF EXECUTIVE’S REVIEWCONTINUED
Solid foundations for long-term recoveryAlthough the short-to-medium-term conditions remain challenging, we do anticipate healthy increased long-term demand for energy. Signs of healthy recovery, coupled with robust global growth forecasts for the next few years, are fuelling a growing appetite for hydrocarbons and ongoing capital spending by resource holders, which Petrofac is well placed to capitalise on.
The operational performance of 2017, backed up by our delivery-focused culture, our commitment to continuous improvement, and our excellent client relationships, demonstrate that Petrofac is well positioned to succeed as the market continues to show encouraging signs of improvement.
Ayman AsfariGroup Chief Executive 28 February 2018
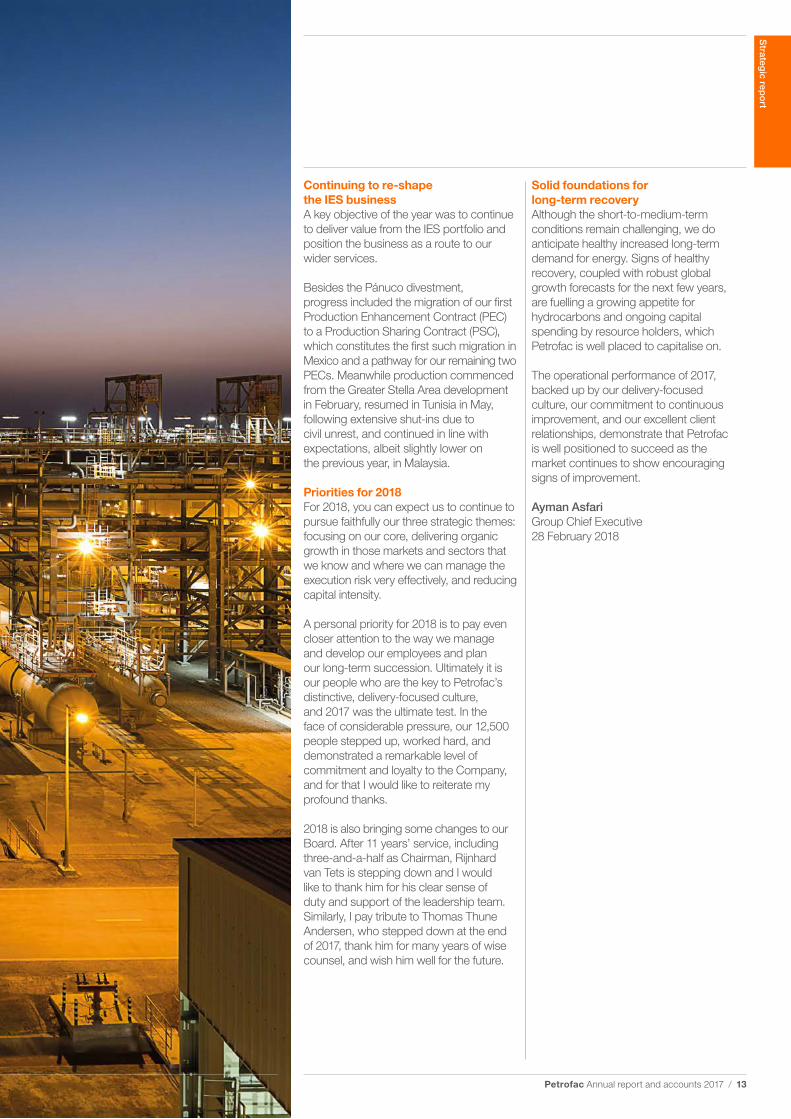
Continuing to re-shape the IES businessA key objective of the year was to continue to deliver value from the IES portfolio and position the business as a route to our wider services.
Besides the Pánuco divestment, progress included the migration of our first Production Enhancement Contract (PEC) to a Production Sharing Contract (PSC), which constitutes the first such migration in Mexico and a pathway for our remaining two PECs. Meanwhile production commenced from the Greater Stella Area development in February, resumed in Tunisia in May, following extensive shut-ins due to civil unrest, and continued in line with expectations, albeit slightly lower on the previous year, in Malaysia.
Priorities for 2018For 2018, you can expect us to continue to pursue faithfully our three strategic themes: focusing on our core, delivering organic growth in those markets and sectors that we know and where we can manage the execution risk very effectively, and reducing capital intensity.
A personal priority for 2018 is to pay even closer attention to the way we manage and develop our employees and plan our long-term succession. Ultimately it is our people who are the key to Petrofac’s distinctive, delivery-focused culture, and 2017 was the ultimate test. In the face of considerable pressure, our 12,500 people stepped up, worked hard, and demonstrated a remarkable level of commitment and loyalty to the Company, and for that I would like to reiterate my profound thanks.
2018 is also bringing some changes to our Board. After 11 years’ service, including three-and-a-half as Chairman, Rijnhard van Tets is stepping down and I would like to thank him for his clear sense of duty and support of the leadership team. Similarly, I pay tribute to Thomas Thune Andersen, who stepped down at the end of 2017, thank him for many years of wise counsel, and wish him well for the future.
Strateg
ic repo
rt
Petrofac Annual report and accounts 2017 / 13
A clear and focused strategy
WHAT WE DO
OUR LICENCE TO OPERATE
OUR STRATEGIC PRIORITIES
GOVERNANCE AND ETHICAL BUSINESS
PRACTICES
RESPECTING HUMAN RIGHTS ACROSS OUR
SUPPLY CHAIN
ENSURING SAFETY,ASSET INTEGRITY
AND SECURITY
ENGAGING WITH LOCAL
COMMUNITIES
DEVELOPING OUR PEOPLE
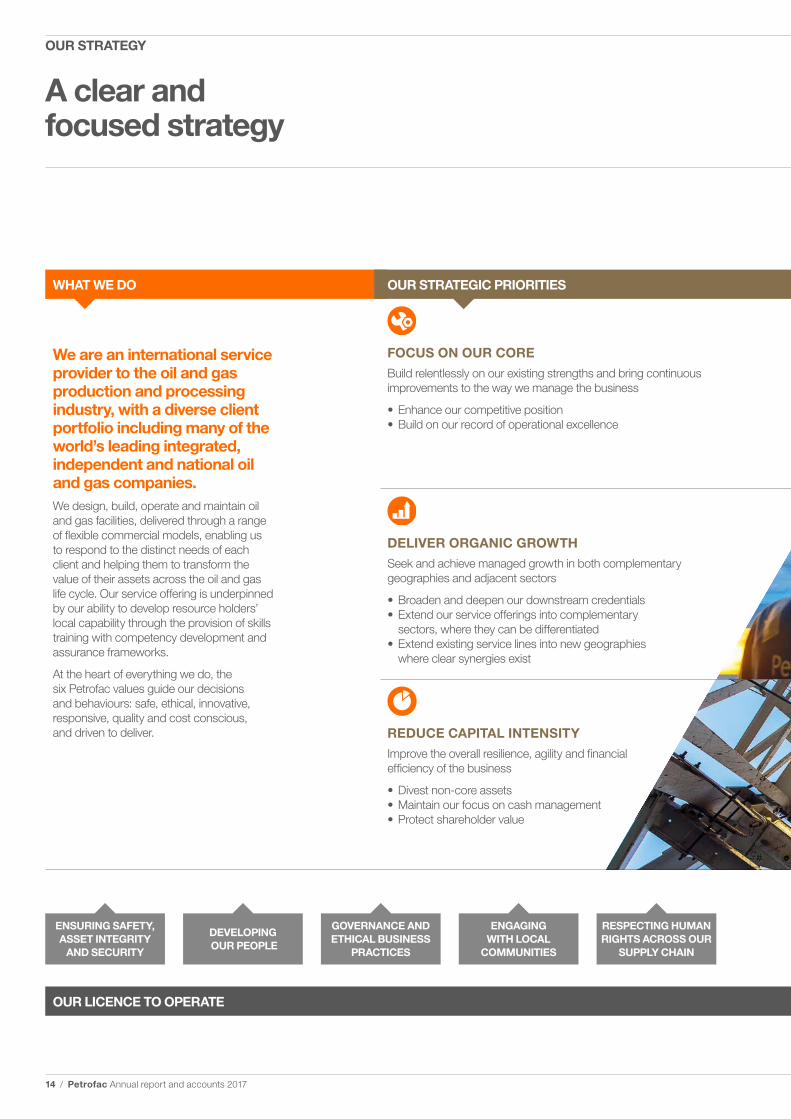
We are an international service provider to the oil and gas production and processing industry, with a diverse client portfolio including many of the world’s leading integrated, independent and national oil and gas companies.We design, build, operate and maintain oil and gas facilities, delivered through a range of flexible commercial models, enabling us to respond to the distinct needs of each client and helping them to transform the value of their assets across the oil and gas life cycle. Our service offering is underpinned by our ability to develop resource holders’ local capability through the provision of skills training with competency development and assurance frameworks.
At the heart of everything we do, the six Petrofac values guide our decisions and behaviours: safe, ethical, innovative, responsive, quality and cost conscious, and driven to deliver.
DELIVER ORGANIC GROWTH
Seek and achieve managed growth in both complementary geographies and adjacent sectors
• Broaden and deepen our downstream credentials• Extend our service offerings into complementary
sectors, where they can be differentiated• Extend existing service lines into new geographies
where clear synergies exist
FOCUS ON OUR CORE
Build relentlessly on our existing strengths and bring continuous improvements to the way we manage the business
• Enhance our competitive position• Build on our record of operational excellence
REDUCE CAPITAL INTENSITY
Improve the overall resilience, agility and financial efficiency of the business
• Divest non-core assets • Maintain our focus on cash management • Protect shareholder value
14 / Petrofac Annual report and accounts 2017
OUR STRATEGY
PROTECTING THEENVIRONMENT
GENERATINGECONOMIC VALUE
IN-COUNTRY
20
18
16
Key performance indicators
See pages 22-23
Directors' remuneration report
See page 90
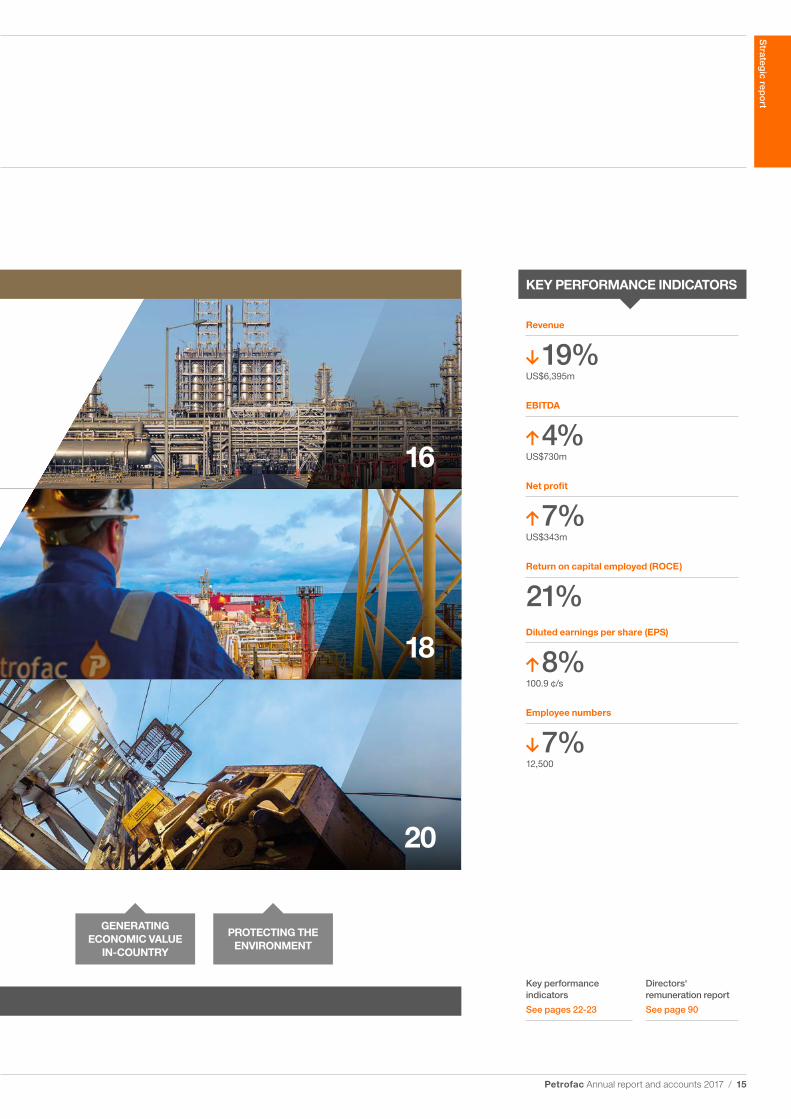
KEY PERFORMANCE INDICATORS
Revenue
19%US$6,395m
EBITDA
4%US$730m
Net profit
7%US$343m
Return on capital employed (ROCE )
21%Diluted earnings per share (EPS)
8%100.9 ¢/s
Employee numbers
7%12,500
Strateg
ic repo
rt
Petrofac Annual report and accounts 2017 / 15
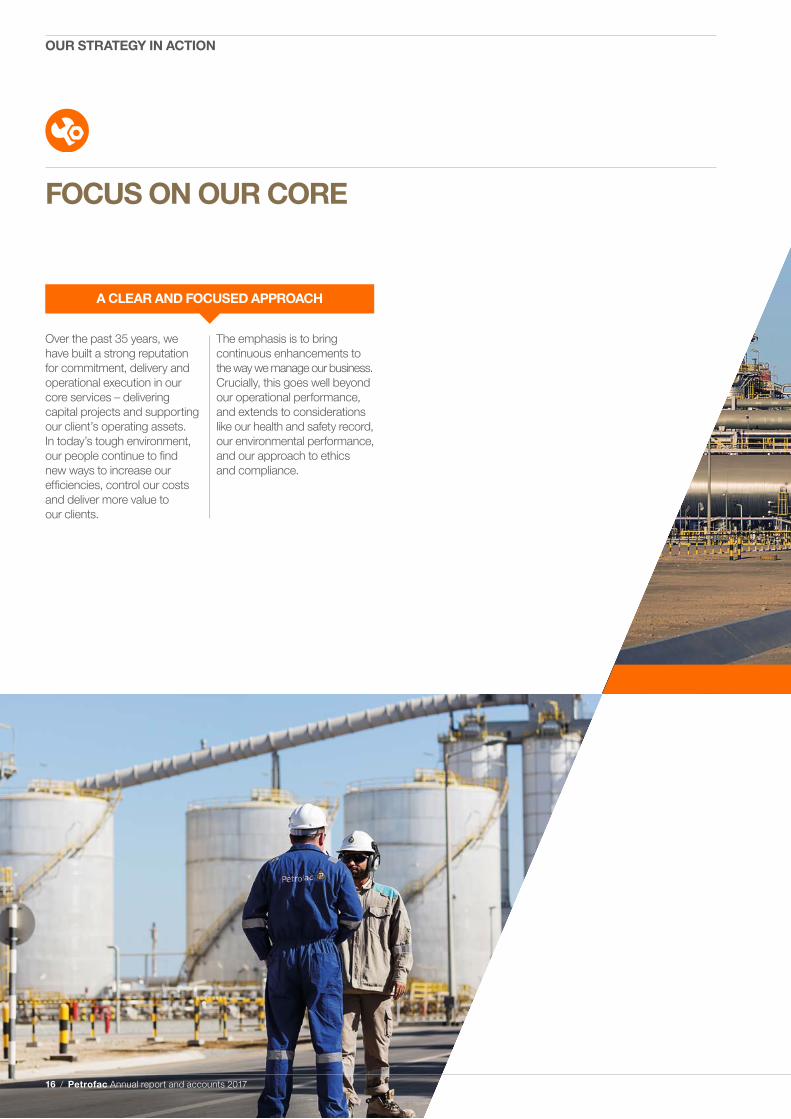
The emphasis is to bring continuous enhancements to the way we manage our business. Crucially, this goes well beyond our operational performance, and extends to considerations like our health and safety record, our environmental performance, and our approach to ethics and compliance.
Over the past 35 years, we have built a strong reputation for commitment, delivery and operational execution in our core services – delivering capital projects and supporting our client’s operating assets. In today’s tough environment, our people continue to find new ways to increase our efficiencies, control our costs and deliver more value to our clients.
FOCUS ON OUR CORE
A CLEAR AND FOCUSED APPROACH
16 / Petrofac Annual report and accounts 2017
OUR STRATEGY IN ACTION
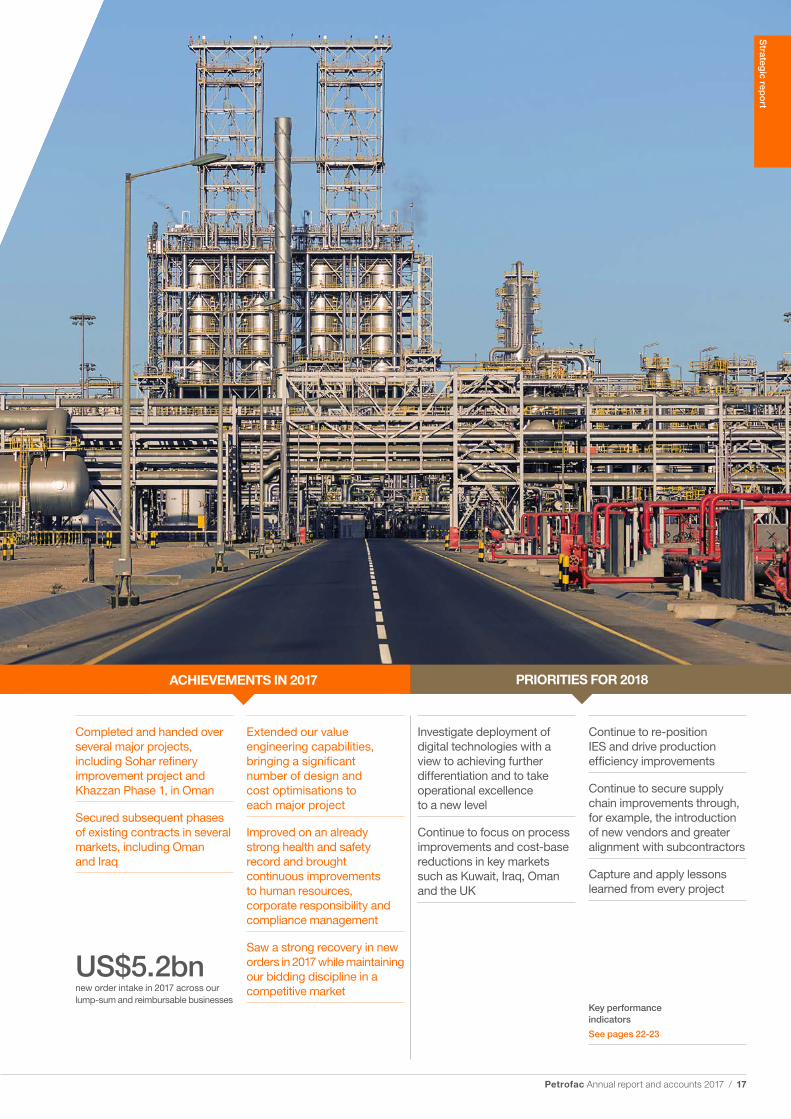
Completed and handed over several major projects, including Sohar refinery improvement project and Khazzan Phase 1, in Oman
Secured subsequent phases of existing contracts in several markets, including Oman and Iraq
Investigate deployment of digital technologies with a view to achieving further differentiation and to take operational excellence to a new level
Continue to focus on process improvements and cost-base reductions in key markets such as Kuwait, Iraq, Oman and the UK
Extended our value engineering capabilities, bringing a significant number of design and cost optimisations to each major project
Improved on an already strong health and safety record and brought continuous improvements to human resources, corporate responsibility and compliance management
Saw a strong recovery in new orders in 2017 while maintaining our bidding discipline in a competitive market
Continue to re-position IES and drive production efficiency improvements
Continue to secure supply chain improvements through, for example, the introduction of new vendors and greater alignment with subcontractors
Capture and apply lessons learned from every project
US$5.2bnnew order intake in 2017 across our lump-sum and reimbursable businesses
Key performance indicators
See pages 22-23
ACHIEVEMENTS IN 2017 PRIORITIES FOR 2018
Strateg
ic repo
rt
Petrofac Annual report and accounts 2017 / 17
ACHIEVEMENTS IN 2017 PRIORITIES FOR 2018
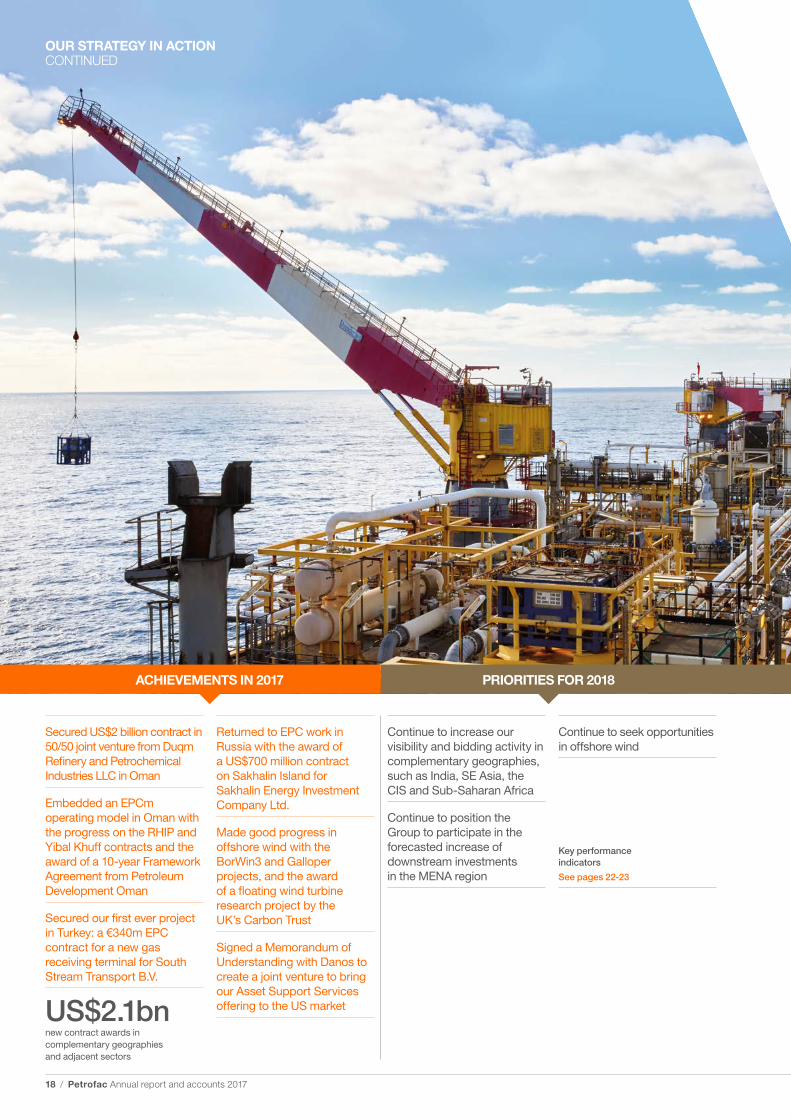
US$2.1bnnew contract awards in complementary geographies and adjacent sectors
Key performance indicators
See pages 22-23
Secured US$2 billion contract in 50/50 joint venture from Duqm Refinery and Petrochemical Industries LLC in Oman
Embedded an EPCm operating model in Oman with the progress on the RHIP and Yibal Khuff contracts and the award of a 10-year Framework Agreement from Petroleum Development Oman
Secured our first ever project in Turkey: a €340m EPC contract for a new gas receiving terminal for South Stream Transport B.V.
Returned to EPC work in Russia with the award of a US$700 million contract on Sakhalin Island for Sakhalin Energy Investment Company Ltd.
Made good progress in offshore wind with the BorWin3 and Galloper projects, and the award of a floating wind turbine research project by the UK’s Carbon Trust
Signed a Memorandum of Understanding with Danos to create a joint venture to bring our Asset Support Services offering to the US market
Continue to increase our visibility and bidding activity in complementary geographies, such as India, SE Asia, the CIS and Sub-Saharan Africa
Continue to position the Group to participate in the forecasted increase of downstream investments in the MENA region
Continue to seek opportunities in offshore wind
18 / Petrofac Annual report and accounts 2017
OUR STRATEGY IN ACTION CONTINUED
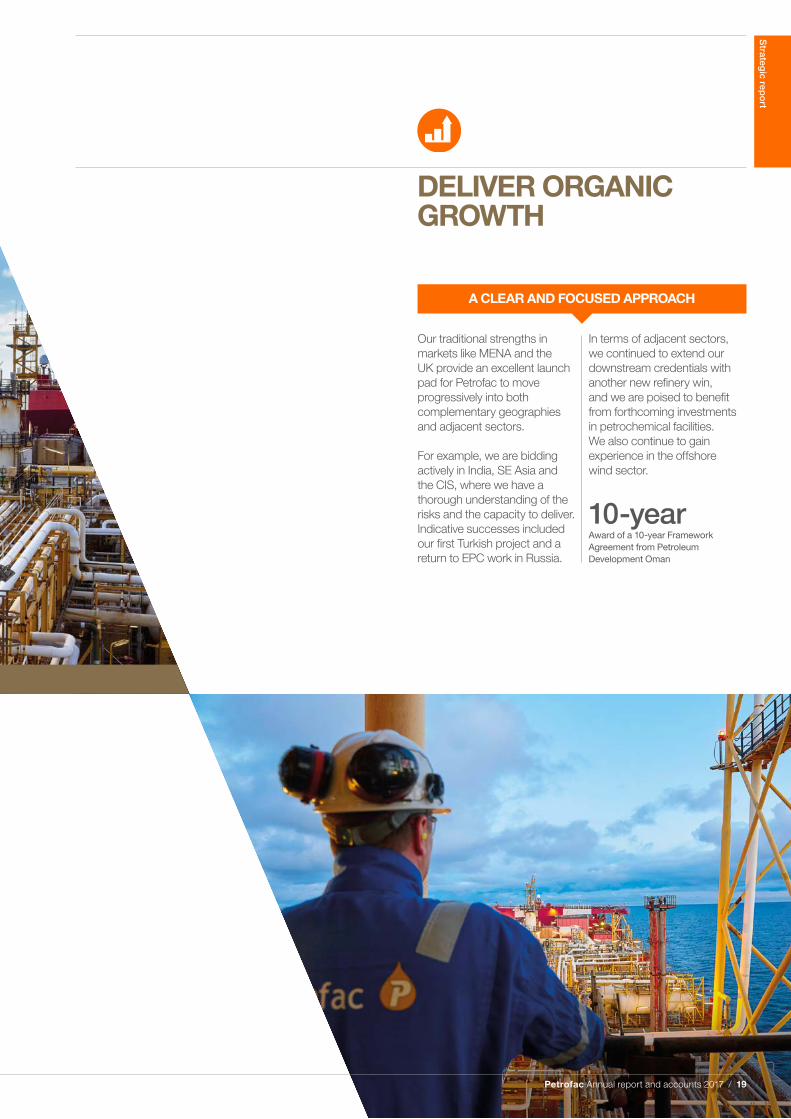
Our traditional strengths in markets like MENA and the UK provide an excellent launch pad for Petrofac to move progressively into both complementary geographies and adjacent sectors.
For example, we are bidding actively in India, SE Asia and the CIS, where we have a thorough understanding of the risks and the capacity to deliver. Indicative successes included our first Turkish project and a return to EPC work in Russia.
In terms of adjacent sectors, we continued to extend our downstream credentials with another new refinery win, and we are poised to benefit from forthcoming investments in petrochemical facilities. We also continue to gain experience in the offshore wind sector.
A CLEAR AND FOCUSED APPROACH
DELIVER ORGANIC GROWTH
10-yearAward of a 10-year Framework Agreement from Petroleum Development Oman
Petrofac Annual report and accounts 2017 / 19
Strateg
ic repo
rt
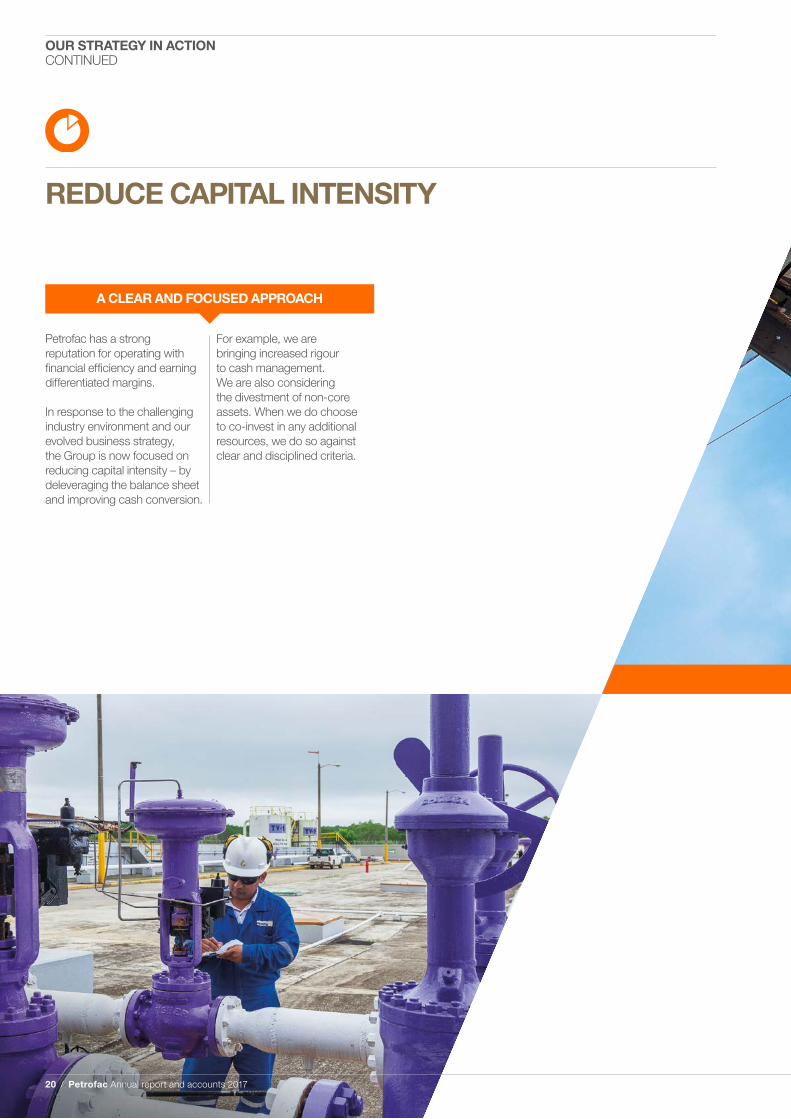
REDUCE CAPITAL INTENSITY
A CLEAR AND FOCUSED APPROACH
For example, we are bringing increased rigour to cash management. We are also considering the divestment of non-core assets. When we do choose to co-invest in any additional resources, we do so against clear and disciplined criteria.
Petrofac has a strong reputation for operating with financial efficiency and earning differentiated margins.
In response to the challenging industry environment and our evolved business strategy, the Group is now focused on reducing capital intensity – by deleveraging the balance sheet and improving cash conversion.
20 / Petrofac Annual report and accounts 2017
OUR STRATEGY IN ACTION CONTINUED
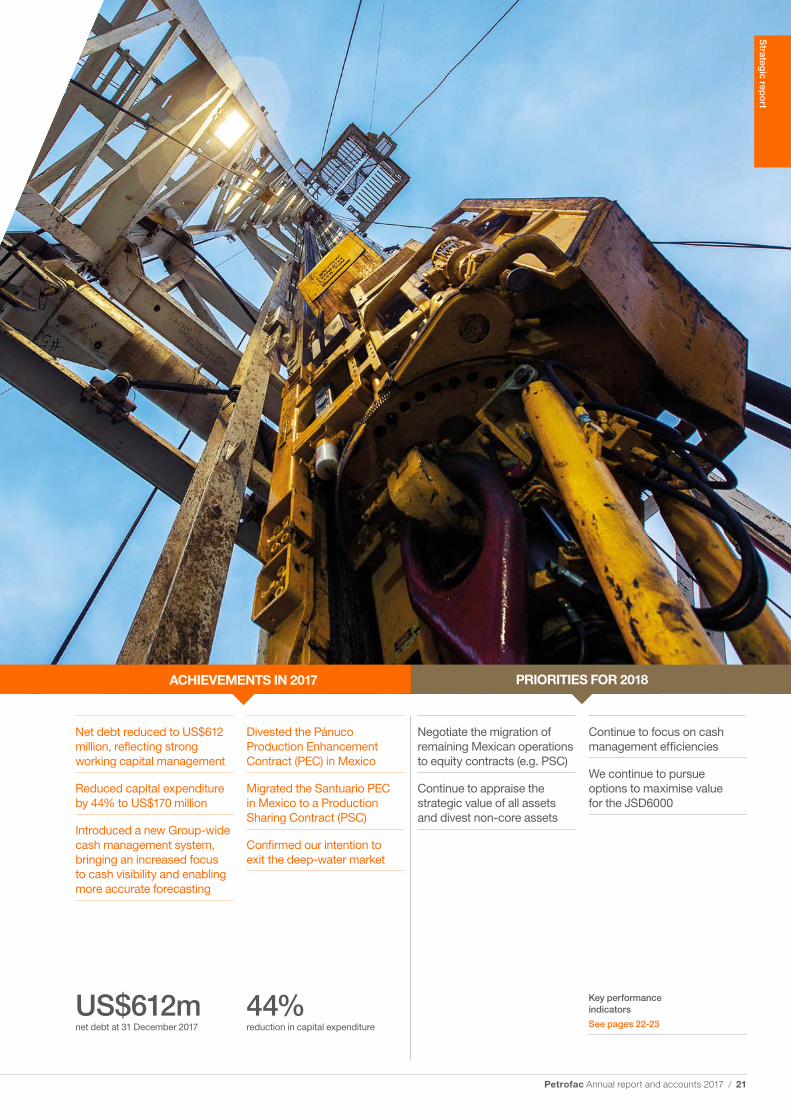
Net debt reduced to US$612 million, reflecting strong working capital management
Reduced capital expenditure by 44% to US$170 million
Introduced a new Group-wide cash management system, bringing an increased focus to cash visibility and enabling more accurate forecasting
Negotiate the migration of remaining Mexican operations to equity contracts (e.g. PSC)
Continue to appraise the strategic value of all assets and divest non-core assets
Divested the Pánuco Production Enhancement Contract (PEC) in Mexico
Migrated the Santuario PEC in Mexico to a Production Sharing Contract (PSC)
Confirmed our intention to exit the deep-water market
Continue to focus on cash management efficiencies
We continue to pursue options to maximise value for the JSD6000
44%reduction in capital expenditure
US$612mnet debt at 31 December 2017
Key performance indicators
See pages 22-23
ACHIEVEMENTS IN 2017 PRIORITIES FOR 2018
Strateg
ic repo
rt
Petrofac Annual report and accounts 2017 / 21
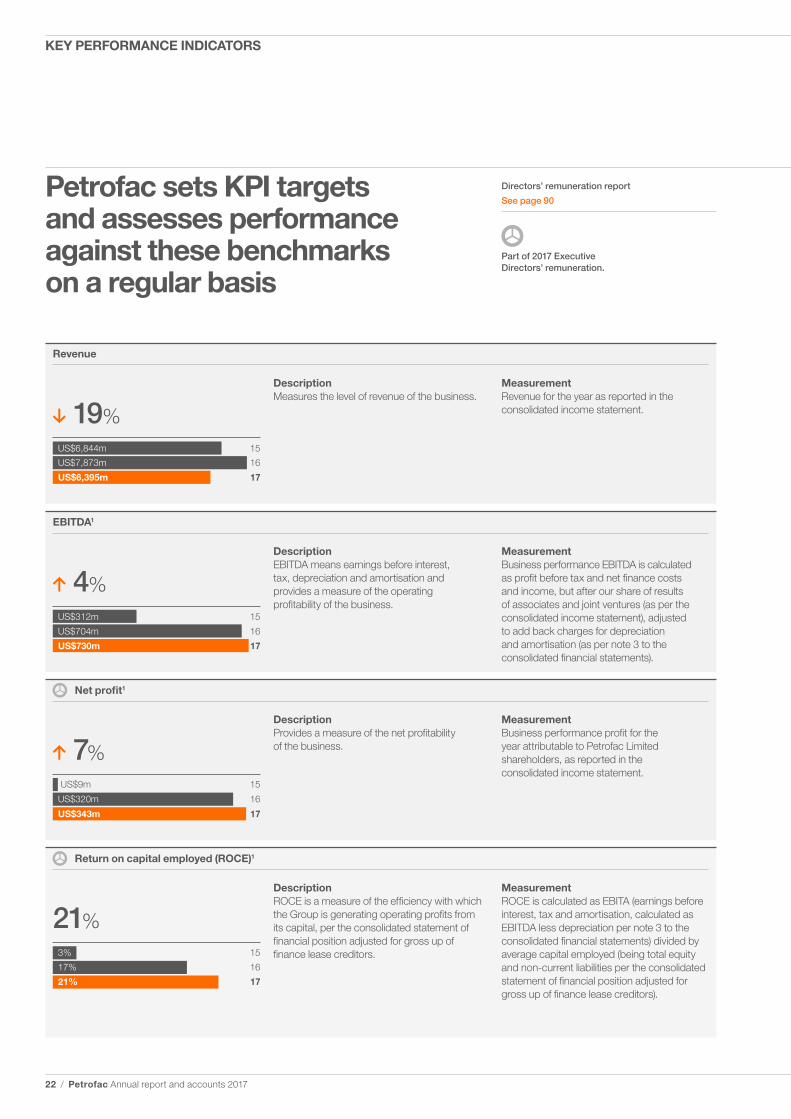
Petrofac sets KPI targets and assesses performance against these benchmarks on a regular basis
7%
4%
19%
21%
Return on capital employed (ROCE)1
Net profit1
EBITDA1
Revenue
DescriptionMeasures the level of revenue of the business.
DescriptionEBITDA means earnings before interest, tax, depreciation and amortisation and provides a measure of the operating profitability of the business.
DescriptionProvides a measure of the net profitability of the business.
DescriptionROCE is a measure of the efficiency with which the Group is generating operating profits from its capital, per the consolidated statement of financial position adjusted for gross up of finance lease creditors.
US$6,844m
US$7,873m
US$6,395m
15
16
17
US$312m
US$704m
US$730m
15
16
17
US$9m
US$320m
US$343m
15
16
17
3%
17%
21%
15
16
17
MeasurementRevenue for the year as reported in the consolidated income statement.
MeasurementBusiness performance EBITDA is calculated as profit before tax and net finance costs and income, but after our share of results of associates and joint ventures (as per the consolidated income statement), adjusted to add back charges for depreciation and amortisation (as per note 3 to the consolidated financial statements).
Measurement Business performance profit for the year attributable to Petrofac Limited shareholders, as reported in the consolidated income statement.
MeasurementROCE is calculated as EBITA (earnings before interest, tax and amortisation, calculated as EBITDA less depreciation per note 3 to the consolidated financial statements) divided by average capital employed (being total equity and non-current liabilities per the consolidated statement of financial position adjusted for gross up of finance lease creditors).
Directors’ remuneration report
See page 90
Part of 2017 Executive Directors’ remuneration.
22 / Petrofac Annual report and accounts 2017
KEY PERFORMANCE INDICATORS
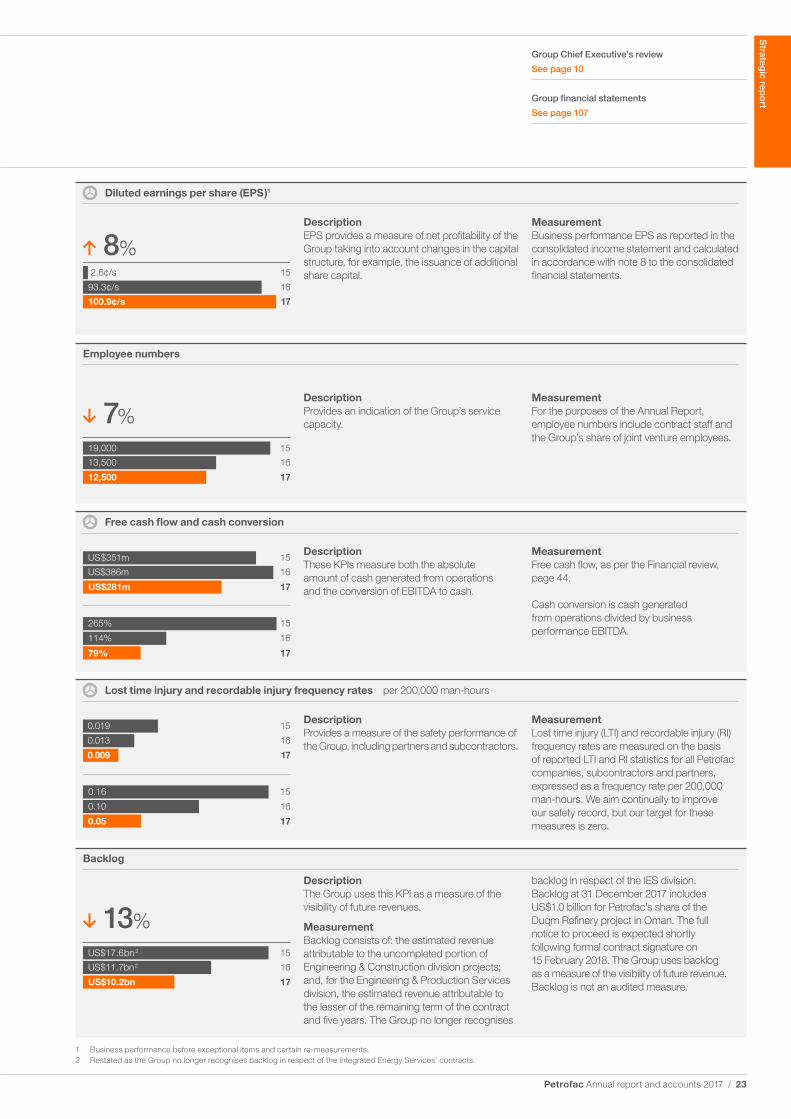
8%
DescriptionProvides an indication of the Group’s service capacity.
DescriptionEPS provides a measure of net profitability of the Group taking into account changes in the capital structure, for example, the issuance of additional share capital.
MeasurementFree cash flow, as per the Financial review, page 44.
Cash conversion is cash generated from operations divided by business performance EBITDA.
MeasurementLost time injury (LTI) and recordable injury (RI) frequency rates are measured on the basis of reported LTI and RI statistics for all Petrofac companies, subcontractors and partners, expressed as a frequency rate per 200,000 man-hours. We aim continually to improve our safety record, but our target for these measures is zero.
DescriptionThe Group uses this KPI as a measure of the visibility of future revenues.
MeasurementBacklog consists of: the estimated revenue attributable to the uncompleted portion of Engineering & Construction division projects; and, for the Engineering & Production Services division, the estimated revenue attributable to the lesser of the remaining term of the contract and five years. The Group no longer recognises
19,000
13,500
12,500
15
16
17
2.6¢/s
93.3¢/s
100.9¢/s
15
16
17
US$351m
US$386m
US$281m
15
16
17
0.019
0.013
0.009
15
16
17
US$17.6bn2
US$11.7bn2
US$10.2bn
15
16
17
MeasurementFor the purposes of the Annual Report, employee numbers include contract staff and the Group’s share of joint venture employees.
MeasurementBusiness performance EPS as reported in the consolidated income statement and calculated in accordance with note 8 to the consolidated financial statements.
backlog in respect of the IES division. Backlog at 31 December 2017 includes US$1.0 billion for Petrofac’s share of the Duqm Refinery project in Oman. The full notice to proceed is expected shortly following formal contract signature on 15 February 2018. The Group uses backlog as a measure of the visibility of future revenue. Backlog is not an audited measure.
265%
114%
79%
15
16
17
0.16
0.10
0.05
15
16
17
1 Business performance before exceptional items and certain re-measurements.2 Restated as the Group no longer recognises backlog in respect of the Integrated Energy Services’ contracts.
Group Chief Executive's review
See page 10
Group financial statements
See page 107
Diluted earnings per share (EPS )1
Employee numbers
Free cash flow and cash conversion
Lost time injury and recordable injury frequency rates per 200,000 man-hours
Backlog
7%
13%
DescriptionThese KPIs measure both the absolute amount of cash generated from operations and the conversion of EBITDA to cash.
DescriptionProvides a measure of the safety performance of the Group, including partners and subcontractors.
Strateg
ic repo
rt
Petrofac Annual report and accounts 2017 / 23
117
8
2
9
10
4
1 5
6
3
Responsibilities and experience
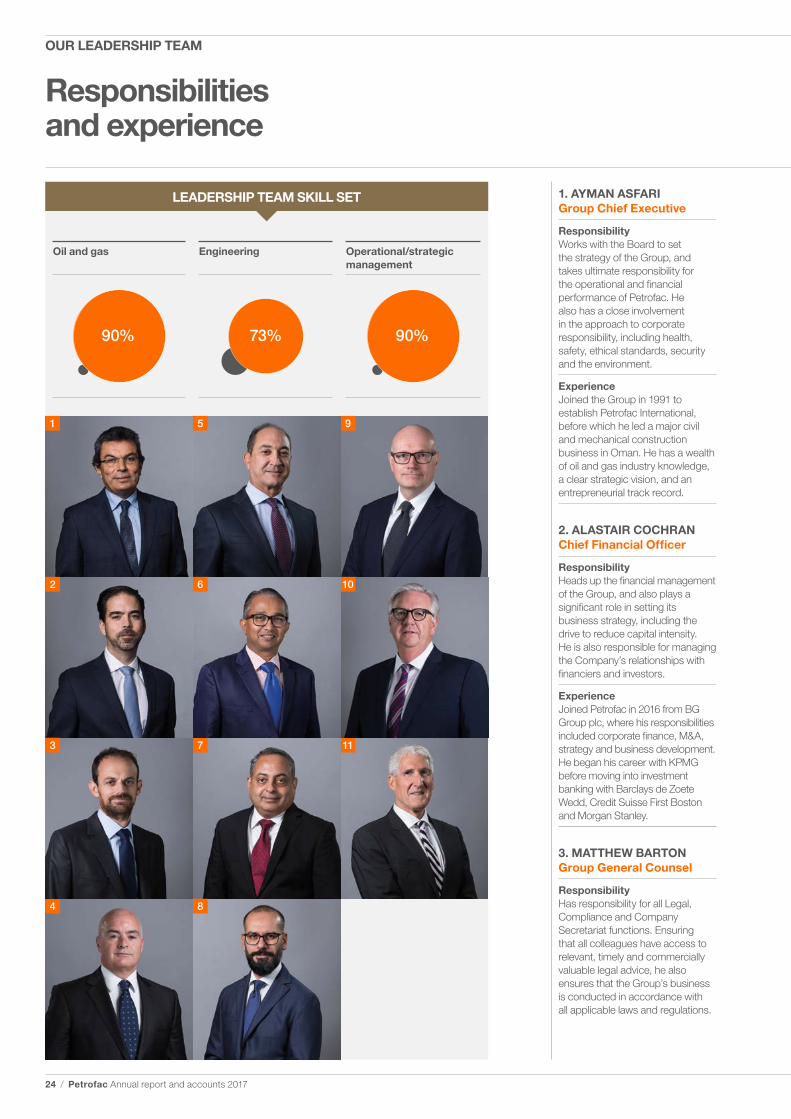
LEADERSHIP TEAM SKILL SET 1. AYMAN ASFARI Group Chief Executive
Responsibility Works with the Board to set the strategy of the Group, and takes ultimate responsibility for the operational and financial performance of Petrofac. He also has a close involvement in the approach to corporate responsibility, including health, safety, ethical standards, security and the environment.
Experience Joined the Group in 1991 to establish Petrofac International, before which he led a major civil and mechanical construction business in Oman. He has a wealth of oil and gas industry knowledge, a clear strategic vision, and an entrepreneurial track record.
2. ALASTAIR COCHRAN Chief Financial Officer
Responsibility Heads up the financial management of the Group, and also plays a significant role in setting its business strategy, including the drive to reduce capital intensity. He is also responsible for managing the Company’s relationships with financiers and investors.
Experience Joined Petrofac in 2016 from BG Group plc, where his responsibilities included corporate finance, M&A, strategy and business development. He began his career with KPMG before moving into investment banking with Barclays de Zoete Wedd, Credit Suisse First Boston and Morgan Stanley.
3. MATTHEW BARTON Group General Counsel
Responsibility Has responsibility for all Legal, Compliance and Company Secretariat functions. Ensuring that all colleagues have access to relevant, timely and commercially valuable legal advice, he also ensures that the Group’s business is conducted in accordance with all applicable laws and regulations.
Oil and gas Engineering Operational/strategic management
90% 73% 90%
24 / Petrofac Annual report and accounts 2017
OUR LEADERSHIP TEAM
Experience Joined Petrofac in 2018 with more than 20 years’ experience, 13 of which are in General Counsel roles, both in the UK and the Middle East. He began his legal career in private practice, working in London and Hong Kong before moving into the engineering and construction industry.
4. DES THURLBY Group Director of Human Resources
Responsibility Has overall responsibility for advising on all people aspects of the business. This includes developing a business-focused people strategy, including succession planning, talent management, leadership development, compensation, key hires, performance culture and employee engagement.
Experience Joined Petrofac in 2017. He started his career as a graduate trainee with Ford Motor Company and spent 25 years in the automotive sector, including six years as HR Director for Jaguar Land Rover. He was also interim President of IMI China and Senior Vice President of Seadrill, an offshore drilling contractor.
5. GEORGE SALIBI Group Chief Commercial Officer
Responsibility Works with both the E&C and EPS businesses, with an emphasis on strategic partnerships, business development and acquisition, operational support and business assurance.
Experience Joined Petrofac in 1998 and has held a variety of management and operational roles. He headed up some of the Company’s most prestigious projects, including the US$3.7 billion Upper Zadco-750 contract in UAE. Most recently he was Regional MD, covering the UAE, Oman, Algeria and Asia.
6. E S SATHYANARAYANAN Group Managing Director, Engineering & Construction
Responsibility Has full operational and P&L responsibility for Petrofac’s Engineering, Procurement and Construction portfolio in its core geographical markets including the UAE, Kuwait, Oman, Saudi Arabia, Algeria and Iraq. He also heads up the Group’s Offshore Capital Projects business and is responsible for all Group technical resources, including the three Indian engineering centres.
Experience Joined Petrofac in 1995, and has held various key roles covering diverse geographical locations such as India, CIS and MENA, and led the Company’s entry into Iraq. He has more than 30 years of experience in the oil and gas sector.
7. SUNDER KALYANAM Group Managing Director, Engineering & Construction Growth
Responsibility Has full P&L and stakeholder responsibility for delivering the E&C portfolio in Petrofac’s strategic growth regions. These include complementary geographies, identified for organic growth, such as India, Southeast Asia, Sub-Saharan Africa, and CIS, where the Group has a good understanding of risks and the capacity to deliver.
Experience Joined Petrofac in 1992, and has held a range of operational and management roles across the Group. Most recently, he was Regional Managing Director, E&C with responsibility for all Petrofac’s onshore operations in Kuwait, Iraq and Oman.
8. ELIE LAHOUD Senior Vice President, Operations Engineering & Construction
Responsibility With a background as a design engineer, and strong project experience, he leads the operational teams across Oman, Saudi Arabia and Iraq. In this role, he ensures that Petrofac identifies and implements opportunities for incremental enhancements to its operational capabilities.
Experience Joined Petrofac in 1997 and has held several key operations and engineering roles. From 2014 he led the delivery of the strategically significant BP Khazzan project in Oman and, from 2016 was SVP and Sponsor for Oman operations. He has more than 20 years’ industry experience.
9. JOHN PEARSON Chief Corporate Development Officer and Group Managing Director, Western Hemisphere
Responsibility As Chief Corporate Development Officer, he manages relationships with international and independent oil companies, and leads the implementation of Group strategy. As Group Managing Director, Western Hemisphere, he is responsible for the long-term growth of the EPS West business.
Experience Joined Petrofac in 2017, prior to which he spent 28 years with AMEC Foster Wheeler and five years with Chevron, in the UK and US. His previous roles have included president of global oil, gas and chemicals, and multi-market roles running the Americas, Northern Europe and CIS regions. He has also been a Co-Chair of Oil & Gas UK.
10. CRAIG MUIR Group Managing Director, Engineering & Production Services, Eastern Hemisphere
Responsibility Focuses on leading and growing the EPS business in geographies such as MENA, CIS and Asia Pacific. His remit includes: engineering, procurement and construction management (EPCm); operations and maintenance; training; and all consultancy services.
Experience Joined Petrofac in 2012 as MD of Engineering & Consulting Services, where his responsibilities included the management of our engineering service centres, and the creation of the new EPS Group. He has over 30 years’ industry experience with companies such as AMEC, KBR and AOC.
11. ROB JEWKES Chief Operating Officer, Integrated Energy Services
Responsibility Heads up the IES business, and has full responsibility for its business portfolio. Most recently he has been charged with the re-shaping of this portfolio, including a number of divestments and contract migrations and the re-positioning of IES as a route to the wider Petrofac services.
Experience Joined Petrofac in 2004 to build a Europe-based engineering services business, before moving into IES where his emphasis has been leveraging our engineering and project management capability. He has over 35 years’ experience in oil and gas and was previously CEO of Clough Engineering.
Strateg
ic repo
rt
Petrofac Annual report and accounts 2017 / 25
Identifying and managing risks and opportunities is key to the successful delivery of our strategy. We operate in a challenging environment and understand that risks are an inherent part of our business.
We believe our risk management framework provides us with the structure to identify the risks and uncertainties that may impact our business, thereby underpinning our ability to achieve our objectives and assess opportunities as our business evolves.
In 2017, there was a particular focus on strengthening the Group’s compliance framework, in particular the anti-bribery and corruption controls that are in place across the Group.
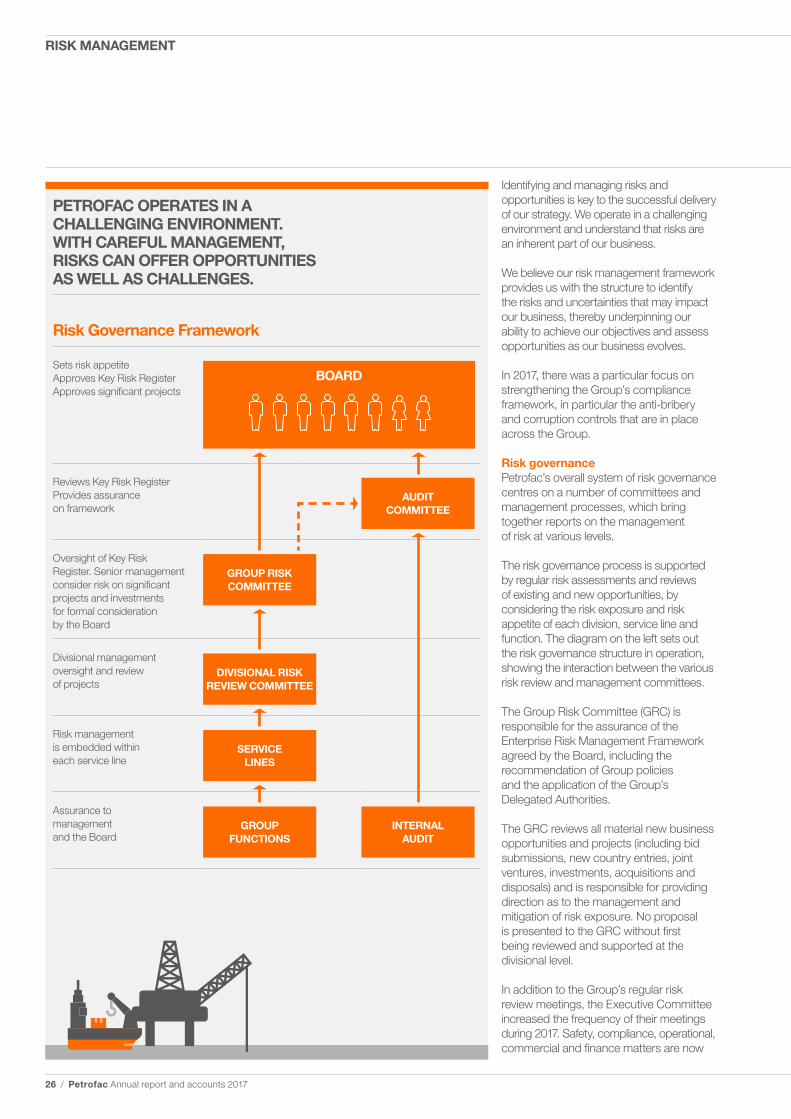
Risk governancePetrofac’s overall system of risk governance centres on a number of committees and management processes, which bring together reports on the management of risk at various levels.
The risk governance process is supported by regular risk assessments and reviews of existing and new opportunities, by considering the risk exposure and risk appetite of each division, service line and function. The diagram on the left sets out the risk governance structure in operation, showing the interaction between the various risk review and management committees.
The Group Risk Committee (GRC) is responsible for the assurance of the Enterprise Risk Management Framework agreed by the Board, including the recommendation of Group policies and the application of the Group’s Delegated Authorities.
The GRC reviews all material new business opportunities and projects (including bid submissions, new country entries, joint ventures, investments, acquisitions and disposals) and is responsible for providing direction as to the management and mitigation of risk exposure. No proposal is presented to the GRC without first being reviewed and supported at the divisional level.
In addition to the Group’s regular risk review meetings, the Executive Committee increased the frequency of their meetings during 2017. Safety, compliance, operational, commercial and finance matters are now
PETROFAC OPERATES IN A CHALLENGING ENVIRONMENT. WITH CAREFUL MANAGEMENT, RISKS CAN OFFER OPPORTUNITIES AS WELL AS CHALLENGES.
Risk Governance Framework
Sets risk appetite Approves Key Risk Register Approves significant projects
BOARD
Reviews Key Risk Register Provides assurance on framework
AUDITCOMMITTEE
Oversight of Key Risk Register. Senior management consider risk on significant projects and investments for formal consideration by the Board
GROUP RISK COMMITTEE
Divisional management oversight and review of projects
DIVISIONAL RISK REVIEW COMMITTEE
Risk management is embedded within each service line
SERVICELINES
Assurance to management and the Board
GROUPFUNCTIONS
INTERNALAUDIT
26 / Petrofac Annual report and accounts 2017
RISK MANAGEMENT
Enterprise Risk Management system (and other tools)
Leadership, communications and engagement
Company values and culture
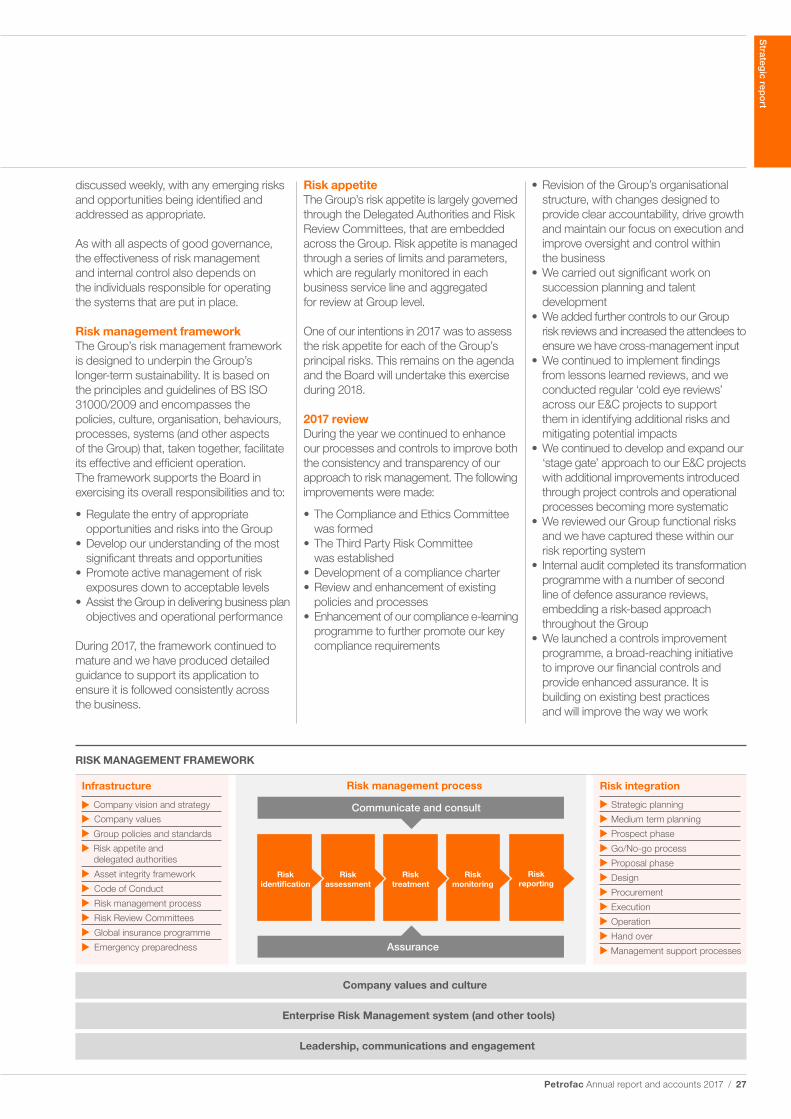
Risk integration
Strategic planning
Medium term planning
Prospect phase
Go/No-go process
Proposal phase
Design
Procurement
Execution
Operation
Hand over
Management support processes
Infrastructure
Company vision and strategy
Company values
Group policies and standards
Risk appetite anddelegated authorities
Asset integrity framework
Code of Conduct
Risk management process
Risk Review Committees
Global insurance programme
Emergency preparedness
Risk management process
Communicate and consult
Riskassessment
Risktreatment
Riskmonitoring
Riskreporting
Riskidentification
Assurance
discussed weekly, with any emerging risks and opportunities being identified and addressed as appropriate.
As with all aspects of good governance, the effectiveness of risk management and internal control also depends on the individuals responsible for operating the systems that are put in place.
Risk management frameworkThe Group’s risk management framework is designed to underpin the Group’s longer-term sustainability. It is based on the principles and guidelines of BS ISO 31000/2009 and encompasses the policies, culture, organisation, behaviours, processes, systems (and other aspects of the Group) that, taken together, facilitate its effective and efficient operation. The framework supports the Board in exercising its overall responsibilities and to:
• Regulate the entry of appropriate opportunities and risks into the Group
• Develop our understanding of the most significant threats and opportunities
• Promote active management of risk exposures down to acceptable levels
• Assist the Group in delivering business plan objectives and operational performance
During 2017, the framework continued to mature and we have produced detailed guidance to support its application to ensure it is followed consistently across the business.
Risk appetiteThe Group’s risk appetite is largely governed through the Delegated Authorities and Risk Review Committees, that are embedded across the Group. Risk appetite is managed through a series of limits and parameters, which are regularly monitored in each business service line and aggregated for review at Group level.
One of our intentions in 2017 was to assess the risk appetite for each of the Group’s principal risks. This remains on the agenda and the Board will undertake this exercise during 2018.
2017 reviewDuring the year we continued to enhance our processes and controls to improve both the consistency and transparency of our approach to risk management. The following improvements were made:
• The Compliance and Ethics Committee was formed
• The Third Party Risk Committee was established
• Development of a compliance charter• Review and enhancement of existing
policies and processes• Enhancement of our compliance e-learning
programme to further promote our key compliance requirements
• Revision of the Group’s organisational structure, with changes designed to provide clear accountability, drive growth and maintain our focus on execution and improve oversight and control within the business
• We carried out significant work on succession planning and talent development
• We added further controls to our Group risk reviews and increased the attendees to ensure we have cross-management input
• We continued to implement findings from lessons learned reviews, and we conducted regular ‘cold eye reviews’ across our E&C projects to support them in identifying additional risks and mitigating potential impacts
• We continued to develop and expand our ‘stage gate’ approach to our E&C projects with additional improvements introduced through project controls and operational processes becoming more systematic
• We reviewed our Group functional risks and we have captured these within our risk reporting system
• Internal audit completed its transformation programme with a number of second line of defence assurance reviews, embedding a risk-based approach throughout the Group
• We launched a controls improvement programme, a broad-reaching initiative to improve our financial controls and provide enhanced assurance. It is building on existing best practices and will improve the way we work
RISK MANAGEMENT FRAMEWORK
Strateg
ic repo
rt
Petrofac Annual report and accounts 2017 / 27
• We continued to expand our intrusion detection monitoring of cyber-security threats and tighten our controls
• A number of HSSEIA deep dives were conducted across the business to identify and address key related concerns
• There has been a continued focus on evacuation and emergency response with mock exercises regularly planned and conducted
• A number of new HSSEIA standards have been published and a driving safety policy video was circulated globally
Principal risksThe Board defines principal risks as those risks that, given the Group’s current position, could materially threaten the business model, future performance, prospects, solvency, liquidity, reputation, or prevent us from delivering our strategic objectives.
The Key Risk Register (KRR) is the means by which the Group’s principal risks are reported to the Audit Committee and the Board for review. It includes business, compliance, financial, hazard and operational risks, together with external factors over which the Group may have little or no direct control, such as market conditions and worsening political risks in key geographies. The GRC reviews the KRR quarterly prior to submission to the Audit Committee.
The KRR is designed to provide the Board and Audit Committee with clarity around the Group’s principal risks and uncertainties, ownership, accountability and mitigation strategies, to promote active engagement, informed debate and constructive challenge, and to keep under review the effectiveness of decision making processes.
As reported on page 78 in the Annual Report, the Serious Fraud Office (SFO) began a formal investigation in May 2017.
We have also considered the potential impact of the EU referendum result and the triggering of Article 50 in March 2017. The Board believes that as an international Group, we have little exposure to the European continent and do not expect that the United Kingdom leaving the EU would have any significant impact on our business.
The Board regularly reviews the funding position of the Group, its projected liquidity requirements and factors that could adversely affect the Group’s future long-term viability. In doing so Directors assess the prospects of the Group by reference to its current financial and operational position, its recent and historical financial performance, its future financial plans and the potential impact of the principal risks and mitigating factors described on pages 30 to 33.
The Directors have assessed the viability of the Group over a three-year period to 31 December 2020. The Board believes that this is an appropriate time horizon given its business portfolio, order backlog and business development pipeline offers limited visibility beyond three years. The Board reviews its prospects over a longer term horizon and prepares a five-year business plan that is dependent on the external market environment, securing new orders at sustainable margins, operational performance and capital discipline. The Group’s business model aims to deliver sustainable, long-term value to shareholders through dividend payments and financial returns from share price growth.
The Directors considered the following principal risks as the most important in their assessment of the viability of the Group:
• Market conditions• Worsening political risks in
key geographies• Failure to meet projected order targets • Operational and project performance• Loss of licence to operate• Loss of financial capacity
The Group’s business plan forecasts have been stress tested against a number of severe but plausible risks to the business that could potentially impact the Group’s ability to fund its future activities and adhere to its banking covenants:
• A material decline in oil price relative to both our and market expectations
• A substantial reduction in forecast new orders in Engineering & Construction
• A material financial loss resulting from poor execution of a major lump-sum project
• A significant decline in the operating and financial performance of Engineering & Production Services
• An increase in working capital driven by a deterioration in contractual terms, weak cash management or delays in commercial settlements
• Adverse commercial settlements resulting in a significant financial loss
In considering the impact of these stress-test scenarios, the Board has reviewed realistic mitigating actions that could be taken to avoid or reduce the impact or occurrence of the underlying risks. These include reducing operating expenditure, cutting discretionary capital expenditure, lowering dividends and disposing of non-core assets.
The Board has also reviewed and approved the Group’s funding plan, long-term liquidity forecasts and risk management policies, which monitor and mitigate the risk of a change in our financial position. In certain scenarios, we may need to access capital markets to raise additional funds to supplement cash flow from operations or to provide additional liquidity headroom. The Group has an established track record of successfully raising capital from a diverse range of sources and the Directors believe the Group should continue to have access to capital markets at commercially acceptable rates throughout the assessment period.
Whilst the principal risks all have the potential to affect future performance, none of them are considered likely either individually or collectively to threaten the viability of the business over the assessment period. Based on the results of this detailed assessment, the Directors have a reasonable expectation that the Group will be able to continue in operation and meet its liabilities as they fall due over the next three years.
VIABILITY STATEMENT
28 / Petrofac Annual report and accounts 2017
RISK MANAGEMENT CONTINUED
Principal risks are those risks that, given the Group’s current position, could materially threaten the business model, future performance, prospects, solvency, liquidity, reputation, or prevent us from delivering our strategic objectives.
In terms of managing these risks, our systems of risk management and internal control are founded upon deployment of our Enterprise Risk Management Framework (based upon ISO 31000:2009); and our Internal Control Framework. Details of these are included in the Audit Committee report on pages 82 to 87.
MARKET CONDITIONS
Description and impact
Low oil and gas prices impact the capital expenditure plans of our key clients and the demand for our services, limiting our profitability and growth. Over the longer term, volatility in oil and gas prices could influence and change the industry’s business models and investment trends.
The financial performance of IES is directly impacted by oil and gas price volatility.
Mitigation and management
The oil and gas market is showing signs of improvement. Oil prices have improved and the majority of forecasts expect a rise in price in the medium term. We expect clients in our core markets will continue to invest in long-term strategic projects, especially regions with lower costs of production. New investment decisions are now being taken and capital investment is edging upwards.
We achieved US$5.2 billion of new order intake, providing us with good revenue visibility and we continue to see high levels of tendering activity.
We are pushing forward with organic growth initiatives. During 2017, we established E&C Growth and we plan to grow our EPS business through the expansion of existing services, new geographies and EPCm opportunities.
We have maintained strong relationships with our clients over the recent downturn, working with them to ensure we have strong commercial and contract management on our projects. We continue to focus on operational excellence to remain competitive.
Significant movements in exchange rates could impact our financial performance.
The majority of Group revenues are denominated in US dollars or currencies pegged to the US dollar. Where we procure equipment or incur costs in other currencies, we use forward currency contracts to hedge any related exposure.
Links
For more information see: pages 8-9; and 161
Change
We expect the 2018 market environment to remain broadly similar to 2017. It will continue to be competitive and bidding discipline will continue to be important. We will continue our focus on organic growth initiatives and we will maintain our cost competitiveness through our focus on operational excellence.
Assessment
The risk has decreased in 2017
WORSENING POLITICAL RISKS IN KEY GEOGRAPHIES
Description and impact
The Group’s backlog is heavily concentrated on business activities in the Middle East which may increase our vulnerability. Recent global economic conditions have had a significant impact on countries whose economies are exposed to the downturn in commodities, placing greater pressure on governments to find alternative means of raising revenues and increasing the risk of social and labour unrest.
The impacts include risks to the successful delivery of our operations and associated impact on margins, the safety of our people, security issues, material logistics and travel restrictions.
Mitigation and management
The Board actively monitors political developments and seek to avoid or minimise our exposure to jurisdictions with unacceptable risk levels.
We have good experience in project execution and maintain positive relationships with key stakeholders. Careful consideration is given to contractual terms and security conditions through our detailed risk review process and we seek external advice on specialist issues as required.
The delivery model is modified to suit each project and we limit exposure to single sources of supply and service. We limit our fixed asset commitment within each contract and closely monitor and manage our cash flow and commitments. There is continued focus on evacuation and emergency response and operations are assessed and executed in accordance with our security policy and security standards.
The risk of over-concentration in a particular market or geography.
We are actively pursuing projects in new geographies and we carry out detailed risk analysis before entering any new country.
Links
For more information see: pages 19; 46-50; and 58-59
Change
To mitigate the risk of geographical concentration, a new business line to focus on growth of lump-sum business into new geographies has been established. Dedicated leadership and resources have been assigned to identify opportunities and assess the risks and mitigations for business delivery.
Assessment
The risk has decreased in 2017
Strateg
ic repo
rt
Petrofac Annual report and accounts 2017 / 29
PRINCIPAL RISKS AND UNCERTAINTIES
FAILURE TO MEET PROJECTED ORDER INTAKE
Description and impact
The risk is that our clients continue to exercise capital discipline and the demand for our services may be impacted with the cancellation or delay of planned investments. The potential impact is that the Group could fail to deliver its anticipated backlog and growth targets.
Mitigation and management
In our MENA region, the source of the majority of our backlog, we see a good pipeline of bidding opportunities in 2018 and 2019. New investment decisions are now being taken and capital investment is edging upwards.
We saw a strong recovery in new orders in 2017, including projects in adjacent markets such as Russia and Turkey. We are also reviewing a number of potential opportunities in India as we seek to further expand our geographic footprint.
The Group wins most of its work through a competitive bidding process, and as competition increases, there is a risk that we could fail to maintain differentiated margins.
Our service lines work together to review and identify prospects and regularly analyse bid-to-win ratios and our competition. We expect the market for our services to remain very competitive and continue our focus on operational excellence to support our competitive bidding performance by protecting, and where possible, enhancing margins. We have dedicated resources to support clients’ financing requirements in our bids.
We have been able to further reduce our project support costs in 2017. These savings allow us to be more competitive in the market, deliver projects for our clients more cost-effectively and help to support our margins going forward.
Links
For more information see: pages 8-9
Change
During 2017 we saw a strong recovery in new orders and we have a healthy bidding pipeline for 2018 and 2019.
Assessment
The risk has decreased in 2017
DELIVERING OUR STRATEGY
Description and impact
To build enterprise value, we need to assure shareholders and opinion formers that we are pursuing an appropriate strategy capable of delivering shareholder value. The impact is reflected in the appetite for new investors to buy into the Group and consequently our relative valuation multiple.
Mitigation and management
The challenging events of 2017 demonstrated our underlying resilience. We executed our projects effectively, reduced our debt and maintained our bidding discipline. We saw a strong recovery in new orders, securing US$5.2 billion in new order intake from both existing and adjacent markets.
Developing opportunities for organic growth is a strategic priority and recognising the importance of this, we established a new service line in June to focus on E&C growth in new geographies. We are also planning to grow our reimbursable business in the western hemisphere through geographic and service line expansion, and we are exploring longer-term opportunities.
The Board regularly assesses our strategic plan to satisfy itself that the right mix of risk, capability and reward is established. We conduct detailed sensitivity analysis to assess the robustness of our plans. The GRC reviews all material new business opportunities and projects, new country entries, joint ventures, investments, acquisitions and disposals.
The Group may be unable to complete its divestment programme within the desired timescales or achieve the expected values.
We are committed to a capital light business model going forward, we will continue to focus on strong cash management across the Group, and we will release capital from investments which are not strongly linked to our core competence.
Links
For more information see: pages 6-11; and 14-21
Change
Our approach will continue to be characterised by three themes: focus on our core, organic growth and reduce capital intensity.
Assessment
The risk has decreased in 2017
OPERATIONAL AND PROJECT PERFORMANCE
Description and impact
Our portfolio typically includes a relatively small number of large value contracts. Cost or schedule overruns on any of these projects could negatively impact the Group’s profitability, cash flows and relationships with key stakeholders.
Mitigation and management
The main project risks are the application of contractual liquidated damages by clients and failure to secure assessed variation orders. We regularly review these exposures and are satisfied that the risks are balanced across the E&C portfolio. We work closely with our clients to resolve contractual elements for our substantially completed and ongoing projects.
Key risks to delivery are initially identified at the tender stage, through the risk review process. On award, detailed execution strategies are further developed and during the execution phase, emerging risks and opportunities are managed through assurance and operational reviews. Lessons learned are cascaded through leadership lines and our quality initiatives are focused on a ‘right first time’ approach.
30 / Petrofac Annual report and accounts 2017
PRINCIPAL RISKS AND UNCERTAINTIES CONTINUED
OPERATIONAL AND PROJECT PERFORMANCE continued
If we are unable to transfer certain risks to the insurance market (due to the availability or cost of cover, for example), we could be exposed to material uninsured losses.
We maintain a Group-wide insurance programme to mitigate against certain significant losses. The programme is consistent with general industry practice. We continually review the coverage of our policies.
Links
For more information see: pages 3; 10-13; and 85
Change
We continued to operate effectively throughout 2017. Project delivery remained a significant area of focus for the Board and executive management to ensure that we continued to implement lessons learned from prior projects.
Assessment
No change
LOSS OF LICENCE TO OPERATE
Description and impact
Formal investigations by regulatory authorities could result in a loss in share price value and/or a loss in business. Other consequences could include the prosecution of the Company and of individuals; imprisonment and/or fines for individuals; and fines, penalties or other consequences, including reputational damage, to the Group. There may also be considerable cost and ongoing disruption in responding to allegations or investigations and taking remedial action.
Mitigation and management
A sub-committee of the Board has been established to be solely responsible for the Company’s engagement with the SFO and to oversee the Company’s response to their investigation.
The investigation by the Serious Fraud Office (SFO) into Petrofac is ongoing. The Company continues to engage with the SFO and is devoting significant resources to this matter. It is unclear when or how the investigation will be concluded. The consequences of this investigation will be determined by the regulatory authorities and it remains therefore too early for Petrofac to predict their outcome. Since the instigation of the investigation, shareholder confidence has been impacted resulting in a material fall in the market value. However, the award of new business has demonstrated that it is a ‘business as usual’ approach and that our clients remain supportive.
There are several factors that could impact our ability to operate safely, ethically and effectively. These include safety and asset integrity risks and extend to a range of environmental and regulatory risks. The risk is the potential harm to our people, and the commercial and/or reputational damage that could be caused.
Safety is a core value and the risk is governed largely by our operating framework, Group policies, systems and various monthly forums (such as the asset integrity review board). During the year we carried out a number of safety deep dives and introduced a number of global standards for HSSEIA.
We continued our focus on crisis management training with exercises being held at the Group and project levels. We reviewed our business continuity plans and digital media response.
Ethical risks are covered under compliance and controls.
Links
For more information see: pages 78; 46-50; and 77
Change
Our safety performance improved with 70 million man-hours worked without a LTI at the end of December 2017.
Assessment
No change
IT RESILIENCE
Description and impact
The Group’s performance is increasingly dependent on the ongoing capability and reliability of our IT platforms.
We (as with all companies) continue to be exposed to external cyber-security threats.
Mitigation and management
Breach or failure of our IT systems due to integrity failings, negligence or attacks on cyber-security could seriously disrupt our operations and could result in the loss or misuse of sensitive information. Such breaches in IT security could adversely impact the Group’s ability to operate and lead to financial loss, damaged reputation, loss of client and shareholder confidence and regulatory fines.
We have adopted a ‘cloud’ strategy and increasingly use secure internet connectivity. We have a number of intrusion detection and prevention tools so we can quickly respond to alerts and suspicious activity. We have moved to a greater standardisation of our IT systems in an effort to replace our legacy systems.
The Group recognises the increased incidence of cyber-security threats and has recently reviewed its policies, procedures and defences to mitigate associated risks, engaging market-leading specialists where appropriate.
Links
For more information see: page 73
Change
We continually develop our IT infrastructure to ensure we are resilient to existing and emerging threats.
Assessment
No change
Strateg
ic repo
rt
Petrofac Annual report and accounts 2017 / 31
LOSS OF FINANCIAL CAPACITY
Description and impact
Failure to adequately forecast, manage or maintain sufficient liquidity and credit could impact our ability to operate and result in financial loss and/or ability to comply with our financial covenants.
Mitigation and management
We always maintain an adequate level of liquidity in the form of readily available cash, short-term investments, or committed credit facilities. The Audit Committee has defined a minimum level of liquidity that must be maintained.
Debt costs may arise owing to rating agency downgrades and the possibility of restricted access to funding.
A funding plan was approved by the Board in February and November 2017 to employ a conservative and flexible funding strategy, robust across a range of business plan scenarios. We made good progress in 2017, securing an extension of our revolving credit facilities and refinancing US$300 million of term-loan maturities.
Access to multiple sources of funding is critical to our sustainability and future growth. Failure to obtain financing could hamper the Group’s growth, prevent us from taking on new projects and could adversely affect the Group’s financial performance.
We prepare quarterly cash flow forecasts, aligned to our financial reforecasts, to identify any funding requirements well in advance.
We introduced a global cash management tool and increased our focus on working capital management during 2017.
The risk of financial or commercial exposure if counterparties (such as key financial institutions, clients, partners, subcontractors or vendors) default on their commitments.
We perform financial due diligence on new and existing clients. We closely monitor all receivables and seek to minimise the risk of exposure through contractual terms. We have regular, senior level dialogue with our major clients to understand and pre-empt any concerns that they may have.
Bank ratings are monitored to ensure security of counterparty for both deposits and lending. The risk is managed by Group Treasury and the Audit Committee.
Links
For more information see: pages 20-21; 45; 85; 161-165; and 182-185
Change
We improved our net debt position over the year and adopted a new funding strategy. A key component of our strategy is to reduce capital intensity.
Assessment
No change
DILUTION OF COMPANY CULTURE AND/OR CAPABILITY
Description and impact
An inability to respond quickly and effectively to unplanned changes in the leadership structure could have an adverse impact on the delivery of our strategy and day-to-day operations.
Mitigation and management
The Group’s organisational structure was revised in May 2017. The changes were designed to provide clear accountability, drive growth and maintain focus on execution, and improve oversight and control within the business.
The focus on succession planning remains an important priority for the Board and we continue to review and update succession plans for all our critical roles across the top three tiers of the organisation. The overall senior talent pipeline is reviewed on a quarterly basis.
We are developing a cadre of future leaders and providing them with the opportunities to demonstrate their potential and accelerate their progression. We have identified our high performing employees who we see as having the potential to be longer-term successors; and we also focus on the emerging talent who are viewed as high potential individuals and we manage their development in terms of on the job training, rotations and training events to accelerate their progression. Over 50% of graduates hired since 2004 have been retained within the Group.
Our aim is to always place our most effective people into our most important roles.
Failure to attract and retain the right level of skilled and experienced personnel could negatively impact our distinctive, delivery-focused culture, and prevent us from maintaining our operational capability and relationships with clients.
We review future headcount requirements as part of our planning process to assess whether to reduce our overall headcount in response to tighter market conditions or to invest in retaining capability. Five-year capability plans have been collated across the Group, linked to the annual business plan process.
A new integrated learning management system was launched in 2017 to capture individual performance objectives and is being used to support mandatory employee performance reviews.
We remain confident that our policies to attract, retain, train, promote and reward our people are appropriate for the Group – and will enable us to meet our strategic goals.
Links
For more information see: pages 4; 6-7; 10-11; 14-15; 51-52; and 66
Change
Succession planning at Board and senior management level was a core focus in 2017. A principal objective is to continue to build a strong talent pipeline.
Assessment
No change
32 / Petrofac Annual report and accounts 2017
PRINCIPAL RISKS AND UNCERTAINTIES CONTINUED
COMPLIANCE AND CONTROLS
Description and impact
The management of agency relationships represents one of the largest risks of reputational damage that companies face.
Mitigation and management
A Third Party Risk Committee was established during 2017 to review all high risk relationships and further progress was made to develop the compliance-related internal controls framework.
The potential financial and reputational risk that would arise from failure to comply with law and regulation and/or non-conformance with relevant Group standards, policies and procedures.
The Code of Conduct sets out the behaviours expected of our employees and those people who work with us. Our employees at supervisory level and above are required to complete an annual mandatory declaration to confirm they have complied with the Code of Conduct, have declared any actual or potential breach of our Code and any potential conflict of interest. Our Group Finance function launched a controls improvement programme during the year to enhance the financial controls framework.
The Group faces risks associated with the management of trade sanctions as it develops business in Russia.
The Group must ensure a broad understanding of, and compliance with, the sanctions regime. As part of the risk review process, sanctions implications are reviewed with the business and specialised external counsel before entering any territory that may be impacted.
Links
For more information see: pages 6-7; 46; 64-65; 66-67; 70; 77; 82-85; and 88-89
Change
During the year the Company revised a number of compliance related controls. The Board approved the formation of the Compliance and Ethics Committee.
Assessment
The risk has increased in 2017
Group Chief Executive's review
See page 10
Corporate responsibility
See page 46
Strateg
ic repo
rt
Petrofac Annual report and accounts 2017 / 33
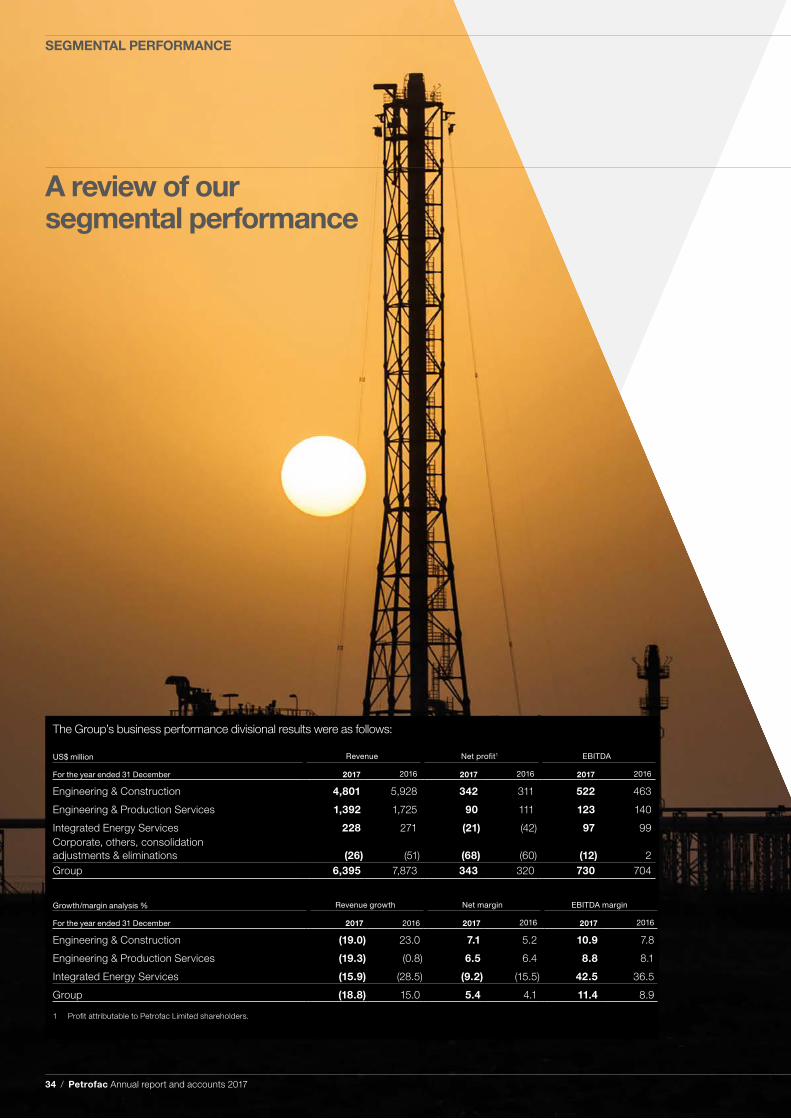
A review of our segmental performance
The Group’s business performance divisional results were as follows:
US$ million Revenue Net profit1 EBITDA
For the year ended 31 December 2017 2016 2017 2016 2017 2016
Engineering & Construction 4,801 5,928 342 311 522 463
Engineering & Production Services 1,392 1,725 90 111 123 140
Integrated Energy Services 228 271 (21) (42) 97 99Corporate, others, consolidation adjustments & eliminations (26) (51) (68) (60) (12) 2Group 6,395 7,873 343 320 730 704
Growth/margin analysis % Revenue growth Net margin EBITDA margin
For the year ended 31 December 2017 2016 2017 2016 2017 2016
Engineering & Construction (19.0) 23.0 7.1 5.2 10.9 7.8
Engineering & Production Services (19.3) (0.8) 6.5 6.4 8.8 8.1
Integrated Energy Services (15.9) (28.5) (9.2) (15.5) 42.5 36.5
Group (18.8) 15.0 5.4 4.1 11.4 8.9
1 Profit attributable to Petrofac Limited shareholders.
SEGMENTAL PERFORMANCE
34 / Petrofac Annual report and accounts 2017
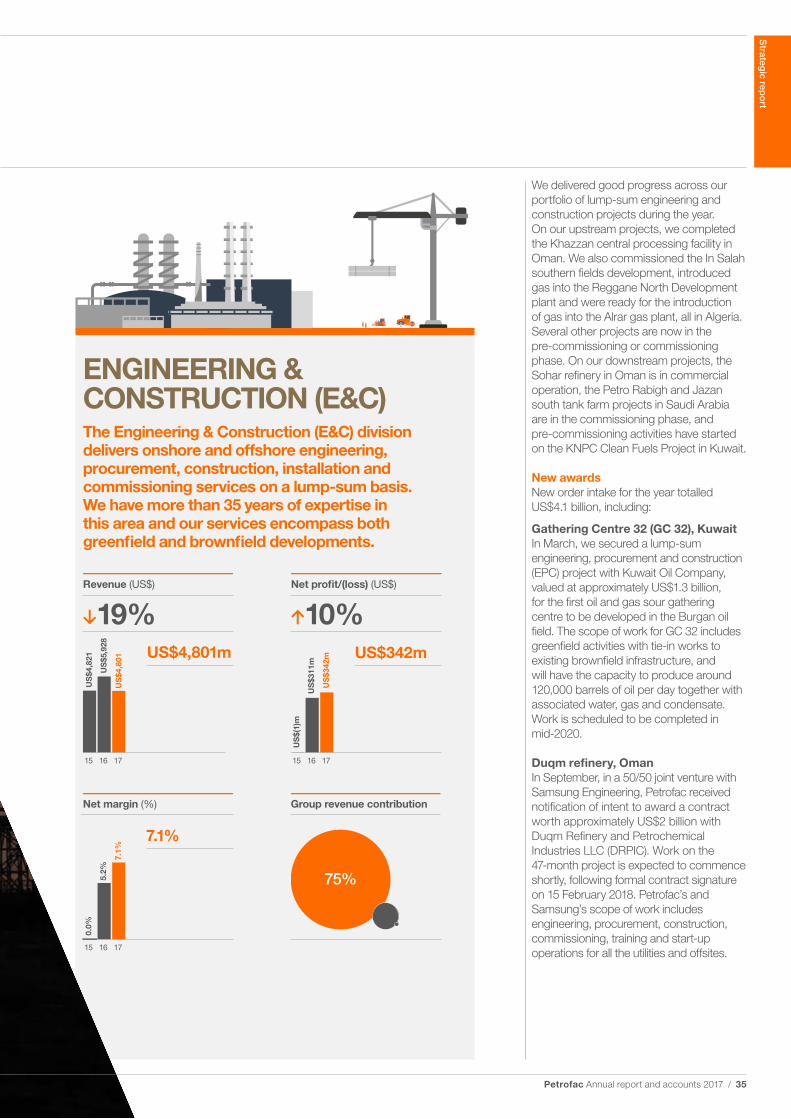
Revenue (US$)
15
US
$4,8
21
US
$5,9
28
US
$4,8
01
16 17
19%
Net margin (%)
15
0.0%
5.2
%
7.1
%
16 17
Group revenue contribution
75%
Net profit/(loss) (US$)
15
US
$(1)
m
US
$311
m
US
$342
m
16 17
10%
ENGINEERING & CONSTRUCTION (E&C)The Engineering & Construction (E&C) division delivers onshore and offshore engineering, procurement, construction, installation and commissioning services on a lump-sum basis. We have more than 35 years of expertise in this area and our services encompass both greenfield and brownfield developments.
We delivered good progress across our portfolio of lump-sum engineering and construction projects during the year. On our upstream projects, we completed the Khazzan central processing facility in Oman. We also commissioned the In Salah southern fields development, introduced gas into the Reggane North Development plant and were ready for the introduction of gas into the Alrar gas plant, all in Algeria. Several other projects are now in the pre-commissioning or commissioning phase. On our downstream projects, the Sohar refinery in Oman is in commercial operation, the Petro Rabigh and Jazan south tank farm projects in Saudi Arabia are in the commissioning phase, and pre-commissioning activities have started on the KNPC Clean Fuels Project in Kuwait.
New awardsNew order intake for the year totalled US$4.1 billion, including:
Gathering Centre 32 (GC 32), KuwaitIn March, we secured a lump-sum engineering, procurement and construction (EPC) project with Kuwait Oil Company, valued at approximately US$1.3 billion, for the first oil and gas sour gathering centre to be developed in the Burgan oil field. The scope of work for GC 32 includes greenfield activities with tie-in works to existing brownfield infrastructure, and will have the capacity to produce around 120,000 barrels of oil per day together with associated water, gas and condensate. Work is scheduled to be completed in mid-2020.
Duqm refinery, OmanIn September, in a 50/50 joint venture with Samsung Engineering, Petrofac received notification of intent to award a contract worth approximately US$2 billion with Duqm Refinery and Petrochemical Industries LLC (DRPIC). Work on the 47-month project is expected to commence shortly, following formal contract signature on 15 February 2018. Petrofac’s and Samsung’s scope of work includes engineering, procurement, construction, commissioning, training and start-up operations for all the utilities and offsites.
US$4,801m US$342m
7.1%
Strateg
ic repo
rt
Petrofac Annual report and accounts 2017 / 35
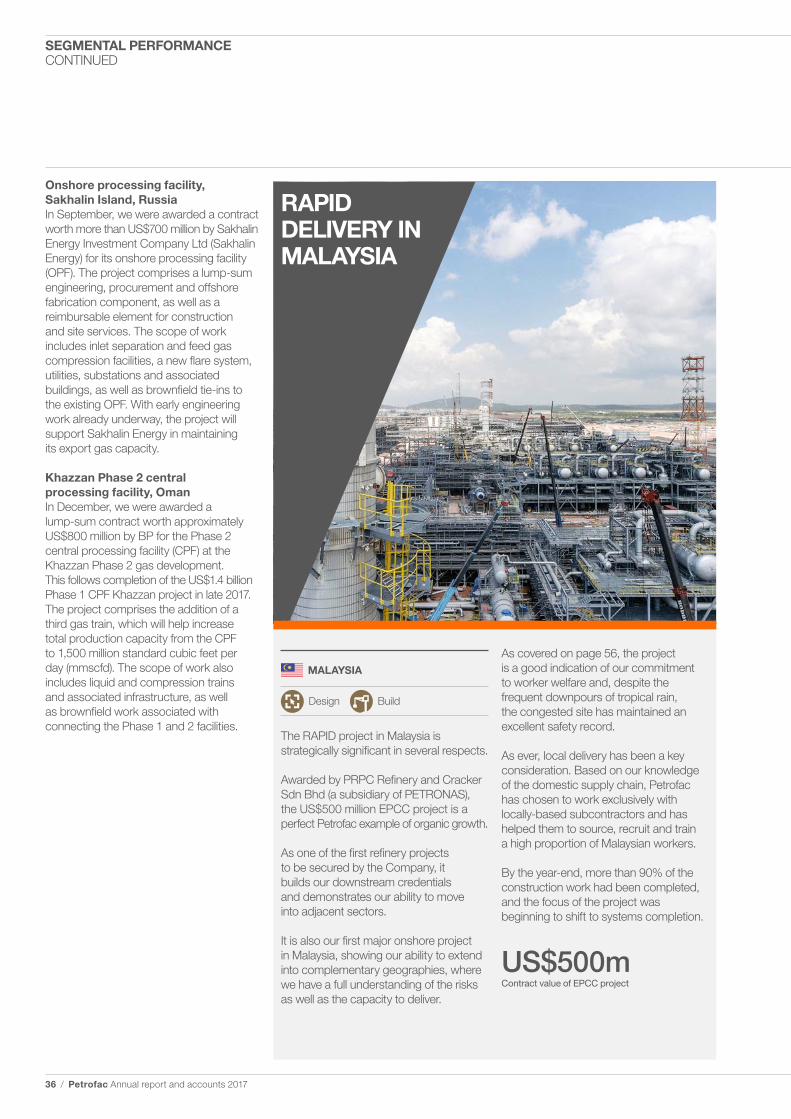
RAPID DELIVERY IN MALAYSIA
As covered on page 56, the project is a good indication of our commitment to worker welfare and, despite the frequent downpours of tropical rain, the congested site has maintained an excellent safety record.
As ever, local delivery has been a key consideration. Based on our knowledge of the domestic supply chain, Petrofac has chosen to work exclusively with locally-based subcontractors and has helped them to source, recruit and train a high proportion of Malaysian workers.
By the year-end, more than 90% of the construction work had been completed, and the focus of the project was beginning to shift to systems completion.
US$500mContract value of EPCC project
MALAYSIA
Design Build
The RAPID project in Malaysia is strategically significant in several respects.
Awarded by PRPC Refinery and Cracker Sdn Bhd (a subsidiary of PETRONAS), the US$500 million EPCC project is a perfect Petrofac example of organic growth.
As one of the first refinery projects to be secured by the Company, it builds our downstream credentials and demonstrates our ability to move into adjacent sectors.
It is also our first major onshore project in Malaysia, showing our ability to extend into complementary geographies, where we have a full understanding of the risks as well as the capacity to deliver.
Onshore processing facility, Sakhalin Island, RussiaIn September, we were awarded a contract worth more than US$700 million by Sakhalin Energy Investment Company Ltd (Sakhalin Energy) for its onshore processing facility (OPF). The project comprises a lump-sum engineering, procurement and offshore fabrication component, as well as a reimbursable element for construction and site services. The scope of work includes inlet separation and feed gas compression facilities, a new flare system, utilities, substations and associated buildings, as well as brownfield tie-ins to the existing OPF. With early engineering work already underway, the project will support Sakhalin Energy in maintaining its export gas capacity.
Khazzan Phase 2 central processing facility, OmanIn December, we were awarded a lump-sum contract worth approximately US$800 million by BP for the Phase 2 central processing facility (CPF) at the Khazzan Phase 2 gas development. This follows completion of the US$1.4 billion Phase 1 CPF Khazzan project in late 2017. The project comprises the addition of a third gas train, which will help increase total production capacity from the CPF to 1,500 million standard cubic feet per day (mmscfd). The scope of work also includes liquid and compression trains and associated infrastructure, as well as brownfield work associated with connecting the Phase 1 and 2 facilities.
36 / Petrofac Annual report and accounts 2017
SEGMENTAL PERFORMANCE CONTINUED
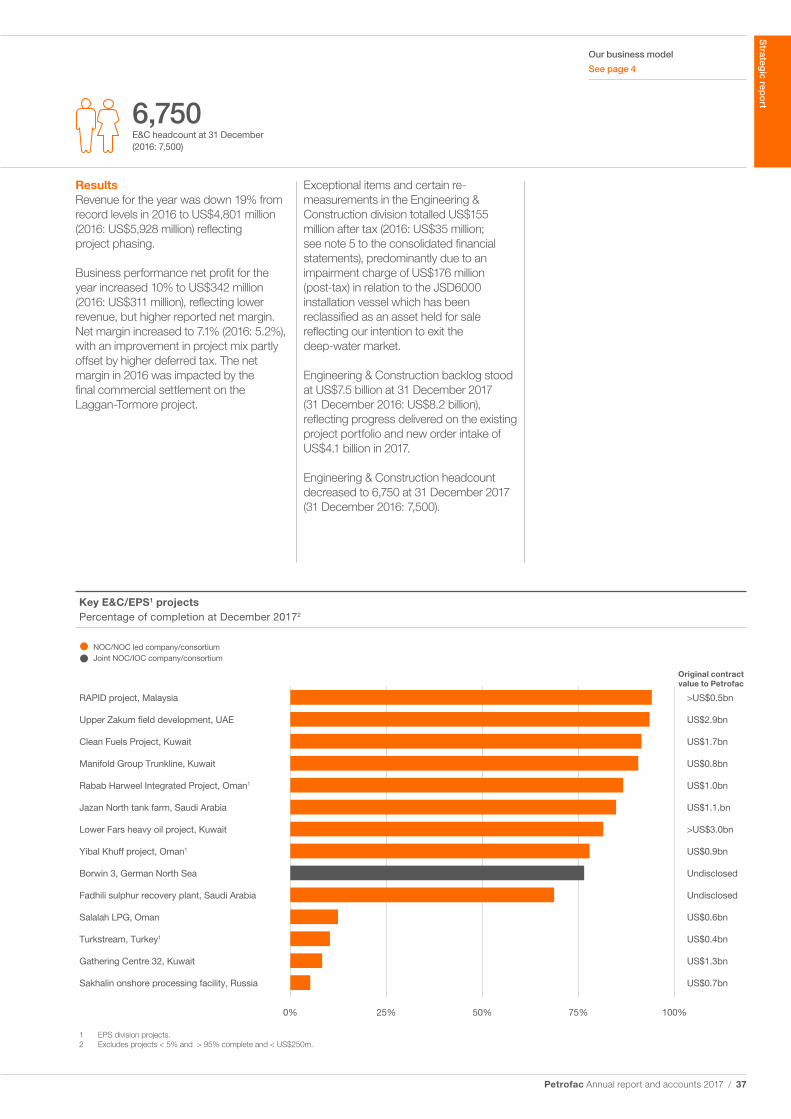
Key E&C/EPS1 projectsPercentage of completion at December 20172
RAPID project, Malaysia
Upper Zakum �eld development, UAE
Clean Fuels Project, Kuwait
Manifold Group Trunkline, Kuwait
Rabab Harweel Integrated Project, Oman1
Jazan North tank farm, Saudi Arabia
Lower Fars heavy oil project, Kuwait
Yibal Khuff project, Oman1
Borwin 3, German North Sea
Fadhili sulphur recovery plant, Saudi Arabia
Salalah LPG, Oman
Turkstream, Turkey1
Gathering Centre 32, Kuwait
Sakhalin onshore processing facility, Russia
>US$0.5bn
US$2.9bn
US$1.7bn
US$0.8bn
US$1.0bn
US$1.1.bn
>US$3.0bn
US$0.9bn
Undisclosed
Undisclosed
US$0.6bn
US$0.4bn
US$1.3bn
US$0.7bn
NOC/NOC led company/consortium Joint NOC/IOC company/consortium
0% 25% 50%
1 EPS division projects.2 Excludes projects < 5% and > 95% complete and < US$250m.
75% 100%
Original contractvalue to Petrofac
6,750E&C headcount at 31 December (2016: 7,500)
Our business model
See page 4
ResultsRevenue for the year was down 19% from record levels in 2016 to US$4,801 million (2016: US$5,928 million) reflecting project phasing.
Business performance net profit for the year increased 10% to US$342 million (2016: US$311 million), reflecting lower revenue, but higher reported net margin. Net margin increased to 7.1% (2016: 5.2%), with an improvement in project mix partly offset by higher deferred tax. The net margin in 2016 was impacted by the final commercial settlement on the Laggan-Tormore project.
Exceptional items and certain re-measurements in the Engineering & Construction division totalled US$155 million after tax (2016: US$35 million; see note 5 to the consolidated financial statements), predominantly due to an impairment charge of US$176 million (post-tax) in relation to the JSD6000 installation vessel which has been reclassified as an asset held for sale reflecting our intention to exit the deep-water market.
Engineering & Construction backlog stood at US$7.5 billion at 31 December 2017 (31 December 2016: US$8.2 billion), reflecting progress delivered on the existing project portfolio and new order intake of US$4.1 billion in 2017.
Engineering & Construction headcount decreased to 6,750 at 31 December 2017 (31 December 2016: 7,500).
Strateg
ic repo
rt
Petrofac Annual report and accounts 2017 / 37
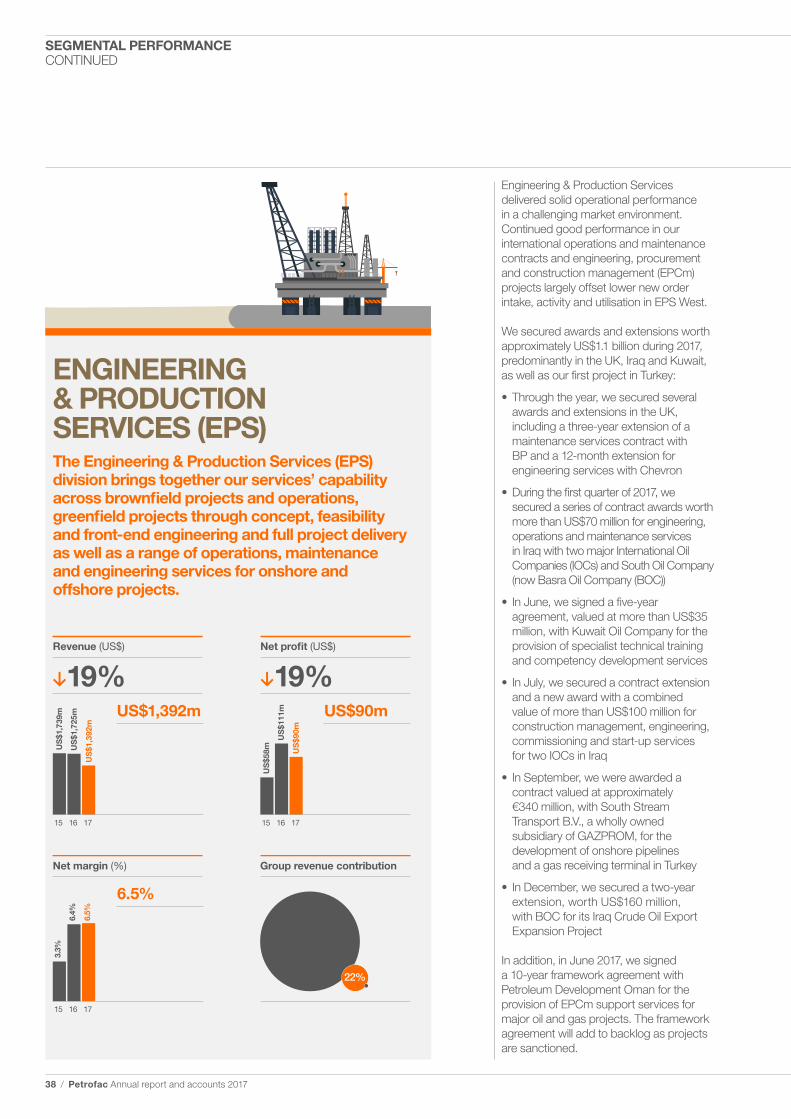
Revenue (US$)
15
US
$1,7
39m
US
$1,7
25m
US
$1,3
92m
16 17
19%
Net margin (%)
15
3.3%
6.4%
6.5%
16 17
Group revenue contribution
22%
Net profit (US$)
15
US
$58m
US
$111
m
US
$90m
16 17
19%
ENGINEERING & PRODUCTION SERVICES (EPS)The Engineering & Production Services (EPS) division brings together our services’ capability across brownfield projects and operations, greenfield projects through concept, feasibility and front-end engineering and full project delivery as well as a range of operations, maintenance and engineering services for onshore and offshore projects.
Engineering & Production Services delivered solid operational performance in a challenging market environment. Continued good performance in our international operations and maintenance contracts and engineering, procurement and construction management (EPCm) projects largely offset lower new order intake, activity and utilisation in EPS West.
We secured awards and extensions worth approximately US$1.1 billion during 2017, predominantly in the UK, Iraq and Kuwait, as well as our first project in Turkey:
• Through the year, we secured several awards and extensions in the UK, including a three-year extension of a maintenance services contract with BP and a 12-month extension for engineering services with Chevron
• During the first quarter of 2017, we secured a series of contract awards worth more than US$70 million for engineering, operations and maintenance services in Iraq with two major International Oil Companies (IOCs) and South Oil Company (now Basra Oil Company (BOC))
• In June, we signed a five-year agreement, valued at more than US$35 million, with Kuwait Oil Company for the provision of specialist technical training and competency development services
• In July, we secured a contract extension and a new award with a combined value of more than US$100 million for construction management, engineering, commissioning and start-up services for two IOCs in Iraq
• In September, we were awarded a contract valued at approximately €340 million, with South Stream Transport B.V., a wholly owned subsidiary of GAZPROM, for the development of onshore pipelines and a gas receiving terminal in Turkey
• In December, we secured a two-year extension, worth US$160 million, with BOC for its Iraq Crude Oil Export Expansion Project
In addition, in June 2017, we signed a 10-year framework agreement with Petroleum Development Oman for the provision of EPCm support services for major oil and gas projects. The framework agreement will add to backlog as projects are sanctioned.
US$1,392m
6.5%
US$90m
38 / Petrofac Annual report and accounts 2017
SEGMENTAL PERFORMANCE CONTINUED
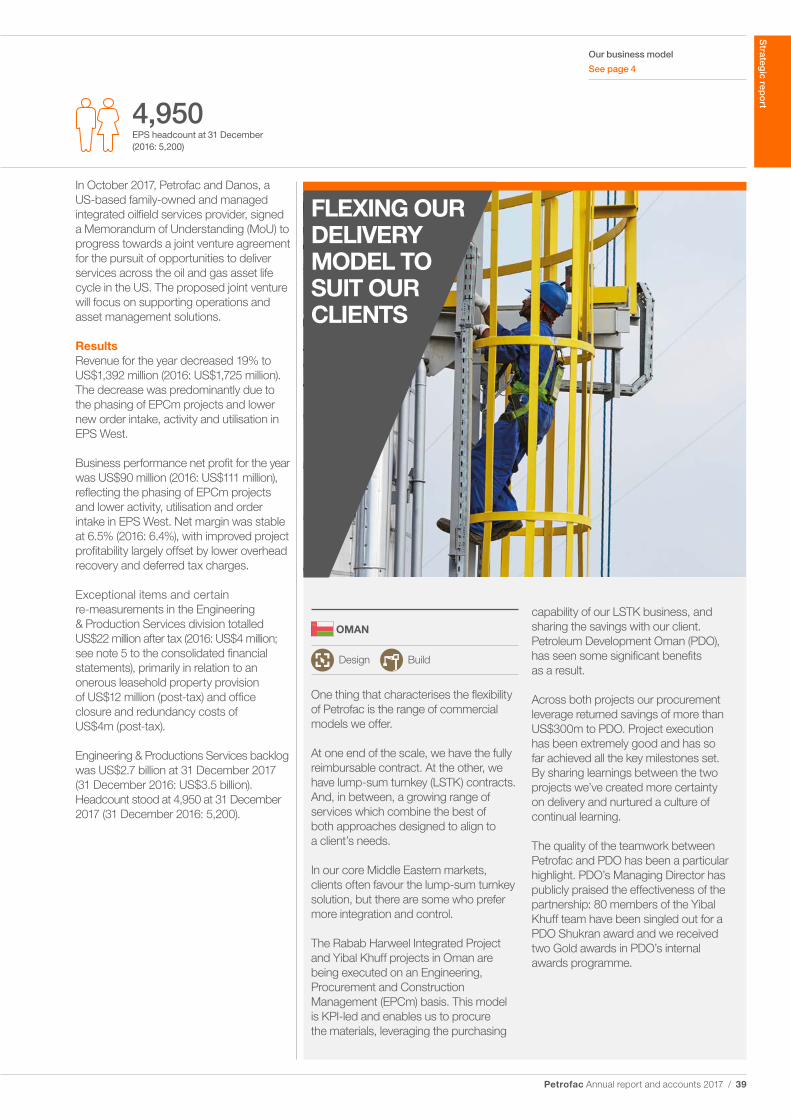
4,950EPS headcount at 31 December (2016: 5,200)
Our business model
See page 4
In October 2017, Petrofac and Danos, a US-based family-owned and managed integrated oilfield services provider, signed a Memorandum of Understanding (MoU) to progress towards a joint venture agreement for the pursuit of opportunities to deliver services across the oil and gas asset life cycle in the US. The proposed joint venture will focus on supporting operations and asset management solutions.
ResultsRevenue for the year decreased 19% to US$1,392 million (2016: US$1,725 million). The decrease was predominantly due to the phasing of EPCm projects and lower new order intake, activity and utilisation in EPS West.
Business performance net profit for the year was US$90 million (2016: US$111 million), reflecting the phasing of EPCm projects and lower activity, utilisation and order intake in EPS West. Net margin was stable at 6.5% (2016: 6.4%), with improved project profitability largely offset by lower overhead recovery and deferred tax charges.
Exceptional items and certain re-measurements in the Engineering & Production Services division totalled US$22 million after tax (2016: US$4 million; see note 5 to the consolidated financial statements), primarily in relation to an onerous leasehold property provision of US$12 million (post-tax) and office closure and redundancy costs of US$4m (post-tax).
Engineering & Productions Services backlog was US$2.7 billion at 31 December 2017 (31 December 2016: US$3.5 billion). Headcount stood at 4,950 at 31 December 2017 (31 December 2016: 5,200).
capability of our LSTK business, and sharing the savings with our client. Petroleum Development Oman (PDO), has seen some significant benefits as a result.
Across both projects our procurement leverage returned savings of more than US$300m to PDO. Project execution has been extremely good and has so far achieved all the key milestones set. By sharing learnings between the two projects we’ve created more certainty on delivery and nurtured a culture of continual learning.
The quality of the teamwork between Petrofac and PDO has been a particular highlight. PDO’s Managing Director has publicly praised the effectiveness of the partnership: 80 members of the Yibal Khuff team have been singled out for a PDO Shukran award and we received two Gold awards in PDO’s internal awards programme.
OMAN
Design Build
One thing that characterises the flexibility of Petrofac is the range of commercial models we offer.
At one end of the scale, we have the fully reimbursable contract. At the other, we have lump-sum turnkey (LSTK) contracts. And, in between, a growing range of services which combine the best of both approaches designed to align to a client’s needs.
In our core Middle Eastern markets, clients often favour the lump-sum turnkey solution, but there are some who prefer more integration and control.
The Rabab Harweel Integrated Project and Yibal Khuff projects in Oman are being executed on an Engineering, Procurement and Construction Management (EPCm) basis. This model is KPI-led and enables us to procure the materials, leveraging the purchasing
FLEXING OUR DELIVERY MODEL TO SUIT OUR CLIENTS
Strateg
ic repo
rt
Petrofac Annual report and accounts 2017 / 39
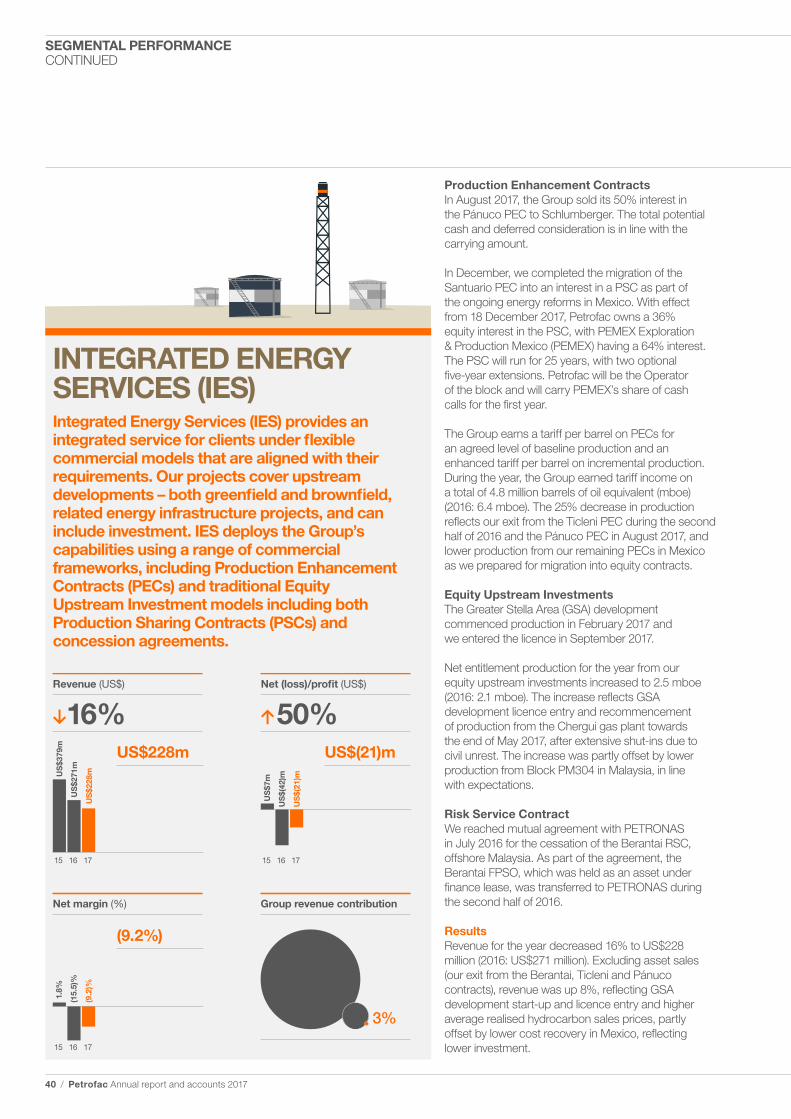
Revenue (US$)
15
US
$379
m
US
$271
m
US
$228
m
16 17
16%
Net margin (%)
15
1.8%
(15.
5)%
(9.2
)%
16 17
Group revenue contribution
3%
Net (loss)/profit (US$)
15
US
$7m
US
$(42
)m
US
$(21
)m
16 17
50%
INTEGRATED ENERGY SERVICES (IES)Integrated Energy Services (IES) provides an integrated service for clients under flexible commercial models that are aligned with their requirements. Our projects cover upstream developments – both greenfield and brownfield, related energy infrastructure projects, and can include investment. IES deploys the Group’s capabilities using a range of commercial frameworks, including Production Enhancement Contracts (PECs) and traditional Equity Upstream Investment models including both Production Sharing Contracts (PSCs) and concession agreements.
Production Enhancement ContractsIn August 2017, the Group sold its 50% interest in the Pánuco PEC to Schlumberger. The total potential cash and deferred consideration is in line with the carrying amount.
In December, we completed the migration of the Santuario PEC into an interest in a PSC as part of the ongoing energy reforms in Mexico. With effect from 18 December 2017, Petrofac owns a 36% equity interest in the PSC, with PEMEX Exploration & Production Mexico (PEMEX) having a 64% interest. The PSC will run for 25 years, with two optional five-year extensions. Petrofac will be the Operator of the block and will carry PEMEX’s share of cash calls for the first year.
The Group earns a tariff per barrel on PECs for an agreed level of baseline production and an enhanced tariff per barrel on incremental production. During the year, the Group earned tariff income on a total of 4.8 million barrels of oil equivalent (mboe) (2016: 6.4 mboe). The 25% decrease in production reflects our exit from the Ticleni PEC during the second half of 2016 and the Pánuco PEC in August 2017, and lower production from our remaining PECs in Mexico as we prepared for migration into equity contracts.
Equity Upstream InvestmentsThe Greater Stella Area (GSA) development commenced production in February 2017 and we entered the licence in September 2017.
Net entitlement production for the year from our equity upstream investments increased to 2.5 mboe (2016: 2.1 mboe). The increase reflects GSA development licence entry and recommencement of production from the Chergui gas plant towards the end of May 2017, after extensive shut-ins due to civil unrest. The increase was partly offset by lower production from Block PM304 in Malaysia, in line with expectations.
Risk Service ContractWe reached mutual agreement with PETRONAS in July 2016 for the cessation of the Berantai RSC, offshore Malaysia. As part of the agreement, the Berantai FPSO, which was held as an asset under finance lease, was transferred to PETRONAS during the second half of 2016.
ResultsRevenue for the year decreased 16% to US$228 million (2016: US$271 million). Excluding asset sales (our exit from the Berantai, Ticleni and Pánuco contracts), revenue was up 8%, reflecting GSA development start-up and licence entry and higher average realised hydrocarbon sales prices, partly offset by lower cost recovery in Mexico, reflecting lower investment.
US$228m US$(21)m
(9.2%)
40 / Petrofac Annual report and accounts 2017
SEGMENTAL PERFORMANCE CONTINUED
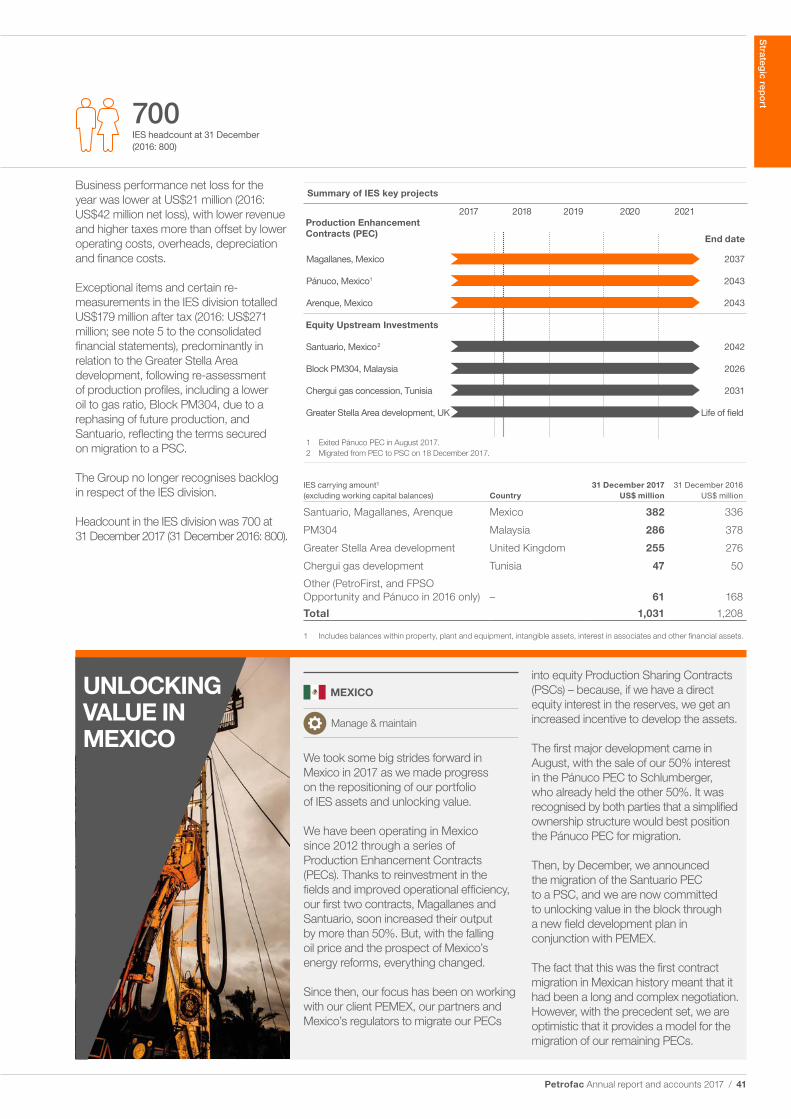
Summary of IES key projects
Magallanes, Mexico
Pánuco, Mexico1
Arenque, Mexico
Production Enhancement Contracts (PEC) End date
2037
2043
2043
2042
2026
2031
Life of �eld
1 Exited Pánuco PEC in August 2017.2 Migrated from PEC to PSC on 18 December 2017.
2020 202120182017 2019
Equity Upstream Investments
Chergui gas concession, Tunisia
Greater Stella Area development, UK
Santuario, Mexico2
Block PM304, Malaysia
Business performance net loss for the year was lower at US$21 million (2016: US$42 million net loss), with lower revenue and higher taxes more than offset by lower operating costs, overheads, depreciation and finance costs.
Exceptional items and certain re-measurements in the IES division totalled US$179 million after tax (2016: US$271 million; see note 5 to the consolidated financial statements), predominantly in relation to the Greater Stella Area development, following re-assessment of production profiles, including a lower oil to gas ratio, Block PM304, due to a rephasing of future production, and Santuario, reflecting the terms secured on migration to a PSC.
The Group no longer recognises backlog in respect of the IES division.
Headcount in the IES division was 700 at 31 December 2017 (31 December 2016: 800).
IES carrying amount¹ (excluding working capital balances) Country
31 December 2017 US$ million
31 December 2016 US$ million
Santuario, Magallanes, Arenque Mexico 382 336
PM304 Malaysia 286 378
Greater Stella Area development United Kingdom 255 276
Chergui gas development Tunisia 47 50
Other (PetroFirst, and FPSO Opportunity and Pánuco in 2016 only) – 61 168
Total 1,031 1,208
1 Includes balances within property, plant and equipment, intangible assets, interest in associates and other financial assets.
MEXICO
Manage & maintain
We took some big strides forward in Mexico in 2017 as we made progress on the repositioning of our portfolio of IES assets and unlocking value.
We have been operating in Mexico since 2012 through a series of Production Enhancement Contracts (PECs). Thanks to reinvestment in the fields and improved operational efficiency, our first two contracts, Magallanes and Santuario, soon increased their output by more than 50%. But, with the falling oil price and the prospect of Mexico’s energy reforms, everything changed.
Since then, our focus has been on working with our client PEMEX, our partners and Mexico’s regulators to migrate our PECs
into equity Production Sharing Contracts (PSCs) – because, if we have a direct equity interest in the reserves, we get an increased incentive to develop the assets.
The first major development came in August, with the sale of our 50% interest in the Pánuco PEC to Schlumberger, who already held the other 50%. It was recognised by both parties that a simplified ownership structure would best position the Pánuco PEC for migration.
Then, by December, we announced the migration of the Santuario PEC to a PSC, and we are now committed to unlocking value in the block through a new field development plan in conjunction with PEMEX.
The fact that this was the first contract migration in Mexican history meant that it had been a long and complex negotiation. However, with the precedent set, we are optimistic that it provides a model for the migration of our remaining PECs.
UNLOCKING VALUE IN MEXICO
700IES headcount at 31 December (2016: 800)
Strateg
ic repo
rt
Petrofac Annual report and accounts 2017 / 41
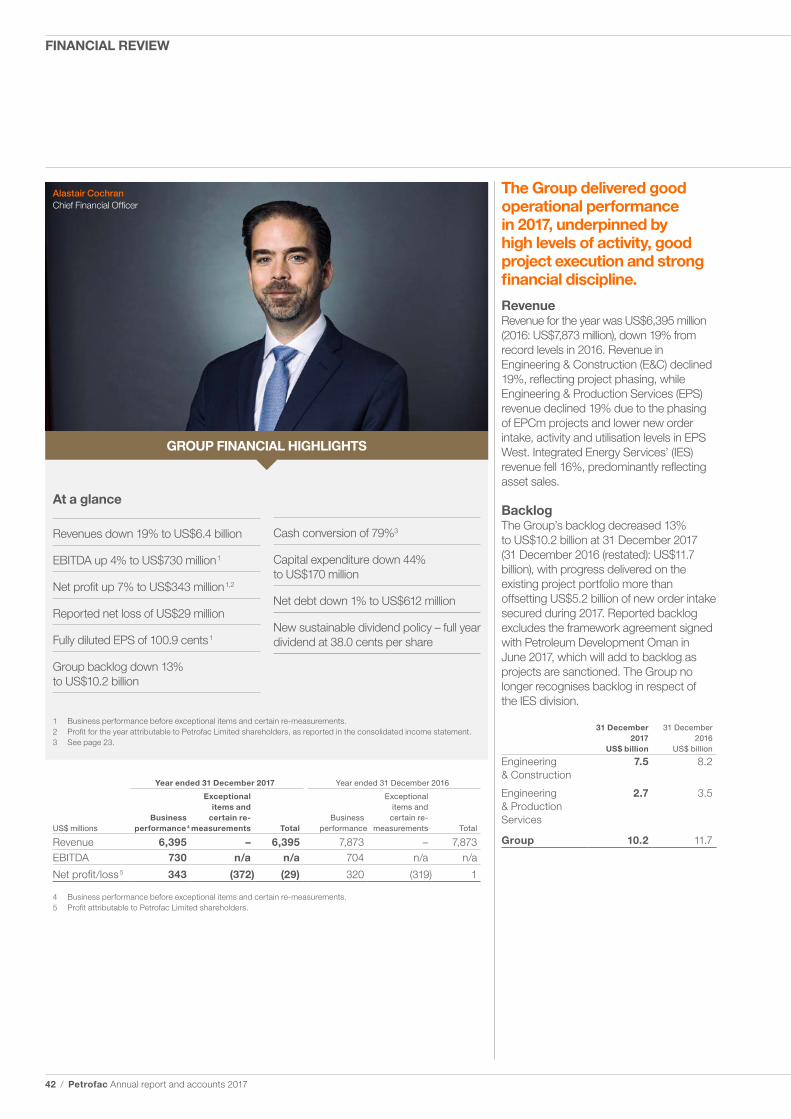
At a glance
Revenues down 19% to US$6.4 billion
EBITDA up 4% to US$730 million 1
Net profit up 7% to US$343 million 1,2
Reported net loss of US$29 million
Fully diluted EPS of 100.9 cents 1
Group backlog down 13% to US$10.2 billion
1 Business performance before exceptional items and certain re-measurements.2 Profit for the year attributable to Petrofac Limited shareholders, as reported in the consolidated income statement.3 See page 23.
The Group delivered good operational performance in 2017, underpinned by high levels of activity, good project execution and strong financial discipline.
RevenueRevenue for the year was US$6,395 million (2016: US$7,873 million), down 19% from record levels in 2016. Revenue in Engineering & Construction (E&C) declined 19%, reflecting project phasing, while Engineering & Production Services (EPS) revenue declined 19% due to the phasing of EPCm projects and lower new order intake, activity and utilisation levels in EPS West. Integrated Energy Services’ (IES) revenue fell 16%, predominantly reflecting asset sales.
BacklogThe Group’s backlog decreased 13% to US$10.2 billion at 31 December 2017 (31 December 2016 (restated): US$11.7 billion), with progress delivered on the existing project portfolio more than offsetting US$5.2 billion of new order intake secured during 2017. Reported backlog excludes the framework agreement signed with Petroleum Development Oman in June 2017, which will add to backlog as projects are sanctioned. The Group no longer recognises backlog in respect of the IES division.
31 December 2017
US$ billion
31 December 2016
US$ billion
Engineering & Construction
7.5 8.2
Engineering & Production Services
2.7 3.5
Group 10.2 11.7
Cash conversion of 79%3
Capital expenditure down 44% to US$170 million
Net debt down 1% to US$612 million
New sustainable dividend policy – full year dividend at 38.0 cents per share
Alastair CochranChief Financial Officer
GROUP FINANCIAL HIGHLIGHTS
Year ended 31 December 2017 Year ended 31 December 2016
US$ millionsBusiness
performance 4
Exceptional items and
certain re- measurements Total
Businessperformance
Exceptional items and
certain re- measurements Total
Revenue 6,395 – 6,395 7,873 – 7,873EBITDA 730 n/a n/a 704 n/a n/a
Net profit/loss 5 343 (372) (29) 320 (319) 1
4 Business performance before exceptional items and certain re-measurements.5 Profit attributable to Petrofac Limited shareholders.
42 / Petrofac Annual report and accounts 2017
FINANCIAL REVIEW
Earnings Before Interest, Tax, Depreciation and Amortisation (EBITDA)Business performance EBITDA increased 4% to US$730 million (2016: US$704 million). EBITDA margin increased to 11.4% (2016: 8.9%). The increase in the EBITDA margin was due to:
• Project mix in E&C, including the final commercial settlement on the Laggan-Tormore project in the first half of 2016
• Business mix, including the phasing of EPCm projects, in EPS
• In IES, lower operating costs and overheads
Finance costs/incomeFinance costs for the year declined 21% to US$80 million (2016: US$101 million) reflecting a reduction in finance lease interest cost following our exit from the Berantai RSC in 2016. Finance income for the year increased to US$10 million (2016: US$3 million) due to the unwinding of the discount on long-term receivables from customers.
TaxationBusiness performance effective tax rate for the year ended 31 December 2017 was 28.6% (2016: 20.3%). Included within the tax charge for the year is the deferred tax asset derecognition of US$38 million resulting from a combination of the previously announced changes in UK tax loss relief rules, which were enacted in October 2017, and a reduction in UK profit forecasts.
A number of factors have increased the overall effective tax rate, with key drivers being changes in the recognition of tax losses and expenditure that is not deductible for tax purposes. In line with prior years, the effective tax rate is also driven by tax laws in the jurisdictions where the Group operates and generates profits.
Net profitBusiness performance net profit increased 7% to US$343 million (2016: US$320 million). The reported net loss was US$29 million (2016: US$1 million net profit), reflecting an increase in exceptional items and certain re-measurements.
Group net margin increased to 5.4% (2016: 4.1%), predominantly due to project mix in the E&C division, including the final commercial settlement on the Laggan-Tormore project in the first half of 2016, partly offset by higher tax.
Earnings per shareBusiness performance diluted earnings per share for the year was 100.9 cents per share (2016: 93.3 cents per share), reflecting the increase in business performance net profit. Total reported diluted earnings per share was a loss of 8.5 cents per share (2016: profit of 0.3 cents per share), reflecting an increase in exceptional items and certain re-measurements.
Operating cash flowNet cash flows from operating activities were US$422 million in the year (2016: US$651 million). The key components were:
• An increase in operating profits before changes in working capital and other non-current items to US$789 million (2016: US$739 million), predominantly due to an increase in business performance profit before tax
• Net working capital outflows of US$213 million (2016: US$85 million inflow), including:
– A decrease in trade and other payables of US$272 million, due primarily to a net unwinding of advances received from customers of US$167 million
– An increase in billings in excess of cost and estimated earnings of US$154 million, driven by favourable billing terms on a small number of projects
– A decrease in accrued contract expenses of US$113 million due to actual costs incurred on E&C projects exceeding their percentage-of-completion based costs
• A reduction in interest paid on borrowing and finance leases to US$70 million (2016: US$94 million) following our exit from the Berantai RSC in 2016
• An increase in net income taxes paid to US$69 million (2016: US$40 million)
Capital expenditureGroup capital expenditure for 2017, on a cash basis, decreased 44% to US$170 million (2016: US$303 million), principally reflecting decreases in capital expenditure relating to the Greater Stella Area development, the Petrofac JSD6000 installation vessel and temporary camps for E&C projects.
31 December 2017
US$ million
31 December 2016
US$ million
Purchase of property, plant and equipment 108 165
Payments for intangible oil and gas assets 9 2Additional investment made in available-for-sale investment
– 12
Investments in associate and joint ventures – 5Net loans paid to associates/joint ventures 2 –Loan in respect of the Greater Stella Area development
51 119
Group capital expenditure 170 303
Balance sheet capital expenditure, including accruals, on property, plant and equipment for 2017 decreased 20% to US$115 million (2016: US$143 million).
Capital expenditure on intangible oil and gas assets during the year was US$8 million (2016: US$3 million).
Group financial statements
See page 107
Company financial statements
See page 169
Strateg
ic repo
rt
Petrofac Annual report and accounts 2017 / 43
Free cash flowFree cash flow decreased to US$281 million in the year (2016: US$386 million), primarily due to a net working capital outflow of US$213 million within net cash flows from operating activities (2016: US$85 million net inflow), partly offset by a 47% reduction in net cash flows used in investing activities:
31 December 2017 US$ million
31 December 2016 US$ million
Net cash flows from operating activities 422 651
Net cash flows used in investing activities
(141) (265)
Free cash flow 281 386
The Group defines free cash flow as net cash flows from operating activities less net cash flows used in investing activities.
DividendsIn August 2017, the Board approved a new sustainable dividend policy that targets a dividend cover of between 2.0x and 3.0x business performance net profit as the Group transitions back towards a low capital intensity business model. Going forward, it is proposed that the interim payment each year will be approximately 33% of the prior year total dividend.
In line with the policy, the Board is proposing a final dividend of 25.3 cents per share (2016: 43.8 cents). The final dividend will be paid on 25 May 2018 to eligible shareholders on the register at 27 April 2018 (the ‘record date’). Shareholders who have not elected to receive dividends in US dollars will receive a sterling equivalent. Shareholders can elect by close of business on the record date to change their dividend currency election. Together with the interim dividend of 12.7 cents per share (2016: 22.0 cents), this gives a total dividend for the year of 38.0 cents per share (2016: 65.8 cents). The dividend is covered by free cash flow.
EmployeesAt 31 December 2017, the Group had approximately 12,500 employees (including long-term contractors) (2016: 13,500).
Balance sheetIES carrying valueThe carrying amount of Integrated Energy Services’ portfolio is US$1,031 million (2016: US$1,208 million; see page 41).
Working capital 1
The net working capital balance at 31 December 2017 increased to US$422 million (31 December 2016: US$277 million). The key movements in working capital during the year were:
• A decrease in trade and other receivables of US$142 million to US$2,020 million (31 December 2016: US$2,162 million) predominantly reflecting the derecognition of US$128 million of trade receivables relating to the Santuario PEC (see note 21 to the consolidated financial statements)
• A decrease in trade and other payables of US$299 million to US$1,675 million (31 December 2016: US$1,974 million), primarily due to reductions in trade payables of US$119 million and a net unwinding of advances received from customers of US$167 million (see note 29 to the consolidated financial statements)
• A decrease in accrued contract expenses of US$104 million to US$1,956 million (31 December 2016: US$2,060 million) due to actual costs incurred on E&C projects exceeding their percentage-of-completion based costs
• An increase in billings in excess of estimated earnings of US$154 million to US$198 million (31 December 2016: US$44 million), driven by favourable billing terms on a small number of projects
Finance leasesNet finance lease liabilities decreased 9% to US$166 million at 31 December 2017 (2016: US$182 million; see note 18 to the consolidated financial statements) and predominantly relate to two leased floating production facilities on Block PM304 in Malaysia.
Total equityTotal equity at 31 December 2017 was US$948 million (2016: US$1,123 million), primarily reflecting the reported loss for the year of US$27 million and other comprehensive income of US$50 million, less dividends paid in the year of US$195 million and treasury shares purchased of US$39 million, which are held in the Petrofac Employees Benefit Trust for the purpose of making awards under the Group’s share schemes.
Return on capital employedThe Group’s return on capital employed for the year ended 31 December 2017 increased to 21% (2016: 17%), reflecting improved profitability and a decrease in capital employed.
1 Inventories, work in progress and trade and other receivables, less trade and other payables, accrued contract expenses and billings in excess of costs and estimated earnings.
44 / Petrofac Annual report and accounts 2017
FINANCIAL REVIEW CONTINUED
Capital, net debt and liquidityThe Group’s net debt decreased to US$612 million at 31 December 2017 (2016: US$617 million) reflecting strong capital management.
The Group’s total gross borrowings less associated debt acquisition costs and the discount on senior notes issuance at 31 December 2017 decreased 11% to US$1,579 million (2016: US$1,784 million).
31 December 2017 31 December 2016
US$ million (unless otherwise stated)
Interest-bearing loans and borrowings (A) 1,579 1,784Cash and short-term deposits (B) 967 1,167Net debt (C = B – A) (612) (617)Equity attributable to Petrofac Limited shareholders (D) 912 1,097EBITDA (E) 730 704Gross gearing ratio (A/D) 173% 163%Net gearing ratio (C/D) 67% 56%
Net debt/EBITDA (C/E) 84% 88%
None of the Company’s subsidiaries are subject to any material restrictions on their ability to transfer funds in the form of cash dividends, loans or advances to the Company.
Excluding bank overdrafts, the Group’s total available borrowing facilities were US$2,210 million at 31 December 2017 (2016: US$2,393 million). Of these facilities, US$645 million was undrawn as at 31 December 2017 (2016: US$631 million). Combined with the Group’s cash balances of US$967 million (2016: US$1,167 million), the Group had substantial sources of liquidity available.
In May 2017, Petrofac and its lenders agreed to extend US$1.0 billion of its US$1.2 billion revolving credit facility by one year to June 2021. During the year, the Company repaid a US$100 million term facility and refinanced a further US$200 million of term loans, extending their maturity by up to two years.
Exceptional items and re-measurements The following items, described as ‘exceptional items and certain re-measurements’ are excluded from business performance as exclusion of these items provides a clearer presentation of the underlying performance of the Group’s ongoing business. For further details of amounts comprising exceptional items and certain re-measurements, see note 5 to the consolidated financial statements.
Exceptional items and certain re-measurements for 2017 amounted to a post-tax loss of US$372 million (2016: US$319 million loss), of which approximately US$350 million were non-cash items:
• The Board has confirmed its intention to exit the deep-water market triggering an impairment charge of US$176 million (post-tax) in relation to the JSD6000 installation vessel, which has been reclassified as an asset held for sale. We continue to pursue options to maximise value for the JSD6000.
• Impairments and exceptional items in relation to the IES division totalled US$179 million after tax, predominantly in relation to the Greater Stella Area development, re-assessment of production profiles, including a lower oil to gas ratio, Block PM304, due to a rephasing of future production, and Santuario, reflecting the terms secured on migration to a PSC.
Alastair CochranChief Financial Officer 28 February 2018
Strateg
ic repo
rt
Petrofac Annual report and accounts 2017 / 45