Embed Size (px)
Citation preview

GROUP INTEGRATED PROJECT
Bruce Brant and Inna Diordieva
December 6, 2011
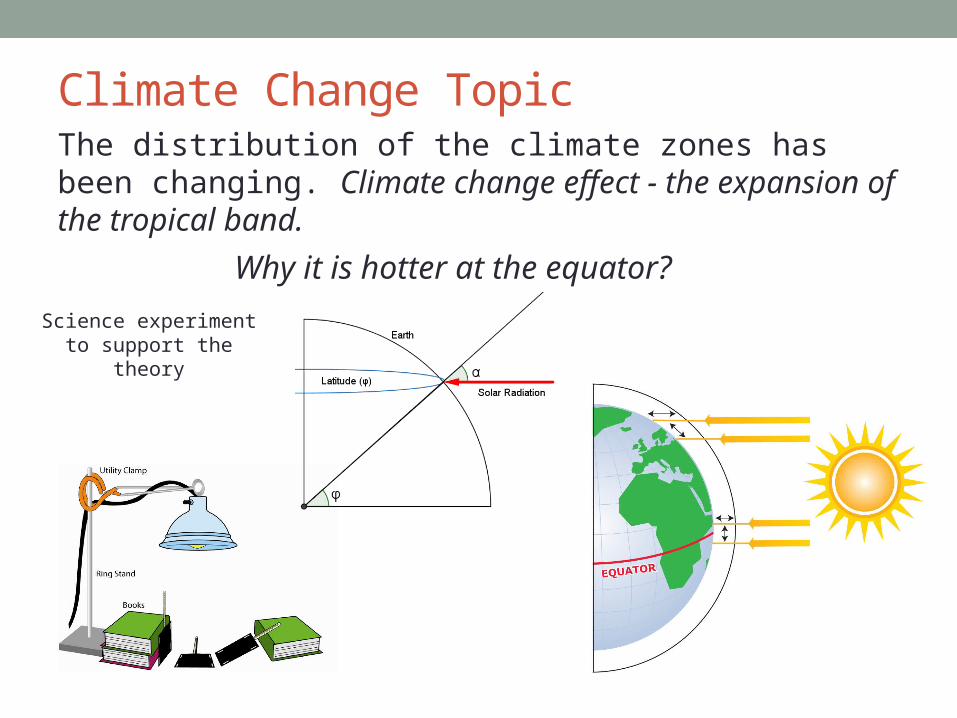
Climate Change TopicThe distribution of the climate zones has been changing. Climate change effect - the expansion of the tropical band.
Why it is hotter at the equator?
Science experiment to support the
theory

Mathematic TopicRight Triangle Trigonometry.
Reinforcement of curve fitting skill using TI 83/84 calculator.Calculation of angle of incidence of the sunlight.
Students express a side through other side and an non-right angle.
0 min. 3 min. 6 min. 9 min. 12 min. 15 min.
Thermometer A Thermometer B Thermometer C Thermometer D Thermometer E
Temperature Differentials (due to angle of thermometer)Data from the experiment
Students graph experimental data.
Technological Tool• The TI 83/84 calculator is used to analyze the
temperature soak data from the experiment• Data plotting gives students a visual representation of
the temperature as a function of incidence angle• Linear regression provides one way to model the data• Students can choose from and study the benefits of
several other curve fit functions• The calculator provides residuals which can be used to
analyze the value of alternate modeling approaches• There is no right answer, students use this tool to support
critical thinking about the mathematics involved in modeling the data
Assessment Item
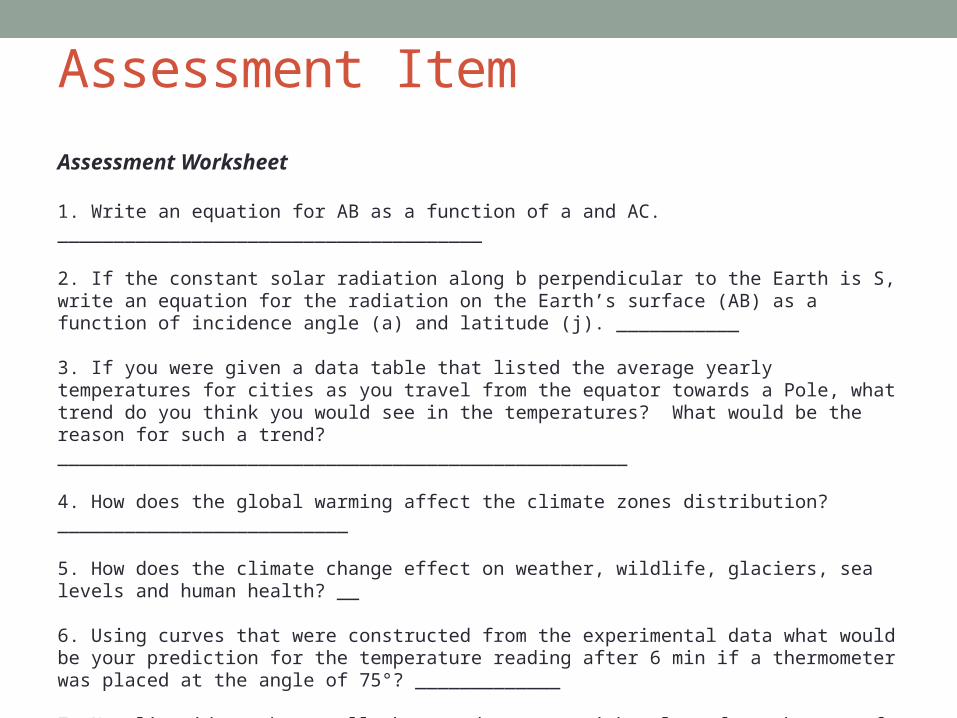
Assessment Worksheet
1. Write an equation for AB as a function of a and AC. ______________________________________
2. If the constant solar radiation along b perpendicular to the Earth is S, write an equation for the radiation on the Earth’s surface (AB) as a function of incidence angle (a) and latitude (j). ___________
3. If you were given a data table that listed the average yearly temperatures for cities as you travel from the equator towards a Pole, what trend do you think you would see in the temperatures? What would be the reason for such a trend? ___________________________________________________
4. How does the global warming affect the climate zones distribution? __________________________
5. How does the climate change effect on weather, wildlife, glaciers, sea levels and human health? __
6. Using curves that were constructed from the experimental data what would be your prediction for the temperature reading after 6 min if a thermometer was placed at the angle of 75°? _____________
7. Natalie rides a horse all the way down a straight slope from the top of a hill that is 23 meters tall. The slope makes a 10 degree angle to the flat ground. How many meters long was the ride? _______