Embed Size (px)
Citation preview
ORIGINAL ARTICLE
Groundwater quality assessment using geospatial and statisticaltools in Salem District, Tamil Nadu, India
P. Arulbalaji1 • B. Gurugnanam1
Received: 29 December 2015 / Accepted: 9 November 2016 / Published online: 22 November 2016
� The Author(s) 2016. This article is published with open access at Springerlink.com
Abstract The water quality study of Salem district, Tamil
Nadu has been carried out to assess the water quality for
domestic and irrigation purposes. For this purpose, 59
groundwater samples were collected and analyzed for pH,
electrical conductivity (EC), total dissolved solids (TDS),
major anions (HCO3-, CO3
-, F-, Cl-, NO2- ? NO3
-,
and SO42-), major cations (Ca2? Mg2?, Na?, and K?),
alkalinity (ALK), and hardness (HAR). To assess the water
quality, the following chemical parameters were calculated
based on the analytical results, such as Piper plot, water
quality index (WQI), sodium adsorption ratio (SAR),
magnesium hazard (MH), Kelly index (KI), and residual
sodium carbonate (RSC). Wilcox diagram represents that
23% of the samples are excellent to good, 40% of the
samples are good to permissible, 10% of the samples are
permissible to doubtful, 24% of the samples are doubtful
unsuitable, and only 3% of the samples are unsuitable for
irrigation. SAR values shows that 52% of the samples
indicate high-to-very high and low-to-medium alkali water.
KI values indicate good quality (30%) and not suit-
able (70%) for irrigation purposes. RSC values indicate
that 89% of samples are suitable for irrigation purposes.
MH reveals that 17% suitable and 83% samples are not
suitable for irrigation purposes and for domestic purposes
the excellent (8%), good (48%), and poor (44%). The
agricultural waste, fertilizer used, soil leaching, urban
runoff, livestock waste, and sewages are the sources of
poor water quality. Some samples are not suitable for
irrigation purposes due to high salinity, hardness, and
magnesium concentration. In general, the groundwater of
the Salem district was polluted by agricultural activities,
anthropogenic activities, ion exchange, and weathering.
Keywords Geochemistry � Water quality index � Wilcox
diagram � Kelley index � Magnesium hazard � Residualsodium carbonate � USSL diagram
Introduction
The groundwater chemistry is the essential factor, which is
permitting its use for irrigation, domestic, and industrial.
Most of the population in the world depends on ground-
water for daily uses. More and more researchers are con-
centrating on hydro-geochemistry in recent decades, which
is challenging to the scientific researchers based on
hydrology and lithology (Guettaf et al. 2014; Kumar et al.
2014; Singh et al. 2014a, b; Srinivasamoorthy et al. 2011).
The hydro-geochemical method can be used for identifying
the interaction between rocks and waters (Basavarajappa
and Manjunatha 2015; Qiyan and Baoping 2002; Zhang
et al. 2001; Poroshin and Khaninak 2000; Cai et al. 1997).
Developing countries, such as India, have extensive spec-
tral differences of topographical, hydrological, meteoro-
logical, geomorphological, hydro-geological, and
geological conditions (Kumar et al. 2015; Ahamed et al.
2013; Singh et al. 2014a, b). Groundwater origin, occur-
rence, and migrations depend upon several factors, such as
drainage density, slope, geology, geomorphology, land use,
and lineament density (Rajaveni et al. 2015). Groundwater,
clean and safe in ancient days in contrast to present dec-
ades, shows how quick industrialization creates severe
& P. Arulbalaji
B. Gurugnanam
1 Centre for Applied Geology, Gandhigram Rural Institute-
Deemed University, Dindigul 624302, Tamil Nadu, India
123
Appl Water Sci (2017) 7:2737–2751
DOI 10.1007/s13201-016-0501-5
environmental issues in most countries (Santhosh and
Revathi 2014). Once the groundwater is contaminated, it is
very tough to recover its quality. Water in a few villages in
Gangavalli Taluk in Salem district had a high hardness and
fluoride content, characteristics which may be altered with
softening and defluoridation, making the water useful
(Florence et al. 2013). In Yercaud Taluk in Salem district,
the groundwater conditions were good except fluoride
content, which was more than the permissible limit by
WHO (Florence et al. 2012). Geographic information
system (GIS) is a valuable tool for mapping the water
quality and effective for monitoring, which is used as a
database system to create maps of water quality based on
concentration values of various chemical constituents
(Krishnaraj et al. 2015; Lozano et al. 2012). The aim of the
present study is to demarcate the groundwater quality of
the study area using geospatial and geostatistical tools.
Materials and methods
The groundwater quality data of the year 2014 were col-
lected from the Public Work Department, State Ground and
Surface Water Resources data center, Chennai. The phy-
sico-chemical characterization of the groundwater samples
is evaluated with pH, EC, TDS, major anions (HCO3-, F-,
Cl-, NO3-, and SO4
2-), major cations (Ca2?, Mg2?, Na?,
and K?), alkalinity, and hardness (Table 1). The analyzed
data were compared with World Health Organization
(WHO 2006) and Bureau of Indian Standards (BIS 2012)
for suitability of domestic uses. SPSS 16.0 software was
used to prepare the correlation matrix of the groundwater
parameters. For identification of water types, the data are
plotted in the piper diagram using the AquaChem 2012.1
software. In addition, evaluation of water quality parame-
ters for suitability of irrigation was analyzed in Wilcox,
SAR, RSC, Kelly index, and magnesium hazard.
Wilcox diagramwas prepared using sodium percentage and
EC value. The Na% is determined by the following formula:
Na% ¼ Na þ K= CaþMgþ Naþ Kð Þ � 100:
The SAR was evaluated by the following formula:
SAR ¼ Na= Ca þ Mgð Þ=2½ �0:5:
RSC values were assessed by the following formula:
RSC ¼ CO3 þ HCO3ð Þ � CaþMgð Þ:
Kelly index was analyzed by the following formula:
KI ¼ Na= CaþMgð Þ:
Magnesium hazard values were measured by the
following formula:
MH ¼ Mg= CaþMgð Þ � 100:
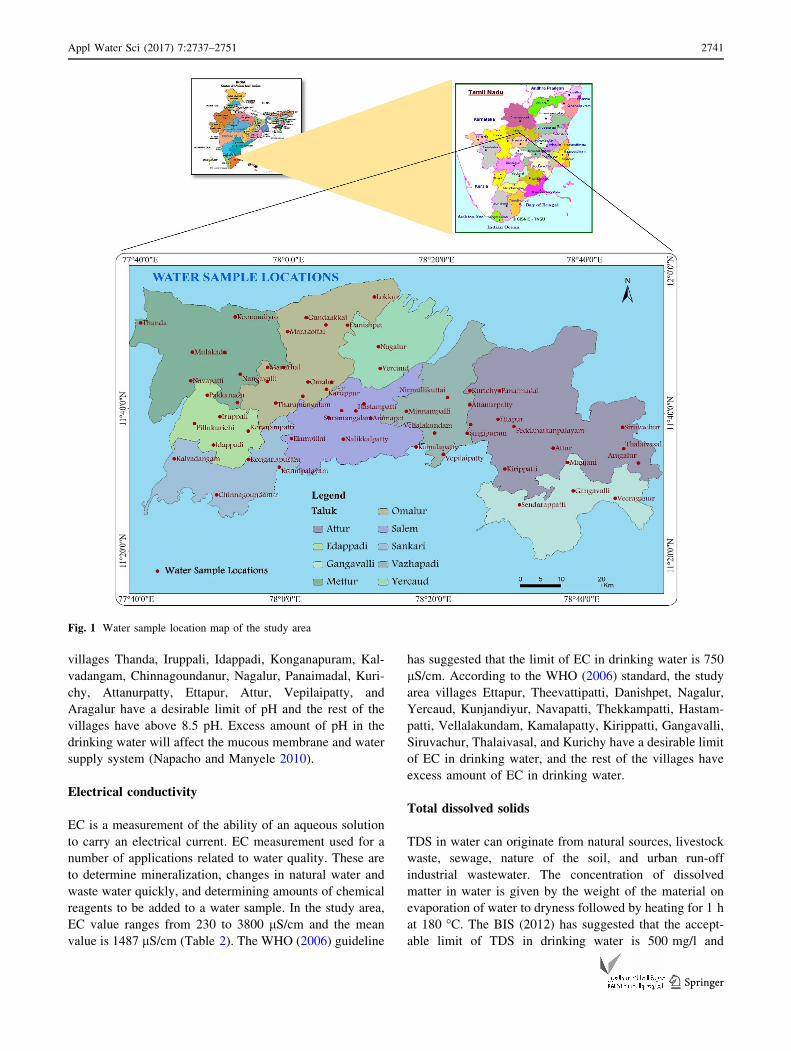
Study area
The present study concentrates on Salem district, Tamil
Nadu, India, which is located North latitude between
11�140 and 12�530 and East longitude between 77�440 and78�500. Salem district is one of the largest cities in respect
to the Tamil Nadu population after Chennai, Coimbatore,
Madurai, and Thiruchirappalli. The 2011 census recorded
the population of 826,267 people. The total area covered by
5234 km2 and the average mean sea level is 278 m. The
study area is covered by hills, such as Jarugumalai,
Nagaramalai, Kanjamalai, Kariyaperumal, Shervaroy, and
Godumalai. There are two major river system flows which
are the Cauvery and Vellar. The study area has a tropical
climate. During the period November to January, the study
area has a pleasant weather. In general, morning times are
more humid than the afternoons, with the humidity
above 75% on an average. During the period of June to
November, the afternoon humidity is above 60% on an
average. The total study area has a nine taluks and 653
villages. Salem district water sample location map is given
in Fig. 1.
Geology of the area serves as the basis for groundwater
condition and its occurrences, movement, and quality of
groundwater (Rajaveni et al. 2015). Lithology of the study
area exposes a highly dissected Precambrian shield terrain
comprising rocks ofdiverse origin. Ingeneral, the area ismade
up of high-grade supra crystals of Archean age, comprising
Khondalite group, Charnockite group and Satyamangalam
group, and Younger intrusive alkaline syenite-carbonatite
complex, ultramafics, basic, and acid rocks. The geological
formation of Salem district is comprised of hard rock types of
gneiss, granites, charnockite, dunite, pyroxenite, and quart-
zite, and the mineral formations are magnesite, bauxite,
quartz, feldspar, soapstone, and limestone (Florence et al.
2013). The study area highly disturbedwith a number of folds,
lineaments, faults, shears, and joints (Srinivasamoorthy et al.
2011). Fissile Hornblende Biotite Gneiss and Charnockite are
the major rock types in the study area.
Results and discussion
pH
pH is the expression of acidity or basic nature of a solution.
The hydrogen ion concentrations in a solution determine
the pH. The BIS (2012) and WHO (2006) have suggested
that the limit of pH in drinking water is 7.0–8.5 and
6.5–8.5, respectively. In study area, the pH ranges from 7.7
to 9 and the mean value is 8.59 (Table 2). According to the
BIS (2012) and WHO (2006) standard, the study area
2738 Appl Water Sci (2017) 7:2737–2751
123
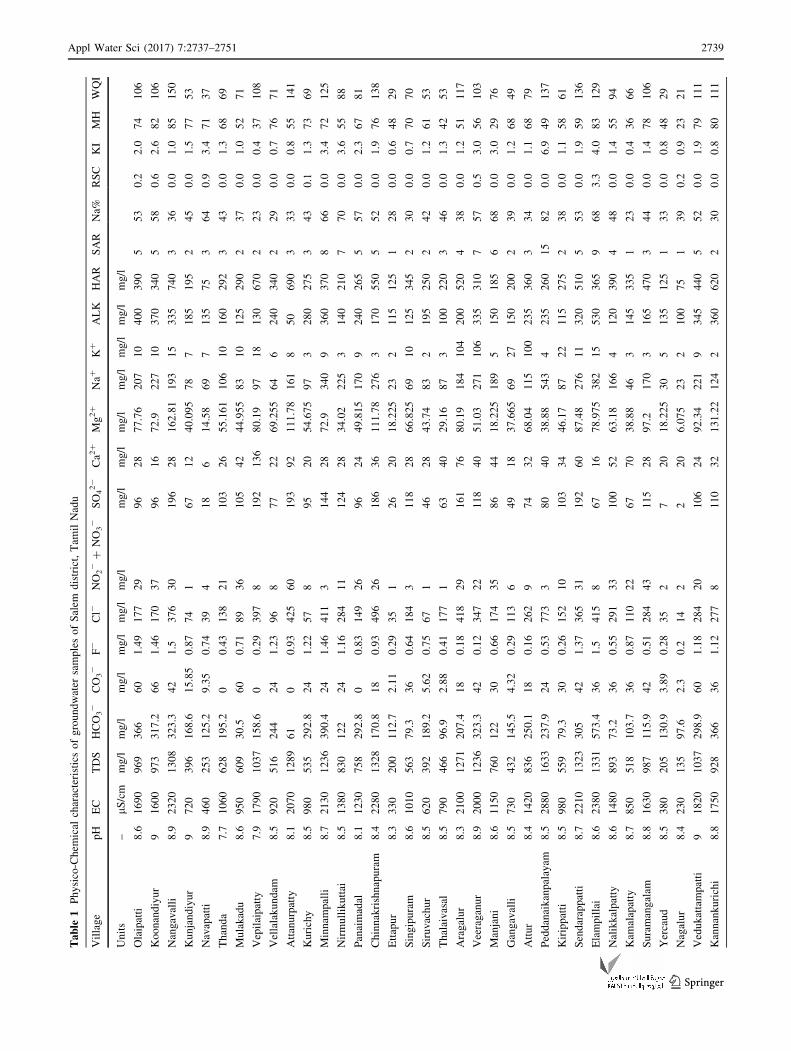
Table
1Physico-Chem
ical
characteristicsofgroundwater
samplesofSalem
district,Tam
ilNadu
Village
pH
EC
TDS
HCO3-
CO3-
F-
Cl-
NO2-?
NO3-
SO42-
Ca2
?Mg2?
Na?
K?
ALK
HAR
SAR
Na%
RSC
KI
MH
WQI
Units
–lS/cm
mg/l
mg/l
mg/l
mg/l
mg/l
mg/l
mg/l
mg/l
mg/l
mg/l
mg/l
mg/l
mg/l
Olaipatti
8.6
1690
969
366
60
1.49
177
29
96
28
77.76
207
10
400
390
553
0.2
2.0
74
106
Koonandiyur
91600
973
317.2
66
1.46
170
37
96
16
72.9
227
10
370
340
558
0.6
2.6
82
106
Nangavalli
8.9
2320
1308
323.3
42
1.5
376
30
196
28
162.81
193
15
335
740
336
0.0
1.0
85
150
Kunjandiyur
9720
396
168.6
15.85
0.87
74
167
12
40.095
78
7185
195
245
0.0
1.5
77
53
Navapatti
8.9
460
253
125.2
9.35
0.74
39
418
614.58
69
7135
75
364
0.9
3.4
71
37
Thanda
7.7
1060
628
195.2
00.43
138
21
103
26
55.161
106
10
160
292
343
0.0
1.3
68
69
Mulakadu
8.6
950
609
30.5
60
0.71
89
36
105
42
44.955
83
10
125
290
237
0.0
1.0
52
71
Vepilaipatty
7.9
1790
1037
158.6
00.29
397
8192
136
80.19
97
18
130
670
223
0.0
0.4
37
108
Vellalakundam
8.5
920
516
244
24
1.23
96
877
22
69.255
64
6240
340
229
0.0
0.7
76
71
Attanurpatty
8.1
2070
1289
61
00.93
425
60
193
92
111.78
161
850
690
333
0.0
0.8
55
141
Kurichy
8.5
980
535
292.8
24
1.22
57
895
20
54.675
97
3280
275
343
0.1
1.3
73
69
Minnam
palli
8.7
2130
1236
390.4
24
1.46
411
3144
28
72.9
340
9360
370
866
0.0
3.4
72
125
Nirmullikuttai
8.5
1380
830
122
24
1.16
284
11
124
28
34.02
225
3140
210
770
0.0
3.6
55
88
Panaimadal
8.1
1230
758
292.8
00.83
149
26
96
24
49.815
170
9240
265
557
0.0
2.3
67
81
Chinnakrishnapuram
8.4
2280
1328
170.8
18
0.93
496
26
186
36
111.78
276
3170
550
552
0.0
1.9
76
138
Ettapur
8.3
330
200
112.7
2.11
0.29
35
126
20
18.225
23
2115
125
128
0.0
0.6
48
29
Singipuram
8.6
1010
563
79.3
36
0.64
184
3118
28
66.825
69
10
125
345
230
0.0
0.7
70
70
Siruvachur
8.5
620
392
189.2
5.62
0.75
67
146
28
43.74
83
2195
250
242
0.0
1.2
61
53
Thalaivasal
8.5
790
466
96.9
2.88
0.41
177
163
40
29.16
87
3100
220
346
0.0
1.3
42
53
Aragalur
8.3
2100
1271
207.4
18
0.18
418
29
161
76
80.19
184
104
200
520
438
0.0
1.2
51
117
Veeraganur
8.9
2000
1236
323.3
42
0.12
347
22
118
40
51.03
271
106
335
310
757
0.5
3.0
56
103
Manjani
8.6
1150
760
122
30
0.66
174
35
86
44
18.225
189
5150
185
668
0.0
3.0
29
76
Gangavalli
8.5
730
432
145.5
4.32
0.29
113
649
18
37.665
69
27
150
200
239
0.0
1.2
68
49
Attur
8.4
1420
836
250.1
18
0.16
262
974
32
68.04
115
100
235
360
334
0.0
1.1
68
79
Peddanaikanpalayam
8.5
2880
1633
237.9
24
0.53
773
380
40
38.88
543
4235
260
15
82
0.0
6.9
49
137
Kirippatti
8.5
980
559
79.3
30
0.26
152
10
103
34
46.17
87
22
115
275
238
0.0
1.1
58
61
Sendarappatti
8.7
2210
1323
305
42
1.37
365
31
192
60
87.48
276
11
320
510
553
0.0
1.9
59
136
Elampillai
8.6
2380
1331
573.4
36
1.5
415
867
16
78.975
382
15
530
365
968
3.3
4.0
83
129
Nalikkalpatty
8.6
1480
893
73.2
36
0.55
291
33
100
52
63.18
166
4120
390
448
0.0
1.4
55
94
Kam
alapatty
8.7
850
518
103.7
36
0.87
110
22
67
70
38.88
46
3145
335
123
0.0
0.4
36
66
Suramangalam
8.8
1630
987
115.9
42
0.51
284
43
115
28
97.2
170
3165
470
344
0.0
1.4
78
106
Yercaud
8.5
380
205
130.9
3.89
0.28
35
27
20
18.225
30
5135
125
133
0.0
0.8
48
29
Nagalur
8.4
230
135
97.6
2.3
0.2
14
22
20
6.075
23
2100
75
139
0.2
0.9
23
21
Vedukattampatti
91820
1037
298.9
60
1.18
284
20
106
24
92.34
221
9345
440
552
0.0
1.9
79
111
Kannankurichi
8.8
1750
928
366
36
1.12
277
8110
32
131.22
124
2360
620
230
0.0
0.8
80
111
Appl Water Sci (2017) 7:2737–2751 2739
123
Table
1continued
Village
pH
EC
TDS
HCO3-
CO3-
F-
Cl-
NO2-?
NO3-
SO42-
Ca2
?Mg2?
Na?
K?
ALK
HAR
SAR
Na%
RSC
KI
MH
WQI
Ammapet
92150
1235
341.6
66
1.06
333
23
144
24
94.77
294
5390
450
658
0.0
2.5
80
124
Hastampatti
9760
414
228
21.43
1.39
57
448
26
44.955
64
3250
250
235
0.0
0.9
63
61
Kalvadangam
8.4
1000
605
109.8
24
1.31
82
8228
28
63.18
74
18
130
330
231
0.0
0.8
69
80
Chinnagoundanur
8.4
1220
779
298.9
18
0.5
160
12
96
10
37.665
143
113
275
180
549
1.9
3.0
79
71
Iruppali
8.2
1000
598
195.2
01.31
85
8196
32
66.825
69
18
160
355
228
0.0
0.7
68
80
Kunnipalayam
8.7
3800
2310
524.6
36
0.84
780
27
224
32
82.62
598
174
490
420
13
67
1.4
5.2
72
190
Konganapuram
81740
1034
195.2
00.61
340
42
105
52
114.21
124
15
160
600
230
0.0
0.7
69
114
Idappadi
8.1
1590
968
170.8
00.26
326
42
76
60
89.91
129
15
140
520
234
0.0
0.9
60
101
Pillukurichi
91410
838
195.2
54
0.77
213
13
144
24
82.62
143
23
250
400
342
0.0
1.3
77
92
Koranam
patti
93650
2116
427
60
1.08
752
12
288
24
111.78
607
8450
520
12
71
0.0
4.5
82
190
Pakkanadu
8.6
2090
1164
372.1
36
1.08
227
12
288
76
114.21
161
23
365
660
334
0.0
0.8
60
127
Danishpet
8.5
650
344
213.5
6.34
1.66
39
348
14
47.385
46
3220
230
130
0.0
0.7
77
59
Lokkur
8.6
1340
795
390.4
36
1.18
135
596
24
24.3
225
38
380
160
870
4.4
4.7
50
78
Theevattipatti
8.5
700
420
150.4
4.46
196
762
22
41.31
69
5155
225
239
0.0
1.1
65
57
Karuppur
8.7
1050
555
292.8
42
0.39
96
196
12
95.985
46
15
310
425
118
0.0
0.4
89
68
Muthunaickanpatti
8.7
1450
904
195.2
36
1.24
191
35
125
16
63.18
189
30
220
300
555
0.0
2.4
80
98
Omalur
8.6
1160
681
305
30
1.35
106
17
89
12
59.535
138
14
300
275
451
0.5
1.9
83
81
Tholasampati
91820
1024
555.1
60
1.65
170
487
16
21.87
368
4555
130
14
86
8.5
9.7
58
97
Tharam
angalam
92530
1476
610
60
1.29
369
22
96
40
46.17
455
6600
290
12
77
6.2
5.3
54
131
Jalakandapuram
92710
1566
170.8
54
0.49
652
4213
32
104.49
405
3230
510
863
0.0
3.0
77
146
Marakottai
8.8
1840
1019
585.6
48
1.4
163
11
114
20
29.16
299
6560
170
10
79
7.8
6.1
59
96
Thekkam
patti
9720
388
255.5
24.01
0.26
39
248
12
59.535
46
6280
275
126
0.0
0.6
83
48
Gundaakkal
8.7
1810
1116
97.6
48
0.8
262
43
236
40
111.78
170
7160
560
339
0.0
1.1
74
122
Manathal
8.5
1230
742
390.4
30
1.36
74
27
69
16
47.385
179
13
370
235
561
2.7
2.8
75
82
ALKalkalinity,HARhardness,ECelectrical
conductivity,TDStotaldissolved
solids,SARsodium
absorptionratio,KIKelleyIndex,MH
magnesium
hazard,RSCresidual
sodium
carbonate
2740 Appl Water Sci (2017) 7:2737–2751
123
villages Thanda, Iruppali, Idappadi, Konganapuram, Kal-
vadangam, Chinnagoundanur, Nagalur, Panaimadal, Kuri-
chy, Attanurpatty, Ettapur, Attur, Vepilaipatty, and
Aragalur have a desirable limit of pH and the rest of the
villages have above 8.5 pH. Excess amount of pH in the
drinking water will affect the mucous membrane and water
supply system (Napacho and Manyele 2010).
Electrical conductivity
EC is a measurement of the ability of an aqueous solution
to carry an electrical current. EC measurement used for a
number of applications related to water quality. These are
to determine mineralization, changes in natural water and
waste water quickly, and determining amounts of chemical
reagents to be added to a water sample. In the study area,
EC value ranges from 230 to 3800 lS/cm and the mean
value is 1487 lS/cm (Table 2). The WHO (2006) guideline
has suggested that the limit of EC in drinking water is 750
lS/cm. According to the WHO (2006) standard, the study
area villages Ettapur, Theevattipatti, Danishpet, Nagalur,
Yercaud, Kunjandiyur, Navapatti, Thekkampatti, Hastam-
patti, Vellalakundam, Kamalapatty, Kirippatti, Gangavalli,
Siruvachur, Thalaivasal, and Kurichy have a desirable limit
of EC in drinking water, and the rest of the villages have
excess amount of EC in drinking water.
Total dissolved solids
TDS in water can originate from natural sources, livestock
waste, sewage, nature of the soil, and urban run-off
industrial wastewater. The concentration of dissolved
matter in water is given by the weight of the material on
evaporation of water to dryness followed by heating for 1 h
at 180 �C. The BIS (2012) has suggested that the accept-
able limit of TDS in drinking water is 500 mg/l and
Fig. 1 Water sample location map of the study area
Appl Water Sci (2017) 7:2737–2751 2741
123
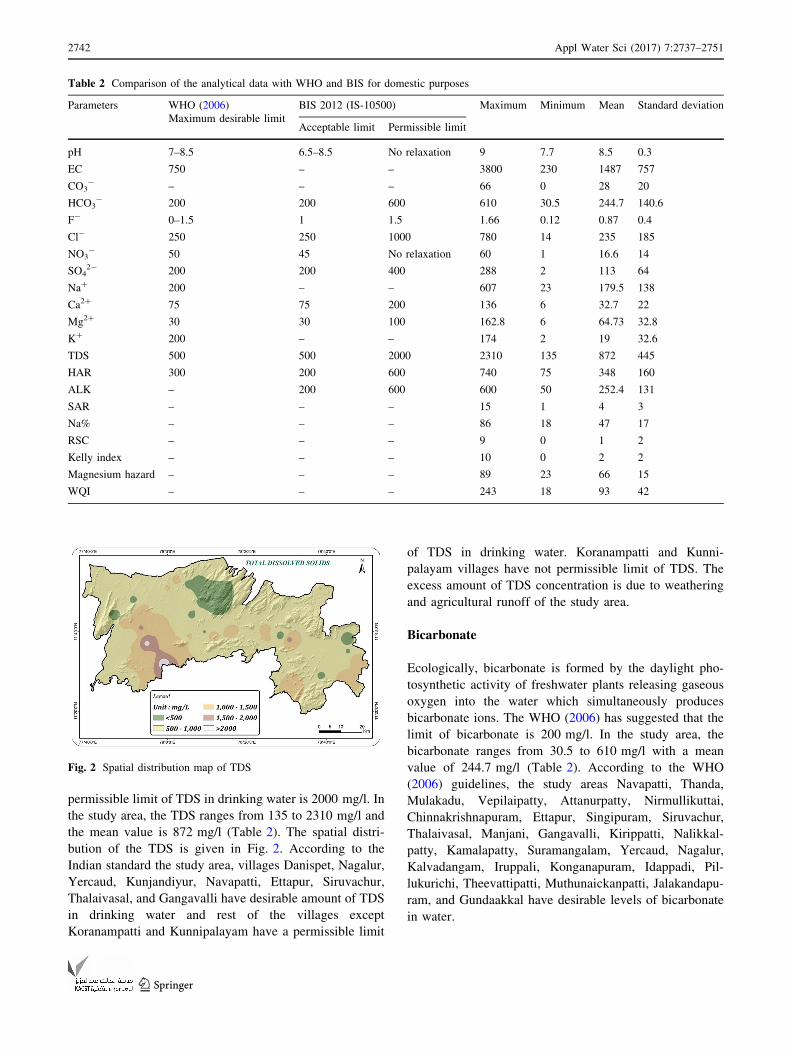
permissible limit of TDS in drinking water is 2000 mg/l. In
the study area, the TDS ranges from 135 to 2310 mg/l and
the mean value is 872 mg/l (Table 2). The spatial distri-
bution of the TDS is given in Fig. 2. According to the
Indian standard the study area, villages Danispet, Nagalur,
Yercaud, Kunjandiyur, Navapatti, Ettapur, Siruvachur,
Thalaivasal, and Gangavalli have desirable amount of TDS
in drinking water and rest of the villages except
Koranampatti and Kunnipalayam have a permissible limit
of TDS in drinking water. Koranampatti and Kunni-
palayam villages have not permissible limit of TDS. The
excess amount of TDS concentration is due to weathering
and agricultural runoff of the study area.
Bicarbonate
Ecologically, bicarbonate is formed by the daylight pho-
tosynthetic activity of freshwater plants releasing gaseous
oxygen into the water which simultaneously produces
bicarbonate ions. The WHO (2006) has suggested that the
limit of bicarbonate is 200 mg/l. In the study area, the
bicarbonate ranges from 30.5 to 610 mg/l with a mean
value of 244.7 mg/l (Table 2). According to the WHO
(2006) guidelines, the study areas Navapatti, Thanda,
Mulakadu, Vepilaipatty, Attanurpatty, Nirmullikuttai,
Chinnakrishnapuram, Ettapur, Singipuram, Siruvachur,
Thalaivasal, Manjani, Gangavalli, Kirippatti, Nalikkal-
patty, Kamalapatty, Suramangalam, Yercaud, Nagalur,
Kalvadangam, Iruppali, Konganapuram, Idappadi, Pil-
lukurichi, Theevattipatti, Muthunaickanpatti, Jalakandapu-
ram, and Gundaakkal have desirable levels of bicarbonate
in water.
Table 2 Comparison of the analytical data with WHO and BIS for domestic purposes
Parameters WHO (2006)
Maximum desirable limit
BIS 2012 (IS-10500) Maximum Minimum Mean Standard deviation
Acceptable limit Permissible limit
pH 7–8.5 6.5–8.5 No relaxation 9 7.7 8.5 0.3
EC 750 – – 3800 230 1487 757
CO3- – – – 66 0 28 20
HCO3- 200 200 600 610 30.5 244.7 140.6
F- 0–1.5 1 1.5 1.66 0.12 0.87 0.4
Cl- 250 250 1000 780 14 235 185
NO3- 50 45 No relaxation 60 1 16.6 14
SO42- 200 200 400 288 2 113 64
Na? 200 – – 607 23 179.5 138
Ca2? 75 75 200 136 6 32.7 22
Mg2? 30 30 100 162.8 6 64.73 32.8
K? 200 – – 174 2 19 32.6
TDS 500 500 2000 2310 135 872 445
HAR 300 200 600 740 75 348 160
ALK – 200 600 600 50 252.4 131
SAR – – – 15 1 4 3
Na% – – – 86 18 47 17
RSC – – – 9 0 1 2
Kelly index – – – 10 0 2 2
Magnesium hazard – – – 89 23 66 15
WQI – – – 243 18 93 42
Fig. 2 Spatial distribution map of TDS
2742 Appl Water Sci (2017) 7:2737–2751
123
Carbonate
Most of the carbonate ions in ground water are derived from
the carbon di-oxide in the atmosphere and soil. The study
area showed the highest carbonate concentration in 66 mg/l
at Koonandiyur, Thanda, Vepillaipatti, Attanurpatty,
Panaimadal, Iruppali, and Konganapuram, with Idappadi
villages having neutral carbonate content in water.
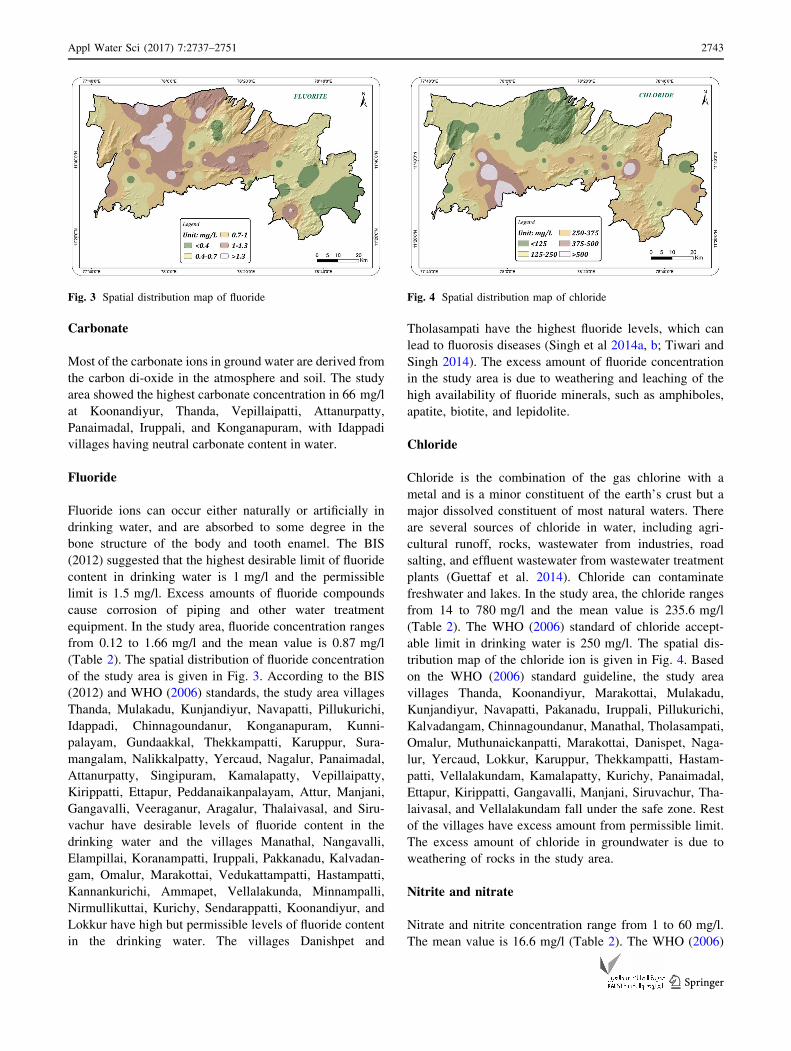
Fluoride
Fluoride ions can occur either naturally or artificially in
drinking water, and are absorbed to some degree in the
bone structure of the body and tooth enamel. The BIS
(2012) suggested that the highest desirable limit of fluoride
content in drinking water is 1 mg/l and the permissible
limit is 1.5 mg/l. Excess amounts of fluoride compounds
cause corrosion of piping and other water treatment
equipment. In the study area, fluoride concentration ranges
from 0.12 to 1.66 mg/l and the mean value is 0.87 mg/l
(Table 2). The spatial distribution of fluoride concentration
of the study area is given in Fig. 3. According to the BIS
(2012) and WHO (2006) standards, the study area villages
Thanda, Mulakadu, Kunjandiyur, Navapatti, Pillukurichi,
Idappadi, Chinnagoundanur, Konganapuram, Kunni-
palayam, Gundaakkal, Thekkampatti, Karuppur, Sura-
mangalam, Nalikkalpatty, Yercaud, Nagalur, Panaimadal,
Attanurpatty, Singipuram, Kamalapatty, Vepillaipatty,
Kirippatti, Ettapur, Peddanaikanpalayam, Attur, Manjani,
Gangavalli, Veeraganur, Aragalur, Thalaivasal, and Siru-
vachur have desirable levels of fluoride content in the
drinking water and the villages Manathal, Nangavalli,
Elampillai, Koranampatti, Iruppali, Pakkanadu, Kalvadan-
gam, Omalur, Marakottai, Vedukattampatti, Hastampatti,
Kannankurichi, Ammapet, Vellalakunda, Minnampalli,
Nirmullikuttai, Kurichy, Sendarappatti, Koonandiyur, and
Lokkur have high but permissible levels of fluoride content
in the drinking water. The villages Danishpet and
Tholasampati have the highest fluoride levels, which can
lead to fluorosis diseases (Singh et al 2014a, b; Tiwari and
Singh 2014). The excess amount of fluoride concentration
in the study area is due to weathering and leaching of the
high availability of fluoride minerals, such as amphiboles,
apatite, biotite, and lepidolite.
Chloride
Chloride is the combination of the gas chlorine with a
metal and is a minor constituent of the earth’s crust but a
major dissolved constituent of most natural waters. There
are several sources of chloride in water, including agri-
cultural runoff, rocks, wastewater from industries, road
salting, and effluent wastewater from wastewater treatment
plants (Guettaf et al. 2014). Chloride can contaminate
freshwater and lakes. In the study area, the chloride ranges
from 14 to 780 mg/l and the mean value is 235.6 mg/l
(Table 2). The WHO (2006) standard of chloride accept-
able limit in drinking water is 250 mg/l. The spatial dis-
tribution map of the chloride ion is given in Fig. 4. Based
on the WHO (2006) standard guideline, the study area
villages Thanda, Koonandiyur, Marakottai, Mulakadu,
Kunjandiyur, Navapatti, Pakanadu, Iruppali, Pillukurichi,
Kalvadangam, Chinnagoundanur, Manathal, Tholasampati,
Omalur, Muthunaickanpatti, Marakottai, Danispet, Naga-
lur, Yercaud, Lokkur, Karuppur, Thekkampatti, Hastam-
patti, Vellalakundam, Kamalapatty, Kurichy, Panaimadal,
Ettapur, Kirippatti, Gangavalli, Manjani, Siruvachur, Tha-
laivasal, and Vellalakundam fall under the safe zone. Rest
of the villages have excess amount from permissible limit.
The excess amount of chloride in groundwater is due to
weathering of rocks in the study area.
Nitrite and nitrate
Nitrate and nitrite concentration range from 1 to 60 mg/l.
The mean value is 16.6 mg/l (Table 2). The WHO (2006)
Fig. 3 Spatial distribution map of fluoride Fig. 4 Spatial distribution map of chloride
Appl Water Sci (2017) 7:2737–2751 2743
123
desirable limit of nitrate and nitrite concentration is 50 mg/
l. The spatial distribution of nitrate and nitrite concentra-
tion is given in Fig. 5. According to the WHO (2006)
standard, it falls under the safe zone except Attanurpatty.
The excess concentration of nitrate and nitrite concentra-
tion can produce the ‘‘brown blood disease’’. These
extreme amounts of nitrate and nitrite concentration mixed
with water may occur through fertilizer runoff, animal
wastes, leaking septic tanks, sanitary landfills, industrial
waste waters, and discharge from car exhausts (Singh et al.
2014a, b). The excess amount of nitrite and nitrate con-
centration in attanurpatty is due to agricultural activities,
such as high use of fertilizer in the study area.
Sulfate
Sulfate can be naturally occurring through rock or soil and
other common minerals or formed artificially from runoff
of fertilized agriculture lands. Sulfur is an important plant
nutrient. The BIS (2012) and WHO (2006) have suggested
that the desirable limit of sulfate is 200 mg/l and permis-
sible limit is 400 mg/l. In the study area, the sulfate ranges
from 2 to 288 mg/l, and the mean value is 113.4 mg/l
(Table 2). According to Indian Standard the study area,
villages except Pakkanadu, Jalakandapuram, Koranam-
patti, Kummipalayam, Kalvadangam, and Gundaakkal fall
below the desirable limits and all other villages fall below
the permissible limits. Sulfate is not considered toxic at
normal concentrations; very high sulfate is toxic to cattle.
Calcium
Calcium ranges from 6 to 136 mg/l, and the mean value is
32.7 mg/l (Table 2). The BIS (2012) and WHO (2006)
have suggested that the desirable limit of calcium con-
centration ion in the drinking water is 75 mg/l. According
to the BIS (2012), the study area villages except Vepil-
laipatty, Kamalapatty, Aragalur, Attanurpatty, and
Pakkanadu fall under the safe zone. Most part of the study
area covered by low and very low calcium concentrations.
Plagioclase feldspar and clinopyroxene are the main source
of the calcium content in the study area. These are char-
acteristically found in Charnockite rock. The Charnockite
rock is generally high in the study area. The variations in
topography, surface material (rock and soil), and land
cover which influence the rate of weathering are the rea-
sons for the differences in the concentration of calcium in
the waters of the study area (Kumar et al. 2014).
Magnesium
The magnesium ranges from 6 to 162 mg/l, and the mean
value is 64.7 mg/l (Table 2). The drinking water specifi-
cation in the BIS (2012) and WHO (2006) has suggested
that the desirable limit of the magnesium in water is
30 mg/l and the BIS (2012) permissible limit in the
absence of an alternate source is 100 mg/l. (Rosanoff 2013)
has stated that Universal drinking water and beverages
containing moderate-to-high levels of magnesium
(10–100 ppm) could potentially prevent 4.5 million heart
disease and stroke deaths per year, worldwide, and this
potential is calculated with 2010 global mortality fig-
ures combined with a recent quantification of water-mag-
nesium inverse association with heart disease and stroke
mortality. The spatial distribution map of the magnesium
ion concentration is shown in Fig. 6. According to the
above said standard, the magnesium ion concentration of
study area villages Navapatti, Ettapur, Thalaivasal, Man-
jani, Yercaud, Nagalur, Lokkur, Tholasampatti, and
Marakottai falls below the desirable limit and that of the
rest of the villages except Nangavalli, Attanurpatty, Chin-
nakrishnapuram, Kannankurich Konganapuram,
Koranampatti, Pakkanadu, Jalakandapuram, and Gun-
dakkal fall within the permissible limit in the absence of
alternative sources. The above said except villages fall
under the above desirable level. The source of high
Fig. 5 Spatial distribution map of nitrite and nitrate
Fig. 6 Spatial distribution map of magnesium
2744 Appl Water Sci (2017) 7:2737–2751
123
magnesium level in the groundwater is due to magnesite
deposits and ultramafic rock occurrence of the study area.
Natural water contains magnesium and calcium, which
caused hardness of groundwater based on dissolved poly-
valent metallic ions (Basavarajappa and Manjunatha 2015).
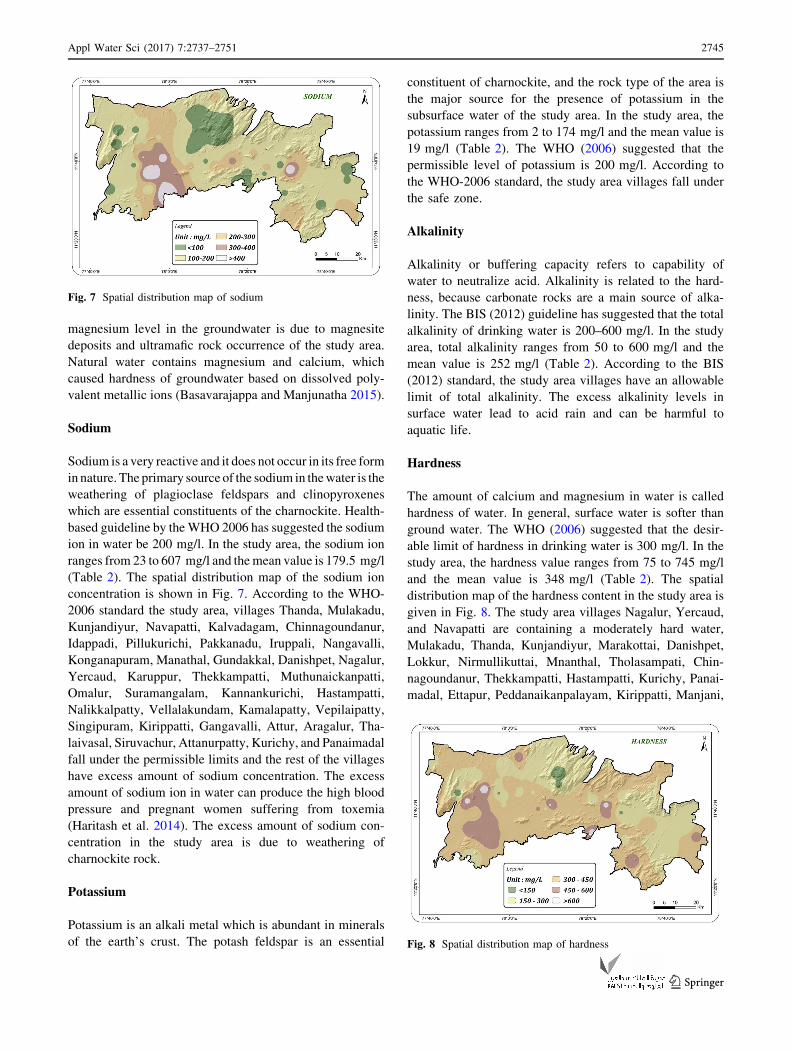
Sodium
Sodium is a very reactive and it does not occur in its free form
in nature. The primary source of the sodium in thewater is the
weathering of plagioclase feldspars and clinopyroxenes
which are essential constituents of the charnockite. Health-
based guideline by theWHO 2006 has suggested the sodium
ion in water be 200 mg/l. In the study area, the sodium ion
ranges from 23 to 607 mg/l and themean value is 179.5 mg/l
(Table 2). The spatial distribution map of the sodium ion
concentration is shown in Fig. 7. According to the WHO-
2006 standard the study area, villages Thanda, Mulakadu,
Kunjandiyur, Navapatti, Kalvadagam, Chinnagoundanur,
Idappadi, Pillukurichi, Pakkanadu, Iruppali, Nangavalli,
Konganapuram, Manathal, Gundakkal, Danishpet, Nagalur,
Yercaud, Karuppur, Thekkampatti, Muthunaickanpatti,
Omalur, Suramangalam, Kannankurichi, Hastampatti,
Nalikkalpatty, Vellalakundam, Kamalapatty, Vepilaipatty,
Singipuram, Kirippatti, Gangavalli, Attur, Aragalur, Tha-
laivasal, Siruvachur, Attanurpatty, Kurichy, and Panaimadal
fall under the permissible limits and the rest of the villages
have excess amount of sodium concentration. The excess
amount of sodium ion in water can produce the high blood
pressure and pregnant women suffering from toxemia
(Haritash et al. 2014). The excess amount of sodium con-
centration in the study area is due to weathering of
charnockite rock.
Potassium
Potassium is an alkali metal which is abundant in minerals
of the earth’s crust. The potash feldspar is an essential
constituent of charnockite, and the rock type of the area is
the major source for the presence of potassium in the
subsurface water of the study area. In the study area, the
potassium ranges from 2 to 174 mg/l and the mean value is
19 mg/l (Table 2). The WHO (2006) suggested that the
permissible level of potassium is 200 mg/l. According to
the WHO-2006 standard, the study area villages fall under
the safe zone.
Alkalinity
Alkalinity or buffering capacity refers to capability of
water to neutralize acid. Alkalinity is related to the hard-
ness, because carbonate rocks are a main source of alka-
linity. The BIS (2012) guideline has suggested that the total
alkalinity of drinking water is 200–600 mg/l. In the study
area, total alkalinity ranges from 50 to 600 mg/l and the
mean value is 252 mg/l (Table 2). According to the BIS
(2012) standard, the study area villages have an allowable
limit of total alkalinity. The excess alkalinity levels in
surface water lead to acid rain and can be harmful to
aquatic life.
Hardness
The amount of calcium and magnesium in water is called
hardness of water. In general, surface water is softer than
ground water. The WHO (2006) suggested that the desir-
able limit of hardness in drinking water is 300 mg/l. In the
study area, the hardness value ranges from 75 to 745 mg/l
and the mean value is 348 mg/l (Table 2). The spatial
distribution map of the hardness content in the study area is
given in Fig. 8. The study area villages Nagalur, Yercaud,
and Navapatti are containing a moderately hard water,
Mulakadu, Thanda, Kunjandiyur, Marakottai, Danishpet,
Lokkur, Nirmullikuttai, Mnanthal, Tholasampati, Chin-
nagoundanur, Thekkampatti, Hastampatti, Kurichy, Panai-
madal, Ettapur, Peddanaikanpalayam, Kirippatti, Manjani,
Fig. 7 Spatial distribution map of sodium
Fig. 8 Spatial distribution map of hardness
Appl Water Sci (2017) 7:2737–2751 2745
123
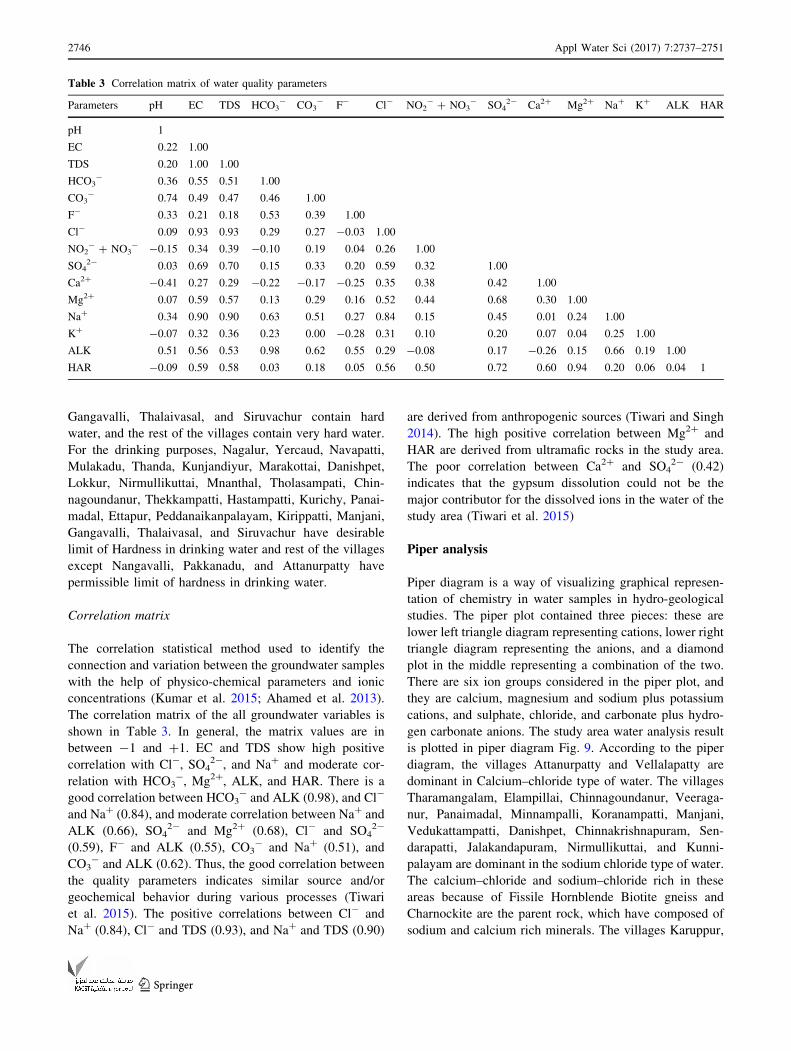
Gangavalli, Thalaivasal, and Siruvachur contain hard
water, and the rest of the villages contain very hard water.
For the drinking purposes, Nagalur, Yercaud, Navapatti,
Mulakadu, Thanda, Kunjandiyur, Marakottai, Danishpet,
Lokkur, Nirmullikuttai, Mnanthal, Tholasampati, Chin-
nagoundanur, Thekkampatti, Hastampatti, Kurichy, Panai-
madal, Ettapur, Peddanaikanpalayam, Kirippatti, Manjani,
Gangavalli, Thalaivasal, and Siruvachur have desirable
limit of Hardness in drinking water and rest of the villages
except Nangavalli, Pakkanadu, and Attanurpatty have
permissible limit of hardness in drinking water.
Correlation matrix
The correlation statistical method used to identify the
connection and variation between the groundwater samples
with the help of physico-chemical parameters and ionic
concentrations (Kumar et al. 2015; Ahamed et al. 2013).
The correlation matrix of the all groundwater variables is
shown in Table 3. In general, the matrix values are in
between -1 and ?1. EC and TDS show high positive
correlation with Cl-, SO42-, and Na? and moderate cor-
relation with HCO3-, Mg2?, ALK, and HAR. There is a
good correlation between HCO3- and ALK (0.98), and Cl-
and Na? (0.84), and moderate correlation between Na? and
ALK (0.66), SO42- and Mg2? (0.68), Cl- and SO4
2-
(0.59), F- and ALK (0.55), CO3- and Na? (0.51), and
CO3- and ALK (0.62). Thus, the good correlation between
the quality parameters indicates similar source and/or
geochemical behavior during various processes (Tiwari
et al. 2015). The positive correlations between Cl- and
Na? (0.84), Cl- and TDS (0.93), and Na? and TDS (0.90)
are derived from anthropogenic sources (Tiwari and Singh
2014). The high positive correlation between Mg2? and
HAR are derived from ultramafic rocks in the study area.
The poor correlation between Ca2? and SO42- (0.42)
indicates that the gypsum dissolution could not be the
major contributor for the dissolved ions in the water of the
study area (Tiwari et al. 2015)
Piper analysis
Piper diagram is a way of visualizing graphical represen-
tation of chemistry in water samples in hydro-geological
studies. The piper plot contained three pieces: these are
lower left triangle diagram representing cations, lower right
triangle diagram representing the anions, and a diamond
plot in the middle representing a combination of the two.
There are six ion groups considered in the piper plot, and
they are calcium, magnesium and sodium plus potassium
cations, and sulphate, chloride, and carbonate plus hydro-
gen carbonate anions. The study area water analysis result
is plotted in piper diagram Fig. 9. According to the piper
diagram, the villages Attanurpatty and Vellalapatty are
dominant in Calcium–chloride type of water. The villages
Tharamangalam, Elampillai, Chinnagoundanur, Veeraga-
nur, Panaimadal, Minnampalli, Koranampatti, Manjani,
Vedukattampatti, Danishpet, Chinnakrishnapuram, Sen-
darapatti, Jalakandapuram, Nirmullikuttai, and Kunni-
palayam are dominant in the sodium chloride type of water.
The calcium–chloride and sodium–chloride rich in these
areas because of Fissile Hornblende Biotite gneiss and
Charnockite are the parent rock, which have composed of
sodium and calcium rich minerals. The villages Karuppur,
Table 3 Correlation matrix of water quality parameters
Parameters pH EC TDS HCO3- CO3
- F- Cl- NO2- ? NO3
- SO42- Ca2? Mg2? Na? K? ALK HAR
pH 1
EC 0.22 1.00
TDS 0.20 1.00 1.00
HCO3- 0.36 0.55 0.51 1.00
CO3- 0.74 0.49 0.47 0.46 1.00
F- 0.33 0.21 0.18 0.53 0.39 1.00
Cl- 0.09 0.93 0.93 0.29 0.27 -0.03 1.00
NO2- ? NO3
- -0.15 0.34 0.39 -0.10 0.19 0.04 0.26 1.00
SO42- 0.03 0.69 0.70 0.15 0.33 0.20 0.59 0.32 1.00
Ca2? -0.41 0.27 0.29 -0.22 -0.17 -0.25 0.35 0.38 0.42 1.00
Mg2? 0.07 0.59 0.57 0.13 0.29 0.16 0.52 0.44 0.68 0.30 1.00
Na? 0.34 0.90 0.90 0.63 0.51 0.27 0.84 0.15 0.45 0.01 0.24 1.00
K? -0.07 0.32 0.36 0.23 0.00 -0.28 0.31 0.10 0.20 0.07 0.04 0.25 1.00
ALK 0.51 0.56 0.53 0.98 0.62 0.55 0.29 -0.08 0.17 -0.26 0.15 0.66 0.19 1.00
HAR -0.09 0.59 0.58 0.03 0.18 0.05 0.56 0.50 0.72 0.60 0.94 0.20 0.06 0.04 1
2746 Appl Water Sci (2017) 7:2737–2751
123
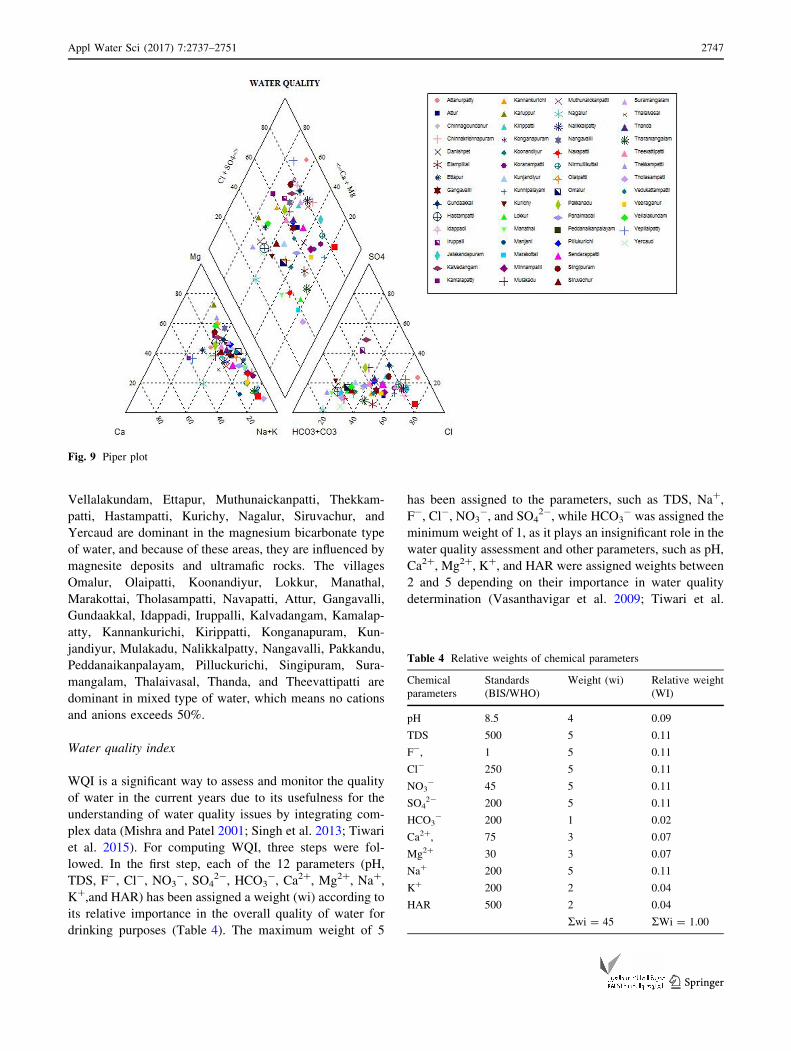
Vellalakundam, Ettapur, Muthunaickanpatti, Thekkam-
patti, Hastampatti, Kurichy, Nagalur, Siruvachur, and
Yercaud are dominant in the magnesium bicarbonate type
of water, and because of these areas, they are influenced by
magnesite deposits and ultramafic rocks. The villages
Omalur, Olaipatti, Koonandiyur, Lokkur, Manathal,
Marakottai, Tholasampatti, Navapatti, Attur, Gangavalli,
Gundaakkal, Idappadi, Iruppalli, Kalvadangam, Kamalap-
atty, Kannankurichi, Kirippatti, Konganapuram, Kun-
jandiyur, Mulakadu, Nalikkalpatty, Nangavalli, Pakkandu,
Peddanaikanpalayam, Pilluckurichi, Singipuram, Sura-
mangalam, Thalaivasal, Thanda, and Theevattipatti are
dominant in mixed type of water, which means no cations
and anions exceeds 50%.
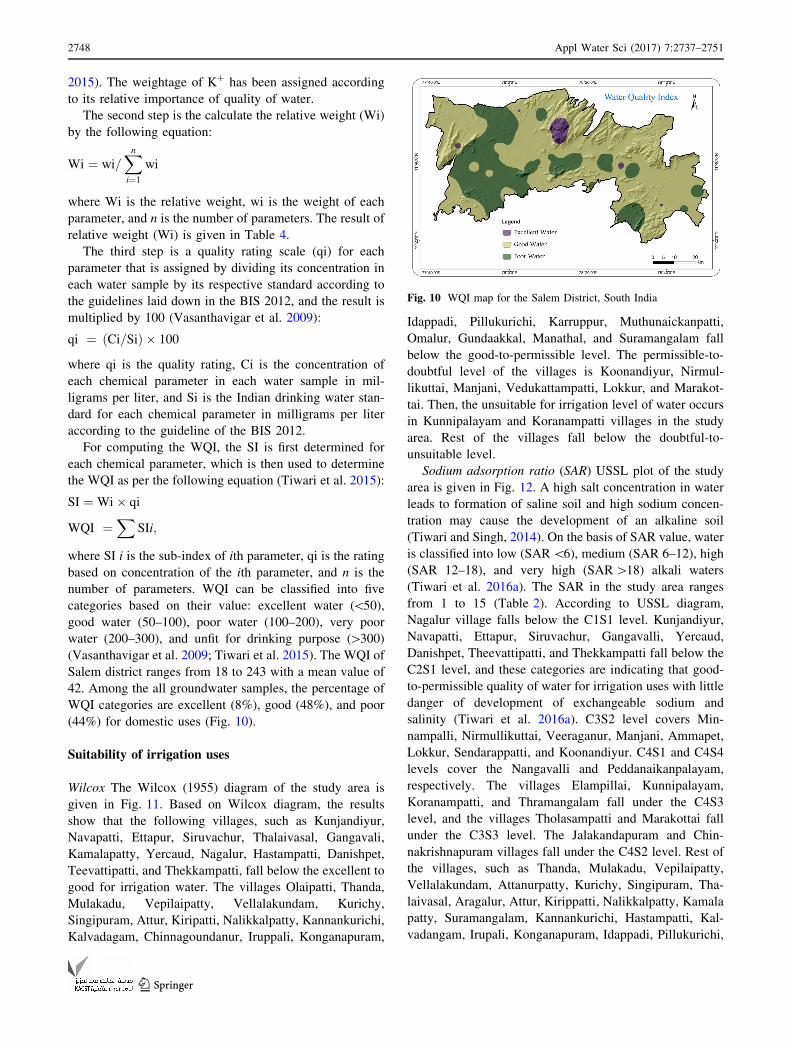
Water quality index
WQI is a significant way to assess and monitor the quality
of water in the current years due to its usefulness for the
understanding of water quality issues by integrating com-
plex data (Mishra and Patel 2001; Singh et al. 2013; Tiwari
et al. 2015). For computing WQI, three steps were fol-
lowed. In the first step, each of the 12 parameters (pH,
TDS, F-, Cl-, NO3-, SO4
2-, HCO3-, Ca2?, Mg2?, Na?,
K?,and HAR) has been assigned a weight (wi) according to
its relative importance in the overall quality of water for
drinking purposes (Table 4). The maximum weight of 5
has been assigned to the parameters, such as TDS, Na?,
F-, Cl-, NO3-, and SO4
2-, while HCO3- was assigned the
minimum weight of 1, as it plays an insignificant role in the
water quality assessment and other parameters, such as pH,
Ca2?, Mg2?, K?, and HAR were assigned weights between
2 and 5 depending on their importance in water quality
determination (Vasanthavigar et al. 2009; Tiwari et al.
Fig. 9 Piper plot
Table 4 Relative weights of chemical parameters
Chemical
parameters
Standards
(BIS/WHO)
Weight (wi) Relative weight
(WI)
pH 8.5 4 0.09
TDS 500 5 0.11
F-, 1 5 0.11
Cl- 250 5 0.11
NO3- 45 5 0.11
SO42- 200 5 0.11
HCO3- 200 1 0.02
Ca2?, 75 3 0.07
Mg2? 30 3 0.07
Na? 200 5 0.11
K? 200 2 0.04
HAR 500 2 0.04
Rwi = 45 RWi = 1.00
Appl Water Sci (2017) 7:2737–2751 2747
123
2015). The weightage of K? has been assigned according
to its relative importance of quality of water.
The second step is the calculate the relative weight (Wi)
by the following equation:
Wi ¼ wi=Xn
i¼1
wi
where Wi is the relative weight, wi is the weight of each
parameter, and n is the number of parameters. The result of
relative weight (Wi) is given in Table 4.
The third step is a quality rating scale (qi) for each
parameter that is assigned by dividing its concentration in
each water sample by its respective standard according to
the guidelines laid down in the BIS 2012, and the result is
multiplied by 100 (Vasanthavigar et al. 2009):
qi ¼ Ci=Sið Þ � 100
where qi is the quality rating, Ci is the concentration of
each chemical parameter in each water sample in mil-
ligrams per liter, and Si is the Indian drinking water stan-
dard for each chemical parameter in milligrams per liter
according to the guideline of the BIS 2012.
For computing the WQI, the SI is first determined for
each chemical parameter, which is then used to determine
the WQI as per the following equation (Tiwari et al. 2015):
SI ¼ Wi� qi
WQI ¼X
SIi;
where SI i is the sub-index of ith parameter, qi is the rating
based on concentration of the ith parameter, and n is the
number of parameters. WQI can be classified into five
categories based on their value: excellent water (\50),
good water (50–100), poor water (100–200), very poor
water (200–300), and unfit for drinking purpose ([300)
(Vasanthavigar et al. 2009; Tiwari et al. 2015). The WQI of
Salem district ranges from 18 to 243 with a mean value of
42. Among the all groundwater samples, the percentage of
WQI categories are excellent (8%), good (48%), and poor
(44%) for domestic uses (Fig. 10).
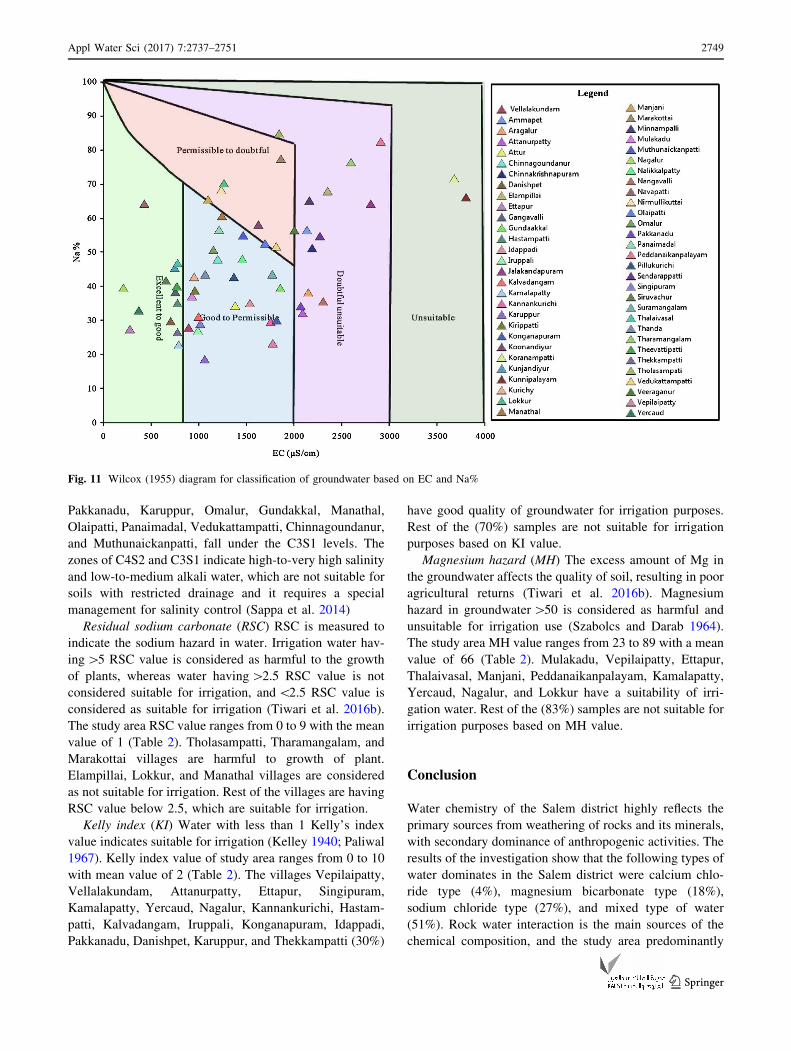
Suitability of irrigation uses
Wilcox The Wilcox (1955) diagram of the study area is
given in Fig. 11. Based on Wilcox diagram, the results
show that the following villages, such as Kunjandiyur,
Navapatti, Ettapur, Siruvachur, Thalaivasal, Gangavali,
Kamalapatty, Yercaud, Nagalur, Hastampatti, Danishpet,
Teevattipatti, and Thekkampatti, fall below the excellent to
good for irrigation water. The villages Olaipatti, Thanda,
Mulakadu, Vepilaipatty, Vellalakundam, Kurichy,
Singipuram, Attur, Kiripatti, Nalikkalpatty, Kannankurichi,
Kalvadagam, Chinnagoundanur, Iruppali, Konganapuram,
Idappadi, Pillukurichi, Karruppur, Muthunaickanpatti,
Omalur, Gundaakkal, Manathal, and Suramangalam fall
below the good-to-permissible level. The permissible-to-
doubtful level of the villages is Koonandiyur, Nirmul-
likuttai, Manjani, Vedukattampatti, Lokkur, and Marakot-
tai. Then, the unsuitable for irrigation level of water occurs
in Kunnipalayam and Koranampatti villages in the study
area. Rest of the villages fall below the doubtful-to-
unsuitable level.
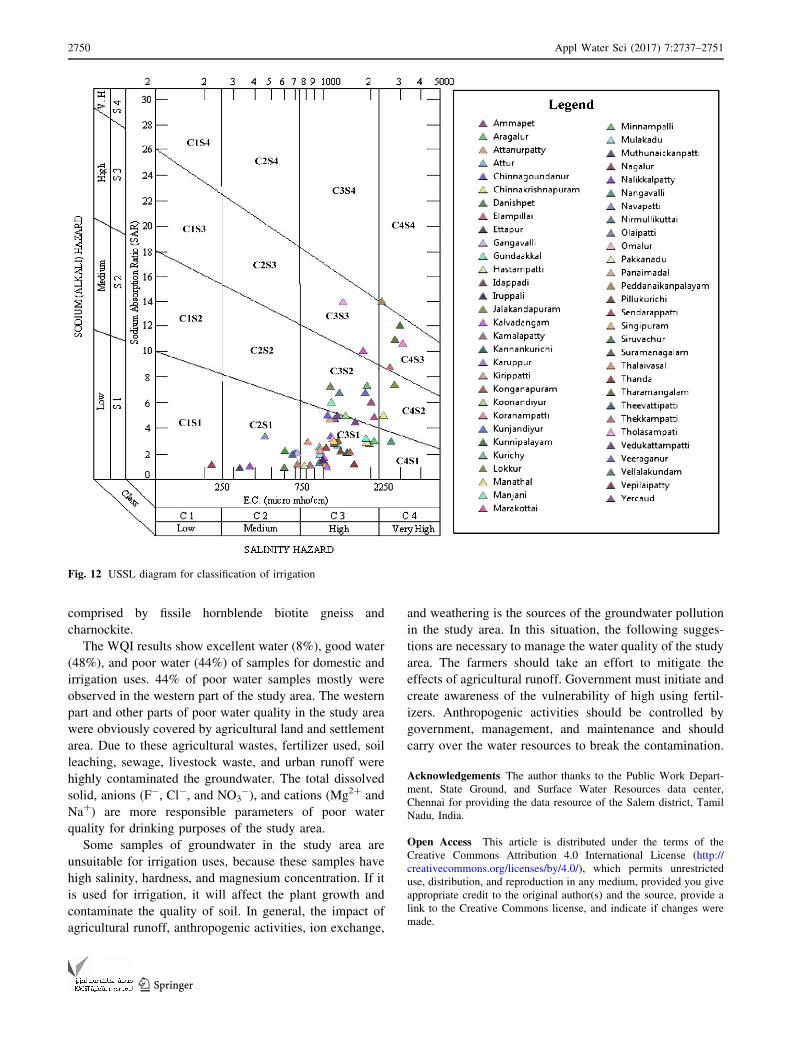
Sodium adsorption ratio (SAR) USSL plot of the study
area is given in Fig. 12. A high salt concentration in water
leads to formation of saline soil and high sodium concen-
tration may cause the development of an alkaline soil
(Tiwari and Singh, 2014). On the basis of SAR value, water
is classified into low (SAR\6), medium (SAR 6–12), high
(SAR 12–18), and very high (SAR[18) alkali waters
(Tiwari et al. 2016a). The SAR in the study area ranges
from 1 to 15 (Table 2). According to USSL diagram,
Nagalur village falls below the C1S1 level. Kunjandiyur,
Navapatti, Ettapur, Siruvachur, Gangavalli, Yercaud,
Danishpet, Theevattipatti, and Thekkampatti fall below the
C2S1 level, and these categories are indicating that good-
to-permissible quality of water for irrigation uses with little
danger of development of exchangeable sodium and
salinity (Tiwari et al. 2016a). C3S2 level covers Min-
nampalli, Nirmullikuttai, Veeraganur, Manjani, Ammapet,
Lokkur, Sendarappatti, and Koonandiyur. C4S1 and C4S4
levels cover the Nangavalli and Peddanaikanpalayam,
respectively. The villages Elampillai, Kunnipalayam,
Koranampatti, and Thramangalam fall under the C4S3
level, and the villages Tholasampatti and Marakottai fall
under the C3S3 level. The Jalakandapuram and Chin-
nakrishnapuram villages fall under the C4S2 level. Rest of
the villages, such as Thanda, Mulakadu, Vepilaipatty,
Vellalakundam, Attanurpatty, Kurichy, Singipuram, Tha-
laivasal, Aragalur, Attur, Kirippatti, Nalikkalpatty, Kamala
patty, Suramangalam, Kannankurichi, Hastampatti, Kal-
vadangam, Irupali, Konganapuram, Idappadi, Pillukurichi,
Fig. 10 WQI map for the Salem District, South India
2748 Appl Water Sci (2017) 7:2737–2751
123
Pakkanadu, Karuppur, Omalur, Gundakkal, Manathal,
Olaipatti, Panaimadal, Vedukattampatti, Chinnagoundanur,
and Muthunaickanpatti, fall under the C3S1 levels. The
zones of C4S2 and C3S1 indicate high-to-very high salinity
and low-to-medium alkali water, which are not suitable for
soils with restricted drainage and it requires a special
management for salinity control (Sappa et al. 2014)
Residual sodium carbonate (RSC) RSC is measured to
indicate the sodium hazard in water. Irrigation water hav-
ing[5 RSC value is considered as harmful to the growth
of plants, whereas water having[2.5 RSC value is not
considered suitable for irrigation, and\2.5 RSC value is
considered as suitable for irrigation (Tiwari et al. 2016b).
The study area RSC value ranges from 0 to 9 with the mean
value of 1 (Table 2). Tholasampatti, Tharamangalam, and
Marakottai villages are harmful to growth of plant.
Elampillai, Lokkur, and Manathal villages are considered
as not suitable for irrigation. Rest of the villages are having
RSC value below 2.5, which are suitable for irrigation.
Kelly index (KI) Water with less than 1 Kelly’s index
value indicates suitable for irrigation (Kelley 1940; Paliwal
1967). Kelly index value of study area ranges from 0 to 10
with mean value of 2 (Table 2). The villages Vepilaipatty,
Vellalakundam, Attanurpatty, Ettapur, Singipuram,
Kamalapatty, Yercaud, Nagalur, Kannankurichi, Hastam-
patti, Kalvadangam, Iruppali, Konganapuram, Idappadi,
Pakkanadu, Danishpet, Karuppur, and Thekkampatti (30%)
have good quality of groundwater for irrigation purposes.
Rest of the (70%) samples are not suitable for irrigation
purposes based on KI value.
Magnesium hazard (MH) The excess amount of Mg in
the groundwater affects the quality of soil, resulting in poor
agricultural returns (Tiwari et al. 2016b). Magnesium
hazard in groundwater[50 is considered as harmful and
unsuitable for irrigation use (Szabolcs and Darab 1964).
The study area MH value ranges from 23 to 89 with a mean
value of 66 (Table 2). Mulakadu, Vepilaipatty, Ettapur,
Thalaivasal, Manjani, Peddanaikanpalayam, Kamalapatty,
Yercaud, Nagalur, and Lokkur have a suitability of irri-
gation water. Rest of the (83%) samples are not suitable for
irrigation purposes based on MH value.
Conclusion
Water chemistry of the Salem district highly reflects the
primary sources from weathering of rocks and its minerals,
with secondary dominance of anthropogenic activities. The
results of the investigation show that the following types of
water dominates in the Salem district were calcium chlo-
ride type (4%), magnesium bicarbonate type (18%),
sodium chloride type (27%), and mixed type of water
(51%). Rock water interaction is the main sources of the
chemical composition, and the study area predominantly
Fig. 11 Wilcox (1955) diagram for classification of groundwater based on EC and Na%
Appl Water Sci (2017) 7:2737–2751 2749
123
comprised by fissile hornblende biotite gneiss and
charnockite.
The WQI results show excellent water (8%), good water
(48%), and poor water (44%) of samples for domestic and
irrigation uses. 44% of poor water samples mostly were
observed in the western part of the study area. The western
part and other parts of poor water quality in the study area
were obviously covered by agricultural land and settlement
area. Due to these agricultural wastes, fertilizer used, soil
leaching, sewage, livestock waste, and urban runoff were
highly contaminated the groundwater. The total dissolved
solid, anions (F-, Cl-, and NO3-), and cations (Mg2? and
Na?) are more responsible parameters of poor water
quality for drinking purposes of the study area.
Some samples of groundwater in the study area are
unsuitable for irrigation uses, because these samples have
high salinity, hardness, and magnesium concentration. If it
is used for irrigation, it will affect the plant growth and
contaminate the quality of soil. In general, the impact of
agricultural runoff, anthropogenic activities, ion exchange,
and weathering is the sources of the groundwater pollution
in the study area. In this situation, the following sugges-
tions are necessary to manage the water quality of the study
area. The farmers should take an effort to mitigate the
effects of agricultural runoff. Government must initiate and
create awareness of the vulnerability of high using fertil-
izers. Anthropogenic activities should be controlled by
government, management, and maintenance and should
carry over the water resources to break the contamination.
Acknowledgements The author thanks to the Public Work Depart-
ment, State Ground, and Surface Water Resources data center,
Chennai for providing the data resource of the Salem district, Tamil
Nadu, India.
Open Access This article is distributed under the terms of the
Creative Commons Attribution 4.0 International License (http://
creativecommons.org/licenses/by/4.0/), which permits unrestricted
use, distribution, and reproduction in any medium, provided you give
appropriate credit to the original author(s) and the source, provide a
link to the Creative Commons license, and indicate if changes were
made.
Fig. 12 USSL diagram for classification of irrigation
2750 Appl Water Sci (2017) 7:2737–2751
123
References
Ahamed AJ, Ananthakrishnan S, Loganathan K, Manikandan K
(2013) Assessment of groundwater quality for irrigation use in
Alathur block, Perambalur district, Tamilnadu, South India. Appl
Water Sci. 3:763–771
Basavarajappa HT, Manjunatha MC (2015) Groundwater quality
analysis in Precambrian rocks of Chitradurga District, Kar-
nataka, India using Geo-informatics Technique. Aquatic Proce-
dia 4:1354–1365
Cai C, Li W, Zeng F (1997) Water–rock interaction in Tarim basin:
constraints from oilfield water geochemistry. Chin J Geochem
16(4):289–303
Florence PL, Raj AP, Ramachandramoorthy T (2012) Water quality
index and correlation study for the assessment of water quality
and its parameters of Yercaud Taluk, Salem District, Tamil
Nadu, India. Chem Sci Trans 1(1):139–149
Florence PL, Raj AP, Ramachandramoorthy T (2013) Ground water
quality assessment of Gangavalli taluk, Salem district, Tamil
Nadu, India using multivariate statistical techniques. IRACST 3
(1)
Guettaf M, Maoui A, Ihdene Z (2014) Assessment of water quality: a
case study of the Seybouse River (North East of Algeria). Appl
Water Sci. doi:10.1007/s13201-014-0245-z
Haritash AK, Gaur S, Garg S (2014) Assessment of water quality and
suitability analysis of River Ganga in Rishikesh. Appl Water Sci,
India. doi:10.1007/s13201-014-0235-1
Kelley WP (1940) Permissible composition and concentration of
irrigation water. Proc Am Soc Civ Eng 66:607–613
Krishnaraj S, Kumar S, Elango KP (2015). Spatial analysis of
groundwater quality using geographic information system—a
case study. IOSR 9(2):01–06
Kumar VS, Amarender B, Dhakate R, Sankaran S, Kumar KR (2014)
Assessment of groundwater quality for drinking and irrigation
use in shallow hard rock aquifer of Pudunagaram, Palakkad
District Kerala. Appl Water Sci. doi:10.1007/s13201-014-0214-6
Kumar SK, Logeshkumaran A, Magesh NS, Godson S, Chandrasekar
N (2015) Hydro-geochemistry and application of water quality
index (WQI) for groundwater quality assessment, Anna Nagar,
part of Chennai city, Tamil Nadu, India. Appl Water Sci
5:335–343
Lozano R, Naghavi M, Foreman K, Lim S, Shibuya K, Aboyans V,
Abraham J, Adair T, Aggarwal R, Ahn SY, Murray JL (2012)
Global and regional mortality from 235 causes of death for 20
age groups in 1990 and 2010: a systematic analysis for the
Global Burden of Disease Study 2010. Lancet
380(9859):2095–2128
Mishra PC, Patel RK (2001) Study of the pollution load in the
drinking water of Rairangpur, a small tribal dominated town of
North Orissa. Indian J Environ Ecoplan 5:293–298
Napacho ZA and Manyele SV (2010) Quality assessment of drinking
water in Temeke district (part II): characterization of chemical
parameters. AJEST 4(11):775–789
Paliwal KV (1967) Effect of gypsum application on the quality of
irrigation waters. Madras Agric J 59:646–647
Poroshin VD, Khaninak VP (2000) Rock-water Interaction during the
Exploitation of Oil Pools in Subsalt and Intersalt Rocks: the
Pripyat Depression as an Example. Lithol Min Resour
35(5):484–492
Qiyan F, Baoping H (2002) Hydro geochemical simulation of water–
rock interaction under water flood recovery in reniqu oilfield,
Hebei province, China. Chin J Geochem 21(2)
Rajaveni SP, Brindha K, Elango L (2015) Geological and geomor-
phological controls on groundwater occurrence in a hard rock
regions. Appl Water Sci. doi:10.1007/s13201-015-0327-6
Rosanoff A (2013) Changing crop magnesium concentrations: impact
on human health. Plant Soil 368(1–2):139–153
Santhosh P, Revathi D (2014) Hydrogeochemical analysis of gorund
water parameters in Coimbatore District, Tamil Nadu, India. Res
J Chem Environ Sci 2(2):89–93
Sappa G, Ergul S, Ferranti F (2014) Water quality assessment of
carbonate aquifers in southern Latium region, Central Italy: a
case study for irrigation and drinking purposes. Appl Water Sci.
4:115–128
Shouting Z, Pengda Z, Zhanzhang X, Minghua Z (2001) Water/Rock
interactions and changes in Chemical composition during Zeolite
Mineralization. Chin J Geochem 20(3)
Singh PK, Tiwari AK, Panigarhy BP, Mahato MK (2013) Water
quality indices used for water resources vulnerability assessment
using GIS technique: a review. Int J Earth Sci Eng
6(6–1):1594–1600
Singh N, Verma KG, Verma P, Sidhu GK, Sachdeva S (2014a) A
comparative study of fluoride ingestion levels, serum thyroid
hormone and TSH level derangements, dental fluorosis status
among school children from endemic and non-endemic fluorosis
areas. Springer Plus 3:7
Singh UV, Abhishek A, Singh KP, Dhakate R, Singh NP (2014b)
Groundwater quality appraisal and its hydrochemical character-
ization in Ghaziabad (a region of indo-gangetic plain), Uttar
Pradesh, India. Appl Water Sci. 4:145–157
Srinivasamoorthy K, Nanthakumar C, Vasanthavigar M, Vijayaragha-
van K, Rajivgandhi R, Chidambaram S, Anandhan P, Manivan-
nan R, Vasudevan S (2011) Groundwater quality assessment
from a hard rock terrain, Salem district of Tamilnadu, India.
Arab J Geosci 4:91–102
Szabolcs I, Darab C (1964) The influence of irrigation water of high
sodium carbonate content of soils. In: Proceedings of 8th
international congress of ISSS, transmission, vol 2, pp 803–812
Tiwari AK, Singh AK (2014) Hydrogrochemical investigation and
groundwater qualtiy assessment of Pratapgarh District, Uttar
Pradesh. J Geol Soc India 83(3):329–343
Tiwari AK, Singh AK, Singh AK, Singh MP (2015) Hydrogeochem-
ical analysis and evaluation of surface water quality of Pratap-
garh district, Uttar Pradesh, India. Appl Water Sci. doi:10.1007/
s13201-015-0313-z
Tiwari AK, Singh PK, Mahato MK (2016a) Environmental geo-
chemistry and a quality assessment of mine water of the West
Bokaro Coalfield, India. Mine Water Environ. doi:10.1007/
s10230-015-0382-0
Tiwari AK, Maio MD, Singh PK, Singh AK (2016b) Hydrogeo-
chemical characterization and groundwater quality assessment in
a coal mining area, India. Arab J Geosci 9(3):1–17
Vasanthavigar M, Srinivasamoorthy K, Vijayaragavan K, Gandhi RR,
Chidambaram S, Anandhan P, Manivannan R, Vasudevan S
(2009) Application of water quality index for groundwater
quality assessment: Thirumanimuttar sub-basin Tamilnadu.
Environ Monit Assess, India. doi:10.1007/s10661-009-1302-1
WHO (World Health Organization) (2006) Guideline for drinking
water quality. Water quality parameters and drinking water
standards—2012 (IS: 10500)
Appl Water Sci (2017) 7:2737–2751 2751
123


![Groundwater Risk Assessment Model (GRAM): Groundwater …...Groundwater Risk Assessment Model (GRAM): Groundwater ... [15–19]. Such an approach requires modeling of pollutant transport](https://img.pdfslide.us/doc/110x75/5f0d13147e708231d4388d71/groundwater-risk-assessment-model-gram-groundwater-groundwater-risk-assessment.jpg)