Embed Size (px)
Citation preview

International Journal of the Physical Sciences Vol. 6(18), pp. 4441-4449, 18 August, 2011 Available online at http://www.academicjournals.org/IJPS DOI: 10.5897/IJPS10.300 ISSN 1992 - 1950 ©2011 Academic Journals Full Length Research Paper
Groundwater quality assessment of Labuan Island
Hossein Moayedi1*, Bujang B. K. Huat1, Afshin Asadi1, Sina Kazemian2 and Thamer Ahmad Mohammad Ali1
1Department of Civil Engineering, University Putra Malaysia, Serdang, Selangor, Malaysia.
2Department of Civil Engineering, Bojnourd Branch, Islamic Azad University, Bojnourd, Iran.
Accepted 21 March, 2011
Groundwater is known as an important source of water supply due to its relatively low susceptibility to pollution in comparison to surface water, and its large storage capacity (USEPA, 1985). It should be mentioned that water pollution is any physical, chemical or biological change in the quality of water that has a harmful effect on any living thing that drinks, uses or lives in it. When humans drink polluted water, it often has serious effects on their health. Water pollution can also make water unsuitable for the desired use. In the present research, different water quality parameters were observed from the different monitoring wells through the Labuan Island. Then by interpolation between the available data, the maps of the different water quality parameters were observed. Each map was classified based on the Malaysia water quality standard, and the results clearly showed those areas which are susceptible to groundwater contamination. Key words: Water pollution, Labuan Island, GIS, groundwater quality, monitoring wells.
INTRODUCTION Groundwater is one of the sources of clean water, other than fresh river water and rain available in Malaysia; however, usage of groundwater is still very low. In rural areas, groundwater is presumed to be a reliable source of portable water in contradiction to those in big cities or town where groundwater often contain harmful toxic materials that are being polluted (Lee et al., 1999). The quality of groundwater is generally under a considerable potential of contamination, especially in agriculture-dominated areas with intense activities that involve the use of fertilizers and pesticides. The issue of protection of groundwater against pollution is of crucial significance (Buselli and Lu, 2001).
Contamination of groundwater often occur in places where the groundwater table is shallow and activities on-going at that particular area contributes to leaching of contamination to groundwater. This normally happens in landfill areas or industries, especially metal plating industries, where a lot of produced water is channelled out into the surface water which will eventually infiltrate into the groundwater (Mahadevan and Rishnaswamy, 1984).
The main objective of this research is not only to assess *Corresponding author. E-mail: [email protected].
the microbiological quality of groundwater resources in Labuan Island, but to also investigate the chemical quality parameters of groundwater. Then after assessing the adequacy of the chemical quality of drinking-water, a comparison of the results of water quality analysis with guideline values was done. For additives (that is, chemicals derived primarily from chemicals and materials used in the distribution and production of drinking-water), emphasis is placed on the direct control of the quality of these products. The main objective of this study is to evaluate groundwater quality of Labuan Island, located in the south of Malaysia, using GIS. Regarding this method, several maps from different contaminants were produced and also considered in water quality assessment of the study area. LITERATURE REVIEW Investigation of the profiles of dissolved oxygen (DO) concentrations and biochemical oxygen demand (BOD), which are able to clarify ground water quality problems, have attracted considerable attention in recent years. For example, wastes discharged into a stream may result in undesirable effects in the aquatic environment. Furthermore, a certain standard of water quality of streams
4442 Int. J. Phys. Sci. is needed in order to sustain the life of aquatic plants and vertebrates. The DO and BOD concentrations as well as coliform counts have been commonly used as measures of water quality. They are of special concern in the organically polluted natural stream. Moreover, the most commonly related problems to groundwater quality are as follows (Almasri and Kaluarachchi, 2004; Buselli and Lu, 2001; Freifeld et al., 2009; Lee et al., 1999; Mahadevan and Rishnaswamy, 1984): i) Water-soluble substances that are dumped, spilled, spread, or stored on the land surface may be eventually infiltrated. ii) Substances that are deposited or stored in the ground above the water table. iii) Materials that are stored, disposed of, or extracted from below the water table. Many of the contamination problems related to these activities are highly complex, and some are not well understood. As an example, the quality of groundwater is affected by land use and waste disposal. One major source of contamination is the storage of waste materials in excavations, such as pits or landfills and mines (Asadi et al., 2009, 2010; Moayedi et al., 2011a, b, c). iv) Groundwater can also become contaminated by the disposal of fluids through wells and, in limestone terrains, through sink holes directly into aquifers. Likewise, infiltration of contaminated surface water has caused groundwater contamination in several places. Irrigation tends to increase the mineral content of both groundwater and surface. The degree of severity in cases, such as these, is related to the hydrologic properties of the aquifers, the amount and type of waste, disposal techniques, and climate. v) Pumping is another cause of groundwater quality deterioration, which may precipitate the migration of more mineralized water from the surrounding strata to the well. In coastal areas, pumping has caused seawater to invade fresh-water aquifers. In some parts of Coastal West Florida, wild-flowing, abandoned artesian wells have salted and consequently ruined large areas of formerly fresh or slightly brackish aquifers. vi) The water quality parameters selected for the assessment and monitoring, include: Ammoniacal nitrogen (NH4-N or Am-N), BOD, chemical oxygen demand (COD), DO, turbidity, faecal coliform counts (FCC), total suspended solids (TSS), total coliform counts (TCC), heavy metals, etc. Some of the parameters are categorized and are subsequently described. Chemical parameters Some of the chemical parameters which can cause groundwater contamination are temperature, pH value, DO, color (Hazen), turbidity (NTU) and conductivity, as well as salinity, TSS, total dissolved solids, TDS, BOD, chemical oxygen demand (COD), ammoniacal nitrogen
(NH4-N or Am-N), potassium, nitrate nitrogen, heavy metals, and oil and grease (Almasri and Kaluarachchi, 2007; Buselli and Lu, 2001; Colten, 1998; Freifeld et al., 2009; Homoncik et al., 2010; Ma et al., 2009; Stone et al., 2010; Tijani, 2009; Zhao et al., 2007). Microbiological parameters Some of the microbiological parameters which significantly caused groundwater to be polluted are FCC and TCC (Falcão et al., 1993; Olaoye and Onilude, 2009). Pesticides Chlorinated, Glyphosphate, Paraquat and Methamidaphos are common tests carried out to know the level of agrochemical pollution (Cerejeira et al., 2003; Hu et al., 1999). MATERIALS AND METHODS Water quality standard The classification of water quality is made according to the Department of Environment's (DOE) National Water Quality Standards for Malaysia (NWQSM). The NWQSM has three elements: (1) the designated uses assigned to waters (for example, swimming, the propagation and protection of aquatic life and drinking), (2) the thresholds or criteria that protect humans and fish from exposure to levels of pollution that may cause adverse effects, and (3) the anti-degradation policy, intended to prevent waters currently in degraded condition from further deteriorating, and minimizing deterioration of high quality waters (Almasri and Kaluarachchi, 2004; Mahadevan and Krishnaswamy, 1984).
The water quality parameters selected for classification are shown in Table 1. The concentration limits for various parameters in the different classes of the NWQSM are also shown. The NWQSM operates with six classes of water quality, namely: Class I, Class HA, Class IB, Class III, Class IV and Class V. Sources of ground water pollution As mentioned earlier, water pollution is usually caused by human activities. Different human sources add to the pollution of water. There are two types of sources: nonpoint and point sources. Point sources discharge pollutants at specific locations through sewers or pipelines into the surface water, while nonpoint sources are sources that cannot be traced to a single site of discharge. Examples of point sources are: factories, sewage treatment plants, oil wells, underground mines, oil tankers and agriculture, while examples of nonpoint sources are: acid deposition from the air, traffic, pollutants that are spread through rivers and those that enter the water through groundwater. Nonpoint pollution is hard to control because the perpetrators cannot be traced (Almasri and Kaluarachchi, 2004; Almasri and Kaluarachchi, 2005; Milovanovic, 2007; Trowsdale and Lerner, 2007). On the one hand, saltwater encroachment associated with over drafting of aquifers or natural leaching from natural occurring deposits are natural sources of groundwater pollution. The main concern of this study over groundwater contamination has been centered on pollution associated with human activities. Human groundwater contamination can be
related to waste disposal (private sewage disposal systems, land disposal of solid waste, municipal wastewater, wastewater impoundments, land spreading of sludge, brine disposal from the petroleum industry, mine wastes, deep-well disposal of liquid wastes, animal feedlot wastes and radioactive wastes) or not directly related to waste disposal (accidents, certain agricultural activities, mining, highway deicing, acid rain, improper well maintenance and construction, road salt) (He et al., 2006; Ma et al., 2009; Stone et al., 2010; Asadi et al. 2011a, b, c, d, e; Huat et al., 2011a, b; Moayedi et al., 2011d). Research area Labuan Island is located in the South-eastern part of Malaysia in
N07.45815 ′′′�
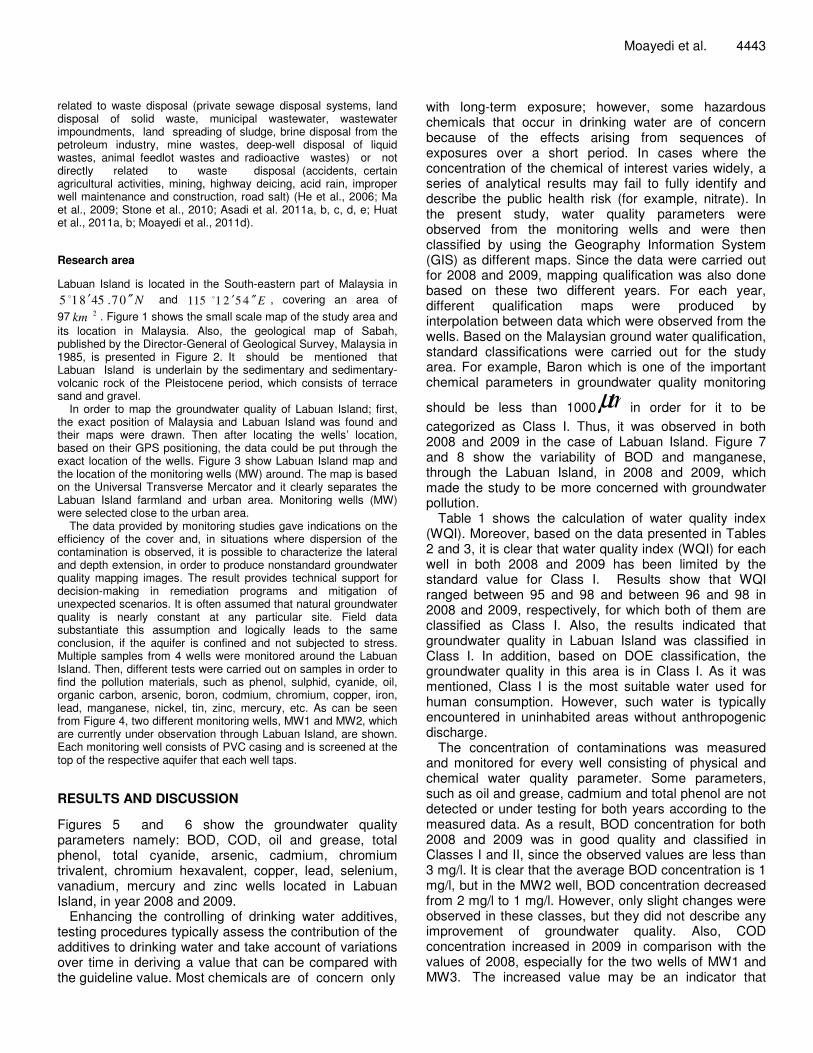
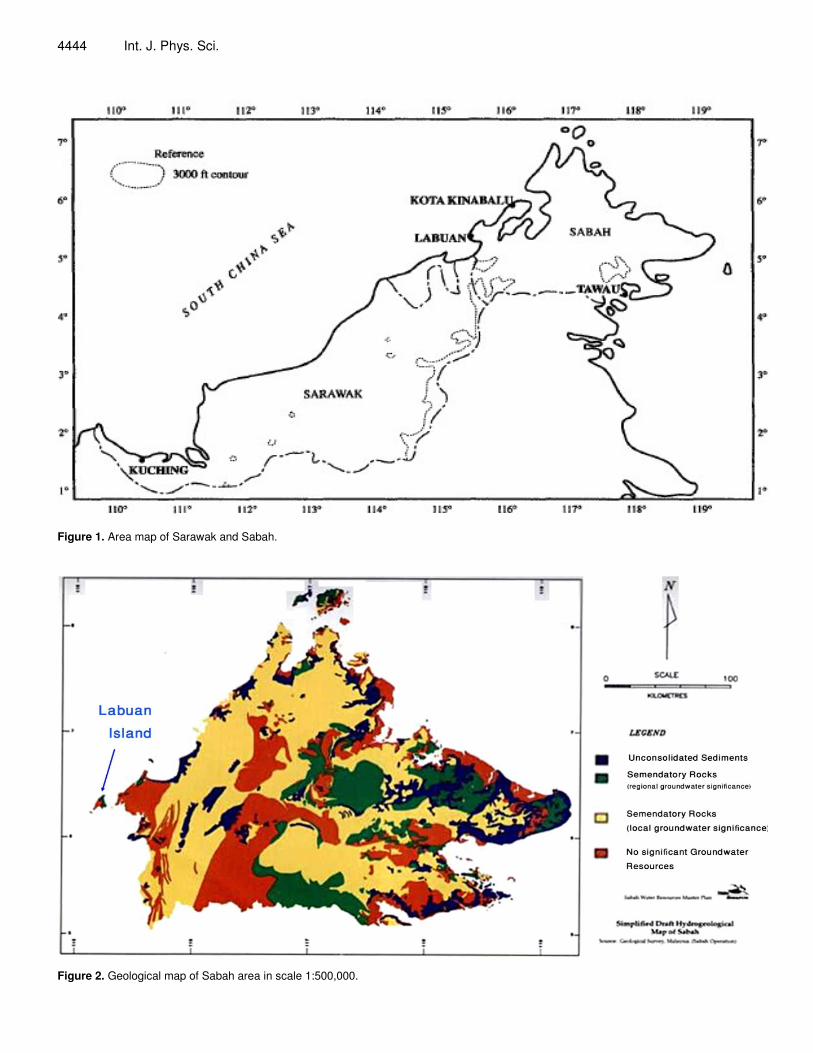
and E4521115 ′′′� , covering an area of 97 2km . Figure 1 shows the small scale map of the study area and its location in Malaysia. Also, the geological map of Sabah, published by the Director-General of Geological Survey, Malaysia in 1985, is presented in Figure 2. It should be mentioned that Labuan Island is underlain by the sedimentary and sedimentary-volcanic rock of the Pleistocene period, which consists of terrace sand and gravel.
In order to map the groundwater quality of Labuan Island; first, the exact position of Malaysia and Labuan Island was found and their maps were drawn. Then after locating the wells’ location, based on their GPS positioning, the data could be put through the exact location of the wells. Figure 3 show Labuan Island map and the location of the monitoring wells (MW) around. The map is based on the Universal Transverse Mercator and it clearly separates the Labuan Island farmland and urban area. Monitoring wells (MW) were selected close to the urban area.
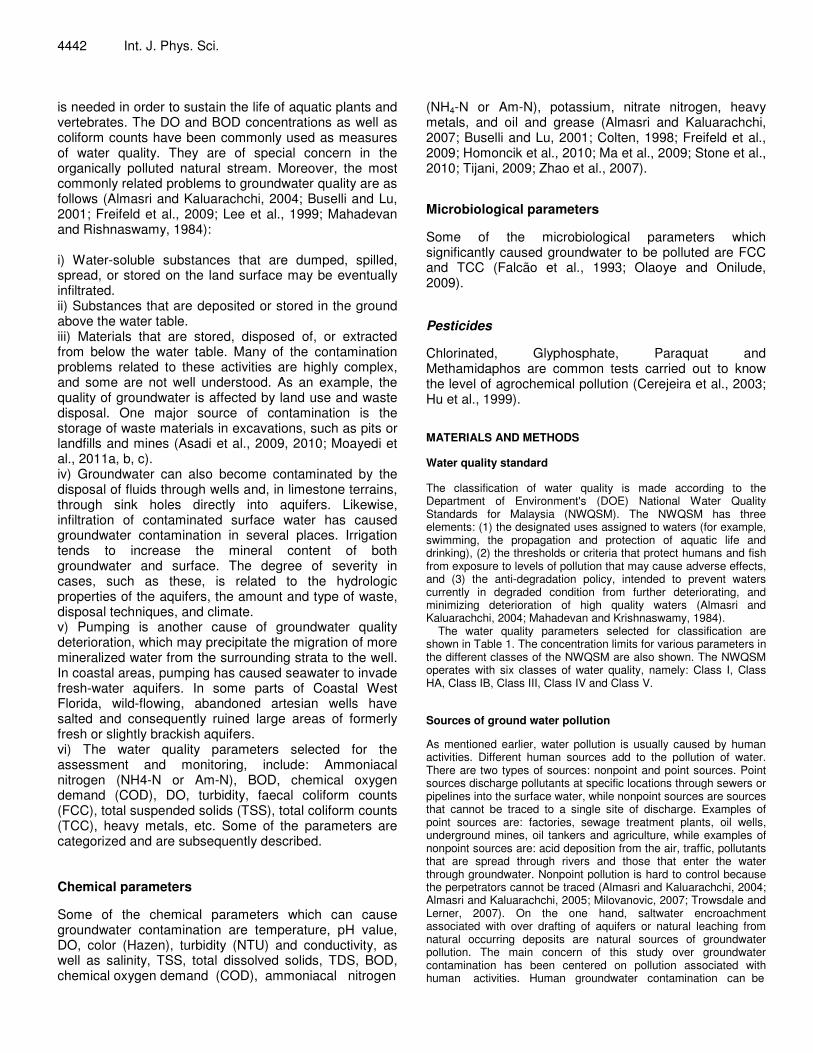
The data provided by monitoring studies gave indications on the efficiency of the cover and, in situations where dispersion of the contamination is observed, it is possible to characterize the lateral and depth extension, in order to produce nonstandard groundwater quality mapping images. The result provides technical support for decision-making in remediation programs and mitigation of unexpected scenarios. It is often assumed that natural groundwater quality is nearly constant at any particular site. Field data substantiate this assumption and logically leads to the same conclusion, if the aquifer is confined and not subjected to stress. Multiple samples from 4 wells were monitored around the Labuan Island. Then, different tests were carried out on samples in order to find the pollution materials, such as phenol, sulphid, cyanide, oil, organic carbon, arsenic, boron, codmium, chromium, copper, iron, lead, manganese, nickel, tin, zinc, mercury, etc. As can be seen from Figure 4, two different monitoring wells, MW1 and MW2, which are currently under observation through Labuan Island, are shown. Each monitoring well consists of PVC casing and is screened at the top of the respective aquifer that each well taps. RESULTS AND DISCUSSION
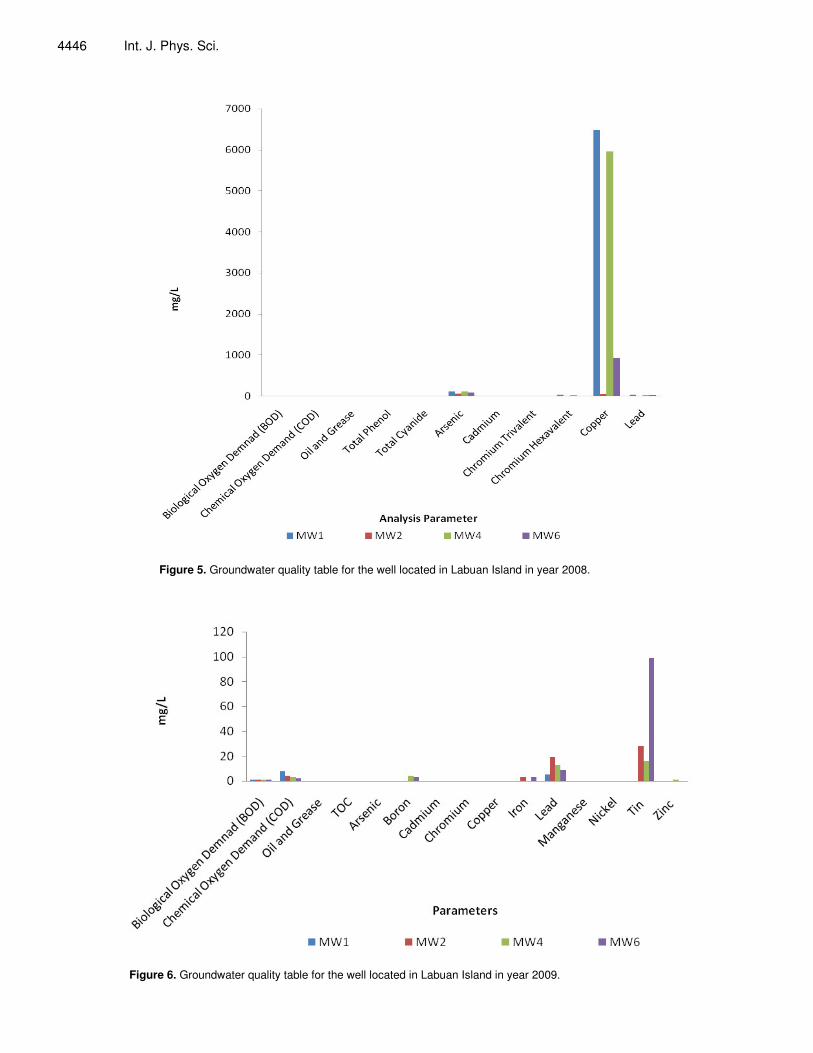
Figures 5 and 6 show the groundwater quality parameters namely: BOD, COD, oil and grease, total phenol, total cyanide, arsenic, cadmium, chromium trivalent, chromium hexavalent, copper, lead, selenium, vanadium, mercury and zinc wells located in Labuan Island, in year 2008 and 2009.
Enhancing the controlling of drinking water additives, testing procedures typically assess the contribution of the additives to drinking water and take account of variations over time in deriving a value that can be compared with the guideline value. Most chemicals are of concern only
Moayedi et al. 4443 with long-term exposure; however, some hazardous chemicals that occur in drinking water are of concern because of the effects arising from sequences of exposures over a short period. In cases where the concentration of the chemical of interest varies widely, a series of analytical results may fail to fully identify and describe the public health risk (for example, nitrate). In the present study, water quality parameters were observed from the monitoring wells and were then classified by using the Geography Information System (GIS) as different maps. Since the data were carried out for 2008 and 2009, mapping qualification was also done based on these two different years. For each year, different qualification maps were produced by interpolation between data which were observed from the wells. Based on the Malaysian ground water qualification, standard classifications were carried out for the study area. For example, Baron which is one of the important chemical parameters in groundwater quality monitoring
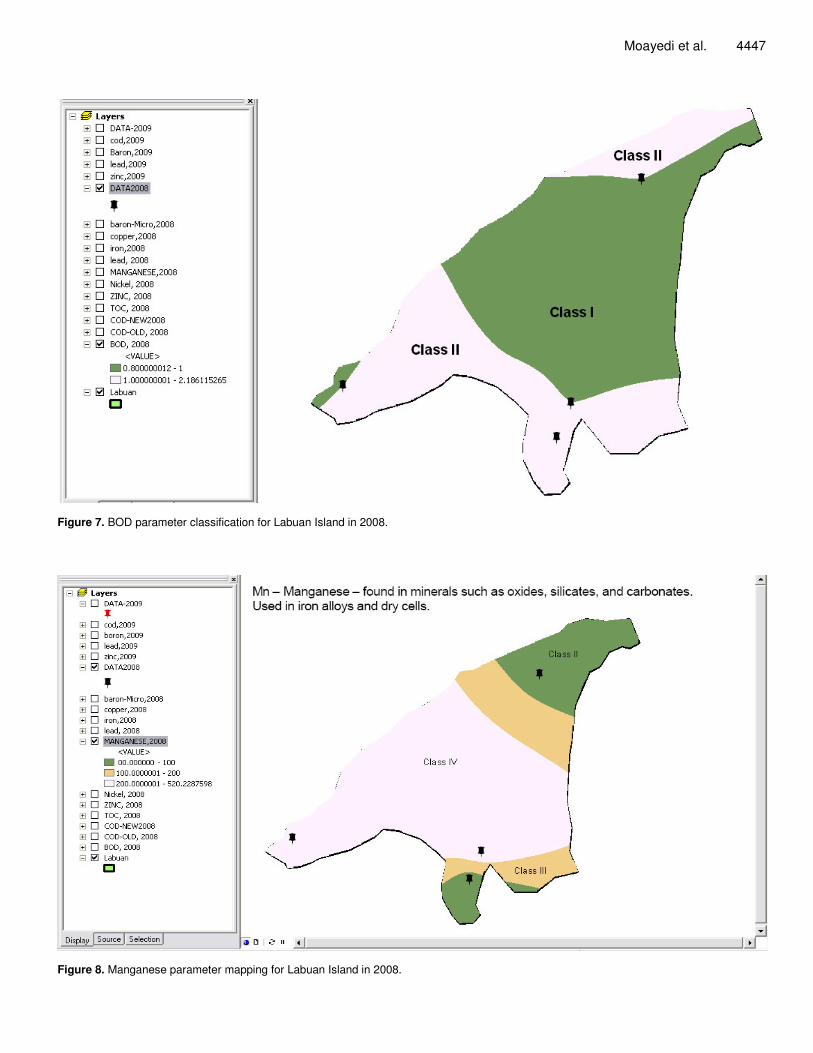
should be less than 1000 mµ in order for it to be categorized as Class I. Thus, it was observed in both 2008 and 2009 in the case of Labuan Island. Figure 7 and 8 show the variability of BOD and manganese, through the Labuan Island, in 2008 and 2009, which made the study to be more concerned with groundwater pollution.
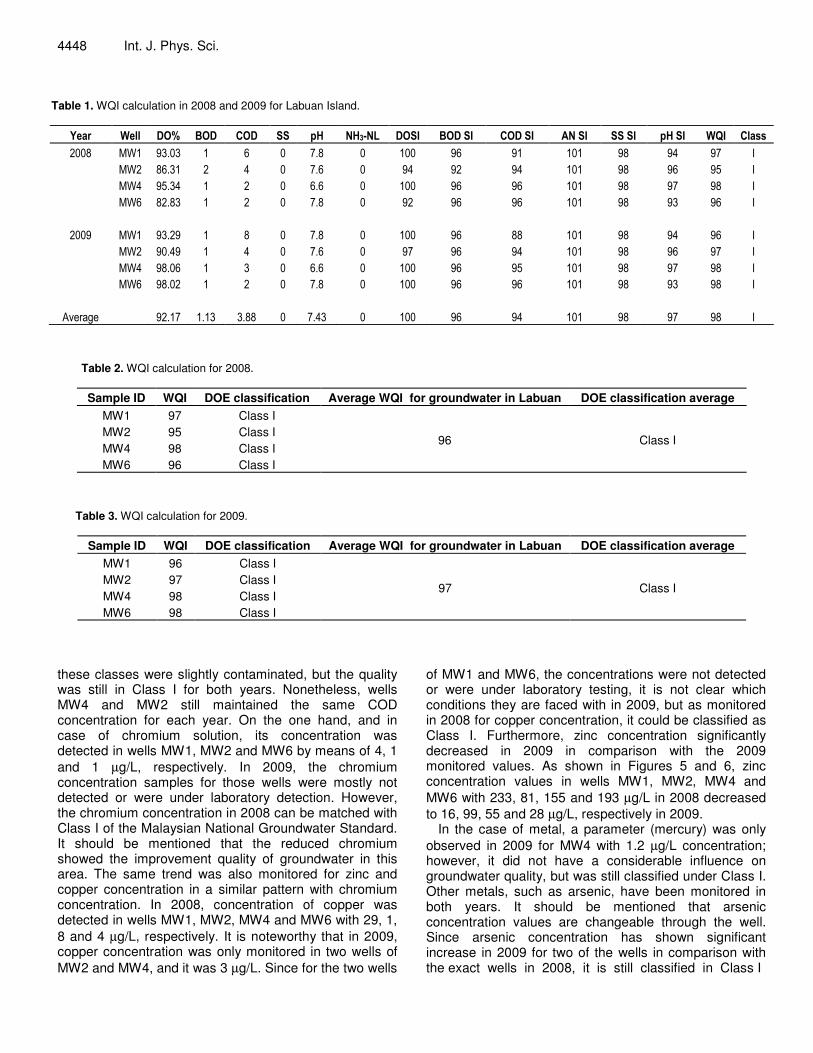
Table 1 shows the calculation of water quality index (WQI). Moreover, based on the data presented in Tables 2 and 3, it is clear that water quality index (WQI) for each well in both 2008 and 2009 has been limited by the standard value for Class I. Results show that WQI ranged between 95 and 98 and between 96 and 98 in 2008 and 2009, respectively, for which both of them are classified as Class I. Also, the results indicated that groundwater quality in Labuan Island was classified in Class I. In addition, based on DOE classification, the groundwater quality in this area is in Class I. As it was mentioned, Class I is the most suitable water used for human consumption. However, such water is typically encountered in uninhabited areas without anthropogenic discharge.
The concentration of contaminations was measured and monitored for every well consisting of physical and chemical water quality parameter. Some parameters, such as oil and grease, cadmium and total phenol are not detected or under testing for both years according to the measured data. As a result, BOD concentration for both 2008 and 2009 was in good quality and classified in Classes I and II, since the observed values are less than 3 mg/l. It is clear that the average BOD concentration is 1 mg/l, but in the MW2 well, BOD concentration decreased from 2 mg/l to 1 mg/l. However, only slight changes were observed in these classes, but they did not describe any improvement of groundwater quality. Also, COD concentration increased in 2009 in comparison with the values of 2008, especially for the two wells of MW1 and MW3. The increased value may be an indicator that
4444 Int. J. Phys. Sci.
�
Figure 1. Area map of Sarawak and Sabah.
Figure 2. Geological map of Sabah area in scale 1:500,000.

Moayedi et al. 4445
Figure 3. Monitoring wells’ location in Labuan Island (Universal Transverse Mercator).
a- b-
Figure 4. Groundwater monitoring well. a- MW1, b- MW2.
4446 Int. J. Phys. Sci.
Figure 5. Groundwater quality table for the well located in Labuan Island in year 2008.
Figure 6. Groundwater quality table for the well located in Labuan Island in year 2009.
Moayedi et al. 4447
Figure 7. BOD parameter classification for Labuan Island in 2008.
Figure 8. Manganese parameter mapping for Labuan Island in 2008.
4448 Int. J. Phys. Sci.
Table 1. WQI calculation in 2008 and 2009 for Labuan Island.
����� � ���� � � � � � � � � � � � � � � ��� � � � �� � � � �� � � � �� � � � �� � �� � � � �� � � �� � ��� � �
����� � � �� � �� �� �� �� � �� �� ���� � �� � �� ���� � �� � � � � � ��
� � � �� ���� �� � �� � �� �� � � � �� � � ���� � �� � �� � � � ��
� � � � � � � �� �� �� ��� �� ���� � �� � �� ���� � �� � � � � �� ��
� � � �� ���� �� �� �� � �� �� � �� � �� � �� ���� � �� � � � �� ��
�
���� � � � �� � �� � �� �� �� � �� �� ���� � �� ��� ���� � �� � � � �� ��
� � � �� � � � � �� � �� � �� �� � � � � �� � � ���� � �� � �� � � � ��
� � � � � ���� �� � �� ��� �� ���� � �� � � � ���� � �� � � � � �� ��
� � � �� � ���� �� �� �� � �� �� ���� � �� � �� ���� � �� � � � �� ��
� � � � � � � � � � � � � � � �
� � � �� � � � � � ��� � ��� ��� �� � � �� ���� � �� � � ���� � �� � � � � �� ��
Table 2. WQI calculation for 2008. Sample ID WQI DOE classification Average WQI for groundwater in Labuan DOE classification average
MW1 97 Class I
96 Class I MW2 95 Class I MW4 98 Class I MW6 96 Class I
Table 3. WQI calculation for 2009.
Sample ID WQI DOE classification Average WQI for groundwater in Labuan DOE classification average MW1 96 Class I
97 Class I MW2 97 Class I MW4 98 Class I MW6 98 Class I
these classes were slightly contaminated, but the quality was still in Class I for both years. Nonetheless, wells MW4 and MW2 still maintained the same COD concentration for each year. On the one hand, and in case of chromium solution, its concentration was detected in wells MW1, MW2 and MW6 by means of 4, 1 and 1 µg/L, respectively. In 2009, the chromium concentration samples for those wells were mostly not detected or were under laboratory detection. However, the chromium concentration in 2008 can be matched with Class I of the Malaysian National Groundwater Standard. It should be mentioned that the reduced chromium showed the improvement quality of groundwater in this area. The same trend was also monitored for zinc and copper concentration in a similar pattern with chromium concentration. In 2008, concentration of copper was detected in wells MW1, MW2, MW4 and MW6 with 29, 1, 8 and 4 µg/L, respectively. It is noteworthy that in 2009, copper concentration was only monitored in two wells of MW2 and MW4, and it was 3 µg/L. Since for the two wells
of MW1 and MW6, the concentrations were not detected or were under laboratory testing, it is not clear which conditions they are faced with in 2009, but as monitored in 2008 for copper concentration, it could be classified as Class I. Furthermore, zinc concentration significantly decreased in 2009 in comparison with the 2009 monitored values. As shown in Figures 5 and 6, zinc concentration values in wells MW1, MW2, MW4 and MW6 with 233, 81, 155 and 193 µg/L in 2008 decreased to 16, 99, 55 and 28 µg/L, respectively in 2009.
In the case of metal, a parameter (mercury) was only observed in 2009 for MW4 with 1.2 µg/L concentration; however, it did not have a considerable influence on groundwater quality, but was still classified under Class I. Other metals, such as arsenic, have been monitored in both years. It should be mentioned that arsenic concentration values are changeable through the well. Since arsenic concentration has shown significant increase in 2009 for two of the wells in comparison with the exact wells in 2008, it is still classified in Class I
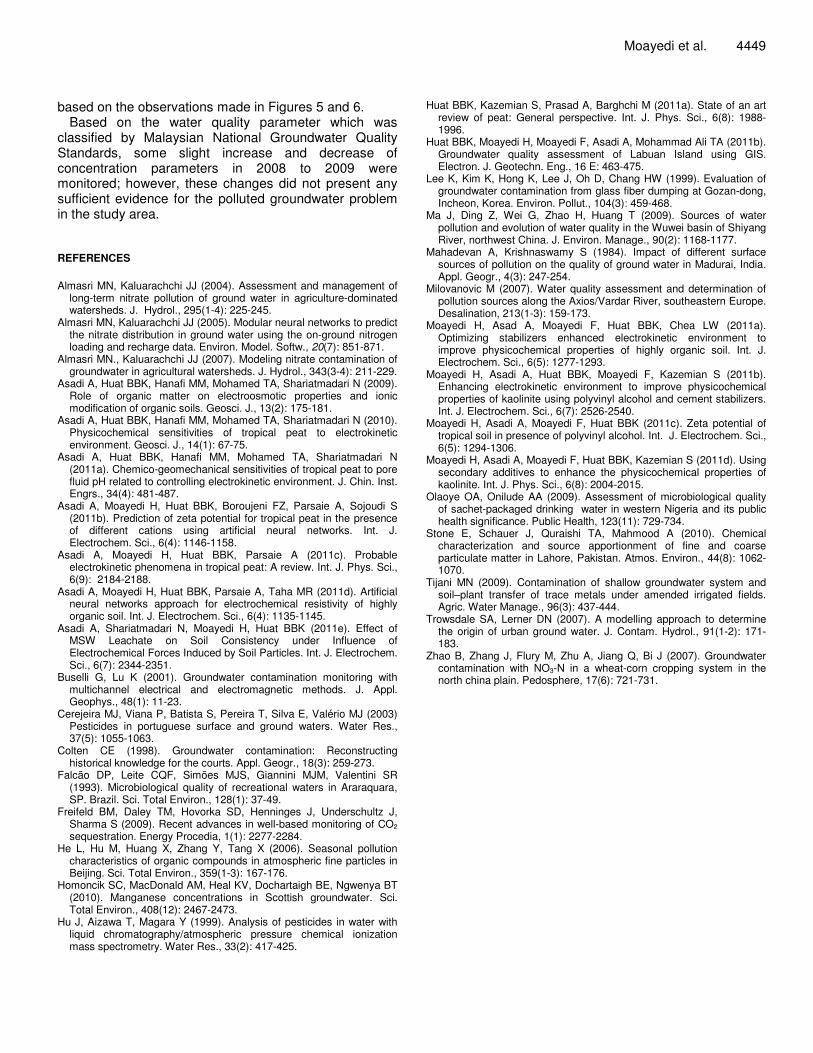
based on the observations made in Figures 5 and 6.
Based on the water quality parameter which was classified by Malaysian National Groundwater Quality Standards, some slight increase and decrease of concentration parameters in 2008 to 2009 were monitored; however, these changes did not present any sufficient evidence for the polluted groundwater problem in the study area. REFERENCES Almasri MN, Kaluarachchi JJ (2004). Assessment and management of
long-term nitrate pollution of ground water in agriculture-dominated watersheds. J. Hydrol., 295(1-4): 225-245.
Almasri MN, Kaluarachchi JJ (2005). Modular neural networks to predict the nitrate distribution in ground water using the on-ground nitrogen loading and recharge data. Environ. Model. Softw., 20(7): 851-871.
Almasri MN., Kaluarachchi JJ (2007). Modeling nitrate contamination of groundwater in agricultural watersheds. J. Hydrol., 343(3-4): 211-229.
Asadi A, Huat BBK, Hanafi MM, Mohamed TA, Shariatmadari N (2009). Role of organic matter on electroosmotic properties and ionic modification of organic soils. Geosci. J., 13(2): 175-181.
Asadi A, Huat BBK, Hanafi MM, Mohamed TA, Shariatmadari N (2010). Physicochemical sensitivities of tropical peat to electrokinetic environment. Geosci. J., 14(1): 67-75.
Asadi A, Huat BBK, Hanafi MM, Mohamed TA, Shariatmadari N (2011a). Chemico-geomechanical sensitivities of tropical peat to pore fluid pH related to controlling electrokinetic environment. J. Chin. Inst. Engrs., 34(4): 481-487.
Asadi A, Moayedi H, Huat BBK, Boroujeni FZ, Parsaie A, Sojoudi S (2011b). Prediction of zeta potential for tropical peat in the presence of different cations using artificial neural networks. Int. J. Electrochem. Sci., 6(4): 1146-1158.
Asadi A, Moayedi H, Huat BBK, Parsaie A (2011c). Probable electrokinetic phenomena in tropical peat: A review. Int. J. Phys. Sci., 6(9): 2184-2188.
Asadi A, Moayedi H, Huat BBK, Parsaie A, Taha MR (2011d). Artificial neural networks approach for electrochemical resistivity of highly organic soil. Int. J. Electrochem. Sci., 6(4): 1135-1145.
Asadi A, Shariatmadari N, Moayedi H, Huat BBK (2011e). Effect of MSW Leachate on Soil Consistency under Influence of Electrochemical Forces Induced by Soil Particles. Int. J. Electrochem. Sci., 6(7): 2344-2351.
Buselli G, Lu K (2001). Groundwater contamination monitoring with multichannel electrical and electromagnetic methods. J. Appl. Geophys., 48(1): 11-23.
Cerejeira MJ, Viana P, Batista S, Pereira T, Silva E, Valério MJ (2003) Pesticides in portuguese surface and ground waters. Water Res., 37(5): 1055-1063.
Colten CE (1998). Groundwater contamination: Reconstructing historical knowledge for the courts. Appl. Geogr., 18(3): 259-273.
Falcão DP, Leite CQF, Simões MJS, Giannini MJM, Valentini SR (1993). Microbiological quality of recreational waters in Araraquara, SP. Brazil. Sci. Total Environ., 128(1): 37-49.
Freifeld BM, Daley TM, Hovorka SD, Henninges J, Underschultz J, Sharma S (2009). Recent advances in well-based monitoring of CO2 sequestration. Energy Procedia, 1(1): 2277-2284.
He L, Hu M, Huang X, Zhang Y, Tang X (2006). Seasonal pollution characteristics of organic compounds in atmospheric fine particles in Beijing. Sci. Total Environ., 359(1-3): 167-176.
Homoncik SC, MacDonald AM, Heal KV, Dochartaigh BE, Ngwenya BT (2010). Manganese concentrations in Scottish groundwater. Sci. Total Environ., 408(12): 2467-2473.
Hu J, Aizawa T, Magara Y (1999). Analysis of pesticides in water with liquid chromatography/atmospheric pressure chemical ionization mass spectrometry. Water Res., 33(2): 417-425.
Moayedi et al. 4449 Huat BBK, Kazemian S, Prasad A, Barghchi M (2011a). State of an art
review of peat: General perspective. Int. J. Phys. Sci., 6(8): 1988-1996.
Huat BBK, Moayedi H, Moayedi F, Asadi A, Mohammad Ali TA (2011b). Groundwater quality assessment of Labuan Island using GIS. Electron. J. Geotechn. Eng., 16 E: 463-475.
Lee K, Kim K, Hong K, Lee J, Oh D, Chang HW (1999). Evaluation of groundwater contamination from glass fiber dumping at Gozan-dong, Incheon, Korea. Environ. Pollut., 104(3): 459-468.
Ma J, Ding Z, Wei G, Zhao H, Huang T (2009). Sources of water pollution and evolution of water quality in the Wuwei basin of Shiyang River, northwest China. J. Environ. Manage., 90(2): 1168-1177.
Mahadevan A, Krishnaswamy S (1984). Impact of different surface sources of pollution on the quality of ground water in Madurai, India. Appl. Geogr., 4(3): 247-254.
Milovanovic M (2007). Water quality assessment and determination of pollution sources along the Axios/Vardar River, southeastern Europe. Desalination, 213(1-3): 159-173.
Moayedi H, Asad A, Moayedi F, Huat BBK, Chea LW (2011a). Optimizing stabilizers enhanced electrokinetic environment to improve physicochemical properties of highly organic soil. Int. J. Electrochem. Sci., 6(5): 1277-1293.
Moayedi H, Asadi A, Huat BBK, Moayedi F, Kazemian S (2011b). Enhancing electrokinetic environment to improve physicochemical properties of kaolinite using polyvinyl alcohol and cement stabilizers. Int. J. Electrochem. Sci., 6(7): 2526-2540.
Moayedi H, Asadi A, Moayedi F, Huat BBK (2011c). Zeta potential of tropical soil in presence of polyvinyl alcohol. Int. J. Electrochem. Sci., 6(5): 1294-1306.
Moayedi H, Asadi A, Moayedi F, Huat BBK, Kazemian S (2011d). Using secondary additives to enhance the physicochemical properties of kaolinite. Int. J. Phys. Sci., 6(8): 2004-2015.
Olaoye OA, Onilude AA (2009). Assessment of microbiological quality of sachet-packaged drinking water in western Nigeria and its public health significance. Public Health, 123(11): 729-734.
Stone E, Schauer J, Quraishi TA, Mahmood A (2010). Chemical characterization and source apportionment of fine and coarse particulate matter in Lahore, Pakistan. Atmos. Environ., 44(8): 1062-1070.
Tijani MN (2009). Contamination of shallow groundwater system and soil–plant transfer of trace metals under amended irrigated fields. Agric. Water Manage., 96(3): 437-444.
Trowsdale SA, Lerner DN (2007). A modelling approach to determine the origin of urban ground water. J. Contam. Hydrol., 91(1-2): 171-183.
Zhao B, Zhang J, Flury M, Zhu A, Jiang Q, Bi J (2007). Groundwater contamination with NO3-N in a wheat-corn cropping system in the north china plain. Pedosphere, 17(6): 721-731.