Embed Size (px)
Citation preview

Geosciences JournalVol. 17, No. 2, p. 183 − 195, June 2013DOI 10.1007/s12303-013-0012-4 ⓒ The Association of Korean Geoscience Societies and Springer 2013
Analyzing groundwater change on a volcanic island caused by the impact of the M9 Sumatra earthquake
ABSTRACT: Changes in groundwater level have been recognizedby the earthquakes at various epicentral distances. The M9 Sumatraearthquake resulted in changes in the groundwater level, electricalconductivity, and temperature in monitoring wells on Jeju Island,South Korea. In regions of different groundwater type (basal, lowerparabasal, upper parabasal, and high-level groundwater), thechanges in the groundwater levels at 25 monitoring wells rangedbetween 4.0 and 49.5 cm; changes in the electrical conductivity atsix monitoring wells ranged between 1 and 27,975 µS/cm; and thechanges in water temperature at three wells ranged between 0.02and 1.37 °C. The irregular groundwater level changes at differentlocations on the island due to the earthquake reflect various inter-actions between hydrological properties and seismological processes.The impact of the earthquake was successfully recognized via transferfunction modeling between the time series of groundwater level andthe tidal oscillation. On the basis of the theoretical aquifer response tothe earthquake, storage coefficient estimates for aquifers, whichcould not be determined from the single-well pumping tests, weredetermined to be within the range of 1.22·10–4–3.51·10–6.
Key words: M9 Sumatra earthquake, groundwater level, transfer func-tion modeling, electrical conductivity, Jeju Island, Republic of Korea
1. INTRODUCTION
The M9 Sumatra earthquake (otherwise known as theSumatra-Andaman Islands earthquake (SAIE) or the 2004Indian Ocean earthquake) occurred in the Indonesian sub-duction zone at 00:58:53.45 UTC (Temps Universel Coordonnéor Coordinated Universal Time, approximately equivalentto Greenwich Mean Time (GMT)) on December 26, 2004.Its epicenter was off the west coast of northern Sumatra,Indonesia, at a depth of 30 km below mean sea level (bmsl).The SAIE (Mw = 9.0) was the largest event since the 1964Good Friday Alaskan earthquake (Mw = 9.2) with a seismicmoment of M0 = 4.0×10²² N-m (Park et al., 2005). Therupture induced by the SAIE extended northwestward along
the Sunda Trench for ~1200 km to the Andaman Islands.The maximum bedrock ground motions for the SAIE weresimulated as 200 cm/s (peak ground velocity, PGV) and 1200cm/s2 (peak ground acceleration, PGA) (Sørensen et al., 2007).Seafloor displacement due to the earthquake triggered adevastating tsunami that struck Sri Lanka and Thailand within2 h of the rupture. The tsunami caused by the SAIE inun-dated coastal villages with waves up to 30 m high andresulted in the death of about 225,000 people in 11 coun-tries, including Indonesia, Sri Lanka, parts of the east coastof India, Bangladesh, Thailand, Myanmar, Malaysia, Maldives,Somalia, Kenya, Tanzania, and Madagascar (Waltham, 2004;Ramanmurthy et al., 2005; Arya et al., 2006; Kench et al.,2006). Seawater intrusion due to the SAIE also induced thedeterioration of groundwater quality in the Andaman andNicobar Islands (Singh, 2008). The change in groundwaterstorage induced by the SAIE in a confined aquifer on theeastern coast of Taiwan was revealed by the spectral relationshipbetween groundwater level and seismograms (Shih, 2009).
To date, numerous studies have been conducted on anom-alous changes in groundwater levels in monitoring wells inassociation with the preseismic, coseismic, and postseismicphases of earthquakes (Grecksch et al., 1999; Tokunaga,1999; King et al., 2000; Montgomery and Manga, 2003;Wang et al., 2004; Caporali et al., 2005; Cutillo and Ge, 2006;Ohno et al., 2006; Itaba and Koizumi, 2007; Ramana et al.,2007; Singh, 2008). Coseismic changes in groundwater leveland streamflow are due to earthquake-induced crustal deforma-tion and ground shaking (Montgomery and Manga, 2003).Postseismic changes in groundwater level possibly reflectsubsurface flow resulting from coseismic changes or per-meability changes (Roeloffs, 1998; Wang et al., 2004). How-ever, preseismic changes in the groundwater level have rarelybeen reported and have provided inconclusive evidence ofan underlying mechanism related to fault deformation orearthquakes (Roeloffs and Quilty, 1997; Koizumi et al.,
Jae-Yeol CheongSe-Yeong Hamm*Sang-Hyun KimSoo-Hyoung Lee
Nam-Chil WooGyoo-Bum Kim
Korea Radioactive Waste Management Corporation, Daejeon 305-353, Republic of KoreaDepartment of Geological Sciences, Pusan National University, Busan 609-735, Republic of KoreaDepartment of Environmental Engineering, Pusan National University, Busan 609-735, Republic of KoreaGroundwater Research Department, Korea Institute of Geoscience and Mineral Resources, Daejeon 305-350, Republic of KoreaDepartment of Earth System Sciences, Yonsei University, Seoul 120-749, Republic of KoreaK-water Institute, Korea Water Resources Corporation, Daejeon 305-730, Republic of Korea
*Corresponding author: [email protected]
184 Jae-Yeol Cheong, Se-Yeong Hamm, Sang-Hyun Kim, Soo-Hyoung Lee, Nam-Chil Woo, and Gyoo-Bum Kim
2004; King et al., 2000). As a result of thrust faulting duringthe 1999 Chi-Chi earthquake (Mw = 7.6), groundwater lev-els changed from falling by 11.10 m to rising by 7.42 m(Chia et al., 2008). Changes in groundwater level also occurredin four wells within 8 km of the epicenter of the small-scaleMerano earthquake (Mw = 4.8) (Caporali et al., 2005). Earth-quakes can alter groundwater supply, as demonstrated bythe examples of Cretan palaces that were abandoned in theLate Minoan period between 1300 and 1700 years BCE(Gorokhovich, 2005).
The response of groundwater levels to the SAIE was evenobserved in Japan, which is located at a distance of morethan 5,000 km from the hypocenter (Kitagawa et al., 2006).
The groundwater level in a monitoring well in Taiwan alsochanged in response to the SAIE (Shih, 2009). This studycharacterizes the effect of the SAIE on groundwater levels,electrical conductivity, and temperature in 28 monitoringwells on Jeju Island, South Korea.
2. GEOLOGY AND HYDROGEOLOGY
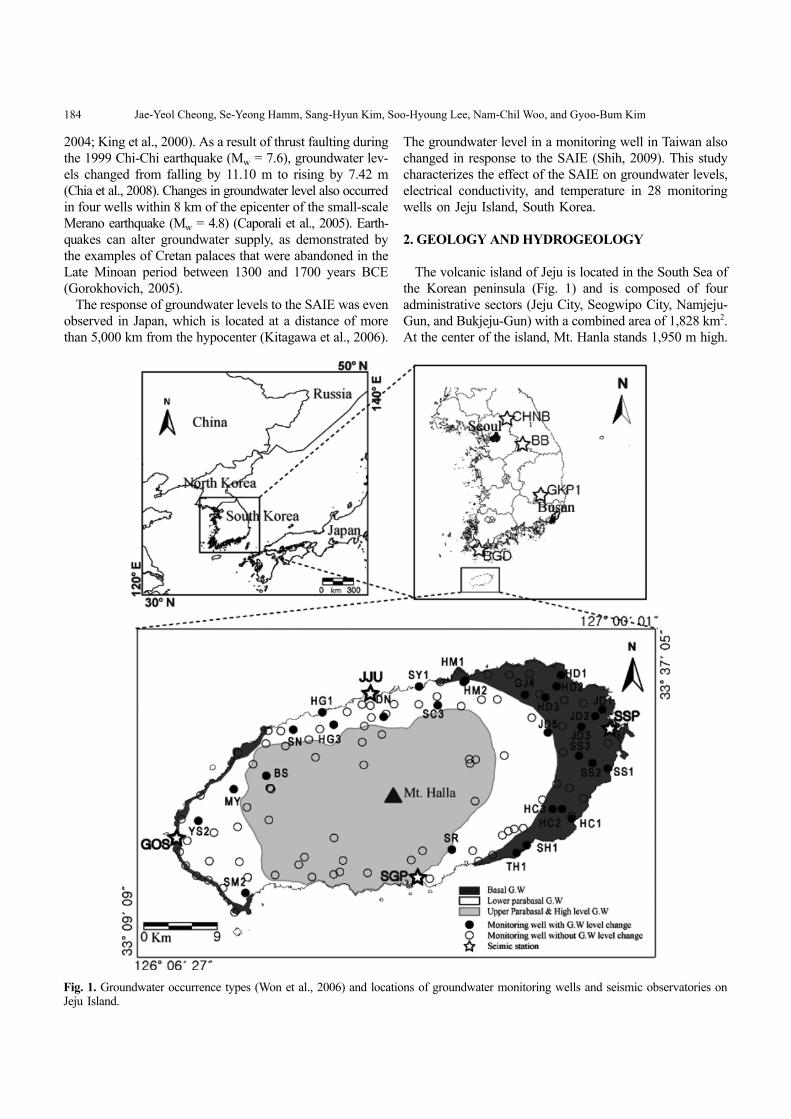
The volcanic island of Jeju is located in the South Sea ofthe Korean peninsula (Fig. 1) and is composed of fouradministrative sectors (Jeju City, Seogwipo City, Namjeju-Gun, and Bukjeju-Gun) with a combined area of 1,828 km2.At the center of the island, Mt. Hanla stands 1,950 m high.
Fig. 1. Groundwater occurrence types (Won et al., 2006) and locations of groundwater monitoring wells and seismic observatories onJeju Island.

Analyzing groundwater change on a volcanic island caused by the impact of the M9 Sumatra earthquake 185
Jeju Island was created by basaltic and trachytic volcanismbetween the Pliocene and Quaternary (Koh et al., 2006). Thegeneral stratigraphy of Jeju Island, from the bottom up, con-sists of basement rocks (tuff and granite), the U Formation(unconsolidated sediments), the Seogwipo Formation, thePyoseolli Basalt Group, older scoria cones, the Tamna For-mation (epiclastic sediments), basaltic dykes, the HallasanTrachybasalt Group, Baegnokdam Trachyte Group, and volca-nic debris-avalanche deposits. Permeable structures in thevolcanic rocks include lava tubes, Sumgol (caves exposed atthe ground surface, through which rainfall directly entersthe subsurface), Gotjawal (unconsolidated aa rubble flow),Oreum (cinder cones or tephra cones), scoria flow deposits,pyroclastic deposits, clinker, fracture zones, crushed zones,and other permeable structures. The lava tubes extend fromone hundred meters to several kilometers, with diameters ofup to several meters.
Jeju Island receives a mean annual rainfall of 1,975 mm.The yearly water budget of Jeju Island amounts to 3.61 bil-lion m3, where 1.22 billion m3 of water is lost to evapo-transpiration and 0.74 billion m3 to direct runoff; 1.65 billion m3
(45% of the annual water budget) is retained as groundwaterrecharge (Jeju Province and Korea Water Resources Cor-poration, 2003). On the other hand, Hahn et al. (1997) esti-mated 44% groundwater recharge relative to the annualwater budget (3.39 billion m3). Consequently, the residentsof Jeju Island use groundwater for most of their water resources,a situation similar to that in the Hawaiian Islands.
Groundwater on Jeju Island is classified as high level,parabasal, or basal based on the level of occurrence (IBDC,1981; Fig. 1). The distribution of basal groundwater is con-siderably more extensive in the eastern coastal area than inthe western coastal area. Transmissivity estimates for thevolcanic rocks on Jeju Island range from 1.44 to 6,212 m2/d(Hamm et al., 2005). The median groundwater levels in thenorthern, southern, eastern, and western areas are 12.61,56.25, 3.13, and 11.35 m, respectively (Won et al., 2006).The groundwater levels may be related to the high altitudeof the Seogwipo Formation in the southern and northernsectors and low altitude, below mean sea level (bmsl), inthe eastern sector.
3. METHODS
3.1. Groundwater Level, Electrical Conductivity, and Temperature Measurements
Groundwater level, electrical conductivity (EC), and tem-perature were monitored at 111 monitoring wells on JejuIsland. While most of the wells for groundwater level mea-surement only reach depths less than 50 m, the wells formonitoring salt-water intrusion were drilled to depths ofover 100 m in order to observe the fresh water–salt waterboundary. The surface elevation of the monitoring wells
ranges from lower than 100 m above mean sea level (amsl)to 400 m amsl. The bottom elevation of the wells rangesfrom less than 50 m below mean sea level (bmsl) to deeperthan 150 m bmsl.
The groundwater datalogger is designed to measure waterlevel, water temperature, and EC at a certain depth belowsea level in well water. The datalogger for monitoring salt-water intrusion was installed around the depth of the freshwater–saltwater interface to detect variations in EC andtemperature as well as water level. The datalogger can mea-sure water level using a pressure transducer as well as a baro-metric pressure transducer to calibrate atmospheric pressure(Troll 9000 series, In-Situ Inc.). Water level measurementswere periodically compared with manual measurementsusing a dipper at the top of the casing. Data obtained every30 min at each monitoring well were transmitted to the mainserver via a wireless communication modem, and were thendownloaded from the remote terminal unit (RTU) once aday; a solar battery was used to obtain electricity in the field.
3.2. Seismic Observation
The Korea Meteorological Administration (KMA) oper-ates four seismic stations on Jeju Island – Gosan (GOS), Seog-wipo (SGP), Jeju (JJU), and Seongsanpo (SSP) (Fig. 1). Aseismograph at Jeju station (JJU) was used to monitor theseismic response of groundwater to the SAIE on Jeju Island.The JJU station is located at a distance angle of 41.6°(~4,620 km) from the epicenter of the SAIE with an azimuth of39.9° (Fig. 2). At the JJU station, a P-wave triggered by theSAIE arrived at 01:06:39.46 UTC (10:06:39.46 local time)on 26 December 2004, and an S-wave arrived at 01:12:59.44UTC (10:12:59.44 local time). Figure 3 shows the seismo-gram of horizontal E-W and N-S components, and the ver-tical component of the SAIE at the JJU station for a duration of6,000 s starting from 00:55:00 UTC on 26 December 2004.
The seismic impact of the SAIE was also detected on theKorean peninsula by seismograms at the Wonju (BB), Bogildo(BGD), Cheolwon (CHNB), and Kyoungbook NationalUniversity (GKP1) stations operated by the Korea Instituteof Geoscience and Mineral Resources (KIGAM) (Fig. 1).The seismicity of the SAIE was recorded for 40 min, includingsurface waves, at a rate of 100 samples/s. The seismogramfor Bogildo (BGD) Island exhibited the first signal from theSAIE at 01:06:40 UTC (10:06:39.46 local time).
3.3. Time Series Analysis
Time series analysis has provided a systematic methodfor simulating and forecasting the temporal behavior ofuncertain hydrologic systems (Salas et al., 1988). Time seriesanalysis involves the following steps: data treatment, modelidentification, parameter estimation, model structure refine-ment, and diagnostic checking (Box and Jenkins, 1976).

186 Jae-Yeol Cheong, Se-Yeong Hamm, Sang-Hyun Kim, Soo-Hyoung Lee, Nam-Chil Woo, and Gyoo-Bum Kim
Preliminary statistical evaluation, such as calculation of themean and variance and histogram analysis, indicated thatboth the tidal oscillations and the groundwater level showednegligible skewness; this result satisfies the normality assump-tion of time series analysis (Salas et al., 1988). In order toperform the analysis in terms of dimensionless noise, cen-tralization transformation was applied to all data subsets toobtain a standardized series. The autocorrelation function(ACF) and partial autocorrelation function (PACF) of thetransformed groundwater level data were used for periodicfeatures and temporal correlation structures. A differenceoperator was implemented for the modeling of groundwater
level fluctuations to correct the periodic behavior. In the next stage, a candidate model was selected from
among various transfer function models of the tidal andgroundwater levels by estimating an extended ACF, i.e.,Corner table (Liu and Hanssen, 1982). On the basis of theidentification of stochastic structures, multiple candidatemodels were explored for both univariate and multivariatemodeling. Model parameters were estimated for the lineartransfer function, the autoregressive operators, and noiseterms and corresponding standard deviation of the residuals.Maximum likelihood estimates (Box and Jenkins, 1976)and conditional likelihood estimates were used to determine
Fig. 2. Map showing the location of the epicenter of the Sumatra-Adaman Islands earthquake (SAIE) and Jeju Island (original source: Goo-gle Earth, 2009).

Analyzing groundwater change on a volcanic island caused by the impact of the M9 Sumatra earthquake 187
the sum of the square surfaces for a range of parameters andto locate their minimum with the corresponding parameters.Sequential diagnostic tests were performed to check whether allthe models satisfied the assumptions of time series model-ing. The stability of the final models was examined by con-firming whether the roots of the characteristic equations layoutside the unit circle (Box and Jenkins, 1976). All the final mod-els satisfied this condition. The significance of the modelparameters was confirmed both by the standard error asso-ciated with each parameter estimate and by the t-statistics of
each parameter. The standard errors and t-statistics for allfinal models indicated that the parameter estimates wereacceptable in terms of the contribution for each parameter. Theover-fitting of the additional parameters on the selectedmodels ensured the existence of a more general model thanthe preliminarily selected models. Finally, the model residualswere tested to verify the removal of the stochastic structuresthrough time series modeling, and both individual residualseries and a group autocorrelation were tested. In all models, theACF of the residuals was less than two standard deviations.
Fig. 3. Seismograms at Jeju (JJU) station. The time series started from 00:55:00 UTC on 26 December 2004.

188 Jae-Yeol Cheong, Se-Yeong Hamm, Sang-Hyun Kim, Soo-Hyoung Lee, Nam-Chil Woo, and Gyoo-Bum Kim
4. RESULTS AND DISCUSSION
4.1. Noise to the SAIE Effect
The groundwater level in 25 of 111 wells on Jeju Island,at a distance of ~4,620 km from the epicenter of the SAIE,changed within a range of 4.5–49.5 cm on 26 December2004, at 10:30 a.m. local time (01:30 UTC) (Table 1 andFig. 1). With the exception of the SAIE, the earthquakes(Mw 6.6) that occurred around the world from December 23to December 26, 2004 (Table 2, http://earthquake.usgs.gov/
earthquakes/eqinthenews/2004/us2004slav/) did not have animpact on the groundwater level in the monitoring wells. Inthis study, rainfall and tidal effects were examined in orderto determine the impact of the SAIE. The effect of precip-itation over a short period before the SAIE was also exam-ined using the precipitation at Jeju Island, which was recordedto be 21–37 mm on December 4, 2004, with a maximumof 6 mm on December 12 and December 20, 2004. There-fore, the amount of precipitation was regarded as negligiblein terms of its impact on groundwater levels in December2004, prior to the SAIE.
Table 1. Groundwater level, electrical conductivity, and temperature changes of the monitoring wells impacted by the SAIE
Well no. Well depth (m)
Surface elevation(m, msl)
Thicknessof aquifer (m)
Abs. water level change (cm)
EC change (µS/cm)
Temp. change(°C)
Transmissivity(m2/day)
Storage Coeff.(–)
HG1 120 13.61 13.5 49.5 – – ? 3.51·10–6
SR 110 103.1 86.0 39.0 – 0.02 19.5 2.83·10–5
HG3 140 115.6 22.0 33.0 – – ? 8.57·10–6
HM2 150 17.32 23.0 12.5 1 0.03 13084 2.36·10–5
SM2 325 22.9 38.0 4.0 – – ? 1.22·10–4
YS2 185 37.44 69.5 9.0 – – ? 9.92·10–5
MY 110 96.88 ? 9.0 – – ? ? DN 117 86.33 ? 15.5 – – ? ?SN 80 54.88 ? 17.5 – – ? ?SC3 120 97.72 19.0 18.5 – 0.03 ? 1.32·10–5
JD5 408 201.4 35.5 37.0 – – 29940 1.23·10–5
HM1 150 21.49 17.0 37.0 21 0.13 7883 5.90·10–6
GJ4 111 93.2 ? 30.0 3 0.29 ? ?SS3 267 115.5 19.8 25.5 23679 1.37 1214 9.98·10–6
JD1 156 14.48 28.5 20.5 3378 – 72.3 1.79·10–5
HD3 262 112.9 28.0 15.5 27975 0.11 46.6 2.23·10–5
HC2 180 58.88 11.5 6.0 32 – 27.2 2.46·10–6
SS1 151 33.84 30.9 4.5 3825 – 801 8.83·10–5
SH1 92 15.69 18.5 12.0 1574 0.06 ? 1.98·10–5
HC1 136 25.78 15.9 12.5 – – 127 1.63·10–5
HC3 186 87.45 21.5 20.5 – – 46.9 1.35·10–5
SS2 196 70.9 19.0 25.5 840 – 195 9.58·10–6
TH1 91 15.05 30.5 25.5 – – ? 1.54·10–5
JD3 252 100.5 25.5 37.0 1320 0.03 3964 8.86·10–6
BS 200 167.7 ? 13.0 – – ? ?Max 408 201.4 86 49.5 27975 1.37 29940 1.22·10–4
Min 80 13.6 11.5 4 1 0.02 19.5 2.46·10–6
Avg. 172 71.2 28.7 21.2 5695 0.23 4783 2.70·10–5
Table 2. List of world earthquakes of Mw larger than 6.6 from 23 December 2004 until 26 December 2004 (http://earthquake.usgs.gov/earthquakes/eqinthenews/2004/us2004slav/)
Date Time (UTC) Mw Location Latitude/Longitude2004/12/23 14:59:04.4 8.1 North of Macquarie Island 49.312S/161.345E2004/12/26 00:58:53.4 9.0 Off the west coast of northern Sumatra 3.295N/95.982E2004/12/26 04:21:29.8 7.1 Nicobar Islands 6.910N/92.958E2004/12/26 09:20:01.6 6.6 Nicobar Islands 8.879N/92.375E

Analyzing groundwater change on a volcanic island caused by the impact of the M9 Sumatra earthquake 189
Fig. 4. Groundwater level responses due to the SAIE with respect to the ranges of groundwater levels ((a) 15–45 m amsl, (b) 7–13 mamsl, and (c) 0–3 m amsl).

190 Jae-Yeol Cheong, Se-Yeong Hamm, Sang-Hyun Kim, Soo-Hyoung Lee, Nam-Chil Woo, and Gyoo-Bum Kim
4.2. Groundwater Level Change due to the SAIE
An example of groundwater level change was demon-strated at a distance of hundreds to thousands of kilometersfrom the epicenter (Montgomery and Manga, 2003). At anepicentral distance of more than 1,000 km, seismograms aremainly dominated by large-period surface waves that areslower than P- and S-waves. According to Kitagawa et al.(2006), the Rayleigh waves of the SAIE propagated all theway around the earth more than five times. Shih (2009) alsoreported that the Rayleigh waves of the SAIE contributed asignificant component of the change in groundwater head inthe monitoring well located on the eastern coast of Taiwan.The S-waves and Rayleigh waves induced by the SAIEarrived on Jeju Island 6.25 min and 11.77 min, respectively,after the arrival of the P-wave. As a consequence, the changein groundwater level in the study area was interpreted as theresponse of Rayleigh waves, even though every 30-minmeasurement of the water level did not exactly coincidewith the arrival of Rayleigh waves.
Figure 4 shows groundwater level responses due to theSAIE which were grouped according to three differentranges of groundwater levels ((a) 15–45 m amsl, (b) 7–13 mamsl, and (c) 0–3 m amsl). The changes in absolute waterlevel due to the SAIE appeared to be justified by a rela-tionship with fracture scale encountered at the wells usingavailable drill data. A positive relationship between the sumof fracture apertures and water level change due to the SAIEin the wells showed a relatively high correlation coefficient,r2 = 0.53 (Fig. 5). This relationship denotes that water sup-ply into the well through abundant fractures can generate a
rise in groundwater level. The model of Gringarten and Ramey(1973) for flow through a single, infinitesimally thin squareplanar fracture embedded in an unbounded, homogeneous,and isotropic confined aquifer also supports proportionalitybetween water level change and pumping rate for a well.Additionally, whether clogged or unclogged conditions occurin the fracture can affect water level change, e.g., cloggedfracture conditions on the upgradient side can induce higherwater level relative to unclogged conditions (Brodsky et al.,2003).
The change in groundwater level on Jeju Island can beexplained logically by the significant distance (~4,620 km)from the SAIE, as mentioned by several researchers (Mat-sumoto, 1992; Roeloffs, 1998; Brodsky et al., 2003), andcan often be explained by orders of magnitude greater thanthat explained by static stress changes (Bower and Heaton,1978). In addition, the spatial variation in groundwater levelmight be due to the proximity of the monitoring wells to thecoast and to the original hydrogeological properties as wellas to changes in aquifer permeability induced by the seis-mic impact. Montgomery and Manga (2003) found spatialirregularities in the groundwater level changes, caused byvarious interactions between hydrogeological and seismo-logical processes that led to the development of crustal-scale permeability and aquifer properties, fault behavior andstrength, and the nature and spatial distribution of seismicimpacts.
4.3. Electrical Conductivity (EC) and Temperature Changes due to the SAIE
Groundwater EC and temperature changes due to theSAIE were examined after converting the measured valuesusing the regression line method. The EC change of basalgroundwater in nine wells ranged from 3–27,975 µS/cm,while only two lower parabasal groundwater regions exhib-ited changes of 1 and 21 µS/cm. The greater numbers ofhigher EC changes in the basal groundwater regions com-pared to the lower parabasal groundwater regions can beexplained by the fact that the EC sensors were locatedcloser to the saltwater zone in the basal groundwater wellsthan in the lower parabasal groundwater wells (Table 1 andFig. 6). However, EC changes did not occur in the well inthe upper parabasal/high level groundwater region that waslocated at a significantly higher level than the saltwateroccurrence.
Arabelos et al. (2001) recognized that a correlation existsbetween earthquakes and changes in groundwater level andtemperature. The temperature change for the basal ground-water in five wells ranged from 0.03–1.37 °C while that forthe lower parabasal groundwater in four wells ranged from0.02–0.13 °C (Table 1 and Fig. 6). Temperature change seemsto be related to groundwater movement and to changes inthe physical properties of geological media; this relation-
Fig. 5. Relationship between total fracture thickness and corre-sponding water level change at the wells induced by the SAIE.

Analyzing groundwater change on a volcanic island caused by the impact of the M9 Sumatra earthquake 191
ship is similar to that discussed by Tronin et al. (2004).In the basal groundwater region, the EC change was more
distinct than the temperature change; on the other hand, inthe lower parabasal groundwater region, the temperaturechange was slightly more visible than the EC change. More-over, the EC and temperature of the part of the basal ground-water region close to the saltwater zone responded effectivelyto the SAIE, although the EC and temperature were lesssensitive to the impact of the SAIE than groundwater level.
4.4. Recognition of the Impact of the SAIE through Time Series Modeling
By applying the systematic analysis procedure to thegroundwater level and tidal signals, we obtained time seriesmodels in both the univariate and multivariate modelingplatforms (Salas et al., 1988). In order to find the best mod-els for each time series, rigorous heuristic approaches werecarried adopted. Univariate models ARIMA (2,1,1) andARIMA (3,1,2) were selected as the final models to eluci-date groundwater levels from wells located at SN and HG1.These models explained the variation in the groundwaterlevels at the abovementioned locations with r2 = 0.97 and
0.96, respectively, and all criteria such as independence ofresiduals and normality of treated data for diagnostic veri-fication were satisfied. The two multivariate models describingthe output as groundwater levels of SN and HG1 and inputas tidal variation agreed well with observations, with r2 = 0.98and 0.97, respectively. In addition, all diagnostic checkswere completed. Figures 7c and d show the residuals of thetransfer function models for the SN and HG1 wells. Thepeak responses, as shown in Figures 7c and d, coincide pre-cisely with the occurrence of the M9 Sumatra earthquake.
Potential tidal impact on groundwater fluctuation can beidentified by the cross correlation function (CCF) betweenthe residuals obtained from prewhitening groundwater model-ing in the context of Granger causality. Figure 8 shows theCCF of the model residuals between the SN and HG1 wells.The periodicity and autocorrelation structures were success-fully eliminated via the residuals obtained by filtering withdelineated univariate models, illustrating a significant cor-relation at lag 0. This implied that the groundwater levels atSN and HG1 were commonly affected by an external driver.Moreover, the impact of the tidal oscillation appeared to beinstant with a negligible memory. On the basis of the CCFbetween model residuals, the potential structure of the transfer
Fig. 6. (a) Electrical conductivity (EC) variation in the JD3 due to; (b) temperature variation in the JD3 due to the SAIE.

192 Jae-Yeol Cheong, Se-Yeong Hamm, Sang-Hyun Kim, Soo-Hyoung Lee, Nam-Chil Woo, and Gyoo-Bum Kim
function model between the tidal signal and the groundwa-ter level can be feasibly approximated.
In contrast to the recognition of the transfer functionmodels relating tidal fluctuation and groundwater levelchange, any distinct transfer function models for ground-water electrical conductance (EC) and temperature couldnot be determined, suggesting that it might be difficult to
use EC and temperature values as a potential tool for theprediction of earthquakes.
4.5. Hydraulic Parameters in Relation to the Impact of the SAIE
To review the effect on hydraulic parameters in associa-
Fig. 7. Groundwater levels of the wells: (a) JD3 and HG1 due to; (b) the SAIE with residuals of transfer function models for the wells;(c) HG1 and (d) SN.

Analyzing groundwater change on a volcanic island caused by the impact of the M9 Sumatra earthquake 193
tion with the impact of the SAIE, transmissivity (T) wasdetermined by pumping test analyses using only pumpedwell data. The Moench (1985) leaky aquifer model was provensuitable for the volcanic aquifers on Jeju Island (Hamm etal., 2005). T estimated for the monitoring wells where thegroundwater level responded to the impact of the SAIE wasdetermined to be 19.5–29,940 m2/day (Table 1).
Using Shih’s (2009) method, an equation was derived toestimate the storage coefficient (S) using the relationshipbetween change in groundwater level (∆h) and maximumRayleigh-wave amplitude (As):
∆h = 0.918b · nR · As/S (1)
where nR is the wave number of Rayleigh waves, and b is
the thickness of the aquifer. For the case of the change ingroundwater level (∆h) on Jeju Island, As = 2.8·10–6 cm andnR = 0.05/cm. In this study, the thickness of aquifers (Table1) corresponds to the total thickness of permeable zones(scoria flow deposits, pyroclastic deposits, clinker, fracturezones, crushed zones, and other permeable structures) encoun-tered in the monitoring wells. From Equation (1), storagecoefficient (S) estimates were determined to be within arange of 1.22·10–4–3.51·10–6 (Table 1).
The SAIE-induced relationships between groundwaterlevel change and transmissivity and between the ground-water level change and storage coefficient were consideredin order to examine disturbance of hydraulic properties dueto the SAIE. In reality, an abrupt change of groundwaterlevel due to an earthquake takes place by compression andexpansion of aquifer media, groundwater, or other geolog-ical structures. Grecksch et al. (1999) and Wakita (1975)reported that extensional strain caused decreases in ground-water level and compressive strain in confined and uncon-fined aquifers induced increases in groundwater level.According to Figure 9, r2 = 0.702 for groundwater level changevs. storage coefficient is higher than r2 = 0.07 for groundwaterlevel change vs. transmissivity, indicating that the storagecoefficient is a more significant factor than transmissivity inresponse to an earthquake. These relationships verify that thechanges in groundwater level in the monitoring wells resultedfrom earthquake energy transmission through the aquifermaterials and caused a storage change in the aquifers.
5. CONCLUSIONS
It was demonstrated that changes in groundwater level,electrical conductivity, and temperature at monitoring wells
Fig. 8. Cross correlation between residuals of univariate modelsfor SN well and for HG1 well.
Fig. 9. Relationships of (a) water level displacement vs. transmissivity and (b) water level displacement vs. storage coefficient.
194 Jae-Yeol Cheong, Se-Yeong Hamm, Sang-Hyun Kim, Soo-Hyoung Lee, Nam-Chil Woo, and Gyoo-Bum Kim
on Jeju Island, South Korea, were related to the impact ofthe Sumatra-Andaman Islands earthquake (SAIE). Becauseof the SAIE, the absolute changes (4.0–49.5 cm) of ground-water levels in 25 monitoring wells responded differently inrelation to the sum of fracture apertures. EC change withinthe range 1–27,975 µS/cm was observed in 11 monitoringwells, and temperature change within the range 0.02–1.37 °Cwas observed in nine wells. Irregularities were observed inthe changes in groundwater level at different locations onthe island, and these irregularities were caused by variousinteractions between the hydrological and seismologicalprocesses that were induced by changes in hydraulic properties.
A systematic and heuristic approach was employed toconfigure the relationship between groundwater levels andthe impact of tidal variation on fluctuations in groundwaterlevel. The cross correlation between the residuals of theunivariate models for the groundwater level indicated theexistence of an external impact (i.e., tidal effect). The lineartransfer function models successfully delineated betweenthe tidal variation and the groundwater level. Hence, theimpact of the SAIE was successfully determined from thedistinctive peaks of the residual series obtained via multi-variate modeling.
On the basis of a theoretical background, the storagecoefficient (S) estimates of the aquifers could be determinedwithin a range of 1.22·10–4–3.51·10–6; otherwise, S valueswere difficult to determine since the single-well pumpingtest was performed at each monitoring well. The SAIE-inducedrelationship between the change in groundwater level andstorage coefficient was more pronounced than that betweenthe change in groundwater level and transmissivity, indi-cating that the storage coefficient is plays a more prominentrole than transmissivity in relation to the impact of an earth-quake.
The study results suggest that the change in groundwaterlevel on Jeju Island could be effectively used as a potentialtool for the prediction of earthquakes of immense magni-tude, such as the 4,621-km distant SAIE.
ACKNOWLEDGMENTS: This study was financed by the Minis-try of Land, Transport and Maritime Affairs. The authors wish tothank Dr. Yong-Gyu Ryu of the Korea Meteorological Administrationfor providing seismogram data and also wish to thank Dr. Myung-Soon Jun of the Korea Institute of Geoscience & Mineral Resourcesfor his review of the manuscript.
REFERENCES
Arabelos, D., Asteriadis, G., Contadakis, M., Zioutas, G., Xu, D.,Zhang, C., and Zeng, B., 2001, The use of an outlier detectingmethod in time series of continuous daily measurements ofunderground water level and temperature in earthquake predic-tion investigation. Tectonophysics, 338, 315–323.
Arya, A.S., Mandal, G.S., and Muley, E.V., 2006, Some aspects oftsunami impact and recovery in India. Disaster Prevention Man-age, 15, 51–66.
Bower, D.R. and Heaton, K.C., 1978, Response of an aquifer nearOttawa to tidal forcing and the Alaskan earthquake of 1964.Canadian Journal of Earth Sciences, 15, 331–340.
Box, G. and Jenkins, G., 1976, Time Series Analysis: Forecasting andControl. revised edition, Holden-day, Oakland, 575 p.
Brodsky, E.E., Roelffs, W., Woodcook, D., Gall, I., and Manga, M.,2003, A mechanism for sustained groundwater pressure changeinduced by distant earthquake. Journal of Geophysical Research,108, (B8):doi:10.1029/2002JB002321.
Caporali, A., Braitenberg, C., and Massironi, M., 2005, Geodetic andhydrological aspects of the Merano earthquake of 17 July 2001.Journal of Geodynamics, 39, 317–336.
Chia, Y., Chiu, J.J., Chiang, Y.-H., Lee, T.-P., and Liu, C.-W., 2008,Spatial and Temporal Changes of groundwater level induced byTrust Faulting. Pure & Applied Geophysics, 165, 5–16.
Cutillo, P.A. and Ge, S., 2006, Analysis of strain-induced ground-water fluctuations at Devils Hole, Navada. Geofluids, 6, 319–333.
Davis, J.C., 2002, Statistics and data analysis in geology. 3rd editoin,John Wiley & Sons, New York, 656 p.
Gorokhovich, Y., 2005, Abandonment of Minoan palaces on Crete inrelation to the earthquake induced change in groundwater supply.Journal of Archeological Sciences, 32, 217–222.
Grecksch, G., Roth, F., and Kumple, H.J., 1999, Coseismic well levelchanges due to the 1992 Roermond earthquake compared withstatic deformation of half space solutions. Geophysical JournalInternational, 138, 470–478.
Gringarten, A.C. and Ramey, H.J., 1973, The use of source andGreen’s functions in solving unsteady-flow problems in reser-voirs. Society of Petroleum Engineers Journal, 255, 285–296.
Gutenberg, B., 1956, The energy of earthquakes. Quarterly Journal ofGeological Society, 112, 1–14.
Hamm, S.-Y., Cheong, J.-Y., Jang, S., Jung, C.-Y., and Kim, B.-S.,2005, Relationship between transmissivity and specific capacityin the volcanic aquifers of Jeju Island, Korea. Journal of Hydrol-ogy, 310, 111–121.
Hahn, J., Lee, Y., Kim, N., Hahn, C., and Lee, S., 1997, The ground-water resources and sustainable yield of Cheju volcanic island,Korea. Environmental Geology, 33, 43–53.
Industrial Base Development Corporation (IBDC), 1981, Report onwater resources development in Jeju Island.
Itaba, S. and Koizumi, N., 2007, Earthquake-related changes in ground-water levels at the Dogo hot spring, Japan. Pure and AppliedGeophysics, 164, 2397–2410.
Jeju Province and Korea Water Resources Corporation, 2003, Reporton hydrogeological and groundwater resource survey in JejuIsland (III) (in Korean).
Kench, P.S., McLean, R.F., Brander, R.W., Nichol, S.L., Smithers,S.G., Ford, M.R., Parnell, K.E., and Aslam, M., 2006, Geologicaleffects of tsunami on mid-ocean atoll islands: the Maldivesbefore and after the Sumatran tsunami. Geology, 34, 177–180.
King, C.Y., Azuma, S., Ohno, M., Asai, Y., He, P., Kitagawa, Y., Iga-rashi, G., and Wakita, H., 2000, In search of earthquake precur-sors in the water-level data of 16 closely clustered wells at Tono,Japan. Geophysical Journal International, 143, 469–477.
Kitagawa, Y., Koizumi, N., Takahashi, M., Matsumoto, N., and Sato,T., 2006, Changes in groundwater levels or pressures associatedwith the 2004 earthquake off the west coast of northern Sumatra(M9.0). Earth Planets Space, 58, 173–179.
Koh, D.-C., Plummer, L.N., Solomon, D.K., Busenberg, E., Kim, Y.-J., and Chang, H.-W., 2006, Application of environmental tracersto mixing, evolution, and nitrate contamination of ground waterin Jeju Island, Korea. Journal of Hydrology, 327, 258–275.

Analyzing groundwater change on a volcanic island caused by the impact of the M9 Sumatra earthquake 195
Koizumi, N., Kitagawai, Y., Matsumoto, N., Takahashi, M., Sato, T.,Kamigaich, O., and Nakamura, K., 2004, Pre-seismic groundwaterlevel changes induced by crustal deformations related to earth-quake swarms off the east coast of Izu Peninsula, Japan. Geo-physical Research Letters, 31, L10606:doi:10.1029/2004GL 019557.
Larocque, M., Mangin, A., Razack, M., and Banton, O., 1998, Con-tribution of correlation and spectral analysis to the regional studyof a large karst aquifer (Charente, France). Journal of Hydrology,205, 217–231.
Liu, L.M. and Hanssens, D.M., 1982, Identification of multiple inputtransfer function models. Communications in Statistics-Theoryand Methods, 11, 297–314.
Lowrie, W., 2007, Fundamentals of geophysics. 2nd edition, Cam-bridge University Press, Cambridge, 393 p.
Matsumoto, N., 1992, Regression-analysis for anomalous changes ofground water level due to earthquakes. Geophysical ResearchLetters, 19, 1193–1196.
Moench, A.F., 1985, Transient flow to a large-diameter well in anaquifer with storative semiconfining layers. Water ResourcesResearch, 21, 1121–1131.
Montgomery, D.R. and Manga M., 2003, Streamflow and water wellresponses to earthquakes. Science, 300, 2047–2049.
Ohno, M., Sato, T., Notsu, K., Wakita, H., and Ozawa, K., 2006,Groundwater-level changes due to pressure gradient induced bynearby earthquakes off Izu Peninsula, 1997. Pure and AppliedGeophysics, 163, 647–655.
Park, J., Anderson, K., Aster, R., Butler, R., Lay, T., and Simpson, D.,2005, Global seismographic network records the great Sumatra-Andaman earthquake. EOS Transactions, American GeophysicalUnion, 86, 57–64.
Ramana, D.V., Chadha, R.K., Singh, C., and Shekar, M., 2007, Waterlevel fluctuations due to earthquakes in Koyna-Warna region,India. Natural Hazards, 40, 585–592.
Ramanmurthy, M.V., Sundaramoorthy, S., Pari, Y., Ranga, R.V.,Mishra, P., Bhat, M., Tune, U., Venkatesan, R., and Subramanian,B.R., 2005, Inundation of seawater in Andaman and NicobarIslands and parts of Tamilnadu coast, India, during 2004 IndianOcean Tsunami. Current Science, 88, 1736–1740.
Roeloffs, E.A., 1998, Persistent water level changes in a well nearParkfield, California, due to local and distant earthquake. Journalof Geophysical Research, 103, 869–889.
Roeloffs, E.A. and Quilty, E., 1997, Case 21 Water level and strain
changes preceding and following the August 4, 1985 KettlemanHills, California, earthquake. Pure and Applied Geophysics, 149,21–60.
Salas, J.D., Delleur, J.W., Yevjeuch, V., and Lane, W.L., 1988, AppliedModeling of Hydrologic Time Series. Water Resource Publica-tion, Chelsea, 484 p.
Shih, D.C.-F., 2009, Storage in confined aquifer: Spectral analysis ofgroundwater responses to seismic Rayleigh waves. Journal ofHydrology, 374, 83–91.
Shih, D.C.-F. and Lin, G.-F., 2002, Spectral analysis of water levelfluctuations in aquifers. Stochastic Environmental Research andRisk Assessment, 16, 374–398.
Singh, V.S., 2008, Impact of the earthquake and Tsunami of Decem-ber 26, 2004, on the groundwater regime at Neill Island (southAndaman). Journal of Environmental Management, 89, 58–62.
Sørensen, M.B., Atakan, K., and Pulido, N., 2006, Simulated strongground motion for the great M 9.3 Sumatra-Andaman earthquakeof 26 December 2004. Bulletin of the Seismological Society ofAmerica, 97, S139–S151.
Tokunaga, T., 1999, Modeling of earthquake-induced hydrologicalchanges and possible permeability enhancement due to the 17January 1995 Kobe Earthquake, Japan. Journal of Hydrology, 223,221–229.
Tronin, A.A., Biagi, P.F., Molchanov, O.A., Khatkevich, Y.M., andGordeev, E.I., 2004, Temperature variations related to earth-quakes from simultaneous observation at the ground stations andby satellites in Kamchatka area. Physics and Chemistry of theEarth, 29, 501–506.
Wakita, H., 1975, Water wells as possible indicators of tectonicstrain. Science, 189, 553–555.
Waltham, T., 2004, The Asian Tsunami disaster, December 2004.Geology Today, 21, 22–26.
Wang, C.Y., Wang, C.H., and Kuo, C.H., 2004, Temporal changes ingroundwater level following the 1999 (Mw = 7.5) Chi-Chi earth-quake, Taiwan. Geofluids, 4, 210–220.
Won, J.-H., Lee, J.-Y., Kim, J.-W., and Koh, G.-W., 2006, Ground-water occurrence on Jeju Island, Korea. Hydrogeology Journal,14, 532–547.
Manuscript received July 19, 2012Manuscript accepted January 23, 2013


![Geo-Electrical and Borehole Investigation of Groundwater in Some … · 2017. 11. 29. · make Mount Cameroon [4] potential volcanic aquifer system. The potential of volcanic rocks](https://img.pdfslide.us/doc/110x75/6128ce05d6fd9b216649a7fd/geo-electrical-and-borehole-investigation-of-groundwater-in-some-2017-11-29.jpg)