Embed Size (px)
Citation preview

LESSON PLANS
GROSS DOMESTIC PRODUCT (GDP) Grade level : 9 - 12 Relevant standards CEE National Standards: 18 - Economic Fluctuations AP Macroeconomics Standards: Unit II - Measure of Economic Performance
This lesson plan covers everything about GDP that is covered in a typical high school economics course. It is split into three days for ease of use. Teachers should pace and adapt according to the needs of their class. INTRODUCTION Is there a convenient way to measure an economy’s overall performance? Gross Domestic Product (GDP) measures the output of a country within a given year. But how is GDP calculated? What counts or doesn’t count as part of a country’s output? And how can we use GDP to compare the outputs of a country at different times in history, or that of different countries altogether? Finally, what does GDP tell us about the standard of living of a given country? STUDENTS WILL
Understand the history of when and why GDP was introduced as a measure of economic health.
Discuss how GDP helps assess economic health and standard of living. Define GDP, real GDP, and real GDP per capita, and understand what each tells
us about the economy. Distinguish what kinds of goods and services are and aren’t factored into GDP. Apply the expenditures and income approaches to calculating GDP. Use FRED data to infer information about the economy. Appraise alternatives to GDP per capita for measuring standard of living.
RESOURCES
Podcast: “ The Invention of ‘The Economy’ ” ( Planet Money ) Assessment activities: GDP: What’s Included? , Splitting GDP GDP Game St. Louis Fed Data ( FRED ): GDP , Real GDP and Real GDP Per Capita “ Bhutan’s Gross National Happiness Index ” ( OPHI ) Marginal Revolution University Videos:
o “ What is Gross Domestic Product? ” o “ Nominal vs. Real GDP ” o “ Splitting GDP ” o “ Real GDP Per Capita and the Standard of Living ”
MRUNIVERSITY.COM/HIGH-SCHOOL-TEACHER-RESOURCES 1
PROCESS DAY 1 Introducing and Defining GDP 1. Introducing Gross Domestic Product (GDP) Gross Domestic Product (GDP) is an important measure of the health of the economy. It was introduced during the Great Depression. Describe the following scenario for students: imagine you’re the President of the United States during the Great Depression. There has been a stock market crash, followed by bank runs and massive unemployment. The economy is obviously in trouble. But you want to know: in just how much trouble? And in what sectors of the economy is this trouble concentrated? Discuss : Ask students what information would you want to have? [ Start this discussion by welcoming any answers from students. Answers might include things like
How many people are unemployed? How much income are people earning? What percentage of high school students are going to college? How high is the income gap between rich and poor?
After some student answers have been discussed, guide students toward the question: “How much stuff is being made?” Explain that, if things are being made, there must be demand for those things, meaning there are people able and willing to pay for them. Ask students how “stuff being made” could be measured. Discuss the fact that we need to put a value on the stuff being made. Suggest the possibility of comparing that value to previous years to see if total value of stuff is increasing or decreasing. Talk about how total value of stuff being made might be different in different industries. Maybe more value is being made in cars but less in clothes. Ask them to speculate: what might that mean about the economy? Also ask them to speculate: what counts as “stuff”? Should a service, like cell phone data or a waiter’s labor, count as “stuff”? No wrong answers during this discussion. Complete the discussion by letting students know that, during the Great Depression, the “GDP” or “Gross Domestic Product” was invented in order to track the progress in the economy. For more information on the genesis of the GDP measure, listen to “ The Invention of ‘The Economy’ ” (Planet Money).]
MRUNIVERSITY.COM/HIGH-SCHOOL-TEACHER-RESOURCES 2
2. Defining GDP
Gross Domestic Product (GDP) measures the market value of all final goods and services produced within a country’s economy in one year .
Final goods and services : GDP only counts goods that will not be sold again as part of another good (i.e., not intermediate goods ). Final goods include capital goods.
Produced : GDP only counts goods that are produced within the year. Within a country’s economy : GDP counts net exports (exports minus imports).
A good counts towards GDP if it is produced in the country. Market value : GDP only counts goods sold in a market.
Transfer payments and financial assets are not counted because they do not create new value they only move already existing value. Online Extension : Students watch Marginal Revolution University’s video, “ What is Gross Domestic Product? ” This video defines GDP, and explains what is and isn’t factored into calculating it. Optional Assessment : Students take online quiz after watching the video.
Optional Assessment : Assign GDP: What’s Included? activity in class or for homework.
MRUNIVERSITY.COM/HIGH-SCHOOL-TEACHER-RESOURCES 3
DAY 2 Nominal versus Real GDP, Calculating GDP 3. Nominal versus Real GDP and Real GDP per Capita GDP, as we’ve just learned it, is called Nominal GDP , and it can give us a good indication of current production. However, if we want to compare GDP across different years, we must remove the effects of inflation on Nominal GDP. Real GDP is Nominal GDP adjusted for inflation. It can be calculated by setting current prices to those of a base year. Real GDP is one of the most important indicators of economic performance. A rise in Real GDP indicates economic growth, while a fall in Real GDP indicates economic decline. Real GDP per Capita adjusts for population changes. It is obtained by dividing Real GDP by total population. Online Extension : Students watch Marginal Revolution University’s video, “ Nominal vs. Real GDP ” to learn how about the difference between Nominal GDP, Real GDP, and Real GDP per Capita. Students learn how all three are calculated and what the three different measures tell us about the economy. Optional Assessment : Students take online quiz after watching the video.
The Federal Reserve Bank of St. Louis maintains an economic database called FRED (Federal Reserve Economic Data). Optional Activity : Work with students to compare Nominal GDP rates at two different points in U.S. history and talk about why they may be different. Then have the students look up the corresponding Real GDP rates. Ask: why is Real GDP better for comparing economic performance? [ Example : 1960 v. 2000. Nominal : 543.3 billion (1960) v. 10.28 trillion (2000). Real : 3.1 trillion (1960) v. 12.6 trillion (2000). An almost 20x increase in nominal but only 4x increase in real. The difference is that the latter filters out the effects of inflation, making it a better measure of economic performance.] 4. Calculating GDP In the U.S., the Department of Commerce Bureau of Economic Analysis measures the GDP. There are two ways of calculating GDP: the Expenditures approach and the Income approach. Ideally, since all money spent by someone is money received by
MRUNIVERSITY.COM/HIGH-SCHOOL-TEACHER-RESOURCES 4
someone else, the two methods should yield the same value for GDP.
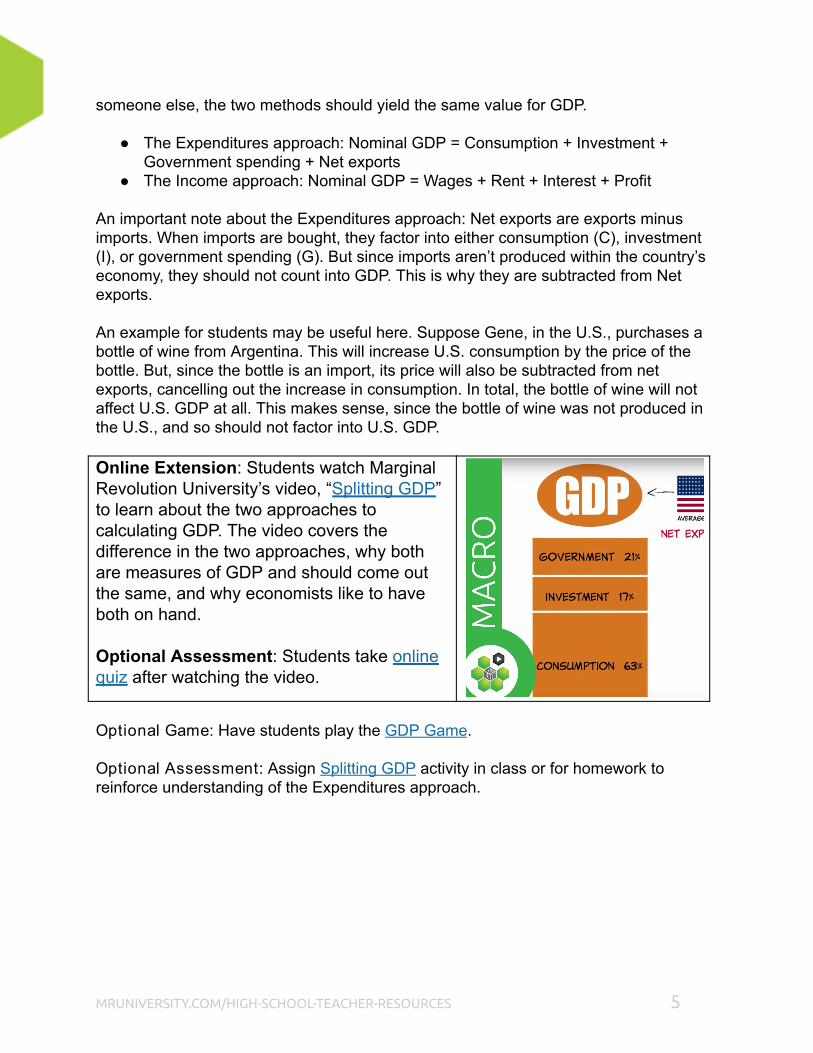
The Expenditures approach: Nominal GDP = Consumption + Investment + Government spending + Net exports
The Income approach: Nominal GDP = Wages + Rent + Interest + Profit An important note about the Expenditures approach: Net exports are exports minus imports. When imports are bought, they factor into either consumption (C), investment (I), or government spending (G). But since imports aren’t produced within the country’s economy, they should not count into GDP. This is why they are subtracted from Net exports. An example for students may be useful here. Suppose Gene, in the U.S., purchases a bottle of wine from Argentina. This will increase U.S. consumption by the price of the bottle. But, since the bottle is an import, its price will also be subtracted from net exports, cancelling out the increase in consumption. In total, the bottle of wine will not affect U.S. GDP at all. This makes sense, since the bottle of wine was not produced in the U.S., and so should not factor into U.S. GDP. Online Extension : Students watch Marginal Revolution University’s video, “ Splitting GDP ” to learn about the two approaches to calculating GDP. The video covers the difference in the two approaches, why both are measures of GDP and should come out the same, and why economists like to have both on hand. Optional Assessment : Students take online quiz after watching the video.
Optional Game : Have students play the GDP Game . Optional Assessment : Assign Splitting GDP activity in class or for homework to reinforce understanding of the Expenditures approach.
MRUNIVERSITY.COM/HIGH-SCHOOL-TEACHER-RESOURCES 5
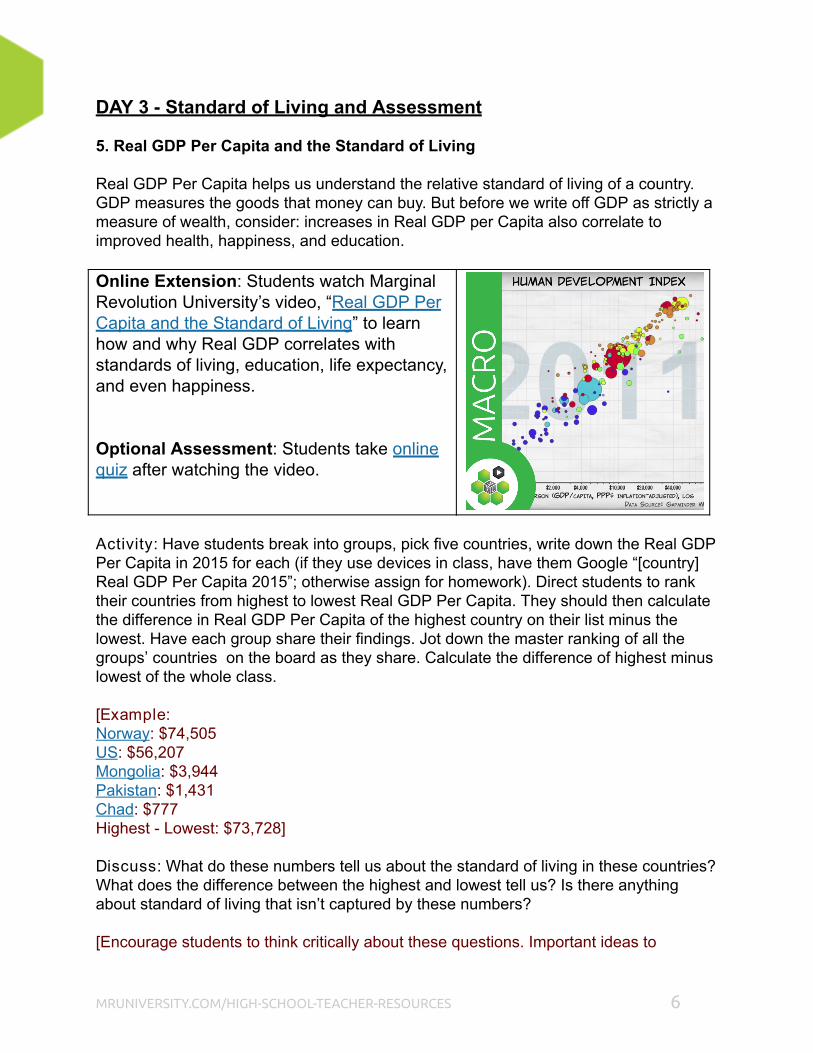
DAY 3 Standard of Living and Assessment 5. Real GDP Per Capita and the Standard of Living Real GDP Per Capita helps us understand the relative standard of living of a country. GDP measures the goods that money can buy. But before we write off GDP as strictly a measure of wealth, consider: increases in Real GDP per Capita also correlate to improved health, happiness, and education. Online Extension : Students watch Marginal Revolution University’s video, “ Real GDP Per Capita and the Standard of Living ” to learn how and why Real GDP correlates with standards of living, education, life expectancy, and even happiness. Optional Assessment : Students take online quiz after watching the video.
Activity : Have students break into groups, pick five countries, write down the Real GDP Per Capita in 2015 for each (if they use devices in class, have them Google “[country] Real GDP Per Capita 2015”; otherwise assign for homework). Direct students to rank their countries from highest to lowest Real GDP Per Capita. They should then calculate the difference in Real GDP Per Capita of the highest country on their list minus the lowest. Have each group share their findings. Jot down the master ranking of all the groups’ countries on the board as they share. Calculate the difference of highest minus lowest of the whole class. [ Example : Norway : $74,505 US : $56,207 Mongolia : $3,944 Pakistan : $1,431 Chad : $777 Highest Lowest: $73,728] Discuss : What do these numbers tell us about the standard of living in these countries? What does the difference between the highest and lowest tell us? Is there anything about standard of living that isn’t captured by these numbers? [Encourage students to think critically about these questions. Important ideas to
MRUNIVERSITY.COM/HIGH-SCHOOL-TEACHER-RESOURCES 6
consider and discuss: Ask students to imagine what it might be like to live on under $1K/person/year. Since these numbers reflect Real GDP divided by population, they show the
income of an average person in that country. If income inequality is high in these countries, there will be many poor people in the country who live on much less than the Real GDP Per Capita indicates. This is a limitation of Real GDP Per Capita as a measure of standard of living.
The difference between the highest and lowest country is usually very large as large as the Real GDP Per Capita of some rich countries. This indicates high income inequality between countries.
Is it possible to be very poor and still be happy? Why or why not? No wrong answers here. ]
Optional Reading : “ Bhutan’s Gross National Happiness Index ” (Oxford Poverty and Human Development Initiative)
MRUNIVERSITY.COM/HIGH-SCHOOL-TEACHER-RESOURCES 7
ASSESSMENT
1. Define GDP. Explain each component of the definition.
Answer: GDP measures the market value of all final goods and services produced within a country’s economy in one year. See Section 1 for breakdown of each component.
2. How is Nominal GDP converted to Real GDP? Why is Real GDP better than
Nominal GDP for comparing economic performance at different times?
Answer: Real GDP is Nominal GDP with prices set to a base year. This removes the difference in prices caused by inflation, giving a more accurate representation of output.
3. How is Real GDP Per Capita calculated? Why is it better than Real GDP for
comparing standard of living between different countries?
Answer: Real GDP Per Capita is Real GDP divided by the population. This removes differences in population size from the measure, giving a more accurate representation of the standard of living for individuals in the given country.
4. What are two different approaches for calculating GDP? Why does it make sense
that they should yield the same value?
Answer: The Expenditure approach and the Income approach (see section 3 for breakdown of each). The two approaches should yield the same value because all money spent (expenditure) by someone is received (income) by someone else.
Use the Real GDP and Real GDP Per Capita FRED Graphs to answer questions 5 through 7:
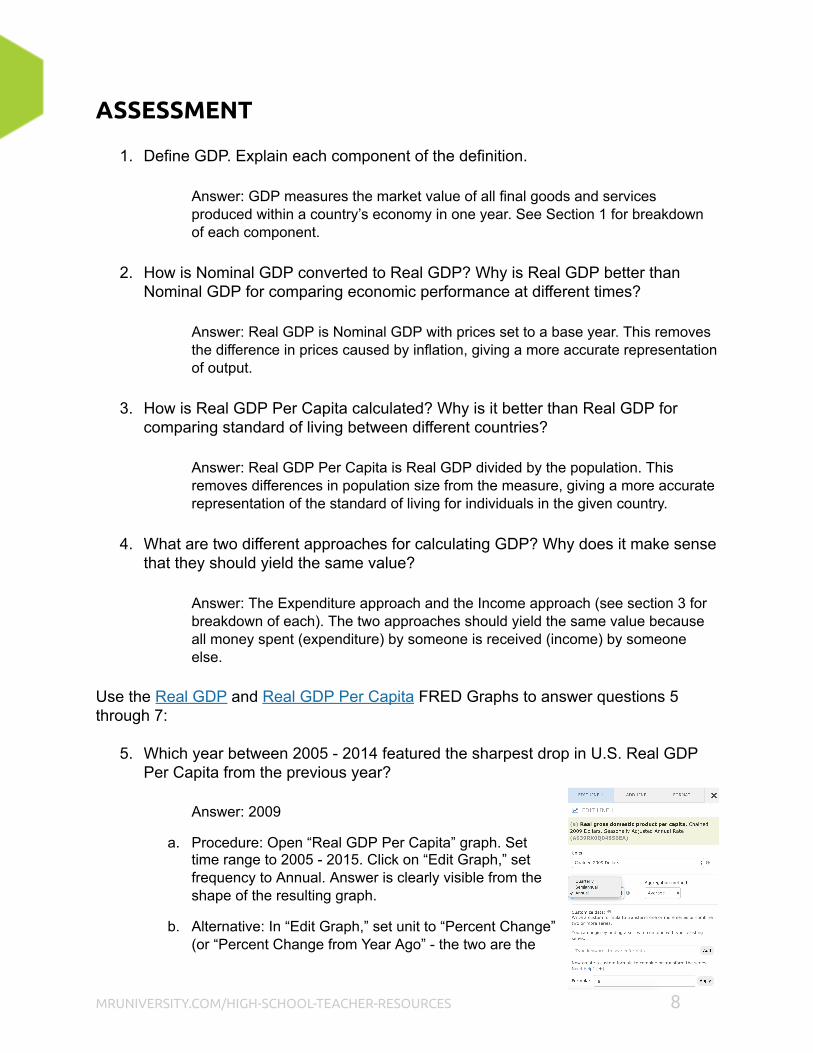
5. Which year between 2005 2014 featured the sharpest drop in U.S. Real GDP Per Capita from the previous year?
Answer: 2009
a. Procedure: Open “Real GDP Per Capita” graph. Set time range to 2005 2015. Click on “Edit Graph,” set frequency to Annual. Answer is clearly visible from the shape of the resulting graph.
b. Alternative: In “Edit Graph,” set unit to “Percent Change” (or “Percent Change from Year Ago” the two are the
MRUNIVERSITY.COM/HIGH-SCHOOL-TEACHER-RESOURCES 8
same when the frequency is Annual). Answer is the year with the lowest value.
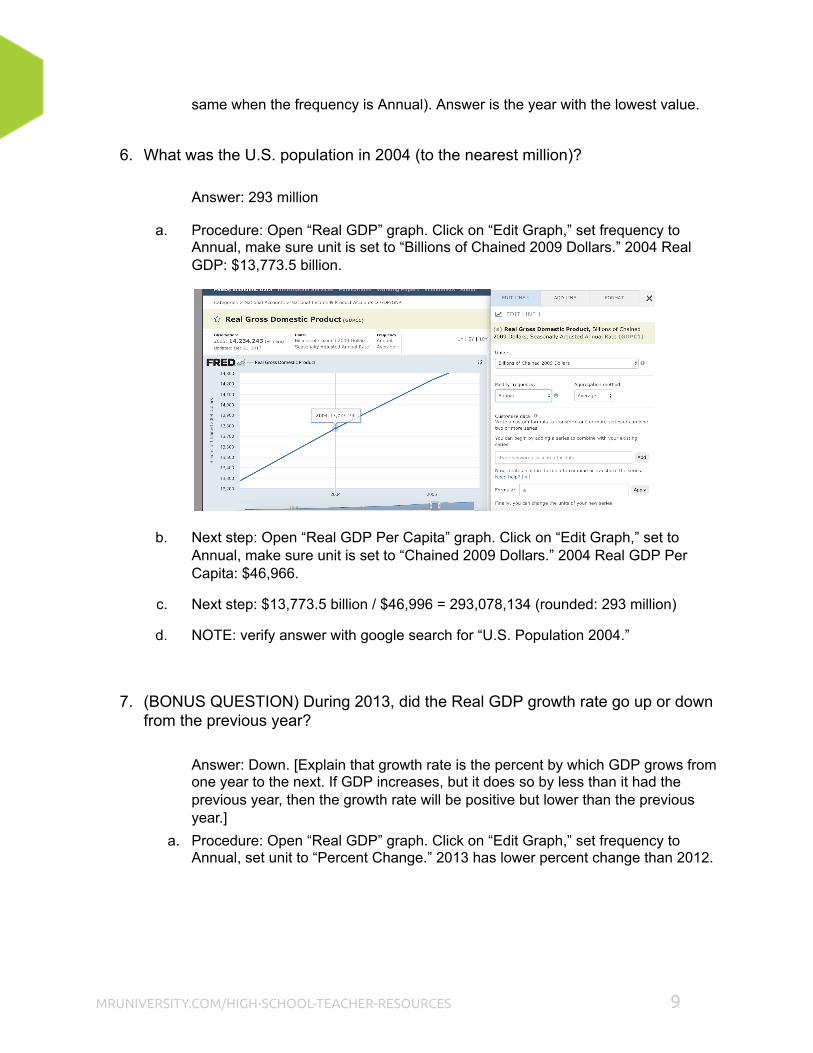
6. What was the U.S. population in 2004 (to the nearest million)?
Answer: 293 million
a. Procedure: Open “Real GDP” graph. Click on “Edit Graph,” set frequency to Annual, make sure unit is set to “Billions of Chained 2009 Dollars.” 2004 Real GDP: $13,773.5 billion.
b. Next step: Open “Real GDP Per Capita” graph. Click on “Edit Graph,” set to Annual, make sure unit is set to “Chained 2009 Dollars.” 2004 Real GDP Per Capita: $46,966.
c. Next step: $13,773.5 billion / $46,996 = 293,078,134 (rounded: 293 million)
d. NOTE: verify answer with google search for “U.S. Population 2004.”
7. (BONUS QUESTION) During 2013, did the Real GDP growth rate go up or down from the previous year?
Answer: Down. [Explain that growth rate is the percent by which GDP grows from one year to the next. If GDP increases, but it does so by less than it had the previous year, then the growth rate will be positive but lower than the previous year.]
a. Procedure: Open “Real GDP” graph. Click on “Edit Graph,” set frequency to Annual, set unit to “Percent Change.” 2013 has lower percent change than 2012.
MRUNIVERSITY.COM/HIGH-SCHOOL-TEACHER-RESOURCES 9
ABOUT MARGINAL REVOLUTION UNIVERSITY Marginal Revolution University is building the world’s largest online library of free economics education videos—currently weighing in at more than 800 videos. Whether it’s an overview of micro and macro principles, a “duel” between leading thinkers, or a primer on how to manage your money like an economist, MRU’s videos bring viewers up to speed on what they need to know about economics. Interested in using MRU in your classroom? Have questions, comments, or lesson plans you’d like to share? We’d love to hear from you! Contact us at: [email protected] VISIT US AT MRUNIVERSITY.COM
MRUNIVERSITY.COM/HIGH-SCHOOL-TEACHER-RESOURCES 10