Embed Size (px)
Citation preview

Future Generation Computer Systems 19 (2003) 871–881
Griz: experience with remote visualization over an optical grid
Luc Renambota,∗, Tom van der Schaafa, Henri E. Bala,b,Desmond Germansb, Hans J.W. Spoelderb
a Division of Mathematics and Computer Science, Faculty of Sciences, Vrije Universiteit, De Boelelaan 1081,1081 HV Amsterdam, The Netherlands
b Division of Physics and Astronomy, Faculty of Sciences, Vrije Universiteit, De Boelelaan 1081,1081 HV Amsterdam, The Netherlands
Abstract
This paper describes the experiments of remote rendering over an intercontinental optical network during theiGrid2002conference in Amsterdam from September 23 to 26. A rendering cluster in Chicago was used to generate images whichwere displayed in real-time on a4-tile visualization setup in Amsterdam. On average, one gigabit per second (1 Gbps) wasconsumed to enable remote visualization, at interactive frame rate, with a 1600× 1200 pixels configuration.© 2003 Elsevier B.V. All rights reserved.
Keywords:Remote visualization; Parallel rendering; Optical network; Reliable UDP; Interactive application
1. Introduction
The recent advances in optical networking aredeeply changing the networking landscape, and ingeneral the way we think about networked resourcessuch as computing, storage, or remote instruments.“Lambda” networking with technologies such aswave division multiplexing (WDM) are on the vergeof providing the “infinite bandwidth” dreams of thecomputer scientists. For instance, in a WDM system,each wavelength in an optic fiber can carry from 1to 10 gigabit per second (Gbps). An example of suchan infrastructure is the StarLight/NetherLight opticalnetwork between Chicago and Amsterdam.
∗ Corresponding author.E-mail addresses:[email protected] (L. Renambot),[email protected] (T. van der Schaaf), [email protected](H.E. Bal), [email protected] (D. Germans),[email protected] (H.J.W. Spoelder).URL: http://www.cs.vu.nl/renambot/vr.
On the other hand, the current trend in hardwarefor parallel graphics is to use clusters of off-the-shelfPCs instead of high-end graphic supercomputers.This trend has emerged since the dramatic changein the price/performance ratio of today’s PCs, inparticular concerning their graphics capability. By ap-plying similar techniques developed for cluster com-puting, graphics clusters can now drive large-scalehigh-resolution systems, overcoming the limited out-put resolution of standard devices such as monitorsand video projectors. High resolution can be achievedby tightly coupling projectors (or TFT monitors),allowing for detailed scientific visualization with anincreased pixel density.
This paper describes the experiments combiningparallel rendering and usage of a very large bandwidthnetwork to achieve remote visualization of interactiveapplications between Chicago (USA) and Amsterdam(The Netherlands) during the internationaliGrid2002conference in September 2002. A rendering cluster inChicago was generating images which were displayed
0167-739X/03/$ – see front matter © 2003 Elsevier B.V. All rights reserved.doi:10.1016/S0167-739X(03)00067-0

872 L. Renambot et al. / Future Generation Computer Systems 19 (2003) 871–881
in real-time on a4-tile display setup in Amsterdam.On average, 1 Gbps was consumed for visual applica-tions at interactive frame rate (≈20 frames per second)for a 1600× 1200 pixel frame buffer.
The reasons to explore such configurations for re-mote visualization in a grid environment are:
• Rendering facilities are still scarce, compared tocomputing or storage resources, and need specificskills to be used,
• Advanced “consumer” graphics cards combinedwith fast processors are the basic blocks to providelarge-scale graphic resources,
• Very large bandwidth between sites, provided byoptical networks, opens a wide range of new pos-sibilities to conduct research. It deeply changes theway we think about remote resources such as stor-age or visualization, and the nature of remote col-laboration between scientists.
The considered scenarios for remote visualizationin such a networking environment are:
• Remote rendering: using a remote cluster with alocal display. The user wants to access a high-performance rendering facility not available locally.This facility can use a high-speed local networkwithin an institution, or an optical backbone overa large distance, such as the one used during theiGrid conference. The target display can be a singlemonitor or a high-resolution tiled display.
• Support for collaborative visualization: two or moresites can visualize the same application or datasetto support a collaborative session.
In the following sections, we are describing thetechniques and tools that enabled this demonstration.We will focus on the two main points, namely pixelgeneration using parallel rendering, and network en-gineering to achieve high-speed data transfer overhigh-latency high-bandwidth network.
2. High-speed networking
High-speed transfer of large datasets is an criti-cal part of many data-intensive scientific applications.However, a major problem for the application de-veloper is to achieve high throughput transfers overhigh bandwidth, long distance networks. This relates
mostly to the design of theTCP/IP protocol. Whileperformances are good over a large class of networks,high latency induced by long distances makes it veryhard to get part of the available bandwidth. Algorithmsof the TCP/IP protocol to detect packet loss and todeal with congestion are too sensitive and take toolong to recover for gigabit networks with round-triptimes (RTTs) over 100 ms (i.e., Chicago–AmsterdamRTT is around 100 ms, Chicago–Japan RTT is round150 ms). For instance, the loss of a few packets can af-fect for a long time such a network. To illustrate theseproblems, Martin[6] reported at the Global Grid Fo-rum in September 2001 that
• The loss of a single packet will affect a 10 Gbpsstream with 200 ms RTT for 5 h. During that timethe average throughput will be 7.5 Gbps. This loss isperceived as congestion by the aggressive TCP pro-tocol which then decreases the emission rate. Thehigh latency and the slow progression of the emis-sion rate makes this loss very long to recover from.
• On a 2.5 Gbps link with 100 ms RTT, this translatesto 38 min recovery time, during that time the aver-age throughput will be 1.875 Gbps.
• On a 2.5 Gbps link, a bit error rate of 10−9 translatesto one packet loss every 250 ms.
However, the non-reliable UDP protocol does notsuffer from these problems. Consequently, severalprojects proposed new protocols ensuring reliablecommunication based on UDP, without much focuson the congestion aspect. This last aspect raises theproblem of fairness of these protocols since they useall the available bandwidth. In the extreme case, thiscould be considered as a “denial of service” (Dos)attack. However, programs making use of theses tech-niques are mainly deployed on research networkswhere this is not yet a problem.
These protocols or programs, such asGridFTP,RBUDP, SABUL, andTsunami, are generally based onthe coupling of a UDP channel for high-speed transferand a TCP channel to control the data emission rateand signal the packet loss.
• GridFTP[1] is an enhanced version of the popularfile transfer protocol, targeted for very large trans-fers between grid sites around the world. The featurerich GridFTP includes capabilities such as auto-matic negotiation of window sizes between client

L. Renambot et al. / Future Generation Computer Systems 19 (2003) 871–881 873
and server, parallel data streams, security, and reli-ability support.
• RBUDP [3] (Reliable Blast UDP) is an aggressivebulk data transfer scheme, designed for extremelyhigh bandwidth networks. The protocol containstwo phases: a blast of data is sent to destination us-ing a UDP channel at a specified rate, followed byreliability phase over TCP, where lost packets aresent again. RBUDP is part of theQUANTAtoolkit,described later in this paper.
• SABUL [8] (Simple Available Bandwidth Utiliza-tion Library for High-Speed Wide Area Networks)is a C++ library for large data transfers overhigh-speed wide area networks. It is similar tothe RBUDP protocol. However, SABUL maintainsstate information and controls data rate to minimizepacket loss over the duration of the transfer.
• Tsunami[9], similar toGridFTP, is an experimen-tal high speed network file transfer protocol de-signed to overcome some of the TCP problems forhigh-performance transfer over the considered net-works. Again, data transport is carried out usinga UDP channel, with limited congestion control.Missing packets are re-sent to ensure reliability.
For the networking aspects of this demonstration,we choose to use theQUANTA toolkit, successor oftheCAVERNSoftproject[3,5]. QUANTA, or Quality ofService and Adaptive Networking Toolkit, provides aneasy-to-use environment to the application program-mer to achieve high-speed data transfer. It also givesthe application various metrics to characterize andmonitor each network connection. It becomes easierfor the non-expert to understand the behavior of theapplication, and to optimize it for a specific network.
The QUANTA toolkit provides a C++ interfacecontaining:
• TCP, UDP, and multicast objects (client, server, re-flectors),
• Socket parameter tuning, with defaults values forwide-area networks,
• Various high-speed protocols:◦ Parallel TCP, using transparently multiple sock-
ets to achieve higher throughput by overcomingthe window-size and latency shortcomings.
◦ UDP with Forward Error Correction, wherepacket loss is resolved by encoding multipletimes the same packets with checksums.
◦ Reliable Blast UDP, the above described reliablehigh-speed data transfer protocol.
• Monitoring and logging of each connection, withmetrics such as immediate and average bandwidth,latency, and jitter.
• A portable implementation for Linux, Windows,and IRIX operating systems.
3. Remote rendering
Our remote rendering infrastructure consists of aparallel rendering infrastructure which generates theimages and a remote visualization technique whichbrings the pixels to a remote location.
3.1. Parallel rendering
The visualization in this work is based on the AuraAPI developed at the Vrije Universiteit in Amsterdam.Aura is designed as a portable 3D graphics scene graphlayer [2]. Aura allows the user to apply modificationsto any object attributes in the graph. For a completedescription of Aura and some case study applications,we refer to[2].
In our parallel approach[10], the applications areexecuted only on the master. All graphics commandsfrom the API are marshaled and sent to all slaves, in-stead of being executed locally. This approach has theadvantage that all cluster-related issues can be hiddenin the implementation of the interface. However, it re-quires graphic commands to be sent over the network,and it potentially needs a high bandwidth. High-speednetworks such as Myrinet or Gigabit Ethernet solvethis problem only partially.
We use a per-frame sort-first strategy to distributethe graphic updates[7], in a comparable approachto WireGL [4]. Whenever something changes in thescene graph, it is sent to the appropriate slaves (i.e.those that are affected by the change). The correctdestination slave is computed using bounding boxes,defined by clipping planes for each sub-frustum. Thisstrategy is simple to implement but can induce loadimbalance. The protocol to keep the scene graph con-sistent on all slaves, distinguishes two types of opera-tions:
Scene graph operations.The master sends separateupdate messages to create nodes, add nodes, and

874 L. Renambot et al. / Future Generation Computer Systems 19 (2003) 871–881
remove nodes from the scene. These types of op-erations are broadcast to every slave to maintaina consistent graph on each node.
Object modifications.Whenever the user-programmodifies an Aura object, the master marks it asdirty. Before the rendering loop, it transmits anupdate containing the new data for each dirtyobject. Each type of object owns its own set ofupdate types and state bits. For example, eachvertex of a geometric object has a dirty bit andonly dirty vertices are sent over the network.The same approach is used for normals, vertexcolors, etc. The key idea is that a minimum ofdata is sent if an object is modified.
For the iGrid2002 demonstration, this parallelrendering was implemented using standard MPI li-brary over the Gigabit Ethernet network linkingthe rendering nodes. The rendering itself was man-aged by an OpenGL graphics card available on eachnode.
Pixel generation. Instead of connecting the outputof the graphics card of each node to an display de-vice (TFT panel, plasma TV, video projector) like ina regular tiled display, we read back the pixels at theend of the graphics pipeline (RGB values). This is astandard operation of the OpenGL API (i.e.glRead-Pixels).
Pixel reading is often considered as a slow processon most graphics cards. However, the situation is im-proving to the point where one can achieve interactiveframe rates while reading back the pixels generated bythe graphic engine. We conduct experiments on twosystems to validate our approach:
• During iGrid2002, on GeForceMX2 cards with P41.8 GHz processor:
Resolution Pixel transfer(Mpixels/s)
Frequency (Hz)
640× 480 18.5 60800× 600 17.5 361024× 768 16.0 20
On such a system, interactive frame rates are pos-sible for a configuration above 800× 600.
• On the Vrije Universiteit cluster, with GeForce4cards and Athlon 1.3 MHz processors:
Resolution Pixel transfer(Mpixels/s)
Frequency (Hz)
640× 480 35.1 114800× 600 38.5 801024× 768 40.5 51
On this more advanced system, even 1024× 768configuration can be used interactively.
Since we were using a very high-bandwidth andhigh-latency network during theiGrid2002 demon-stration, compression of the pixel data was not con-sidered. However, early tests show that a simplerunlength encoding(RLE) or a YUV (raw video) con-version allows significant gains at interactive speedon a Pentium4 processor (without optimizations ormultimedia instructions): it is possible to compress1024×768 images in RLE format at more than 60 Hz,for a compression ratio varying between 2.3 and 25,and to compress the same images in YUV format atmore than 80 Hz for a compression ratio of 2.
3.2. Remote visualization
The demonstration shown duringiGrid2002 con-sists of three components, as shown inFig. 1:
• The application generating scene-graph updates.This is a non-graphical process that can be runon a single host. The application program and theinteraction events (mouse, keyboard) modify thescene graph. The updates are sent to the renderingcluster for pixel generation. The application canreceive its data from an external simulation, in agrid interactive steering scenario.
• The renderingfacility implements the parallel ren-dering system described in the previous section. Itcan consist of a single graphics workstation or ren-dering cluster. From the scene graph updates, therendering generates images accordingly. The pixelsare then streamed to the display infrastructure.
• The display infrastructure receives the pixels gen-erated by the rendering facility, and schedules theimages for a smooth animation. It can consist of asingle display (monitor or projector) or a tiled dis-play (video wall, TFT tiling).
The technologies used in this application are startedas follows. First, a rendering cluster is setup with an

L. Renambot et al. / Future Generation Computer Systems 19 (2003) 871–881 875
Fig. 1. Application setup.
empty scene to be rendered. Then an application us-ing the Aura API is started on another machine andtransmits scene graph updates to the rendering clus-ter. From the received scene each node of the clusterrenders a part of the whole picture and send the pixelsto a display facility. Finally, the generated images arevisualized on the display machines.
The communication between these three softwarecomponents (application, rendering, display) was car-ried out using theQUANTA toolkit, as described inFig. 2between the application and the rendering clus-ter we used TCP connections to ensure the needed reli-ability. Large TCP windows were set to optimize thesetransfers. Between the rendering nodes and the display
Fig. 2. Networking setup.
setup, we used theRBUDP protocol to achieve thehighest possible throughput for pixel data. The onlyparameter we controlled was the data emission rate,which was generally set around 500 Mbps. This pa-rameter was controlled by a configuration file, whichvalue was set by experimentation before an actual runof the demo. In a ideal case, this value should be dy-namic, like in the TCP protocol or theSABULlibrary,in order not to overload the routers or the destinationmachine. For optimal data transfer, the emission rateshould be below the capacity of the whole link (phys-ical links, routers, source and destination machines).
Even if the application can be run on any site, twoplaces should be considered. First, the application can

876 L. Renambot et al. / Future Generation Computer Systems 19 (2003) 871–881
Fig. 3. Multi-threaded communication.
be run close to the display facility, in a scenario wherethe user uses the remote rendering cluster as graphicsresource. In a second scenario, the application can berun close to the rendering facility for a collaborativesession where two sites (the local rendering, and the re-mote display) share the views of the visualization. Thesecond approach (application close to the renderingfacility) was used duringiGrid2002 to overcome thelarge latency between the two sites (around 100 ms).Remote interaction, using mouse and keyboard events,was still possible using a X11 remote display.
Multi-threaded communication. To achieve high-throughput at the application level between the twoend points, we had to carefully design the datapath between the software components. We used amulti-threaded implementation to obtain the best net-work throughput without slowing down the renderingprocess, as shown inFig. 3.
Since the workload was small (frame size be-tween 1 and 2 MB) and the network latency washigh (100 ms), we decided to pack several framesinto a singleRBUDPmessage. The rendering thread
Fig. 4. Algorithms: application, master, rendering, and display.
pushes frames (pixel buffers) into a work queue, ina producer–consumerfashion. This allows the ren-dering process to work without delay, and allows thenetwork thread to send a large amount of data at once.Experimental tests gave good results while combiningeight frames in a message (in general, between 5 and10 frames). Small messages under-utilize the networkand slow down the rendering process, while largemessages can achieve the largest throughput possible.However, large messages introduce a lag in the sys-tem, where the display process receives the images, ina pipeline fashion, delayed by the size of the message(5 or 10 frames). This can be a drawback for interac-tive application. We noticed that around 1/3 s delay isbearable on such high-latency network, and offers thebest compromise between throughput and latency.
Similarly, we implemented a network queue at thedisplay side, managed with aproducer–consumerscheme: a network thread reads the frame packetsfrom the network and inserts them in a queue, whilea display thread visualizes these images at a fixedframe rate. The network queue and the re-scheduling
L. Renambot et al. / Future Generation Computer Systems 19 (2003) 871–881 877
of the frames locally produce a fluid animation, andsmooth out the jittery network transfers.
Algorithms. Fig. 4 gives an overview of the severalprograms involved in the remote rendering system:the application processing events and sending sceneupdates to the rendering master which controls therendering nodes, the nodes send pixel buffers to thedisplay node for visualization.
4. Experiments
During theiGrid2002, theGriz demonstration wasrun successfully numerous times. In the current sec-tion, we show the setup we used and some statisticscollected during the last day of the conference.
4.1. Setup
The hardware architecture, as sketched inFig. 2was mostly provided by theElectronic VisualizationLaboratoryfrom the University of Illinois at Chicago.For the rendering, we used a five-node graphics clustersetup at theStarLight facility in Chicago. Each nodewas using a dual-Pentium4 system with a GeForceMXgraphics cards (consumer cards), and equipped with agigabit interface linked to the 10 gigabit backbone toAmsterdam.
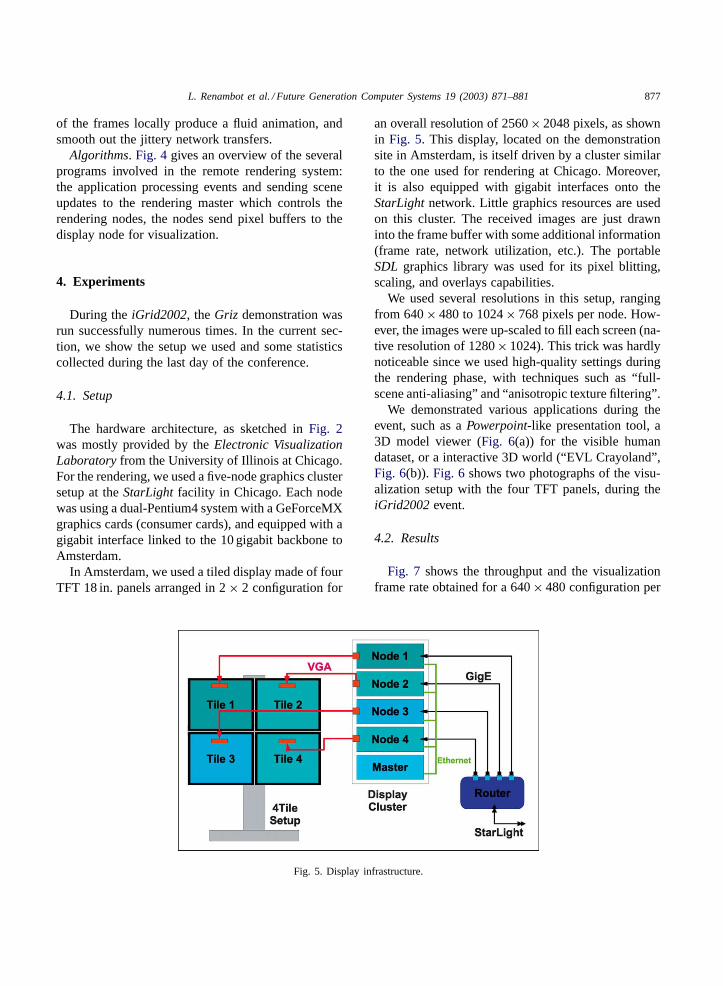
In Amsterdam, we used a tiled display made of fourTFT 18 in. panels arranged in 2× 2 configuration for
Fig. 5. Display infrastructure.
an overall resolution of 2560× 2048 pixels, as shownin Fig. 5. This display, located on the demonstrationsite in Amsterdam, is itself driven by a cluster similarto the one used for rendering at Chicago. Moreover,it is also equipped with gigabit interfaces onto theStarLightnetwork. Little graphics resources are usedon this cluster. The received images are just drawninto the frame buffer with some additional information(frame rate, network utilization, etc.). The portableSDL graphics library was used for its pixel blitting,scaling, and overlays capabilities.
We used several resolutions in this setup, rangingfrom 640× 480 to 1024× 768 pixels per node. How-ever, the images were up-scaled to fill each screen (na-tive resolution of 1280× 1024). This trick was hardlynoticeable since we used high-quality settings duringthe rendering phase, with techniques such as “full-scene anti-aliasing” and “anisotropic texture filtering”.
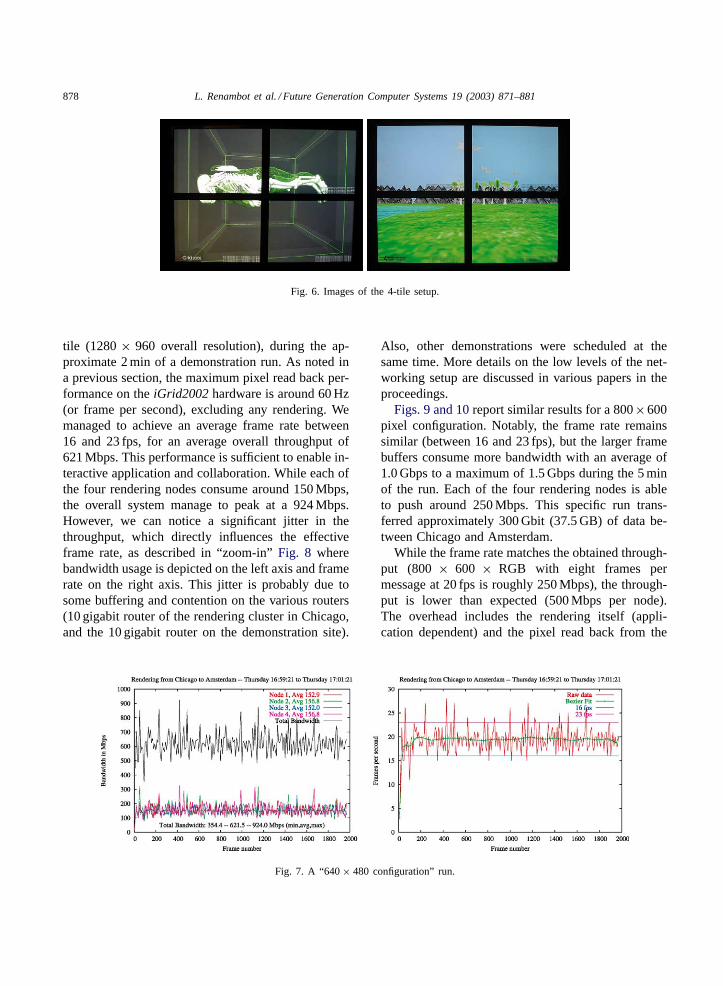
We demonstrated various applications during theevent, such as aPowerpoint-like presentation tool, a3D model viewer (Fig. 6(a)) for the visible humandataset, or a interactive 3D world (“EVL Crayoland”,Fig. 6(b)). Fig. 6 shows two photographs of the visu-alization setup with the four TFT panels, during theiGrid2002event.
4.2. Results
Fig. 7 shows the throughput and the visualizationframe rate obtained for a 640× 480 configuration per
878 L. Renambot et al. / Future Generation Computer Systems 19 (2003) 871–881
Fig. 6. Images of the 4-tile setup.
tile (1280× 960 overall resolution), during the ap-proximate 2 min of a demonstration run. As noted ina previous section, the maximum pixel read back per-formance on theiGrid2002hardware is around 60 Hz(or frame per second), excluding any rendering. Wemanaged to achieve an average frame rate between16 and 23 fps, for an average overall throughput of621 Mbps. This performance is sufficient to enable in-teractive application and collaboration. While each ofthe four rendering nodes consume around 150 Mbps,the overall system manage to peak at a 924 Mbps.However, we can notice a significant jitter in thethroughput, which directly influences the effectiveframe rate, as described in “zoom-in”Fig. 8 wherebandwidth usage is depicted on the left axis and framerate on the right axis. This jitter is probably due tosome buffering and contention on the various routers(10 gigabit router of the rendering cluster in Chicago,and the 10 gigabit router on the demonstration site).
Fig. 7. A “640× 480 configuration” run.
Also, other demonstrations were scheduled at thesame time. More details on the low levels of the net-working setup are discussed in various papers in theproceedings.
Figs. 9 and 10report similar results for a 800×600pixel configuration. Notably, the frame rate remainssimilar (between 16 and 23 fps), but the larger framebuffers consume more bandwidth with an average of1.0 Gbps to a maximum of 1.5 Gbps during the 5 minof the run. Each of the four rendering nodes is ableto push around 250 Mbps. This specific run trans-ferred approximately 300 Gbit (37.5 GB) of data be-tween Chicago and Amsterdam.
While the frame rate matches the obtained through-put (800 × 600 × RGB with eight frames permessage at 20 fps is roughly 250 Mbps), the through-put is lower than expected (500 Mbps per node).The overhead includes the rendering itself (appli-cation dependent) and the pixel read back from the

L. Renambot et al. / Future Generation Computer Systems 19 (2003) 871–881 879
Fig. 8. Zoom on a “640× 480 configuration” run.
graphics cards (constant). The whole system seemsbound to the RTT of 100 ms observed during theevent (1000 ms/0.5 RTT= 20 fps). This behaviorneeds further investigation to achieve higher per-formance. Some severe performance loss can benoticed inFig. 9 and in the zoomFig. 10. This canbe explained by some network contention that thebuffering mechanism cannot hide, or by some loadimbalance on the rendering cluster. The latter canbe produced when a rendering node has to renderthe whole scene (for instance, the whole skeleton in
Fig. 9. A “800× 600 configuration” run.
the visible human application) while the other nodesare idle. This view-dependent behavior should besolved by a more efficient parallel rendering tech-nique.
In Fig. 11, it is possible to pin-point these specificsruns of theGriz demonstration on the network statis-tics collected during theiGrid2002event. This figurereports the incoming traffic (solid curve) and the out-going traffic (line curve) on Thursday of 26th Septem-ber. Our runs, between 16.00 and 17.00, clearlygenerates an additional traffic, up to 1.5 Gbps.

880 L. Renambot et al. / Future Generation Computer Systems 19 (2003) 871–881
Fig. 10. Zoom on a “800× 600 configuration” run.
Fig. 11. Griz demonstration network usage on the statistics graph.
5. Conclusion
We demonstrated in this event and publicationthat remote rendering over intercontinental opticalnetworks was possible at interactive frame rate. Us-ing a four-node rendering cluster in Chicago and afour-node display setup in Amsterdam, 1 Gbps wasused on average to enable remote visualization with a1600× 1200 pixels configuration. Various visualiza-tion application were shown.
Future enhancements include various compressiontechniques to cope with the bandwidth requirementson more limited networks. One can think of algorithmssuch as simplerun-length encodingor more complexmotion JPEG. This will lead to an approach similarto video delivery to one or more users, and could beintegrated into the AccessGrid environment. The dy-namic adaptation to match the requirements of vari-ous display environments (PDA, laptop, or large tileddisplay) will be also considered. Finally, an important

L. Renambot et al. / Future Generation Computer Systems 19 (2003) 871–881 881
issue to be investigated is the latency of the overallsystem to support collaborative work.
Acknowledgements
The authors would like to thank theElectronic Vi-sualization Laboratoryfrom the University of Illinoisat Chicago for theQUANTAtoolkit, and for the use ofthe rendering cluster in Chicago and the 4-tile displayduring the event.
References
[1] B. Allcock, J. Bester, J. Bresnahan, A.L. Chervenak, I.Foster, C. Kesselman, S. Meder, V. Nefedova, D. Quesnel, S.Tuecke, Data management and transfer in high-performancecomputational grid environments, Parallel Comput. 28 (5)(2002) 749–771.
[2] D. Germans, H.J.W. Spoelder, L. Renambot, H.E. Bal, VIRPI:a high-level toolkit for interactive scientific visualization invirtual reality, in: Proceedings of the Fifth Immersive Projec-tion Technology Workshop, May 2001.
[3] E. He, J. Leigh, O. Yu, T. DeFanti, Reliable blast UDP:predictable high performance bulk data transfer, in: Procee-dings of the IEEE Cluster Computing 2002, Chicago, IL,September 2002.
[4] G. Humphreys, M. Eldridge, I. Buck, G. Stoll, M. Everett, P.Hanrahan, WireGL: a scalable graphics system for clusters, in:Proceedings of the Computer Graphics on SIGGRAPH 2001,Annual Conference Series, ACM Press/ACM SIGGRAPH,2001, pp. 129–140.
[5] J. Leigh, O. Yu, D. Schonfeld, R. Ansari, et al., Adap-tive networking for tele-immersion, in: Proceedings of theImmersive Projection Technology/Eurographics Virtual En-vironments (IPT/EGVE) Workshop, Stuttgart, Germany, May2001.
[6] O. Martin, The EU DataTAG Project, Global Grid Forum(GGF3), Frascati, Italy, 2001.http://datatag.web.cern.ch/datatag/presentations/GGF3-Frascati.ppt.
[7] S. Molnar, M. Cox, D. Ellsworth, H. Fuchs, A sortingclassification of parallel rendering, IEEE Comput. Graph.Appl. 14 (4) (1994) 23–32.
[8] SABUL (Simple Available Bandwidth Utilization Library),2002.http://www.dataspaceweb.net/sabul.htm.
[9] Tsunami, 2002.http://www.anml.iu.edu/anmlresearch.html.[10] T. van der Schaaf, L. Renambot, D. Germans, H. Spoelder,
H. Bal, Retained mode parallel rendering for scalable tileddisplays, in: Proceedings of the Sixth Annual ImmersiveProjection Technology (IPT) Symposium, Orlando, FL, March2002.
Luc Renambot is currently a postdoc-toral research associate of the Vrije Uni-versiteit in Amsterdam, The Netherlands.He received in 2000 a PhD in computersciences from the Universite de Rennes1, France, within the INRIA researchinstitute. His research interests includehigh-performance and parallel computing,computational steering, virtual reality en-vironments, and computer graphics.
Tom van der Schaaf is a PhD student at the Computer ScienceDepartment of the Vrije Universiteit of Amsterdam. He earned MSin computer science at the same university in 2001. His researchinterests include parallel graphics and collaborative applicationsfor scientific visualization.
Henri E. Bal received a MSc in mathe-matics from the Delft University of Tech-nology in 1982 and a PhD in computerscience from the Vrije Universiteit in Am-sterdam in 1989. His research interestsinclude parallel and distributed program-ming, cluster computing, and program-ming languages. At present, Dr. Bal is afull professor at the Vrije Universiteit. Heis a member of the ACM and IEEE CS.
Desmond Germans is a PhD student atthe Physics Applied Computer ScienceGroup of the Vrije Universiteit of Ams-terdam. He earned MS in physics at thesame university in 1998. His research in-terests include high-performance graph-ics and interactive applications in virtualreality.
Hans J.W. Spoelder studied experimen-tal physics and received the PhD degreein biophysics in 1987, at the Vrije Uni-versiteit in Amsterdam, The Netherlands.Dr. Spoelder is presently an associatedprofessor at Physics Applied ComputerScience Group. Since then, he has beena faculty member of the Physics Ap-plied Computer Science Group, Divisionof Physics and Astronomy, Vrije Univer-
siteit. In 1991, he was visiting scientist as IBM T.J. Watson re-search Center, Hawthorne, NY. His research interest is in thefield of interactive visualization, virtual realities, high performancecomputing and computational steering.


![Immersive Visualization for Enhanced Computational Fluid ......available optical coherence tomography (OCT) imaging system with associated software [17] (LightLab, St. Jude Medical,](https://img.pdfslide.us/doc/110x75/5f63ed1597c7900985467ee2/immersive-visualization-for-enhanced-computational-fluid-available-optical.jpg)