Embed Size (px)
Citation preview

Norwegian Meteorological Institute
Gridded observation data for
Climate ServicesOle Einar Tveito, Inger Hanssen–Bauer, Eirik J. Førland and
Cristian Lussana
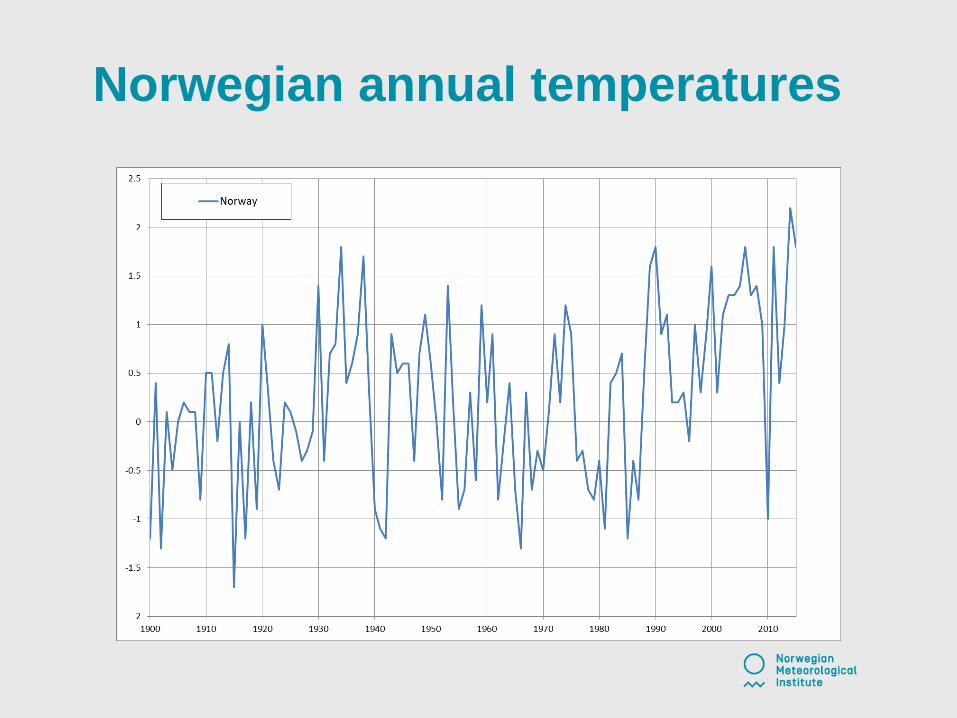
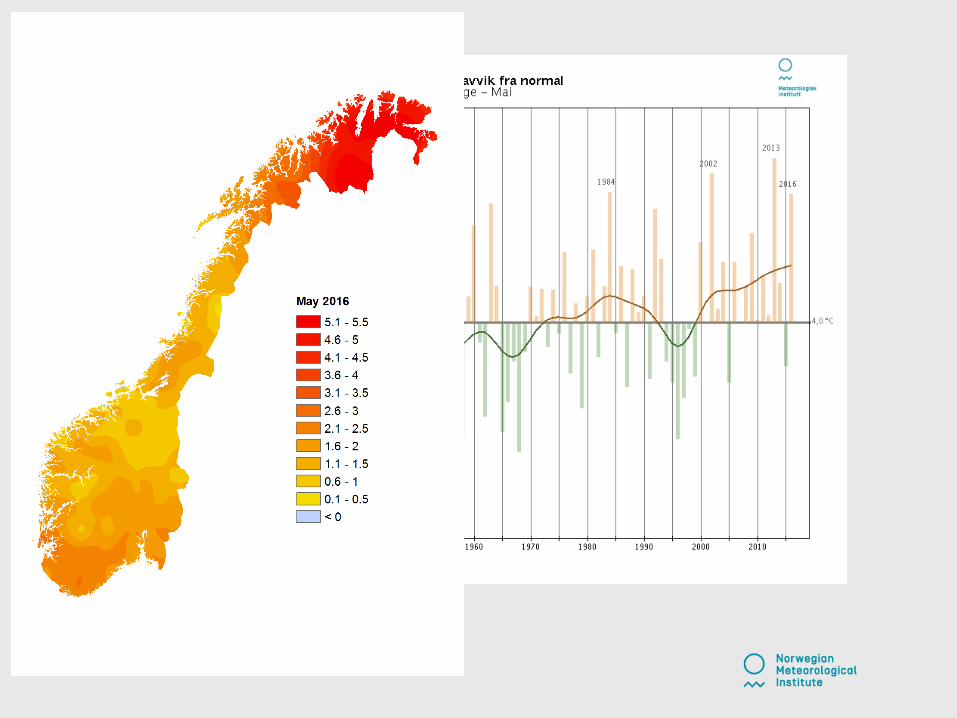
Norwegian annual temperatures

Norwegian annual temperatures

Norwegian annual temperatures

Norwegian annual temperatures

Gridding of observation - aims to
• Provide fine scale climate information at any location or area of interest
• Provide data at relevant scales for various applications and purposes:
- Hydrology
- Agriculture and forestry
- Infrastructure (roads, railways, electricity grids, municipalities)
- Energy
- Tourism
- ….
• Provide a observation basis for understanding and adapting to climate change
• “Truth” for calibrating post-processing (bias adjustment) of RCM / Dyn.Downscaling climate projection data.
• Given robust gridding methods provide space-time consistent and homogeneous information. (Local anomalies will often occur due to network changes
though)

Gridded observation data sets at
Met Norway.• Monthly, seasonal and annual data
- Period: 1900-present
- Variables: Temperature, Precipitation
- Methods: Spline interpolation of monthly anomalies.
- Derived products: Degree day grids.
• Daily values (two parallell datasets)- Period: 1957 - present
- Variables: Temperature, Precipitation, Wind (in development)
- Methods:
• Ver.1: Residual Kriging (temperature), Triangulation with terrain dependence (precipitation)
• Ver. 2: Bayesian spatial optimum interpolation (under operalization)
• Wind: Downcaling/post-processing of Hindcast data
- Datasets covering Fennoscandia based on both ver.1 and 2 are in progress as a part of the FP7 UERRA project.
• Hourly values- Period: 2010-present
- Variables: Temperature and precipitation
- Bayesian spatial optimum interpolation (under operalization)
• Spatial resolution: 1x1 km
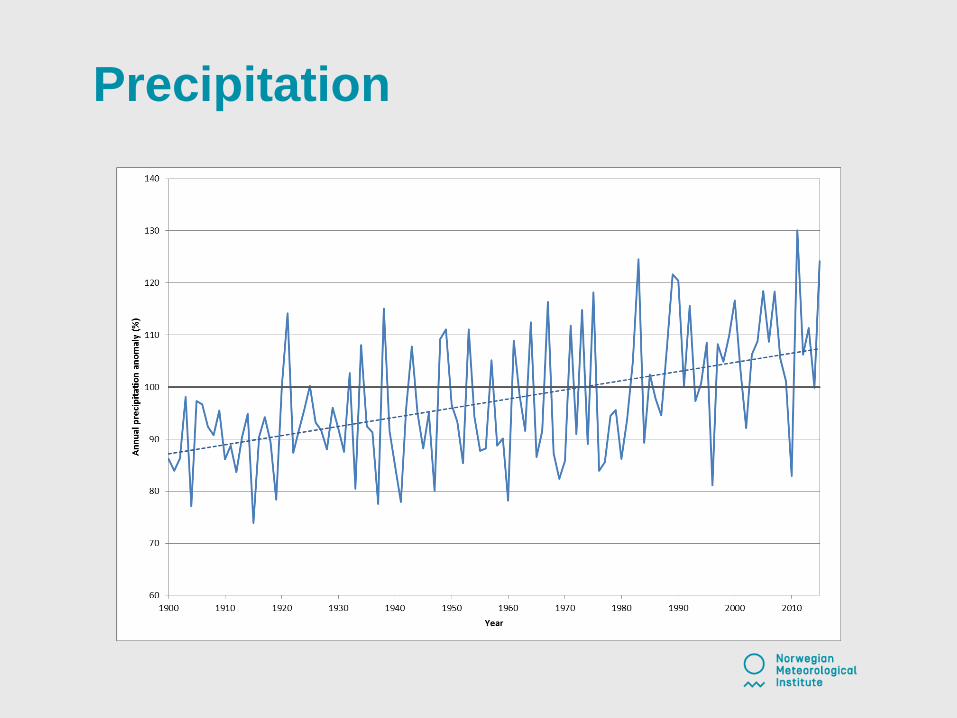
Precipitation

Days with precipitation
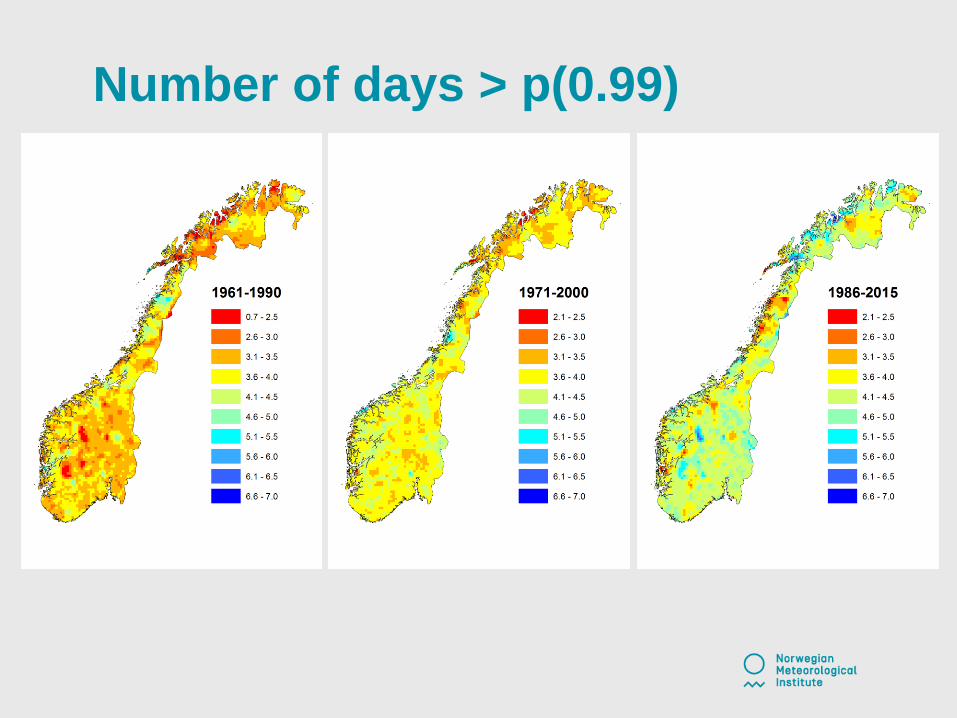
Number of days > p(0.99)
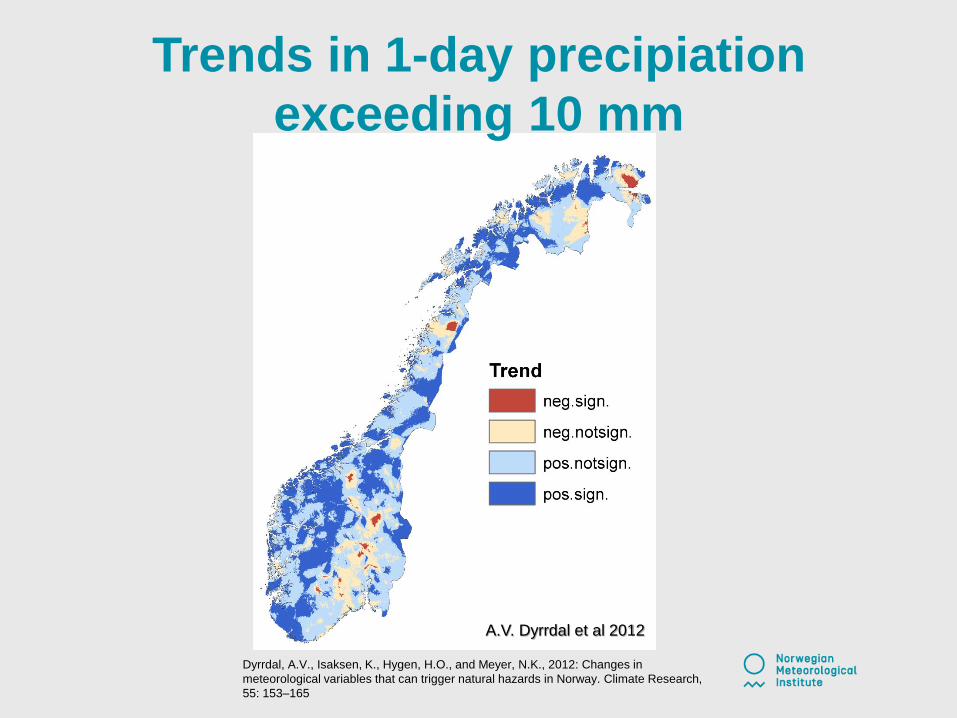
Trends in 1-day precipiation
exceeding 10 mm
A.V. Dyrrdal et al 2012
Dyrrdal, A.V., Isaksen, K., Hygen, H.O., and Meyer, N.K., 2012: Changes in
meteorological variables that can trigger natural hazards in Norway. Climate Research,
55: 153–165
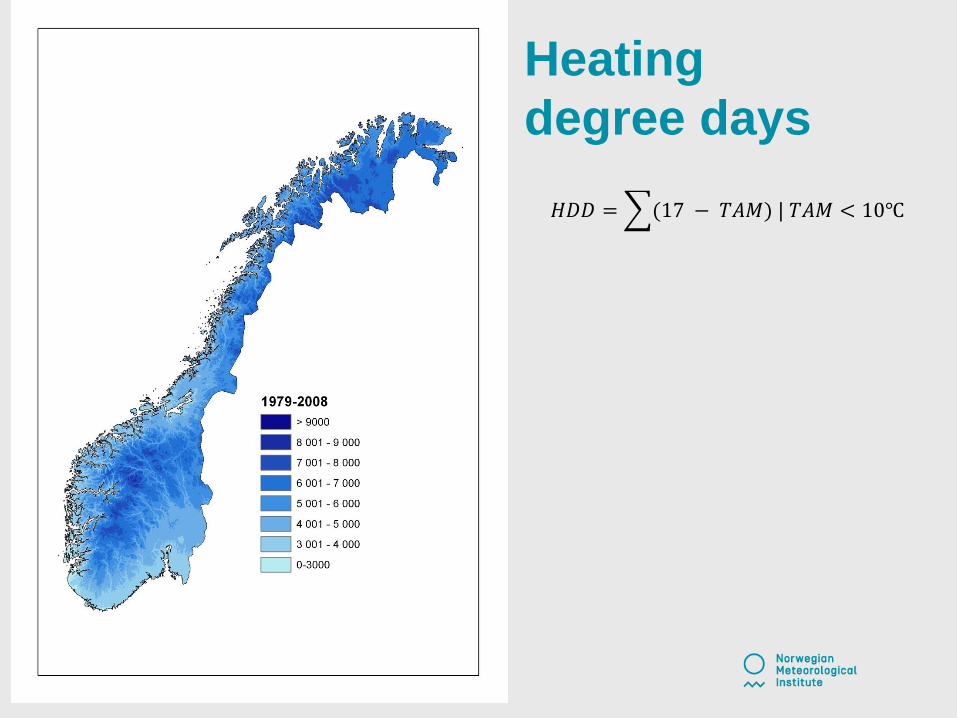
Heating
degree days
𝐻𝐷𝐷 = (17 − 𝑇𝐴𝑀) | 𝑇𝐴𝑀 < 10℃

Heating
degree days
𝐻𝐷𝐷 = (17 − 𝑇𝐴𝑀) | 𝑇𝐴𝑀 < 10℃

Growing degreedays in Oslo-Blindern 1961-2012
1000
1100
1200
1300
1400
1500
1600
1700
1800
1900
2000
1960 1965 1970 1975 1980 1985 1990 1995 2000 2005 2010

Norwegian Meteorological Institute
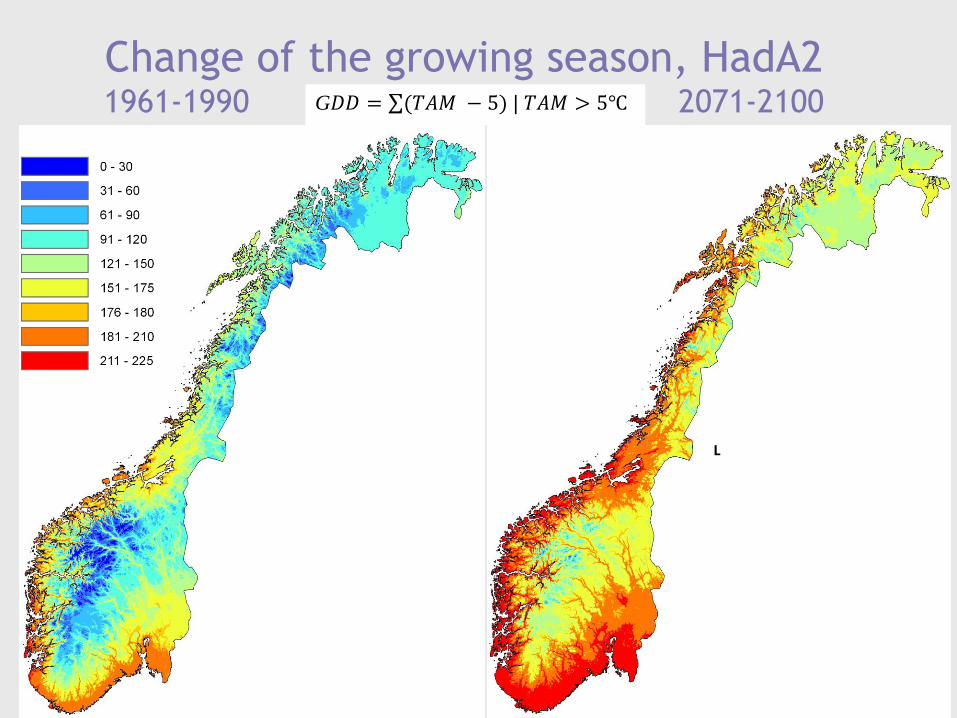
Change of the growing season, HadA21961-1990 2071-2100G𝐷𝐷 = (𝑇𝐴𝑀 − 5) | 𝑇𝐴𝑀 > 5℃
Norwegian Meteorological Institute
Change of the growing season, HadA21961-1990 2071-2100G𝐷𝐷 = (𝑇𝐴𝑀 − 5) | 𝑇𝐴𝑀 > 5℃

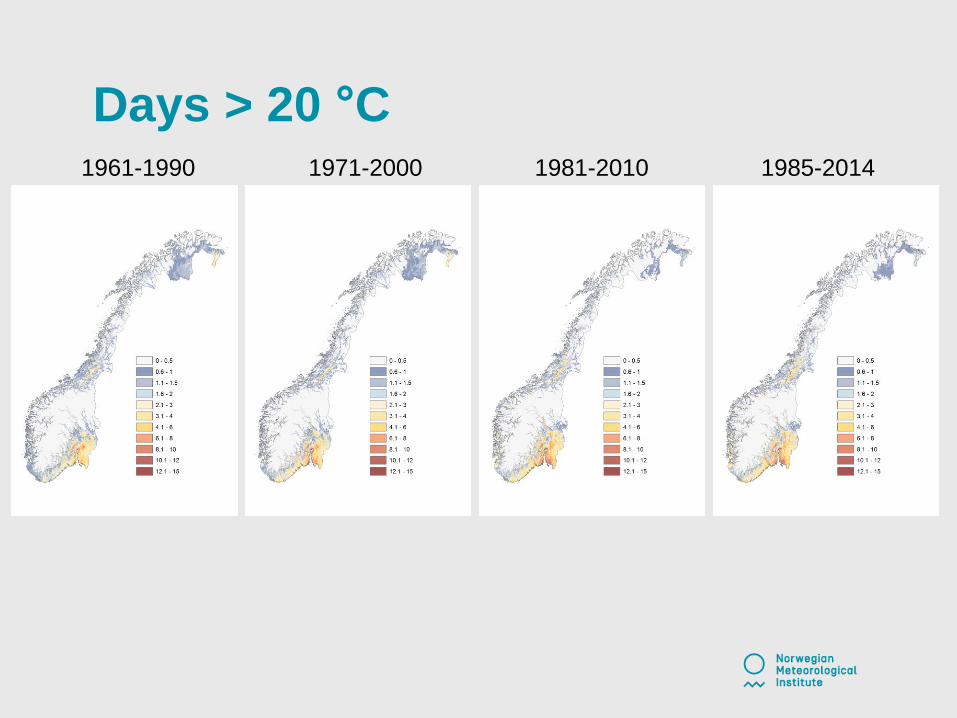
Days > 20 °C1961-1990 1971-2000 1981-2010 1985-2014
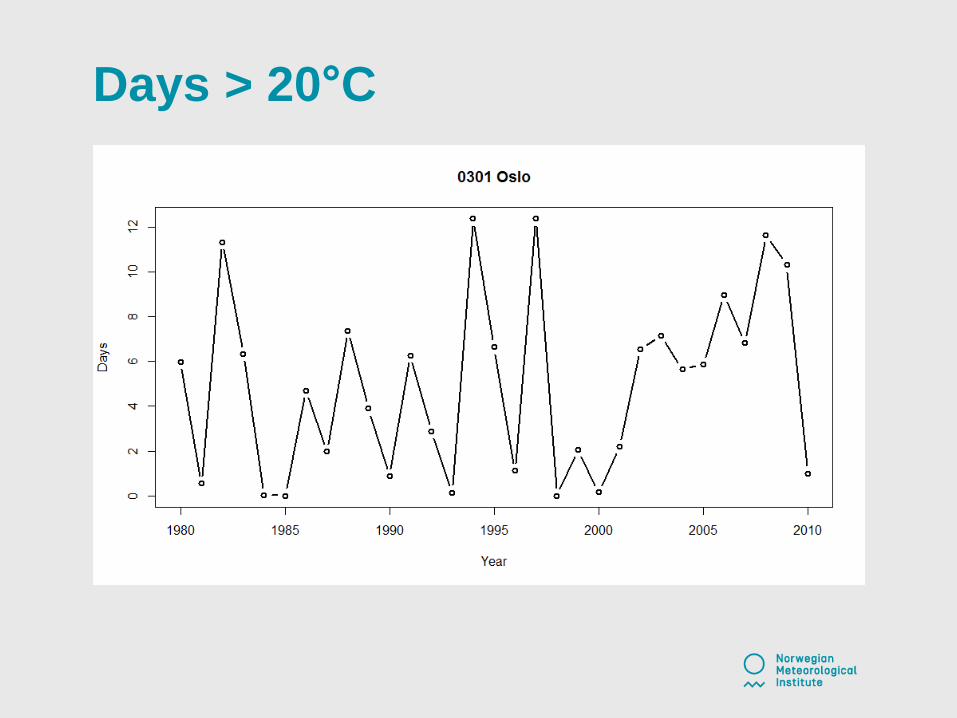
Days > 20°C
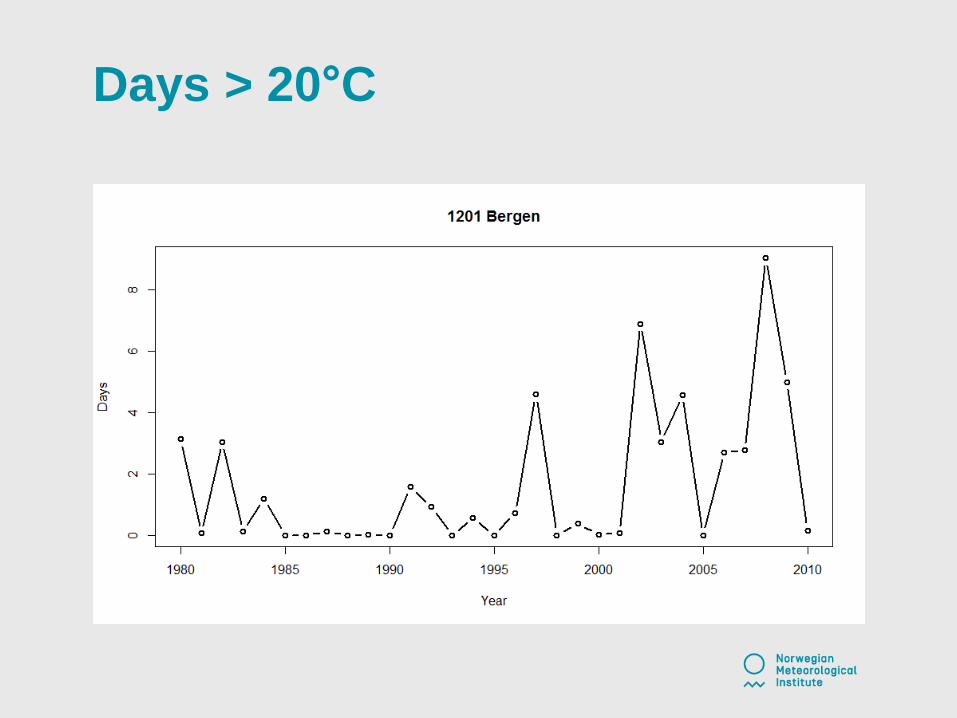
Days > 20°C
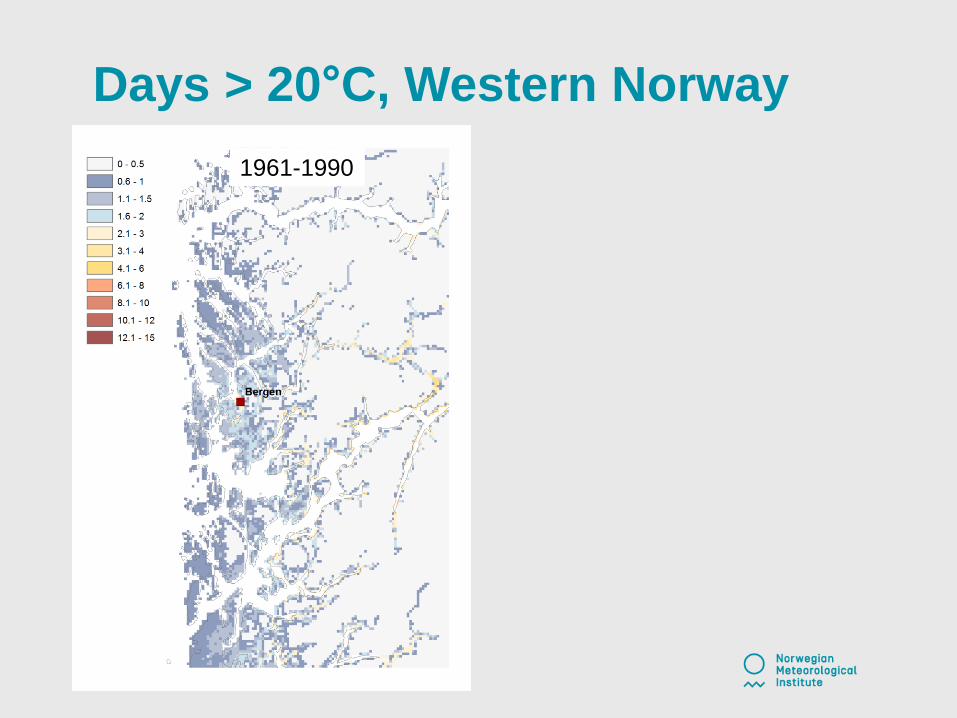
Days > 20°C, Western Norway
1961-1990

Days > 20°C, Western Norway
1961-1990 1985-2014
Days > 20 °C1961-1990 1971-2000 1981-2010 1985-2014
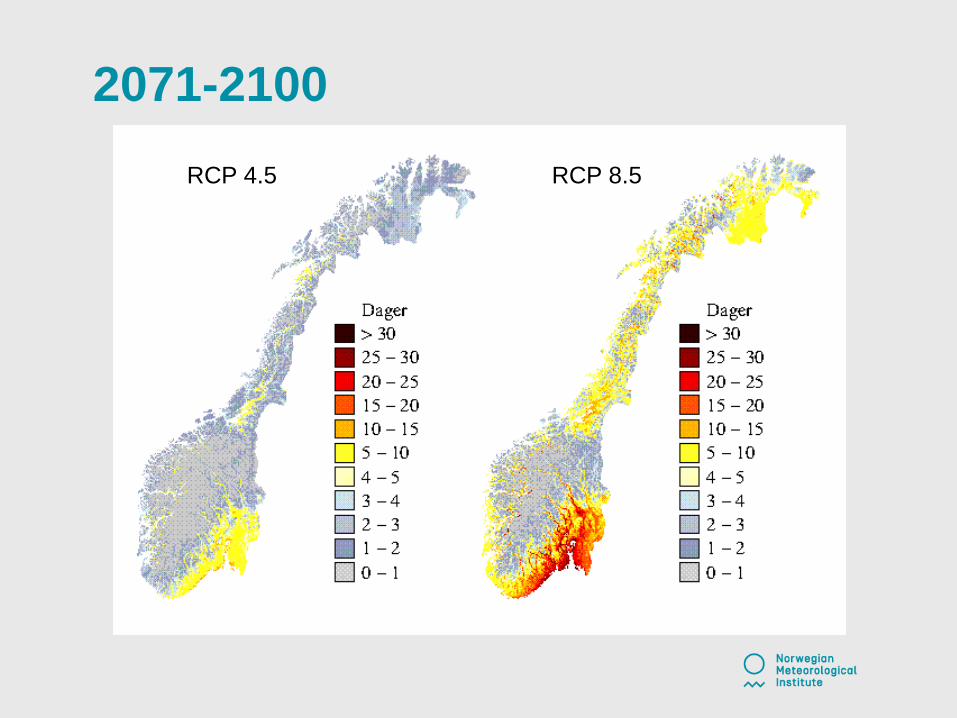
2071-2100
RCP 4.5 RCP 8.5

Shorter winters!
• Norwegian less dominant in cross-country skiing?
- We will still have areas with winter conditions though…..
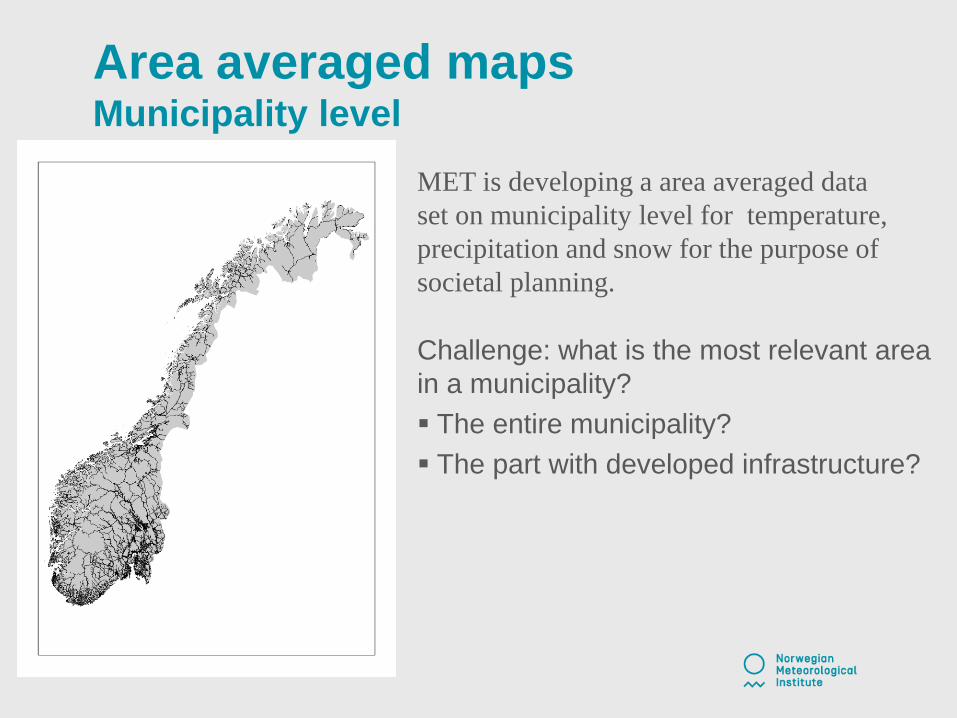
Area averaged mapsMunicipality level
MET is developing a area averaged data
set on municipality level for temperature,
precipitation and snow for the purpose of
societal planning.
Challenge: what is the most relevant area
in a municipality?
The entire municipality?
The part with developed infrastructure?
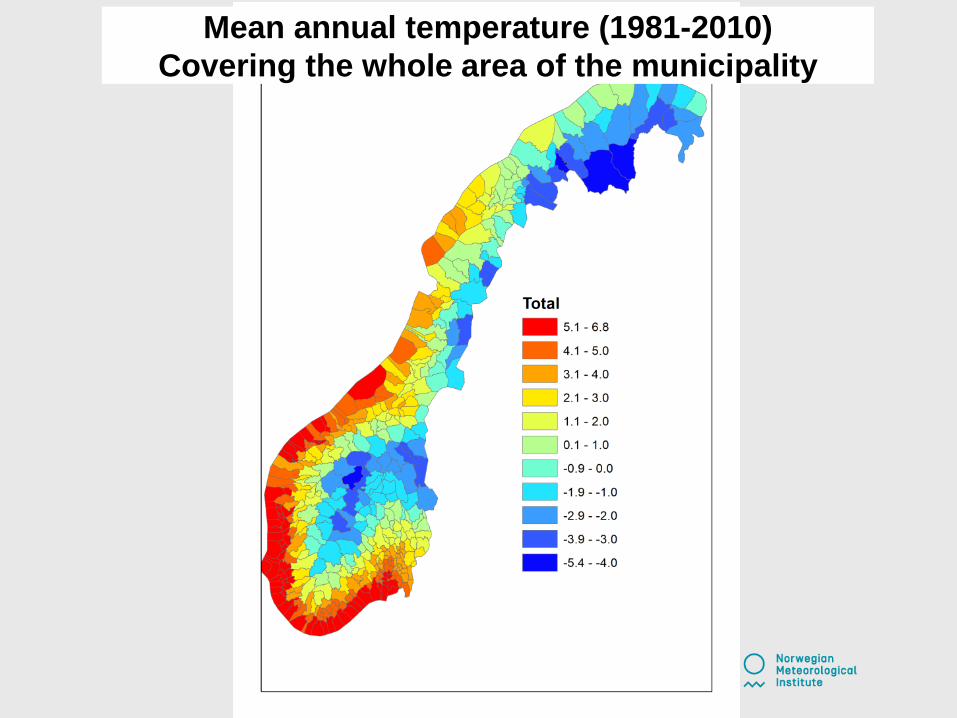
Mean annual temperature (1981-2010)
Covering the whole area of the municipality
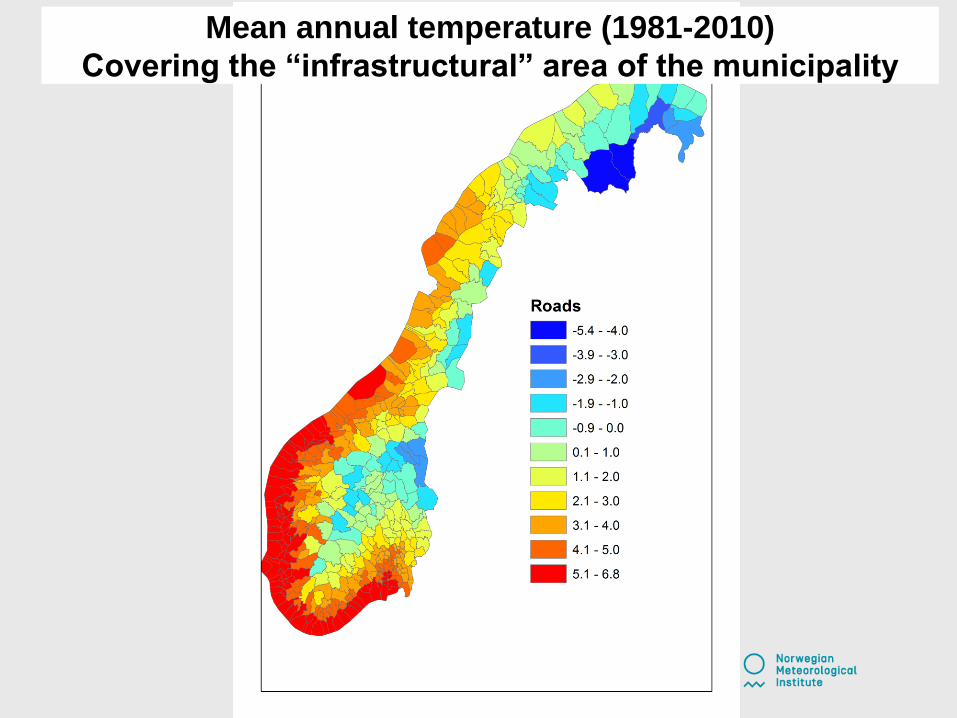
Mean annual temperature (1981-2010)
Covering the “infrastructural” area of the municipality

Observation griddingHow we are doing it…

Klimagrid v 2.0
● Replace the current Klimagrid1.1 (SeNorge1.1)
● seNorge: gridded datasets; Norwegian mainland +parts of Sweden and
Finland; 1Km resolution
● source: Observations from MET Norway Climate database (manual +
automatic weather station data)
● Precipitation 1h (RR_1)
● Precipitation 3h (based on hourly observations)
● Temperature hourly (TA)
● Precipitation daily (RR)
● Temperature daily mean (TAM)
Periods:Hourly datasets 2010.01.01 onwards (hourly updated)Daily datasets 1957.01.01 onwards (updated daily)

Klimagrid 1.1Temperature and precipitation
• Period: 01.01.1957 – present
• Resolution: 1x1 km
• Cover mainland Norway.
Daily mean temperature 16.March 2015
Daily precipitation 29.October 2014

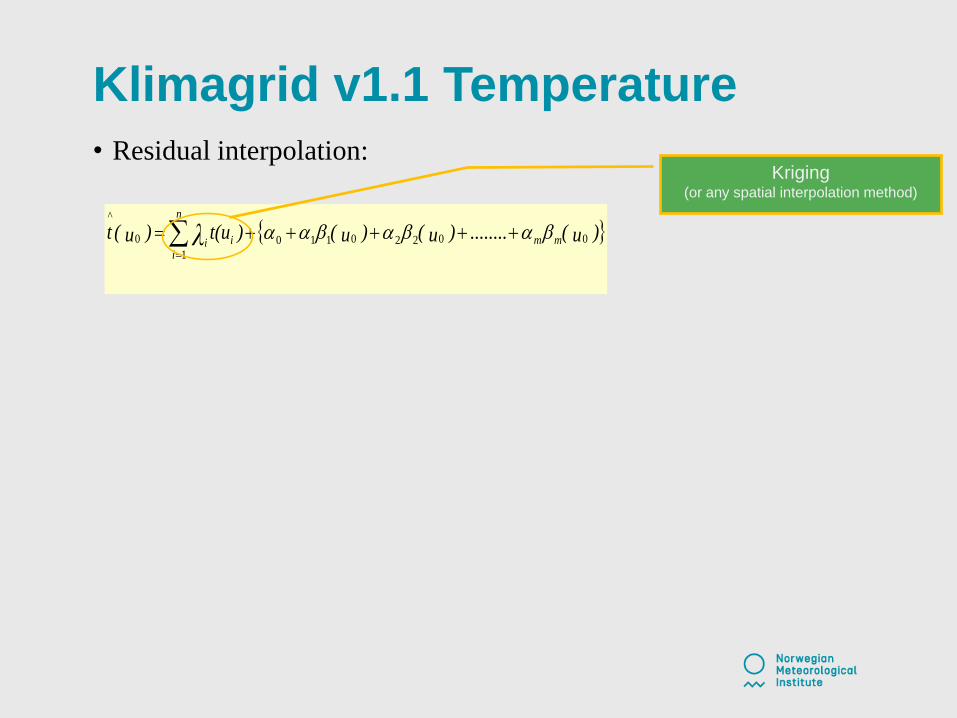
Klimagrid v1.1 Temperature
• Residual interpolation:
)u()u()u()t(u)u(t mm
n
i
ii
^
λ 00220110
1
0 ........
Klimagrid v1.1 Temperature
• Residual interpolation:
)u()u()u()t(u)u(t mm
n
i
ii
^
λ 00220110
1
0 ........
Kriging (or any spatial interpolation method)
Klimagrid v1.1 Temperature
• Residual interpolation:
)u()u()u()t(u)u(t mm
n
i
ii
^
λ 00220110
1
0 ........
External trend/drift
(linear regression)
Kriging (or any spatial interpolation method)

Klimagrid v1.1 Temperature
• Residual interpolation:
)u()u()u()t(u)u(t mm
n
i
ii
^
λ 00220110
1
0 ........
External trend/drift
(linear regression)
Kriging (or any spatial interpolation method)

Klimagrid v1.1 Temperature
• Residual interpolation:
)u()u()u()t(u)u(t mm
n
i
ii
^
λ 00220110
1
0 ........
External trend/drift
(linear regression)
Kriging (or any spatial interpolation method)
-1.000
-0.800
-0.600
-0.400
-0.200
0.000
0.200
0.400
Jan Feb Mar Apr May Jun Jul Aug Sep Oct Nov Dec
Co
rrela
tio
n c
oe
ffic
ien
ts
MonthLAT LONG ALT
DEM_MEAN DEM_MIN
-0.5
-0.4
-0.3
-0.2
-0.1
0
0.1
0.2
-0.01
-0.008
-0.006
-0.004
-0.002
0
0.002
0.004
1 2 3 4 5 6 7 8 9 10 11 12
Coef
fici
ents
posi
tion
Coef
fici
ents
ter
rain
Month
ALT DEM_MEAN DEM_MINLAT LONG

Trend climatological first guess

Norwegian Meteorological Institute
NGCD.RK @ MET Norway – TEMP1d - Evaluation
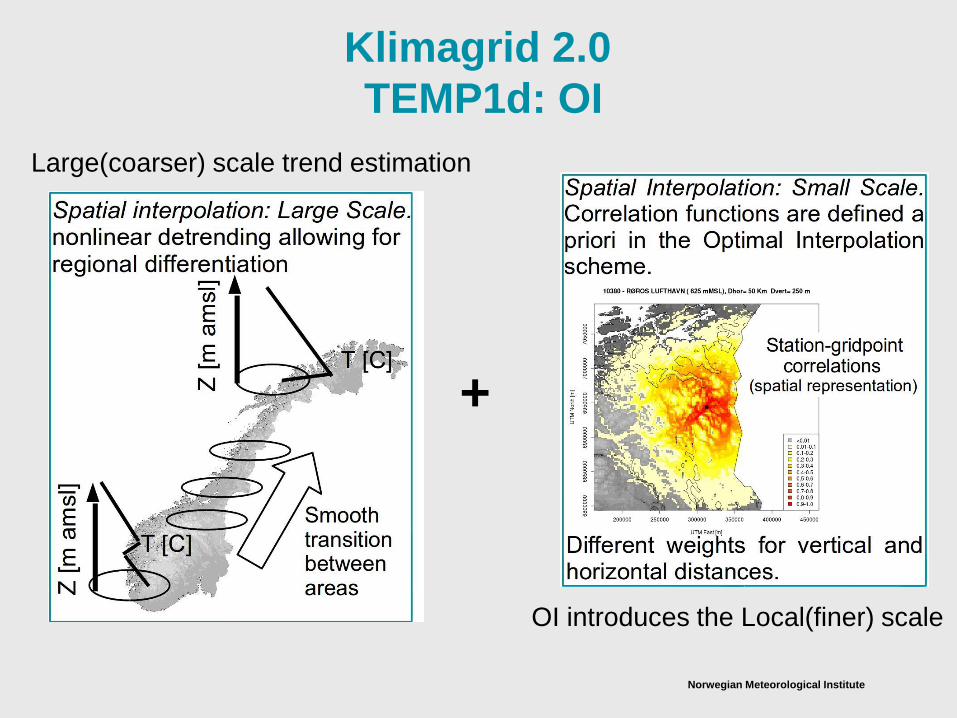
Norwegian Meteorological Institute
Large(coarser) scale trend estimation
+
OI introduces the Local(finer) scale
Klimagrid 2.0
TEMP1d: OI

Temperature
• Spatial interpolation method is
the same both for hourly and
daily (in the future, it is possible
that a post-processing of 24
hourly temperature fields will be
used a first guess for the daily
spatial interpolation)
• Spatial Interpolation method:
hourly temperature – Large scale
after de-trending
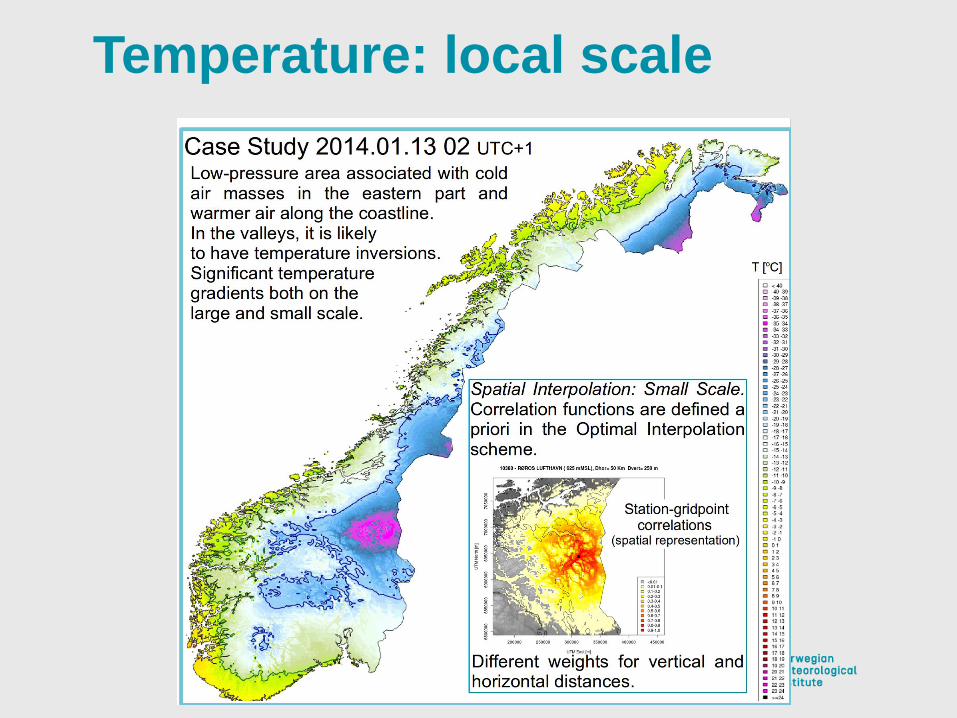
Temperature: local scale

Norwegian Meteorological Institute
Old method New method
New method
reduce estimation
error.
(RMSE, independent
cross-validation)

Precipitation v1.1• Triangulation.
• Includes elevation dependence.
• Correction for wind-loss.
=-
x =
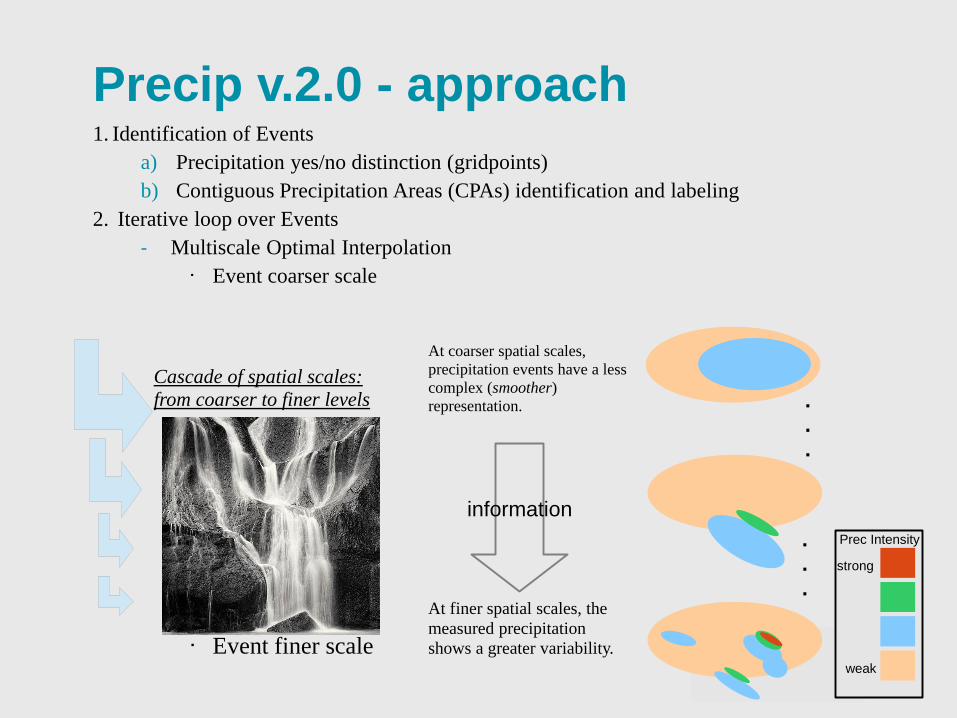
Precip v.2.0 - approach1. Identification of Events
a) Precipitation yes/no distinction (gridpoints)
b) Contiguous Precipitation Areas (CPAs) identification and labeling
2. Iterative loop over Events
- Multiscale Optimal Interpolation
· Event coarser scale
· Event finer scale
Prec Intensity
weak
strong
Cascade of spatial scales:
from coarser to finer levels ...
.
.
.
At coarser spatial scales,
precipitation events have a less
complex (smoother)
representation.
At finer spatial scales, the
measured precipitation
shows a greater variability.
information
Norwegian Meteorological Institute
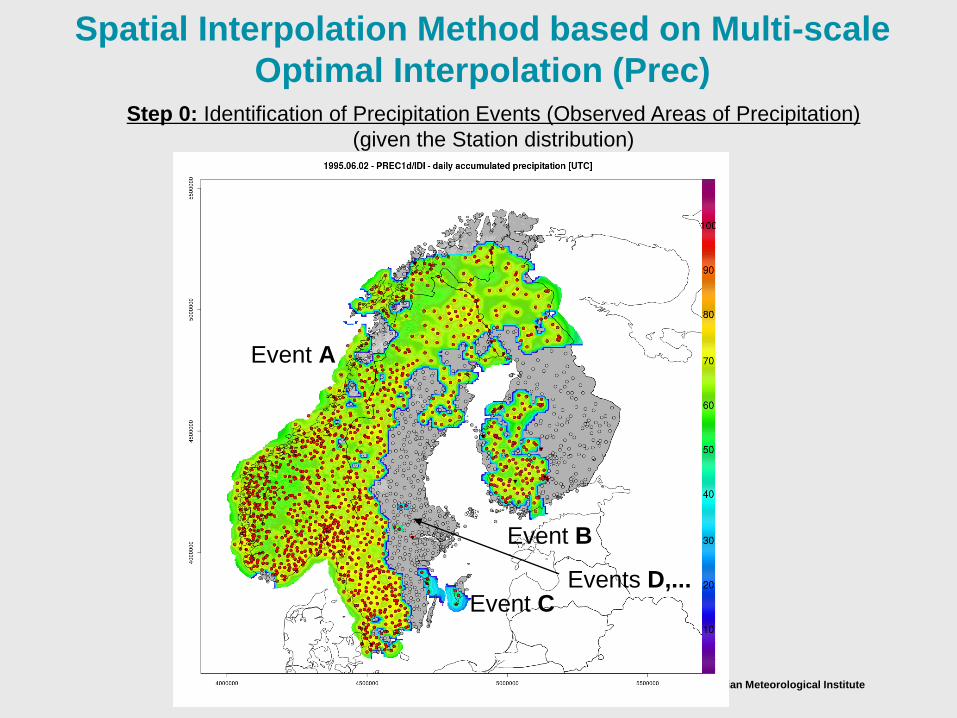
Spatial Interpolation Method based on Multi-scale
Optimal Interpolation (Prec)Step 0: Identification of Precipitation Events (Observed Areas of Precipitation)
(given the Station distribution)
Event A
Event B
Event CEvents D,...

Norwegian Meteorological Institute
Step-by-step: from coarser to local scale
Mu
lti -Scale
Op
timal In
terp
ola
tion

Norwegian Meteorological Institute
Step-by-step: predicted field
Mu
lti -Scale
Op
timal In
terp
ola
tion
Challenges & limitations (i)
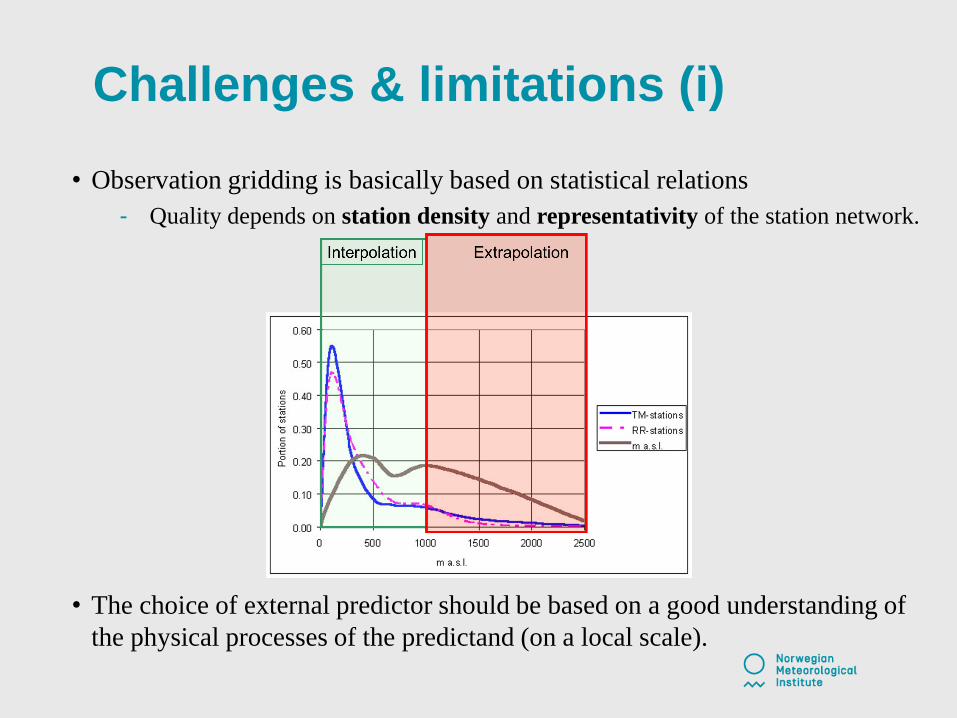
• Observation gridding is basically based on statistical relations
- Quality depends on station density and representativity of the station network.
• The choice of external predictor should be based on a good understanding of
the physical processes of the predictand (on a local scale).

Challenges & limitations (ii)
• Combine datasources?
- Observations
- Radar
- Model fields (NWP, RA)
• Ensemble gridding?
- Conditional stochastic simulations
- Bayesian statistical analysis (OI) in «an
ensemble» mode
- Analogue techniques
- Atm. circulation as conditional input?’
- Observations itself set the conditions?
Challenges & limitations (iii)
High resolution timeseries are more «noisy» than long-term data
series spatial covariance is lower (estimates are more uncertain)
and the «signal» is weaker.
Physical concistency between elements (precip, temperature) will
not be retained.
For long-term data with «low» (daily, monthly….) resolution
observation gridding provide useful and precise information. For
historical dataseries (> 50 years) it is probably the best (only)
reference.

Future
• NWP, RCM and RRA models are «chasing» the spatial resolution
of observation gridding.
- Provide physical consistent data
- Spatial scale is an issue. 4-5 x the resolution.
• The gap between observation gridding and atmospheric model
approaches for providing climatological data are ready be closed.
- Apply gridding concepts in postprocessing of NWP/RA
- Apply NWP/RA fields as first guess
- Independent validation