Embed Size (px)
Citation preview

GREGARIOUSNESS AND SCHOOL BEHAVIOUR OF PELAGIC FISH : IMPACT OF THE ACOUSTICS EVALUATION AND FISHERIES
F. GERLOTTO
ABSTRACT Pelagic fish (Clupeids, Carangids, Engraulids, Scombroids, etc.) are normally forming dense schools,
gathering over tens of thousands of individuals. This paper defines the concept of fish schools for fishery acoustics, and describes briefly their main dynamic mechanisms. The kind of spatial distribution, due to this behaviour, makes necessary the design of appropriate sampling methodologies. This paper also describes the main acoustic tools applied on fisheries studies, and their characteristics. The effect of the heterogeneity in the spatial distribution of fish density is discussed. The impact of gregariousness on the validity of acoustic data is described, as well as the main behavioural features : horizontal and vertical school avoidance, acoustic shadowing, diving and dial cycles are factors to be taken into account in the acoustic methodology. Under some favourable conditions these behavioural characteristics may help to improve the knowledge of a stock, and sometimes to identify the species. KEYWORDS : Acoustics, methodology, school, behaviour, biomass, deviation.
ABSTRAK Jenis-jenis ikan pelagis (Clupeidae, Carangidae, Engraulidae, Scombridae dan lainnya) ummumnya
membentuk kelompok yang padat yang terdiri atas ribuan individual. Tulisan inì mendefinisikan pengertian dan penjelasan singkat tentang kelompok ikan pada akustik perikanan serta dinamikanya. Sifat distribusi spasial yang berhubungan dengan tingkah Iakunya menyebabkan perlunya rancangan yang sesuai pada metodologi pengambilan contoh pada saat penelitian. Tulisan ini juga menjelaskan aplikasi metoda akustik pada penelitian perikanan serta karakteristiknya. Demikian pula pengaruh heterogenitas pada distribusi spasial kepadatan ikan, peranan sifat pengelompokan ikan, pola tingkah laku, penghindaran mendatar dan tegak, “acoustic shadowing” serta ruaya harian yang merupakan faktor-faktor yang harus diperhitungkan terhadap data pada aplikasi metoda akustik. Pada keadaan tertentu pola tingkah laku tersebut dapat membantu perkembangan pengetahuan suatu stok bahkan pengenalan jenis ikannya. KATA KUNCI : Akustik, metodologi, kelompok ikan, tingkah laku, biomas, penyimpangan.
The gregariousness and behaviour of the pelagicfish on îhe Schoof. 23 3
One of the most remarkable characteristics of fish behaviour is their gregariousness. The great majority of species is permanently or occasionally (during one life episode or only seasonal) grouped in schools. This behaviour turns out to be of great importance for exploitation: about 70 million tons of the annually ocean fish product (FAO, 1995), almost 80 YO, come from gregarious species. Fishing adapted to this behaviour turn into an advantage : should it be that oceans had to be filtered through to extract fish, exploitation costs would turn greatly higher than they actually do, thanks to devices adapted to this behaviour such as trawls and ring nets. Theses are the most productive fishery devices ever invented, and particularly since these acoustics tools can locate schools in water. They have been designed keeping in mind gregarious behaviour.
Meanwhile, this gregarious behaviour shows several spatial and temporal features, that have a strong impact on acoustics assessments : dispersal, concentrations, dynamic behaviour, etc. This work describes the spatial characteristics and their impact.
WHAT IS A SCHOOL?
Definitions
The first scientific studies dealing with schools had been carried out upon an average of small- scale groups, only some individual or at most 10 subjects, inside several aquariums or ponds. Despite their limits, those works allowed to establish basic rules concerning gregarious behaviour. Be just named the pioneer works of Radakov (1973), which is still of authority. Subsequently, scientists tried to verify if this mechanism could be observed within Nature.
This opening to real life can be found in Bardach et al. (1980), for example, or in Pitcher (1986). But these in situ observations turned out to be difficult, and it is only since the 90's that studies about schools have been performant to really examine schools in their own natural environment.
To sum up a definition given by Soria and Dagorn (1992), "a school of fish can be described as a provisional group of individuals, generally from the same species, the same size and within the same biological cycle, united by a mutual attraction, and showing different degrees of coordination of their swim ability within a centered group. They maintain constant contact, mostly visual, but by acoustics and olfactory means as well. These individuals can, at any time, come to an organized action that uses the same biological skills for any member of the group. W e observe a synchronisation of individual movement inside the school." It also needs to be distinguished right away between school and aggregation : "aggregations are collections of animals of one or several species. A n aggregation is a result of individual animal's attraction against a precise characteristics of the environment. W e talk about aggregation when social attraction does not exist (Eibl-Eibesfeldt, 1984)." (Soria and Dagorn, 1992).
Organization and functioning of a school
From visual observations and underwater photos, it had been believed for quite a while that schools were completely regular structures where fish occupy situations strictly linked to their neighbourhood. At such a point that some works show a "cristalline" structure of schools, where every fish occupy the place of an atom inside a rhomboedrique crystal lattice (Breder,1976). This structure was found on numerous observations, mainly carried out in isolated environment, even aquariums, that actually showed a tendency of a fish to place itself at an "optimal" distance from its neighbour. And the determinism of this position was based on individuals' reaction to sound and pressure waves emitted by fellow creatures.
Subsequently some writers, observing schools in their own natural environment, particularly with acoustics (Cushing, 1977; Gerlotto and Fréon, 1988; Misund, 1993) or visually, have refused the hypotheses that, in their general structure, schools showed a very strong heterogeneity, forming large empty vacuoles. These observations were in accordance with more general observations in acoustics
234
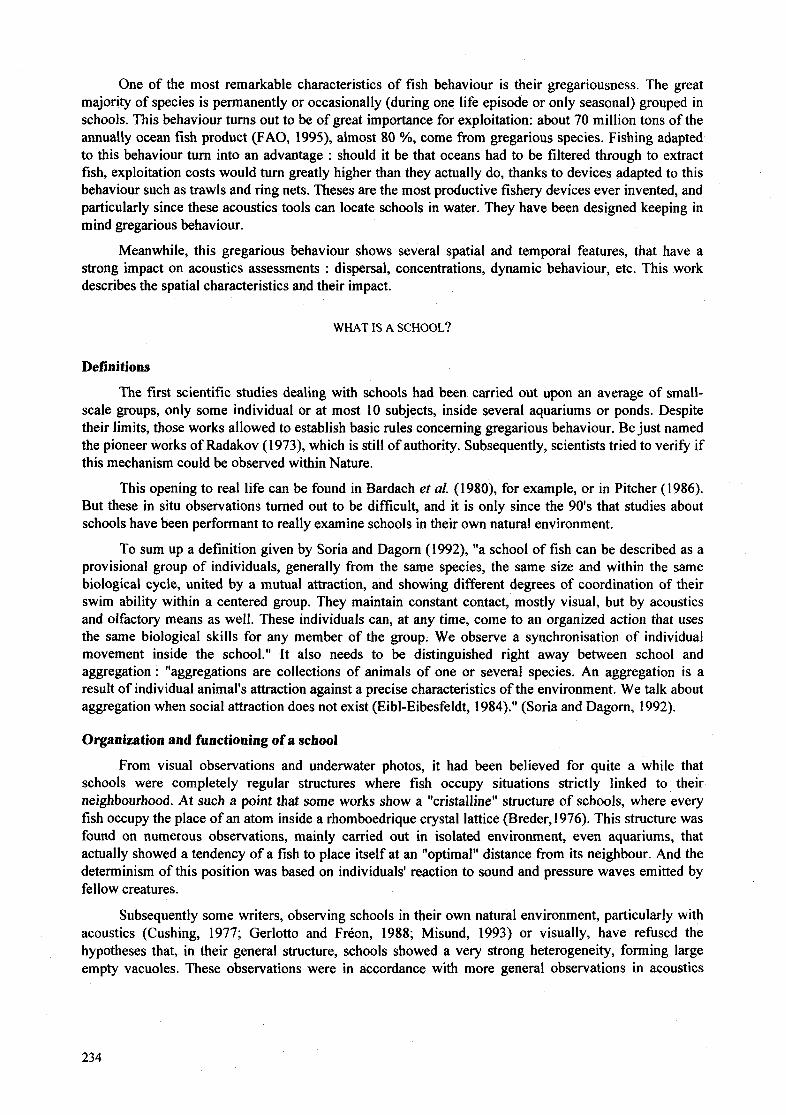
upon schools, with average densities from the majority of ocean species, which seldom are higher than 3 individuals per meter cubic (Simmonds et al., 1992), which was obviously contradictory to the theory on the school homogeneity (Fig.1).
, I O 50 100
T - 9 c u
3
7
11
15
19
23
O 10 20 30 40 50
I l l O 15 30 45
I
Horizontal dimension (m)
Remarks : Blind zone
Relative density
0 Bottom
Figure 1
Gambar 1
Density heterogeneity in three tropical Clupeid schools observed by vertical sounding (Freon et al., 1992). Heterogenitas kepadatan pada tiga pengelompokan Clupeid tropis (Freon et al., 1992).
A. Sardinella aurita (Venezuela) B. Sardinella maderensis (Cameroun) C. Harengulu sp (Martinique)
The gregariousness and behaviour of the pelagicfish on the school. 235
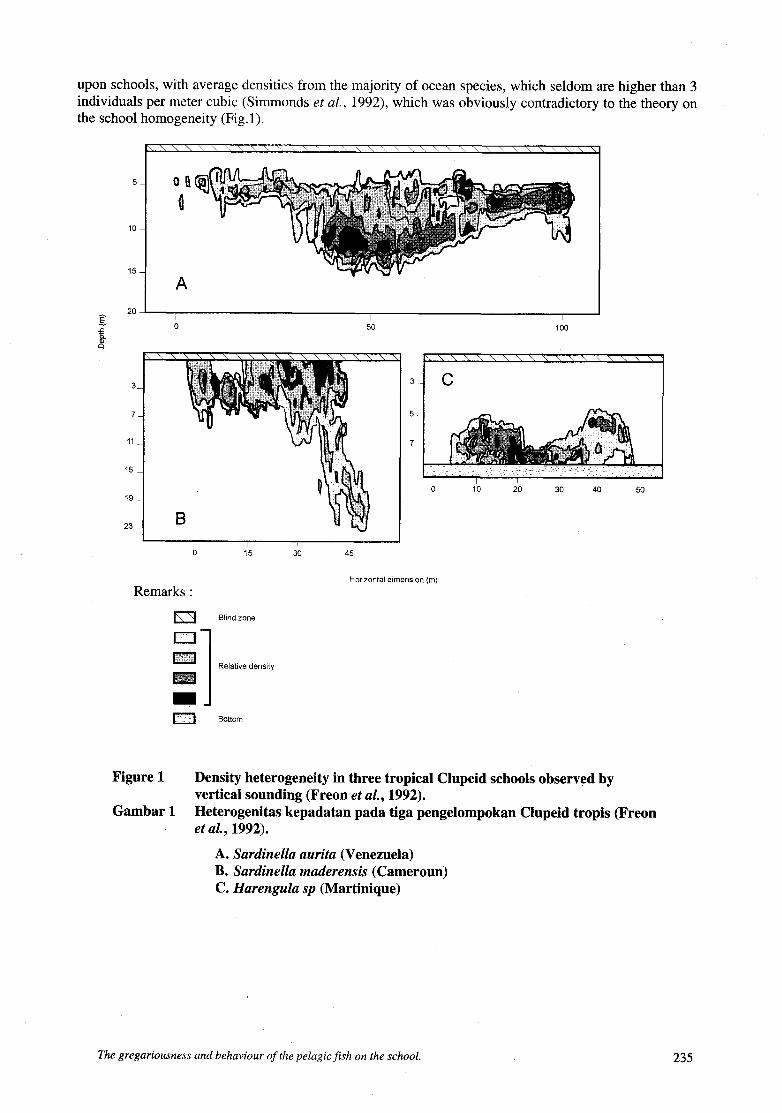
A certain number of assumptions about the dynamic and spatial function of schools, that can explain this obvious contradiction, were based on these observations. In fact, this should explain the steadiness of inter-individual distances and the heterogeneity of the school. W e present here the “stretch- split” (Fréon et al., 1992). The schools in their unity represent a “spongy tissue” formed by fish, around the vacuoles of various sizes. O n non-stress situation, fish show individualistic behaviours and the inter- individual distances vary relatively, continuously with less visual contact. In the phase of moving or stress, the fish use this regular spatial structure as often described, with polarization and synchronization of the reactions. In this matter the vacuoles form in a very visible manner (Fig. 2), due to the synthesis of the two basic tropisms :
Each fish tends to keep a constant distance from others. In this situation, for one reason or another, appear a slight “stretch” inside the school tissue. The fish situated at the break point choosing to remain with one or the other neighbour, but does not let the distance to the nearest neighbour overstep an alert threshold. The stretch comes then to a wrench then to an empty space, that will not be filled up by the following fishes. In fact, an empty space represents a dangerous zone for individuals. It often motivates a decrease of inter- individual distances, thus an extension of the empty space, until the moment it forms an important space that is passed over by the totality of the individuals. This wrench that, if alone could be a cause in preventing schools formation, is compensated by the fact that the fish shoals, or micro-schools, have a tendency to recast inside a more important unity. There is a gregarious reassemble, as soon as it is possible. This behaviour explains why, once the empty space (wrench) has been shaped, the group of fishes bordering this volume, as far as they keep visual contact, tend to be closer. In a second time, space then tends to decrease because of banks attractions, and the vacuole is then formed. These hypotheses have been successfully tested by simulation of artificial life.
General characteristic of schools
Schools abide by a series of behavioural and functional features. To summarize, a school is : a temporal gathering of individuals sharing common characteristics, altogether in
a spatial structure constructed from basic behavioural reactions, a dynamic structure the function of which (in term of evolutional adaptation) should be essentially anti-predatory (resulting of confusion for a predator because of synchronous reactions of unrecognizable individuals).
anatomy, physiology and behaviour,
Furthermore the school structures vary according to different factors :
The biological rhythm; the school structures vary in cyclical way, particularly on 24 hours cycles. Generally the structure is much looser, even absent at night and more concentrated at day. This observation has been renewed several times ever since, see Fréon et al. (1993; 1996) for more. This basic sketch undergoes several exceptions. The light impact appears to be determining : according to the tearing diagram hereafter, it can be seen that, if inter- personal contact is both supported by visual and acoustic stimuli (pressure field created by fish moves and detected by their horizontal line), the border rapprochement of the vacuole, even of “micro-schools” is essentially allowed by visual contact. When luminosity decreases, these rapprochements become more difficult, and the fish groups “lose contact.“ The school decreases notably in size. If the illumination completely disappears, the individual contact becomes difficult to keep and the dismissal becomes total (case of full moon periods). The fish are also capable to receive an illumination intensity extremely weak (Glass et al., 1986), so the school can preserve itself during the night, when the moon is present, even by cloudy skies.
236
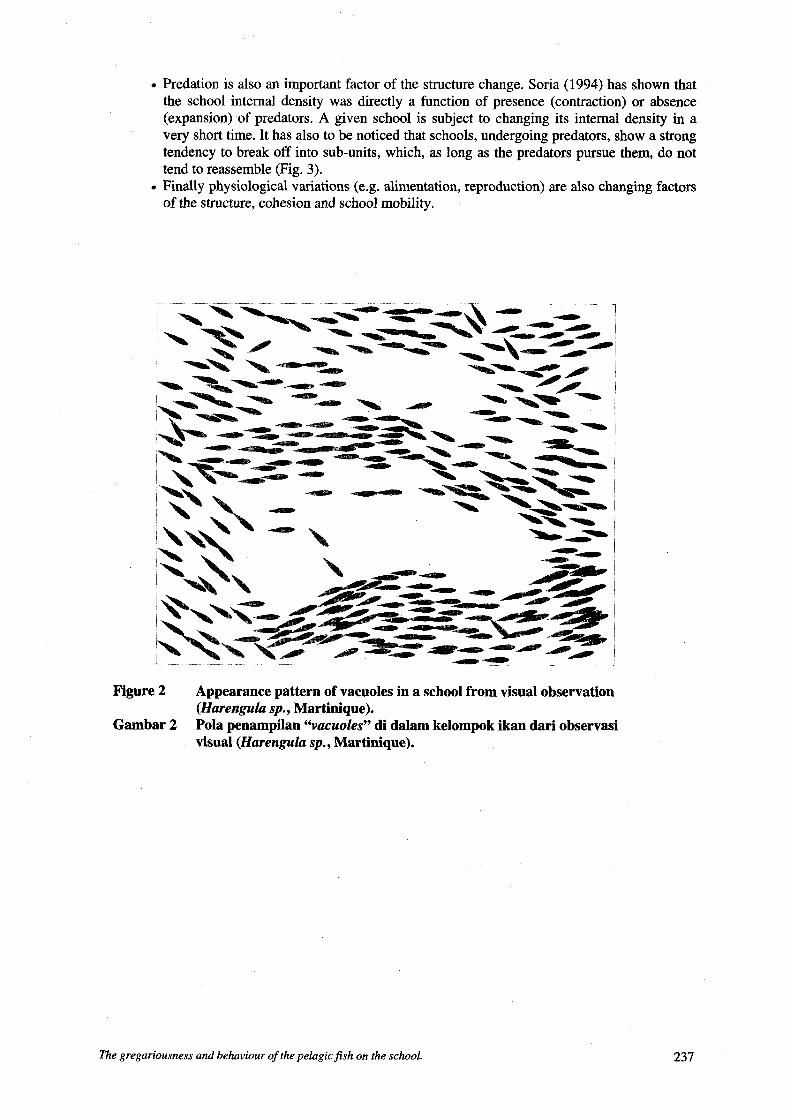
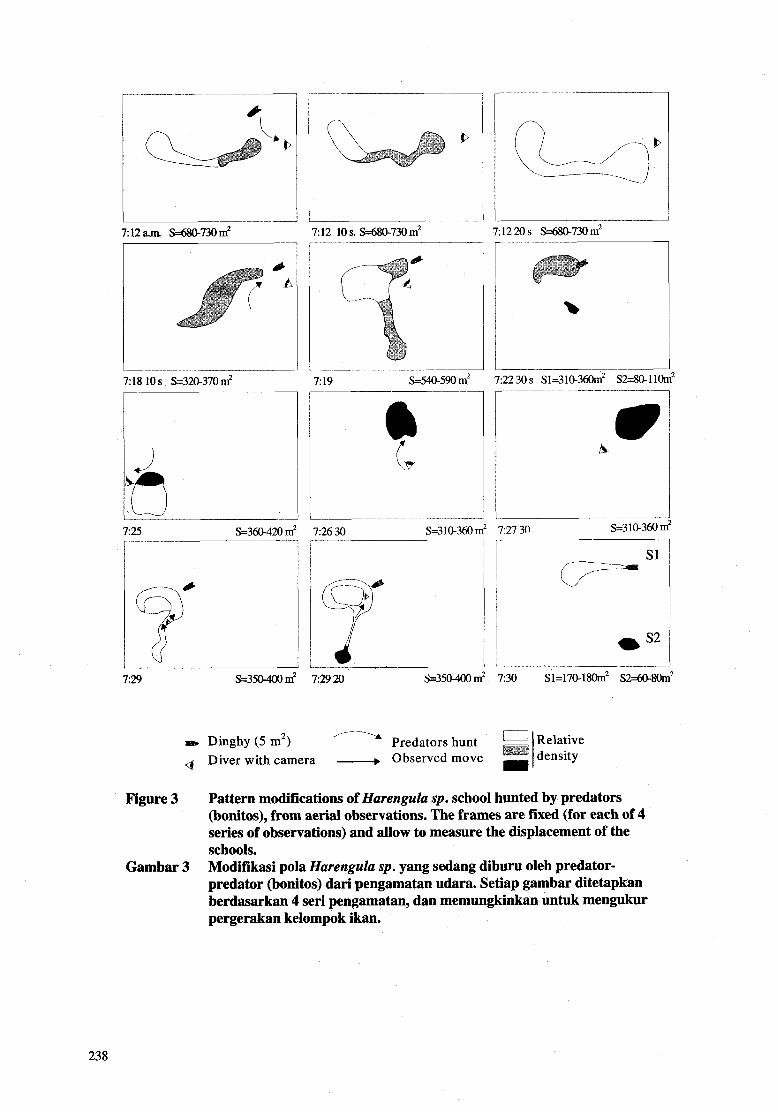
Predation is also an important factor of the structure change. Soria (1994) has shown that the school internal density was directly a function of presence (contraction) or absence (expansion) of predators. A given school is subject to changing its internal density in a very short time. It has also to be noticed that schools, undergoing predators, show a strong tendency to break off into sub-units, which, as long as the predators pursue them, do not tend to reassemble (Fig. 3). Finally physiological variations (e.g. alimentation, reproduction) are also changing factors of the structure, cohesion and school mobility.
Figure 2
Gambar 2
Appearance pattern of vacuoles in a school from visual observation (Harenguh sp., Martinique). Pola penampilan “vacuoles” di dalam kelompok ikan dari observasi visual (Harenguh sp., Martinique).
The gregariousness and behaviour of the pelagicfish on the school. 237
A D
7:12 10 s. S=680-730m2
7:18 10 s S=3u)-370 m2 r 7% S=36(1420 m2
7 19 ~m.590 m’
7 12 20 s S=68@730 m’
I 7:22 30s Sl=31@36om2 S2=8@110mz
7:26 30 S=3 10-360 m’ 7:27 30 S31O.360 n I 7-- v
729 S=350-400m2 72920 ~=35040 m’
Dinghy (5 m2) Predators hunt Diver with camera - Observed move
Figure 3 Pattern modifications of Harenguh sp. school hunted by predators (bonitos), from aerial observations. The frames are fmed (for each of 4 series of observations) and allow to measure the displacement of the schools. Modifikasi pola Harenguh sp. yang sedang diburu oleh predator- predator (bonitos) dari pengamatan udara. Setiap gambar ditetapkan berdasarkan 4 seri pengamatan, dan memungkinkan untuk mengukur pergerakan kelompok ikan.
Gambar 3
238
SCHOOL OBSERVATION BY ACOUSTICS
The most important limiting factor, for any in site study on marine population, is the fact that water is an environment that can be considered as opaque. In the best studies, visibility does not exceed 50 metres, and “efficient” visibility about 20 metres. Besides, underwater observation is technologically expensive, and its use for so small sampled volumes has to be righteously justified.
Acoustics methods, presented elsewhere, solve the most important part of the problem of measurement. The sonars are instruments of small size (relating to the range they cover), with a satisfactory capacity, and even more, the signal received is easily digitized and stored.
Concerning the pelagic schools, basic devices consist in two types : vertical sounder and sonar.
Vertical Sounder
It provides three data types for the study of school : echogram, density measurement (echo-
Echogram. This is a retranscription on a visual support (paper or video screen) of information supplied by acoustic signal. Echogram, that was the first representation of acoustic information, is still a very useful result, in the fact that it points out, for example, the typology setting and the school classifications by type. By now, these classifications and these particular typologies are done manually, because the processing system and image analysis are not fulfilling enough to extract coherent parameters from echogram, due to the geometric variability of this later (Petitgas and Levenez, 1996; Fig. 4).
0 Density measurement. The echoes received, after a proper mathematical processing, are proportional to absolute fish density. Therefore, it is possible, by “echo-integration,” to know precisely the density, even the biomass of a particular school. This measurement is especially important for abundance measurement and for the follow-up of fishery. The knowledge of school density shows several interest. It points out, at the first moment, a general information about total biomass of pelagic population. It is also a way to an automatic identification of the species, based on the fact that every species has a specific acoustic response, due to their individual anatomy (example : mackerel Scomber scombrus, which does not have swimbladder, shows a quite lower acoustic density than the other species), or finding itself, at the moment of the observation, within a state of particular density (Massé, 1996; Massé et al., 1996). Geometric Parameter Measurement of Schools. Schools present specific geometric characteristics : diameter, perpendicular height, surface of the vertical section on echogram, roughness, etc. This information on every school is nowadays available through proper processing software, such as MOVIES B (Weill et al., 1993). Furthermore their situation, inside the water layer, is also an essential information, as well in terms of stock types (pelagic, demersal), as dynamic features of behaviour or the possibility of school avoidance measurement along the ship’s route. This information is also routinely obtained via the same software.
integration) and geometric parameter measurements of schools.
The gregariousness and behaviour ofthe pelugicfish on the schooi. 239

1) Scattered fish
2) Small schools 3) Pole shaped schools
4) Tower shaped schools
6) Compact schools
8) Macro structure
5) Fluffy schools
7) Zig Zag shaped schools
9) Thermocline shaped layers
Figure 4 Gambar 4
Penjelasan : 1) Ikan terpencar-pencar 2) Kawanan ikan kecil
Pelagic school typology in Senegalese waters (Petitgas and Levenez, 1996). Tipologi kelompok ikan pelagis di perairan Senegal (Petitgas dan Levenez, 1996).
3) Kawanan berbentuk tongkat 5) Kawanan bersifat lembut 7) kelompok berbentuk zig-zag 9) Lapisan-lapisan berbentuk seperti termoklin
4) Kawanan berbentuk tugu 6) Kawanan men ye bar me men^ ruangan 8) Struktur makro
240
Sonar At the beginning, the term sonar (SQund NAvigation and Ranging) named every aquatic acoustics
transmitter-receiver. Then, it was given to vertical sonar (designed to depth measurements) the name of sounder. At present, sonars show 2 types of tools : the sonar with a single beam and the multi-beam sonar. Only the last one will be described here, because the evolution of this device is almost of universal use nowadays. W e present here two kinds of multi-beam sonar :
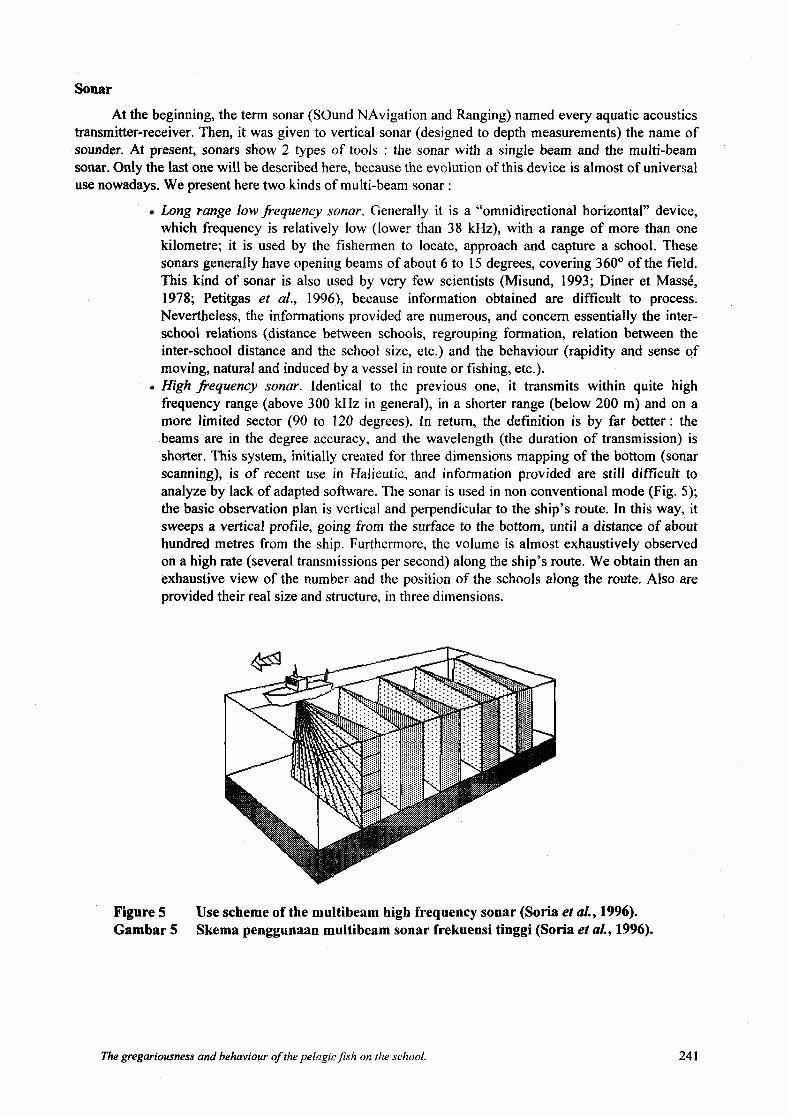
Long range low frequency sonar. Generally it is a “omnidirectional horizontal” device, which frequency is relatively low (lower than 38 kHz), with a range of more than one kilometre; it is used by the fishermen to locate, approach and capture a school. These sonars generally have opening beams of about 6 to 15 degrees, covering 360” of the field. This kind of sonar is also used by very few scientists (Misund, 1993; Diner et Massé, 1978; Petitgas et al., 1996), because information obtained are difficult to process. Nevertheless, the informations provided are numerous, and concern essentially the inter- school relations (distance between schools, regrouping formation, relation between the inter-school distance and the school size, etc.) and the behaviour (rapidity and sense of moving, natural and induced by a vessel in route or fishing, etc.). High frequency sonar. Identical to the previous one, it transmits within quite high frequency range (above 300 kHz in general), in a shorter range (below 200 m) and on a more limited sector (90 to 120 degrees). In return, the definition is by far better: the beams are in the degree accuracy, and the wavelength (the duration of transmission) is shorter. This system, initially created for three dimensions mapping of the bottom (sonar scanning), is of recent use in Halieutic, and information provided are still difficult to analyze by lack of adapted software. The sonar is used in non conventional mode (Fig. 5); the basic observation plan is vertical and perpendicular to the ship’s route. In this way, it sweeps a vertical profile, going from the surface to the bottom, until a distance of about hundred metres from the ship. Furthermore, the volume is almost exhaustively observed on a high rate (several transmissions per second) along the ship’s route. W e obtain then an exhaustive view of the number and the position of the schools along the route. Also are provided their real size and structure, in three dimensions.
Figure 5 Gambar 5
Use scheme of the multibeam high frequency sonar (Soria er al., 1996). Skema penggunaan multibeam sonar frekuensi tinggi (Soria er al., 1996).
The gregariousness and behaviour of the pelagicfish on the school. 24 1
IMPACT OF GREGARIOUSNESS ON ACOUSTIC MEASUREMENT
Images obtained by scientific devices are misleading, because they seem to be an exact representation of the structure observed. But, due to geometry of acoustic beams, they give a very different image from visual observations, for instance satellite images. Indeed, acoustic transmission is cone-shaped, which becomes wider and wider as it moves away from its source. The volume observed is then dependent on the transducer's distance, and the echoes are averaged in volumes increasing with the depth. But the essential sources of the bias are of another order and two types can be brought up, as following :
Bias linked to acoustic technique
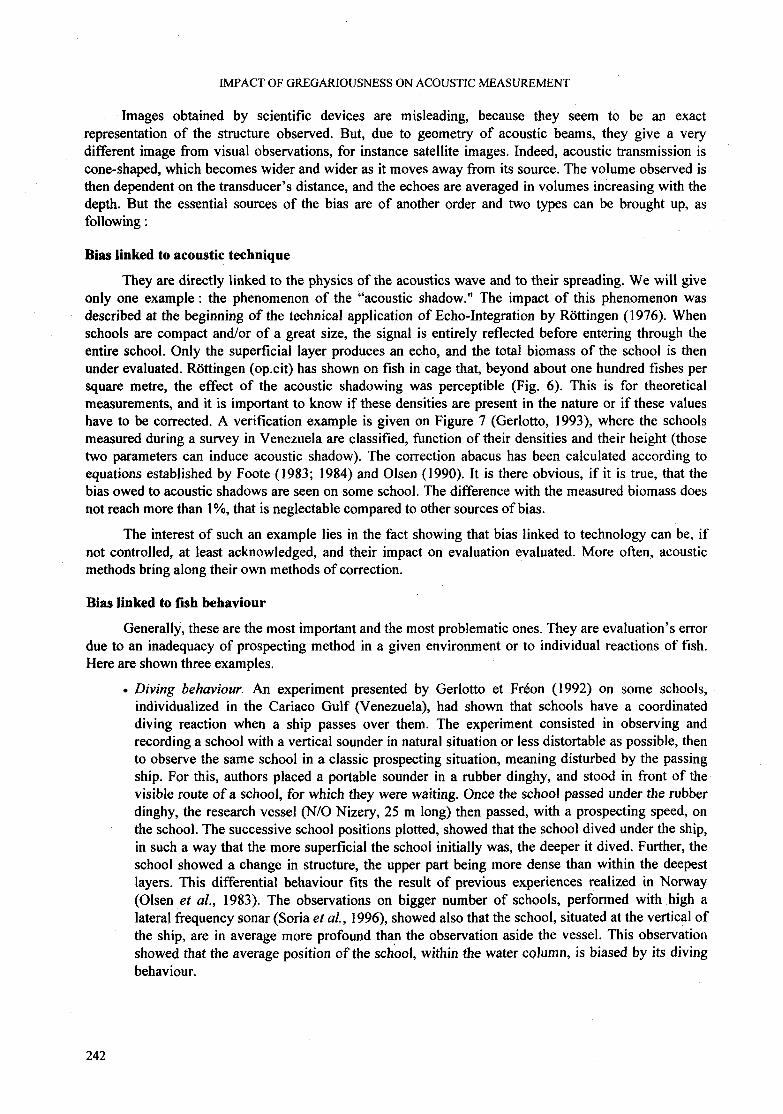
They are directly linked to the physics of the acoustics wave and to their spreading. W e will give only one example : the phenomenon of the "acoustic shadow." The impact of this phenomenon was described at the beginning of the technical application of Echo-Integration by Röttingen (I 976). When schools are compact and/or of a great size, the signal is entirely reflected before entering through the entire school. Only the superficial layer produces an echo, and the total biomass of the school is then under evaluated. Röttingen (op.cit) has shown on fish in cage that, beyond about one hundred fishes per square metre, the effect of the acoustic shadowing was perceptible (Fig. 6). This is for theoretical measurements, and it is important to know if these densities are present in the nature or if these values have to be corrected. A verification example is given on Figure 7 (Gerlotto, 1993), where the schools measured during a survey in Venezuela are classified, function of their densities and their height (those two parameters can induce acoustic shadow). The correction abacus has been calculated according to equations established by Foote (1983; 1984) and Olsen (1990). It is there obvious, if it is true, that the bias owed to acoustic shadows are seen on some school. The difference with the measured biomass does not reach more than 1 %, that is neglectable compared to other sources of bias.
The interest of such an example lies in the fact showing that bias linked to technology can be, if not controlled, at least acknowledged, and their impact on evaluation evaluated. More often, acoustic methods bring along their own methods of correction.
Bias linked to fish behaviour
Generally, these are the most important and the most problematic ones. They are evaluation's error due to an inadequacy of prospecting method in a given environment or to individual reactions of fish. Here are shown three examples.
Diving behaviour. A n experiment presented by Gerlotto et Fréon (1992) on some schools, individualized in the Cariaco Gulf (Venezuela), had shown that schools have a coordinated diving reaction when a ship passes over them. The experiment consisted in observing and recording a school with a vertical sounder in natural situation or less distortable as possible, then to observe the same school in a classic prospecting situation, meaning disturbed by the passing ship. For this, authors placed a portable sounder in a rubber dinghy, and stood in front of the visible route of a school, for which they were waiting. Once the school passed under the rubber dinghy, the research vessel (N/O Nizery, 25 m long) then passed, with a prospecting speed, on the school. The successive school positions plotted, showed that the school dived under the ship, in such a way that the more superficial the school initially was, the deeper it dived. Further, the school showed a change in structure, the upper part being more dense than within the deepest layers. This differential behaviour fits the result of previous experiences realized in Norway (Olsen et al., 1983). The observations on bigger number of schools, performed with high a lateral frequency sonar (Soria et al., 1996), showed also that the school, situated at the vertical of the ship, are in average more profound than the observation aside the vessel. This observation showed that the average position of the school, within the water column, is biased by its diving behaviour.
242

C O
id b tul W
C
b 4
O
.3 c
c
.3
01 a, I m > al > cd
8
3
.3 c - &
25
20
15
10
5 .
O
1 .o
0.8
0.6
0.4
I
=
=
n I I I I
0.2
O
1 .o
0.8
0.6
0.4
0.2
O
Density in number of fish per m3
The gregariousness and behaviour of the pelagicfish on the school. 243
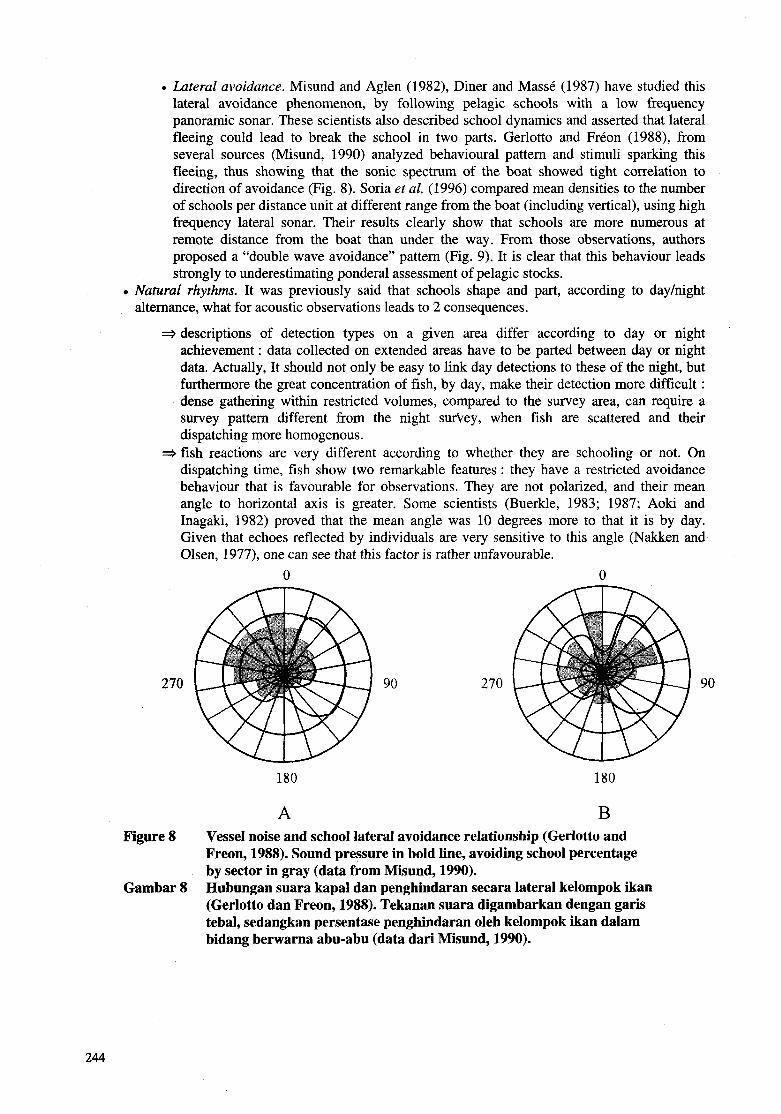
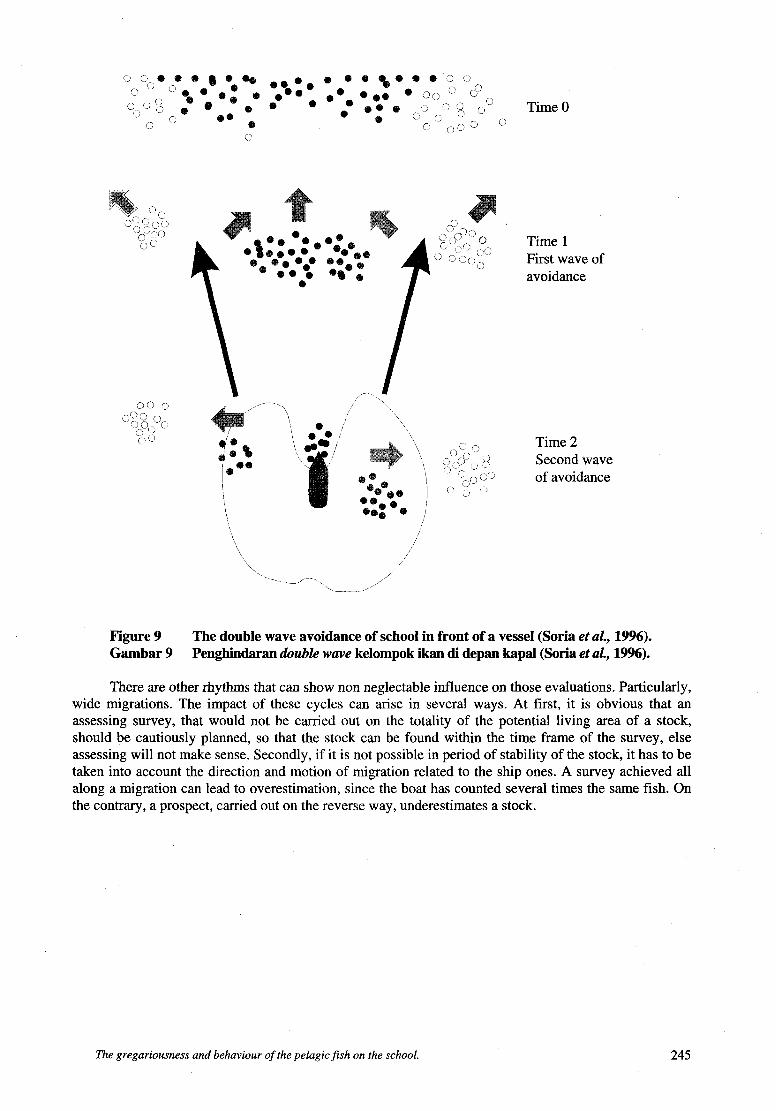
Lateral avoidance. Misund and Aglen (1982), Diner and Massé (1987) have studied this lateral avoidance phenomenon, by following pelagic schools with a low frequency panoramic sonar. These scientists also described school dynamics and asserted that lateral fleeing could lead to break the school in two parts. Gerlotto and Fréon (1988), from several sources (Misund, 1990) analyzed behavioural pattern and stimuli sparking this fleeing, thus showing that the sonic spectrum of the boat showed tight correlation to direction of avoidance (Fig. 8). Soria et al. (1996) compared mean densities to the number of schools per distance unit at different range from the boat (including vertical), using high frequency lateral sonar. Their results clearly show that schools are more numerous at remote distance from the boat than under the way. From those observations, authors proposed a “double wave avoidance” pattern (Fig. 9). It is clear that this behaviour leads strongly to underestimating pondera1 assessment of pelagic stocks.
Natural rhythms. It was previously said that schools shape and part, according to dayhight
3 descriptions of detection types on a given area differ according to day or night achievement : data collected on extended areas have to be parted between day or night data. Actually, It should not only be easy to link day detections to these of the night, but furthermore the great concentration of fish, by day, make their detection more difficult : dense gathering within restricted volumes, compared to the survey area, can require a survey pattern different from the night surtey, when fish are scattered and their dispatching more homogenous. fish reactions are very different according to whether they are schooling or not. On dispatching time, fish show two remarkable features : they have a restricted avoidance behaviour that is favourable for observations. They are not polarized, and their mean angle to horizontal axis is greater. Some scientists (Buerkle, 1983; 1987; Aoki and Inagaki, 1982) proved that the mean angle was 10 degrees more to that it is by day. Given that echoes reflected by individuals are very sensitive to this angle (Nakken and Olsen, 1977), one can see that this factor is rather unfavourable.
O O
alternance, what for acoustic observations leads to 2 consequences.
270 90 270 90
180 180
Figure 8
Gambar 8
A B Vessel noise and school lateral avoidance relationship (Gerlotto and Freon, 1988). Sound pressure in bold line, avoiding school percentage by sector in gray (data from Misund, 1990). Hubungan suara kapal dan penghindaran secara lateral kelompok ikan (Gerlotto dan Freon, 1988). Tekanan suara digambarkan dengan garis tebal, sedangkan persentase penghindaran oleh kelompok ikan dalam bidang berwarna abu-abu (data dari Misund, 1990).
244
P’ C,/ 9‘) , i o Time 1 i- r;<) 1 c,z, First wave of
’\ ’ avoidance
Figure 9 Gambar 9
The double wave avoidance of school in front of a vessel (Soria et UZ., 1996). Penghindaran double wave kelompok ikan di depan kapal (Soria et aL, 1996).
There are other rhythms that can show non neglectable influence on those evaluations. Particularly, wide migrations. The impact of these cycles can arise in several ways. At first, it is obvious that an assessing survey, that would not be carried out on the totality of the potential living area of a stock, should be cautiously planned, so that the stock can be found within the time frame of the survey, else assessing will not make sense. Secondly, if it is not possible in period of stability of the stock, it has to be taken into account the direction and motion of migration related to the ship ones. A survey achieved all along a migration can lead to overestimation, since the boat has counted several times the same fish. On the contrary, a prospect, carried out on the reverse way, underestimates a stock.
The gregariousness and behaviour of the pelagicfish on the school. 245

IMPLICATIONS ON STOCKS STUDIES
Uncertainty source physical calibration transducer moves
Errors on evaluation
A quite complete study of errors, concerning biomass evaluation by acoustic surveys, had been published by Simmonds et al. (1992). Hereafter is a synthetic table of the measurements from those authors.
Table 1 Tabel 1
Evaluation of the different errors sources (from Simmond et uL, 1992). Evaluasi beberapa sumber kalahan yang berbeda (dari Simmond et d, 1992).
error bias 2 Yo 5 Yo
o to 10 Yo microbubbles attenuating hydrographic conditions
- o to 10 Yo 2to5%
Species identification
migrations dayhight behaviour
spatial sampling
avoidance. behaviour
This table shows that schooling behaviour, to which are linked dayhight behaviour, spatial sampling and avoidance, is directly responsible for an error from 25 to 92%, and a bias of O to 5% in biomass assessment. The rest of acoustic features, by their own, is responsible for an error of 9 to 14% and a bias of 5 to 45%.
Nevertheless, those results must be relativized, taking into account these two statements. First, this table is just an indication on a range that has to be adjusted for a given survey. For instance, it was seen that acoustic shadowing, potentially important, does not exceed 1 % of error in the case of our results. O n the other hand, it has to be noticed that, if the acoustic methods include numerous error sources, they generally are able to assess these errors, then to set methods to correct them. The case of migrations is a good example : using a relevant strategy, MacLennan and Simmonds (1991) have been able to totally erase the error due to this behaviour. Generally speaking, it is estimated that total error on a prospecting is about 30%.
I o to 20 Yo
- o to 5 Yo 10 to 25 Yo - OtolO% - 13 to 57 %
Interpretation errors
It has been seen before that schools have a vertical fleeing behaviour, that make their mean position on echograms several metres lower than their natural position. This is not a neutral point, as it can lead to misguiding conclusions on catchability of those fish. Here is a special and clear example : in the eastern area of Venezuela, especially in the Gulf of Cariaco, where has been precisely recorded this diving behaviour, fishermen detect schools from a coastal hill, from the perturbation the fish create at the surface, or from the presence of associated fauna (e.g. birds). Then they catch fish thanks to gill nets. Since schools have dived before being recorded by the echo-sounder, an acoustic observation can lead to think that a great part of stock is not catchable because deep, so the stock is naturally protected, whereas the reality can turn out to be very different. In the case of the Gulf of Cariaco, it has been noticed during a survey that only 14% of schools were located to a depth less than 10 m, so potentially catchable, according to their bathymetric position not corrected. If a correction of the diving effect is done, this proportion can reach 46% (Fig. 1 O).
246

Dense Layers I Schools
Om
30 m
60 m
Om
30m
60 m
Om
30 m
60 m
90 m Om
30 m
60 m
Om
30 m
Om
30 m
Figure 10 Vertical distribution and pelagic fish layers along 6 transects in Cariaco Gulf, Venezuela (Gerlotto, 1993).
Gambar 10 Penyebaran vertikal dan lapisan ikan pelagis sepanjang 6 jalur pelayaran di Teluk Cariaco, Venezuela (Gerlotto, 1993).
The gregariousness und behaviour of the pekgicfish on the school. 247
Sampling and identification
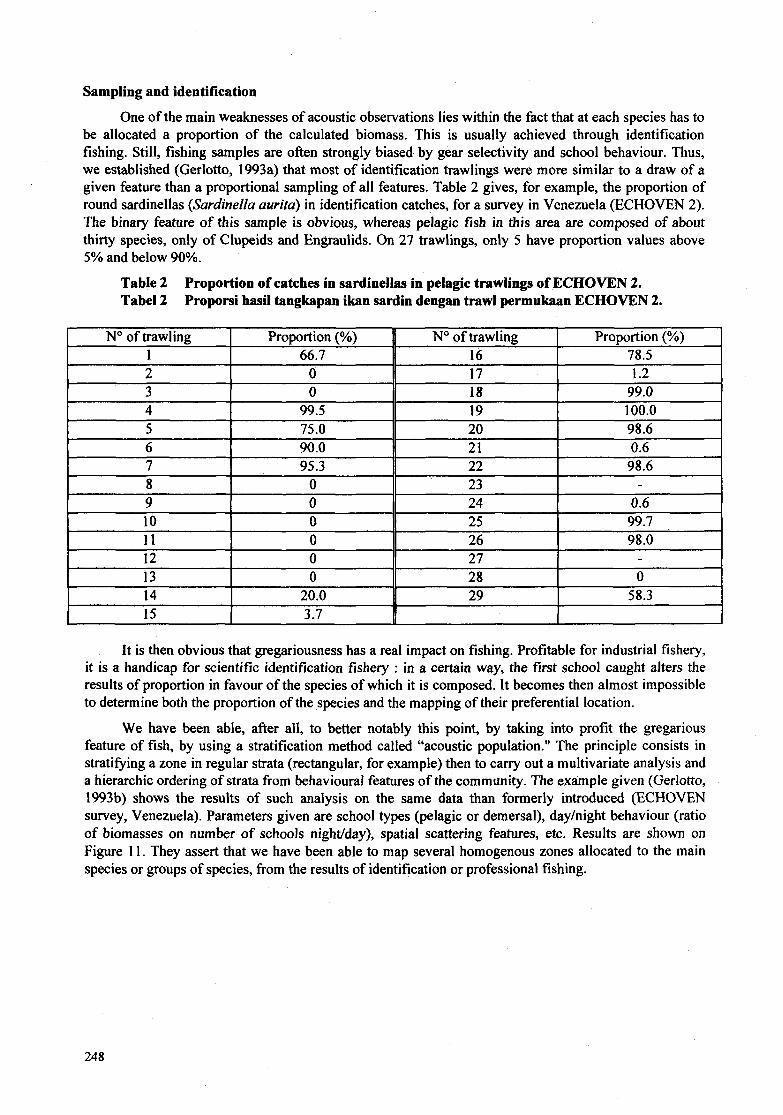
One of the main weaknesses of acoustic observations lies within the fact that at each species has to be allocated a proportion of the calculated biomass. This is usually achieved through identification fishing. Still, fishing samples are often strongly biased by gear selectivity and school behaviour. Thus, w e established (Gerlotto, 1993a) that most of identification trawlings were more similar to a draw of a given feature than a proportional sampling of all features. Table 2 gives, for example, the proportion of round sardinellas (Sardinella aurita) in identification catches, for a survey in Venezuela (ECHOVEN 2). The binary feature of this sample is obvious, whereas pelagic fish in this area are composed of about thirty species, only of Clupeids and Engraulids. O n 27 trawlings, only 5 have proportion values above 5% and below 90%.
Table 2 Tabel 2
Proportion of catches ín sardinellas in pelagic trawlings of ECHOVEN 2. Proporsi hasil tangkapan ikan sardin dengan trawl permukaan ECHOVEN 2.
No of trawling 1
1 Proportion (%) No of trawling Proportion (%) 66.7 16 78.5
2 3 4
O 17 1.2 O 18 99.0
99.5 19 100.0
II
7 I 95.3 II 22 I 98.6
5 6
75.0 20 98.6 90.0 21 0.6
It is then obvious that gregariousness has a real impact on fishing. Profitable for industrial fishery, it is a handicap for scientific identification fishery : in a certain way, the first school caught alters the results of proportion in favour of the species of which it is composed. It becomes then almost impossible to determine both the proportion of the species and the mapping of their preferential location.
W e have been able, after all, to better notably this point, by taking into profit the gregarious feature of fish, by using a stratification method called "acoustic population." The principle consists in stratifying a zone in regular strata (rectangular, for example) then to carry out a multivariate analysis and a hierarchic ordering of strata from behavioural features of the community. The example given (Gerlotto, 1993b) shows the results of such analysis on the same data than formerly introduced (ECHOVEN survey, Venezuela). Parameters given are school types (pelagic or demersal), dayhight behaviour (ratio of biomasses on number of schools nighdday), spatial scattering features, etc. Results are shown on Figure Il. They assert that w e have been able to map several homogenous zones allocated to the main species or groups of species, from the results of identification or professional fishing.
8 9 10 1 1 12 13 14
248
~ ~ ~ - O 23 - O 24 0.6 O 25 99.7 O 26 98.0 O 27 - O 28 O 20.0 29 58.3

Acoustics and management
U p to now, implication of acoustics in management simply consists in providing biomass values, either global or by cohorts, in order to calibrate population dynamics models (especially VPA). The fact that pelagic fish are generally gathered into schools, yet allows, along with the evolution of acoustic techniques, to provide managing tools for a more elaborate level. The spatial behaviour of pelagic population shows several impacts on the dynamics of an exploited population, that has to be studied. Here are proposed four of them :
Impact of spatial scattering. Whether a population shape in a type of spatial structure or another, at a small scale (school), middle or big scale (cluster, population), its accessibility in terms of probability to meet the population (fishing or evaluation) can vary. This statistic link between distribution type (histogram and density location) and catchability can be seen from acoustic data and simulations.
0 Impact of small scale structure variability. Schools are able to successively shape into different types of form. These forms, as in the former case, can influence both vulnerability and accessibility. A typology of shapes and a dynamic description of changes linked either to biological rhythm, or to presence of fishermen, or to ecological conditions in the environment (food, predation, ...) can thus be carried out from echograms. Impact of environmental conditions. They can lead to an increase or a decrease of catchability. Furthermore, relations between different trophic levels and environment can lead, directly or not, to favourable or unfavourable conditions for exploitation in specific zones. Precise links between environmental data and dispatching and types of structure are as well key points, allowing to understand the reasons of presence or absence of stocks. It has to be noticed that the impact of environment on biomass is not studied there, but on spatial structure. Impact of gregariousness. Fishermen use more and more attraction and concentration devices in reduced areas, in order to catch them (DCP, shipwreck, etc.). Those mechanisms are not well understood, though allowing an important part of catches. Understanding their functioning implies to establish ethologic systems, happening during the ontogenesis and leading to these reactions of attraction and fixation of fish around an artifact.
CONCLUSION
Gregariousness is a strong component of spatial behaviour of pelagic fishes. Even if such behaviour can be found in other animals’ groups, and especially birds and some insects (crickets, butterflies...), it is in this phylum that the formation of great non hierarchized and polarized gathering is the most spectacular. This behaviour requires a special adaptation of scientific studies, as far as it produces some types of spatial scattering that are particular for which, within other, usual statistical methods are unusable. In turn, adaptation of methods of analysis to this behaviour allows to take some advantages (identification). M a n is not only a searcher : it is also the most adaptable predator of the whole biosphere. The fisherman has also taken advantage of this behaviour to set catching methods of great efficiency. Paradoxically, the gregarious behaviour, that is theoretically considered as an effective “anti predator” tool, turns against the species of which adaptability as well in terms of learning as of evolution, is infinitely less than the human’s. Are those huge pelagic stocks endangered by overexploitation ? It is yet too soon to answer. One begins to better understand the other role of these huge concentrations of fish, that would not only be an answer to predation, but also would allow a more effective adaptation to environment variations. Dramatic drops of the number of these stocks, especially in the case of Engraulids and Clupeids (North Sea Herrings, Sardines of Japan, California, Chile, Sardinellas of Ghana, etc.) have often been followed by recovering, not less spectacular. Gregariousness could thus also have an evolutive meaning more important than its instantaneous role of response towards predators.
The gregariousness and behaviour of the pelagicjsh 011 the school. 249
REFERENCES AokiI I. and Inagaki T., 1988. Photographic observations on the behaviour of Japanese anchovy Engraulis japonica at night
in the sea. Mar. Ecol. Prog. Ser., 43 : 213-22 I. Bardach I.E., Magnusson J.J., M a y R.C. and Reinhart J.M. (eds.), 1980. Fish behavior and its use in the capture and culture
of fishes. International Center for Living Aquatic Resources Management, Manila, Philippines. ICLARM Conf. Proc., 5 : 512 p.
Breder C.M. Jr., 1976. Fish schools as operational structures. Fish. Bull., 74 (3) : 471-502. Buerkle U., 1983. First look at herring distributions with a bottom referencing underwater towed instrumentation vehicle
Buerkle U., 1987. Photographic and acoustic measurements in a large aggregation of herring. Int. Symp. Fish. Acoustics,
Cushing D.H., 1977. Observations on fish shoals with the ar1 scanner. Rapp. P.-v. Reun. Cons. int. Explor. Mer, 170 : 15-20. Diner N. and Masse J., 1987. Fish school behaviour during echo survey observed by acoustic devices. Int. Symp. Fish.
Eibl-Eibesfeldt I., 1984. Biologie du Comportement. Eds Naturalia et Biologia : 748 p.
FAO, 1995. Annuaire statistique des pêches 1993. Captures et quantites debarquees. Supplement : Production halieutique
Foote K.G., 1983. Linearity of fisheries acoustics, with addition theorems. J. Acoust. Soc. Am., 73(6) : 1932-1940. Foote K.G., 1984. School and multiple echoes. Subject group G. Rapp. P.-v. Cons. Int. Explor. Mer, 184 : 84-95. Freon P., Gerlotto F. and Soria M. , 1992. Changes in school structure according to external stimuli: description and
Freon P., Gerlotto F. and Soria M., 1996. Diel variability of school structure with special reference to transition periods.
Freon P., Soria M., Mullon C. and Gerlotto F., 1993. Diurnal variation in fish density during acoustic surveys in relation to spatial distribution and avoidance reactions. Aquat. Liv. Resour., 6 (3).
Gerlotto F., 1993a. Methodologie d'observation et d'evaluation par hydroacoustique des stocks tropicaux de poissons pelagiques côtiers: impact du comportement et de la distribution spatiale. Th&e Doct. Univ. Bretagne Occidentale, spec. OcCanogr. Biol., 19 mars 1993 : 310 p.
Gerlotto F., 1993b. Identification and Spatial stratification of tropical fish concentration using acoustic populations. Aquat. Liv. Resour., 6 (3).
Gerlotto F. and Freon P., 1988. Influence of the structure and behaviour of fish schools on acoustic assessment. Reun. Ann. Cons. Int. Explor. Mer, CM 1988/B:53 : 31 p.
Gerlotto F., and Freon P., 1992. Some elements of vertical avoidance of fish schools to a vessel during acoustic surveys. Fish. Res., 14 : 251-259.
Glass C.W., Wardle C.S. and Mojsiewicz W.R., 1986. A light intensity threshold for schooling in the atlantic mackerel, Scomber scombrus. J. Fish. Biol., 29 (supplement A) : 71-81.
MacLennan D.N. and Simmonds E.J., 1991. Fisheries Acoustics. Chapman and Hall Ed., Londres, 325 p. Masse J., 1996. Acoustic obnservations in the Bay of Biscay : Schooling, vertical distribution, species assemblages and
Masse J., Koutsikopoulos C. and Patty W., 1996. The structure and spatial distribution of pelagic fish schools in multispecies
Misund O.A., 1990. Sonar observations of schooling herring : school dimensions, swimming behaviour, and avoidance of
Misund O.A., 1993. Dynamics of moving masses: Variability in packing density and shape among pelagic schools. ICES,
Misund O.A. and Aglen A., 1992. Swimming behaviour of fish schools in the North Sea during acoustic surveying and
Nakken O. and OIsen K., 1977. Target strength measurement of fish. Rapp. P.-v. Reun. Cons. Int. Explor. Mer, 170 : 52-69.
"BRUTIV". FAO Fish. Rep. 300 : 125-130.
Seattle June 22-26, Contrib. 18: 28 p.
Acoustics, June, 22-26, Seattle, 28 p.
mondiale : 1950-1993. FAO, Rome, 44 p.
influence on acoustic assessment. Fish. Res., in press.
ICES, Jour. Marine Sci., 53 : 459-464.
behaviour. Sci. Mar., 60 (Supl. 2) : 227-234.
clusters : an acoustic study. ICES, Jour. Mar. Sci., 53 (2), 155-160.
vessel and purse seine. Rapp. P.-v. Reun. Cons. Int. Explor. Mer, 189 : 147-158.
Jour. Mar. Sci., 50 : 145-160.
pelagic trawl sampling. ICES, Jour. Mar. Sci., 49 : 325-334.
250

Olsen K., Angel1 J. and Ltrvik A., 1983. Quantitative estimations of the influence of fish behaviour on acoustically
OIsen K., 1990. Fish behaviour and acoustic sampling. Rapp. P.-v. Réun. Cons. Int. Explor. Mer, 189 : 147-158. Petitgas P., Monimeau L., Brehmer P. and Gerlotto F., 1996. Characterizing the spatial distribution of fish schools with a
Petitgas P. and Levenez J.J., 1996. Spatial organization of pelagic fish : echogram structure ; spatio-temporal condition and
Pitcher T.J., 1986. The behaviour of telept fishes. London, Croom Helm. Radakov D.V., 1973. Schooling in the ecology of fish. N e w York, Halsted Press, John Wiley and Sons
Röttingen I., 1976. O n the relation between echo intensity and fish density. Fiskeridir. Skr. (Havunders.), 16 (9) : 301-314.
Simmonds E.J., Williamson N., Gerlotto F. and Aglen A., 1992. Acoustic survey design and analysis procedure: a
Soria M., 1994. Structure et stabilitd des bancs et agrégations de poissons pélagiques côtiers tropicaux : application
Soria M. and Dagom L., 1992. Rappels sur le comportement grégaire. in : Action Incitative Comportement Agrégatif
Soria M., Fréon P. and Gerlotto F., 1996. Analysis of vessel influence on spatial behaviour of fish schools using a multi-
Weill A., Scalabrin C. and Diner N., 1993. MOVIES-B : an acoustic detection description software. Application to shoal
determined fish abundance. FAO Fish. Rep., 300 : 139-149.
point process approach : a first application on sonar recordings. CIEM C.M. 1996B 31 : 16 p.
biomass in senegalese waters. ICES, Jour. Mar. Sci., 53 (2) : 147-154.
comprehensive review of current practice. Rapp. Rech. Collectives Cons. Int. Explor. Mer, 187 : 13 1 p.
halieutique. Trav. et Doc. ORSTOM, 125 : 285 p.
(AICA), Compte-Rendu de Réunion, Doc. Centre ORSTOM Montpellier, 9 :5-9.
beam sonar and consequences for biomass estimates by echo-sounder. ICES, Jour. Mar. Sci., 53 : 453-458.
species classification. Aquat. Living Resour., 6 (3) : 255-267.
The gregariousness and behaviour of the pelagicjìsh on the school. 25 1
DISCUSSION
(Chairman Dr. FATUCHRI)
Mr. SIHOTANG Q : - The avoidance error is from O to 50%; H o w can this interval error be found ? A : - I will give you two answers :
1. Avoidance can be very important. For example, according to the Norwegian, only 20% of the biomass are estimated. Fish avoids for two reasons : the first one is the noise and the second one is the light at night. That is why w e recommend to switch off the lights. If not, you will have different estimations of the biomass.
2. The percentage of avoidance depends on the fish and the vessel. In some parts of Venezuela, there is no avoidance. W e have the same values at day and at night. In other places, avoidance can reach a factor 2. H o w is this percentage calculated ? It depends on the area. You have to make your own experiments to estimate the factor that is suitable.
252