Embed Size (px)
Citation preview
IEEE TRANSACTIONS ON NETWORK AND SERVICE MANAGEMENT, VOL. 12, NO. 3, SEPTEMBER 2015 363
Greenslater: On Satisfying Green SLAsin Distributed Clouds
Ahmed Amokrane, Rami Langar, Mohamed Faten Zhani, Raouf Boutaba, Fellow, IEEE, and Guy Pujolle
Abstract—With the massive adoption of cloud-based services,high energy consumption and carbon footprint of cloud infrastruc-tures have become a major concern in the IT industry. Conse-quently, many governments and IT advisory organizations haveurged IT stakeholders (i.e., cloud provider and cloud customers) toembrace green IT and regularly monitor and report their carbonemissions and put in place efficient strategies and techniques tocontrol the environmental impact of their infrastructures and/orapplications. Motivated by this growing trend, we investigate, inthis paper, how cloud providers can meet Service Level Agree-ments (SLAs) with green requirements. In such SLAs, a cloudcustomer requires from cloud providers that carbon emissionsgenerated by the leased resources should not exceed a fixed bound.We hence propose a resource management framework allowingcloud providers to provision resources in the form of Virtual DataCenters (VDCs) (i.e., a set of virtual machines and virtual linkswith guaranteed bandwidth) across a geo-distributed infrastruc-ture with the aim of reducing operational costs and green SLAviolation penalties. Extensive simulations show that the proposedsolution maximizes the cloud provider’s profit and minimizes theviolation of green SLAs.
Index Terms—Green SLA, virtual data center, distributedcloud, energy efficiency.
I. INTRODUCTION
W ITH the rapid development of cloud computing tech-nologies, data centers have become a popular platform
for delivering large-scale online services such as content de-livery, social networking and e-commerce. However, the rapidexpansion of cloud infrastructures in recent years have alsoraised serious concerns regarding their energy consumptionand environmental impact. Recent reports [1] have revealedthat the Information and Communication Technologies (ICT)account for 3% of the world’s carbon emissions. Data centersby themselves accounts for about 10% of the ICT emissionsworldwide.
Manuscript received March 23, 2015; revised May 27, 2015; acceptedMay 28, 2015. Date of publication June 5, 2015; date of current versionSeptember 4, 2015. This work was partially supported by the CNRS (France)WINDS project (Grant no. 25995), the NSERC (Canada) SAVI project (Grantno. NETGP394424-10), and the EU FP7 IRSES MobileCloud project (Grantno. 612212). The associate editor coordinating the review of this paper andapproving it for publication was L. Granville.
A. Amokrane is with the CoESSI, 78360 Montesson, France (e-mail:[email protected]).
R. Langar and G. Pujolle are with the Laboratoire d’Informatique de Paris6 (LIP6), University of Pierre and Marie Curie (UPMC), 75005 Paris, France(e-mail: [email protected]; [email protected]).
M. F. Zhani is with the Department of Software and IT EngineeringÉcole de Technologie Supérieure, Montréal, QC H3C 1K3, Canada (e-mail:[email protected]).
R. Boutaba is with the University of Waterloo, Waterloo, ON N2L 3G1,Canada (e-mail: [email protected]).
Digital Object Identifier 10.1109/TNSM.2015.2440423
Motivated by these observations, the ICT sector is witnessingan upward move towards greening cloud infrastructures and ser-vices driven by several governmental regulations and marketingconsiderations. For instance, a recent study [2] showed that thefirms’ value would decrease significantly if it has high carbonfootprint or even if it withholds information about its carbonemission rates. As a result, many IT companies are voluntarilydisclosing their carbon emissions and regularly reporting theirefforts towards deploying environmental-friendly solutions andservices [3]. At the same time, governments are imposingtaxes on carbon emissions in the hopes of pushing further thisshift towards the adoption of green sources of energy and thereduction of carbon footprint [4].
In current cloud environments, there are mainly two stake-holders: (1) cloud providers (CPs) that typically own distributedinfrastructures and lease their resources in an on-demand man-ner to different Service Providers (SPs); (2) SPs use theseresources to deploy their services and offer them to Internetend-users. Recent research proposals and cloud offerings [5]are advocating to offer these resources in the form of VirtualData Centers (VDCs), i.e., a set of VMs and virtual links withguaranteed bandwidth.
Typically, CPs are responsible for allocating resources forVDCs across their distributed clouds with the goal of min-imizing operational costs and maximizing the infrastructureenvironmental friendliness by increasing the usage of greenenergy [6]. However, recently, SPs were also required to takeinto account environmental objectives and ensure that theirservices are produced with the smallest carbon footprint. Manyadvisory boards and commissions (e.g., Open Data CenterAlliance [7] and SLA Expert Subgroup of the Cloud SelectedIndustry Group of the European Commission [8]) are pushingtowards defining green SLAs in which SPs require their CPs tolimit the carbon emissions generated on their behalf. Recently,some research works advocated providing Green SLAs in thecontext of HPC clouds [9]–[13].
Typically, the green SLA terms require either to limit thecarbon emissions generated by SPs services [9]–[12] or to seta minimum amount of renewable power to be consumed by theresources allocated to SPs [13], [14]. However, these proposalsdo not consider the allocation of network resources (virtuallinks) and aim only to allocate VMs within a single data center.
In this paper, we investigate how a CP can meet an SLAwith green requirements. In particular, we consider SLAs thatspecify a limit on the carbon emission generated by eachservice provider’s VDC. We, hence, propose Greenslater, aholistic framework that orchestrates the provisioning and the
1932-4537 © 2015 IEEE. Personal use is permitted, but republication/redistribution requires IEEE permission.See http://www.ieee.org/publications_standards/publications/rights/index.html for more information.
364 IEEE TRANSACTIONS ON NETWORK AND SERVICE MANAGEMENT, VOL. 12, NO. 3, SEPTEMBER 2015
resource optimization for the multiple VDCs deployed acrossa distributed infrastructure. From the CP’s point of view, theobjective is to maximize revenue while minimizing operationalcosts and the potential green SLA violation penalties. Greens-later takes advantage of the variability in space and time of theavailable renewables and electricity prices in different data cen-ters to reduce the carbon footprint and costs. It provisions VDCsand dynamically optimize resource allocation over time whilefulfilling the green SLA terms. Through extensive simulations,we show that the proposed framework maximizes the CP’sprofit and also the usage of renewable power while minimizingSLA violation cost.
The remainder of this paper is organized as follows.Section II surveys the related works. Section III defines greenSLAs and presents the proposed management framework. Themathematical formulation of the VDC embedding problemacross distributed infrastructures that considers green SLAs isthen presented in Section IV. Section V gives a detailed de-scription of the proposed algorithms for VDC admission controland dynamic resource allocation and optimization. Section VIdiscusses simulation setup and results. Finally, we conclude thepaper in Section VII.
II. RELATED WORK
In the last few years, a large body of work has addressed theproblem of reducing energy consumption and carbon footprintin cloud environments. In the following, we first survey theliterature on green management in the cloud and then we focuson the proposals that advocated implementing green SLAsbetween cloud and service providers.
A. Green Management in the Cloud
Recently, several systems have been proposed to map VDCsonto a single data center with the goal of reducing energy con-sumption. For instance, Zhani et al. [15] proposed VDC Plan-ner, a resource management framework that leverages dynamicVM migration to increase CP’s revenue while minimizing en-ergy consumption. Unfortunately, these solutions are designedto manage a single data center and hence do not consider thevariability over time and between different locations of theelectricity prices and the availability of green sources of energy.
A plethora of techniques have been also proposed to allocateresources across geographically distributed data centers in orderto reduce energy costs [16]–[18], minimize the infrastructure’scarbon footprint [19], [20] or achieve both objectives [6], [21],[22]. For instance, Xin et al. [23] proposed an algorithm thatuses minimum k-cut to split a VDC request into partitions beforeassigning them to different locations so as to balance the loadamong different data centers. In [6], we proposed Greenhead,a framework for VDC embedding across distributed infras-tructures that aims at maximizing cloud providers’ revenuewhile cutting down the carbon footprint of the infrastructure.Unfortunately, the solutions above use static mapping and donot perform any dynamic resource optimization over time. Theyalso do not consider green SLAs and hence do not guarantee
any limit on carbon emissions of the resources leased byeach SP.
B. Green SLA in the Cloud
Green SLAs stipulate that SPs are able to require their cloudproviders to guarantee that the leased resources are environ-mental friendly. In other words, SPs can explicitly specifygreen constraints like, for instance, an upper limit on carbonemissions produced by the resources they lease.
Providing green SLAs has been originally proposed back in2010 by Laszewski et al. [9] and then quickly adopted andsupported in several research works [10]–[14], [24]–[26]. Forinstance, Haque et al. [13] considered an SLA that specifiesthe proportion of green power that the HPC provider shoulduse to run the job (e.g., x% of the job should run on greenpower). Hence, the HPC provider has to pay a penalty toSPs if the green terms of the SLA are not satisfied. Similarly,Wang et al. [24] proposed an approach where SPs can defineSLA constraints for their submitted tasks to limit the carbonemissions and the consumed power. In this case, the goal, fromthe CP’s perspective, is to schedule parallel tasks such that thegreen SLAs are satisfied. Klingert et al. [25] proposed thatdata center providers consider CO2 per task or resource (inkgCO2) and the yearly average PUE as metrics to specify SPs’requirements. In a case study, the authors compared three typesof SLA: (i) a standard SLA (Full Power) that does not addressenergy consumption at all but prioritizes performance and time;(ii) a relaxed SLA that requires key indicators to be withinrelaxed boundaries, and (iii) an energy-aware SLA that usestight energy ranges for each job. The results at a small scaleshow significant energy saving and reduced QoS violations.
Hasan et al. [14] proposed a framework for defining GreenSLA between the SPs (SaaS providers) and the CPs (IaaSproviders). The Green SLAs define terms related to the totalamount of renewable energy in percentage that should beconsumed by the data center. The goal of the CP in this case is tosatisfy these terms by purchasing renewable power and findinga good tradeoff between profit and SLA violation penalty.Hence, the CP negotiates with electricity providers short termcontracts that would satisfy the renewable power demand basedon SPs’ requirements, while capping expenditures to a limitedbudget. To do so, the authors proposed an optimization modulethat uses linear programming techniques along with forecastingmodels that predict renewable power availability and cost.
It is worth noting that existing works such as [10], [27]proposed renegotiation of the SLA terms between the CP andthe SP. The idea is that CPs incentivize SPs to relax some of theQoS constraints so as to reduce the energy consumption and/orcarbon footprint. For instance, SPs can relax theconstraint on theexecution time of an HPC job or task to allow the CP to run itduring periods of time where the renewable power is available.
The main limitation of the solutions described above is thatthey do not consider bandwidth requirements between VMsand they are designed to manage resources within a singledata center. Our work considers a more general scenario withmultiple data centers and where the network requirements areexplicitly specified in the VDC request.
AMOKRANE et al.: GREENSLATER: ON SATISFYING GREEN SLAs IN DISTRIBUTED CLOUDS 365
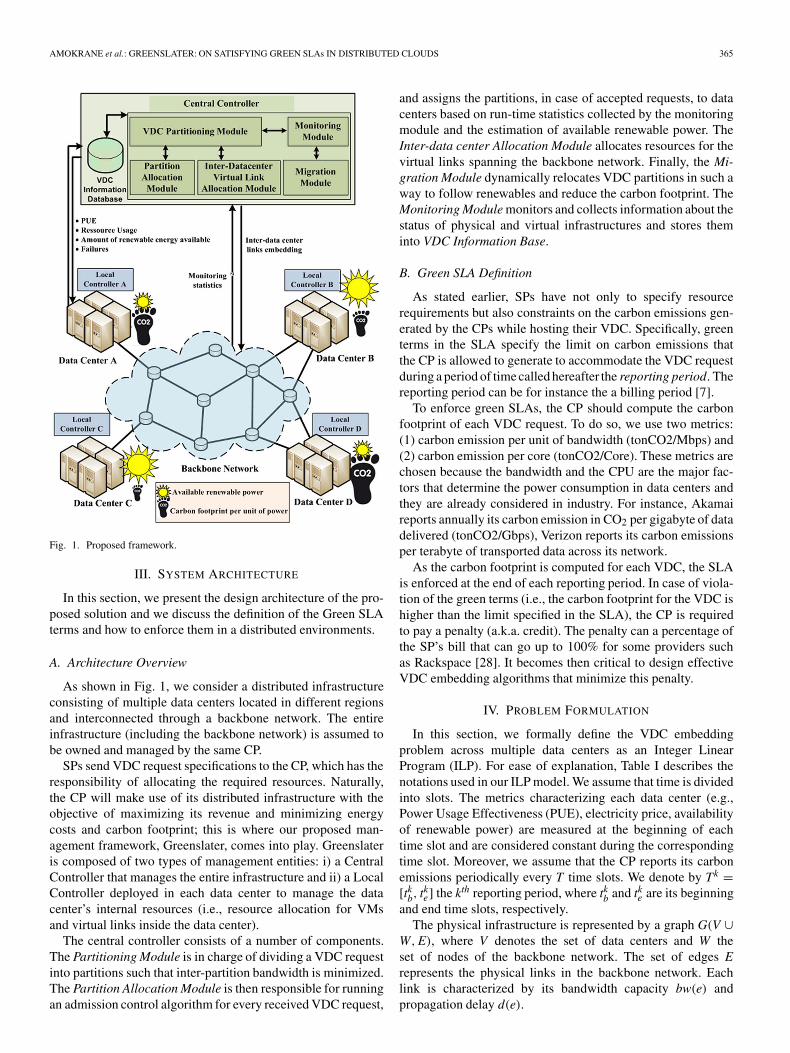
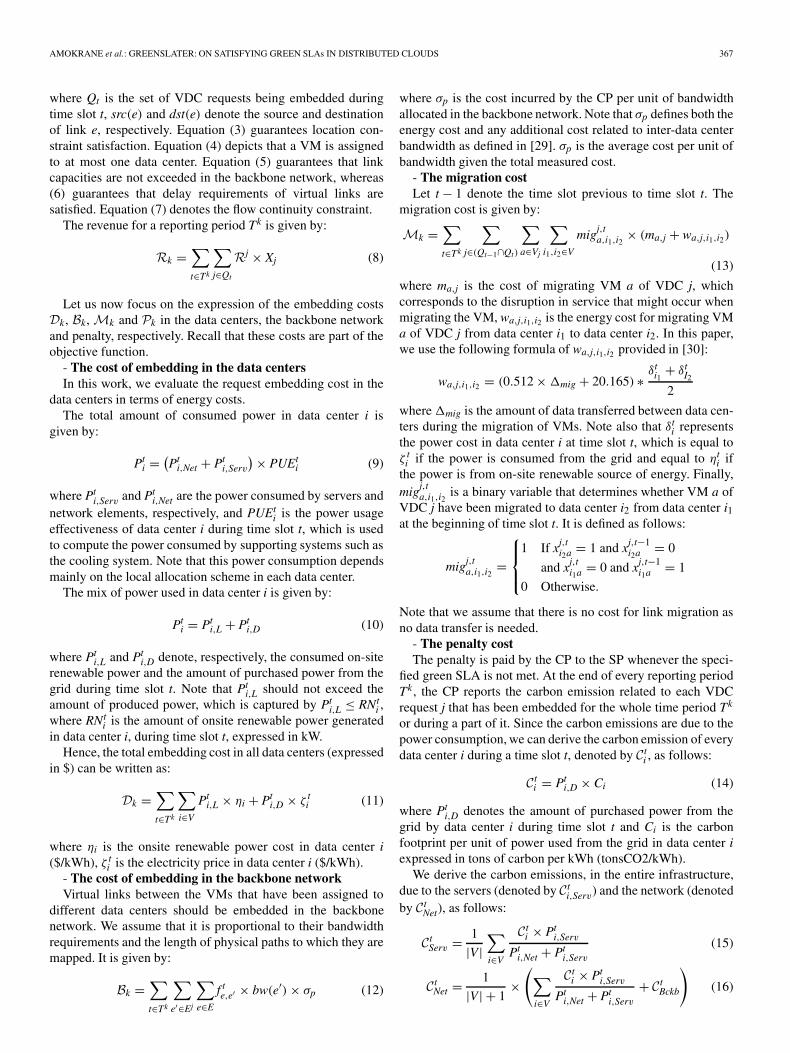
Fig. 1. Proposed framework.
III. SYSTEM ARCHITECTURE
In this section, we present the design architecture of the pro-posed solution and we discuss the definition of the Green SLAterms and how to enforce them in a distributed environments.
A. Architecture Overview
As shown in Fig. 1, we consider a distributed infrastructureconsisting of multiple data centers located in different regionsand interconnected through a backbone network. The entireinfrastructure (including the backbone network) is assumed tobe owned and managed by the same CP.
SPs send VDC request specifications to the CP, which has theresponsibility of allocating the required resources. Naturally,the CP will make use of its distributed infrastructure with theobjective of maximizing its revenue and minimizing energycosts and carbon footprint; this is where our proposed man-agement framework, Greenslater, comes into play. Greenslateris composed of two types of management entities: i) a CentralController that manages the entire infrastructure and ii) a LocalController deployed in each data center to manage the datacenter’s internal resources (i.e., resource allocation for VMsand virtual links inside the data center).
The central controller consists of a number of components.The Partitioning Module is in charge of dividing a VDC requestinto partitions such that inter-partition bandwidth is minimized.The Partition Allocation Module is then responsible for runningan admission control algorithm for every received VDC request,
and assigns the partitions, in case of accepted requests, to datacenters based on run-time statistics collected by the monitoringmodule and the estimation of available renewable power. TheInter-data center Allocation Module allocates resources for thevirtual links spanning the backbone network. Finally, the Mi-gration Module dynamically relocates VDC partitions in such away to follow renewables and reduce the carbon footprint. TheMonitoring Module monitors and collects information about thestatus of physical and virtual infrastructures and stores theminto VDC Information Base.
B. Green SLA Definition
As stated earlier, SPs have not only to specify resourcerequirements but also constraints on the carbon emissions gen-erated by the CPs while hosting their VDC. Specifically, greenterms in the SLA specify the limit on carbon emissions thatthe CP is allowed to generate to accommodate the VDC requestduring a period of time called hereafter the reporting period. Thereporting period can be for instance the a billing period [7].
To enforce green SLAs, the CP should compute the carbonfootprint of each VDC request. To do so, we use two metrics:(1) carbon emission per unit of bandwidth (tonCO2/Mbps) and(2) carbon emission per core (tonCO2/Core). These metrics arechosen because the bandwidth and the CPU are the major fac-tors that determine the power consumption in data centers andthey are already considered in industry. For instance, Akamaireports annually its carbon emission in CO2 per gigabyte of datadelivered (tonCO2/Gbps), Verizon reports its carbon emissionsper terabyte of transported data across its network.
As the carbon footprint is computed for each VDC, the SLAis enforced at the end of each reporting period. In case of viola-tion of the green terms (i.e., the carbon footprint for the VDC ishigher than the limit specified in the SLA), the CP is requiredto pay a penalty (a.k.a. credit). The penalty can a percentage ofthe SP’s bill that can go up to 100% for some providers suchas Rackspace [28]. It becomes then critical to design effectiveVDC embedding algorithms that minimize this penalty.
IV. PROBLEM FORMULATION
In this section, we formally define the VDC embeddingproblem across multiple data centers as an Integer LinearProgram (ILP). For ease of explanation, Table I describes thenotations used in our ILP model. We assume that time is dividedinto slots. The metrics characterizing each data center (e.g.,Power Usage Effectiveness (PUE), electricity price, availabilityof renewable power) are measured at the beginning of eachtime slot and are considered constant during the correspondingtime slot. Moreover, we assume that the CP reports its carbonemissions periodically every T time slots. We denote by Tk =[tkb, tke] the kth reporting period, where tkb and tke are its beginningand end time slots, respectively.
The physical infrastructure is represented by a graph G(V ∪W, E), where V denotes the set of data centers and W theset of nodes of the backbone network. The set of edges Erepresents the physical links in the backbone network. Eachlink is characterized by its bandwidth capacity bw(e) andpropagation delay d(e).
366 IEEE TRANSACTIONS ON NETWORK AND SERVICE MANAGEMENT, VOL. 12, NO. 3, SEPTEMBER 2015
TABLE ITABLE OF NOTATIONS
A VDC request j is represented by a graph Gj(Vj, Ej). Thearrival time and lifetime of the request j are denoted by tj
and T j, respectively. Each vertex v ∈ Vj corresponds to a VM,characterized by its CPU, memory and disk requirements. Eachedge e ∈ Ej is a virtual link that connects a pair of VMs,which is characterized by its bandwidth demand bw(e) andpropagation delay d(e). Furthermore, each VDC j may have aconstraint on carbon emissions per reporting period T, whichis defined by the variable cj. We assume the revenue generatedby VDC j, denoted by Rj, to be proportional to the amount ofresources (CPU, memory and disk) and bandwidth required byits VMs and links, and inversely proportional to the carbon limitcj. Let R denote the different types of resources offered by eachnode (i.e., CPU, memory and disk). The revenue generated byVDC j per time slot can be written as follows:
Rj =⎛⎝∑
v∈Vj
∑r∈R
(Cr(v) × σ r)+ ∑
e′∈Ej
bw(e′) × σ b
⎞⎠× γ
cj(1)
where Cr(v) is the demand of VM v belonging to VDC jin terms of resource r ∈ R, and σ r and σ b are unit price ofresource r and bandwidth, respectively, and γ is a weightingfactor that determines the importance of the green constraintsin the pricing.
Furthermore, a VM v ∈ Vj may have a location constraint.That is, it can only be embedded in a particular set of data
centers. To model this constraint, we define a binary variablezj
ik, indicating whether or not a VM k of VDC j can beembedded in a data center i.
The problem of embedding VDC requests in a distributedinfrastructure of data centers should be solved dynamically overtime. In fact, the decision of embedding VMs in different datacenters is modified at the beginning of every time slot in sucha way to follow the renewables. Thus, for each VDC request j,and during each time slot t ∈ [tj, tj + T j], the central controllershould:
• Assign each VM k ∈ Vj to a data center. Hence, we definethe decision variable xj,t
ik as:
xj,tik =
⎧⎪⎨⎪⎩
1 If the VM k of the VDC j is assigned
to data center i during slot t
0 Otherwise.
• Embed every virtual link either in the backbone networkif it connects two VMs assigned to different data centersor within the same data center, otherwise. To do so, wedefine the virtual link allocation variable f t
e,e′ as:
f te,e′ =
⎧⎪⎨⎪⎩
1 If the link e ∈ E is used to embed
the virtual link e′ ∈ Ej during slot t
0 Otherwise.
As a CP can reject a request due to shortage in resourcesor too tight constraints (delay, location), we define a binaryvariable Xj, which indicates whether the VDC request j isaccepted for embedding or not defined as follows:
Xj ={
1 If∑
t∈Tk∑
i∈V∑
k∈Vj xj,tik ≥ 1
0 Otherwise.
Finally, the ultimate objective of the CP when embedding VDCrequests during any reporting period Tk is to maximize itsprofit defined as the difference between the revenue (denotedby Rk) and the total embedding cost plus penalty cost, whichconsists of the embedding cost in the data centers (denoted byDk), the migration cost (denoted by Mk) the embedding costin the backbone network Bk and the penalty cost Pk. Hence,our problem can be formulated as an ILP with the followingobjective function:
Maximize Rk − (Dk + Bk + Mk + Pk) (2)
Subject to:
xj,tik ≤ zj
ik, ∀k ∈ Vj,∀i ∈ V,∀t, (3)∑i∈V
xj,tik = Xj, ∀k ∈ Vj,∀j ∈ Qt,∀t (4)
∑e′∈Ej
f te,e′ × bw(e′) ≤ bw(e), ∀e ∈ E,∀t (5)
∑e∈E
f te,e′ × d(e) ≤ d(e′), ∀e′ ∈ Ej,∀t (6)
f te1,e′ − f t
e2,e′ = xtdst(e1)dst(e′) − xt
src(e2)src(e′),
∀e1, e2 ∈ E, dst(e1) = src(e2), ∀ e′ ∈ Vj ,∀t (7)
AMOKRANE et al.: GREENSLATER: ON SATISFYING GREEN SLAs IN DISTRIBUTED CLOUDS 367
where Qt is the set of VDC requests being embedded duringtime slot t, src(e) and dst(e) denote the source and destinationof link e, respectively. Equation (3) guarantees location con-straint satisfaction. Equation (4) depicts that a VM is assignedto at most one data center. Equation (5) guarantees that linkcapacities are not exceeded in the backbone network, whereas(6) guarantees that delay requirements of virtual links aresatisfied. Equation (7) denotes the flow continuity constraint.
The revenue for a reporting period Tk is given by:
Rk =∑t∈Tk
∑j∈Qt
Rj × Xj (8)
Let us now focus on the expression of the embedding costsDk, Bk, Mk and Pk in the data centers, the backbone networkand penalty, respectively. Recall that these costs are part of theobjective function.
- The cost of embedding in the data centersIn this work, we evaluate the request embedding cost in the
data centers in terms of energy costs.The total amount of consumed power in data center i is
given by:
Pti = (
Pti,Net + Pt
i,Serv
) × PUEti (9)
where Pti,Serv and Pt
i,Net are the power consumed by servers andnetwork elements, respectively, and PUEt
i is the power usageeffectiveness of data center i during time slot t, which is usedto compute the power consumed by supporting systems such asthe cooling system. Note that this power consumption dependsmainly on the local allocation scheme in each data center.
The mix of power used in data center i is given by:
Pti = Pt
i,L + Pti,D (10)
where Pti,L and Pt
i,D denote, respectively, the consumed on-siterenewable power and the amount of purchased power from thegrid during time slot t. Note that Pt
i,L should not exceed theamount of produced power, which is captured by Pt
i,L ≤ RNti ,
where RNti is the amount of onsite renewable power generated
in data center i, during time slot t, expressed in kW.Hence, the total embedding cost in all data centers (expressed
in $) can be written as:
Dk =∑t∈Tk
∑i∈V
Pti,L × ηi + Pt
i,D × ζ ti (11)
where ηi is the onsite renewable power cost in data center i($/kWh), ζ t
i is the electricity price in data center i ($/kWh).- The cost of embedding in the backbone networkVirtual links between the VMs that have been assigned to
different data centers should be embedded in the backbonenetwork. We assume that it is proportional to their bandwidthrequirements and the length of physical paths to which they aremapped. It is given by:
Bk =∑t∈Tk
∑e′∈Ej
∑e∈E
f te,e′ × bw(e′) × σp (12)
where σp is the cost incurred by the CP per unit of bandwidthallocated in the backbone network. Note that σp defines both theenergy cost and any additional cost related to inter-data centerbandwidth as defined in [29]. σp is the average cost per unit ofbandwidth given the total measured cost.
- The migration costLet t − 1 denote the time slot previous to time slot t. The
migration cost is given by:
Mk =∑t∈Tk
∑j∈(Qt−1∩Qt)
∑a∈Vj
∑i1,i2∈V
migj,ta,i1,i2
× (ma,j + wa,j,i1,i2)
(13)
where ma,j is the cost of migrating VM a of VDC j, whichcorresponds to the disruption in service that might occur whenmigrating the VM, wa,j,i1,i2 is the energy cost for migrating VMa of VDC j from data center i1 to data center i2. In this paper,we use the following formula of wa,j,i1,i2 provided in [30]:
wa,j,i1,i2 = (0.512 × �mig + 20.165) ∗ δti1
+ δtI2
2
where �mig is the amount of data transferred between data cen-ters during the migration of VMs. Note also that δt
i representsthe power cost in data center i at time slot t, which is equal toζ t
i if the power is consumed from the grid and equal to ηti if
the power is from on-site renewable source of energy. Finally,migj,t
a,i1,i2is a binary variable that determines whether VM a of
VDC j have been migrated to data center i2 from data center i1at the beginning of time slot t. It is defined as follows:
migj,ta,i1,i2
=
⎧⎪⎨⎪⎩
1 If xj,ti2a = 1 and xj,t−1
i2a = 0
and xj,ti1a = 0 and xj,t−1
i1a = 1
0 Otherwise.
Note that we assume that there is no cost for link migration asno data transfer is needed.
- The penalty costThe penalty is paid by the CP to the SP whenever the speci-
fied green SLA is not met. At the end of every reporting periodTk, the CP reports the carbon emission related to each VDCrequest j that has been embedded for the whole time period Tk
or during a part of it. Since the carbon emissions are due to thepower consumption, we can derive the carbon emission of everydata center i during a time slot t, denoted by C t
i , as follows:
C ti = Pt
i,D × Ci (14)
where Pti,D denotes the amount of purchased power from the
grid by data center i during time slot t and Ci is the carbonfootprint per unit of power used from the grid in data center iexpressed in tons of carbon per kWh (tonsCO2/kWh).
We derive the carbon emissions, in the entire infrastructure,due to the servers (denoted by C t
i,Serv) and the network (denotedby C t
Net), as follows:
C tServ = 1
|V|∑i∈V
C ti × Pt
i,Serv
Pti,Net + Pt
i,Serv(15)
C tNet = 1
|V| + 1×
(∑i∈V
C ti × Pt
i,Serv
Pti,Net + Pt
i,Serv
+ C tBckb
)(16)
368 IEEE TRANSACTIONS ON NETWORK AND SERVICE MANAGEMENT, VOL. 12, NO. 3, SEPTEMBER 2015
where C tBckb is the carbon emission due to embedding virtual
links in the backbone network. In a similar way to the datacenters, C t
Bckb is computed for every time slot based on thepower consumption and the carbon footprint per unit of power.
In this case, the average carbon emission rate of the CP perunit of VM during a reporting period Tk is given by:
CkCPU = 1
tke − tkb×
∑t∈[
tkb,tke]
C tServ∑
j∈Qt
∑v∈Vj Ccpu(v)
(17)
where Qt is the set of VDC requests being embedded duringtime slot t and Ccpu(v) is the capacity of VM v in terms of CPUunits.
Similarly, the carbon emission rate per unit of bandwidthduring a period Tk can be given as:
CkBW = 1
tke − tkb×
∑t∈[
tkb,tke]
C tNet∑
j∈Qt
∑e∈Ej bw(e)
(18)
As such, the carbon emission related to a VDC request jduring the period Tk, denoted by C j
k, can be given by:
C jk =T j
k ×⎛⎝
⎛⎝∑
v∈Vj
Ccpu(v) × CkCPU
⎞⎠+
⎛⎝∑
e∈Ej
bw(e) × CkBW
⎞⎠
⎞⎠
where T jk is the number of time slots of the period Tk during
which VDC j was embedded.Finally, a penalty is paid by the CP for an SP j at the end of
the period Tk if the carbon emission for VDC j is above the limitspecified in the SLA, i.e., C j
k > cj, where cj is the amount ofcarbon emission allowed by the SP for every reporting period.In this case, the total penalty cost for a period Tk is given by:
Pk =∑
j∈(∪t∈Tk Qt)
(Rj × T j
k
)× p, if C j
k > cj (19)
where p ∈ [0, 1] is the proportion of the SP’s bill to be refundedby the CP in case of SLA violation. Note that p can be constantas it is common nowadays [28], or variable depending on theextent of the violation. For instance, in this paper, we use asimple penalty model as follows:
p = max
(C j
k
cj, 1
)(20)
which makes the penalty proportional to the extent of theviolation, with a maximum refund of 100% of the total amountof the bill. In this paper, we investigate both cases (i.e., constantpenalty and variable penalty) and discuss them in the simulationresults.
The problem described above can be seen as a combinationof the bin-packing problem and the multi-commodity flow
problem, which are known to be NP-hard. Therefore, wepropose a simple yet efficient and scalable solution.
V. GREEN SLA OPTIMIZER (GREENSLATER)
Since the problem presented in the previous section isNP-hard, we propose a greedy three-step approach. At thearrival a VDC request, the Central Controller first splits it intopartitions such that the intra-partition bandwidth is maximizedand the inter-partition bandwidth is minimized. It then uses anadmission control algorithm that rejects VDCs with negativeprofit (i.e., the VDC cost is higher than the generated revenue).If the VDC is accepted, its partitions are embedded in differentdata centers. As the availability of renewables and electricityprices are variable over time, and the requests dynamicallyarrive and leave the system, we propose a reconfigurationalgorithm, which migrates partitions from the data centers withno available renewables to those with available renewables. Inthe following, we present in details the proposed algorithms.Note that the partitioning aims at minimizing the backbonenetworks cost, while the reconfiguration minimizes the energycost and limits the SLA violation by following the renewables,while taking into account the migration costs before migrating.
A. VDC Partitioning
Once received, the Central Controller divides the VDC re-quest into partitions where the intra-partition bandwidth is max-imized and the inter-partition bandwidth is minimized. Hence,each entire partition is then embedded in the same data center,which minimizes the inter-data center bandwidth. As the parti-tioning problem is NP-hard [31], we use the Location AwareLouvain Algorithm (LALA), the partitioning algorithm used in[6]. LALA is a modified version of the Louvain Algorithm [32]that considers location constraints. The objective of the Louvainalgorithm is to maximize the modularity, defined as an indexbetween −1 and 1 that measures intra-partition density (i.e.,the sum of the links’ weights inside partitions) compared tointer-partition density (i.e., sum of the weights of links betweenpartitions). In fact, graphs with high modularity have denseconnections (i.e., high sum of weights) between the nodeswithin partitions, but sparse connections across partitions. Sim-ilar to the Louvain algorithm, the complexity of LALA isO(n log n) [32].
B. Admission Control
When a VDC request is received, the Central Controllerchecks if the request will generate profit, in which case it isaccepted, otherwise it is rejected. In some cases, a request withtight carbon constraints might result in high SLA violationpenalties, which reduces the CP’s profit. To address this issue,we propose an admission control algorithm (Algorithm 1).The idea is to estimate the available renewable power in thenext prediction window and estimate carbon emission of therequested VDC. In this paper, we consider solar panels togenerate the renewable power and we use a prediction modelpresented in [13]. Moreover, we consider short term predictions(up to 4 hours).
AMOKRANE et al.: GREENSLATER: ON SATISFYING GREEN SLAs IN DISTRIBUTED CLOUDS 369
Algorithm 1 Admission Control Algorithm
1: IN: predictionWdW // the prediction window2: IN: reconfigInterval // the reconfiguration interval3: IN: vdc // the VDC to embed4: wdw ← min(predictionWdw, reconfigInterval)5: possible ← possibleToEmbed(vdc)6: if possible then7: carbonRate ← getEstimationCarbonRate(wdw)
8: carbonLimitRate ← vdc.carbonLimit/wdw9: if carbonRate ≤ carbonLimitRate then
10: Accept vdc11: else12: //Verify if profit can be made13: estimatedCost ← estimatePowerCost(vdc)14: if revenue(vdc)×(1−refundFactor)−estimatedCost>
0 then15: Accept vdc16: else17: Reject vdc18: end if19: end if20: else21: Reject vdc22: end if
First, the central controller checks whether it is possible toembed the VDC given the available resources and constraints ofthe VMs in the VDC. If the request is embeddable, the centralcontroller computes an estimation for carbon emission for therequest given the current power consumption and the predictedavailability of renewables for the next prediction window. Todo so, we propose to use a simple estimation algorithm, whichcomputes the estimation of carbon emission per unit of VMand per unit of bandwidth in the next prediction window, andby the same derives the estimation of carbon emission of thegiven VDC request. The estimated carbon of the VDC requestis then compared to the limit provided in the SLA of the VDCrequest. In case of SLA violation, the Central Controller checkswhether profit can still be made even if there is a penalty to pay.If the profit is positive, the VDC request is accepted, otherwiseit is rejected. It is worth noting that as the prediction windowis limited compared to the lifetime of some of the VDCs (up toweeks for long lived VDCs), the decision of accepting might bebiased as the short term forecasts can show high availability ofrenewables.
C. Partitions Embedding
Once a request Gj(Vj, Ej) is partitioned, the resulting parti-tions that are connected through virtual links can be seen as amultigraph Gj
M(VjM, Ej
M) where VjM is the set of nodes (parti-
tions) and EjM is the set of virtual links connecting them. This
multigraph is then embedded into the infrastructure, partitionby partition, using Algorithm 2. As reported in Algorithm 2,for each partition v ∈ Vj
M , we first build the list of data centers
that satisfy the location constraints of its VMs. The CentralController queries the Local Controller of each data center sfrom the list to get the embedding cost of v. The cost is returnedby the remote call getCost(s, v).
Algorithm 2 Greedy VDC Partitions Embedding Across DataCenters
1: IN: G(V ∪ W, E), GjM(Vj
M, EjM)
2: for all i ∈ V do3: ToDC[i] ← {}4: end for5: for all v ∈ Vj
M do6: Sv ← {i ∈ V/i satisfies the location constraint}7: end for8: for all v ∈ Vj
M do9: i ← s ∈ Sv with the smallest cost getCost(s, v), and
LinksEmbedPossible(s, v) = true10: if no data center is found then11: return FAIL12: end if13: ToDC[i] ← ToDC[i] ∪ {v}14: for all k ∈ N(v) do15: if k ∈ ToDC[i] then16: ToDC[i] ← ToDC[i] ∪ {evk}17: else18: if ∃l �= i ∈ V/k ∈ ToDC[l] then19: Embed evk in G using the shortest path20: end if21: end if22: end for23: end for24: return ToDC
The data center offering the lowest cost (provided by theprocedure getCost(s, v)) and able to embed virtual links be-tween v and all previously embedded partitions-denoted byN(v)-(verified by the function LinksEmbedPossible(s, v)) isthen selected to host the partition. These virtual links areembedded in the backbone network using the shortest pathalgorithm.
This procedure is repeated until all partitions and virtual linksthat connect them are embedded into the distributed infrastruc-ture. It is worth noting that the complexity of embedding thewhole multigraph is O(|Vj
M| × |V|), where |VjM| is the number
of partitions and |V| is the number of data centers.
D. Dynamic Partition Relocation
As the electricity price and the availability of renewablesare variable over time, we propose a dynamic reconfigurationalgorithm that optimizes VDC embedding over-time. Our aimis to migrate partitions that have already been embedded indata centers which may run out of renewables towards datacenters with available renewable power. The second criterionto perform a migration is to move partitions to locations wherethe electricity price is lower.
370 IEEE TRANSACTIONS ON NETWORK AND SERVICE MANAGEMENT, VOL. 12, NO. 3, SEPTEMBER 2015
Algorithm 3 Greedy Partition Migration Across Data Centers
1: IN: predictionWdW // the prediction window2: IN: reconfigInterval // the reconfiguration interval3: wdw ← min(predictionWdW, reconfigInterval)4: for all i ∈ V do5: Diff [i] ← EstimateRenewables(wdw, i) −
FutureConsumption(wdw, i)6: if Diff [i] < 0 then7: part[i] ← list of partitions in i sorted by migration
cost8: end if9: end for
10: for all i ∈ V, Diff [i] < 0 do11: while k ∈ V, Diff [k] > 0 do12: p ← part[i].first13: D ← {k ∈ V, Diff [k] > 0}14: done ← false15: while !done && D �= φ do16: //Take the data center with the minimum cost in the
backbone network after migration17: dest ← minBackboneCost(D)
18: Migrate(p, dest)19: if successful migration then20: done ← true21: Update Diff [dest] and Diff [i]22: else23: D ← D\{dest}24: end if25: end while26: end while27: end for
We, hence, propose a migration algorithm (Algorithm 3)executed every τ hours (i.e., reconfiguration interval) by theCentral Controller.
Data centers are first classified into two categories: sourcesand destinations. A data center is considered as a source if it hasnot enough renewable power to support its workload and hencewe will have to resort to power from the grid. In this case, in asource data center, the difference between the estimated avail-able renewable power and the estimated power consumptionis negative (cf. Line 5 of Algorithm 3). Conversely, if a datacenter has renewable power that exceeds its estimated powerconsumption, it is considered as destination data center sincethere is no need to reduce its workload and migrate VMs. Inthis case, it might be able to host more partitions if it has enoughrenewable power.
The idea is that partitions from source data centers shouldbe migrated to destination data centers. To do so, the list ofpartitions in each source data center are sorted in increasingorder of their migration cost (cf. Line 7 of Algorithm 3). Foreach partition, one destination data center that have a positivedifference is chosen. The destination is chosen in a way thatminimizes the inter-data center virtual link embedding costafter migration.
VI. PERFORMANCE EVALUATION
To evaluate the performance of Greenslater, we conductedseveral simulations using a realistic topology and real tracesfor electricity prices and renewable power availability. In thefollowing, we first describe the simulation setting. Then, wepresent the results under two different penally cost models: afixed penalty and a variable penalty that depends on the extentof the Green SLA violation.
A. Simulation Settings
For our simulations, we consider a physical infrastructureof 4 data centers located at four different states: New York,Illinois, California and Texas. The data centers are connectedthrough the NSFNet topology as a backbone network, whichincludes 14 nodes. Each data center is connected to the back-bone network through the closest node to its location. Weassume all NSFNet links have a capacity of 100 Gbps. Thetraces of electricity prices and availability of renewable energyare provided by the US Energy Information Administration(EIA) [33]. The weather forecast is taken from the NationalRenewable Energy Laboratory [34] and the amount of powergenerated per square meter of solar panel from [35]. The carbonfootprint per unit of power is provided by [36].
Similar to previous works [6], [15], VDCs are generatedrandomly according to a Poisson process with arrival rate λ
and a lifetime following an exponential distribution with mean1/μ. The number of VMs per VDC is uniformly distributedbetween 10 and 50 for regular VDCs, and between 5 and 10for small VDCs. Note that the small VDCs are used onlyto run the exhaustive search algorithm in order to study theconvergence to the optimal solution. A pair of VMs belongingto the same VDC are directly connected with a probability 0.5with a bandwidth demand uniformly distributed between 10and 50 Mbps and a delay uniformly distributed between 10 and100 milliseconds. Each VM has a number of cores uniformlydistributed between 1 and 4. Moreover, in each VDC, a fractionof VMs, denoted by Ploc ∈ [0, 1], is assumed to have locationconstraints and thus cannot be migrated, i.e., it can only beembedded in a specific set of data centers. Each VDC comeswith a carbon limit constraint specified in the Green SLA.This limit is assumed to be uniformly distributed between 5and 20 kgCO2 per day independently of the size of the VDCsto show the independence of our approach from the carbonconstraints. When the Green SLA is not satisfied, the CPrefunds a proportion p of the SP’s bill for that specific period oftime. In the first set of experiments, we consider p to be fixed to50% of the bill. In the second set of experiments, we consider pto be proportional to the violation, i.e., the refund in percentageis equal to the proportion of violation divided by the limit ofcarbon of the VDC with a cap of 100%.
To assess the effectiveness of our proposal, we com-pare Greenslater to three other solutions: (i) Greenhead [6],(ii) Greenhead with No Partitioning (NP) (i.e., each VM isconsidered as a single partition), and (iii) the load balancingapproach for VDC embedding [23]. Moreover, we developed animplementation of the brute force exhaustive search algorithm,
AMOKRANE et al.: GREENSLATER: ON SATISFYING GREEN SLAs IN DISTRIBUTED CLOUDS 371
TABLE IICOMPARISON OF THE COMPUTATION TIME AND PERFORMANCE GAINS FOR THE OPTIMAL SOLUTION,
GREENSLATER, GREENHEAD, GREENHEAD NP AND LOAD BALANCING
that computes the optimal solution given by the ILP formulatedin Section IV, to assess the convergence of our solution aswell as the time complexity. The simulations are run usingour own developed discrete event simulator, which extends theprevious version developed in [6]. The interface between thecentral controller and the local controllers in each data centerare implemented using remote procedure calls. Note that foreach of the given results, the average values and confidenceintervals of 80 consecutive runs are used.
For performance evaluation, we consider five metrics: (i) theprofit of the CP, which is the difference between revenue and thesum of operational costs (i.e., power cost, backbone networkcost) and the Green SLA violation cost, (ii) the acceptanceratio (defined as the ratio of embedded requests out of the totalreceived requests by the CP), (iii) the carbon footprint generatedby the whole infrastructure, (iv) the green power utilizationand (v) the SLA violation penalty cost. We also measured thecomputation time for all the algorithms composing the solution,i.e., partitioning a VDC request, embedding the partitions, andthe reconfiguration time, which is the computation time to findnew embedding scheme for all partitions and virtual links.
B. Simulation Results Under Fixed Penalty Refund Factor
In this first set of simulations, we assume a fixed refundfactor p. Specifically, p is set to 50%. That is, the CP refunds50% of the SP’s bill for the period of violation. GreenslaterWe first study the impact of the different input parameters: thearrival rate λ, the fraction of location constrained VMs Ploc
and the reporting period T on the system performance, usingdifferent values of the reconfiguration interval τ .
1) Computation Time and Convergence: First, we inves-tigate the computation time of our proposed approach com-pared to the optimal solution given by the ILP formulation inSection IV, as well as the gain in terms of profit and SLAviolation costs. To this end, we run simulations at a smallarrival rate (λ = 2 Requests/hour) for small VDC requests(5–10 VMs). We implemented a brute force exhaustive searchalgorithm to find the optimal solution of the ILP formulated inSection IV. The brute force search algorithm iterates over allthe possibilities for VM placement and virtual link allocation.Moreover, it uses the full knowledge of the available renewablepower in the different data centers instead of the predictionalgorithm used by Greenslater. We measured the computation
time to partition, embed a VDC request and the time neededto reconfigure the infrastructure by migrating partitions. Wealso measured the profit gain compared to the Load Balancingapproach. The results are summarized in Table II.
As reported in Table II, for small sized VDCs, we can noticethat Greenslater achieves comparable gain in profit with the op-timal solution, while incurring shorter embedding+partitioningtime (i.e., 0.0043 ms in total) and reconfiguration time (i.e.,0.18 ms), compared to 11 seconds for embedding a request and49 seconds to find the optimal configuration when using theoptimal solution. Note that in this case, the other approachesachieve lower profit gain and higher computation time com-pared to Greenslater.
For large sized VDC requests, Greenslater again achieves thebest profit gain with a short computation time. Specifically, thepartitioning+embedding process of a VDC request takes lessthan 53 ms in average, which is similar to Greenhead as theyuse the same partitioning algorithm, while it takes less time forthe other approaches as they do not partition the VDC requests.Note that the reconfiguration time in this case is less than 28 ms,which makes the algorithm usable in practice.
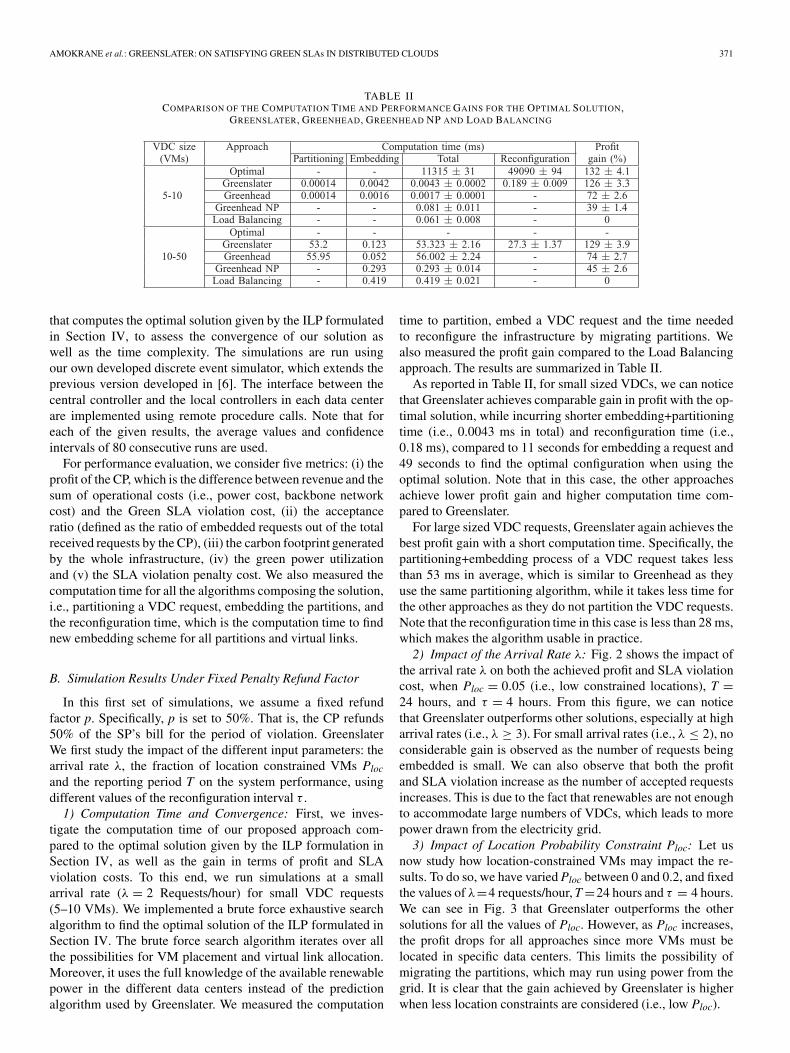
2) Impact of the Arrival Rate λ: Fig. 2 shows the impact ofthe arrival rate λ on both the achieved profit and SLA violationcost, when Ploc = 0.05 (i.e., low constrained locations), T =24 hours, and τ = 4 hours. From this figure, we can noticethat Greenslater outperforms other solutions, especially at higharrival rates (i.e., λ ≥ 3). For small arrival rates (i.e., λ ≤ 2), noconsiderable gain is observed as the number of requests beingembedded is small. We can also observe that both the profitand SLA violation increase as the number of accepted requestsincreases. This is due to the fact that renewables are not enoughto accommodate large numbers of VDCs, which leads to morepower drawn from the electricity grid.
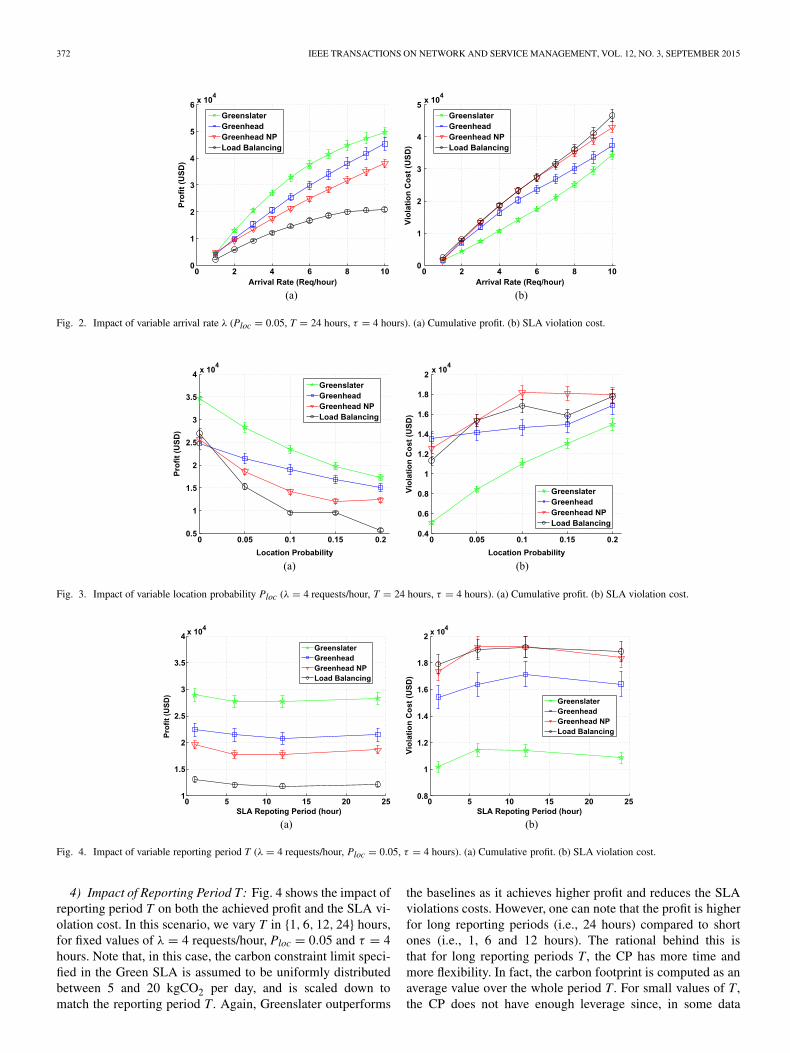
3) Impact of Location Probability Constraint Ploc: Let usnow study how location-constrained VMs may impact the re-sults. To do so, we have varied Ploc between 0 and 0.2, and fixedthe values of λ=4 requests/hour, T =24 hours and τ = 4 hours.We can see in Fig. 3 that Greenslater outperforms the othersolutions for all the values of Ploc. However, as Ploc increases,the profit drops for all approaches since more VMs must belocated in specific data centers. This limits the possibility ofmigrating the partitions, which may run using power from thegrid. It is clear that the gain achieved by Greenslater is higherwhen less location constraints are considered (i.e., low Ploc).
372 IEEE TRANSACTIONS ON NETWORK AND SERVICE MANAGEMENT, VOL. 12, NO. 3, SEPTEMBER 2015
Fig. 2. Impact of variable arrival rate λ (Ploc = 0.05, T = 24 hours, τ = 4 hours). (a) Cumulative profit. (b) SLA violation cost.
Fig. 3. Impact of variable location probability Ploc (λ = 4 requests/hour, T = 24 hours, τ = 4 hours). (a) Cumulative profit. (b) SLA violation cost.
Fig. 4. Impact of variable reporting period T (λ = 4 requests/hour, Ploc = 0.05, τ = 4 hours). (a) Cumulative profit. (b) SLA violation cost.
4) Impact of Reporting Period T: Fig. 4 shows the impact ofreporting period T on both the achieved profit and the SLA vi-olation cost. In this scenario, we vary T in {1, 6, 12, 24} hours,for fixed values of λ = 4 requests/hour, Ploc = 0.05 and τ = 4hours. Note that, in this case, the carbon constraint limit speci-fied in the Green SLA is assumed to be uniformly distributedbetween 5 and 20 kgCO2 per day, and is scaled down tomatch the reporting period T. Again, Greenslater outperforms
the baselines as it achieves higher profit and reduces the SLAviolations costs. However, one can note that the profit is higherfor long reporting periods (i.e., 24 hours) compared to shortones (i.e., 1, 6 and 12 hours). The rational behind this isthat for long reporting periods T, the CP has more time andmore flexibility. In fact, the carbon footprint is computed as anaverage value over the whole period T. For small values of T,the CP does not have enough leverage since, in some data
AMOKRANE et al.: GREENSLATER: ON SATISFYING GREEN SLAs IN DISTRIBUTED CLOUDS 373
Fig. 5. Impact of variable reconfiguration interval τ (λ = 4 requests/hour, Ploc = 0.05, T = 24 hours). (a) Cumulative profit. (b) SLA violation cost.
Fig. 6. Comparison of the cumulative values of the different metrics(λ = 4 requests/hour, Ploc = 0.05, T = 24 hours, τ = 4 hours).
centers, VMs cannot be migrated even though renewables areavailable. This results in more frequent violation of the GreenSLAs, which results in higher violations costs, as shown inFig. 4(b), and thus lower profit (see Fig. 4(a)).
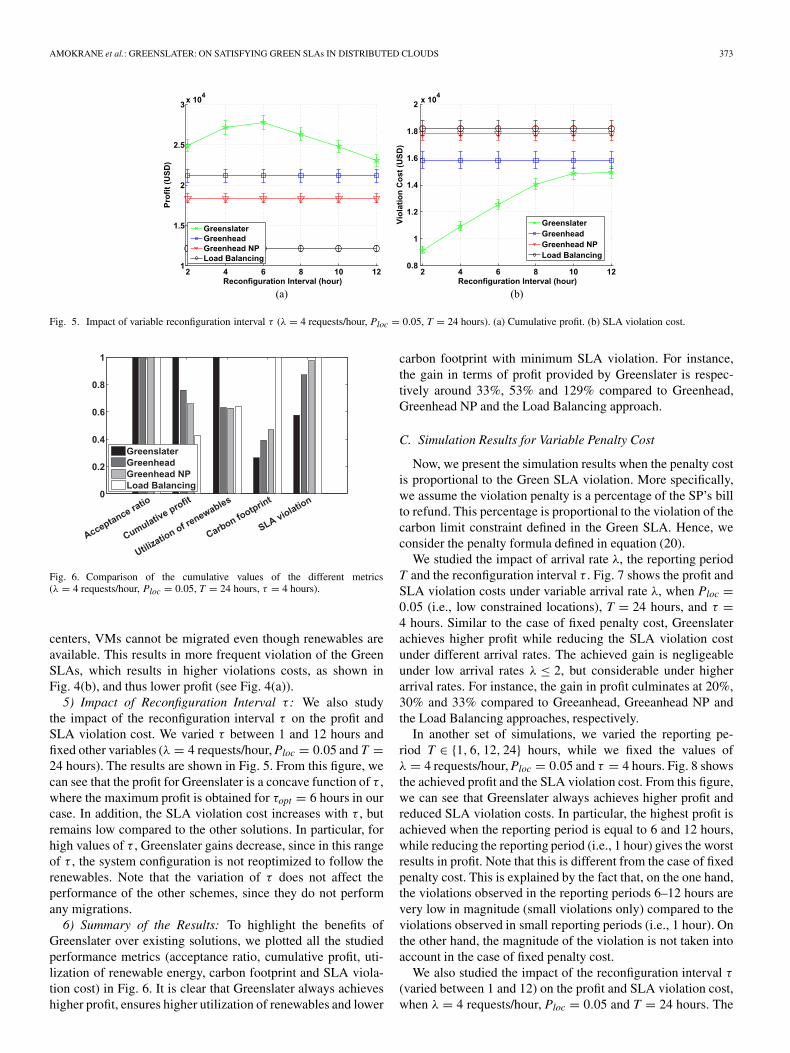
5) Impact of Reconfiguration Interval τ : We also studythe impact of the reconfiguration interval τ on the profit andSLA violation cost. We varied τ between 1 and 12 hours andfixed other variables (λ = 4 requests/hour, Ploc = 0.05 and T =24 hours). The results are shown in Fig. 5. From this figure, wecan see that the profit for Greenslater is a concave function of τ ,where the maximum profit is obtained for τopt = 6 hours in ourcase. In addition, the SLA violation cost increases with τ , butremains low compared to the other solutions. In particular, forhigh values of τ , Greenslater gains decrease, since in this rangeof τ , the system configuration is not reoptimized to follow therenewables. Note that the variation of τ does not affect theperformance of the other schemes, since they do not performany migrations.
6) Summary of the Results: To highlight the benefits ofGreenslater over existing solutions, we plotted all the studiedperformance metrics (acceptance ratio, cumulative profit, uti-lization of renewable energy, carbon footprint and SLA viola-tion cost) in Fig. 6. It is clear that Greenslater always achieveshigher profit, ensures higher utilization of renewables and lower
carbon footprint with minimum SLA violation. For instance,the gain in terms of profit provided by Greenslater is respec-tively around 33%, 53% and 129% compared to Greenhead,Greenhead NP and the Load Balancing approach.
C. Simulation Results for Variable Penalty Cost
Now, we present the simulation results when the penalty costis proportional to the Green SLA violation. More specifically,we assume the violation penalty is a percentage of the SP’s billto refund. This percentage is proportional to the violation of thecarbon limit constraint defined in the Green SLA. Hence, weconsider the penalty formula defined in equation (20).
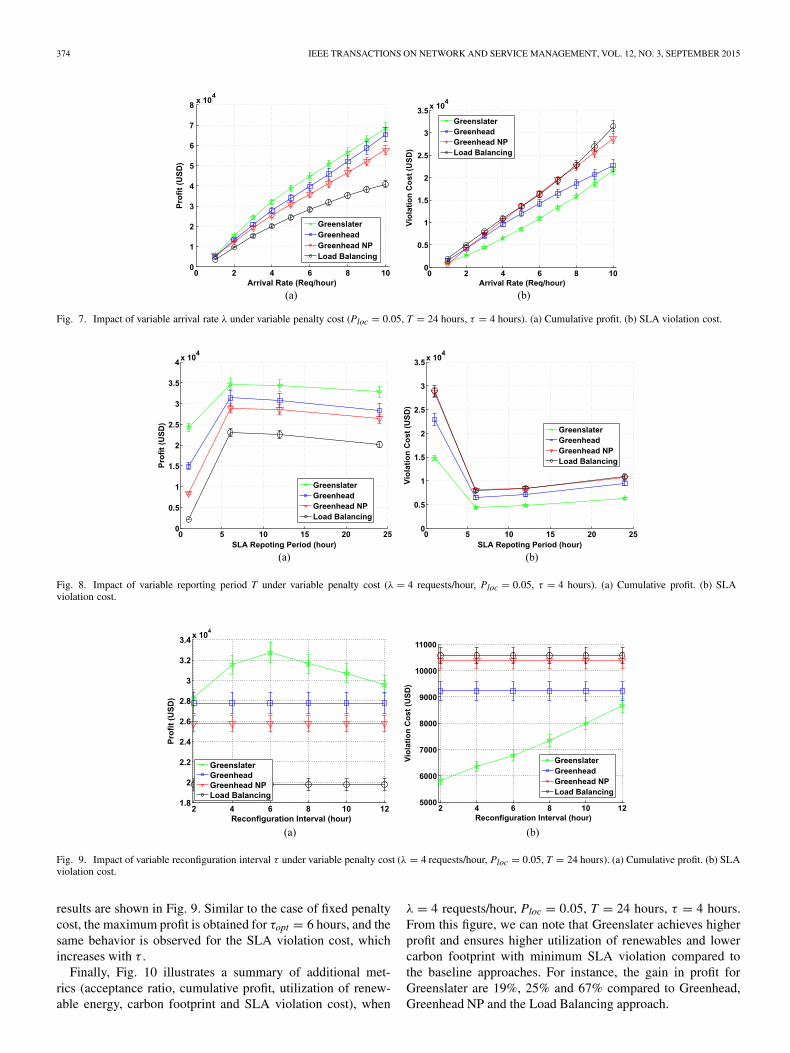
We studied the impact of arrival rate λ, the reporting periodT and the reconfiguration interval τ . Fig. 7 shows the profit andSLA violation costs under variable arrival rate λ, when Ploc =0.05 (i.e., low constrained locations), T = 24 hours, and τ =4 hours. Similar to the case of fixed penalty cost, Greenslaterachieves higher profit while reducing the SLA violation costunder different arrival rates. The achieved gain is negligeableunder low arrival rates λ ≤ 2, but considerable under higherarrival rates. For instance, the gain in profit culminates at 20%,30% and 33% compared to Greeanhead, Greeanhead NP andthe Load Balancing approaches, respectively.
In another set of simulations, we varied the reporting pe-riod T ∈ {1, 6, 12, 24} hours, while we fixed the values ofλ = 4 requests/hour, Ploc = 0.05 and τ = 4 hours. Fig. 8 showsthe achieved profit and the SLA violation cost. From this figure,we can see that Greenslater always achieves higher profit andreduced SLA violation costs. In particular, the highest profit isachieved when the reporting period is equal to 6 and 12 hours,while reducing the reporting period (i.e., 1 hour) gives the worstresults in profit. Note that this is different from the case of fixedpenalty cost. This is explained by the fact that, on the one hand,the violations observed in the reporting periods 6–12 hours arevery low in magnitude (small violations only) compared to theviolations observed in small reporting periods (i.e., 1 hour). Onthe other hand, the magnitude of the violation is not taken intoaccount in the case of fixed penalty cost.
We also studied the impact of the reconfiguration interval τ
(varied between 1 and 12) on the profit and SLA violation cost,when λ = 4 requests/hour, Ploc = 0.05 and T = 24 hours. The
374 IEEE TRANSACTIONS ON NETWORK AND SERVICE MANAGEMENT, VOL. 12, NO. 3, SEPTEMBER 2015
Fig. 7. Impact of variable arrival rate λ under variable penalty cost (Ploc = 0.05, T = 24 hours, τ = 4 hours). (a) Cumulative profit. (b) SLA violation cost.
Fig. 8. Impact of variable reporting period T under variable penalty cost (λ = 4 requests/hour, Ploc = 0.05, τ = 4 hours). (a) Cumulative profit. (b) SLAviolation cost.
Fig. 9. Impact of variable reconfiguration interval τ under variable penalty cost (λ = 4 requests/hour, Ploc = 0.05, T = 24 hours). (a) Cumulative profit. (b) SLAviolation cost.
results are shown in Fig. 9. Similar to the case of fixed penaltycost, the maximum profit is obtained for τopt = 6 hours, and thesame behavior is observed for the SLA violation cost, whichincreases with τ .
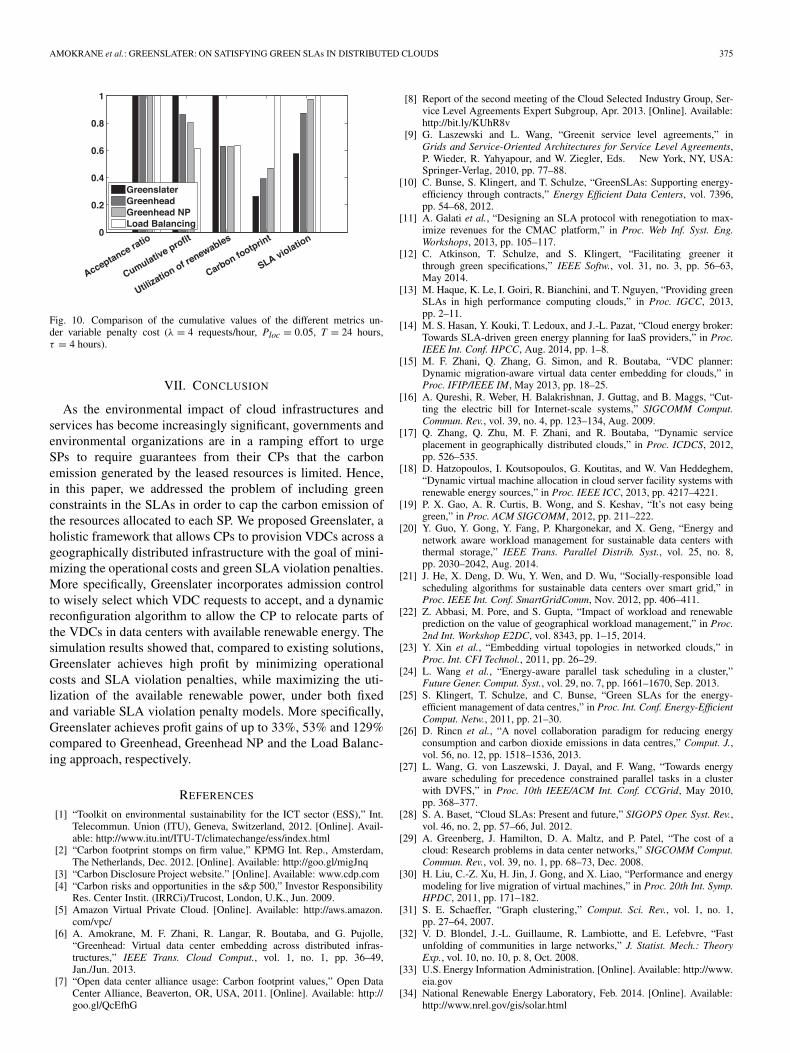
Finally, Fig. 10 illustrates a summary of additional met-rics (acceptance ratio, cumulative profit, utilization of renew-able energy, carbon footprint and SLA violation cost), when
λ = 4 requests/hour, Ploc = 0.05, T = 24 hours, τ = 4 hours.From this figure, we can note that Greenslater achieves higherprofit and ensures higher utilization of renewables and lowercarbon footprint with minimum SLA violation compared tothe baseline approaches. For instance, the gain in profit forGreenslater are 19%, 25% and 67% compared to Greenhead,Greenhead NP and the Load Balancing approach.
AMOKRANE et al.: GREENSLATER: ON SATISFYING GREEN SLAs IN DISTRIBUTED CLOUDS 375
Fig. 10. Comparison of the cumulative values of the different metrics un-der variable penalty cost (λ = 4 requests/hour, Ploc = 0.05, T = 24 hours,τ = 4 hours).
VII. CONCLUSION
As the environmental impact of cloud infrastructures andservices has become increasingly significant, governments andenvironmental organizations are in a ramping effort to urgeSPs to require guarantees from their CPs that the carbonemission generated by the leased resources is limited. Hence,in this paper, we addressed the problem of including greenconstraints in the SLAs in order to cap the carbon emission ofthe resources allocated to each SP. We proposed Greenslater, aholistic framework that allows CPs to provision VDCs across ageographically distributed infrastructure with the goal of mini-mizing the operational costs and green SLA violation penalties.More specifically, Greenslater incorporates admission controlto wisely select which VDC requests to accept, and a dynamicreconfiguration algorithm to allow the CP to relocate parts ofthe VDCs in data centers with available renewable energy. Thesimulation results showed that, compared to existing solutions,Greenslater achieves high profit by minimizing operationalcosts and SLA violation penalties, while maximizing the uti-lization of the available renewable power, under both fixedand variable SLA violation penalty models. More specifically,Greenslater achieves profit gains of up to 33%, 53% and 129%compared to Greenhead, Greenhead NP and the Load Balanc-ing approach, respectively.
REFERENCES
[1] “Toolkit on environmental sustainability for the ICT sector (ESS),” Int.Telecommun. Union (ITU), Geneva, Switzerland, 2012. [Online]. Avail-able: http://www.itu.int/ITU-T/climatechange/ess/index.html
[2] “Carbon footprint stomps on firm value,” KPMG Int. Rep., Amsterdam,The Netherlands, Dec. 2012. [Online]. Available: http://goo.gl/migJnq
[3] “Carbon Disclosure Project website.” [Online]. Available: www.cdp.com[4] “Carbon risks and opportunities in the s&p 500,” Investor Responsibility
Res. Center Instit. (IRRCi)/Trucost, London, U.K., Jun. 2009.[5] Amazon Virtual Private Cloud. [Online]. Available: http://aws.amazon.
com/vpc/[6] A. Amokrane, M. F. Zhani, R. Langar, R. Boutaba, and G. Pujolle,
“Greenhead: Virtual data center embedding across distributed infras-tructures,” IEEE Trans. Cloud Comput., vol. 1, no. 1, pp. 36–49,Jan./Jun. 2013.
[7] “Open data center alliance usage: Carbon footprint values,” Open DataCenter Alliance, Beaverton, OR, USA, 2011. [Online]. Available: http://goo.gl/QcEfhG
[8] Report of the second meeting of the Cloud Selected Industry Group, Ser-vice Level Agreements Expert Subgroup, Apr. 2013. [Online]. Available:http://bit.ly/KUhR8v
[9] G. Laszewski and L. Wang, “Greenit service level agreements,” inGrids and Service-Oriented Architectures for Service Level Agreements,P. Wieder, R. Yahyapour, and W. Ziegler, Eds. New York, NY, USA:Springer-Verlag, 2010, pp. 77–88.
[10] C. Bunse, S. Klingert, and T. Schulze, “GreenSLAs: Supporting energy-efficiency through contracts,” Energy Efficient Data Centers, vol. 7396,pp. 54–68, 2012.
[11] A. Galati et al., “Designing an SLA protocol with renegotiation to max-imize revenues for the CMAC platform,” in Proc. Web Inf. Syst. Eng.Workshops, 2013, pp. 105–117.
[12] C. Atkinson, T. Schulze, and S. Klingert, “Facilitating greener itthrough green specifications,” IEEE Softw., vol. 31, no. 3, pp. 56–63,May 2014.
[13] M. Haque, K. Le, I. Goiri, R. Bianchini, and T. Nguyen, “Providing greenSLAs in high performance computing clouds,” in Proc. IGCC, 2013,pp. 2–11.
[14] M. S. Hasan, Y. Kouki, T. Ledoux, and J.-L. Pazat, “Cloud energy broker:Towards SLA-driven green energy planning for IaaS providers,” in Proc.IEEE Int. Conf. HPCC, Aug. 2014, pp. 1–8.
[15] M. F. Zhani, Q. Zhang, G. Simon, and R. Boutaba, “VDC planner:Dynamic migration-aware virtual data center embedding for clouds,” inProc. IFIP/IEEE IM, May 2013, pp. 18–25.
[16] A. Qureshi, R. Weber, H. Balakrishnan, J. Guttag, and B. Maggs, “Cut-ting the electric bill for Internet-scale systems,” SIGCOMM Comput.Commun. Rev., vol. 39, no. 4, pp. 123–134, Aug. 2009.
[17] Q. Zhang, Q. Zhu, M. F. Zhani, and R. Boutaba, “Dynamic serviceplacement in geographically distributed clouds,” in Proc. ICDCS, 2012,pp. 526–535.
[18] D. Hatzopoulos, I. Koutsopoulos, G. Koutitas, and W. Van Heddeghem,“Dynamic virtual machine allocation in cloud server facility systems withrenewable energy sources,” in Proc. IEEE ICC, 2013, pp. 4217–4221.
[19] P. X. Gao, A. R. Curtis, B. Wong, and S. Keshav, “It’s not easy beinggreen,” in Proc. ACM SIGCOMM, 2012, pp. 211–222.
[20] Y. Guo, Y. Gong, Y. Fang, P. Khargonekar, and X. Geng, “Energy andnetwork aware workload management for sustainable data centers withthermal storage,” IEEE Trans. Parallel Distrib. Syst., vol. 25, no. 8,pp. 2030–2042, Aug. 2014.
[21] J. He, X. Deng, D. Wu, Y. Wen, and D. Wu, “Socially-responsible loadscheduling algorithms for sustainable data centers over smart grid,” inProc. IEEE Int. Conf. SmartGridComm, Nov. 2012, pp. 406–411.
[22] Z. Abbasi, M. Pore, and S. Gupta, “Impact of workload and renewableprediction on the value of geographical workload management,” in Proc.2nd Int. Workshop E2DC, vol. 8343, pp. 1–15, 2014.
[23] Y. Xin et al., “Embedding virtual topologies in networked clouds,” inProc. Int. CFI Technol., 2011, pp. 26–29.
[24] L. Wang et al., “Energy-aware parallel task scheduling in a cluster,”Future Gener. Comput. Syst., vol. 29, no. 7, pp. 1661–1670, Sep. 2013.
[25] S. Klingert, T. Schulze, and C. Bunse, “Green SLAs for the energy-efficient management of data centres,” in Proc. Int. Conf. Energy-EfficientComput. Netw., 2011, pp. 21–30.
[26] D. Rincn et al., “A novel collaboration paradigm for reducing energyconsumption and carbon dioxide emissions in data centres,” Comput. J.,vol. 56, no. 12, pp. 1518–1536, 2013.
[27] L. Wang, G. von Laszewski, J. Dayal, and F. Wang, “Towards energyaware scheduling for precedence constrained parallel tasks in a clusterwith DVFS,” in Proc. 10th IEEE/ACM Int. Conf. CCGrid, May 2010,pp. 368–377.
[28] S. A. Baset, “Cloud SLAs: Present and future,” SIGOPS Oper. Syst. Rev.,vol. 46, no. 2, pp. 57–66, Jul. 2012.
[29] A. Greenberg, J. Hamilton, D. A. Maltz, and P. Patel, “The cost of acloud: Research problems in data center networks,” SIGCOMM Comput.Commun. Rev., vol. 39, no. 1, pp. 68–73, Dec. 2008.
[30] H. Liu, C.-Z. Xu, H. Jin, J. Gong, and X. Liao, “Performance and energymodeling for live migration of virtual machines,” in Proc. 20th Int. Symp.HPDC, 2011, pp. 171–182.
[31] S. E. Schaeffer, “Graph clustering,” Comput. Sci. Rev., vol. 1, no. 1,pp. 27–64, 2007.
[32] V. D. Blondel, J.-L. Guillaume, R. Lambiotte, and E. Lefebvre, “Fastunfolding of communities in large networks,” J. Statist. Mech.: TheoryExp., vol. 10, no. 10, p. 8, Oct. 2008.
[33] U.S. Energy Information Administration. [Online]. Available: http://www.eia.gov
[34] National Renewable Energy Laboratory, Feb. 2014. [Online]. Available:http://www.nrel.gov/gis/solar.html
376 IEEE TRANSACTIONS ON NETWORK AND SERVICE MANAGEMENT, VOL. 12, NO. 3, SEPTEMBER 2015
[35] The Renewable Resource Data Center (RReDC), 2012. [Online]. Avail-able: http://www.nrel.gov/rredc/
[36] Carbon Footprint Calculator, 2012. [Online]. Available: http://www.carbonfootprint.com
Ahmed Amokrane received the M.Sc. degree in computer science from ÉcoleNormale Supérieure de Cachan, Cachan, France, in 2011 and the Ph.D. degreein computer science from the Pierre and Marie Curie University, Paris, France,in 2014. He was a Visiting Ph.D. Student for nine months with the Universityof Waterloo, ON, Canada, and a Research Intern for six months with IBMT.J Watson Research Center, Yorktown Heights, NY, USA. He is currentlyworking as a Consultant and R&D Engineer with CoESSI, Montesson, France.His research interests include energy efficiency, green networking, and securityin wireless networks, cloud computing, and software-defined networks.
Rami Langar received the M.Sc. degree in network and computer science fromthe Pierre and Marie Curie University, Paris, France, in 2002 and the Ph.D. de-gree in network and computer science from Telecom ParisTech, Paris, France,in 2006. He is currently an Associate Professor with Laboratoire d’Informatiquede Paris 6 (LIP6), Pierre and Marie Curie University. In 2007 and 2008, hewas with the School of Computer Science, University of Waterloo, Waterloo,ON, Canada, as a Postdoctoral Research Fellow. His research interests includemobility and resource management in cloud radio access networks, wirelessmesh, vehicular ad hoc and femtocell networks, green networking, green cloud,and quality-of-service support.
Mohamed Faten Zhani received the Ph.D. degree in computer science fromthe University of Quebec, Montréal, QC, Canada, in 2011. He is an AssistantProfessor with the Department of Software and IT Engineering, École deTechnologie Supérieure (ÉTS), University of Quebec. Before that, he was aPostdoctoral Research Fellow with the David R. Cheriton School of ComputerScience, University of Waterloo, Waterloo, ON, Canada. His research interestsinclude cloud computing, virtualization, big-data analytics, software-definednetworks, and resource management in large-scale distributed systems.
Raouf Boutaba (M’93–SM’01–F’12) received the M.Sc. and Ph.D. degrees incomputer science from the Pierre and Marie Curie University, Paris, France, in1990 and 1994, respectively. He is currently a Professor of computer sciencewith the University of Waterloo, Waterloo, ON, Canada. His research interestsinclude resource and service management in networks and distributed systems.Dr. Boutaba is a Fellow of the IEEE, the Engineering Institute of Canada,and the Canadian Academy of Engineering. He served as a DistinguishedSpeaker for the IEEE Computer and Communications Societies. He is thefounding Editor-in-Chief of the IEEE TRANSACTIONS ON NETWORK AND
SERVICE MANAGEMENT (2007–2010), and he is on the editorial boards ofother journals. He was the recipient of several Best Paper Awards and otherrecognitions, such as the Premier’s Research Excellence Award, the IEEE HalSobol Award in 2007, the Fred W. Ellersick Prize in 2008, the Joe LociCeroAward and the Dan Stokesbury Award in 2009, the Salah Aidarous Award in2012, and the McNaughton Gold Medal in 2014.
Guy Pujolle received the Ph.D. and “These d’Etat” degrees in computerscience from the University of Paris IX and Paris XI, in 1975 and 1978,respectively. He is currently a Professor at Pierre et Marie Curie University-Paris 6, a Distinguished Invited Professor at POSTECH, Korea, a member of theInstitut Universitaire de France, and a member of The Royal PhysiographicalAcademy of Lund, Sweden. He spent the period 1994–2000 as Professor andHead of the computer science department of Versailles University. He was alsoProfessor and Head of the MASI Laboratory at Pierre et Marie Curie University(1981–1993), Professor at ENST (1979–1981), and a member of the scientificstaff of INRIA (1974–1979). He is the French representative at the TechnicalCommittee on Networking at IFIP. He is an Editor for ACM International Jour-nal of Network Management, Telecommunication Systems, and Editor in Chiefof Annals of Telecommunications. He is a pioneer in high-speed networkinghaving led the development of the first Gbit/s network to be tested in 1980. Hehas participated in several important patents like DPI or virtual networks. GuyPujolle is Co-founder of QoSMOS (www.qosmos.fr), Ucopia Communications(www.ucopia.com), EtherTrust (www.ethertrust.com), Virtuor (www.VirtuOR.fr), and Green Communications (www.green-communications.fr).


![[SLAS 2016] Poster presentation](https://img.pdfslide.us/doc/110x75/58edbea01a28ab5c7b8b46f5/slas-2016-poster-presentation.jpg)


