Embed Size (px)
Citation preview

Greening the GridUtility-Scale Battery Storage: When, Where, Why and How Much?
Paul Denholm | Principle Energy Analyst, National Renewable Energy Laboratory | February 27, 2019

In power systems with increasing levels of variable RE…
• What type of battery storage is valuable for the power system?
• What type of storage will be valuable in a high RE system?
• Is battery storage needed to integrate renewable energy? (Why?)
• How much storage is appropriate?
• Where should battery storage be located?
• When does battery storage become cost-effective?
Answers to these questions are complex and system-specific. Some trends are
emerging…
Overview

• In most power systems, storage isn’t yet needed to integrate larger amounts of variable RE.
– “Stand-alone” RE integration applications are typically not cost effective…yet
• Storage applications need to consider duration, location, and ability to combine and monetize multiple services
• Storage is increasingly cost competitive for short-duration ancillary services, and long duration applications that combine some elements of capacity, energy and transmission services
• As RE penetration increases, this increases the value of storage, and storage becomes an increasingly valuable tool for RE integration
– There are important potential tradeoffs when considering co-location of storage with RE or siting storage closer to load
Key Takeaways

Key concepts and definitions
4

Why all the hype, and why now?
5
Lithium-ion battery price survey, 2010-16 ($/kWh)Source: Bloomberg New Energy Finance, Lithium-ion Battery Costs and Market (July 2017)
Global Cumulative Storage Deployments, 2016-2030 (GWh) Source: Bloomberg New Energy Finance (November 2017)
73% cost reduction since 2010 due to
technology improvements,
economies of scale, manufacturing
competition
Similar trajectory to PV deployment in
early 2000s
Why batteries?

• Applications for energy storage are
defined by the following parameters:
– Power capacity (kW): rate of
charge or discharge (in kilowatts or
megawatts
– Energy capacity (kWh): amount of
stored energy (in kilowatt-hours or
megawatt-hours)
– Storage duration: amount of time
storage can discharge at its power
capacity before depleting its energy
capacity
What type of battery storage is valuable for the power
system?
6
For example, a battery with 1 MW of power capacity and 4 MWh of usable energy
capacity will have a storage duration of 4 hours.
What type?
Is Battery Storage Needed to Integrate
Renewable Energy?
7

• Net load is energy demand after accounting for solar and wind generation
– This is the energy demand that must be met by other resources on the power
system (e.g., thermal, hydro, storage, energy trade, demand response)
– Net load (like normal load without RE) is best balanced at the system level
Balancing Supply and Demand –The Importance of System-Wide Net Load
Figure source: NREL
Report No. FS-6A20-63039
Why batteries?

• We don’t balance or “firm” individual loads
• Why should we balance individual generators?
• The variability and uncertainty of loads and generators are
best optimized at a system level
• We of course need to address any additional need for
operating reserves, transmission constraints etc.
• Need to consider impacts of spatial diversity and all sources
of flexibility for integrating VRE
Do Individual Renewable Energy Plants
Require “Backup” From Battery Storage?
Aggregating windSource: NREL/FS-6A20-63037
Lew et al. 2013Aggregating solar
Balancing individual solar plants could result in
simultaneous charging AND discharging
Why batteries?

Battery Storage Can be Considered as
Part of the Flexibility Supply Curve
10You probably do this first
Cochran et al.
2015
Battery storage has historically
been among the most expensive
options for the integration of
renewable energy (or any grid
service)
But that is changing
When?

What type of battery storage is valuable for the
power system?
What type of storage will be valuable in a high RE
system?
11

Services currently valued in some markets
Proposed or early adoption services
Currently not valued services
Battery storage applications and
potential value streams
Energy and Capacity
Ancillary Services
Transmission Services
Distribution Services
End-Use Applications
mS S Min Hr Day
Energy
Firm Capacity
Fast Frequency Response
Frequency Regulation
Ramping reserves
Contingency Spinning Reserves
Replacement Nonspin Reserves
Voltage Support
Black-Start Capability
Type of Service
Primary Frequency Response
Timescale
Transmission Upgade Deferral
Transmission Congestion Relief
Distribution Upgade Deferral
Distribution Voltage Support
Distribution Loss Reduction
Power Quality
Reliability and Resiliency
Demand Charge Management
Time of Use and Real-Time Pricing
mS S Min Hr Day
Inertial Response
What type?

Energy and Capacity
Ancillary Services
Transmission Services
Distribution Services
End-Use Applications
mS S Min Hr Day
Energy
Firm Capacity
Fast Frequency Response
Frequency Regulation
Ramping reserves
Contingency Spinning Reserves
Replacement Nonspin Reserves
Voltage Support
Black-Start Capability
Type of Service
Primary Frequency Response
Timescale
Transmission Upgade Deferral
Transmission Congestion Relief
Distribution Upgade Deferral
Distribution Voltage Support
Distribution Loss Reduction
Power Quality
Reliability and Resiliency
Demand Charge Management
Time of Use and Real-Time Pricing
mS S Min Hr Day
Inertial Response
Services currently valued in some markets
Proposed or early adoption services
Currently not valued services
Battery storage applications and
potential value streams
• Storage can provide a range of grid
services at different timescales
• Value stacking enables storage
projects to monetize a range of value
streams
• Markets and planning need to evolve to
enable power system services that
storage (and other technologies) can
provide
• Renewable integration is largely
captured by existing service
categories
How quickly initial
response is needed
How long response is
needed
What type?

Energy and Capacity
Ancillary Services
Transmission Services
Distribution Services
End-Use Applications
mS S Min Hr Day
Energy
Firm Capacity
Fast Frequency Response
Frequency Regulation
Ramping reserves
Contingency Spinning Reserves
Replacement Nonspin Reserves
Voltage Support
Black-Start Capability
Type of Service
Primary Frequency Response
Timescale
Transmission Upgade Deferral
Transmission Congestion Relief
Distribution Upgade Deferral
Distribution Voltage Support
Distribution Loss Reduction
Power Quality
Reliability and Resiliency
Demand Charge Management
Time of Use and Real-Time Pricing
mS S Min Hr Day
Inertial Response
Battery storage applications and
potential value streams
• Storage can provide a range of grid
services at different timescales
• Value stacking enables storage
projects to monetize a range of
value streams
• Markets and planning need to evolve to
enable power system services that
storage (and other technologies) can
provide
• Renewable integration is largely
captured by existing service
categories
A battery providing firm capacity may
also provide energy arbitrage and
transmission congestion relief
Arbitrage alone cannot
pay for storage
Services currently valued in some markets
Proposed or early adoption services
Currently not valued services
What type?

Energy and Capacity
Ancillary Services
Transmission Services
Distribution Services
End-Use Applications
mS S Min Hr Day
Energy
Firm Capacity
Fast Frequency Response
Frequency Regulation
Ramping reserves
Contingency Spinning Reserves
Replacement Nonspin Reserves
Voltage Support
Black-Start Capability
Type of Service
Primary Frequency Response
Timescale
Transmission Upgade Deferral
Transmission Congestion Relief
Distribution Upgade Deferral
Distribution Voltage Support
Distribution Loss Reduction
Power Quality
Reliability and Resiliency
Demand Charge Management
Time of Use and Real-Time Pricing
mS S Min Hr Day
Inertial Response
Services currently valued in some markets
Proposed or early adoption services
Currently not valued services
Battery storage applications and
potential value streams
• Storage can provide a range of grid
services at different timescales
• Value stacking enables storage
projects to monetize a range of value
streams
• Markets and planning need to evolve to
enable power system services that
storage (and other technologies) can
provide
• Renewable integration is largely
captured by existing service
categories
In addition to unvalued services, the
value streams may cut across different
market conditions.
Value recovered from
an ISO/RTO market?
Value recovered from a
cost-of-service
transmission company?
What type?

Energy and Capacity
Ancillary Services
Transmission Services
Distribution Services
End-Use Applications
mS S Min Hr Day
Energy
Firm Capacity
Fast Frequency Response
Frequency Regulation
Ramping reserves
Contingency Spinning Reserves
Replacement Nonspin Reserves
Voltage Support
Black-Start Capability
Type of Service
Primary Frequency Response
Timescale
Transmission Upgade Deferral
Transmission Congestion Relief
Distribution Upgade Deferral
Distribution Voltage Support
Distribution Loss Reduction
Power Quality
Reliability and Resiliency
Demand Charge Management
Time of Use and Real-Time Pricing
mS S Min Hr Day
Inertial Response
Services currently valued in some markets
Proposed or early adoption services
Currently not valued services
Battery storage applications and
potential value streams
• Storage can provide a range of grid
services at different timescales
• Value stacking enables storage
projects to monetize a range of value
streams
• Markets and planning need to
evolve to enable power system
services that storage (and other
technologies) can provide
• Renewable integration is largely
captured by existing service
categories
Renewable time-shifting
and curtailment mitigation
Renewable “firming”
Renewable ramping
What type?

Energy and Capacity
Ancillary Services
Transmission Services
Distribution Services
End-Use Applications
mS S Min Hr Day
Energy
Firm Capacity
Fast Frequency Response
Frequency Regulation
Ramping reserves
Contingency Spinning Reserves
Replacement Nonspin Reserves
Voltage Support
Black-Start Capability
Type of Service
Primary Frequency Response
Timescale
Transmission Upgade Deferral
Transmission Congestion Relief
Distribution Upgade Deferral
Distribution Voltage Support
Distribution Loss Reduction
Power Quality
Reliability and Resiliency
Demand Charge Management
Time of Use and Real-Time Pricing
mS S Min Hr Day
Inertial ResponseBattery storage applications and
potential value streams
Ongoing competition from various
other flexibility resources
What type?

Energy and Capacity
Ancillary Services
Transmission Services
Distribution Services
End-Use Applications
mS S Min Hr Day
Energy
Firm Capacity
Fast Frequency Response
Frequency Regulation
Ramping reserves
Contingency Spinning Reserves
Replacement Nonspin Reserves
Voltage Support
Black-Start Capability
Type of Service
Primary Frequency Response
Timescale
Transmission Upgade Deferral
Transmission Congestion Relief
Distribution Upgade Deferral
Distribution Voltage Support
Distribution Loss Reduction
Power Quality
Reliability and Resiliency
Demand Charge Management
Time of Use and Real-Time Pricing
mS S Min Hr Day
Inertial Response
Two Examples of Potentially Cost
Effective Storage Applications
Operating Reserves
Shorter duration
(<1 hour)
• Regulation reserves to
balance short-term variability
• Fast frequency response to
replace lost inertia
What type?

Energy and Capacity
Ancillary Services
Transmission Services
Distribution Services
End-Use Applications
mS S Min Hr Day
Energy
Firm Capacity
Fast Frequency Response
Frequency Regulation
Ramping reserves
Contingency Spinning Reserves
Replacement Nonspin Reserves
Voltage Support
Black-Start Capability
Type of Service
Primary Frequency Response
Timescale
Transmission Upgade Deferral
Transmission Congestion Relief
Distribution Upgade Deferral
Distribution Voltage Support
Distribution Loss Reduction
Power Quality
Reliability and Resiliency
Demand Charge Management
Time of Use and Real-Time Pricing
mS S Min Hr Day
Inertial Response
Two Examples of Potentially Cost
Effective Storage Applications
Peaking Capacity
Longer duration
(>1 hour)
• Peaking capacity resource
• Energy shifting to recover
curtailed RE, arbitrage prices
• Can also provide
transmission services
What type?

Battery storage for the provision of operating
reserves
20

• Significant deployment for
frequency regulation (regulating reserves/ secondary
frequency response)
• Often most cost effective
early application
– Short duration
requirements
– High utilization of storage
assets
Early Deployment of Batteries for Reserves
How much?

Operating Reserves Represents the Ability to Increase
or Decrease Output Based on Grid Requirements
22
Batteries have
extremely fast
response timesBatteries are not
limited by minimum
stable levels and can
typically operate over
full range
Batteries are limited by
stored energy, so
shorter duration
devices may not be
able to provide long-
duration reserve
services such as
replacement reserves
Why batteries?

Regulating Reserves
23
• Responds to events (e.g.,
large generator faults) than
can result in decreased
frequency
• Operates during normal
operations to respond to
normal short-term variations in
supply and demand
Operating Reserves
Why batteries?
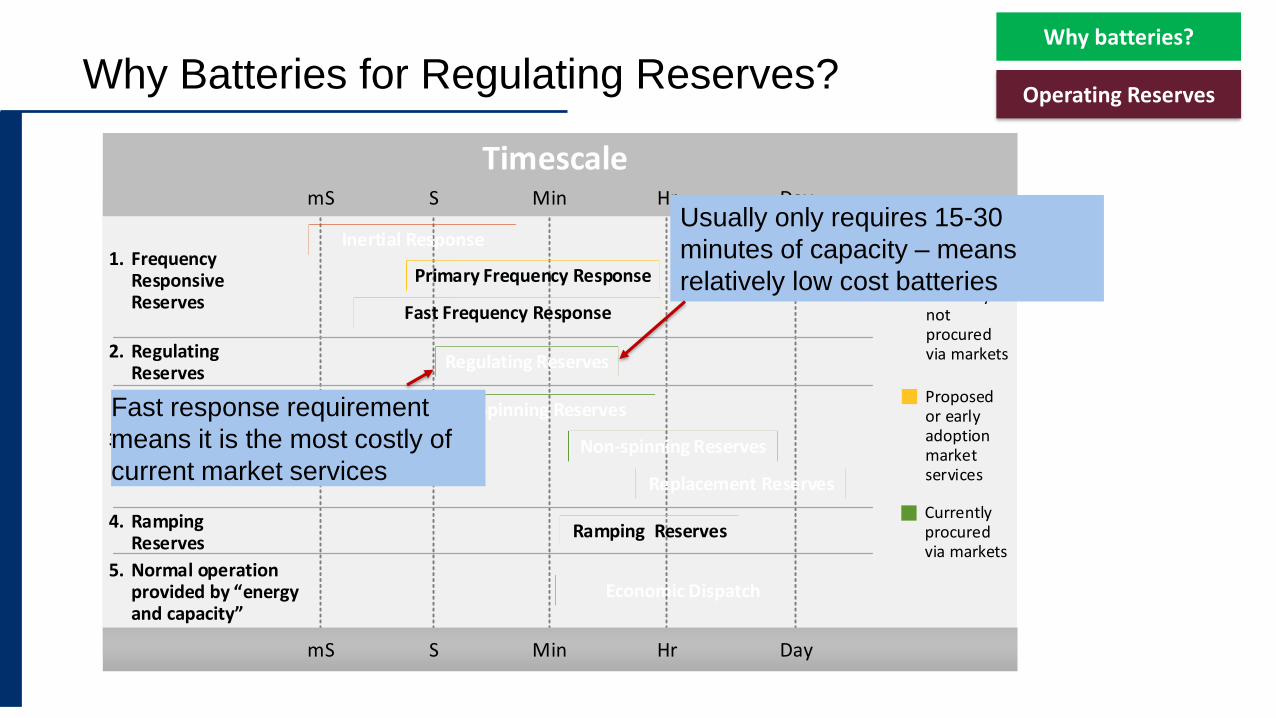
Why Batteries for Regulating Reserves?
Regulating Reserves
Spinning Reserves
Non-spinning Reserves
Primary Frequency Response
mS S Min Hr Day
Inertial Response
Economic Dispatch
Replacement Reserves
Ramping Reserves
1. FrequencyResponsiveReserves
3. ContingencyReserves
5. Normal operationprovided by “energyand capacity”
2. RegulatingReserves
4. RampingReserves
Services currentlynot procured via markets
Proposed or early adoption market services
Currently procured via markets
Fast Frequency Response
Option 3mS S Min Hr Day
Timescale
Fast response requirement
means it is the most costly of
current market services
Usually only requires 15-30
minutes of capacity – means
relatively low cost batteries
Operating Reserves
Why batteries?

Batteries Have the Flexibility to Continuously
Provide Upward and Downward Regulation
25
Discharge
Charge
Up
Reserve
Energy
Purchase
Up
Reserve
Up
Reserve Energy
Sales
Energy
Sales
Partial Charge
(Downward
Reserve Call
or Make-up
Energy
Purchase)
Idle Partial Discharge
FullDischarge
Up Res.
Down
Reserve
Down
Reserve
Down
Reserve
Down
Reserve
Energy storage typically has a larger
operating range for provision of
regulating reserves than thermal
generation.
Operating Reserves
Why batteries?

• More variable RE could increase the need for various reserves, including regulating reserves
– BUT ... integration studies show a relatively small increase in operating reserve
requirements as solar and wind are added
• For example, regulation reserve requirements have decreased in Texas as wind penetration has
increased
Impact of Increasing Amounts of Renewable
Energy on Reserve Requirements?
26
There is also competition for the
provision of operating reserves
from other sources, including
curtailed wind and solar and
demand response
?
Operating Reserves
How much?

• Something will need to replace inertial response and primary frequency response (PFR) from
synchronous generators
• Inconsistent terminology, but “fast frequency response” captures the ability of resources
(including storage) to measure and rapidly respond to deviations in frequency.
• FFR could replace some of the need for inertial response.
Other Reserve Services? Increasing Interest in
Frequency Responsive Reserves
27
Econ. Dispatch
Inertia
Frequency
(Hz)
Time (approx.)
60
Event
Occurs
0 s 10 s 30 s 5 m 10 m 30 m 1 hr
Contingency
Reserves
Non-Spinning / Replacement
Spinning
Regulating Res.
PFR Frequency Responsive
Reserves
Operating Reserves
How much?

Example: Fast Frequency Response
from Energy Storage
Source: Gevorgian, Burra, Morjaria (2018) https://www.nrel.gov/docs/fy18osti/71551.pdf
Operating Reserves
How much?

How much operating reserve do we need?
• Limited need for high value
reserves.
• Total market for regulating
reserves in all U.S. RTO/ISO
markets is ~2.6 GW.
• Already have ~700 MW of
new battery storage
• Increased competition from
DR and other sources
• What’s the next big thing?
0%
1%
2%
3%
4%
5%
6%
7%
8%
9%
10%
0
1,000
2,000
3,000
4,000
5,000
6,000
7,000
California Texas Florida
Frac
tio
n o
f An
nu
al P
eak
Dem
and
Cap
acit
y N
eed
ed (M
W)
0
10
20
30
40
50
60
70
80
California Texas Florida
Cap
acit
y N
eed
ed (G
W)
Operating Reserves
How much?

Battery storage peaking capacity
30

Recent Focus – Peaking Capacity
0
2
4
6
8
10
12
14
16
18
20
22
24
Pe
akin
g C
apac
ity
Inst
alle
d (
GW
)
Installation dates of U.S. peaking capacity (non
CHP CT, IC, oil/gas steam)
Significant peaking capacity now over 40 years old
Over the next 20 years, we would expect about 152
GW of peaking capacity to retire in the U.S.
• Aging peaking capacity in the U.S.,
• Other growing economies with increasing peak demand (air conditioning, climate impacts)
Peaking Capacity
How much?

Challenge of Comparing Storage to Conventional
Peaking Capacity: 1) Capacity Credit/Capacity Value
Capacity credit/capacity value reflects the ability of a generator to be available during periods of highest
system stress. This is typically during the periods of peak demand. Analysis must determine the
energy capacity (hours) needed to provide an alternative to conventional peaking capacity.
Florida has narrow peaks well suited for shorter duration storage
22,000
24,000
26,000
28,000
30,000
32,000
34,000
36,000
38,000
40,000
42,000
12 AM 6 AM 12 PM 6 PM
Load
(M
W)
Hour of Day
4 Hr Storage
6 Hr Storage
8 Hr Storage
Load Met withOther Generators
6,000
8,000
10,000
12,000
14,000
16,000
18,000
20,000
22,000
24,000
26,000
12 AM 6 AM 12 PM 6 PM
Load
(M
W)
Hour of Day
4 Hr Storage
6 Hr Storage
8 Hr Storage
Load Met with Other Generators
New York has longer peaks so requires longer duration storage
Peaking Capacity
How much?

Challenge of Comparing Storage to Conventional
Peaking Capacity: 2) Operational Value
• Batteries and combustion turbines with the same power capacity may have substantially different
operation in economic dispatch
• Batteries and CTs typically have low generation capacity factor (<20%) but batteries may still
have higher capacity factors than CTs
• Batteries may have different operational profiles, acting to avoid thermal generator starts. This
value is difficult to capture, and is uncompensated in ISO/RTO markets.
• LCOE vs LCOS may be a poor comparison metric
0
10
20
30
40
50
60
0
50
100
150
200
250
300
350
0 12 24 36 48 60 72
Syst
em
Mar
gin
al P
rice
($
/MW
h)
Sto
rage
Ge
ne
rati
on
(M
W)
Hour
Storage Generation
System Marginal Price
Peaking Capacity
How much?
Simulations of storage in
production cost models
often show short spikes of
battery output to avoid
thermal plant spikes and
address ramping events

$0
$50
$100
$150
$200
$250
$300
$350
$400
3 4 5 6 7 8
Bat
tery
(M
od
ule
On
ly)
Inst
alle
d C
ost
($
/kW
h)
Hours of Storage Needed
High Cost CT/HighValue Location
Low Cost CT/LowValue Location
So How Cheap Does Storage Have to Be?
We are nearing a tipping point for 4-hour storage providing
capacity services – but how big is this market?
GTM 2020
Estimate
($217/kWh)
Denholm et al. unpublished
Peaking Capacity
When?
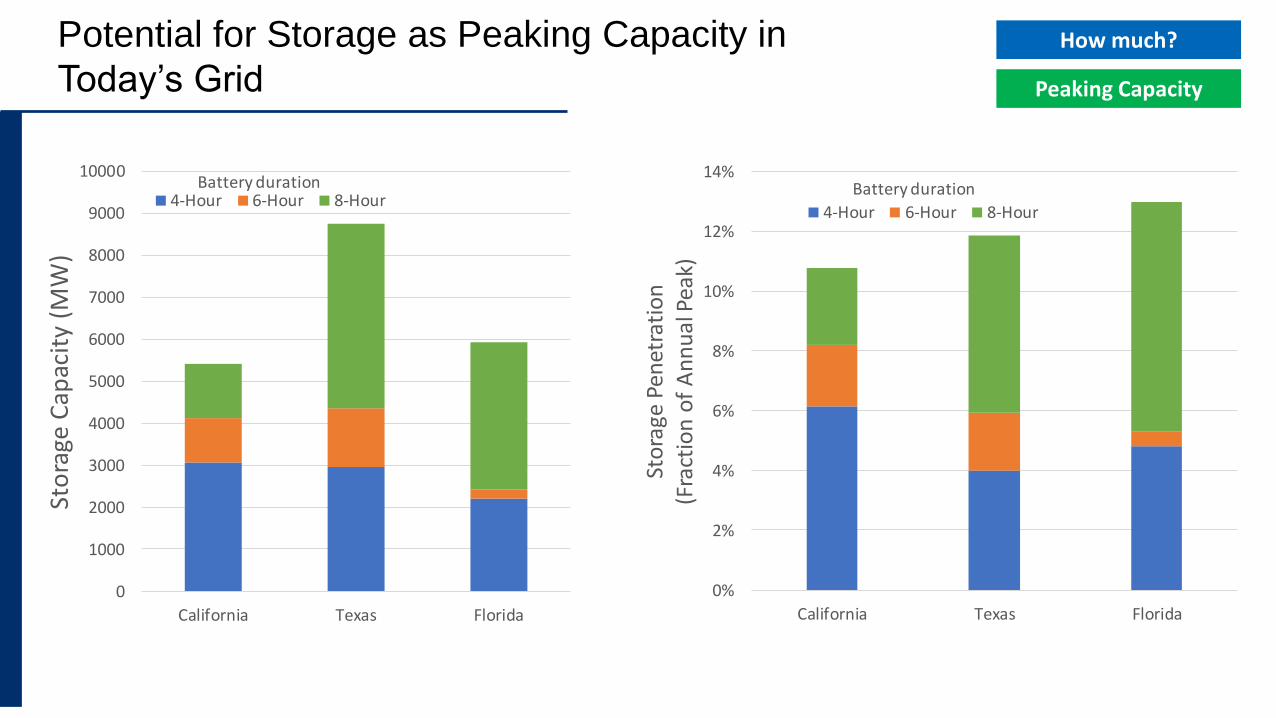
Potential for Storage as Peaking Capacity in
Today’s Grid
0%
2%
4%
6%
8%
10%
12%
14%
California Texas Florida
Sto
rage
Pen
etra
tio
n
(Fra
ctio
n o
f A
nn
ual
Pea
k)
4-Hour 6-Hour 8-Hour
0
1000
2000
3000
4000
5000
6000
7000
8000
9000
10000
California Texas Florida
Sto
rage
Cap
acit
y (M
W)
4-Hour 6-Hour 8-HourBattery duration Battery duration
Peaking Capacity
How much?
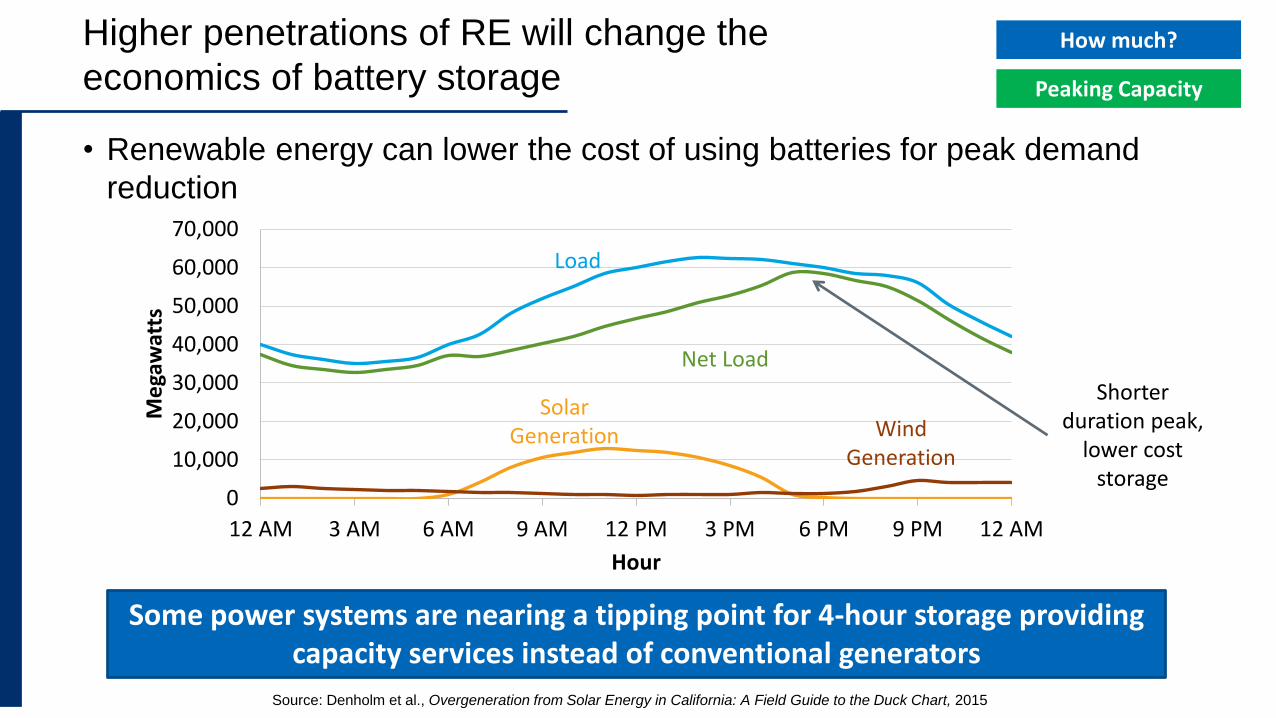
• Renewable energy can lower the cost of using batteries for peak demand
reduction
Higher penetrations of RE will change the
economics of battery storage
Source: Denholm et al., Overgeneration from Solar Energy in California: A Field Guide to the Duck Chart, 2015
0
10,000
20,000
30,000
40,000
50,000
60,000
70,000
12 AM 3 AM 6 AM 9 AM 12 PM 3 PM 6 PM 9 PM 12 AM
Me
gaw
atts
Hour
Shorter duration peak,
lower cost storage
Load
Net Load
Wind Generation
Solar Generation
Some power systems are nearing a tipping point for 4-hour storage providing capacity services instead of conventional generators
Peaking Capacity
How much?

How Do Renewables Affect This?
Zero PV
10% PV
5% PV
With increased PV penetration, the capacity value of PV decreases while the capacity value of storage increases
Peaking Capacity
How much?

Impact of PV on 4-Hour Storage Potential in California
0
1,000
2,000
3,000
4,000
5,000
6,000
7,000
8,000
9,000
10,000
11,000
0 2 4 6 8 10 12 14 16 18 20 22 24 26 28 30
4-H
ou
r S
tora
ge C
ap
acit
y (
MW
) P
rovid
ing
100%
Peak D
em
an
d
Red
ucti
on
Cre
dit
PV Penetration (%)
2017 Estimated PV Penetration
2020 Estimated PV Penetration
2016 Estimated PV Penetration
Denholm and Margolis 2017 Consistent correlation of storage
capacity with PV. Very limited
correlation with wind in the U.S.
Peaking Capacity
How much?

Where should storage be deployed?
39

1. At the load site?
2. Near remote renewables?
3. Coupled with other generation technologies (e.g., solar + storage, gas +
storage)?
Where should storage be deployed?
40
Where?

Location 1: Within Load Centers
• Allows replacement of peaking capacity in congested
regions
– Reduced siting challenges of thermal generation
– Defers investment in transmission and distribution
– Avoided T&D losses
– Scalable
Southern California Edison hybrid battery
storage, gas turbine peaker system
Where?

Location 2: Co-Located with Remote
RE Resources
Example: Interaction
Between Storage and
Transmission in the
Western United States
• Best wind resources are not close to major population centers
• Significant transmission capacity will be needed
• Transmission typically operated at relatively low capacity (based on capacity factor of wind)
Where?

Storage can reduce transmission
requirements
Where?
0
100
200
300
400
500
600
700
800
900
1000
0 2000 4000 6000 8000
Po
wer
(MW
)
Available Wind
Delivered Wind
Delivered Wind plusStored Wind
Capacity Factor of
this 200 MW of
transmission is about
10%
Duration curve for 1000 MW of wind in Texas
Remove 200 MW of
transmission and add
150 MW of storage
When evaluating such configurations
it is important to consider the ability
of storage to provide additional
services. But also compare to load-
sited storage.

Location 3: Integrated with Renewable Generation
• Enhance unit flexibility
• Reduce costs through shared componentry
• Provide streamlined acquisition for off-takers
• Can lead to inefficient levels of storage if required with all variable
RE (ignores benefits of geographic diversity)
DC-coupled (flexible charging)AC-coupled (flexible charging)
Where?

Energy and Capacity
Ancillary Services
Transmission Services
Distribution Services
End-Use Applications
mS S Min Hr Day
Energy
Firm Capacity
Fast Frequency Response
Frequency Regulation
Ramping reserves
Contingency Spinning Reserves
Replacement Nonspin Reserves
Voltage Support
Black-Start Capability
Type of Service
Primary Frequency Response
Timescale
Transmission Upgade Deferral
Transmission Congestion Relief
Distribution Upgade Deferral
Distribution Voltage Support
Distribution Loss Reduction
Power Quality
Reliability and Resiliency
Demand Charge Management
Time of Use and Real-Time Pricing
mS S Min Hr Day
Inertial Response
Siting Can Change Relative
Value of Various Applications
Which location is best?
…It depends!
Analysis is needed to optimize
the costs and benefits of various
storage siting optionsSiting near remote
renewable resources
may increase
transmission value
Siting closer to load can
increase capacity and
energy value
Where?

1. Stand-alone “renewable integration” applications of energy storage are typically neither needed nor cost effective in most grids.
2. Ancillary services (regulating reserves) appears to be cost effective for a few storage devices, but with limited market size.
3. When properly scheduled, long-duration (several hours of capacity) batteries provide an alternative to combustion turbines for meeting peak capacity requirements.
4. We are approaching a “tipping point” where storage provides a cost-effective alternative to conventional peaking capacity.
– This application also needs to consider the energy arbitrage value of storage. Combining energy and capacity applications is key as the value of storage for energy arbitrage alone is relatively low and is unlikely pay for any existing storage technology/device.
– RE will help accelerate the storage tipping point and increase the overall market size.
5. There is no easy “one size fits all” rules for where storage should be located. It is very application and grid-specific.
6. Careful analysis of storage is required to ensure it is sized and located properly, and that appropriate rules exist that can capture the value it can provide.
Conclusions / Opinions

NREL is a national laboratory of the
U.S. Department of Energy, Office of
Energy Efficiency and Renewable
Energy, operated by the Alliance for
Sustainable Energy, LLC.
Thank you
47

Questions?
Greening the Gridgreeningthegrid.org
Email: [email protected]
Webinar Panel
Paul Denholm
National Renewable Energy Laboratory
Email: [email protected]
Jennifer Leisch
United States Agency for International Development
Email: [email protected]