Embed Size (px)
Citation preview
Greening the Charcoal Chain
Substituting for Charcoal as a Household Cooking Fuel in Dar es
Salaam
Sarianne Palmula
Michelle T. Beaudin
Traineeship Report
ERM Module 5
16 July 2007
ii
This report was commissioned by: Poverty Reduction and Environmental Management
(PREM)
It was internally reviewed by: Dr. Pieter van Beukering and Sebastiaan Hess
IVM
Institute for Environmental Studies
Vrije Universiteit
De Boelelaan 1087
1081 HV Amsterdam
The Netherlands
Tel. +31-20-4449 555
Fax. +31-20-4449 553
E-mail: [email protected]
Copyright © 2007 Institute for Environmental Studies
All rights reserved. No part of this publication may be reproduced, stored in a retrieval system or
transmitted in any form or by any means, electronic, mechanical, photocopying, recording or
otherwise without the prior written permission of the copyright holder.
Greening the Charcoal Chain
i
Table of Contents
Abstract 1
1. Introduction 3
1.1 The Problem: Deforestation, Health Effects, and Greenhouse Gases 3
1.2 Purpose of this Study 4
1.3 Literature Review 5
1.4 Structure of Report 7
2. Research Methods 8
2.1 Purpose of the Survey 8
2.2 Survey Design and Implementation 9
2.3 Cost-Benefit Analysis 9
3. Stakeholder Views on Charcoal in Dar es Salaam 11
3.1 NGOs (TaTEDO, WWF, PREM, World Bank) 11
3.2 The Government 12
3.3 Charcoal Producers and Consumers 12
3.4 Producers of Alternative Fuels (Oryx, TANESCO) 13
3.5 Stakeholder Conclusions 14
4. Survey results 15
4.1 Demographics of Different Fuel Users 15
4.1.1 Fuel Source and Family Size 15
4.1.2 Income 16
4.1.3 Education 17
4.2 Profile of Different Fuel Users 18
4.3 Perceptions of cooking fuels 23
4.4 Switching 25
4.5 Motivation for Switching 31
4.6 Main Findings of the Survey 32
4.7 Uncertainties and Limitations of the Survey 33
5. Cost-Benefit Analysis 34
5.1 Household CBA 34
5.1.1 Costs 34
5.1.2 Benefits 36
5.1.3 Results of the Household CBA 37
5.1.4 Sensitivity Analysis of the Household CBA 38
5.2 Social Planner CBA 39
5.2.1 Costs 40
5.2.2 Benefits 41
5.2.3 Results of the Social Planner CBA 44
5.2.4 Sensitivity Analysis of the Social Planner CBA 44
5.3 Uncertainties and Limitations of the Cost-Benefit Analysis 45
6. Conclusions and Recommendations 47
6.1 Conclusions 47
6.2 Recommendations 48
References 50
ii
Acknowledgements
This report would not have been possible without the aid and support of several people.
We would like to take this opportunity to acknowledge a few of them. Dr. Pieter van
Beukering, our supervisor, who took the time to meet with us and calm our anxieties at
least once a week and Dr. Godius Kahyarara for his optimistic spirit, encouragement,
and efficient way of getting things done. We must thank all of the staff at the CEDR
office, Lucy, Sarah, and Irene, for helping to answer our many questions and allowing us
to interrupt them several times daily, the students at the University of Dar es Salaam,
George Mahende, Jenifer Edward, Rehema Mwaisaka, Jacqueline Nyantori, and Koku
John, for their excellent surveying skills, and Sebastiaan Hess for his helpful feedback
during a crucial stage of our research. A special thanks to Victor Geofrey for teaching us
all of the important Swahili words (“poa”), finding us a place to live, and teaching us a
little about Tanzania, and finally, Eric Massey for his excellent suggestions on how to
occupy ourselves when we were not hard at work.
Greening the Charcoal Chain
1
Abstract
One of the United Republic of Tanzania’s most prized resources, forest land, is being
threatened by the industry of charcoal. Deforestation caused by the charcoal industry is
a problem that developing countries around the world and particularly in Africa are
facing. This study will focus on this problem as it affects the city of Dar es Salaam, the
countries largest consumer of charcoal. A large number of citizens, 69% (Malimbwi
2001), use charcoal to cook with, increasing deforestation, adding to their health
problems and emitting detrimental greenhouse gases.
The process of producing and using charcoal is not sustainable and many organizations
are looking into ways of making the charcoal chain more sustainable. Many options
exist; however, this study will focus on decreasing charcoal consumption in the city of
Dar es Salaam. Using the results of a survey of 235 targeted households in the city, this
report seeks to explain what kinds of people use certain fuels, why they use those fuels,
their way of cooking with the fuel, and their willingness to switch to other fuels.
The results of the survey are used in two cost-benefit analyses (CBAs). A household
CBA will determine which fuel is the most cost effective, taking daily cost, initial
investment cost, health risk avoided and time savings into account. The results of the
household CBA will be used in a social planner CBA to determine if investing in a fuel
substitution campaign will benefit the society as a whole. The social planner CBA will
consider environmental benefits as well as the costs and benefits used in the household
CBA.
Finally, we conclude that investing in an extensive LPG marketing campaign to target
30% of charcoal users is not only feasible but beneficial to society. This measure will
decrease consumption of charcoal and make the industry more sustainable. Forestland, a
precious resource, will have a better chance of surviving and being of continued use to
the citizens of Tanzania.

Greening the Charcoal Chain
3
1. Introduction
The continent of Africa is dealing with the growing problem of deforestation and
desertification. This problem has become pressing in Tanzania. The forests outside the
country’s largest city, Dar es Salaam, are rich in biodiversity and keep the delicate local
climate in balance. Though these forests have great environmental value they are also
used to support the charcoal industry that fuels the stoves of most citizens of Dar es
Salaam. This has been a growing problem as these forests shrink and the rarest trees are
cut to make charcoal. Under the protection of the government these forests should not
be a target for charcoal makers. However, the trees in these forests are the best trees to
make charcoal from and the protection, though written in law, is not strictly enforced by
the ill equipped forest service.
1.1 The Problem: Deforestation, Health Effects, and Greenhouse Gases
Using charcoal as a cooking fuel attributes to many environmental problems, such as
deforestation, negative health effects, and an increase in greenhouse gas emissions. This
report was commissioned because of the huge impact charcoal production and use has on
Tanzania’s natural forests, however, we will not ignore its other effects. Here we will
discuss the consequences of producing and cooking with charcoal.
The foremost cause of deforestation in Tanzania is the production of charcoal. While
this is a country wide problem, this study draws much of its data about charcoal
production from the coastal forests, outside of Dar es Salaam, according to TaTEDO, the
country’s largest consumer of charcoal. The Pugu and Kazimzumbwi Forest Reserves
within the coastal forests are receiving the brunt of the city’s charcoal industry and by
decreasing the number of charcoal users the hope is that these forests will be saved.
Country wide the forests have reduced from 44.3 million ha in 1961 to 33.5 million ha in
1998 (Ministry of Natural Resources & Tourism 2001). The Division of Forestry and
Beekeeping estimates that the country loses between 130,000 and 500,000 ha of forest
land annually, against only 25,000 ha planted. In the Coastal Forests the loss is even
higher than the national average. Because of the value of older hardwood trees we see
an 87% decrease in natural forest between the years of 1987 and 2005 (PREM 2007a), as
these trees are selected for charcoal production.
Changes in land usage, such as natural forests to grassland or bushland, as is the case in
the Pugu and Kazimsumbwi Forest Reserves, can severely affect the local watersheds
and hydrological activities in the area. Deforestation causes soil erosion which clogs
rivers and removes fertile soil, as well as increases bushland growth which can prevent
the germination of young trees. Extreme weather patterns are also the result of
deforestation. Flooding and drought become common in areas where forests are lost.
Though research is lacking regarding the specific hydrological effects of deforestation in
the Pugu and Kazimsumbwi Forest Reserves it is safe to assume that many of the
extreme climatic changes taking place in the area are a result of said deforestation
(PREM 2007a).
Institute for Environmental Studies 4
In addition, to the climatic changes caused by deforestation, the production of charcoal is
a major contributor to greenhouse gases. Inefficient earth-mound kilns (the majority of
charcoal kilns) cause emissions of carbon dioxide (CO2) and methane (CH4). Use of
inefficient cooking stoves (used by 51% of the population (Malimbwi 2001)) wastes a
considerable amount of energy and causes incomplete combustion that creates methane.
Compared to CO2, methane has a very high global warming potential (around 25 times
more than CO2). In this way cooking with charcoal adds to global warming in a way
that using fossil fuels does not (WHO 2006).
Environmental degradation is not the only effect charcoal has on Tanzania. The health
effects of cooking with charcoal can be quite severe. Worldwide, cooking with biomass
(charcoal and firewood) is responsible for 1.5 million deaths. Exposure to smoke from
burning biomass can cause lung cancer, tuberculosis and cataracts. Globally, 2.7% of all
diseases are caused by cooking with biomass; in Tanzania the number is even higher at
4.4% (WHO 2007).
It is obvious that the production and use of charcoal will continue to be a major threat to
the welfare of Tanzanians’, unless something is done to stop its consumption. The
intention of this study is to bring Tanzania closer to a solution that will protect the health
and forests of its citizens.
1.2 Purpose of this Study
The desecration of Tanzania’s prized forests has come to the attention of many
organizations including the government of Tanzania, the World Bank, WWF, and many
other NGOs. Poverty Reduction and Environmental Management (PREM) has worked
in conjunction with many of these organizations to identify the links in the charcoal
chain. This study has been charged with filling one of the gaps of information in the
chain. In Dar es Salaam the household sector consumes 69% of all charcoal (Malimbwi
2001). Because it is the largest sector consuming charcoal it is important to understand
why people use charcoal, why they do not use other fuels, and whether or not it is
possible to get a significant portion of households to switch. This study will focus on
this gap and has addressed these issues with a survey of households in the city.
In addition to addressing the reasons for fuel usage we have performed a cost-benefit
analysis to address the question of which fuel is the least expensive fuel to use for
cooking. We have approached the CBA from two angles; from the household point of
view, calculating the specific cost and benefit of each fuel to the household; and then
from the social planner’s point of view, calculating the costs and benefits with the
addition of the cost to the environment. These analyses will allow decision makers to
look at the charcoal issue from two perspectives that have been missing from previous
studies.
This study will target the household sector in an attempt to find ways to discontinue the
use of charcoal and perhaps increase the use of a substitute fuel. The driving questions
of this study are: is it possible for people to stop using charcoal? If so, what should they
switch to? Do the benefits to society and the environment of people switching away from
charcoal outweigh the costs? Through the use of a household survey this study shows
why people switch from one fuel source to another, why they do not switch, what the
Greening the Charcoal Chain
5
perceptions of citizens of Dar es Salaam are regarding different sources of cooking fuel,
and if they are based on fact, as well as what the organizations listed above can do to
make switching fuels more likely to happen. Through a cost-benefit-analysis this report
also demonstrates the effects on society and the environment of people switching away
from charcoal.
Addressing the problem of deforestation due to charcoal production is complex and there
are aspects of the issue that will not be considered extensively here. It is recognized that
any decrease in charcoal consumption will greatly affect the lives of charcoal producers;
this study does not discuss the possibilities for alternative livelihoods though that is a
topic that others are considering. Also, though we recognize the affect the use of fossil
fuels has on the climate, we consider LPG to be a great step up from using charcoal and
regard it as a viable alternative. There are renewable fuels that exist and, with further
study and great effort, can be used as a fuel in Tanzania. However, due to a lack of
infrastructure the development and consumption of these fuels will not happen for some
time. This study puts forth improvements on the current situation for the short term.
Many other options exist to make the charcoal chain more sustainable, such as
production forests as well as efficient stoves. However, this report will concentrate on
decreasing the consumption of charcoal by switching to alternative fuels.
1.3 Literature Review
Using biomass as a cooking fuel is not unique to Tanzania, nor are the damaging effects
of this practice. Poor developing countries across the world use fuel wood ( charcoal
and firewood) as their predominant cooking fuel source which has led to environmental
degradation around the world and brought the issue to the policy agenda’s of many
countries and the attention of many NGOs. Many options for minimizing the impact of
fuel wood consumption and production have been put forth and considered in different
countries. In this section different studies and findings will be examined regarding one
of those options, fuel substitution.
There have been many studies focusing on the energy sources used by people around the
world and the theory of the “energy ladder” has been put forth. People work their way
up the “energy ladder” from traditional fuels such as firewood to charcoal and from
charcoal to more modern fuels such as liquid petroleum gas (LPG) and electricity. This
move up the ladder is linked to rises in income (Arnold et al 2005). A study in
Bangalore, India tried to determine if the steps of the “energy ladder” can be altered or
influenced by outside actors (Reddy 1994). The conclusion to the analysis was that it is
possible through policy intervention to aid the move from one fuel to the next. The
study also noted that the transition from firewood to charcoal is a bit faster and easier
than the move from charcoal to more modern fuels. Because of these issues the authors
advocate subsidies, taxes and financing.
Another study, focusing on East Africa, presents and argument that is not against
subsidies, but does demonstrate reasons to be wary of too much government
involvement. This study, by Bhagavan, focuses on how government management of the
power sector in east African countries has led to an overly bureaucratic regime that can
Institute for Environmental Studies 6
not make a quick decision (2003). Tanzania’s government run system is used as an
example of a country that should commercialize its power sector. The confusion that
Bahgavan portrays as inherent in any power sector run by the government does not
inspire confidence in its ability to replace charcoal as the cooking fuel for the majority of
citizens in Dar es Salaam. Though commercialization and a free market may be the
solution for the power sector, it is possible that to control the consumption of charcoal it
may be beneficial to have aid from the government to ensure that increases in income are
followed by a move up the energy ladder.
Whether or not the move along the fuel ladder is done through the free market or has
help from the outside, the impetus that propels people from one fuel to another is not
entirely based on rises income. Other factors that play a large part are availability, the
importation structure of the substitute fuel, and the perception people have of the fuel’s
safety, cleanliness, and ease of use (Dang 1993). In an article focusing on Sub-Saharan
Africa, Himraj Dang writes that the idea of fuel substitution is noble but if the
infrastructure for that fuel is not present, its use will not be taken up widely by the
population. Cooking is a necessary, daily activity and fuel must be available at all times
in order for people to feel comfortable using it. The UN Millennium Project has
highlighted the availability problem as a focus of any energy strategies in developing
countries (UNDP and GTZ 2005).
While the Millenium Development Goals (MDGs) do not specifically address energy, it is understood that addressing the dependence on fuel wood is necessary for alleviation of poverty. “The goals are quantified targets for addressing extreme poverty in its many dimensions while promoting gender equality, education, health, and environmental sustainability. Although the provision of adequate, affordable and reliable energy services is not one of the goals, it is a prerequisite if the MDGs are to be achieved” (UNDP and GTZ 2005). The fuel wood issue disproportionately affects women because they are responsible for gathering the fuel, food preparation and cooking (UNDP and GTZ 2005). Though in urban areas women do not spend time gathering the fuel as they do in rural areas, cooking with charcoal requires much more time and effort than cooking with modern fuels. In this way women must focus much of their day on food preparation and can not spend it doing more lucrative activities such as harvesting plants to sell, making crafts, or even learning to read (Stockholm Environment Institute, 1999). Fuel substitution by more modern fuels has been the focus of studies in Ghana where a
large promotional campaign resulted in doubling the number of LPG users (UNDP
2004), in Ethiopia where deforestation has become a focus of the government and the
production of electricity is being promoted (Schramm 1987), in India where LPG is
being promoted while dealing with problems of accessibility and affordability (D’Sa and
Murthy 2004) and in many more developing countries. Each country has a story and a
few of the issues highlighted in those stories have been described here. At this point
there is no sure way to solve the fuel wood problem, but it is clear that improvements
can be made. This is the first study to focus on the demand side of charcoal
consumption in Dar es Salaam, targeting the largest consumers, households. By learning
from the successes and failures of fuel substitution around the world, Tanzania can save
its diminishing forests and improve the lives of its citizens.
Greening the Charcoal Chain
7
1.4 Structure of Report
In this report the problem has already been stated (1.1), the purpose of the study (1.2)has
been laid out, and the literature used to form the basis for this study had been discussed
(1.3). In Chapter 2 the research methods used will be elaborated upon. The purpose,
design, and implementation of the survey that has formed the bulk of our research will
be described along with the process used to perform the household and social planner
CBAs. Then, in Chapter 3 the positions of the different stakeholders will be laid out and
analyzed. In Chapter 4 the results of the survey are presented beginning with the profiles
of different fuel users, their preferences and what they think about the health, safety, and
environmental risks of cooking with those fuels. Then, reasons people have for
switching or not switching to the modern fuels, LPG and electricity, are presented. Next,
in Chapter 5 the results of the survey are used along with other numbers to create two
cost-benefit analyses. These numbers used are described in detail as are the results.
Finally, in Chapter 6 conclusions are made and recommendations are given.
Institute for Environmental Studies 8
2. Research Methods
To prepare this report a literature review was undertaken, stakeholder interviews were
performed and most importantly a household survey of different fuel users was designed
and carried out. The literature review and stakeholder interviews are discussed in detail
in Chapter 1 and Chapter 3, respectively. This chapter will detail the purpose, design and
implementation of the survey as well as the methods used in the cost-benefit analysis.
2.1 Purpose of the Survey
The previously described literature review was the foundation for the formation of the
survey. The stakeholder interviews further influenced the survey with the informal
interviews conducted with different fuel customers being the most informative. The
information gathered in this way was used to form a survey that would measure what
type of fuel citizens use, how much they spend per month on this fuel, how much time
they spend cooking with it, how much time it takes to buy it, where they buy it, as well
as why they use it and would they ever consider switching to another fuel. The survey
then aim’s to discover what perceptions people have of LPG and electricity, whether or
not they would switch to either fuel, if they think that the alternatives are too expensive
and if the initial investment cost prevents him/her from switching would he/she take a
loan.
The results of the questions about cost and time were then used in a cost-benefit analysis.
Much confusion exists about whether or not charcoal is truly the least expensive fuel
(apart from firewood). Many people also confuse the energy per kilojoules compared to
cost of each fuel with the amount and cost of the fuel that is actually required. It is
possible that for each kilo joule of charcoal burned another fuel could burn the same
amount at a lower cost but if this is not transferred to the consumer then this type of
measurement is useless. What matters is that a person can spend a certain amount of
money and cook a certain amount of food for a certain price. If one fuel has higher heat
and gives off more energy but a person has to cook on it for hours it could end up being
far more expensive than charcoal which has a lower energy content. Therefore, the aim
of the survey was to find the true cost to the consumer of each fuel.
Secondly, the survey had the purpose of determining the reasons for the use of certain
types of fuel. Research showed that two significant alternatives exist in Dar es Salaam
for charcoal. Not many people use these fuels and the assumption has been that the
reason for the lack of use is cost. Some believe that it is the cost of continued use of the
fuel (Sumbi 2007) while others believe that it is the initial investment cost (Hoogeveen
2007) of the fuel that is a deterrent. The survey tried to determine what overall
perceptions people have of these two fuel sources, LPG and electricity. It surveyed their
thoughts and knowledge of costs, but also their perceptions on general use such as
safety, cleanliness, availability, and timeliness.
Greening the Charcoal Chain
9
2.2 Survey Design and Implementation
The targets of the survey were charcoal, firewood, kerosene, LPG, and electricity users.
These cooking fuel sources are the most common fuels in the city, though LPG does not
have a wide customer base yet, its usage rate has remained constant for the past few
years and recent changes in government taxes are likely to help increase its market share
(Tanzania Association of Oil Marketing Companies 2001). Because certain fuel users
were being targeted the survey was broken up into fuel use sections, each section to be
answered by those who use the fuel. The survey was presented by enumerators in face-
to-face interviews to 235 respondents. Respondents could select two fuels and answer
the corresponding questions. The survey then directed them to skip the questions for
other fuels and continue on to the “switching section”. This section was aimed at
discovering how many people have switched from one fuel to another in the past five
years and why. Finally, the last section of the survey targeted those respondents that do
not use LPG and or electricity.
Questions were formed with the goal of finding out what people thought of both fuels
and whether or not they found the initial investment cost for each too expensive. The
survey was 15 pages long (including a section asking personal details) but only took
approximately 20 minutes to answer, as much of the survey could be skipped by each
respondent.
Questions were written in a closed format for easier coding if all possible responses
could be identified. Other questions were left open-ended when the response could be
unpredictable. It turns out that the open ended questions were quite easy to code as most
respondents had similar ideas; however, it was difficult to know what these answers
would be before the survey.
The survey was written in English and translated into Swahili by the enumerator, then
the respondents answers were translated back into English to be written down. The
enumerators were 5 students from the University of Dar es Salaam. Pre-testing was done
for one day. Changes were made, and then the survey took 5 additional days to
administer. The enumerators were asked to spread out evenly across the city to get a
diverse group of respondents. We got a higher number of respondents from Kinondoni,
the most populated municipality. The surveying went well even though torrential rains
slowed down the enumerators during the first two days.
2.3 Cost-Benefit Analysis
To find out, which cooking fuel is the most cost-efficient alternative to charcoal, a cost-
benefit analysis (CBA) was conducted. The analysis approaches the problem from two
levels: the household level and the social planner level.
The aim of the household CBA is to find out which of the five commonly used cooking
fuels in Dar es Salaam is the best energy source for a household when it takes into
account the initial investment cost, the daily cost of cooking, the benefits of time saved
and human health risk avoided. The goal of the household CBA is to find the most cost-
efficient cooking fuel to use.
Institute for Environmental Studies 10
The outcome of the household CBA is then used in the social planner CBA. In this
analysis the aim is to find out whether it would be beneficial for the society as a whole to
make households switch from charcoal to the best alternative. The social planner CBA
includes the same cost and benefit elements as the household CBA. In addition, it also
includes the cost of an awareness raising campaign and environmental benefits from
avoided deforestation and greenhouse gas emissions. The goal of the social planner
CBA is to maximize social welfare.
The numbers for the initial investment cost and daily cost, as well as the time spent
cooking with each fuel are derived from the results of our survey. A literature review
was conducted to find out the value for time saved, health benefits and environmental
benefits. In most cases, it was not possible to find value information derived directly
from Tanzania. To value these benefits we have used benefit transfer from valuation
studies conducted in other developing countries and in developed countries. The values
were converted to Tanzania by using the differences in per capita GDP.
The discount rate used in the analysis is 3%, which is in the range of commonly used
values for social discount rates based on social time preference. Sensitivity analysis is
conducted by altering the discount rate from 3% to 0% and 10% to find out if the
discount rate has an effect on the outcome of the CBA. The time period used in both the
household CBA and social planner CBA is 10 years. In addition, the analysis is done for
a time period of 25 years to see if this changes the outcome.
Greening the Charcoal Chain
11
3. Stakeholder Views on Charcoal in Dar es Salaam
It is important to understand where the stakeholders of charcoal use and production stand
in Dar es Salaam. These stakeholders include different NGOs that are working to solve
the problem of deforestation, the government, the charcoal producers, the end users, as
well as producers of alternative fuels. In this chapter each view will be examined and
discussed. As the NGOs have written the most about the subject their views will be
explored in greater detail. The views of other stakeholders have been gathered from
different sources including personal interviews, business reports, and reports produced
by NGOs.
3.1 NGOs (TaTEDO, WWF, PREM, World Bank)
These four NGOs have varying views about the charcoal industry and what must be done
to solve the problem of deforestation. TaTEDO, Tanzania Traditional Energy and
Environment Organization is a local NGO based in Dar es Salaam. It has been dealing
with the issue of charcoal for many years and has produced many studies regarding its
use and production. The main focus of TaTEDO has been the inefficiency of charcoal
production and consumption. They have studied the charcoal kilns as well as the stoves
used by citizens to cook with charcoal and have been looking for ways to make both
more efficient (TaTEDO 2004). Though they recognize fuel substitution as an option
they are not optimistic that it is possible (Sanga 2005).
WWF believes that not enough work has been done on the charcoal chain itself. They
feel that they are lacking certain important information that prohibits them from acting
now (Sumbi 2007). This seems to be an oversight on their part as there have been many
studies about the charcoal chain from production to consumption. In fact, an extensive
report exists on the subject, titled, Charcoal Potential in Southern Africa: Final Report
for Tanzania (Malimbwi 2001). In an interview, the Forest Program Officer, Peter
Sumbi, mentioned almost every possible solution for the deforestation problem but also
stated that it was too early to do anything about the issue. Though he offered many
innovative solutions to the problem, he stated that he felt that electricity and LPG are too
expensive to be viable alternatives for charcoal. However, he offered no numbers to
substantiate this view (Sumbi 2007).
WWF is lagging behind TaTEDO and the other organizations, only having just formed a
study group to do a literature review of the charcoal chain. Other than having produced
a few educational booklets regarding the subject they have not been instrumental in
finding a solution to the charcoal problem. Their sudden interest in the subject may be
fruitful. A workshop is planned for July 2007, where interested parties will share their
findings, and a National Framework will be the goal. At this point WWF is considering
all options and has a lack of priorities.
PREM has completed several studies regarding the charcoal chain, however, gaps remain
(PREM 2007a). Many options are being examined by PREM, such as promotion of
production forests, promotion of efficient stoves, payments for environmental services
Institute for Environmental Studies 12
(PES)1, as well as formalization of the charcoal market (PREM 2007). However, further
research is needed on many of these options before being put into practice. This study
will focus on the minimization of the consumption of charcoal in the city, rather than on
sustaining its production.
The World Bank is also interested in this subject. They understand the large part the
charcoal industry plays in the economy as well as in the daily lives of citizens. They are
considering production forests on the supply side as well as options to minimize the use
of charcoal on the demand side. At this point they are looking into what is the best
alternative for charcoal, as well as the best way to introduce this alternative. A
representative of the World Bank cited a recent success South Africa has had with
electricity as an alternative to biomass fuels. The South African power companies have
lowered their standards, which brings down the cost of electricity and allows customers
to have just enough power for a few appliances (Hoogeveen 2007). Hans Hoogeveen of
the World Bank feels that largest hurdle to Tanzanians switching to another fuel, such as
LPG or electricity, is the high initial investment cost. Hoogeveen also stated that the
World Bank lacks a cohesive view on the charcoal problem depending on which
department is dealing with the issue.
3.2 The Government
The government recognizes that the high rate of deforestation due to charcoal production
is something that needs to be addressed but it has had difficulty finding the right
solutions. In 2006, the government banned the production of charcoal which only
caused the price to rise, in the end hurting the poor consumers. Pressured by many
different stakeholders they have made a few rash decisions. Recently the LPG company
Oryx was successful in getting the import duty on LPG as well as the VAT abolished. In
a speech to the National Assembly the Minister of Finance2 said, “The amendments
made include, exemption of VAT on Liquefied Petroleum Gas (LPG) and its cylinders
with the aim of encouraging people to use gas instead of charcoal and firewood so as to
protect the environment. The impact of this measure is expected to be noticed in the
medium to long term time frame” (Meghji 2007). This is an interesting development and
a positive development in the promotion of alternative fuels.
3.3 Charcoal Producers and Consumers
Producing charcoal has a low over-head cost, in fact it could be considered zero-cost.
Most producers gather the wood free of charge, use their own labour, and use minimal
tools for the harvest. Because there are so few costs to the production of charcoal and
there is a large population willing to buy the product, this line of work is very popular.
1“The critical foundation of the PES is on compensating resource owners such as landowners for
the environmental services their land generates” (PREM 2006). This would theoretically
keep them from degrading the land with unsustainable practices. 2 This speech was given on 14 June 2007, after the data for this study had been gathered.
Because the data was gathered before the taxes were abolished the price for LPG is currently
less than what we have reported here.
Greening the Charcoal Chain
13
Also the lack of alternative jobs keeps people producing charcoal even when they
recognize the lack of sustainability in the process (PREM 2007a).
Charcoal is consumed by households and commercial enterprises almost exclusively in
urban and peri-urban areas. Dar es Salaam consumes half of all charcoal produced in the
country and the number of consumers there is growing. There is a belief that
improvement of economic circumstances will lead people up the fuel ladder to fossil
fuels or electricity, however, there is no evidence that consumption is slowing down in
Dar es Salaam (PREM 2007a). This study aims to find out why people are not moving
to other fuels. Many studies claim that the reason for not moving “up the ladder” is
solely income driven (Arnold 2006, Dang 1993, D’Sa and Murthy 2004, Hosier 1993,
Reddy 1993). This study aims check the validity of that belief.
3.4 Producers of Alternative Fuels (Oryx, TANESCO)
The leading producer and distributor of LPG in Tanzania is Oryx, a company based on
the continent of Africa. They have been trying to promote their product as a substitute
for fuel wood across the continent. Wema Muhama, a representative of Oryx feels that
even if citizens of Dar es Salaam can afford LPG they do not know enough about it to
invest in it. Many are scared of using LPG due to its history of explosion, not realizing
that the containers and form of the product have become much safer, and no longer carry
a serious risk. One suggestion has been for the government to begin regulating the
safety of LPG canisters, in this way Oryx could market these safety regulations to the
public, citing the government as a watchdog. Mr. Muhama stated that the company
believes that the market will grow but he does not have faith in the ability of LPG to
replace charcoal (Muhama 2007).
TANESCO, Tanzania Electric Supply Company Limited, is owned by the United Republic
of Tanzania. It produces electricity though hydropower as well as diesel power stations, for
11 percent of the country. The rest of the countries 34 million citizens are left without power
(TANESCO 2007). The company has the highest tariffs in East Africa (Malimbwi 2001, 57)
which makes electricity unattainable for the majority of citizens. Rather than prices going
down they have been rising and many citizens have switched from cooking with electricity
to charcoal.
Institute for Environmental Studies 14
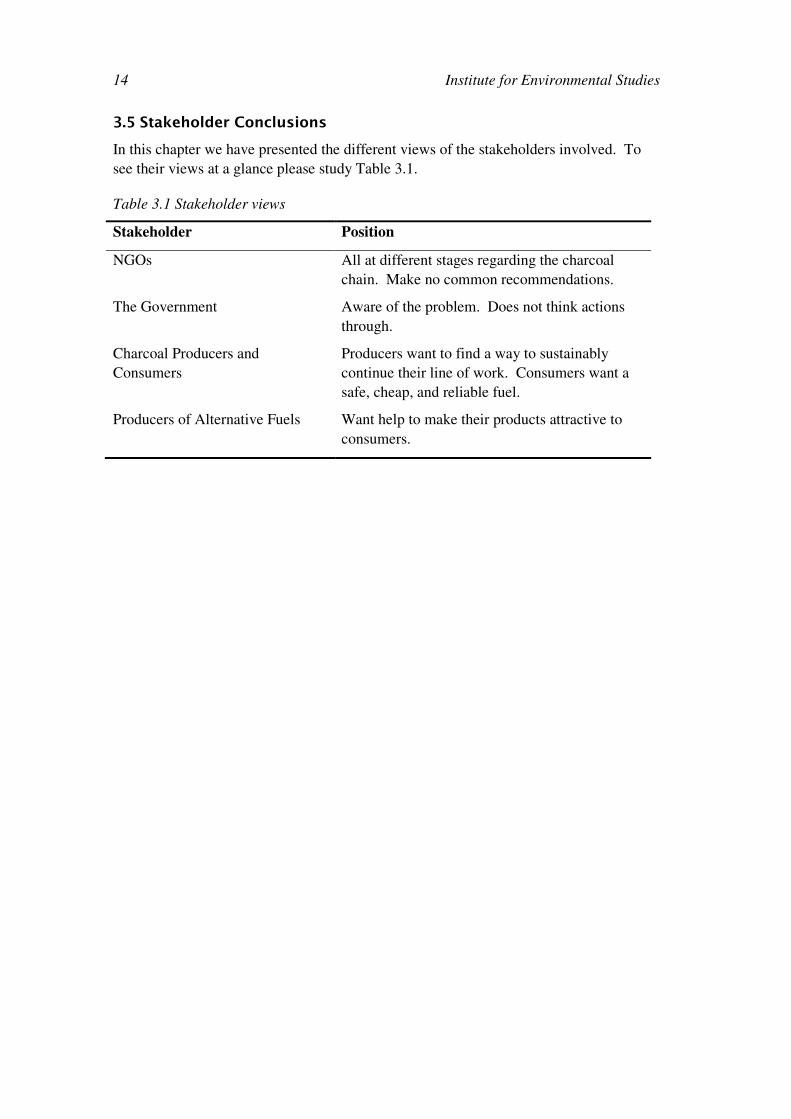
3.5 Stakeholder Conclusions
In this chapter we have presented the different views of the stakeholders involved. To
see their views at a glance please study Table 3.1.
Table 3.1 Stakeholder views
Stakeholder Position
NGOs All at different stages regarding the charcoal
chain. Make no common recommendations.
The Government Aware of the problem. Does not think actions
through.
Charcoal Producers and
Consumers
Producers want to find a way to sustainably
continue their line of work. Consumers want a
safe, cheap, and reliable fuel.
Producers of Alternative Fuels Want help to make their products attractive to
consumers.
Greening the Charcoal Chain
15
4. Survey results
With a survey that was 15 pages in length, the data collected is quite extensive. In
designing the survey we tried to ask all of the questions that might be relevant to our
research questions: is it possible for people to stop using charcoal? If so, what should
they switch to? Do the benefits to society and the environment, of people switching away
from charcoal outweigh the costs? In this section we have compiled and analysed the
results of the questionnaire using SPSS. Some of the questions asked did not reveal any
interesting findings while others did. Here we have included the results that say
something about the cooking habits the people of Dar es Salaam, the fuels they use, why
they use them, and what makes them switch from one fuel to another.
In this chapter we will illustrate the profiles of the different households using each fuel,
the willingness of charcoal users to switch fuels, the ideas that people have about LPG
and electricity, and the willingness of people to take aid the switch from charcoal to LPG
or electricity.
4.1 Demographics of Different Fuel Users
In this section we will examine the demographics of our respondents including the fuels
they use, their family size, income, and education levels. We will look at how the
income and education levels of the different cooking fuel users differ from each other.
Regression analysis and crosstabulation were performed in SPSS to find out if the
income and education level have a significant effect on the fuel source used in the
household.
4.1.1 Fuel Source and Family Size
The survey had 235 respondents of targeted fuel users. The respondents were targeted to
be representative of Dar es Salaam as a whole. They were targeted based on three
criteria: fuel source, income and family size. Table 2.1 shows the percentage of users
from each fuel source we surveyed compared to the percentage of users in the city.
Table 4.1 Fuel source
Fuel Source Our Survey Dar es Salaam*
Charcoal
Kerosene
54%
11%
54%
26%
Firewood 7% 12%
Electricity 14% 5%
LPG 14% 1%
*Dar es Salaam percentages from 2002 Census
Institute for Environmental Studies 16
We sampled the same percentage of charcoal users as there are in the city. The survey
under sampled kerosene and firewood users and over sampled electricity and LPG users.
This was a conscious choice because a large enough sample for each fuel was needed in
order to draw any conclusions from the responses. Habits of users could not be
determined with a smaller numbers of respondents and because the habits of charcoal,
LPG, and electricity users would be most important to our conclusions we spent more
time gathering these responses.
Second to the fuel source we targeted different family sizes. Table 2.2 shows the
comparison of the percentages of different family sizes in the city to the percentages of
family sizes sampled in our survey. The survey under sampled the smallest and the
largest families and got an even sampling of the medium sized families. With the
average sized family in the city being around 4, our average family is close to the same
(Census 2002).
Table 4.2 Family size
Family Size Our Survey Dar es Salaam*
1-2 13% 24%
3-4 40% 30%
5-7 38% 33%
8+ 9% 13%
*Dar es Salaam percentages from 2002 Census
4.1.2 Income
In addition, to targeting different fuel users and family sizes we targeted households with
different incomes. Due to the over sampling of LPG and electricity users the higher
income households are over sampled, because those fuel users tend to have higher
incomes than the rest of the fuel users. There was an even sampling of medium income
households.
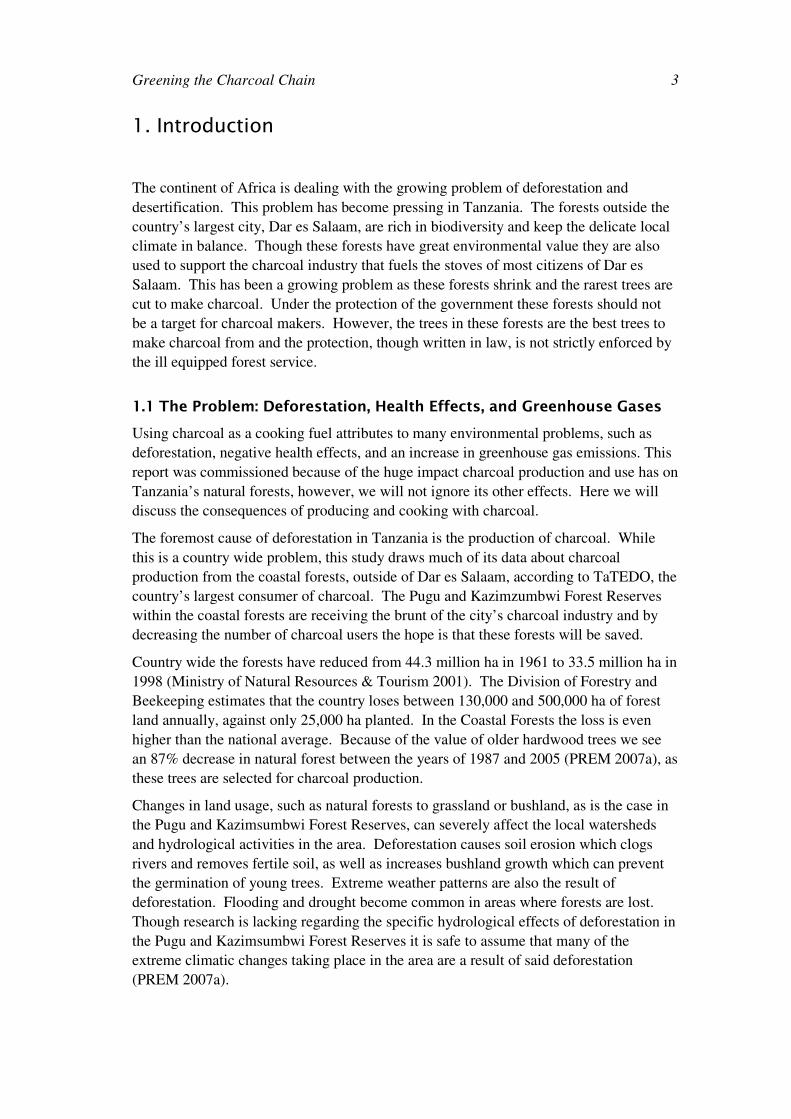
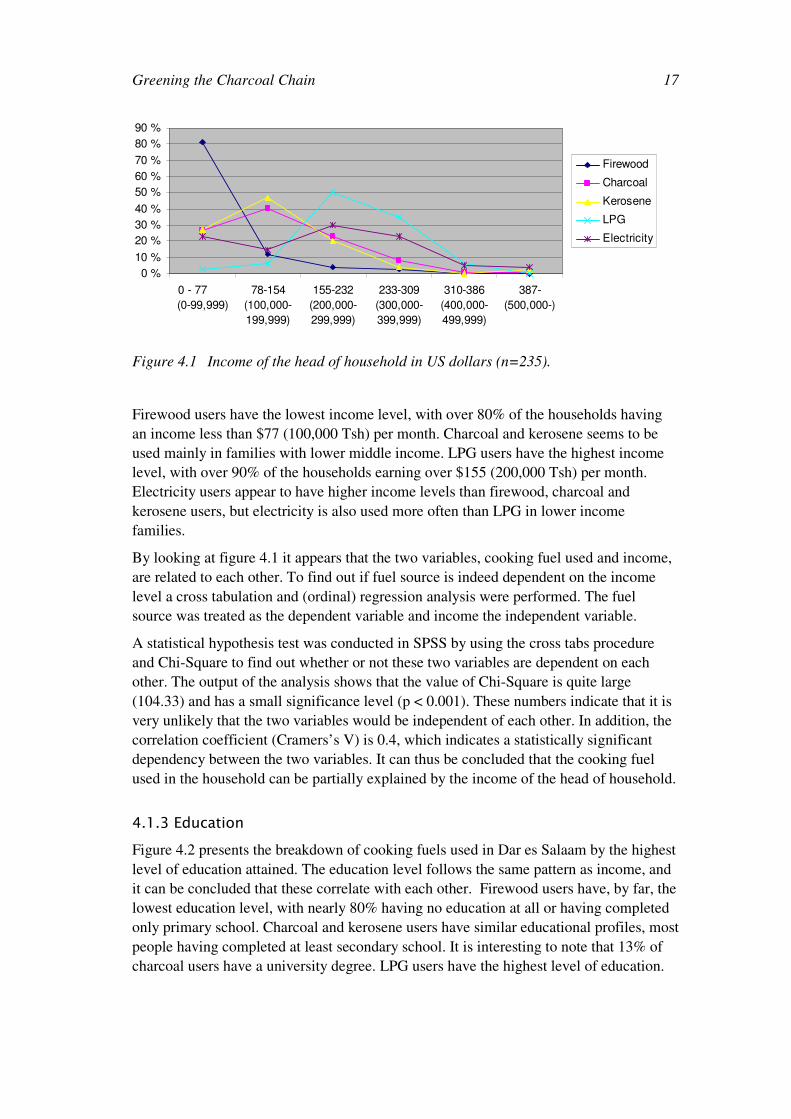
Figure 4.1 presents the monthly income of the head of household in US dollars for each
fuel source with the corresponding amount in Tanzanian shillings3 presented in brackets.
3 For this study we have used an exchange rate of 1,295 Tanzanian Shillings to 1 US dollar.
Greening the Charcoal Chain
17
0 %
10 %
20 %
30 %
40 %
50 %
60 %
70 %
80 %
90 %
0 - 77
(0-99,999)
78-154
(100,000-
199,999)
155-232
(200,000-
299,999)
233-309
(300,000-
399,999)
310-386
(400,000-
499,999)
387-
(500,000-)
Firewood
Charcoal
Kerosene
LPG
Electricity
Figure 4.1 Income of the head of household in US dollars (n=235).
Firewood users have the lowest income level, with over 80% of the households having
an income less than $77 (100,000 Tsh) per month. Charcoal and kerosene seems to be
used mainly in families with lower middle income. LPG users have the highest income
level, with over 90% of the households earning over $155 (200,000 Tsh) per month.
Electricity users appear to have higher income levels than firewood, charcoal and
kerosene users, but electricity is also used more often than LPG in lower income
families.
By looking at figure 4.1 it appears that the two variables, cooking fuel used and income,
are related to each other. To find out if fuel source is indeed dependent on the income
level a cross tabulation and (ordinal) regression analysis were performed. The fuel
source was treated as the dependent variable and income the independent variable.
A statistical hypothesis test was conducted in SPSS by using the cross tabs procedure
and Chi-Square to find out whether or not these two variables are dependent on each
other. The output of the analysis shows that the value of Chi-Square is quite large
(104.33) and has a small significance level (p < 0.001). These numbers indicate that it is
very unlikely that the two variables would be independent of each other. In addition, the
correlation coefficient (Cramers’s V) is 0.4, which indicates a statistically significant
dependency between the two variables. It can thus be concluded that the cooking fuel
used in the household can be partially explained by the income of the head of household.
4.1.3 Education
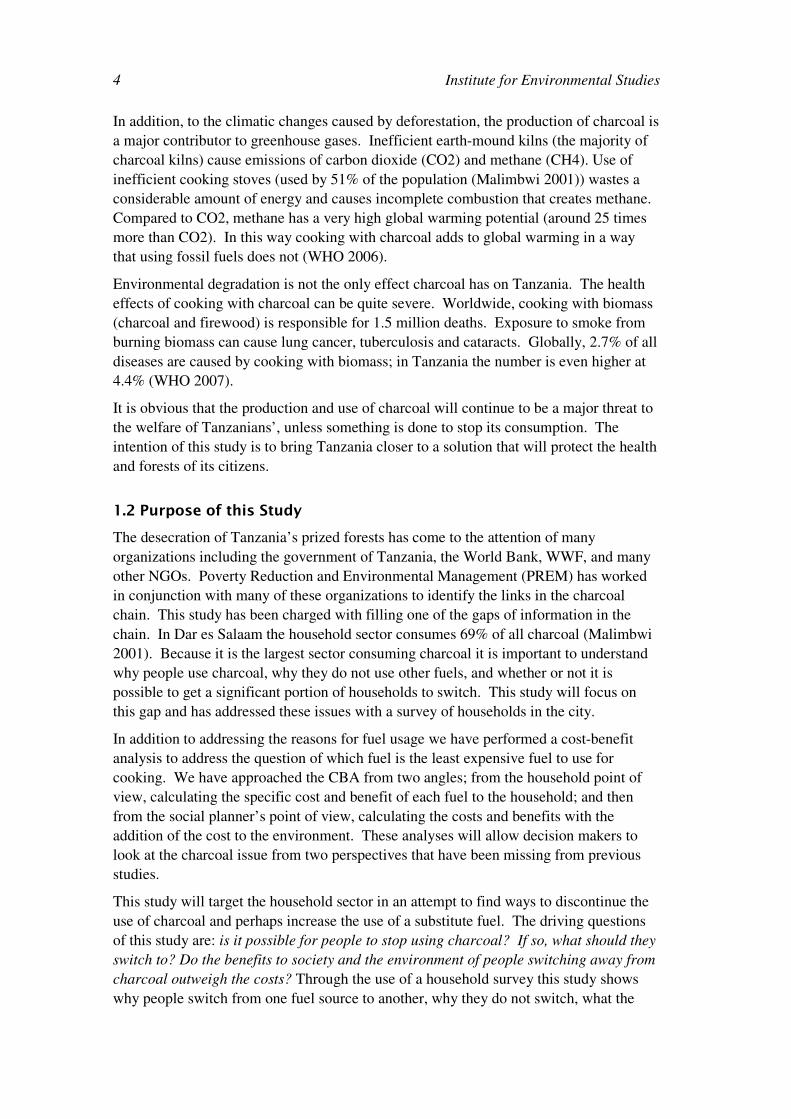
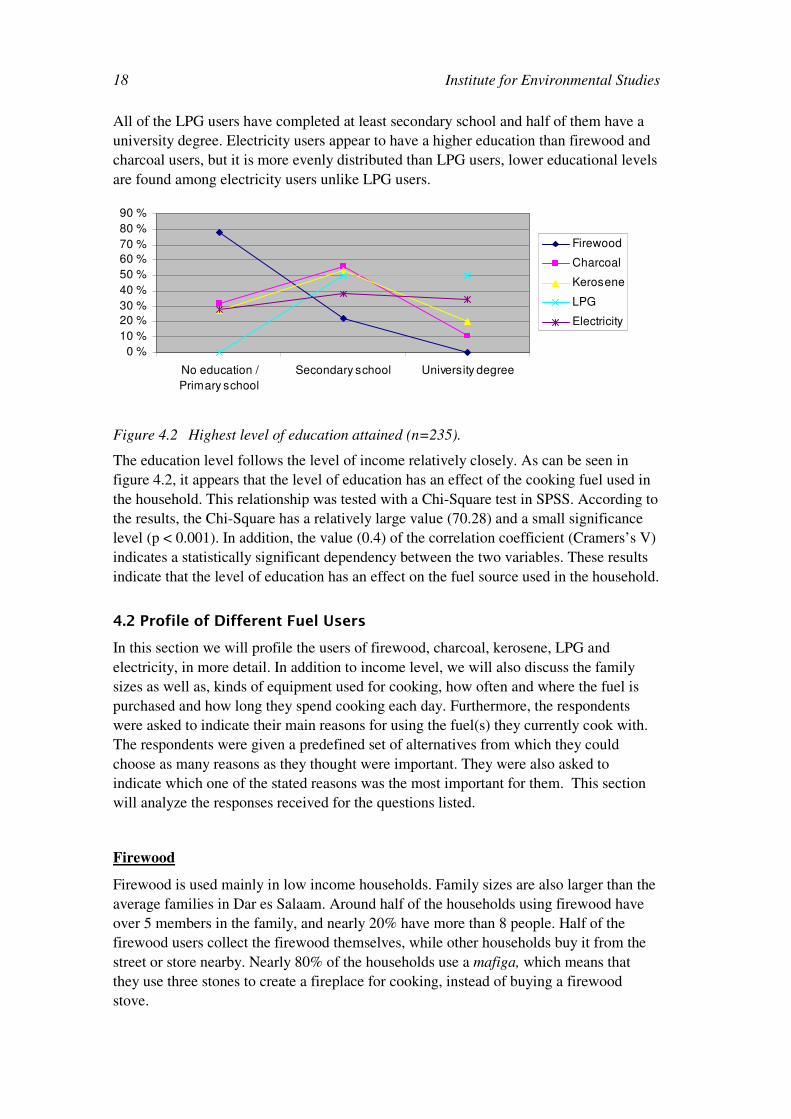
Figure 4.2 presents the breakdown of cooking fuels used in Dar es Salaam by the highest
level of education attained. The education level follows the same pattern as income, and
it can be concluded that these correlate with each other. Firewood users have, by far, the
lowest education level, with nearly 80% having no education at all or having completed
only primary school. Charcoal and kerosene users have similar educational profiles, most
people having completed at least secondary school. It is interesting to note that 13% of
charcoal users have a university degree. LPG users have the highest level of education.
Institute for Environmental Studies 18
All of the LPG users have completed at least secondary school and half of them have a
university degree. Electricity users appear to have a higher education than firewood and
charcoal users, but it is more evenly distributed than LPG users, lower educational levels
are found among electricity users unlike LPG users.
0 %
10 %
20 %
30 %
40 %
50 %
60 %
70 %
80 %
90 %
No education /
Primary school
Secondary school University degree
Firewood
Charcoal
Kerosene
LPG
Electricity
Figure 4.2 Highest level of education attained (n=235).
The education level follows the level of income relatively closely. As can be seen in
figure 4.2, it appears that the level of education has an effect of the cooking fuel used in
the household. This relationship was tested with a Chi-Square test in SPSS. According to
the results, the Chi-Square has a relatively large value (70.28) and a small significance
level (p < 0.001). In addition, the value (0.4) of the correlation coefficient (Cramers’s V)
indicates a statistically significant dependency between the two variables. These results
indicate that the level of education has an effect on the fuel source used in the household.
4.2 Profile of Different Fuel Users
In this section we will profile the users of firewood, charcoal, kerosene, LPG and
electricity, in more detail. In addition to income level, we will also discuss the family
sizes as well as, kinds of equipment used for cooking, how often and where the fuel is
purchased and how long they spend cooking each day. Furthermore, the respondents
were asked to indicate their main reasons for using the fuel(s) they currently cook with.
The respondents were given a predefined set of alternatives from which they could
choose as many reasons as they thought were important. They were also asked to
indicate which one of the stated reasons was the most important for them. This section
will analyze the responses received for the questions listed.
Firewood
Firewood is used mainly in low income households. Family sizes are also larger than the
average families in Dar es Salaam. Around half of the households using firewood have
over 5 members in the family, and nearly 20% have more than 8 people. Half of the
firewood users collect the firewood themselves, while other households buy it from the
street or store nearby. Nearly 80% of the households use a mafiga, which means that
they use three stones to create a fireplace for cooking, instead of buying a firewood
stove.
Greening the Charcoal Chain
19
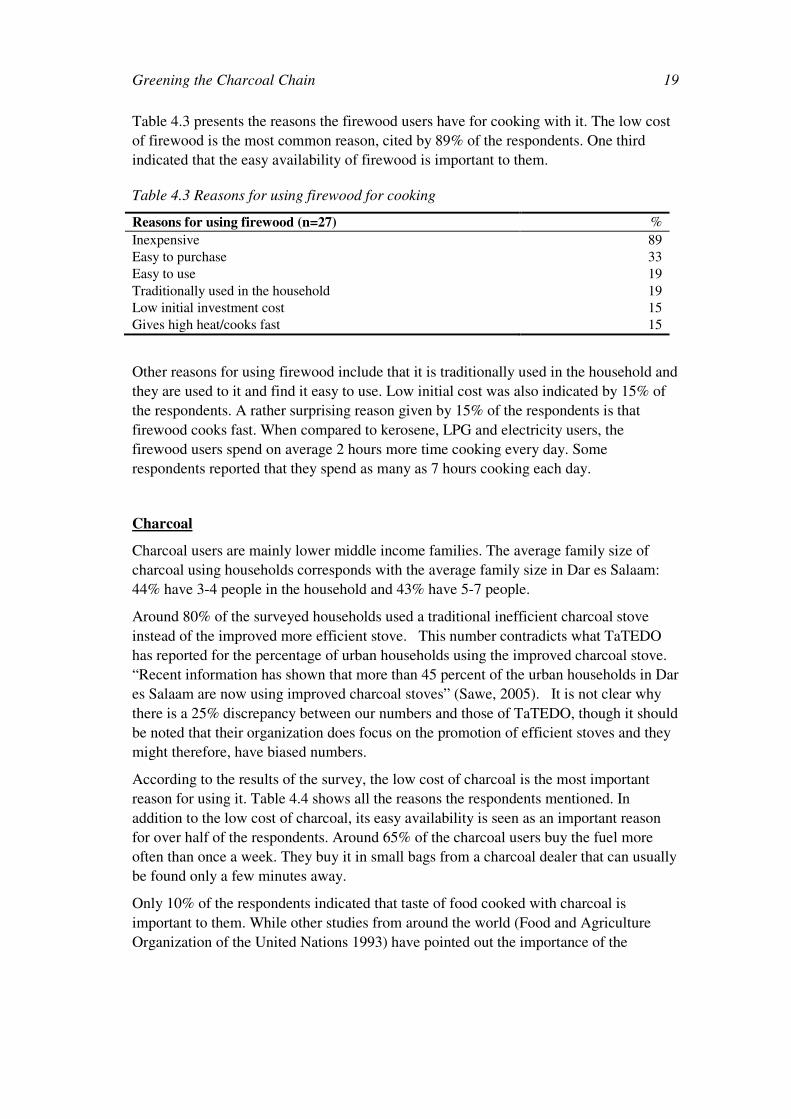
Table 4.3 presents the reasons the firewood users have for cooking with it. The low cost
of firewood is the most common reason, cited by 89% of the respondents. One third
indicated that the easy availability of firewood is important to them.
Table 4.3 Reasons for using firewood for cooking
Reasons for using firewood (n=27) %
Inexpensive 89
Easy to purchase 33
Easy to use 19
Traditionally used in the household 19
Low initial investment cost 15
Gives high heat/cooks fast 15
Other reasons for using firewood include that it is traditionally used in the household and
they are used to it and find it easy to use. Low initial cost was also indicated by 15% of
the respondents. A rather surprising reason given by 15% of the respondents is that
firewood cooks fast. When compared to kerosene, LPG and electricity users, the
firewood users spend on average 2 hours more time cooking every day. Some
respondents reported that they spend as many as 7 hours cooking each day.
Charcoal
Charcoal users are mainly lower middle income families. The average family size of
charcoal using households corresponds with the average family size in Dar es Salaam:
44% have 3-4 people in the household and 43% have 5-7 people.
Around 80% of the surveyed households used a traditional inefficient charcoal stove
instead of the improved more efficient stove. This number contradicts what TaTEDO
has reported for the percentage of urban households using the improved charcoal stove.
“Recent information has shown that more than 45 percent of the urban households in Dar
es Salaam are now using improved charcoal stoves” (Sawe, 2005). It is not clear why
there is a 25% discrepancy between our numbers and those of TaTEDO, though it should
be noted that their organization does focus on the promotion of efficient stoves and they
might therefore, have biased numbers.
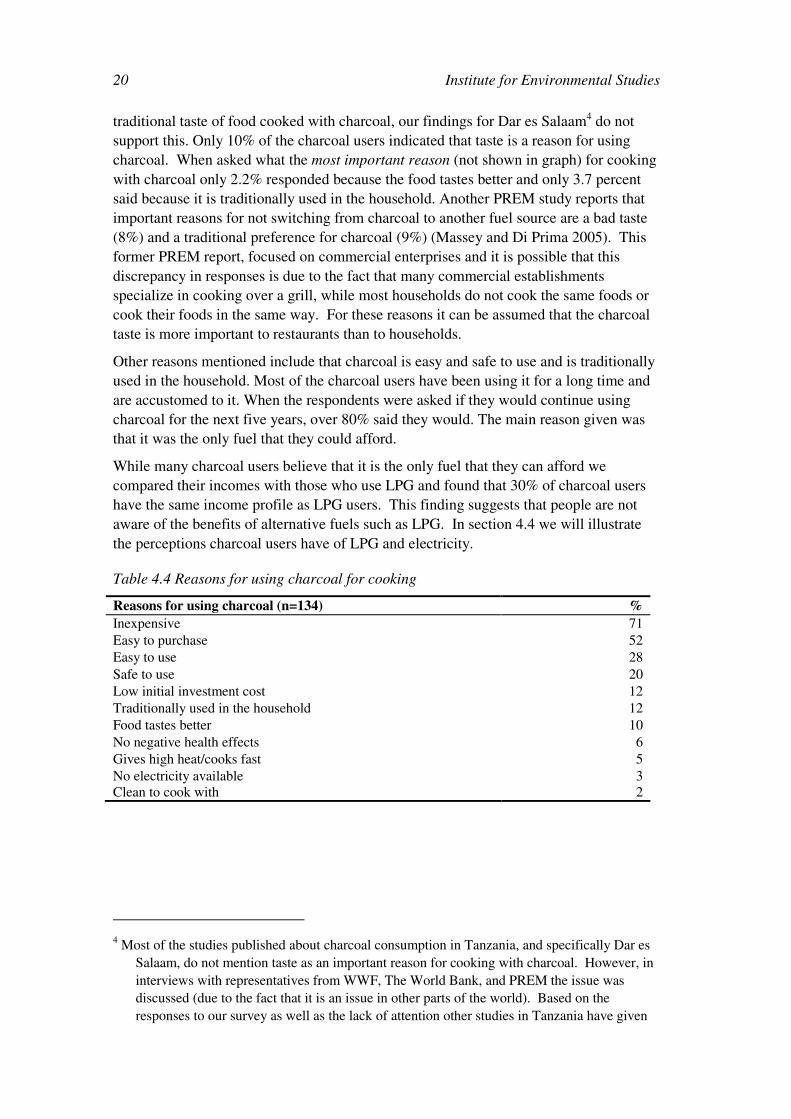
According to the results of the survey, the low cost of charcoal is the most important
reason for using it. Table 4.4 shows all the reasons the respondents mentioned. In
addition to the low cost of charcoal, its easy availability is seen as an important reason
for over half of the respondents. Around 65% of the charcoal users buy the fuel more
often than once a week. They buy it in small bags from a charcoal dealer that can usually
be found only a few minutes away.
Only 10% of the respondents indicated that taste of food cooked with charcoal is
important to them. While other studies from around the world (Food and Agriculture
Organization of the United Nations 1993) have pointed out the importance of the
Institute for Environmental Studies 20
traditional taste of food cooked with charcoal, our findings for Dar es Salaam4 do not
support this. Only 10% of the charcoal users indicated that taste is a reason for using
charcoal. When asked what the most important reason (not shown in graph) for cooking
with charcoal only 2.2% responded because the food tastes better and only 3.7 percent
said because it is traditionally used in the household. Another PREM study reports that
important reasons for not switching from charcoal to another fuel source are a bad taste
(8%) and a traditional preference for charcoal (9%) (Massey and Di Prima 2005). This
former PREM report, focused on commercial enterprises and it is possible that this
discrepancy in responses is due to the fact that many commercial establishments
specialize in cooking over a grill, while most households do not cook the same foods or
cook their foods in the same way. For these reasons it can be assumed that the charcoal
taste is more important to restaurants than to households.
Other reasons mentioned include that charcoal is easy and safe to use and is traditionally
used in the household. Most of the charcoal users have been using it for a long time and
are accustomed to it. When the respondents were asked if they would continue using
charcoal for the next five years, over 80% said they would. The main reason given was
that it was the only fuel that they could afford.
While many charcoal users believe that it is the only fuel that they can afford we
compared their incomes with those who use LPG and found that 30% of charcoal users
have the same income profile as LPG users. This finding suggests that people are not
aware of the benefits of alternative fuels such as LPG. In section 4.4 we will illustrate
the perceptions charcoal users have of LPG and electricity.
Table 4.4 Reasons for using charcoal for cooking
Reasons for using charcoal (n=134) %
Inexpensive 71
Easy to purchase 52
Easy to use 28
Safe to use 20
Low initial investment cost 12
Traditionally used in the household 12
Food tastes better 10
No negative health effects 6
Gives high heat/cooks fast 5
No electricity available 3 Clean to cook with 2
4 Most of the studies published about charcoal consumption in Tanzania, and specifically Dar es
Salaam, do not mention taste as an important reason for cooking with charcoal. However, in
interviews with representatives from WWF, The World Bank, and PREM the issue was
discussed (due to the fact that it is an issue in other parts of the world). Based on the
responses to our survey as well as the lack of attention other studies in Tanzania have given
Greening the Charcoal Chain
21
Kerosene
Kerosene is a fuel used mainly in small lower middle income families. Approximately
22% of the households have only 1-2 people and 50% have 3-4 people. In large families
(8+) kerosene is rarely used and it is not the main fuel source but rather a supplement to
charcoal or firewood. This could be due to the fact that kerosene stoves are generally
smaller in size.
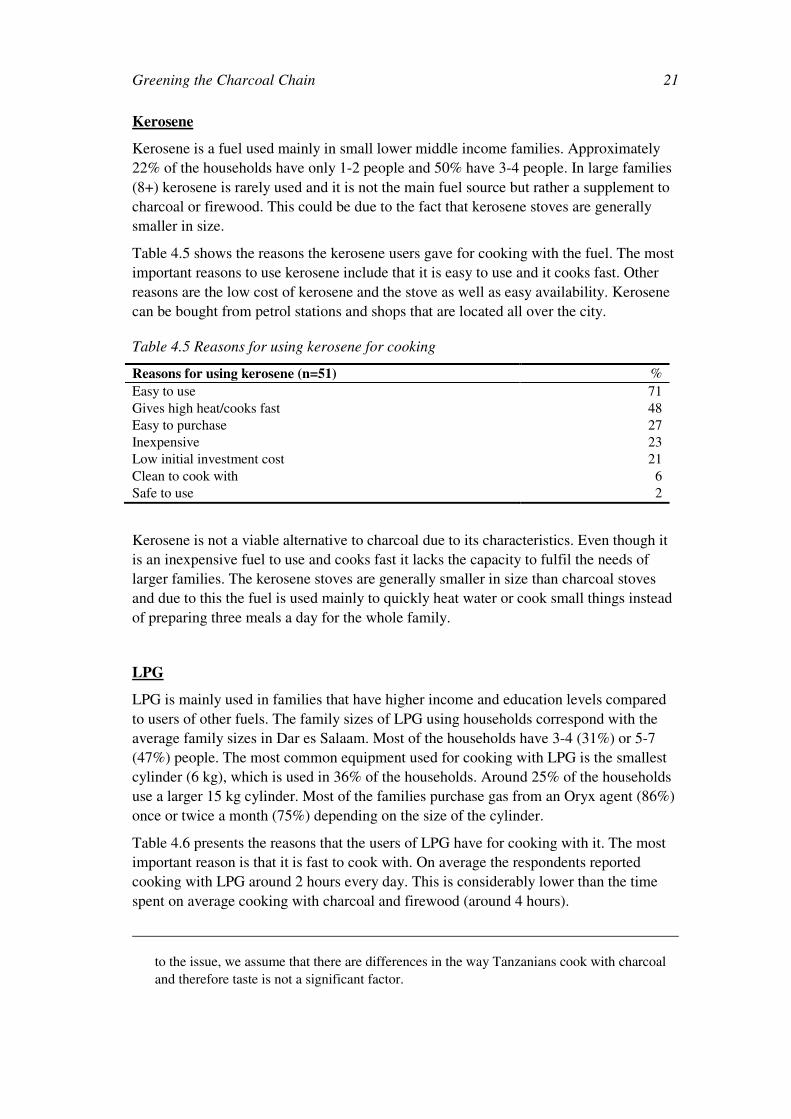
Table 4.5 shows the reasons the kerosene users gave for cooking with the fuel. The most
important reasons to use kerosene include that it is easy to use and it cooks fast. Other
reasons are the low cost of kerosene and the stove as well as easy availability. Kerosene
can be bought from petrol stations and shops that are located all over the city.
Table 4.5 Reasons for using kerosene for cooking
Reasons for using kerosene (n=51) %
Easy to use 71
Gives high heat/cooks fast 48
Easy to purchase 27
Inexpensive 23
Low initial investment cost 21
Clean to cook with 6
Safe to use 2
Kerosene is not a viable alternative to charcoal due to its characteristics. Even though it
is an inexpensive fuel to use and cooks fast it lacks the capacity to fulfil the needs of
larger families. The kerosene stoves are generally smaller in size than charcoal stoves
and due to this the fuel is used mainly to quickly heat water or cook small things instead
of preparing three meals a day for the whole family.
LPG
LPG is mainly used in families that have higher income and education levels compared
to users of other fuels. The family sizes of LPG using households correspond with the
average family sizes in Dar es Salaam. Most of the households have 3-4 (31%) or 5-7
(47%) people. The most common equipment used for cooking with LPG is the smallest
cylinder (6 kg), which is used in 36% of the households. Around 25% of the households
use a larger 15 kg cylinder. Most of the families purchase gas from an Oryx agent (86%)
once or twice a month (75%) depending on the size of the cylinder.
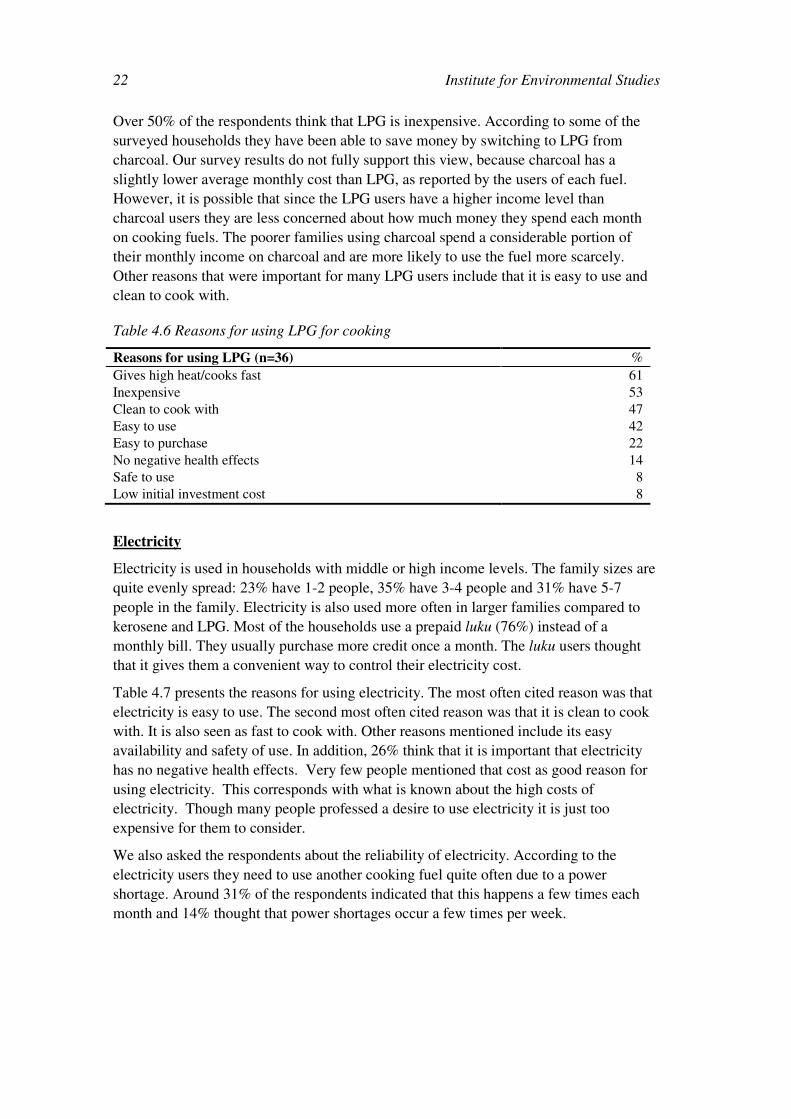
Table 4.6 presents the reasons that the users of LPG have for cooking with it. The most
important reason is that it is fast to cook with. On average the respondents reported
cooking with LPG around 2 hours every day. This is considerably lower than the time
spent on average cooking with charcoal and firewood (around 4 hours).
to the issue, we assume that there are differences in the way Tanzanians cook with charcoal
and therefore taste is not a significant factor.
Institute for Environmental Studies 22
Over 50% of the respondents think that LPG is inexpensive. According to some of the
surveyed households they have been able to save money by switching to LPG from
charcoal. Our survey results do not fully support this view, because charcoal has a
slightly lower average monthly cost than LPG, as reported by the users of each fuel.
However, it is possible that since the LPG users have a higher income level than
charcoal users they are less concerned about how much money they spend each month
on cooking fuels. The poorer families using charcoal spend a considerable portion of
their monthly income on charcoal and are more likely to use the fuel more scarcely.
Other reasons that were important for many LPG users include that it is easy to use and
clean to cook with.
Table 4.6 Reasons for using LPG for cooking
Reasons for using LPG (n=36) %
Gives high heat/cooks fast 61
Inexpensive 53
Clean to cook with 47
Easy to use 42
Easy to purchase 22
No negative health effects 14
Safe to use 8
Low initial investment cost 8
Electricity
Electricity is used in households with middle or high income levels. The family sizes are
quite evenly spread: 23% have 1-2 people, 35% have 3-4 people and 31% have 5-7
people in the family. Electricity is also used more often in larger families compared to
kerosene and LPG. Most of the households use a prepaid luku (76%) instead of a
monthly bill. They usually purchase more credit once a month. The luku users thought
that it gives them a convenient way to control their electricity cost.
Table 4.7 presents the reasons for using electricity. The most often cited reason was that
electricity is easy to use. The second most often cited reason was that it is clean to cook
with. It is also seen as fast to cook with. Other reasons mentioned include its easy
availability and safety of use. In addition, 26% think that it is important that electricity
has no negative health effects. Very few people mentioned that cost as good reason for
using electricity. This corresponds with what is known about the high costs of
electricity. Though many people professed a desire to use electricity it is just too
expensive for them to consider.
We also asked the respondents about the reliability of electricity. According to the
electricity users they need to use another cooking fuel quite often due to a power
shortage. Around 31% of the respondents indicated that this happens a few times each
month and 14% thought that power shortages occur a few times per week.
Greening the Charcoal Chain
23
Even though electricity is fast, clean and easy to cook with, its high cost5 makes it
unattainable for most of the people in Dar es Salaam. In addition, the electricity network
does not cover the whole city and the power supply is very unreliable.
Table 4.7 Reasons for using electricity for cooking
Reasons for using electricity (n=54) %
Easy to use 70
Clean to cook with 59
Gives high heat/cooks fast 48
Easy to purchase 28
Safe to use 26
No negative health effects 26
Traditionally used in the household 9
Food tastes better 4
Inexpensive 2
Low initial investment cost 2
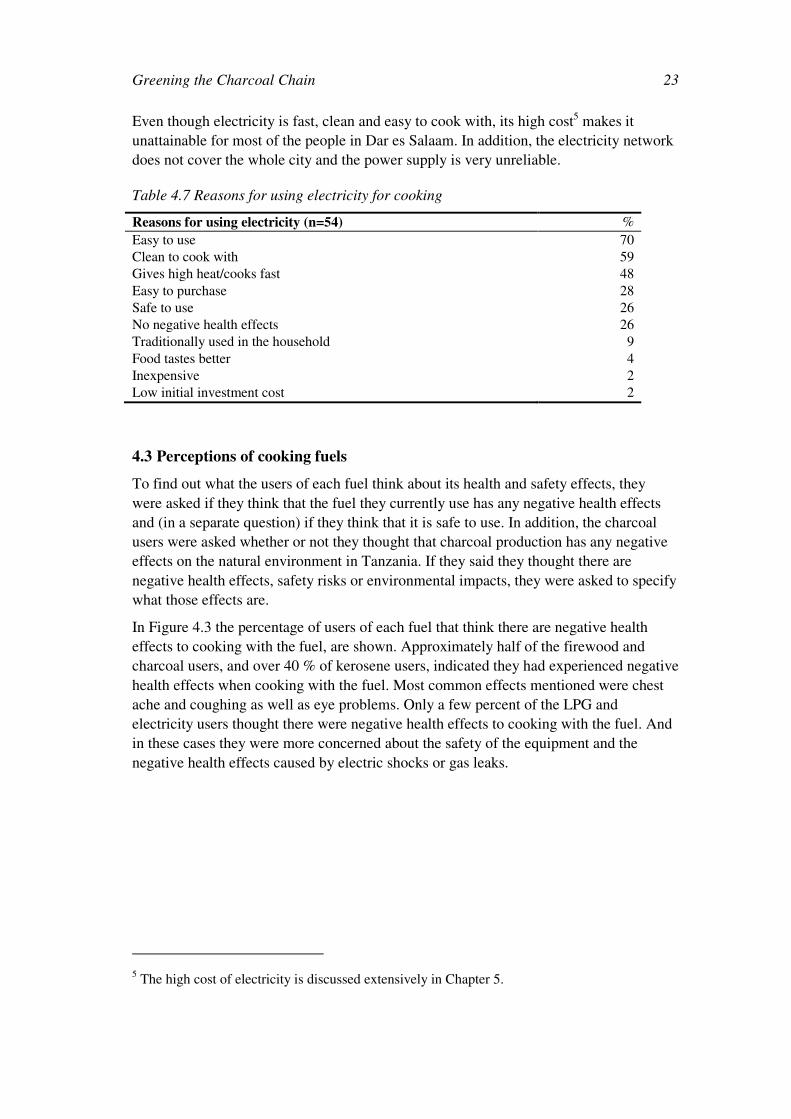
4.3 Perceptions of cooking fuels
To find out what the users of each fuel think about its health and safety effects, they
were asked if they think that the fuel they currently use has any negative health effects
and (in a separate question) if they think that it is safe to use. In addition, the charcoal
users were asked whether or not they thought that charcoal production has any negative
effects on the natural environment in Tanzania. If they said they thought there are
negative health effects, safety risks or environmental impacts, they were asked to specify
what those effects are.
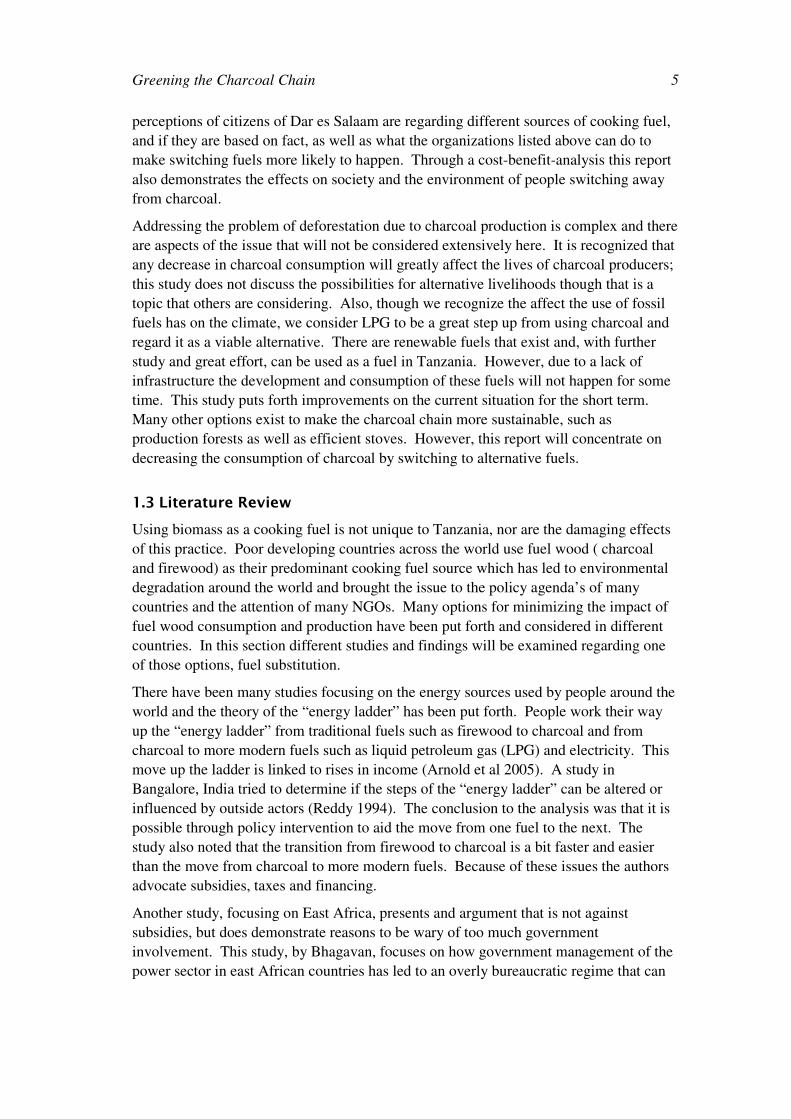
In Figure 4.3 the percentage of users of each fuel that think there are negative health
effects to cooking with the fuel, are shown. Approximately half of the firewood and
charcoal users, and over 40 % of kerosene users, indicated they had experienced negative
health effects when cooking with the fuel. Most common effects mentioned were chest
ache and coughing as well as eye problems. Only a few percent of the LPG and
electricity users thought there were negative health effects to cooking with the fuel. And
in these cases they were more concerned about the safety of the equipment and the
negative health effects caused by electric shocks or gas leaks.
5 The high cost of electricity is discussed extensively in Chapter 5.
Institute for Environmental Studies 24
52 %
48 %
42 %
6 % 6 %
0 %
10 %
20 %
30 %
40 %
50 %
60 %
Firew ood Charcoal Kerosene Electricity LPG
Figure 4.3 Percentage of users of each fuel that think there are negative health effects
to cooking with the fuel.(n=235).
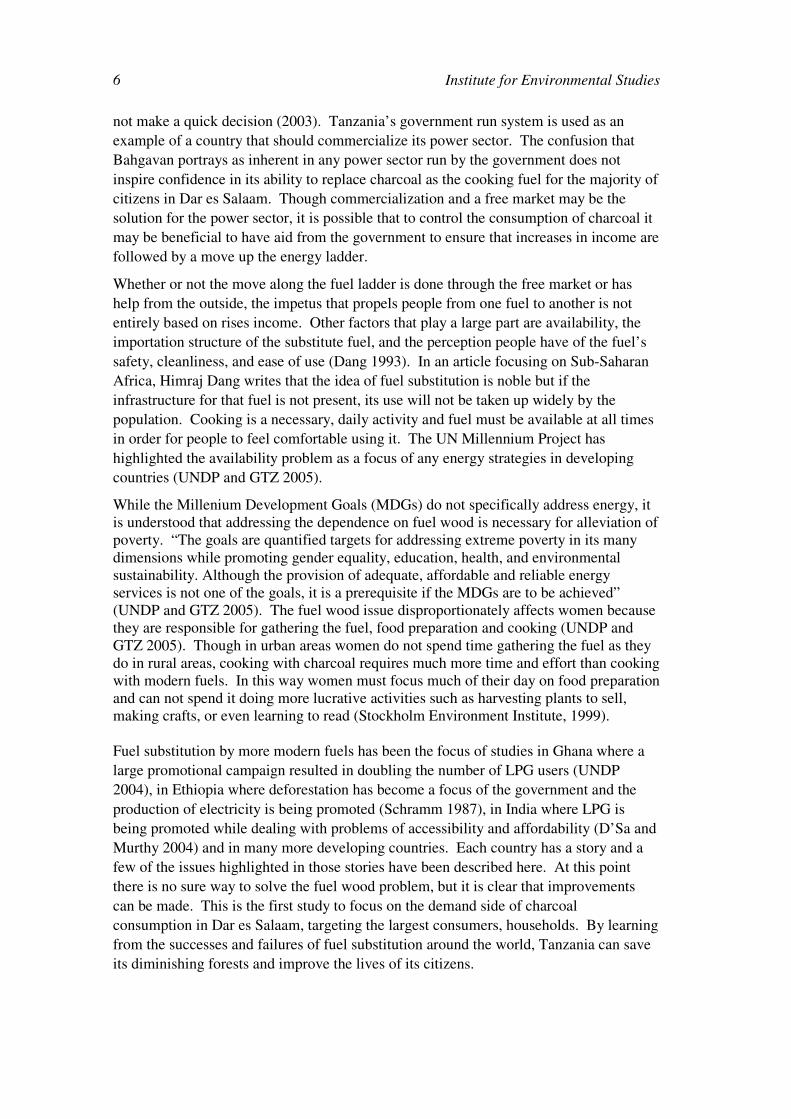
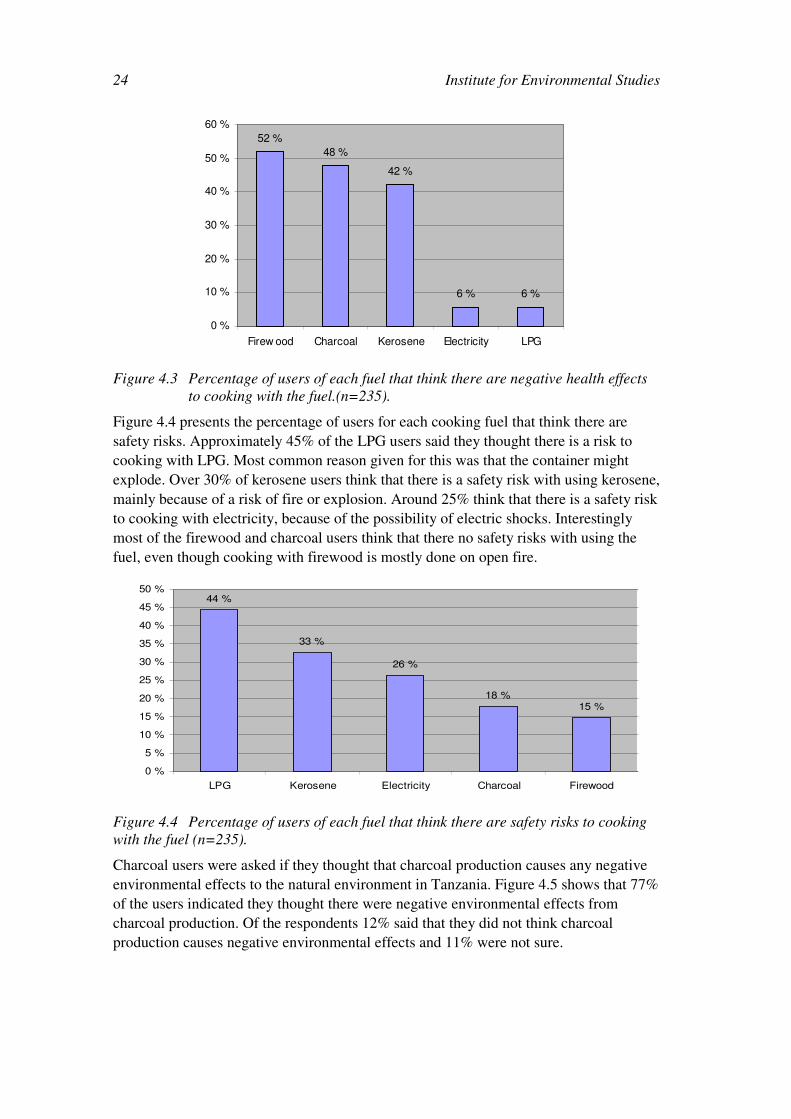
Figure 4.4 presents the percentage of users for each cooking fuel that think there are
safety risks. Approximately 45% of the LPG users said they thought there is a risk to
cooking with LPG. Most common reason given for this was that the container might
explode. Over 30% of kerosene users think that there is a safety risk with using kerosene,
mainly because of a risk of fire or explosion. Around 25% think that there is a safety risk
to cooking with electricity, because of the possibility of electric shocks. Interestingly
most of the firewood and charcoal users think that there no safety risks with using the
fuel, even though cooking with firewood is mostly done on open fire.
44 %
33 %
26 %
18 %15 %
0 %
5 %
10 %
15 %
20 %
25 %
30 %
35 %
40 %
45 %
50 %
LPG Kerosene Electricity Charcoal Firewood
Figure 4.4 Percentage of users of each fuel that think there are safety risks to cooking
with the fuel (n=235).
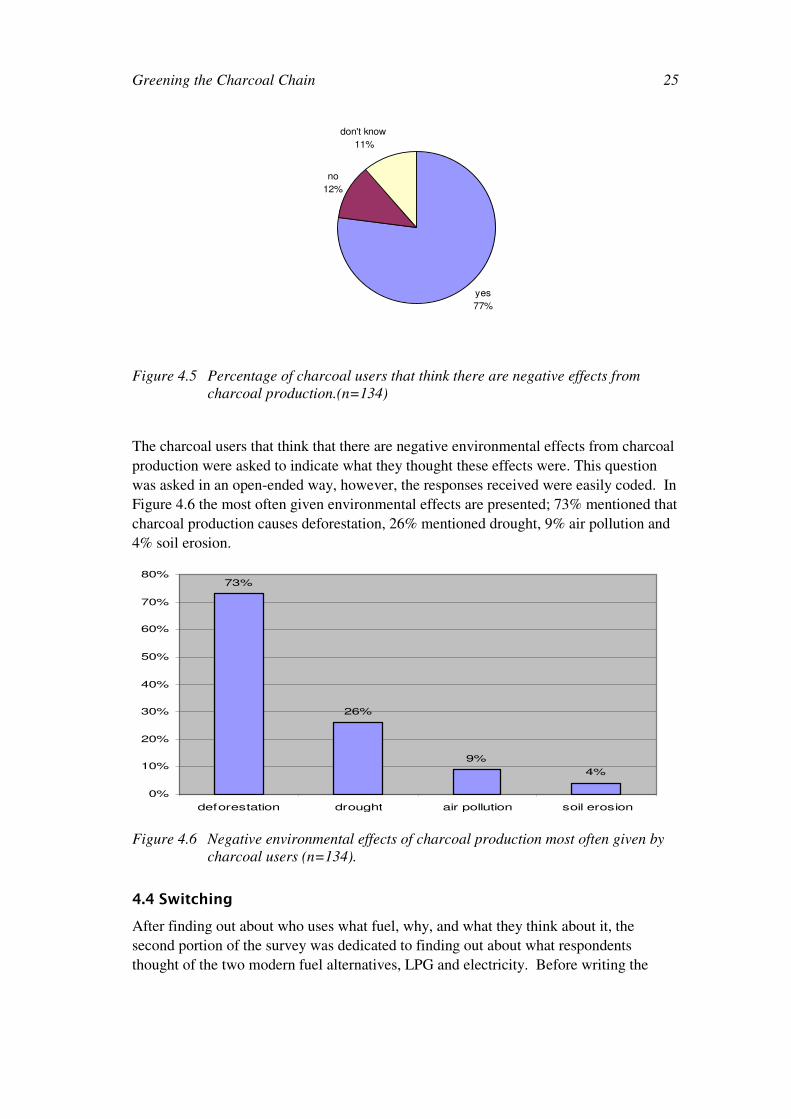
Charcoal users were asked if they thought that charcoal production causes any negative
environmental effects to the natural environment in Tanzania. Figure 4.5 shows that 77%
of the users indicated they thought there were negative environmental effects from
charcoal production. Of the respondents 12% said that they did not think charcoal
production causes negative environmental effects and 11% were not sure.
Greening the Charcoal Chain
25
yes
77%
no
12%
don't know
11%
Figure 4.5 Percentage of charcoal users that think there are negative effects from
charcoal production.(n=134)
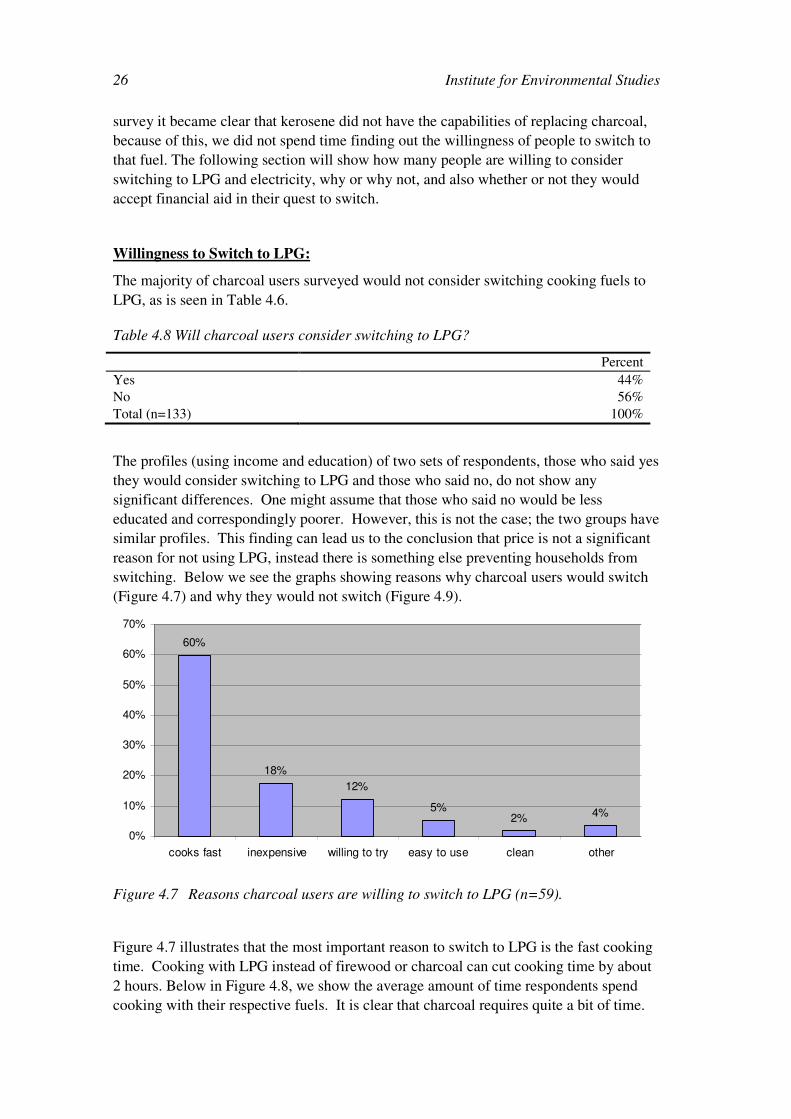
The charcoal users that think that there are negative environmental effects from charcoal
production were asked to indicate what they thought these effects were. This question
was asked in an open-ended way, however, the responses received were easily coded. In
Figure 4.6 the most often given environmental effects are presented; 73% mentioned that
charcoal production causes deforestation, 26% mentioned drought, 9% air pollution and
4% soil erosion.
73%
26%
9%
4%
0%
10%
20%
30%
40%
50%
60%
70%
80%
deforestation drought air pollution soil erosion
Figure 4.6 Negative environmental effects of charcoal production most often given by
charcoal users (n=134).
4.4 Switching
After finding out about who uses what fuel, why, and what they think about it, the
second portion of the survey was dedicated to finding out about what respondents
thought of the two modern fuel alternatives, LPG and electricity. Before writing the
Institute for Environmental Studies 26
survey it became clear that kerosene did not have the capabilities of replacing charcoal,
because of this, we did not spend time finding out the willingness of people to switch to
that fuel. The following section will show how many people are willing to consider
switching to LPG and electricity, why or why not, and also whether or not they would
accept financial aid in their quest to switch.
Willingness to Switch to LPG:
The majority of charcoal users surveyed would not consider switching cooking fuels to
LPG, as is seen in Table 4.6.
Table 4.8 Will charcoal users consider switching to LPG?
Percent
Yes 44%
No 56%
Total (n=133) 100%
The profiles (using income and education) of two sets of respondents, those who said yes
they would consider switching to LPG and those who said no, do not show any
significant differences. One might assume that those who said no would be less
educated and correspondingly poorer. However, this is not the case; the two groups have
similar profiles. This finding can lead us to the conclusion that price is not a significant
reason for not using LPG, instead there is something else preventing households from
switching. Below we see the graphs showing reasons why charcoal users would switch
(Figure 4.7) and why they would not switch (Figure 4.9).
60%
18%
12%
5%2% 4%
0%
10%
20%
30%
40%
50%
60%
70%
cooks fast inexpensive willing to try easy to use clean other
Figure 4.7 Reasons charcoal users are willing to switch to LPG (n=59).
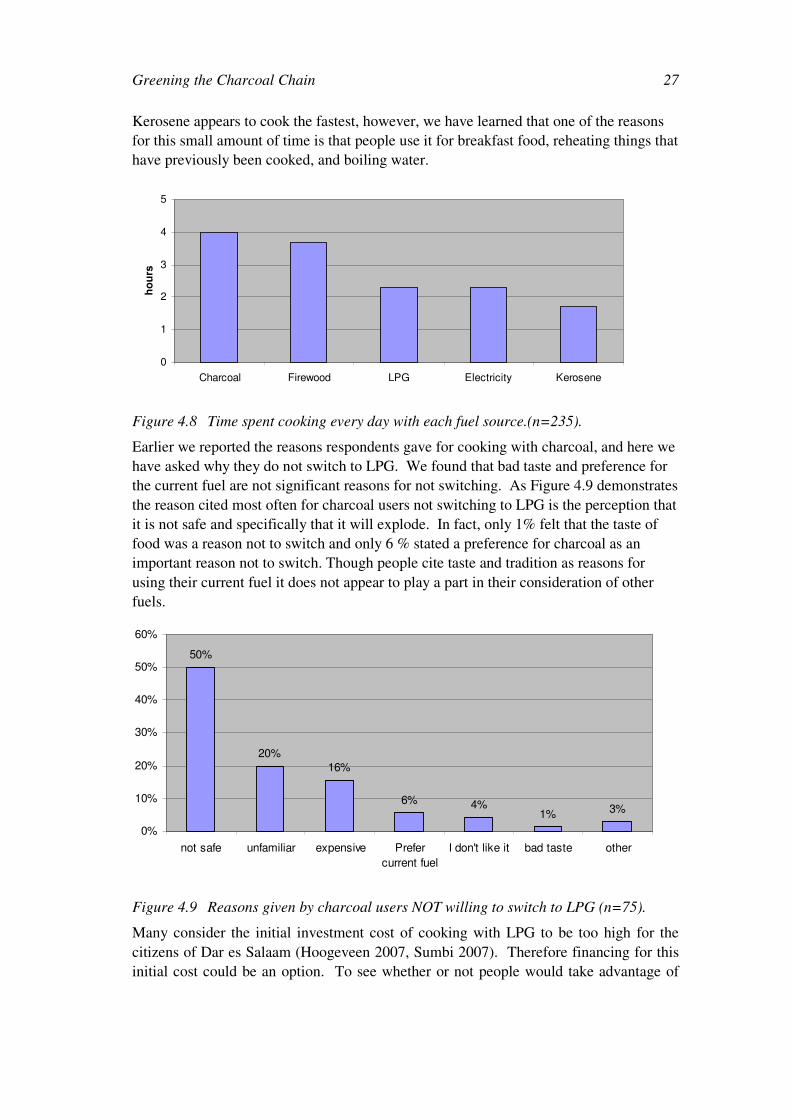
Figure 4.7 illustrates that the most important reason to switch to LPG is the fast cooking
time. Cooking with LPG instead of firewood or charcoal can cut cooking time by about
2 hours. Below in Figure 4.8, we show the average amount of time respondents spend
cooking with their respective fuels. It is clear that charcoal requires quite a bit of time.
Greening the Charcoal Chain
27
Kerosene appears to cook the fastest, however, we have learned that one of the reasons
for this small amount of time is that people use it for breakfast food, reheating things that
have previously been cooked, and boiling water.
0
1
2
3
4
5
Charcoal Firewood LPG Electricity Kerosene
ho
urs
Figure 4.8 Time spent cooking every day with each fuel source.(n=235).
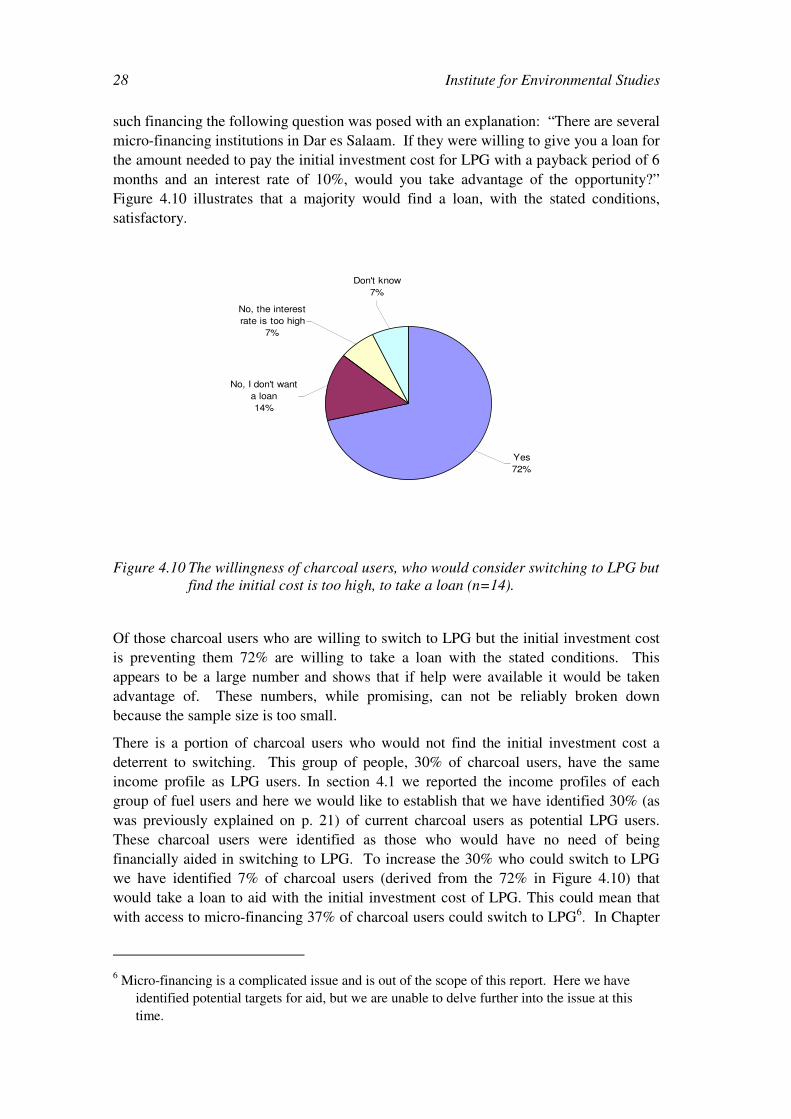
Earlier we reported the reasons respondents gave for cooking with charcoal, and here we
have asked why they do not switch to LPG. We found that bad taste and preference for
the current fuel are not significant reasons for not switching. As Figure 4.9 demonstrates
the reason cited most often for charcoal users not switching to LPG is the perception that
it is not safe and specifically that it will explode. In fact, only 1% felt that the taste of
food was a reason not to switch and only 6 % stated a preference for charcoal as an
important reason not to switch. Though people cite taste and tradition as reasons for
using their current fuel it does not appear to play a part in their consideration of other
fuels.
50%
20%16%
6% 4%1% 3%
0%
10%
20%
30%
40%
50%
60%
not safe unfamiliar expensive Prefer
current fuel
I don't like it bad taste other
Figure 4.9 Reasons given by charcoal users NOT willing to switch to LPG (n=75).
Many consider the initial investment cost of cooking with LPG to be too high for the
citizens of Dar es Salaam (Hoogeveen 2007, Sumbi 2007). Therefore financing for this
initial cost could be an option. To see whether or not people would take advantage of
Institute for Environmental Studies 28
such financing the following question was posed with an explanation: “There are several
micro-financing institutions in Dar es Salaam. If they were willing to give you a loan for
the amount needed to pay the initial investment cost for LPG with a payback period of 6
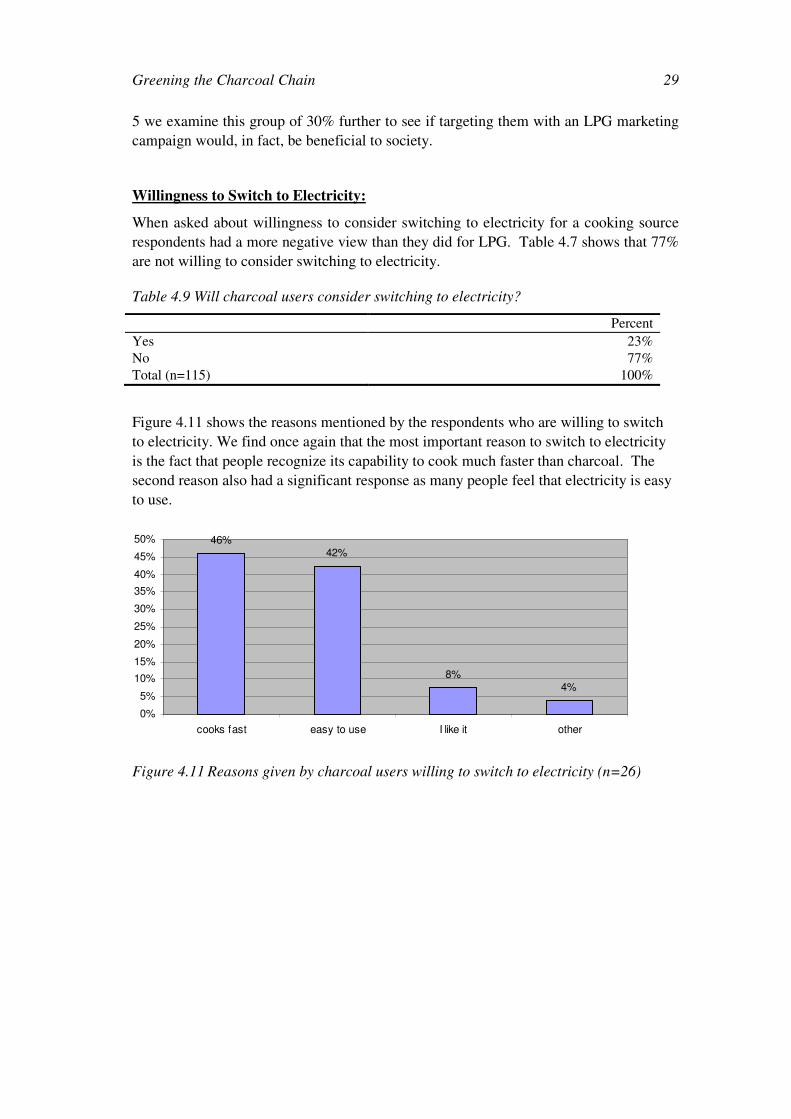
months and an interest rate of 10%, would you take advantage of the opportunity?”
Figure 4.10 illustrates that a majority would find a loan, with the stated conditions,
satisfactory.
Yes
72%
Don't know
7%
No, the interest
rate is too high
7%
No, I don't want
a loan
14%
Figure 4.10 The willingness of charcoal users, who would consider switching to LPG but
find the initial cost is too high, to take a loan (n=14).
Of those charcoal users who are willing to switch to LPG but the initial investment cost
is preventing them 72% are willing to take a loan with the stated conditions. This
appears to be a large number and shows that if help were available it would be taken
advantage of. These numbers, while promising, can not be reliably broken down
because the sample size is too small.
There is a portion of charcoal users who would not find the initial investment cost a
deterrent to switching. This group of people, 30% of charcoal users, have the same
income profile as LPG users. In section 4.1 we reported the income profiles of each
group of fuel users and here we would like to establish that we have identified 30% (as
was previously explained on p. 21) of current charcoal users as potential LPG users.
These charcoal users were identified as those who would have no need of being
financially aided in switching to LPG. To increase the 30% who could switch to LPG
we have identified 7% of charcoal users (derived from the 72% in Figure 4.10) that
would take a loan to aid with the initial investment cost of LPG. This could mean that
with access to micro-financing 37% of charcoal users could switch to LPG6. In Chapter
6 Micro-financing is a complicated issue and is out of the scope of this report. Here we have
identified potential targets for aid, but we are unable to delve further into the issue at this
time.
Greening the Charcoal Chain
29
5 we examine this group of 30% further to see if targeting them with an LPG marketing
campaign would, in fact, be beneficial to society.
Willingness to Switch to Electricity:
When asked about willingness to consider switching to electricity for a cooking source
respondents had a more negative view than they did for LPG. Table 4.7 shows that 77%
are not willing to consider switching to electricity.
Table 4.9 Will charcoal users consider switching to electricity?
Percent
Yes 23%
No 77%
Total (n=115) 100%
Figure 4.11 shows the reasons mentioned by the respondents who are willing to switch
to electricity. We find once again that the most important reason to switch to electricity
is the fact that people recognize its capability to cook much faster than charcoal. The
second reason also had a significant response as many people feel that electricity is easy
to use.
46%42%
8%4%
0%
5%
10%
15%
20%
25%
30%
35%
40%
45%
50%
cooks fast easy to use I like it other
Reasons to Switch
Figure 4.11 Reasons given by charcoal users willing to switch to electricity (n=26)
Institute for Environmental Studies 30
91%
3% 3% 2%
0%
10%
20%
30%
40%
50%
60%
70%
80%
90%
100%
expensive no pow er not reliable other
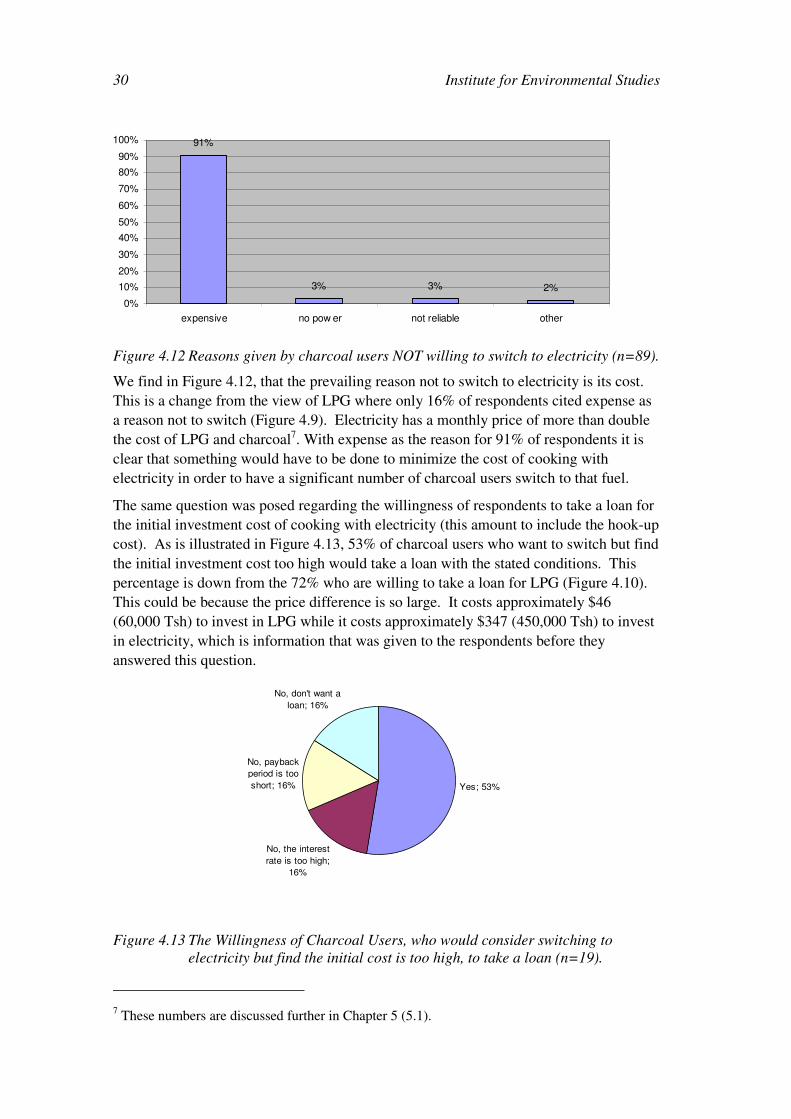
Figure 4.12 Reasons given by charcoal users NOT willing to switch to electricity (n=89).
We find in Figure 4.12, that the prevailing reason not to switch to electricity is its cost.
This is a change from the view of LPG where only 16% of respondents cited expense as
a reason not to switch (Figure 4.9). Electricity has a monthly price of more than double
the cost of LPG and charcoal7. With expense as the reason for 91% of respondents it is
clear that something would have to be done to minimize the cost of cooking with
electricity in order to have a significant number of charcoal users switch to that fuel.
The same question was posed regarding the willingness of respondents to take a loan for
the initial investment cost of cooking with electricity (this amount to include the hook-up
cost). As is illustrated in Figure 4.13, 53% of charcoal users who want to switch but find
the initial investment cost too high would take a loan with the stated conditions. This
percentage is down from the 72% who are willing to take a loan for LPG (Figure 4.10).
This could be because the price difference is so large. It costs approximately $46
(60,000 Tsh) to invest in LPG while it costs approximately $347 (450,000 Tsh) to invest
in electricity, which is information that was given to the respondents before they
answered this question.
Yes; 53%
No, the interest
rate is too high;
16%
No, payback
period is too
short; 16%
No, don't want a
loan; 16%
Figure 4.13 The Willingness of Charcoal Users, who would consider switching to
electricity but find the initial cost is too high, to take a loan (n=19).
7 These numbers are discussed further in Chapter 5 (5.1).
Greening the Charcoal Chain
31
Here we have shown that the group of people willing to switch to electricity is not large
(23%, Table 4.7). In addition, we have seen that due to the high costs of electricity there
is also not a large group of people that have the financial capability to switch to
electricity. We are unable to identify a group of charcoal users similar to the 30% we
have identified with capability to switch to LPG. In Chapter 5 the differences between
electricity and LPG will be examined further.
4.5 Motivation for Switching
We asked respondents if they had switched or added fuels in the past 5 years and if so
what had they switched from? While we did get a significant number of respondents
who switched (23% or 54 respondents) they had not switched from or to fuels as we had
expected. There is no real trend to these responses, and it is therefore difficult to make
any conclusions. We were expecting many people to have switched from charcoal to
electricity, LPG, or kerosene. Though a percentage of households have switched to LPG
(35% of switchers) the fuel that had the second largest percentage of people switching to
it was charcoal, with a few even switching to firewood. After further examination we
see that this switch to charcoal is due to recent hikes in the prices of electricity and
kerosene. A few of these households switched from using firewood to charcoal which is
a step up, and none of our respondents had switched from LPG to charcoal.
Of the 35% of households who switched to LPG 53% switched from electricity and 42%
switched from charcoal. However, this 35% is only 19 households, which makes any
further breakdown unreliable. There is no real trend to the reasons why these groups
made the switch. Almost all of the reasons listed were cited but no reason showed itself
as the most important reason to switch to LPG though we can speculate that the high
price of electricity was a reason for the 53% who used to use it. Because of the
assumptions we made before implementing the survey the coded reasons were directed
toward respondents who would be switching from charcoal to LPG, electricity, or
kerosene. Not the other way around.
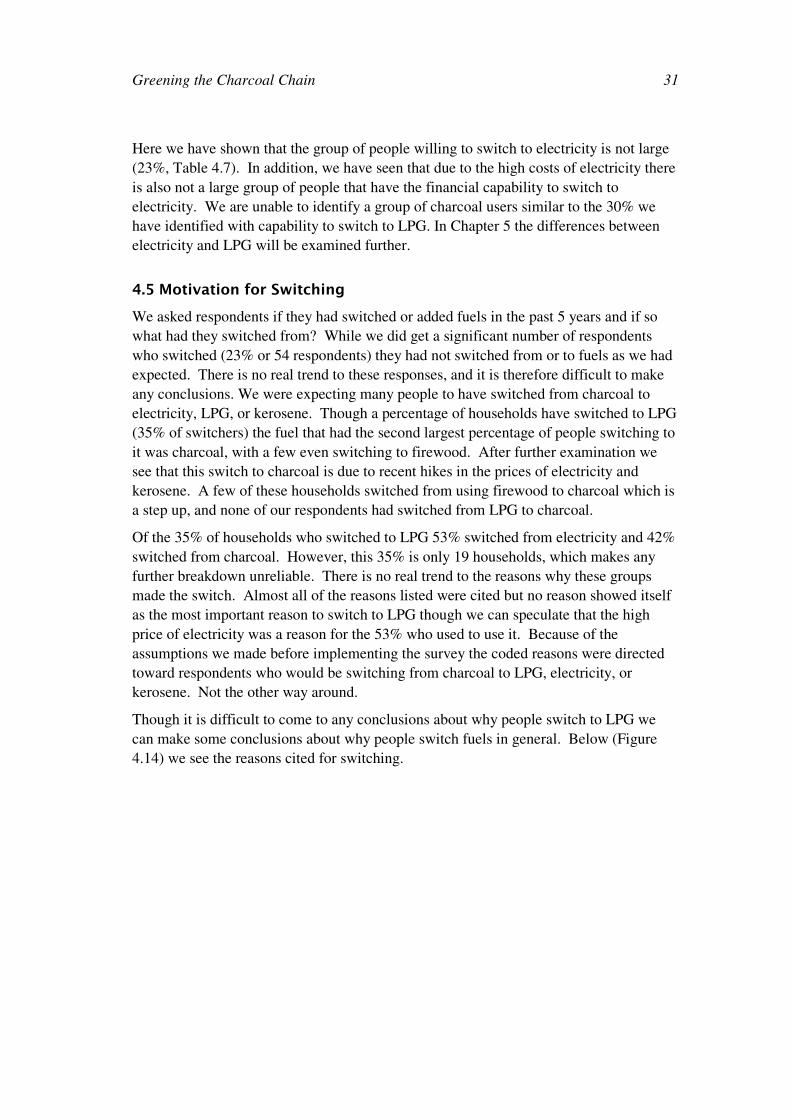
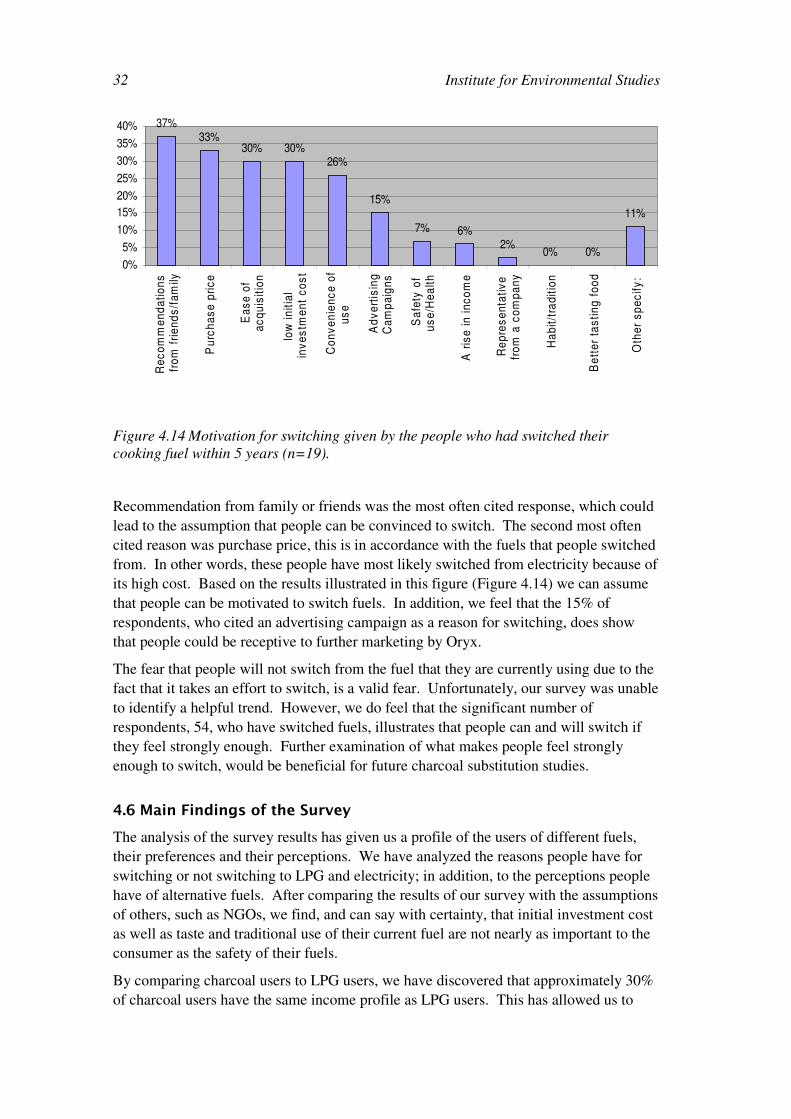
Though it is difficult to come to any conclusions about why people switch to LPG we
can make some conclusions about why people switch fuels in general. Below (Figure
4.14) we see the reasons cited for switching.
Institute for Environmental Studies 32
37%33%
30% 30%26%
15%
7% 6%2%
0% 0%
11%
0%
5%
10%
15%
20%
25%
30%
35%
40%
Re
co
mm
en
da
tio
ns
fro
m f
rie
nd
s/f
am
ily
Pu
rch
as
e p
ric
e
Ea
se
of
ac
qu
isit
ion
low
in
itia
lin
ve
stm
en
t c
os
t
Co
nv
en
ien
ce
of
us
e
Ad
ve
rtis
ing
Ca
mp
aig
ns
Sa
fety
of
us
e/H
ea
lth
A r
ise
in
in
co
me
Re
pre
se
nta
tiv
efr
om
a c
om
pa
ny
Ha
bit
/tra
dit
ion
Be
tte
r ta
sti
ng
fo
od
Oth
er
sp
ec
ify
:
Figure 4.14 Motivation for switching given by the people who had switched their
cooking fuel within 5 years (n=19).
Recommendation from family or friends was the most often cited response, which could
lead to the assumption that people can be convinced to switch. The second most often
cited reason was purchase price, this is in accordance with the fuels that people switched
from. In other words, these people have most likely switched from electricity because of
its high cost. Based on the results illustrated in this figure (Figure 4.14) we can assume
that people can be motivated to switch fuels. In addition, we feel that the 15% of
respondents, who cited an advertising campaign as a reason for switching, does show
that people could be receptive to further marketing by Oryx.
The fear that people will not switch from the fuel that they are currently using due to the
fact that it takes an effort to switch, is a valid fear. Unfortunately, our survey was unable
to identify a helpful trend. However, we do feel that the significant number of
respondents, 54, who have switched fuels, illustrates that people can and will switch if
they feel strongly enough. Further examination of what makes people feel strongly
enough to switch, would be beneficial for future charcoal substitution studies.
4.6 Main Findings of the Survey
The analysis of the survey results has given us a profile of the users of different fuels,
their preferences and their perceptions. We have analyzed the reasons people have for
switching or not switching to LPG and electricity; in addition, to the perceptions people
have of alternative fuels. After comparing the results of our survey with the assumptions
of others, such as NGOs, we find, and can say with certainty, that initial investment cost
as well as taste and traditional use of their current fuel are not nearly as important to the
consumer as the safety of their fuels.
By comparing charcoal users to LPG users, we have discovered that approximately 30%
of charcoal users have the same income profile as LPG users. This has allowed us to
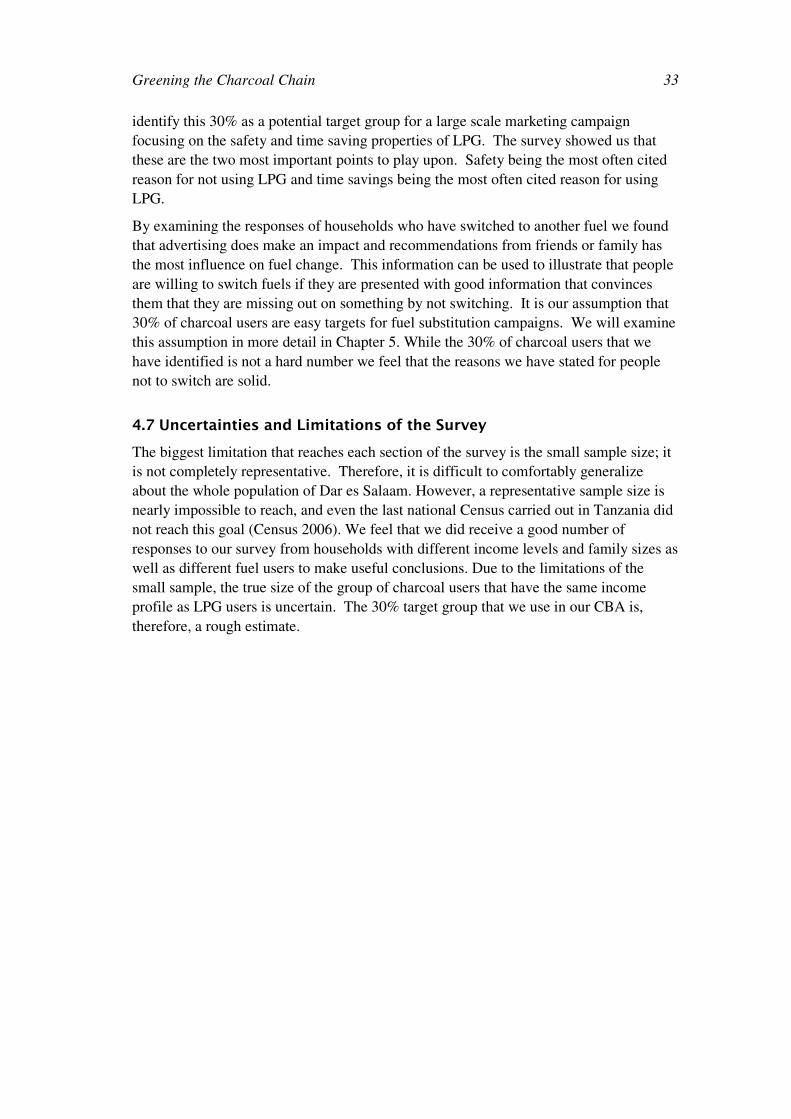
Greening the Charcoal Chain
33
identify this 30% as a potential target group for a large scale marketing campaign
focusing on the safety and time saving properties of LPG. The survey showed us that
these are the two most important points to play upon. Safety being the most often cited
reason for not using LPG and time savings being the most often cited reason for using
LPG.
By examining the responses of households who have switched to another fuel we found
that advertising does make an impact and recommendations from friends or family has
the most influence on fuel change. This information can be used to illustrate that people
are willing to switch fuels if they are presented with good information that convinces
them that they are missing out on something by not switching. It is our assumption that
30% of charcoal users are easy targets for fuel substitution campaigns. We will examine
this assumption in more detail in Chapter 5. While the 30% of charcoal users that we
have identified is not a hard number we feel that the reasons we have stated for people
not to switch are solid.
4.7 Uncertainties and Limitations of the Survey
The biggest limitation that reaches each section of the survey is the small sample size; it
is not completely representative. Therefore, it is difficult to comfortably generalize
about the whole population of Dar es Salaam. However, a representative sample size is
nearly impossible to reach, and even the last national Census carried out in Tanzania did
not reach this goal (Census 2006). We feel that we did receive a good number of
responses to our survey from households with different income levels and family sizes as
well as different fuel users to make useful conclusions. Due to the limitations of the
small sample, the true size of the group of charcoal users that have the same income
profile as LPG users is uncertain. The 30% target group that we use in our CBA is,
therefore, a rough estimate.
Institute for Environmental Studies 34
5. Cost-Benefit Analysis
A cost-benefit analysis (CBA) was conducted on two levels: the household level and the
social planner level. The aim of the household CBA is to find out, which cooking fuel is
the best alternative when the initial investment cost, daily cooking cost, time spent
cooking and health risks are taken into account. The goal for the household CBA is to
find the most cost-efficient fuel to use.
Then, the best fuel source, according to the results of the household CBA, is used in the
social planner CBA as an alternative to charcoal. In the social planner CBA the costs of
making people switch from charcoal to the best alternative are compared to the social
and environmental benefits. The aim is to find out if this kind of switch would benefit
the society as a whole. The goal for the social planner is to maximise the welfare to the
society.
5.1 Household CBA
The household CBA aims to find the cheapest cooking fuel source when all the relevant
costs and benefits are taken into account. The functional unit used in the analysis is
cooking with the fuel for 10 years.
5.1.1 Costs
The costs for the initial investment cost and daily cooking cost of each fuel source are
derived from the results of our survey. The households were asked to indicate the type
and cost of the equipment (e.g. stove) that they use for the fuel that they primarily cook
with. The initial investment cost used in our analysis is therefore an average cost based
on the responses received from the survey and not the least possible investment cost
required to start using the fuel8. Figure 5.1 presents the average initial investment costs
for each cooking fuel source commonly used in Dar es Salaam.
490
83
4 3 10
50
100
150
200
250
300
350
400
450
500
Electricity LPG Kerosene Charcoal Firew ood
$
Figure 5.1 Average initial investment cost of each fuel
8 On page 30 the lowest possible investment cost for LPG ($46) and electricity ($347) was used.
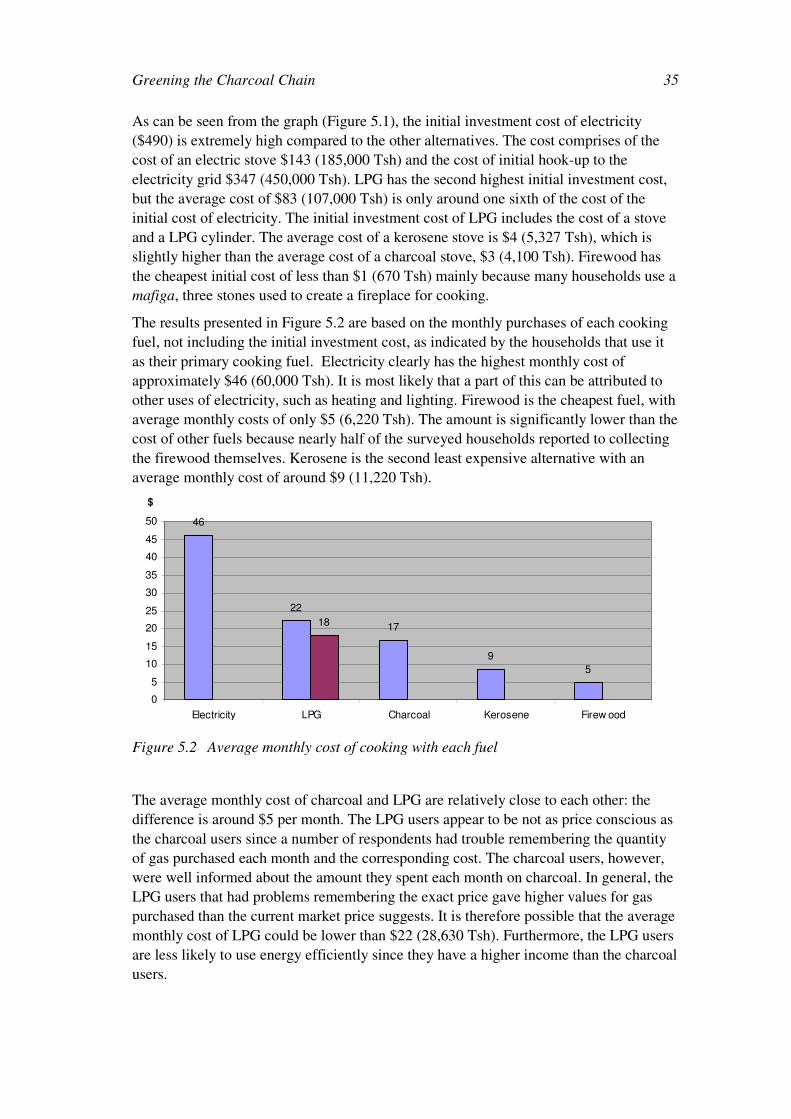
Greening the Charcoal Chain
35
As can be seen from the graph (Figure 5.1), the initial investment cost of electricity
($490) is extremely high compared to the other alternatives. The cost comprises of the
cost of an electric stove $143 (185,000 Tsh) and the cost of initial hook-up to the
electricity grid $347 (450,000 Tsh). LPG has the second highest initial investment cost,
but the average cost of $83 (107,000 Tsh) is only around one sixth of the cost of the
initial cost of electricity. The initial investment cost of LPG includes the cost of a stove
and a LPG cylinder. The average cost of a kerosene stove is $4 (5,327 Tsh), which is
slightly higher than the average cost of a charcoal stove, $3 (4,100 Tsh). Firewood has
the cheapest initial cost of less than $1 (670 Tsh) mainly because many households use a
mafiga, three stones used to create a fireplace for cooking.
The results presented in Figure 5.2 are based on the monthly purchases of each cooking
fuel, not including the initial investment cost, as indicated by the households that use it
as their primary cooking fuel. Electricity clearly has the highest monthly cost of
approximately $46 (60,000 Tsh). It is most likely that a part of this can be attributed to
other uses of electricity, such as heating and lighting. Firewood is the cheapest fuel, with
average monthly costs of only $5 (6,220 Tsh). The amount is significantly lower than the
cost of other fuels because nearly half of the surveyed households reported to collecting
the firewood themselves. Kerosene is the second least expensive alternative with an
average monthly cost of around $9 (11,220 Tsh).
46
22
17
9
5
18
0
5
10
15
20
25
30
35
40
45
50
Electricity LPG Charcoal Kerosene Firew ood
$
Figure 5.2 Average monthly cost of cooking with each fuel
The average monthly cost of charcoal and LPG are relatively close to each other: the
difference is around $5 per month. The LPG users appear to be not as price conscious as
the charcoal users since a number of respondents had trouble remembering the quantity
of gas purchased each month and the corresponding cost. The charcoal users, however,
were well informed about the amount they spent each month on charcoal. In general, the
LPG users that had problems remembering the exact price gave higher values for gas
purchased than the current market price suggests. It is therefore possible that the average
monthly cost of LPG could be lower than $22 (28,630 Tsh). Furthermore, the LPG users
are less likely to use energy efficiently since they have a higher income than the charcoal
users.
Institute for Environmental Studies 36
The price of LPG will drop even more in the near future, now that the government has
abolished the VAT and importation tax. In Figure 5.2 the effect of abolishing the VAT
(20%) on LPG is shown by the red bar. The average monthly cost of LPG is then
approximately $18, and the difference between the monthly cost of LPG and charcoal is
only around $1.
5.1.2 Benefits
The costs are compared to the benefits of cooking with each fuel source. The benefits are
derived from two sources: time saved and negative health effects avoided. We have
decided to treat time used for cooking and health effects as benefits instead of as costs to
illustrate the positive gains that can be attained by using a more modern cooking fuel.
These benefits increase as you move up the energy ladder from firewood and charcoal to
kerosene and finally to LPG and electricity.
According to the results of our survey, the households cooking with kerosene, LPG and
electricity spent approximately two hours less time cooking every day compared to the
families using firewood or charcoal. On average firewood and charcoal users spent 4
hours cooking every day, while the users of kerosene, LPG and electricity spent
approximately 2 hours cooking. Some households using firewood and charcoal reported
cooking up to 7 hours every day. Time savings can be considerable when switching
from firewood or charcoal to kerosene, LPG or electricity. On average the time saved is
estimated to be 2 hours per day. To calculate the yearly amount of time saved this
number is multiplied by 365.
The time saved is valued following the guidelines used by the World Health
Organization (2006) in their global cost-benefit analysis of household cooking fuels. The
value of time is calculated by taking 30% of the average Gross National Income (GNI) in
Dar es Salaam, which is approximately $52 (67,000 Tsh) per month (Dar es Salaam City
Council 2004) and dividing this number according to the length of average work week in
Dar es Salaam (45 hours per week). This calculation gives us an estimate for the value of
time of 0.086 $/hour.
In our analysis the negative health effects of cooking with firewood and charcoal are
treated similarly, even though we recognize that cooking with firewood is more
damaging to health than cooking with charcoal. Cooking with firewood is commonly
done on an open fire, which emits more particulate matters than using a charcoal stove.
The reasoning behind this decision is that most of the studies found on the negative
health effects combine firewood and charcoal into one fuel, biomass. We feel that this is
justified since we are more interested in finding out the differences between charcoal and
the more modern cooking fuels, such as kerosene, LPG and electricity, instead of
looking at the health effects of firewood compared to charcoal.
Firewood and charcoal acquire no health benefits. LPG and electricity have full positive
health benefits due to human health risk avoided. While kerosene is not as damaging to
health as firewood and charcoal, its smoke can still cause negative health effects.
According to studies looking at the emissions of different cooking fuels, kerosene emits
0.01 g of health damaging pollutants per MJ delivered compared to less than 0.001 g of
LPG (Edwards et al. 2004, 404; Smith et al. 2005). Based on these numbers we have
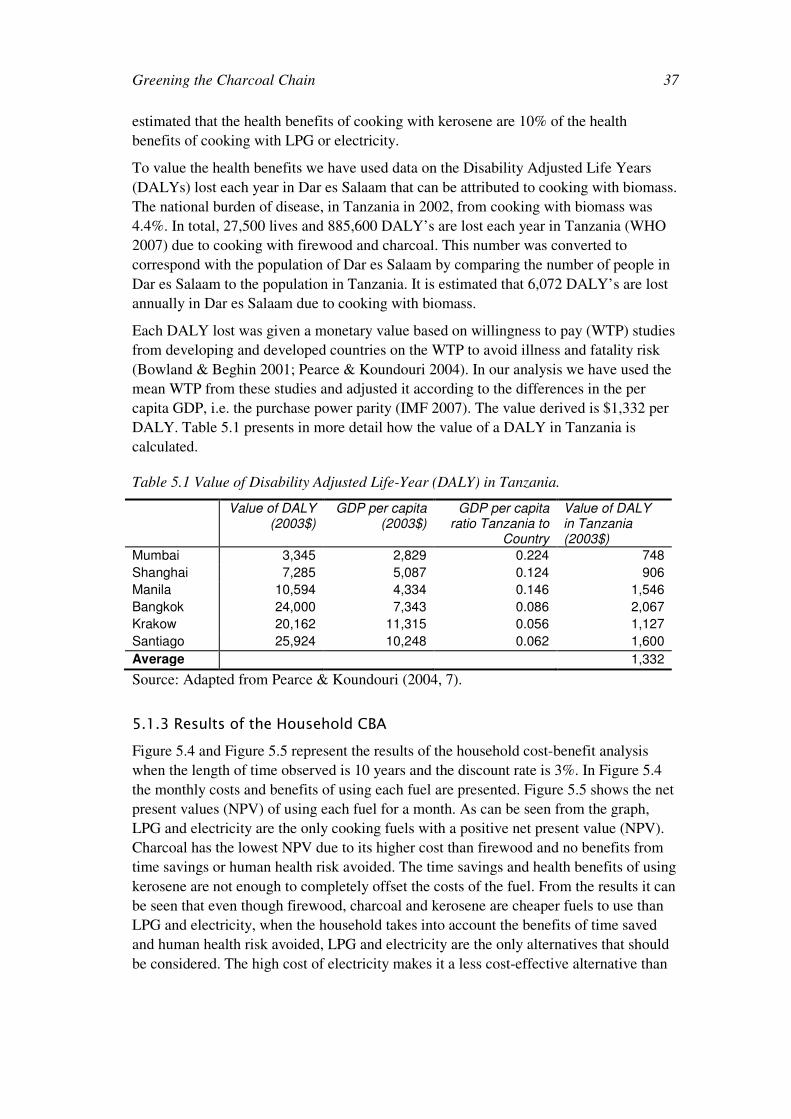
Greening the Charcoal Chain
37
estimated that the health benefits of cooking with kerosene are 10% of the health
benefits of cooking with LPG or electricity.
To value the health benefits we have used data on the Disability Adjusted Life Years
(DALYs) lost each year in Dar es Salaam that can be attributed to cooking with biomass.
The national burden of disease, in Tanzania in 2002, from cooking with biomass was
4.4%. In total, 27,500 lives and 885,600 DALY’s are lost each year in Tanzania (WHO
2007) due to cooking with firewood and charcoal. This number was converted to
correspond with the population of Dar es Salaam by comparing the number of people in
Dar es Salaam to the population in Tanzania. It is estimated that 6,072 DALY’s are lost
annually in Dar es Salaam due to cooking with biomass.
Each DALY lost was given a monetary value based on willingness to pay (WTP) studies
from developing and developed countries on the WTP to avoid illness and fatality risk
(Bowland & Beghin 2001; Pearce & Koundouri 2004). In our analysis we have used the
mean WTP from these studies and adjusted it according to the differences in the per
capita GDP, i.e. the purchase power parity (IMF 2007). The value derived is $1,332 per
DALY. Table 5.1 presents in more detail how the value of a DALY in Tanzania is
calculated.
Table 5.1 Value of Disability Adjusted Life-Year (DALY) in Tanzania.
Value of DALY (2003$)
GDP per capita (2003$)
GDP per capita ratio Tanzania to
Country
Value of DALY in Tanzania (2003$)
Mumbai 3,345 2,829 0.224 748
Shanghai 7,285 5,087 0.124 906
Manila 10,594 4,334 0.146 1,546
Bangkok 24,000 7,343 0.086 2,067
Krakow 20,162 11,315 0.056 1,127
Santiago 25,924 10,248 0.062 1,600
Average 1,332
Source: Adapted from Pearce & Koundouri (2004, 7).
5.1.3 Results of the Household CBA
Figure 5.4 and Figure 5.5 represent the results of the household cost-benefit analysis
when the length of time observed is 10 years and the discount rate is 3%. In Figure 5.4
the monthly costs and benefits of using each fuel are presented. Figure 5.5 shows the net
present values (NPV) of using each fuel for a month. As can be seen from the graph,
LPG and electricity are the only cooking fuels with a positive net present value (NPV).
Charcoal has the lowest NPV due to its higher cost than firewood and no benefits from
time savings or human health risk avoided. The time savings and health benefits of using
kerosene are not enough to completely offset the costs of the fuel. From the results it can
be seen that even though firewood, charcoal and kerosene are cheaper fuels to use than
LPG and electricity, when the household takes into account the benefits of time saved
and human health risk avoided, LPG and electricity are the only alternatives that should
be considered. The high cost of electricity makes it a less cost-effective alternative than
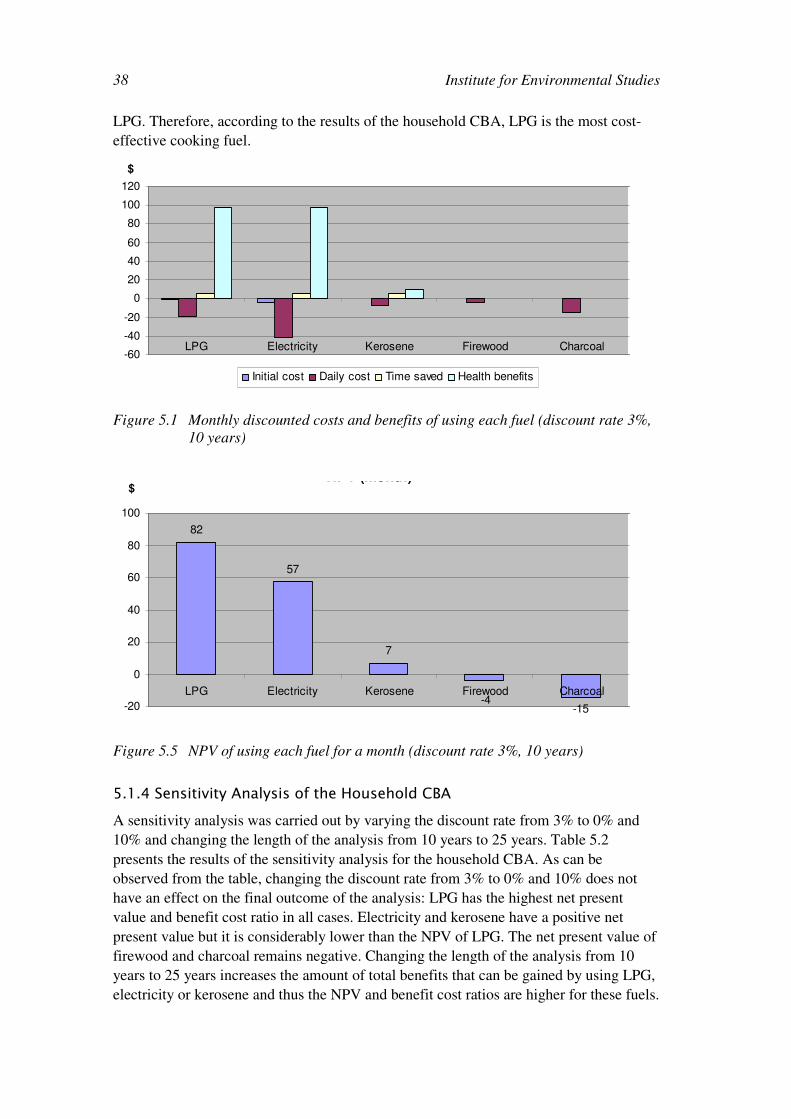
Institute for Environmental Studies 38
LPG. Therefore, according to the results of the household CBA, LPG is the most cost-
effective cooking fuel.
-60
-40
-20
0
20
40
60
80
100
120
LPG Electricity Kerosene Firewood Charcoal
$
Initial cost Daily cost Time saved Health benefits
Figure 5.1 Monthly discounted costs and benefits of using each fuel (discount rate 3%,
10 years)
NPV (month)
82
57
7
-15-4
-20
0
20
40
60
80
100
LPG Electricity Kerosene Firewood Charcoal
$
Figure 5.5 NPV of using each fuel for a month (discount rate 3%, 10 years)
5.1.4 Sensitivity Analysis of the Household CBA
A sensitivity analysis was carried out by varying the discount rate from 3% to 0% and
10% and changing the length of the analysis from 10 years to 25 years. Table 5.2
presents the results of the sensitivity analysis for the household CBA. As can be
observed from the table, changing the discount rate from 3% to 0% and 10% does not
have an effect on the final outcome of the analysis: LPG has the highest net present
value and benefit cost ratio in all cases. Electricity and kerosene have a positive net
present value but it is considerably lower than the NPV of LPG. The net present value of
firewood and charcoal remains negative. Changing the length of the analysis from 10
years to 25 years increases the amount of total benefits that can be gained by using LPG,
electricity or kerosene and thus the NPV and benefit cost ratios are higher for these fuels.
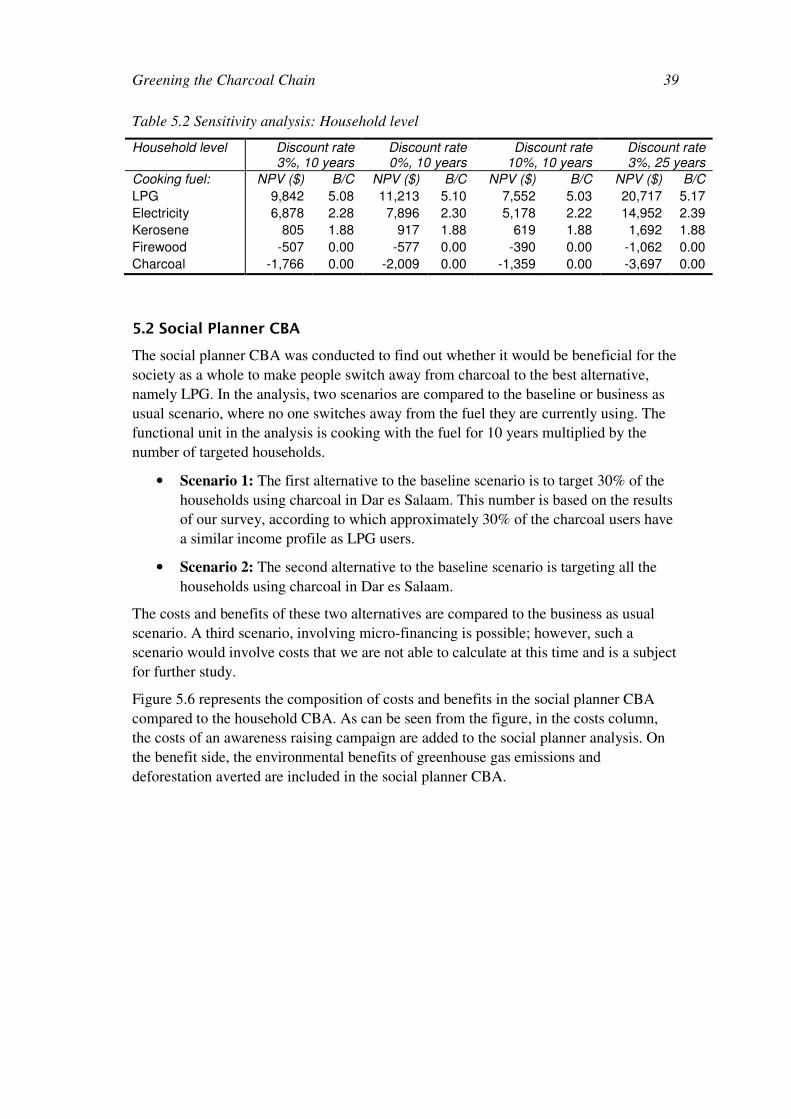
Greening the Charcoal Chain
39
Table 5.2 Sensitivity analysis: Household level
Household level Discount rate 3%, 10 years
Discount rate 0%, 10 years
Discount rate 10%, 10 years
Discount rate 3%, 25 years
Cooking fuel: NPV ($) B/C NPV ($) B/C NPV ($) B/C NPV ($) B/C
LPG 9,842 5.08 11,213 5.10 7,552 5.03 20,717 5.17
Electricity 6,878 2.28 7,896 2.30 5,178 2.22 14,952 2.39
Kerosene 805 1.88 917 1.88 619 1.88 1,692 1.88
Firewood -507 0.00 -577 0.00 -390 0.00 -1,062 0.00
Charcoal -1,766 0.00 -2,009 0.00 -1,359 0.00 -3,697 0.00
5.2 Social Planner CBA
The social planner CBA was conducted to find out whether it would be beneficial for the
society as a whole to make people switch away from charcoal to the best alternative,
namely LPG. In the analysis, two scenarios are compared to the baseline or business as
usual scenario, where no one switches away from the fuel they are currently using. The
functional unit in the analysis is cooking with the fuel for 10 years multiplied by the
number of targeted households.
• Scenario 1: The first alternative to the baseline scenario is to target 30% of the
households using charcoal in Dar es Salaam. This number is based on the results
of our survey, according to which approximately 30% of the charcoal users have
a similar income profile as LPG users.
• Scenario 2: The second alternative to the baseline scenario is targeting all the
households using charcoal in Dar es Salaam.
The costs and benefits of these two alternatives are compared to the business as usual
scenario. A third scenario, involving micro-financing is possible; however, such a
scenario would involve costs that we are not able to calculate at this time and is a subject
for further study.
Figure 5.6 represents the composition of costs and benefits in the social planner CBA
compared to the household CBA. As can be seen from the figure, in the costs column,
the costs of an awareness raising campaign are added to the social planner analysis. On
the benefit side, the environmental benefits of greenhouse gas emissions and
deforestation averted are included in the social planner CBA.
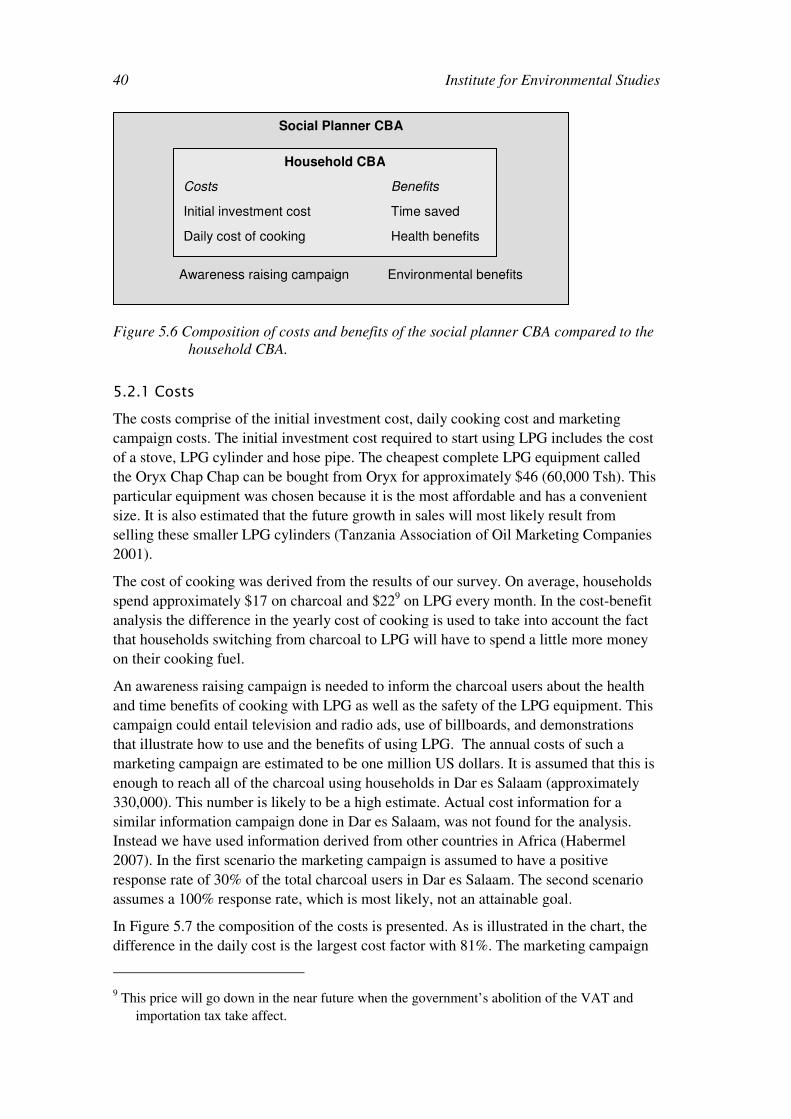
Institute for Environmental Studies 40
Figure 5.6 Composition of costs and benefits of the social planner CBA compared to the
household CBA.
5.2.1 Costs
The costs comprise of the initial investment cost, daily cooking cost and marketing
campaign costs. The initial investment cost required to start using LPG includes the cost
of a stove, LPG cylinder and hose pipe. The cheapest complete LPG equipment called
the Oryx Chap Chap can be bought from Oryx for approximately $46 (60,000 Tsh). This
particular equipment was chosen because it is the most affordable and has a convenient
size. It is also estimated that the future growth in sales will most likely result from
selling these smaller LPG cylinders (Tanzania Association of Oil Marketing Companies
2001).
The cost of cooking was derived from the results of our survey. On average, households
spend approximately $17 on charcoal and $229 on LPG every month. In the cost-benefit
analysis the difference in the yearly cost of cooking is used to take into account the fact
that households switching from charcoal to LPG will have to spend a little more money
on their cooking fuel.
An awareness raising campaign is needed to inform the charcoal users about the health
and time benefits of cooking with LPG as well as the safety of the LPG equipment. This
campaign could entail television and radio ads, use of billboards, and demonstrations
that illustrate how to use and the benefits of using LPG. The annual costs of such a
marketing campaign are estimated to be one million US dollars. It is assumed that this is
enough to reach all of the charcoal using households in Dar es Salaam (approximately
330,000). This number is likely to be a high estimate. Actual cost information for a
similar information campaign done in Dar es Salaam, was not found for the analysis.
Instead we have used information derived from other countries in Africa (Habermel
2007). In the first scenario the marketing campaign is assumed to have a positive
response rate of 30% of the total charcoal users in Dar es Salaam. The second scenario
assumes a 100% response rate, which is most likely, not an attainable goal.
In Figure 5.7 the composition of the costs is presented. As is illustrated in the chart, the
difference in the daily cost is the largest cost factor with 81%. The marketing campaign
9 This price will go down in the near future when the government’s abolition of the VAT and
importation tax take affect.
Social Planner CBA
Awareness raising campaign Environmental benefits
Household CBA
Costs Benefits
Initial investment cost Time saved
Daily cost of cooking Health benefits
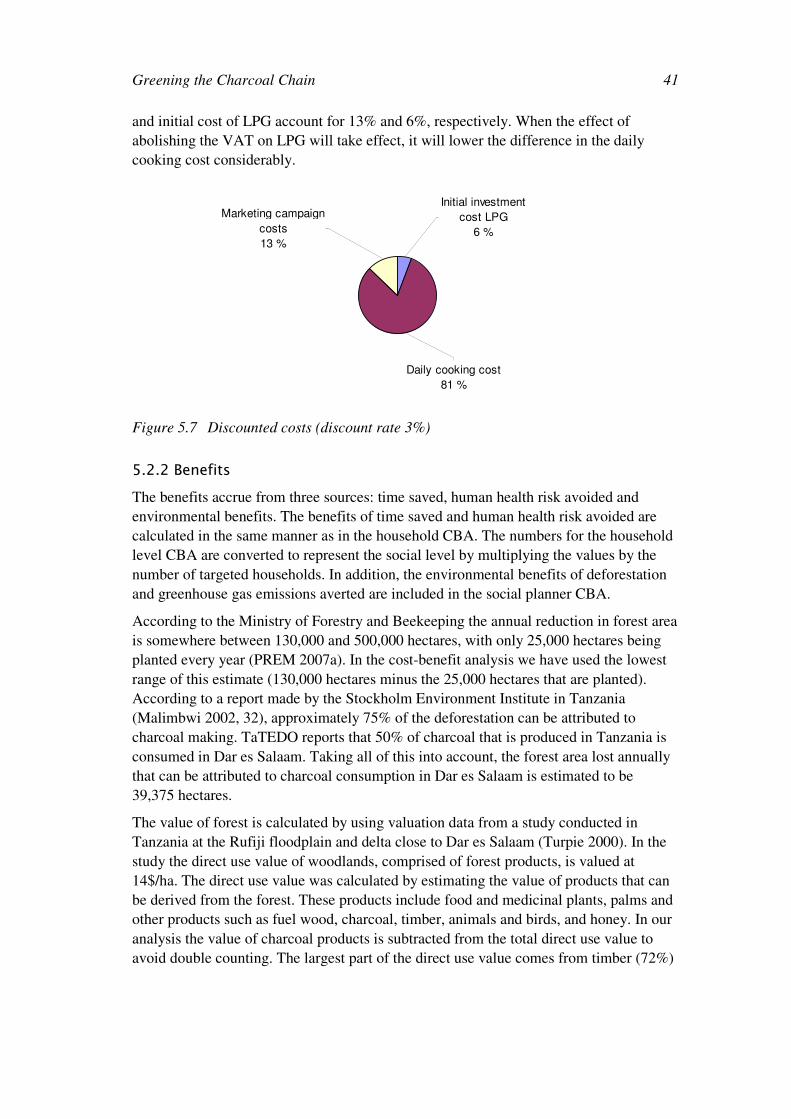
Greening the Charcoal Chain
41
and initial cost of LPG account for 13% and 6%, respectively. When the effect of
abolishing the VAT on LPG will take effect, it will lower the difference in the daily
cooking cost considerably.
Daily cooking cost
81 %
Marketing campaign
costs
13 %
Initial investment
cost LPG
6 %
Figure 5.7 Discounted costs (discount rate 3%)
5.2.2 Benefits
The benefits accrue from three sources: time saved, human health risk avoided and
environmental benefits. The benefits of time saved and human health risk avoided are
calculated in the same manner as in the household CBA. The numbers for the household
level CBA are converted to represent the social level by multiplying the values by the
number of targeted households. In addition, the environmental benefits of deforestation
and greenhouse gas emissions averted are included in the social planner CBA.
According to the Ministry of Forestry and Beekeeping the annual reduction in forest area
is somewhere between 130,000 and 500,000 hectares, with only 25,000 hectares being
planted every year (PREM 2007a). In the cost-benefit analysis we have used the lowest
range of this estimate (130,000 hectares minus the 25,000 hectares that are planted).
According to a report made by the Stockholm Environment Institute in Tanzania
(Malimbwi 2002, 32), approximately 75% of the deforestation can be attributed to
charcoal making. TaTEDO reports that 50% of charcoal that is produced in Tanzania is
consumed in Dar es Salaam. Taking all of this into account, the forest area lost annually
that can be attributed to charcoal consumption in Dar es Salaam is estimated to be
39,375 hectares.
The value of forest is calculated by using valuation data from a study conducted in
Tanzania at the Rufiji floodplain and delta close to Dar es Salaam (Turpie 2000). In the
study the direct use value of woodlands, comprised of forest products, is valued at
14$/ha. The direct use value was calculated by estimating the value of products that can
be derived from the forest. These products include food and medicinal plants, palms and
other products such as fuel wood, charcoal, timber, animals and birds, and honey. In our
analysis the value of charcoal products is subtracted from the total direct use value to
avoid double counting. The largest part of the direct use value comes from timber (72%)
Institute for Environmental Studies 42
and fuel wood (16%) while the other products account for less than 5% of the total value
each (Turpie 2000).
The indirect use value consists of carbon sequestration benefits, which, according to the
study conducted in Tanzania, is estimated to be 650$/ha. (Turpie 2000, 81.) This value is
at the low end of estimates. In their study on the value of the world’s ecosystem services,
Costanza et al. (1997, 256) estimated the value of a tropical forest to be approximately
2,007 $/ha. According to Pearce (2001, 291) the value of carbon sequestration of forests
is around 2,000 $/ha. We have decided to use the estimate from Turpie, because she
estimates the value of the specific kind of forest around the area of Dar es Salaam, which
is our main focus. In addition, we feel that when a lower estimate is used, the outcome of
the analysis is not an overestimation, and the results are robust. Therefore, in our
analysis, the total value of woodlands is the sum of indirect and direct value, which is
estimated at 664$/ha. This total value is used in our analysis as an opportunity cost of
forest lost to the production of charcoal.
The amount of greenhouse gas emissions averted was calculated by comparing the
differences between the emissions across the chain, from the production, transportation
and end-use of charcoal and LPG. The data is based on a life-cycle analysis on cooking
fuels from Kenya (Bailis et al. 2004) as well as a study on greenhouse gas emissions of
different cooking fuels from India (Smith 2000). Only Kyoto Protocol gases (most
importantly CO2 and methane) were included in our analysis, leaving out the global
warming potential of particulate matter.
The production of charcoal in inefficient earth-mound kilns causes emissions of carbon
dioxide (CO2) and methane (CH4) (Smith 2000). The numbers used assume full
regeneration of biomass, meaning that the emissions of CO2 from charcoal production
are omitted from the assessment.
The emissions from the transportation are based on emissions data from the US
Environmental Protection Agency for heavy-duty diesel trucks by converting these
numbers to reflect the condition and age of vehicles that are used for charcoal
transportation in Kenya (Bailis et al. 2004).
According to the findings, cooking with charcoal causes higher greenhouse gas
emissions than using LPG. Use of inefficient cooking stoves wastes a considerable
amount of energy and causes incomplete combustion that creates methane. Compared to
CO2 methane has a very high global warming potential (around 25 times more than
CO2) (Bailis 2004).
Table 5.3 presents in detail how the calculations for the greenhouse gas (GHG)
emissions were conducted. According to the results the households use, on average, 444
kg of charcoal and 156 kg of LPG per year. This number was then multiplied by the
caloric value of each fuel and the emissions of GHG in kg of carbon emitted per MJ. The
difference in the yearly GHG emissions for a household, measured in metric tonnes of
carbon, is then multiplied by the number of targeted households to derive the total
amount of avoided GHG emissions for each scenario.
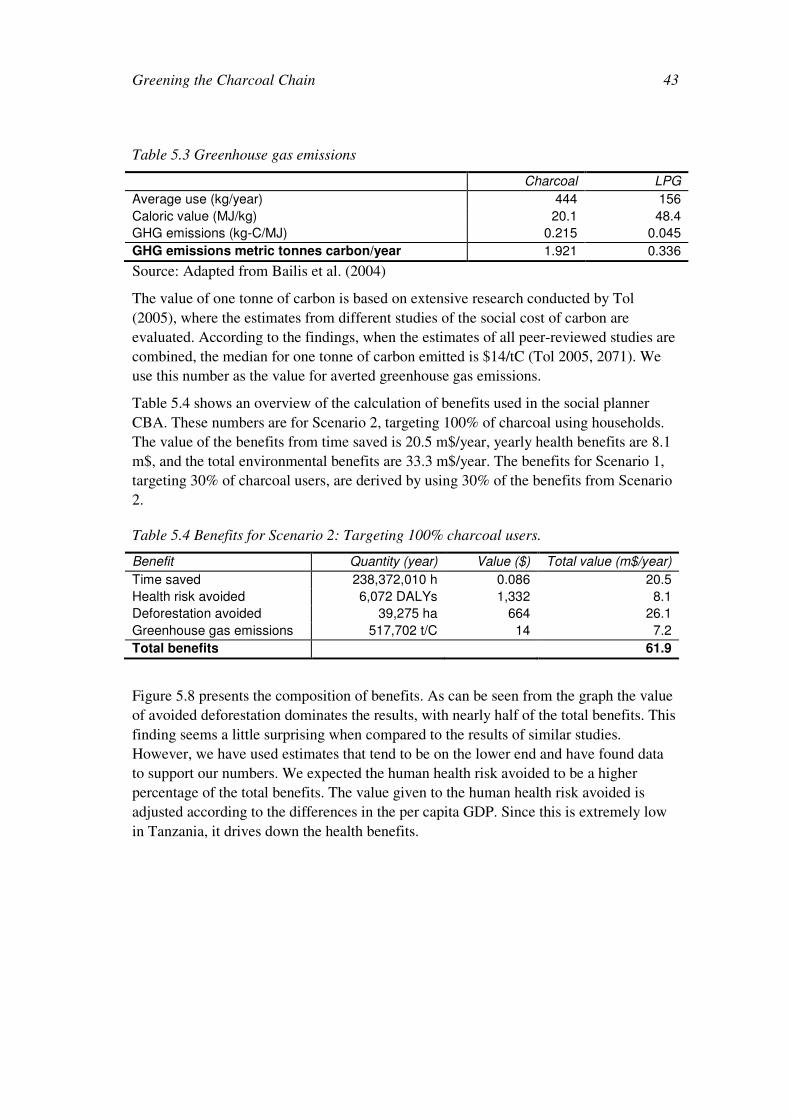
Greening the Charcoal Chain
43
Table 5.3 Greenhouse gas emissions
Charcoal LPG
Average use (kg/year) 444 156
Caloric value (MJ/kg) 20.1 48.4
GHG emissions (kg-C/MJ) 0.215 0.045
GHG emissions metric tonnes carbon/year 1.921 0.336
Source: Adapted from Bailis et al. (2004)
The value of one tonne of carbon is based on extensive research conducted by Tol
(2005), where the estimates from different studies of the social cost of carbon are
evaluated. According to the findings, when the estimates of all peer-reviewed studies are
combined, the median for one tonne of carbon emitted is $14/tC (Tol 2005, 2071). We
use this number as the value for averted greenhouse gas emissions.
Table 5.4 shows an overview of the calculation of benefits used in the social planner
CBA. These numbers are for Scenario 2, targeting 100% of charcoal using households.
The value of the benefits from time saved is 20.5 m$/year, yearly health benefits are 8.1
m$, and the total environmental benefits are 33.3 m$/year. The benefits for Scenario 1,
targeting 30% of charcoal users, are derived by using 30% of the benefits from Scenario
2.
Table 5.4 Benefits for Scenario 2: Targeting 100% charcoal users.
Benefit Quantity (year) Value ($) Total value (m$/year)
Time saved 238,372,010 h 0.086 20.5
Health risk avoided 6,072 DALYs 1,332 8.1
Deforestation avoided 39,275 ha 664 26.1
Greenhouse gas emissions 517,702 t/C 14 7.2
Total benefits 61.9
Figure 5.8 presents the composition of benefits. As can be seen from the graph the value
of avoided deforestation dominates the results, with nearly half of the total benefits. This
finding seems a little surprising when compared to the results of similar studies.
However, we have used estimates that tend to be on the lower end and have found data
to support our numbers. We expected the human health risk avoided to be a higher
percentage of the total benefits. The value given to the human health risk avoided is
adjusted according to the differences in the per capita GDP. Since this is extremely low
in Tanzania, it drives down the health benefits.
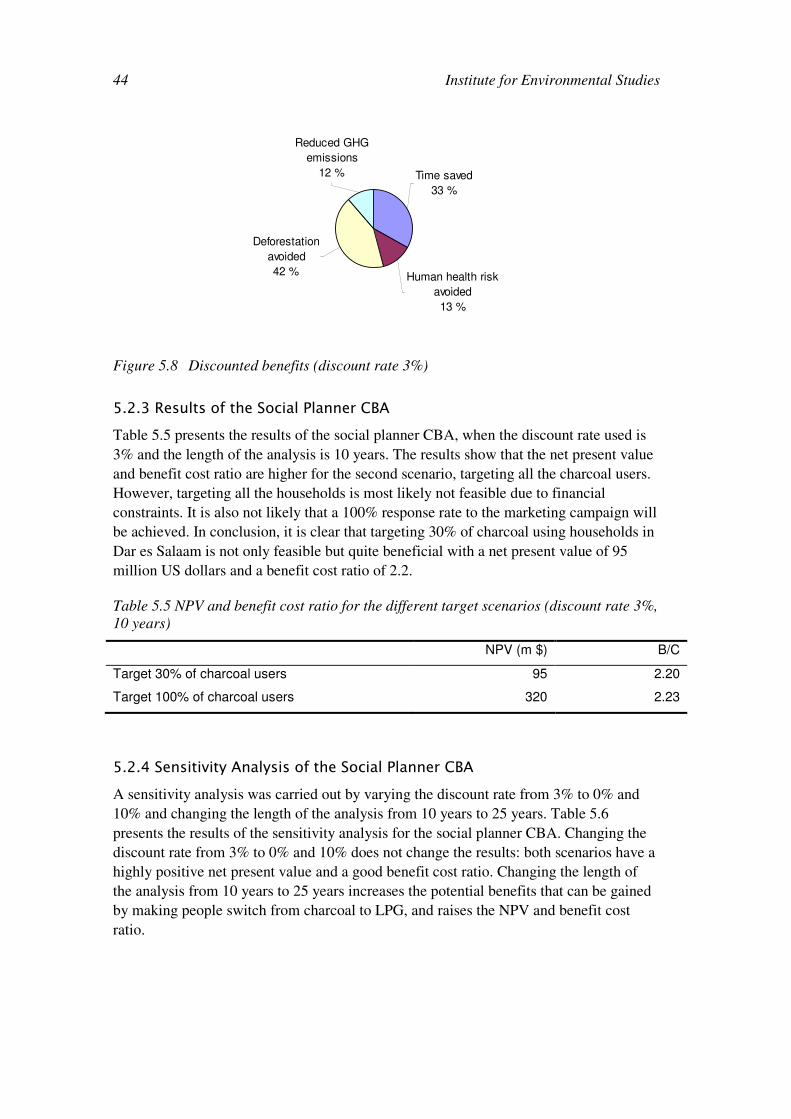
Institute for Environmental Studies 44
Reduced GHG
emissions
12 %
Deforestation
avoided
42 % Human health risk
avoided
13 %
Time saved
33 %
Figure 5.8 Discounted benefits (discount rate 3%)
5.2.3 Results of the Social Planner CBA
Table 5.5 presents the results of the social planner CBA, when the discount rate used is
3% and the length of the analysis is 10 years. The results show that the net present value
and benefit cost ratio are higher for the second scenario, targeting all the charcoal users.
However, targeting all the households is most likely not feasible due to financial
constraints. It is also not likely that a 100% response rate to the marketing campaign will
be achieved. In conclusion, it is clear that targeting 30% of charcoal using households in
Dar es Salaam is not only feasible but quite beneficial with a net present value of 95
million US dollars and a benefit cost ratio of 2.2.
Table 5.5 NPV and benefit cost ratio for the different target scenarios (discount rate 3%,
10 years)
NPV (m $) B/C
Target 30% of charcoal users 95 2.20
Target 100% of charcoal users 320 2.23
5.2.4 Sensitivity Analysis of the Social Planner CBA
A sensitivity analysis was carried out by varying the discount rate from 3% to 0% and
10% and changing the length of the analysis from 10 years to 25 years. Table 5.6
presents the results of the sensitivity analysis for the social planner CBA. Changing the
discount rate from 3% to 0% and 10% does not change the results: both scenarios have a
highly positive net present value and a good benefit cost ratio. Changing the length of
the analysis from 10 years to 25 years increases the potential benefits that can be gained
by making people switch from charcoal to LPG, and raises the NPV and benefit cost
ratio.
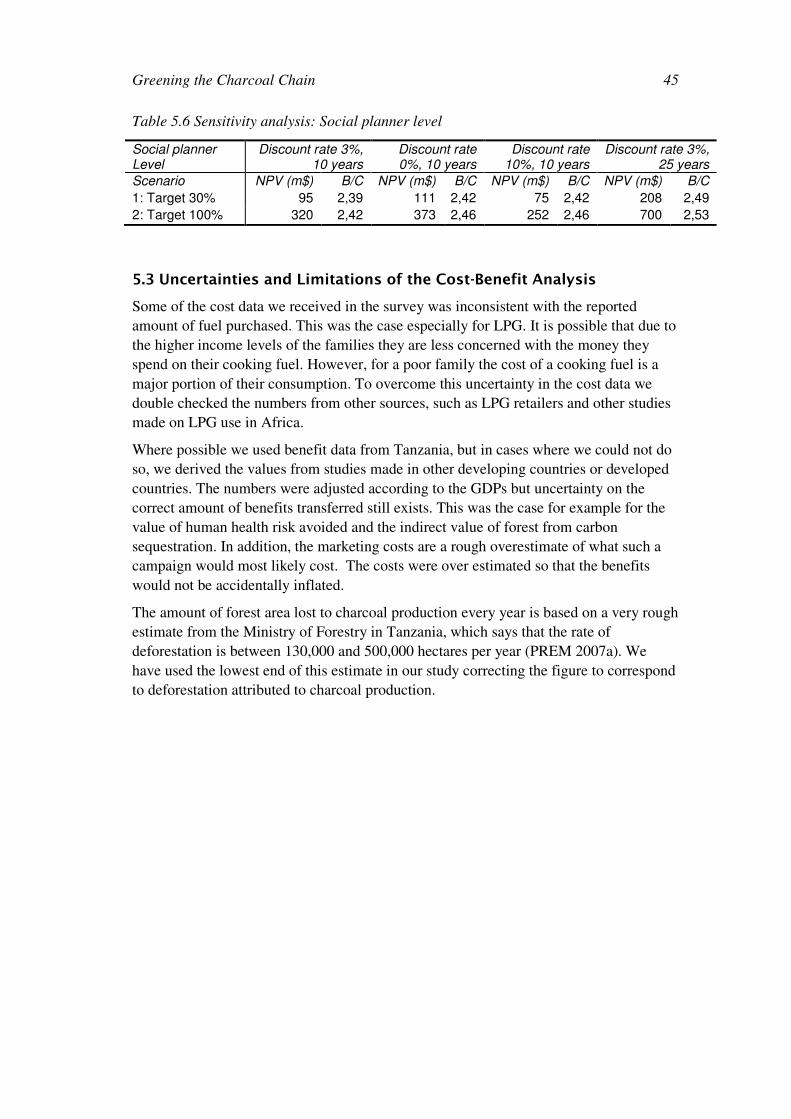
Greening the Charcoal Chain
45
Table 5.6 Sensitivity analysis: Social planner level
Social planner Level
Discount rate 3%, 10 years
Discount rate 0%, 10 years
Discount rate 10%, 10 years
Discount rate 3%, 25 years
Scenario NPV (m$) B/C NPV (m$) B/C NPV (m$) B/C NPV (m$) B/C
1: Target 30% 95 2,39 111 2,42 75 2,42 208 2,49
2: Target 100% 320 2,42 373 2,46 252 2,46 700 2,53
5.3 Uncertainties and Limitations of the Cost-Benefit Analysis
Some of the cost data we received in the survey was inconsistent with the reported
amount of fuel purchased. This was the case especially for LPG. It is possible that due to
the higher income levels of the families they are less concerned with the money they
spend on their cooking fuel. However, for a poor family the cost of a cooking fuel is a
major portion of their consumption. To overcome this uncertainty in the cost data we
double checked the numbers from other sources, such as LPG retailers and other studies
made on LPG use in Africa.
Where possible we used benefit data from Tanzania, but in cases where we could not do
so, we derived the values from studies made in other developing countries or developed
countries. The numbers were adjusted according to the GDPs but uncertainty on the
correct amount of benefits transferred still exists. This was the case for example for the
value of human health risk avoided and the indirect value of forest from carbon
sequestration. In addition, the marketing costs are a rough overestimate of what such a
campaign would most likely cost. The costs were over estimated so that the benefits
would not be accidentally inflated.
The amount of forest area lost to charcoal production every year is based on a very rough
estimate from the Ministry of Forestry in Tanzania, which says that the rate of
deforestation is between 130,000 and 500,000 hectares per year (PREM 2007a). We
have used the lowest end of this estimate in our study correcting the figure to correspond
to deforestation attributed to charcoal production.

Greening the Charcoal Chain
47
6. Conclusions and Recommendations
In this final chapter we will make conclusions based upon the research that we have
detailed in this report. After making conclusions concerning what our research has
illustrated about the fuel substitution issue in Dar es Salaam, we will make some
recommendations. Recommendations based directly on our research, as well as some
general recommendations for improving the sustainability of the charcoal chain will be
presented.
6.1 Conclusions
A survey of 235 households in Dar es Salaam has given insight into the cooking fuel
choices of citizens. We have discovered that while people do understand the
environmental consequences of charcoal production they continue to use it because they
believe it is less expensive and easier to use than the alternatives. While a small
percentage of people do cite cost as a reason not to switch to a modern fuel, such as
LPG, the most often cited reason for not switching to LPG is its perceived lack of safety.
This could mean that allaying such fears could cause an increase in LPG users.
In this study, we have compared the use of five fuels and performed a cost-benefit
analysis on two levels. We used the results of our survey to gain insight into the habits
of different fuel users, and this data was used to generate the two CBAs. The survey
showed that firewood is used by the poorest in society and we have concluded that its
use will continue. Though firewood is less expensive than charcoal, its health and
environmental effects are the same as, if not worse than charcoal, therefore it is not a
desirable alternative. Kerosene is used by the smallest families and does not have the
capabilities to replace charcoal. The results of the household level CBA show that
electricity and LPG are the only two fuels with positive Net Present Values. Because of
this, they are the only two acceptable alternatives to charcoal.
Electricity and LPG are capable of replacing charcoal and both are desirable alternatives
in terms of the environment and health effects, as well as time saved. However, the high
cost of electricity makes LPG the clear winner. The price difference between LPG and
charcoal, while significant for some of the population, can be overcome for
approximately 30% of the population. This 30% could even be higher at this point due
to the government’s recent abolition (after the survey was taken) of the import and VAT
on LPG which will close the price gap between the two fuels even more. We checked to
see how sensitive our analysis is to the price of LPG and of course we found that the
decrease in taxes only makes LPG more desirable.
To examine the benefits of targeting the 30% of charcoal users that have the same
income levels as LPG users, we did a social level CBA, in which we examined two
scenarios. The two scenarios were compared to a baseline scenario where households
continue to use their current fuels. The first scenario to be compared is one in which
30% of the targeted charcoal using population respond to an extensive LPG marketing
Institute for Environmental Studies 48
campaign. The second scenario is one in which 100% of the targeted charcoal using
population responds to said campaign.
Both scenarios have a promising benefit-cost ratio, and both have positive Net Present
Values. Though the NPV for the second scenario, in which 100% of the targeted
charcoal users respond, is significantly higher than the first scenario, we conclude that
realization of the second scenario is unrealistic. Due to the great positive benefits of the
first scenario and the feasibility of this scenario we recommend that it be pursued in
reality.
6.2 Recommendations
The following section will elaborate on recommendations we can make based on our
field research as well as our literature review.
Marketing Campaign
We suggest that 30% of charcoal users be targeted with an extensive marketing
campaign by Oryx. Emphasizing the safety and time saving abilities of LPG in
television and radio ads, billboards, and even demonstrations will aid in the substitution
of charcoal and eventually slow down the high rate of deforestation that is plaguing the
nation.
Legislate LPG Safety Regulations
To aid Oryx in convincing the population that LPG is safe to use it would be beneficial
for the government to pass safety regulating laws for LPG equipment. Publicizing the
existence and enforcement of these laws would increase the speed with which people
believe in the safety of using LPG, and therefore increase the speed with which they
switch to LPG.
Further Recommendations
Of course, 30% of the charcoal users switching to LPG means that there is still 70% that
have not switched. We expect that if a significant number of people do start using LPG
(for example the targeted 30%) the price of LPG will go down, availability will go up,
and more people will be talking about it and recommending it to friends and family. In
this way, the percentage of people using LPG will go up and the percentage of people
using charcoal will go down. . The hope is that a significant decrease in charcoal usage
will improve the sustainability of the industry and will lift the burden from the natural
forests that are so important to the local eco-system.
However, just as a small percentage of people have continued to use firewood, it is
expected that charcoal will also continue to play a role in Tanzanian households.
Because of its continued role more will have to be done to increase the sustainability of
the charcoal chain itself. Such improvements could be improving charcoal kiln
efficiency, improving charcoal stove efficiency, creating production forests from
which charcoal will be made, working to find alternative livelihoods for charcoal
producers, using payments for environmental services (PES), improving the
Greening the Charcoal Chain
49
charcoal taxing system so that it is more effective, and earmarking taxes from
charcoal for monitoring forests and implementing sustainable forestry practices.
There are many options for improving the sustainability of the charcoal chain. In this
study we have shown that fuel substitution is a viable option that can be implemented in
the near future. Our research has shown that a significant portion of the population of
Dar es Salaam can be convinced to start using LPG. This shift must be accompanied by
improvements in the sustainability of the charcoal chain itself. Here we have listed
many of the options available. If the relevant stakeholders take action as we have
suggested, the rapid destruction of one of Tanzania’s finest resources will be slowed if
not stopped and the forests will be preserved for future generations.
In their natural condition, or under wise management...these forests would be a never failing
fountain of wealth and beauty.
~John Muir~
Institute for Environmental Studies 50
References
Arnold, J.E. Michael, Gunnar Köhlin, Reidear Persson. Woodfuels, Livelihoods and Policy In terventions: Changing Perspectives. 2006. World Development Vol. 34, No. 3, pp. 596–611, Elsevier Ltd.
Bailis, Robert; David Pennise, Majid Ezzati, Daniel M. Kammen, & Evans Kituyi. (2004)
Impacts of Greenhouse Gas and Particulate Emissions from Wood Fuel Production and End-
use in Sub-Saharan Africa. http://rael.berkeley.edu/old-site/OA5.1.pdf 15 June 2007.
Bhagavan, M.R. Some Public Benefit Policy Aspects in Reforming the Power Sectors in East and
Southern Africa. (2003). Stockholm Environment Institute (SEI). SEI Climate and Energy
Programme Report 2004-03.
Bowland, Bradley J. & John C. Beghin. (2001). Robust Estimates of Value of a Statistical life for
Developing Economies. Journal of Policy Modelling, No. 23, pp. 385-396.
Census (2006) Population and housing Census (2002). National Bureau of Statistics. Ministry of
Planning, Economy and Empowerment, Dar es Salaam.
Costanza, Robert et al. (1997). The Value of the World’s Ecosystem Services and Natural
Capital. Nature,387, 253-260.
D’Sa, Antonette and K.V. Narasimha Murthy. (2004). Report on the Use of LPG as a Domestic
Cooking Fuel Option in India. International Energy Initiative, Bangalore.
Dang, Himraj. (1993). Fuel Substitution in Sub-Saharan Africa. Environmental
Management Vol. 17, No. 3, 283-288. Springer-Verlang Inc., New York.
Dar es Salaam City Council (2004). Dar es Salaam city profile. United Republic of Tanzania.
Edwards, Rufus D.; Kirk D. Smith, Junfeng Zhang, & Yuqing Ma (2004). Implications of
Changes in Household Stoves and Fuel Use in China. Energy Policy 32, 395-411.
Food and Agriculture Organization of the United Nations. (1993). Patterns of Commercial
Woodfuel Supply, Distribution and Use in the City and Province of CEBU, Philippines.
Regional Wood Energy Development Programme in Asia.
Habermel, Helga (2007). Economic Evaluation of the Improved Household Cooking Stove
Dissemination Programme in Uganda. Deutsche Gesellschaft für Technische
Zusammenarbeit (GTZ).
Hoogeveen, Hans. Interview. 3 May 2007. The World Bank, Dar es Salaam. Interviewers:
Sarianne Palmula & Michelle T. Beaudin.
Greening the Charcoal Chain
51
Hosier, R.H. and W. Kipondya. Urban Household Energy Use in Tanzania: Prices, Substitutes
and Poverty. Stockholm Environment and Tanzanian Institute and Ministry of Water,
Energy and Minerals. 1993. Butterworth-Heinemann Ltd.
IMF (2007). International Monetary Fund. World economic outlook.
http://www.econstats.com/weo/index_glweo.htm
Lvovsky, Kseniy, Gordon Hughes, David Maddison, Bart Ostro & David Pearce (2000).
Environmental Costs of Fossil Fuels. A Rapid Assessment Method with Application to Six
Cities. Pollution Management Series, World Bank Environment Department.
Malimbwi, R.E. (2001). Final report Charcoal Potential in Southern Africa (CHAPOSA): Final
Report for Tanzania. Stockholm Environment Institute (SEI).
Massey, Eric E. and Sabina Di Prima. (2005). The Demand for Charcoal in Dar es Salaam
Tanzania: An economic and environmental assessment. PREM. Institute for Environmental
Studies. Vrije Universiteit Amsterdam.
Meghji, Zakia Hamdani. 14 June 2007. Speech by the Minister of Finance. Introducing
to the National Assembly, The Estimates of Government Revenue and Expenditure
Financial Year 2007/2008.
Mehta, Sumi & Cyrus Shahpar (2004). The Health Benefits of Interventions to Reduce
Indoor Air Pollution from Solid Fuel Use: A Cost-Effectiveness Analysis. Energy for
Sustainable Development, Vol. 8 (3), pp. 53-59.
Muhama, Wema. 2 May 2007. Interview. Oryx, Dar es Salaam. Interviewers: Sarianne Palmula
& Michelle T. Beaudin.
Norconsult (2002) The True Cost of Charcoal, Norconsult Ltd., May 2002.
Pearce, David (2001). The Economic Value of Forest Ecosystems. Ecosystem Health,
Vol. 7 (4), 284-296.
Pearce, David & Phoebe Koundouri (2004). Regulatory Assessment for Chemicals: A Rapid
Appraisal Cost-Benefit Approach. Environmental Science and Policy, 7, 435-449.
PREM (2007). Chained to Charcoal: The Market for Forest Fuels in Tanzania. Policy Brief.
No.16. March 2007.
PREM (2007a). Optimization of the Charcoal Chain in Tanzania: A Gap Analysis. Institute for
Environmental Studies, Vrije Universiteit Amsterdam.
Institute for Environmental Studies 52
Reddy, Amulya K.N. and B. Sudhakara Reddy. Substitution of Energy Carriers for Cooking in
Bangalore. (1993). Department of Management Studies, Indian Institute of Science,
Bangalore India.
Sanga, Godfrey A. (Coordinator Monitoring & Evaluation TaTEDO). Cooking Energy in
Tanzania: Fuel Substitution and Improvement of Energy Efficiency. (2005) A contribution
to the dialogue between EU and Africa framework of the EU Energy Initiative – EUEI.
‘Partners for Africa’ Policy Dialogue Conference, 22-24 June 2005, Dar es Salaam,
Tanzania.
Sawe, E.N. (2005). Rural Energy and Stoves Development in Tanzania: Experiences, Barriers
and Strategies. TaTEDO.
Schramm, Gunter. Managing Urban/Industrial Wood Fuel Supply and Demand in Africa. (1987)
The World Bank. Washington DC.
Smith, Kirk R.; Jamesine Rogers & Shannon C. Cowlin, (2005). Household Fuels and Ill-health
in Developing Countries: What Improvements Can Be Brought by LP Gas? World LP Gas
Association .
Smith, Kirk R. et al. (2000). Greenhouse Implications of Household Stoves: An Analysis from
India. Ann. Rev. Energy Environmental 25, 741-763.
Stockholm Environment Institute (Arvidson et al.). (1999). Energy Interventions and Poverty
Alleviation: Strengthening the linkages.
Sumbi, Peter. 27 April 2007. Interview. World Wildlife Federation, Dar es Salaam.
Interviewers: Sarianne Palmula & Michelle T. Beaudin
TANESCO. (2007). History. http://www.tanesco.com/ . 11 June 2007.
Tanzania Association of Oil Marketing Companies (LPG Committee). (2001). The LP Gas
Market in Tanzania.
TaTEDO. (2004). Supply/Demand Chain Analysis of Charcoal/Firewood in Dar es Salaam and
Coast Region and Differentiation of Target Groups. Prepared by Napendaeli Sem.
Tol, Richard. (2005). The marginal damage costs of carbon dioxide emissions: an assessment of
the uncertainties. Energy Policy 33, 2064-2074.
Turpie, Jane K. (2000). The use and value of natural resources of the Rufiji floodplain and delta,
Rufiji District , Tanzania. Rufiji Environmental Management Project, Dar es Salaam.
Technical Report No. 17.
Greening the Charcoal Chain
53
United Nations Development Programme (UNDP) and Deutsche Gesellschaft für Technische
Zusammenarbeit (GTZ). Scaling up Modern Energy Services in East Africa: To alleviate
poverty and meet the Millennium Development Goals. (2005).
United Nations Development Programme in Ghana. Environment and Energy: Liquefied
Petroleum Gas (LPG) Substitution for Wood Fuel in Ghana – Opportunities and Challenges.
(2004).
WHO. (2006). World Health Organization. Fuel for life: household energy and health.
WHO (2007). World Health Organization. Indoor air pollution: national burden of disease
estimates.
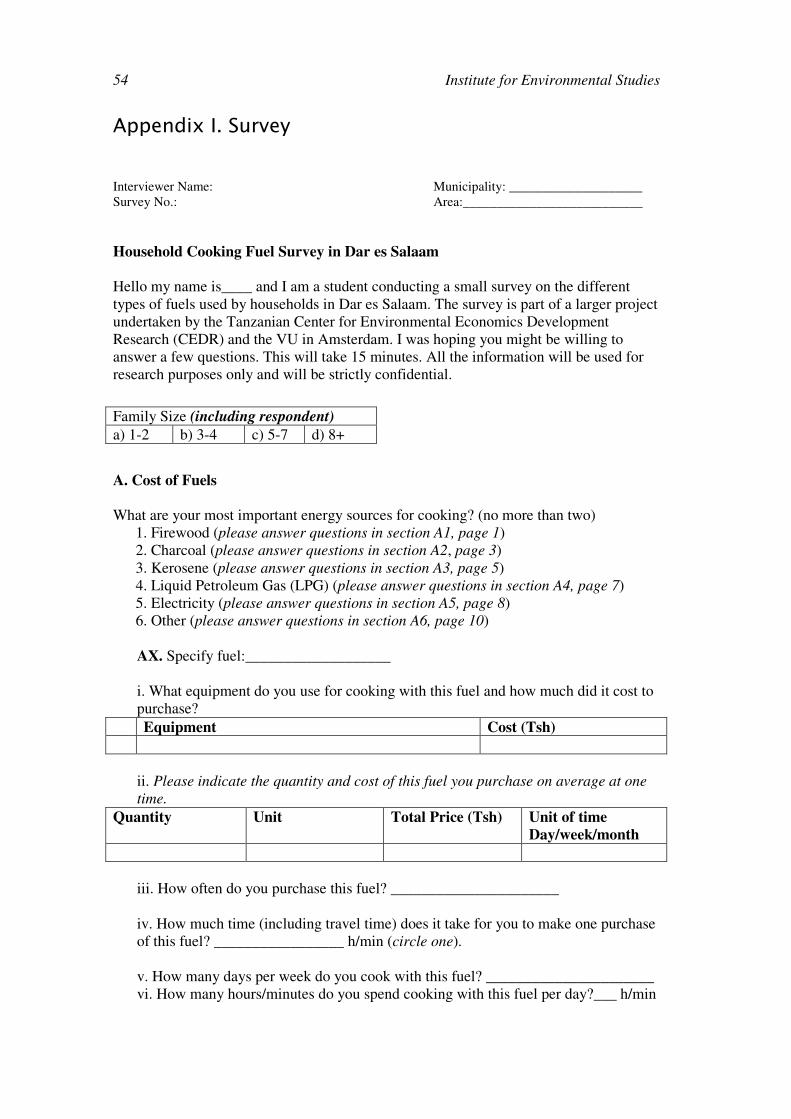
Institute for Environmental Studies 54
Appendix I. Survey
Interviewer Name: Municipality: ____________________ Survey No.: Area:___________________________
Household Cooking Fuel Survey in Dar es Salaam
Hello my name is____ and I am a student conducting a small survey on the different types of fuels used by households in Dar es Salaam. The survey is part of a larger project undertaken by the Tanzanian Center for Environmental Economics Development Research (CEDR) and the VU in Amsterdam. I was hoping you might be willing to answer a few questions. This will take 15 minutes. All the information will be used for research purposes only and will be strictly confidential.
A. Cost of Fuels What are your most important energy sources for cooking? (no more than two) 1. Firewood (please answer questions in section A1, page 1) 2. Charcoal (please answer questions in section A2, page 3) 3. Kerosene (please answer questions in section A3, page 5) 4. Liquid Petroleum Gas (LPG) (please answer questions in section A4, page 7) 5. Electricity (please answer questions in section A5, page 8) 6. Other (please answer questions in section A6, page 10)
AX. Specify fuel:___________________ i. What equipment do you use for cooking with this fuel and how much did it cost to purchase?
Equipment Cost (Tsh)
ii. Please indicate the quantity and cost of this fuel you purchase on average at one
time.
Quantity Unit Total Price (Tsh) Unit of time
Day/week/month
iii. How often do you purchase this fuel? ______________________ iv. How much time (including travel time) does it take for you to make one purchase of this fuel? _________________ h/min (circle one). v. How many days per week do you cook with this fuel? ______________________ vi. How many hours/minutes do you spend cooking with this fuel per day?___ h/min
Family Size (including respondent)
a) 1-2 b) 3-4 c) 5-7 d) 8+
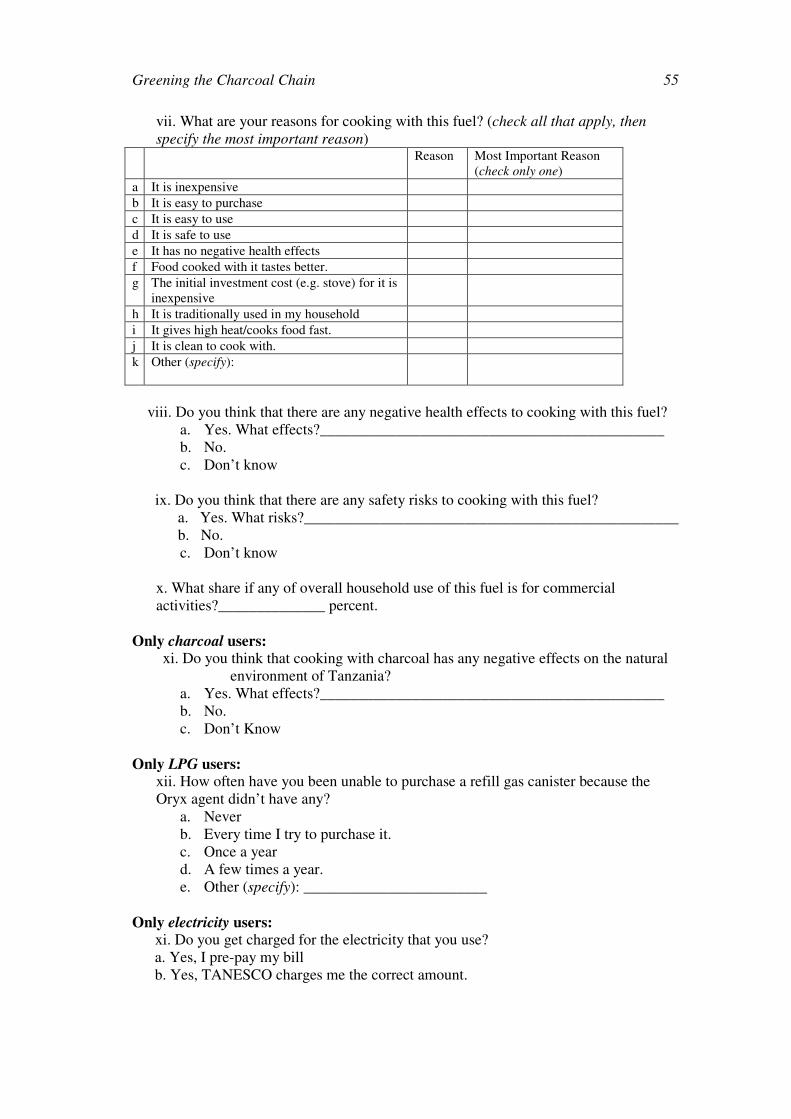
Greening the Charcoal Chain
55
vii. What are your reasons for cooking with this fuel? (check all that apply, then
specify the most important reason) Reason Most Important Reason
(check only one)
a It is inexpensive
b It is easy to purchase
c It is easy to use
d It is safe to use
e It has no negative health effects
f Food cooked with it tastes better.
g The initial investment cost (e.g. stove) for it is inexpensive
h It is traditionally used in my household
i It gives high heat/cooks food fast.
j It is clean to cook with.
k Other (specify):
viii. Do you think that there are any negative health effects to cooking with this fuel?
a. Yes. What effects?_____________________________________________ b. No. c. Don’t know
ix. Do you think that there are any safety risks to cooking with this fuel? a. Yes. What risks?_________________________________________________ b. No.
c. Don’t know
x. What share if any of overall household use of this fuel is for commercial activities?______________ percent.
Only charcoal users: xi. Do you think that cooking with charcoal has any negative effects on the natural environment of Tanzania?
a. Yes. What effects?_____________________________________________ b. No. c. Don’t Know
Only LPG users:
xii. How often have you been unable to purchase a refill gas canister because the Oryx agent didn’t have any?
a. Never b. Every time I try to purchase it. c. Once a year d. A few times a year. e. Other (specify): ________________________
Only electricity users:
xi. Do you get charged for the electricity that you use? a. Yes, I pre-pay my bill b. Yes, TANESCO charges me the correct amount.
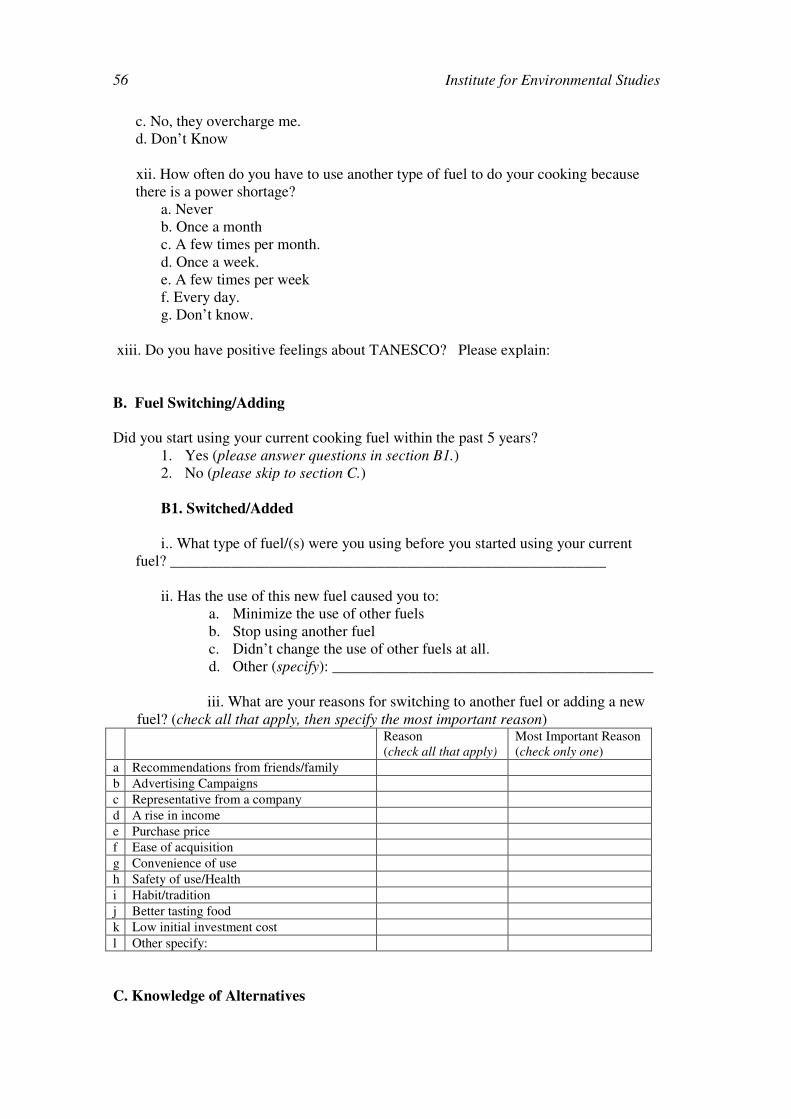
Institute for Environmental Studies 56
c. No, they overcharge me. d. Don’t Know xii. How often do you have to use another type of fuel to do your cooking because there is a power shortage?
a. Never b. Once a month c. A few times per month. d. Once a week. e. A few times per week f. Every day. g. Don’t know.
xiii. Do you have positive feelings about TANESCO? Please explain:
B. Fuel Switching/Adding
Did you start using your current cooking fuel within the past 5 years?
1. Yes (please answer questions in section B1.) 2. No (please skip to section C.) B1. Switched/Added i.. What type of fuel/(s) were you using before you started using your current
fuel? _________________________________________________________ ii. Has the use of this new fuel caused you to:
a. Minimize the use of other fuels b. Stop using another fuel c. Didn’t change the use of other fuels at all. d. Other (specify): __________________________________________
iii. What are your reasons for switching to another fuel or adding a new fuel? (check all that apply, then specify the most important reason)
Reason (check all that apply)
Most Important Reason (check only one)
a Recommendations from friends/family
b Advertising Campaigns
c Representative from a company
d A rise in income
e Purchase price
f Ease of acquisition
g Convenience of use
h Safety of use/Health
i Habit/tradition
j Better tasting food
k Low initial investment cost
l Other specify:
C. Knowledge of Alternatives
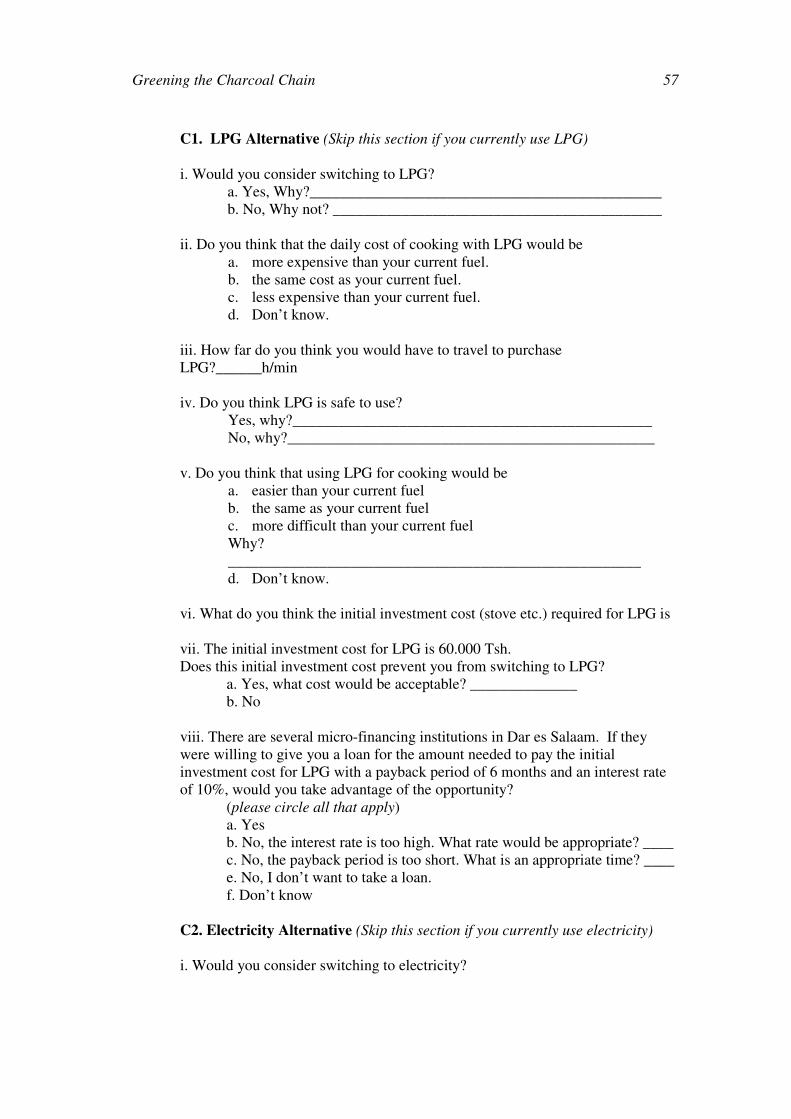
Greening the Charcoal Chain
57
C1. LPG Alternative (Skip this section if you currently use LPG)
i. Would you consider switching to LPG?
a. Yes, Why?______________________________________________ b. No, Why not? ___________________________________________
ii. Do you think that the daily cost of cooking with LPG would be a. more expensive than your current fuel. b. the same cost as your current fuel. c. less expensive than your current fuel. d. Don’t know.
iii. How far do you think you would have to travel to purchase LPG?______h/min iv. Do you think LPG is safe to use?
Yes, why?_______________________________________________ No, why?________________________________________________
v. Do you think that using LPG for cooking would be
a. easier than your current fuel b. the same as your current fuel c. more difficult than your current fuel Why? ______________________________________________________ d. Don’t know.
vi. What do you think the initial investment cost (stove etc.) required for LPG is vii. The initial investment cost for LPG is 60.000 Tsh. Does this initial investment cost prevent you from switching to LPG? a. Yes, what cost would be acceptable? ______________ b. No
viii. There are several micro-financing institutions in Dar es Salaam. If they were willing to give you a loan for the amount needed to pay the initial investment cost for LPG with a payback period of 6 months and an interest rate of 10%, would you take advantage of the opportunity? (please circle all that apply) a. Yes b. No, the interest rate is too high. What rate would be appropriate? ____ c. No, the payback period is too short. What is an appropriate time? ____ e. No, I don’t want to take a loan. f. Don’t know C2. Electricity Alternative (Skip this section if you currently use electricity)
i. Would you consider switching to electricity?
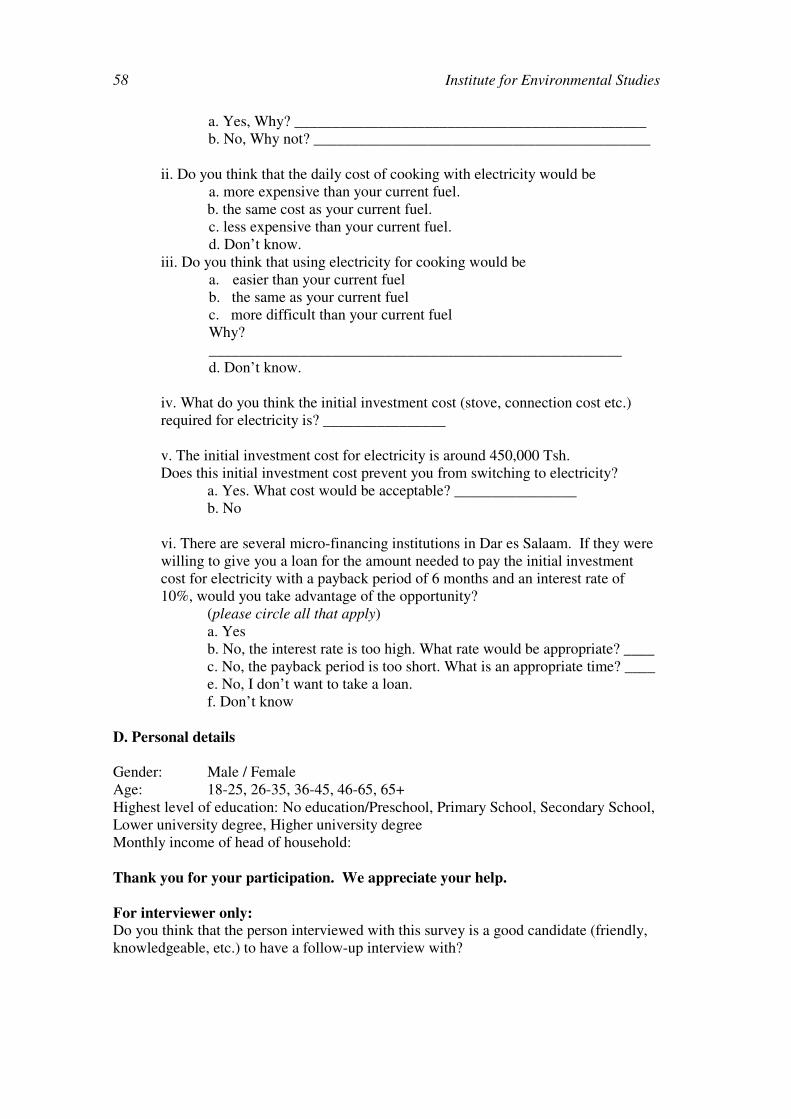
Institute for Environmental Studies 58
a. Yes, Why? ______________________________________________ b. No, Why not? ____________________________________________
ii. Do you think that the daily cost of cooking with electricity would be
a. more expensive than your current fuel. b. the same cost as your current fuel.
c. less expensive than your current fuel. d. Don’t know.
iii. Do you think that using electricity for cooking would be a. easier than your current fuel b. the same as your current fuel c. more difficult than your current fuel Why? ______________________________________________________ d. Don’t know.
iv. What do you think the initial investment cost (stove, connection cost etc.) required for electricity is? ________________
v. The initial investment cost for electricity is around 450,000 Tsh. Does this initial investment cost prevent you from switching to electricity? a. Yes. What cost would be acceptable? ________________ b. No vi. There are several micro-financing institutions in Dar es Salaam. If they were willing to give you a loan for the amount needed to pay the initial investment cost for electricity with a payback period of 6 months and an interest rate of 10%, would you take advantage of the opportunity? (please circle all that apply) a. Yes b. No, the interest rate is too high. What rate would be appropriate? ____ c. No, the payback period is too short. What is an appropriate time? ____ e. No, I don’t want to take a loan. f. Don’t know
D. Personal details
Gender: Male / Female Age: 18-25, 26-35, 36-45, 46-65, 65+ Highest level of education: No education/Preschool, Primary School, Secondary School, Lower university degree, Higher university degree Monthly income of head of household: Thank you for your participation. We appreciate your help.
For interviewer only: Do you think that the person interviewed with this survey is a good candidate (friendly, knowledgeable, etc.) to have a follow-up interview with?

Greening the Charcoal Chain
59


![Tanzania's Precious Minerals Boom: Issues In Mining …. Haji Semboja [ hsemboja@esrf.or.tz], ... Godius Kahyarara, Economic and Social Research Foundation and Peter C. Keller, The](https://img.pdfslide.us/doc/110x75/5b46a80a7f8b9af5078b9874/tanzanias-precious-minerals-boom-issues-in-mining-haji-semboja-hsembojaesrfortz.jpg)