Embed Size (px)
Citation preview

General rights Copyright and moral rights for the publications made accessible in the public portal are retained by the authors and/or other copyright owners and it is a condition of accessing publications that users recognise and abide by the legal requirements associated with these rights.
Users may download and print one copy of any publication from the public portal for the purpose of private study or research.
You may not further distribute the material or use it for any profit-making activity or commercial gain
You may freely distribute the URL identifying the publication in the public portal If you believe that this document breaches copyright please contact us providing details, and we will remove access to the work immediately and investigate your claim.
Downloaded from orbit.dtu.dk on: Dec 01, 2021
Greenhouse gas reductions through enhanced use of residues in the life cycle ofMalaysian palm oil derived biodiesel
Hansen, Sune Balle; Olsen, Stig Irving; Ujang, Zaini
Published in:Bioresource Technology
Link to article, DOI:10.1016/j.biortech.2011.10.069
Publication date:2012
Link back to DTU Orbit
Citation (APA):Hansen, S. B., Olsen, S. I., & Ujang, Z. (2012). Greenhouse gas reductions through enhanced use of residues inthe life cycle of Malaysian palm oil derived biodiesel. Bioresource Technology, 104, 358-366.https://doi.org/10.1016/j.biortech.2011.10.069
1
Greenhouse Gas Reductions through Enhanced Use of Residues in the Life Cycle of Malaysian Palm Oil derived Biodiesel Sune Balle Hansena,b*
, Stig Irving Olsena, Zaini Ujangc
a DTU Management Engineering, Technical University of Denmark, Produktionstorvet building 424, 2800 Kgs. Lyngby, Denmark b UTM Razak school of Engineering and Advanced Technologies, University of Technology Malaysia, KL International Campus, Jalan Semarak, 50300 Kuala Lumpur, Selangor, Malaysia c Office of the Vice-Chancellor, University of Technology Malaysia, 81310 Skudai, Johor, Malaysia
Abstract
This study identifies the potential greenhouse gas (GHG) reductions, which can be achieved by optimizing the use of residues in the life cycle of palm oil derived biodiesel. This is done through compilation of data on existing and prospective treatment technologies as well as practical experiments on methane potentials from empty fruit bunches. Methane capture from the anaerobic digestion of palm oil mill effluent was found to result in the highest GHG reductions. Among the solid residues, energy extraction from shells was found to constitute the biggest GHG savings per ton of residue, whereas energy extraction from empty fruit bunches was found to be the most significant in the biodiesel production life cycle. All the studied waste treatment technologies performed significantly better than the conventional practices and with dedicated efforts of optimized use in the palm oil industry, the production of palm oil derived biodiesel can be almost carbon neutral.
Keywords: Palm Oil, Waste Treatment, Life Cycle Assessment, Bioconversion, Thermochemical Conversion
1 Introduction
Palm oil is the biggest vegetable oil in the world with a 2009 market share of 31.7%, which increases to 35.4% with the inclusion of the co-product palm kernel oil (MPOB, 2010). In Malaysia oil palm plantations take up 14.3% of the total land area with an average and relatively constant growth rate of 3.9% from 2005 to 2009 (MPOB, 2010). The production of 17.6 million tons of crude palm oil (CPO) and 2.1 million ton crude palm kernel oil, CPKO, in 2009 (MPOB, 2010) makes the palm oil industry the fourth largest revenue sector in Malaysia in 2009 with a gross national income (GNI) contribution of USD 17 billion after oil and gas (USD 36 billion), financial services (19 billion) and wholesale and retail (19 billion) (PEMANDU, 2011). In 2009 Malaysia
* Corresponding Author. Tel: +60 12 219 9441 (Malaysia), +45 4525 4660 (Denmark) E-mail address: [email protected] (primary), [email protected] (secondary)
2
exported 227,457 tons palm oil derived biodiesel (MPOB, 2010). Apart from ensuring sustainable land use change, the use of residues for optimal environmental performance in the life cycle of palm oil biodiesel production is one of the most important criteria in ensuring sustainable palm oil.
The aim of this paper is to evaluate the significance of technological improvements on the greenhouse gas (GHG) balance in handling of residues from palm oil and biodiesel production compared to conventional practices. This is done through application of Life Cycle Assessment (LCA) tools. A brief background literature review is given in Appendix 1 of the Supplementary Data.
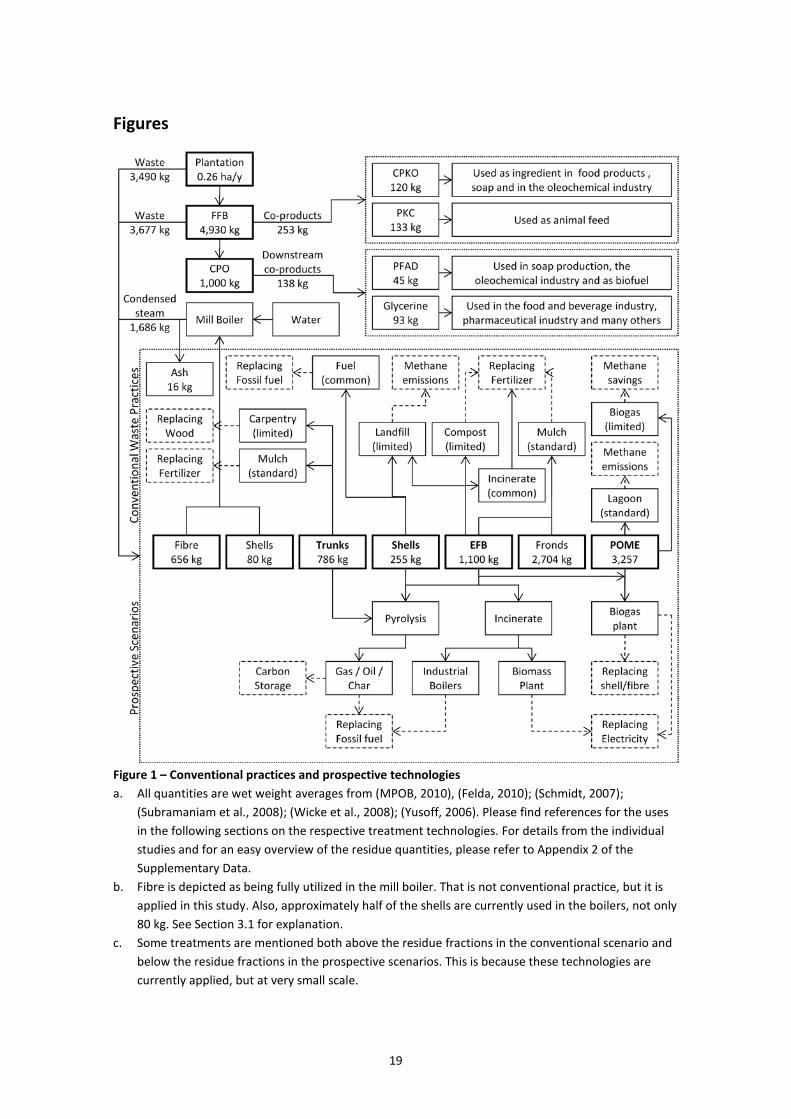
Among the various waste treatments available, this study focuses on technologies, which are available for full scale implementation and that provide energy recovery (electricity, steam etc.) or carbon sequestration. The chosen technologies, hereafter termed ‘prospective technologies’ are thus 1. Incineration with energy recovery, 2. Pyrolysis, 3. Biogas. As such it is not the aim to create a utopian best case scenario, but rather to assess the conventional residue use and disposal as well as realistic improvements to these conventional practices. A flow diagram identifying the conventional practices, prospective technologies and qualitative emissions/benefits of the various treatments is provided in Figure 1 in Section 3. It should be noted that all four technologies have already been implemented full scale in the Malaysian palm oil industry, but only in very few cases as of primo 2011. The conventional practices are not a worst case scenario. Except for the Palm Oil Mill Effluent, POME, all residues are generally used, thus creating very little actual waste through low-tech application. In a worst case scenario, all residues would be landfilled in open dump sites. The implementation of the prospective technologies is unlikely to be a best case scenario. It is likely that some residues can be refined to replace products, which are very energy intensive to produce and thus create larger GHG savings than the three relatively low-tech prospective technologies included in this study.
In order to quantify the scale of the benefits from residue utilization in relation to the overall GHG emissions from palm oil derived biodiesel, the GHG emissions/reductions from the conventional and prospective treatment technologies are identified and compared to life cycle emissions for palm oil derived biodiesel. A scenario of the conventional practices is created and compared to a scenario of prospective treatment technologies thus presenting the actual benefits of the prospective residue utilization. In order to assess the sensitivity and uncertainty of the findings, the results and assumptions for each treatment technology (conventional and prospective) and the full scenarios as well as worst and best case scenarios will be assessed and a potential bandwidth for GHG emissions/reductions will be established. The sensitivity for the prospective scenario is given special attention.
3
Capturing the vast amounts of methane from the anaerobic digestion of palm oil mill effluent (POME) through the construction of biogas plants is recognized as one of the most important environmental challenges in the production of palm oil. It is hypothesized that adding solid residues, e.g. from empty fruit bunches (EFB), to the POME would boost the methane production in the biogas plant thus allowing for increased electricity production from combustion of the methane in gas engines at little extra cost. Experimental studies of biogas production from EFB were performed to test this hypothesis.
To the knowledge of the authors, the present study is the first to attempt to quantify and compare GHG emissions/reductions of various palm oil waste treatment technologies in a life cycle perspective. Industry specific data for this kind of studies are sparse and to some extent inconsistent as of primo 2011. As such, this study should be seen as an introduction to life cycle assessments of waste treatment in the palm oil industry and a platform on which to extend further studies on the topic.
2 Materials and Methods
Data collection and generation for the study has been conducted through literature reviews, discussions with palm oil industries and research institutions and through experimental analysis in the case of biogas generation from EFB. The results focus quantitatively on greenhouse gas emissions with qualitative discussions on other impacts.
2.1 Life Cycle Assessment
The life cycle assessment methodology applied is in accordance with standardized practices in ISO 14040 and ISO 14044 as described in the ILCD Handbook (ILCD, 2010). When assessing the transformation of residues into a new product or energy it can be done through allocation or substitution (ILCD, 2010). Substitution is used in this paper. This study focuses on greenhouse gas emissions and savings for which the denominator is CO2-equivalents. One kg of methane corresponds to 25 kg CO2-equivalents (IPCC, 2006). Lower heating (net calorific) values (LHV) are used in the calculations as per IPCC guidelines (IPCC, 2006). When substituting e.g. coal fired in an industrial boiler with a waste product it is done on a MJ to MJ basis with a correction factor to adjust for possible pre-treatment of the residue, i.e. 1 MJ residue = 0.9 MJ coal. For transportation emission calculations, CO2 emissions per ton*km using a 22 ton truck (PE International, 2006a) are applied.
2.2 Data Collection
Data was collected mainly through literature studies for the various waste treatment technologies translated into life cycle data. Where possible, data is specific to palm oil
4
residues and based on experimental studies, however, for pyrolysis and gasification some generic data is included.
2.3 Experimental Set-up
This section provides an overview of the experimental set-up. A full description can be found in Appendix 2 in the Supplementary Data.
The experiments were designed to provide indications of the biogas potential in fibrous solid palm oil residues. The shredded EFB from a palm oil mill were digested in a batch process, fully mixed, 52°C thermophilic digester for 21 days at a loading of 5% w/w. On day one of the experiments, 200 g shredded EFB were added to 4 L thermophilic anaerobic bacteria solution in an insulated 5 L glass bottle. The bottle (hereafter ‘digester’) was sealed to allow only for a gas tube and a thermometer and placed on a combined heater/magnetic stirrer. Produced gas volumes were measured continuously and recorded daily to study degradation of the fibres as a function of the hydraulic retention time, which is crucial for estimating the potential loading of fibres into a full scale biogas plant. The methane content of the biogas was analysed twice weekly. After the 21 days the digester was opened and the digestate was analysed for nutrient values in order to assess its potential in application as a fertilizer.
3 Results and Discussions
This section quantifies the GHG emissions and savings from conventional waste treatments and prospective technologies. A summary of the potential GHG savings in relation to the life cycle emissions from palm oil derived biodiesel production is given along with a quantification of the GHG savings between a scenario of the conventional practices and a scenario of prospective waste treatment technologies. Figure 1 depicts the residue quantities along with conventional practices, prospective technologies and the liabilities/benefits. For the conventional practices it is indicated whether it is a standard, common or limited practice. The various current and potential utilization options for the palm residues have several varieties. In order to present a concise overview, some generalization and simplifications have been made in the following sections. These are dealt with in a quantitative uncertainty analysis in Appendix 7 in the Supplimentary Data and the calculated bandwidth of the GHG data for each treatment technology is presented in the respective sections. An overall sensitivity and uncertainty analysis for the scenarios is presented in Section 3.8.
3.1 Boiler Fuel
Palm oil mill boilers produce steam for sterilization and softening of the incoming fresh bruit bunches (FFB). The boilers are fired exclusively with press fibre and shells from the mill. The third solid residue from the mills, EFB, has high moisture content and is
5
not well suited as boiler fuel. Without sufficient amounts of fibres and shells available, the steam generation would have to be based on external, possibly fossil fuels. For environmental and economic reasons the availability of fibres and shells for other applications is thus limited due to onsite demand for steam generation. The average fuel ratio was approximately 60% fibre and 40% shells in the early 2000’s (Husain et al., 2002), but has changed to approximately 75% fibre and 25% shells (Subramaniam et al., 2008) and the trend is to utilize more fibre in the boilers and add shells as needed. There are mainly two drivers for this trend: 1. The shells produce undesirable black smoke with a lot of particulate matter and the palm oil mill boiler stacks do not have particle filters, 2. With their higher energy content (see Table 1) and density, the shells have a higher market value and lower transportation costs per energy unit and can be sold as boiler fuel to other industries. The 16 kg boiler ash generated per ton CPO can be used for various applications such as road filling, concrete production and adsorbent or as fertilizer in the plantations. This study assumes that the manner in which the boiler ash is used is of low significance relative to the other residues and the overall life cycle impacts for palm oil due to the small quantities, so further quantitative studies on ash are omitted from this paper.
3.1.1 GHG data for boil fuel
Assuming the above 75:25 fuel ratio; 170 kg shells and 520 kg fibres are used for steam generation per ton CPO (Subramaniam et al., 2008) resulting in an energy input to the boiler of 8.7 GJ/ton CPO. Thus, a total of 165 kg shells and 136 kg fibres are available for other uses. If the mills decide to use all their fibre in the boilers to make as much shell as possible available for revenue generation, they would on average need to supplement with 80 kg shells to meet the energy requirements, thus leaving 255 kg shells (75%) for other applications per ton of CPO. Assuming that 255 kg shells will be available for the prospective scenarios thus seems reasonable and the value is used in the following sections.
The mill boilers in Malaysia are generally inefficient as efficiency is not prioritized with the surplus availability of fibres and shells, which until recently did not have market value. The uncertainty analysis tests a 20% increase in boiler efficiency in the prospective scenario, which will make the fibre alone able to meet the energy requirements, thus making the remaining 80 kg shells available for other applications.
3.2 Mulch
All the fronds from the oil palms and some of the EFB from the mill are spread out between the oil palms as mulch to retain moisture in the soil and provide nutrients through the degradation of the organic matter. The practice has proven to improve the root proliferation and the yield of the oil palms. The total nutrient requirements at the oil palm plantations are on average 264, 30 and 395 kg/ha/year for N, P and K

6
respectively on coastal soils in Malaysia including losses due to leaching (Henson and Chang, 2007). It should, however, be noted that significant variations exist depending on soil type. The mulched fronds contribute 126, 12 and 158 kg/ha of N, P and K respectively (Henson and Chang, 2007). With 0.26 ha needed to produce 1 ton CPO per year, the remaining nutrient demands to be covered by EFB mulching and fertilizer translate to 36, 5 and 62 kg/ton CPO for N, P and K respectively. The available EFB will only be able to contribute 3, 1 and 16 kg/ton CPO of N, P and K based on the nutrient content presented in (Abdullah and Gerhauser, 2008). EFB may not be appropriate as a fertilizer on its own, but when used in combination with industrial fertilizer, approximately 15% increase in FFB yield has been demonstrated compared to fertilizer alone (Singh et al., 1989). Although this increase is very likely to depend on other factors such as soil type and general plantation management as well, 15% increase is used as an example in the following. However, approximately 150 kg EFB is required per palm to achieve the 15% increase (Singh et al., 1989) under controlled circumstances. This paper estimates app. 200 kg EFB per palm.
At replanting, the felled oil palm trunks are most often chipped and spread out as mulch or buried in the soil when the soil is tilled prior to planting of the new generation of oil palms. The trunks provide nutrients and carbon to the soil while degrading, however, the young palms can only utilize a fraction of the released nutrients, so most are leached to the groundwater. The method of burying the stems is thus convenient, but provides poor GHG reductions.
It is assumed that trucks bringing the FFB to the mill will bring back EFB instead of going back empty, so no transport emissions are allocated to EFB.
3.2.1 GHG data for mulching
The 200 kg EFB required per palm corresponds to over 7,500 kg EFB per ton CPO. Only 15% of this is available. The increase in production due to EFB mulching on a national level is thus 15% of 15%. The areas with EFB mulching will not need P and K fertilizer and only two thirds of the N fertilizer. Thus, fertilizer savings due to EFB mulching are 5% N, 15% P and 15% K. 2% higher yield translates to 2% less fertilizer per ton CPO, so the net fertilizer savings are thus 7% N, 17% P and 17% K on a national level assuming all EFB is used as mulch. Effectively 2.5 kg N, 0.8 kg P and 10 kg K are potentially substituted per ton CPO. Using the Ecoinvent database in LCA software Gabi (PE International, 2006b) to calculate CO2 emissions from fertilizer production gives a total saving of 14 kg CO2/ton CPO.
In accordance with the IPCC guidelines (IPCC, 2006), composting emits some methane as well as N2O, which makes it probable that mulching has similar emissions. IPCC (2006) provides emission ranges of 0.03-8 g CH4/kg wet waste, 4 being the default value and 0.06-0.6 g N2O/kg wet waste, 0.3 being the default value. As EFBs are not

7
dense and are spread in a single layer, thus minimizing anaerobic conditions and as EFB has a lower nitrogen content than assumed in the IPCC calculation and it is only slowly released during degradation, the low ends of the ranges are used in the present study. Thus 0.4 g CH4/kg waste (10% of the default value) corresponding to 11 kg CO2-eq/ton CPO and 0.06 g N2O/kg waste corresponding to 20 kg CO2-eq/ton CPO are assumed emitted from the degrading EFB. On the other hand, N2O emissions from mineral N fertilizer would be saved. Again using the low end of the range from fertilizer application on land in IPCC (2006), 0.003 kg N2O-N is released per kg N of industrial fertilizer amounting to a saving of 4 kg CO2-eq/ton CPO for replacing mineral fertilizer.
The total GHG balance for applying EFB as mulch is thus an emission of 13 kg CO2-eq/ton CPO. The uncertainty analysis revealed that depending on whether the actual methane and N2O emissions are in fact negligible or possibly as high as the IPCC (2006) default values, the bandwidth of the GHG data varies from a net GHG reduction of 14 kg CO2-eq/ton CPO to emissions of 180 kg CO2-eq/ton CPO when EFBs are applied as mulch.
3.3 Open lagoons and Landfilling
Nearly all palm oil mills in Malaysia treat the palm oil mill effluent (POME) in a series of open lagoons. The first lagoons will be anaerobic, followed by facultative lagoons and finally algae ponds to meet the stringent effluent requirements. The lagoons have no bottom liner thus resulting in leakage to groundwater and methane emissions to the atmosphere from the anaerobic ponds. No studies have been published on the quantities and environmental impacts of leakage, however, Yacob et al. (2006) measured methane emissions from open lagoons to be 12.36 kg CH4/ton POME at an average methane concentration in the biogas of 54%.
Landfilling of excess residues is becoming rarer, as the residues have monetary market values, which can give the mills a side income. However, it is estimated that 5% of the EFB is still landfilled in Malaysia although no official reference exists.
3.3.1 GHG data for open lagoons and landfilling
At 3.25 tons POME per ton CPO, the methane emission per ton CPO is 40 kg, corresponding to 1,000 kg CO2-equivalents. The methane values in Yacob et al. (2006) seem high as the methane production in an average POME biogas plant is also 40 kg/ton CPO at a methane content in the biogas of 65% (unpublished data). However, the high values could be due to the fact that with the long retention time of 40 days in the lagoon, COD is reduced to a level of 1,200 mg/L (Yacob et al., 2006) whereas the average POME biogas plant (hydraulic retention time (HRT)<20 days) only removes COD down to 4-6,000 mg/L and thus do not harvest the full gas potential.
8
When landfilling EFB, apart from leachate, the anaerobic degradation would be responsible for significant methane emissions. At 16% C content (wet weight) (Chow et al., 2008) and an estimated 20% C conversion to methane for this type of organic residue in a landfill, an estimated 47 kg of methane or 1,180 kg CO2-equivalents is emitted per ton CPO if all EFB were landfilled.
There is little uncertainty in the methane emissions from POME, which are well documented. However, for the landfilled EFB, a bandwidth was established assuming 15% and 25% C conversion to methane resulting in an emission range from 890-1480 kg CO2-eq/ton CPO.
3.4 Biomass Power
Incineration of palm oil residues can produce significant amounts of steam for electricity production or industrial processes thus replacing grid electricity or fossil boiler fuels. The incinerated biomass also has a value as a fertilizer. Rosnah et al. (2006) reports that at the time 65% of EFB were incinerated at the mills without energy recovery in order to generate ash for fertilizer. Stack emissions can be considered CO2 neutral. Other environmental impacts will be discussed qualitatively in section 3.8. The ash remains are about 7% of the dry weight from incoming EFB leaving 9 kg K per ton CPO equivalent to 6 kg CO2 in accordance with (PE International, 2006b). It is assumed that ash from Shells has the same properties.
A biomass incineration plant producing electricity would also be able to dispose of the ash as fertilizer thus saving 6 kg CO2/ton CPO (as per above) on top of the CO2 savings from the biomass power output. Biomass used in industry boilers is often co-fired with fossil fuels making the ash less suitable for fertilizer.
It is assumed that biomass plants will be constructed in areas with easy access from the mills supplying the feedstock. An average of 50 km is estimated with the trucks driving empty one way giving a total of 100 km. If shells or EFB are sold for use in industrial boilers, the industries capable of handling biomass in their boilers are estimated to be on average 200 km from the palm oil mills thus giving a total distance of 400 km with one way empty driving.
3.4.1 GHG data for biomass power
Table 1 in Section 3.1 lists the energy contents of EFB, press fibre and shells. From a 50 tons/hour palm oil mill (average size), a biomass power plant could produce 2.5 MW electricity from just the shells not used in the mill boiler and this could be almost tripled to 6.5 MW by including all the EFB. With a placement adjacent to the mill, no significant transportation of the residues would be needed. The potential CO2 savings from replacing current Malaysian electricity mix emitting 0.75 kg CO2-eq/kWh (PE International, 2006c) are 190 kg CO2/ton CPO for Shells and 290 kg CO2/ton CPO for

9
EFB including fertilizer contribution from the ash. If residues from one ton of CPO are instead substituting coal in industry boilers, shells could replace 146 kg coal equivalent to 380 kg CO2 and briquetted EFB could replace 225 kg coal equivalent to 590 kg CO2.
7 kg CO2/ton CPO for EFB and 2 kg CO2/ton CPO for shells are emitted from transportation to biomass plants and 29 and 7 kg CO2/ton CPO for EFB and shells respectively from transportation to industry boilers given the above assumptions.
The GHG reductions calculated above can be considered as best case scenario for power production from the residues. IPCC (2006) suggests that app. 5 g CH4/ton waste and 50 g N2O/ton waste is likely to be emitted during incineration. This would reduce the GHG reductions from power production from EFB by 4% and shells by 1%.
3.5 Biogas
Biogas capture from the anaerobic digestion of POME can be done by (1) simply covering the lagoon with a flexible membrane, (2) constructing covered tanks for ambient temperature operation (~30°C) or (3) constructing covered tanks for thermophilic temperature operation (~50°C). As POME is easily degradable, the anaerobic technology used has little influence on the methane quantities produced as long as the required hydraulic retention time and general operation and maintenance are in place. Approximately 12 kg methane is produced per ton POME resulting in 40 kg methane per on CPO. The captured gas can be (a) flared off thus converting the methane to CO2 thus making the POME treatment CO2 neutral, assuming a closed flare with close to 100% combustion efficiency is used, (b) burned in a gas burner installed at the mill boiler (co-generation) for steam production or (c) burned in a gas engine for electricity production. All three types of biogas plants and all three gas utilization techniques are in operation in Malaysia as of end 2010.
3.5.1 GHG data for biogas
At a calorific value of 50 MJ/kg, the methane from POME from producing one ton CPO can produce 220 kWh electricity at 40% gas engine efficiency. 5 kWh are required to operate the biogas plant leaving 215 kWh for export equivalent to 160 kg CO2. Or it could replace 180 kg of press fibre or 120 kg of shells in the boiler through co-generation.
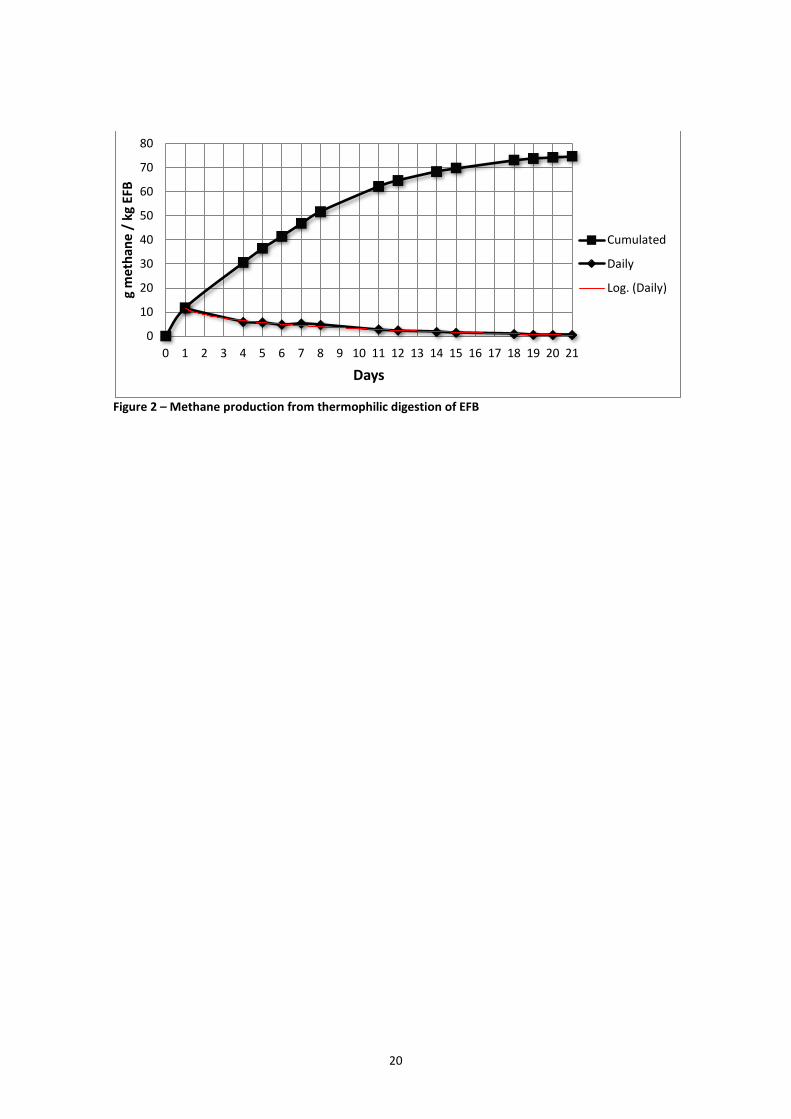
As treating the POME in a biogas plant to avoid methane emissions is the highest priority for mills in ensuring sustainable palm oil, ensuring that the biogas plant is designed to digest EFB can generate a relatively low-cost boost to gas production. Thermophilic anaerobic digestion has the advantage of improved ability to digest solid residues. Converti et al. (1999) showed a 60% increase in gas yields from solids residues under thermophilic conditions compared to mesophilic conditions. The results of the experiments undertaken in this study are shown in Figure 2 depicting the

10
methane production over time from EFB digestion at thermophilic conditions. The degradation of the EFB as depicted by the methane production followed a logarithmic curve with the methane potential depleted after 21 days and a total methane production of 75 g/kg EFB. In comparison, it took Paepatung et al. (2009) 90 days to produce 78 g methane per kg EFB under mesophilic conditions, which shows that methane potentials from EFB are similar under thermophilic and mesophilic conditions, but the time scales are very different. In a full scale, fully mixed thermophilic digester the practical experience has shown that optimal hydraulic retention time is 10-12 days for stabile POME digestion and gas production (unpublished data). As EFB is meant as a supplement to the POME, the methane produced at 12 days, namely 65 g/kg EFB or 86% of the total methane per kg EFB, is used in the following calculations. In a full scale biogas plant the mixing and pumping can be affected at suspended solid contents above 10% (unpublished data). With the existing 2-4% suspended solids in POME it is thus recommended to add shredded EFB at about 5% of the POME quantity or 160 kg per ton CPO. The added EFB would produce 10.5 kg methane, which is an increase of 26% compared to POME alone. 60 kWh of electricity can be produced from the EFB methane replacing 45 kg of CO2. It should be added that there are only relatively low expenses involved in adding EFB to a thermophilic biogas plant, thus making it a cost effective solution. As the POME from the mills is 70-80°C and the ambient temperature is app. 30°C in Malaysia, thermophilic conditions can be maintained in an insulated tank with little or no auxiliary heating. It must, however, be mentioned that the methane potential of the EFB was determined at batch feeding, laboratory conditions. More studies are needed to determine actual EFB degradation and methane potential when mixed with POME under full scale, continuous flow conditions.
After biogasification, 70% (dry weight) of the EFB remains as non-digestible fibre. The LHV of the remaining fibre has not been measured; however, it may be an option to use them in the mill boiler or in an incineration/pyrolysis plant. This could significantly improve the environmental profile of bio-gasification of EFB. Biogas plants are assumed to be constructed adjacent to the mills, so POME and EFB used for biogas do not have transportation emissions.
The anaerobic digestate retains considerable amounts of nutrients, which can be applied to the plantations as fertilizer. The fertilizer value is, however, assumed identical whether the digestate is from a biogas plant or open lagoons, so the industrial fertilizer savings are not included in the calculations. If EFB is added to the biogas plant, this study showed that 80% N, 50% P and 10% K are still present in the EFB after digestion. It is expected that the ‘lost’ nutrients are available in the liquid phase. There is thus an improved fertilizer value in the effluent digestate if EFB is added to the biogas plant. It is expected that this fertilizer value may be equal to that of mulched EFB, which would equal 2 kg CO2/ton CPO at 160 kg EFB. These additional

11
benefits are not included in the results as the potential GHG savings from use as fertilizer are uncertain and seem insignificant.
Energy recovery from the remaining digested EFB has not been scientifically quantified, but preliminary calculations in the uncertainty analysis showed that by substituting shells in the mill boiler (and use these shells in other applications), the GHG reductions from producing biogas from EFB could be doubled to a best case value of 89 kg CO2eq/ton CPO. Conversely, it is not unlikely that a poorly managed biogas plant may have methane leakages of up to 10%, which would create a worst case GHG reduction value of 13 kg CO2/ton CPO.
3.6 Pyrolysis and Gasification
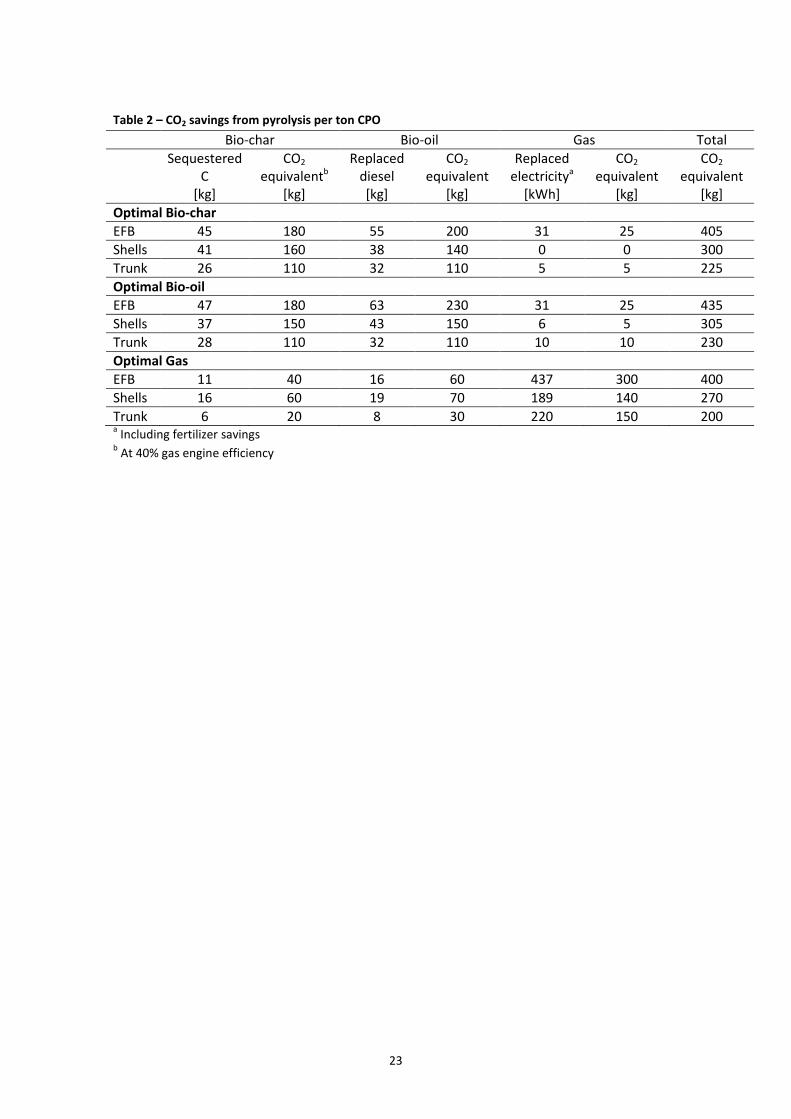
Pyrolysis is thermal treatment of organic material at anoxic conditions. Pyrolysis produces bio-oil, syngas and bio-char. With increasing temperatures more gas is produces as the carbon from the bio-char is released and the bio-oil is cracked into gaseous compounds. The ratios of the three products at various temperatures depend on the feedstock. In the case of EFB, as the temperature approaches 900°C and beyond, the process is known as gasification, in which the output is solely gas and a few percent of ash. For Pyrolysis, three set-ups will be analyzed: Optimal bio-char production, optimal bio-oil production and optimal gas production. Bio-oil and gas can be cracked or synthesized into various products. However, for sake of simplification, in Table 2 bio-oil replaces diesel in an industrial boiler and the gas is used for electricity production in a gas engine with a standard 40% electrical efficiency. Additional data background for the values can be found in Appendix 4 of the Supplementary Data.
3.6.1 GHG data for pyrolysis and gasification
[Table 2]
The CO2 savings from the three pyrolysis set-ups (optimal bio-char/bio-oil/gas) for the respective residues in Table 2 are not statistically different, so in Section 3.7 the average values for EFB, shells and trunks respectively are used. As for the biomass plants, pyrolysis plants are assumed to be placed at locations easily accessible for the feedstock. However, as transportation of the pyrolysis products to the final destinations have to be taken into account, 100 km distance is estimated. With empty driving one way this results in 200 km equivalent to 10, 14 and 3 kg CO2/ton CPO for trunks, EFB and shells respectively.
In the uncertainty analysis, the double standard variations of the mean values for EFB, shells and trunks respectively have been used to create a potential bandwidth for the three residues: 362-433 kg CO2-eq/ton CPO for EFB 253-323 kg CO2-eq/ton CPO for shells and 180-239 kg CO2-eq/ton CPO for trunks.
12
3.7 Scenarios and Life Cycle Perspective
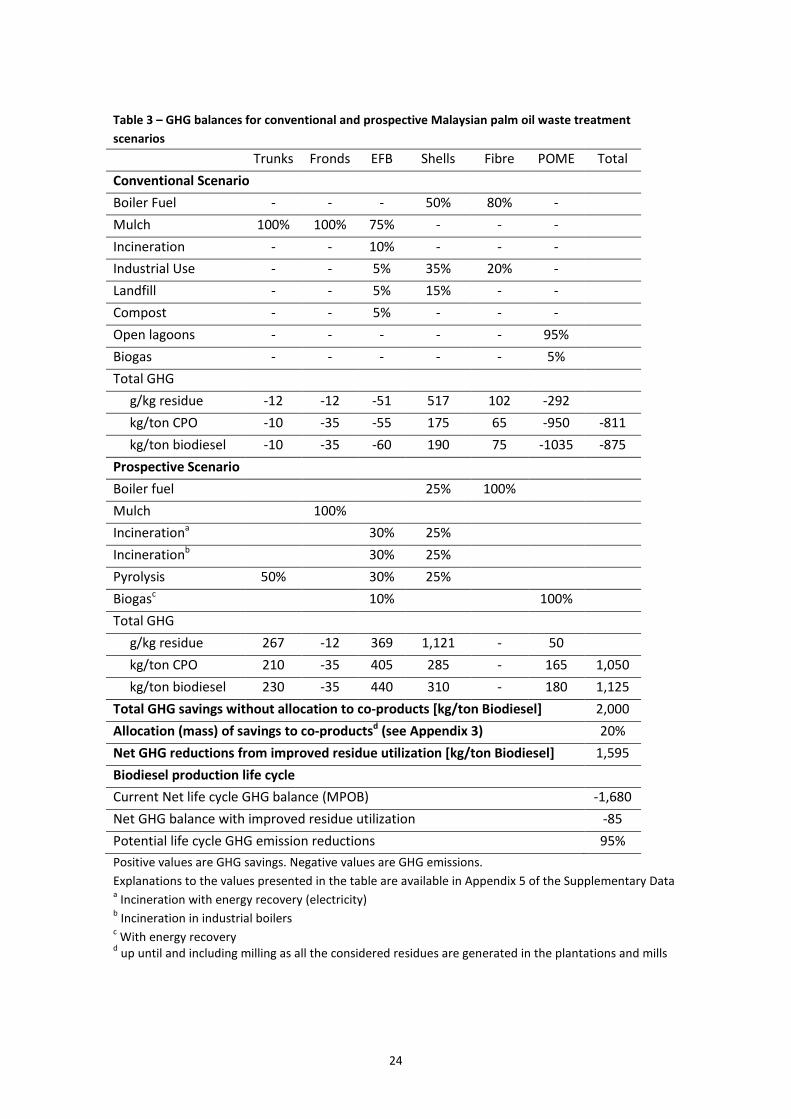
This section presents scenarios of the conventional and prospective waste treatment in the Malaysian palm oil industry. GHG reductions from the prospective scenario are held against the conventional scenario and the total life cycle GHG emissions from palm oil derived biodiesel in Table 3. A summary table of the GHG emissions and savings derived in Sections 3.1 – 3.7 can be found in Appendix 4 of the Supplementary Data. According to Choo et al., 2011 it takes 1.09 ton CPO to produce 1 ton biodiesel, so the results from Sections 3.1 – 3.6 are multiplied by 1.09 in the following.
In order to compare the relative benefits of implementing improved waste treatment, a scenario of the conventional waste treatment is created in Table 3. No statistics currently exist, which quantify the actual distribution of residues on the various treatment technologies. The scenario is thus created through estimations based on various discussions and indirect information and may vary from actual conditions. It should be noted that other uses/treatments are currently being practiced on small scale, such as incineration with energy recovery. However, these currently constitute a small percentage and are considered under ‘Industrial Use’ (see Appendix 6 of the Supplementary Data for further details).
It is unlikely that any one of the prospective treatment technologies will capture the entire Malaysian market, so rather than aiming to identify an unlikely optimal residue utilization scenario, the potential overall savings are calculated on the basis of the prospective scenario in Table 3, which assumes equal distribution within the waste treatment technologies. Only biogasification of EFB is given a smaller share as not all EFB from a mill can be used in a biogas plant (see Section 3.5.1). It is evident from Table 3 that the conventional low-tech practices such as mulching, incineration without energy recovery, open lagoon treatment of POME and landfilling compare poorly to the prospective treatments. Whereas the conventional scenario is responsible for large net emissions, the use of residues forms a carbon sink in the prospective scenario. Thus, significant CO2 savings can be achieved by applying advanced waste treatment.
The results show that without allocation to co-products 1,125 kg CO2-eq can potentially be saved per ton of biodiesel produced compared to a hypothetical carbon neutral disposal scenario where all carbon in the residues is simply converted to CO2. 2,000 kg CO2-eq/ton biodiesel can be saved compared to the conventional practices. With 20% mass allocation of the savings to co-products generated at the mill (see Appendix 3 in the Supplementary Data), the values are 700 kg CO2-eq/ton biodiesel and 1,595 kg CO2-eq/ton biodiesel respectively.
In 2010, Choo et al. (2011) completed an LCA on palm oil derived biodiesel for the Malaysian Palm Oil Board (MPOB) through an extensive study of 21 nurseries, 102

13
plantations, 12 mills, 11 refineries and 2 biodiesel plants. The study concluded that the production of palm oil derived biodiesel emits 33.2 g CO2-eq/MJ biodiesel without capture of methane from the anaerobic ponds and 21.2 g CO2-eq/MJ biodiesel with capture of methane. This translates to 1340 kg CO2-eq/ton biodiesel and 855 kg CO2-eq/ton CPO respectively. The study is based on mass allocation for co-products and excess shells not used in the mill boiler. The allocation for shells is 14% of the life cycle emissions generated up until and including the mill (830 kg CO2-eq/ton CPO with methane capture and without allocation). The fertilizer savings from mulching of EFB (all EFB is considered mulched) was not quantified but indirectly included as the inorganic fertilizer input would have been higher without the mulched EFB. No other residues were considered.
In order to be able to present the full conventional life cycle GHG emissions using the production emissions from the MPO study and the emissions/reductions from the conventional residue treatment scenario in Table 3, it must be ensured that there is no double counting between the MPOB study and the present study. Thus the GHG emissions from the MOPB study not including methane emissions from anaerobic digestion are used with the 14% allocation for excess shells removed and the fertilizer value from the EFB (as presented in Section 3.2.1) subtracted. The mulch emissions for methane and N2O are not included in the MPOB study. The emissions from the MPOB study excluding emissions/reductions from any of the residues but including allocation to co-products thus amounts to 855+116-(-14) = 985 kg CO2-eq/ton biodiesel. The emissions from the conventional residue use scenario in Table 3 minus 20% mass allocation are then added resulting in a total emission of 985+(875*(1-20%)) = 1,680 kg CO2-eq/ton biodiesel in the MPOB study when subjected to the conventional residue treatment of the present study. After subjecting the results of the present study to co-product allocation it is evident from Table 3 that 95% of the total life cycle GHG emissions from the production of biodiesel can be off-set against the GHG reductions by using the residues thus making the production of biodiesel close to carbon neutral. It is also worth noticing from the results that the shells have the highest emission reductions per ton residue, but that EFB due to the large quantities can provide the largest GHG emission savings in a life cycle perspective.
3.8 Sensitivity and Uncertainty
This section focuses on a quantitative sensitivity analysis of the conventional and prospective scenario based on the GHG emission/reduction bandwidths presented in Section 3.1 – 3.6 and qualitative considerations regarding other impacts than global warming as well as consequential LCA.
The prospective scenario in Table 3 shows that improved residue utilization can make production of palm oil derived biodiesel close to carbon neutral. However, this
14
scenario requires 100% use of the residues and significant investments from the industry itself or from external investors and may thus be achievable for some mills/estates, but not for all as some do not have the financial means and some are too remote and difficult to access to make residue transportation feasible. It must also be stressed that more research is required to generate a stronger scientific platform for life cycle data on palm oil waste treatment technologies and that other environmental benefits from e.g. using treated residues as soil enhancement and fertiliser are not regarded here.
Figure 3 shows the cumulative bandwidths of the conventional and the prospective scenarios from the uncertainty analysis in Appendix 7 as well as the potential net GHG reductions of the prospective scenario is implemented with 25%, 50% and 75% success. It should be noted that ‘best case’ and ‘worst case’ values are realistic estimations not including extreme circumstances. The worst case scenarios are highly impacted by the potential N2O emissions from mulch as per the IPCC (2006) default emission values (see Appendix 7 in the Supplementary Data).
Based on the default emissions and reductions from the two scenarios, even if the prospective scenario is only implemented within 50% of the Malaysian palm oil industry – which is likely more realistic than 100% at least in the short term – the GHG reductions can still offset 27% of the life cycle GHG emissions from palm oil production. It takes 30% implementation of the prospective scenario to create net GHG reductions from the use of residues generated in the production of Malaysian palm oil derived biodiesel.
The results presented in Table 3 consider only GHG emissions. A full environmental assessment would need to include factors such as stack emissions, leachate from landfilling, lagoons and mulching, transportation emissions, impacts due to possible soil erosion when removing EFB mulch and (indirect) land use change. The various forms of biomass incineration for electricity production or in industry boilers would likely generate more particulate matter than the equivalent fossil fuels, thus setting higher demands for flue-gas filters. Transportation of the residues would also be likely to play a bigger role when other impacts are considered, as the general condition of trucks in Malaysia is poor, often emitting dark exhaust. On the other hand, eutrophication due to leachate would be greatly reduced compared to the conventional scenario. If EFB is not used as mulch, increased surface soil erosion in the oil palm plantations may occur. This could, however, be countered with a cover crop such as legumes. If erosion was to occur it would lead to eutrophication of streams and lakes and increased fertilizer use and/or reduced yields, which could have significant impacts on the life cycle impacts. The general nutrient balance and soil conditions can play a much more significant role in a holistic perspective than when considering GHG

15
only. As such, the tradeoffs of removing biomass/nutrients from the system must be closely investigated. For example the benefits of bio-char on soil conditions may make pyrolysis an even more attractive technology than indicated in the results of this study.
Studying how decisions and actions in the life cycle of one product impacts the life cycle itself as well as the life cycles of other products is known as consequential LCA. When the residues from biodiesel production are used and thus substitute another product, the said product will either decrease in demand or the extra stock available will again substitute another product. Thus it can ultimately be very difficult to identify exactly what is substituted. It can even be argued that replacing e.g. coal with a biomass may lower the demand of coal, which will lower the price, which will ultimately result in increased use of coal. As such, the life cycles of each possible waste treatment technology should be studied carefully to obtain better decision support.
4 Conclusions
Methane capture from the anaerobic digestion of POME is the highest priority in the pursuit of sustainable palm oil derived biodiesel. If the methane is used for steam or electricity production, adding EFB to the POME can significantly increase the gas production under thermophilic conditions. The implementation of solid waste treatment technologies such as waste incineration with energy recovery and pyrolysis also result in significant GHG reductions. The use of all residues in an optimized manner can make the production of biodiesel from palm oil close to CO2-neutral with a reduction of 95% of the current 1,680 kg CO2-eq/ton Biodiesel.
5 Acknowledgements
The authors would like to express gratitude to palm oil corporation Felda Holdings Bhd and their fully owned subsidiary Felda Palm Industries Sdn Bhd for allowing access to their mills for collection of POME and EFB for the practical experiments of this study and for providing comparative data for the residue quantities. The authors would also like to thank Malaysian biogas contractor CST Engineering Sdn Bhd for access to, and use of, biogas testing facilities. It is stressed that neither Felda Palm Industries nor CST Engineering has had any subjective influence on the results of this study.
6 References
Abdullah, N., Gerhauser, H., 2008. Bio-oil derived from empty fruit bunches, Fuel. 87, 2606-2613.
Abdullah, N., Gerhauser, H., Sulaiman, F., 2010. Fast pyrolysis of empty fruit bunches, Fuel. 89, 2166-2169.
16
Alam, M.Z., Jamal, P., Nadzir, M.M., 2008. Bioconversion of palm oil mill effluent for citric acid production: statistical optimization of fermentation media and time by central composite design, World J. Microbiol. Biotechnol. 24, 1177-1185.
Alam, M.Z., Mamun, A.A., Qudsieh, I.Y., Muyibi, S.A., Salleh, H.M., Omar, N.M., 2009. Solid state bioconversion of oil palm empty fruit bunches for cellulase enzyme production using a rotary drum bioreactor, Biochem. Eng. J. 46, 61-64.
Bari, M.N., Alam, M.Z., Muyibi, S.A., Jamal, P., Abdullah-Al-Mamum, 2009. Improvement of production of citric acid from oil palm empty fruit bunches: Optimization of media by statistical experimental designs, Bioresour. Technol. 100, 3113-3120.
Choo, Y.M., Muhamad, H., Hashim, Z., Subramaniam, V., Puah, C.W., Tan, Y., 2011. Determination of GHG contributions by subsystems in the oil palm supply chain using the LCA approach, Int. J. Life Cycle Assess. 16, 669-681.
Chow, M.C., Basri, M.W., Chan, K.W., 2008. Availability and potential of biomass resources from Malaysian palm oil industry for generating renewable energy, Oil Palm Bulletin, No 56, 2008.
Converti, A., Del Borghi, A., Zilli, M., Arni, S., Del Borghi, M., 1999. Anaerobic digestion of the vegetable fraction of municipal refuses: mesophilic versus thermophilic conditions, Bioprocess Eng. 21, 371-376.
Felda, 2010. Waste product statistics for Malaysian palm oil producer Felda Palm Industries Sdn. Bhd. with 349,000 ha oil palm plantations and 70 palm oil mills, Presented in October 2010
Henson, I.E., Chang, K.C., 2007. Modelling oil palm nutrient demand, nutrient turnover and nutrient balance, MPOB Technology No. 30.
Husain, Z., Zainac, Z., Abdullah, Z., 2002. Briquetting of palm fibre and shell from the processing of palm nuts to palm oil, Biomass Bioenergy. 22, 505-509.
ILCD, 2010. ILCD Handbook - Specific guide for Life Cycle Inventory datasets, First edition, Institute for Environment and Sustainability, Joint Research Centre, European Commission, 2010.
IPCC, 2006. 2006 IPCC Guidelines for National Greenhouse Gas Inventories, National Greenhouse Gas Emissions Programme, IGES, Japan.
Khalil, H.P.S.A., Fazita, M.R.N., Bhat, A.H., Jawaid, M., Fuad, N.A.N., 2010. Development and material properties of new hybrid plywood from oil palm biomass, Mater Des. 31, 417-424.
17
Khor, K.H., Lim, K.O., Alimuddin, Z.A.Z., 2010. Laboratory-scale Pyrolysis of Oil Palm Trunks, Energy Sources, Part A: Recovery, Utilization, and Environmental Effects. 32, 518.
Kim, S.-., Jung, S.-., Kim, J.-., 2010. Fast pyrolysis of palm kernel shells: Influence of operation parameters on the bio-oil yield and the yield of phenol and phenolic compounds, Bioresour. Technol. 101, 9294-9300.
Li, J., Yan, R., Xiao, B., Wang, X., Yang, H., 2007. Influence of Temperature on the Formation of Oil from Pyrolyzing Palm Oil Wastes in a Fixed Bed Reactor, Energy & Fuels. 21, 2398.
Lim, K.O., Lim, K.S., 1992. Carbonisation of oil palm trunks at moderate temperatures, Bioresour. Technol. 40, 215-219.
MPOB, 2010. Malaysian Oil Palm Industry Statistics 2009, 29th edition, Malaysian Palm Oil Board, 2010.
Mullen, C.A., Boateng, A.A., Goldberg, N.M., Lima, I.M., Laird, D.A., Hicks, K.B., 2010. Bio-oil and bio-char production from corn cobs and stover by fast pyrolysis, Biomass & Bioenergy. 34, 67-74.
Paepatung, N., Nopharatana, A., Songkasiri, W., 2009. Bio-methane potential of biological solid materials and agricultural wastes, Asian Journal on Energy and Environment. Vol. 10, No 1.
PE International, 2006a. GaBi 4 database, RER: Lorry (22t) incl. fuel ELCD [Truck] agg,.
PE International, 2006b. GaBi 4 database, Ecoinvent - RER: Mineral Fertilizers for N, P2O5, K2O, agg,.
PE International, 2006c. GaBi 4 database, PE - Malaysian (MY) Power grid mix, agg.
PEMANDU, 2011. Performance Management & Delivery Unit of Malaysia, www.pemandu.gov.my, accessed February 2011,.
Rosnah, M.S., Hasamudin, W.H., Gapor, A.M.T., Kamarudin, H., 2006. Thermal properties of oil palm fibre, cellulose and its derivatives, Journal of Oil Palm Research. Vol. 18,.
Schmidt, J., 2007. Life Cycle Assessment of rapeseed oil and palm oil, Part 3: Life Cycle Inventory of rapeseed oil and palm oil, PhD Thesis, Department of Development and Planning, Aalborg University, 2007.
Singh, G., Manoharan, S., Toh, T.S., 1989. Proceedings of the PORIM International Palm Oil Development Conference, Module II - Agriculture, pp 225-234
18
Subramaniam, V., Ma, A.N., Choo, Y.M., Nik, M.N.S., 2008. Environmental performance of the milling process of Malaysian palm oil using the life cycle assessment approach, American Journal of Environmental Sciences. Vol 4, No 4.
Sukiran, M.A., Abu Bakar, N.K., Chin, C.M., 2009. Optimization of Pyrolysis of Oil Palm Empty Fruit Bunches, Journal of Oil Palm Research. 21, 653-658.
Sulaiman, F., Abdullah, N., 2011. Optimum conditions for maximising pyrolysis liquids of oil palm empty fruit bunches, Energy. In Press, Corrected Proof,.
Tan, H.T., Lee, K.T., Mohamed, A.R., 2010. Second-generation bio-ethanol (SGB) from Malaysian palm empty fruit bunch: Energy and exergy analyses, Bioresour. Technol. 101, 5719-5727.
Wicke, B., Dornburg, V., Junginger, M., Faaij, A., 2008. Different palm oil production systems for energy purposes and their greenhouse gas implications, Biomass Bioenergy. 32, 1322-1337.
Yacob, S., Ali Hassan, M., Shirai, Y., Wakisaka, M., Subash, S., 2006. Baseline study of methane emission from anaerobic ponds of palm oil mill effluent treatment, Sci. Total Environ. 366, 187-196.
Yusoff, S., 2006. Renewable energy from palm oil – innovation on effective utilization of waste, J. Clean. Prod. 14, 87-93.
19
Figures
Figure 1 – Conventional practices and prospective technologies a. All quantities are wet weight averages from (MPOB, 2010), (Felda, 2010); (Schmidt, 2007);
(Subramaniam et al., 2008); (Wicke et al., 2008); (Yusoff, 2006). Please find references for the uses in the following sections on the respective treatment technologies. For details from the individual studies and for an easy overview of the residue quantities, please refer to Appendix 2 of the Supplementary Data.
b. Fibre is depicted as being fully utilized in the mill boiler. That is not conventional practice, but it is applied in this study. Also, approximately half of the shells are currently used in the boilers, not only 80 kg. See Section 3.1 for explanation.
c. Some treatments are mentioned both above the residue fractions in the conventional scenario and below the residue fractions in the prospective scenarios. This is because these technologies are currently applied, but at very small scale.
20
Figure 2 – Methane production from thermophilic digestion of EFB
0
10
20
30
40
50
60
70
80
0 1 2 3 4 5 6 7 8 9 10 11 12 13 14 15 16 17 18 19 20 21
g m
etha
ne /
kg
EFB
Days
Cumulated
Daily
Log. (Daily)

21
Figure 3 – GHG bandwidths of the scenarios and net effects of prospective scenario of implementation
-700 -585
-1355
895 1215
400
-125
450
1025
1595
-2000
-1500
-1000
-500
0
500
1000
1500
2000
Default Best case
Worst case
Default Best case
Worst case
25% 50% 75% 100%
Resi
due
trea
tmen
t GH
G r
educ
tion
s
[kg
CO2-
eq/t
on b
iodi
esel
]
Conventional Prospective Prospective Scenario Implementation

22
Tables
Table 1 – Mill residue energy contents
Moisture [%]
LHV [MJ/kg]
dry weight
LHV [MJ/kg]
wet weight
LHV [MJ/ton
CPO]
Pot. Electricitya
[kWh/ton CPO]
EFB 66 17.9 6.1 6,690 390 Press Fiber 39 18.1 11.1 7,290 - Shell (75%) 11 19.1 17.0 4,330 250 Total - - - 18,310 1,070 All values are based on averages from Chow et al. (2008) a At 21% combined boiler and steam turbine efficiency
23
Table 2 – CO2 savings from pyrolysis per ton CPO
Bio-char Bio-oil Gas Total Sequestered
C [kg]
CO2
equivalentb
[kg]
Replaced diesel [kg]
CO2
equivalent [kg]
Replaced electricitya
[kWh]
CO2
equivalent [kg]
CO2
equivalent [kg]
Optimal Bio-char EFB 45 180 55 200 31 25 405 Shells 41 160 38 140 0 0 300 Trunk 26 110 32 110 5 5 225 Optimal Bio-oil EFB 47 180 63 230 31 25 435 Shells 37 150 43 150 6 5 305 Trunk 28 110 32 110 10 10 230 Optimal Gas EFB 11 40 16 60 437 300 400 Shells 16 60 19 70 189 140 270 Trunk 6 20 8 30 220 150 200 a Including fertilizer savings b At 40% gas engine efficiency
24
Table 3 – GHG balances for conventional and prospective Malaysian palm oil waste treatment scenarios
Trunks Fronds EFB Shells Fibre POME Total
Conventional Scenario
Boiler Fuel - - - 50% 80% -
Mulch 100% 100% 75% - - -
Incineration - - 10% - - -
Industrial Use - - 5% 35% 20% -
Landfill - - 5% 15% - -
Compost - - 5% - - -
Open lagoons - - - - - 95%
Biogas - - - - - 5%
Total GHG
g/kg residue -12 -12 -51 517 102 -292
kg/ton CPO -10 -35 -55 175 65 -950 -811
kg/ton biodiesel -10 -35 -60 190 75 -1035 -875
Prospective Scenario
Boiler fuel 25% 100%
Mulch 100%
Incinerationa 30% 25%
Incinerationb 30% 25%
Pyrolysis 50% 30% 25%
Biogasc 10% 100%
Total GHG
g/kg residue 267 -12 369 1,121 - 50
kg/ton CPO 210 -35 405 285 - 165 1,050
kg/ton biodiesel 230 -35 440 310 - 180 1,125
Total GHG savings without allocation to co-products [kg/ton Biodiesel] 2,000
Allocation (mass) of savings to co-productsd (see Appendix 3) 20%
Net GHG reductions from improved residue utilization [kg/ton Biodiesel] 1,595
Biodiesel production life cycle
Current Net life cycle GHG balance (MPOB) -1,680
Net GHG balance with improved residue utilization -85
Potential life cycle GHG emission reductions 95% Positive values are GHG savings. Negative values are GHG emissions. Explanations to the values presented in the table are available in Appendix 5 of the Supplementary Data a Incineration with energy recovery (electricity) b Incineration in industrial boilers c With energy recovery d up until and including milling as all the considered residues are generated in the plantations and mills