Embed Size (px)
Citation preview
GREENHOUSE GAS MANAGEMENT PLAN
City of Edmonton 2019 - 2030 Civic Operations
City of Edmonton Greenhouse Gas Management Plan 2019-2030 Civic Operations
Page 2
Report prepared by: Energy Transition, City Environmental Strategies
Technical support from:
Integrated Infrastructure Services Facility Engineering Facility Planning and Design Lifecycle Management Office of Energy Management
Urban Form and Corporate Strategic Development Safety Codes Permits and Inspection
City Operations Client and Vendor Services (Fleet Services) Signals and Street Lighting Special Projects (Edmonton Transit) Technical Services (Waste Services)
External Subject Matter Support and Reviewer: Stantec Inc.
City of Edmonton Greenhouse Gas Management Plan 2019-2030 Civic Operations
Page 3
Table of Contents
List of Tables 5
List of Figures 7
Executive Summary 9
1. Purpose 12
1.1. Background, Mandate and Strategic Alignment for Developing the Plan 12
2. Principles & Approaches Used to Develop This Plan 15
3. The Cost of Carbon 16
4. Description of the City’s reporting program 18
5. Review of the City of Edmonton’s Civic Operations Energy Assets 19
6. Baseline Greenhouse Gas Emissions Forecast 21
7. Cost Benefit Analysis Findings 23
7.1. A Consistent Cost Benefit Approach 23
7.1.1. Cost Benefit of Building Energy Retrofits 23
7.1.2. Comparative Lifecycle Cost Benefit between various Carbon Abatement options 25
7.2. Limitations of Cogeneration 28
7.3. Uncertainty of future cost of electric buses 28
7.4. Uncertainty in availability of incentives 29
7.5. Sensitivity Analysis 29
8. Greenhouse Gas Reduction Target Scenarios 31
8.1. Background on green electricity procurement 31
8.2. Scenario 1: 30% below 2005 by 2030 32
8.3. Scenario 2: 50% below 2005 by 2030 34
8.4. Scenario 3: Carbon Neutral 37
8.4.1. Discussion on viability of Renewable Natural Gas and Carbon Offsets and Preliminary Cost Estimates
40
9. Enabling Change 42
9.1. Electrification of City fleets 43
10. From Concept to Implementation – Steps Towards Implementation of An Action Plan 45
Appendix A: EPCOR 2016 Inventory 49
Appendix B: Asset-specific Forecasts under Business As Usual 50
Appendix C: Guiding Procurement Principles and Operationalization Considerations for Green Electricity 56
Appendix D: Greenhouse Gas Reduction Target Scenarios – Data Tables 58

City of Edmonton Greenhouse Gas Management Plan 2019-2030 Civic Operations
Page 4
Appendix E: Lifecycle Cost Benefit Methodology and Findings 60
Appendix F: Sensitivity Analysis 80
Appendix G: Glossary and Equations 84
Appendix H: Social Cost of Carbon 86
City of Edmonton Greenhouse Gas Management Plan 2019-2030 Civic Operations
Page 5
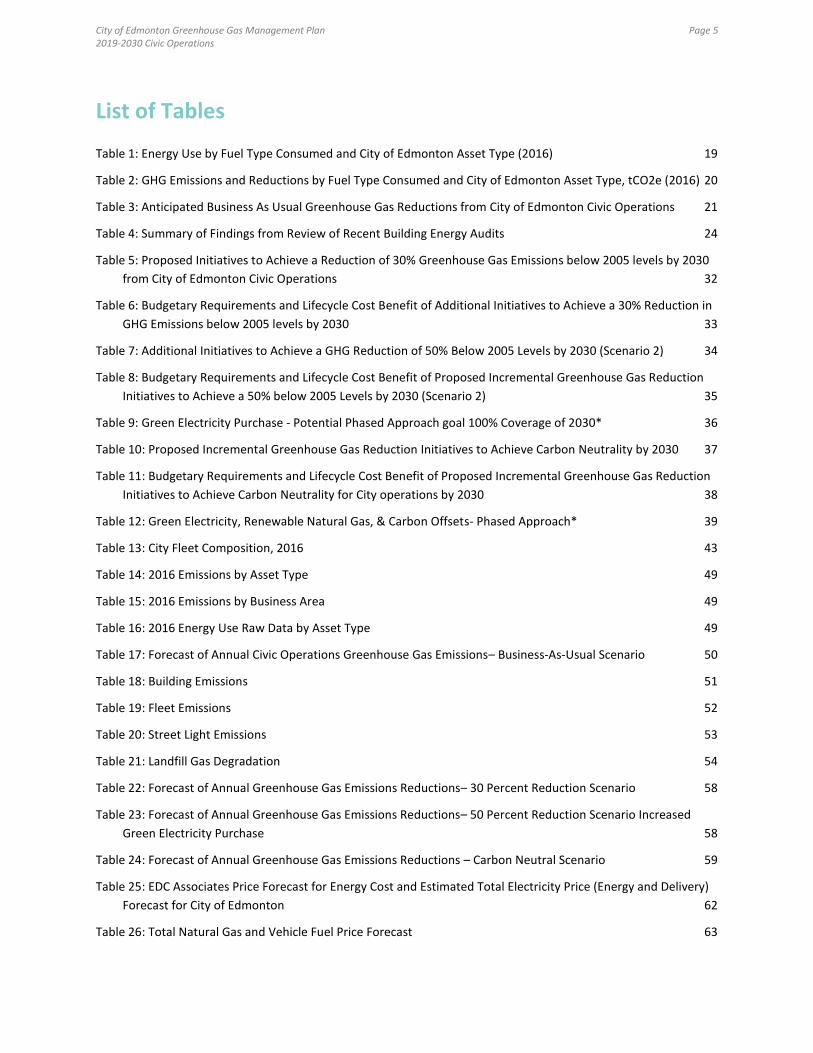
List of Tables
Table 1: Energy Use by Fuel Type Consumed and City of Edmonton Asset Type (2016) 19
Table 2: GHG Emissions and Reductions by Fuel Type Consumed and City of Edmonton Asset Type, tCO2e (2016) 20
Table 3: Anticipated Business As Usual Greenhouse Gas Reductions from City of Edmonton Civic Operations 21
Table 4: Summary of Findings from Review of Recent Building Energy Audits 24
Table 5: Proposed Initiatives to Achieve a Reduction of 30% Greenhouse Gas Emissions below 2005 levels by 2030
from City of Edmonton Civic Operations 32
Table 6: Budgetary Requirements and Lifecycle Cost Benefit of Additional Initiatives to Achieve a 30% Reduction in
GHG Emissions below 2005 levels by 2030 33
Table 7: Additional Initiatives to Achieve a GHG Reduction of 50% Below 2005 Levels by 2030 (Scenario 2) 34
Table 8: Budgetary Requirements and Lifecycle Cost Benefit of Proposed Incremental Greenhouse Gas Reduction
Initiatives to Achieve a 50% below 2005 Levels by 2030 (Scenario 2) 35
Table 9: Green Electricity Purchase - Potential Phased Approach goal 100% Coverage of 2030* 36
Table 10: Proposed Incremental Greenhouse Gas Reduction Initiatives to Achieve Carbon Neutrality by 2030 37
Table 11: Budgetary Requirements and Lifecycle Cost Benefit of Proposed Incremental Greenhouse Gas Reduction
Initiatives to Achieve Carbon Neutrality for City operations by 2030 38
Table 12: Green Electricity, Renewable Natural Gas, & Carbon Offsets- Phased Approach* 39
Table 13: City Fleet Composition, 2016 43
Table 14: 2016 Emissions by Asset Type 49
Table 15: 2016 Emissions by Business Area 49
Table 16: 2016 Energy Use Raw Data by Asset Type 49
Table 17: Forecast of Annual Civic Operations Greenhouse Gas Emissions– Business-As-Usual Scenario 50
Table 18: Building Emissions 51
Table 19: Fleet Emissions 52
Table 20: Street Light Emissions 53
Table 21: Landfill Gas Degradation 54
Table 22: Forecast of Annual Greenhouse Gas Emissions Reductions– 30 Percent Reduction Scenario 58
Table 23: Forecast of Annual Greenhouse Gas Emissions Reductions– 50 Percent Reduction Scenario Increased
Green Electricity Purchase 58
Table 24: Forecast of Annual Greenhouse Gas Emissions Reductions – Carbon Neutral Scenario 59
Table 25: EDC Associates Price Forecast for Energy Cost and Estimated Total Electricity Price (Energy and Delivery)
Forecast for City of Edmonton 62
Table 26: Total Natural Gas and Vehicle Fuel Price Forecast 63
City of Edmonton Greenhouse Gas Management Plan 2019-2030 Civic Operations
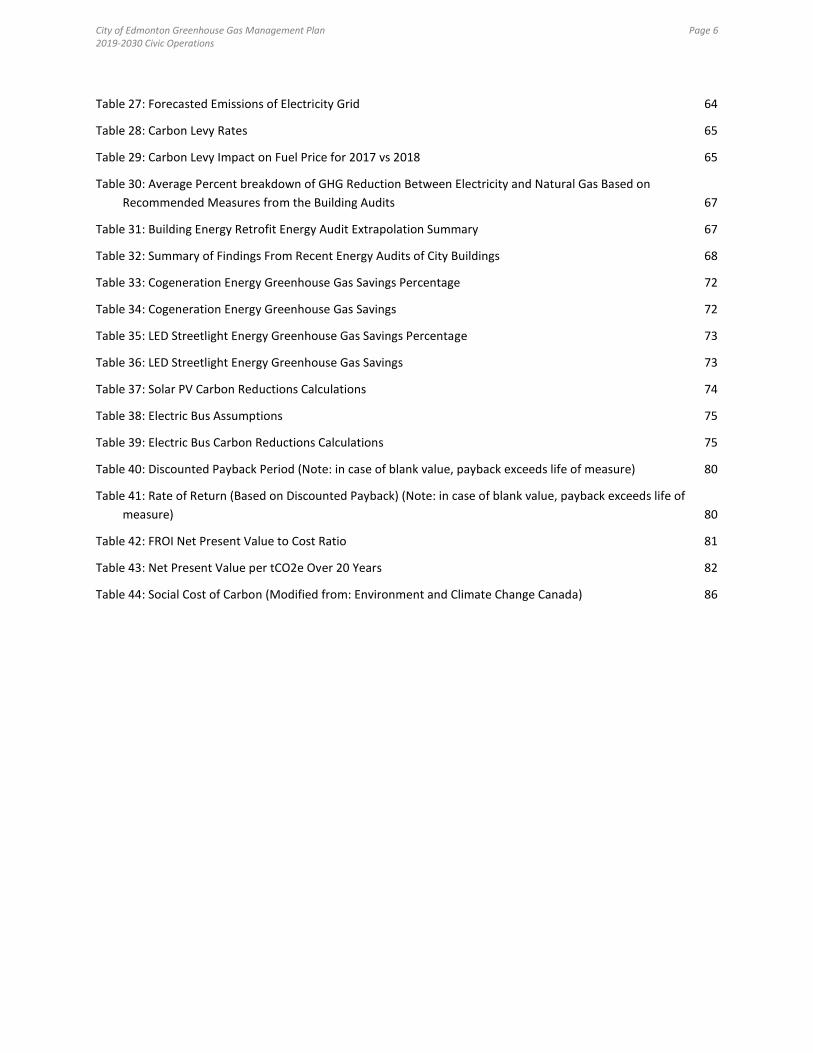
Page 6
Table 27: Forecasted Emissions of Electricity Grid 64
Table 28: Carbon Levy Rates 65
Table 29: Carbon Levy Impact on Fuel Price for 2017 vs 2018 65
Table 30: Average Percent breakdown of GHG Reduction Between Electricity and Natural Gas Based on
Recommended Measures from the Building Audits 67
Table 31: Building Energy Retrofit Energy Audit Extrapolation Summary 67
Table 32: Summary of Findings From Recent Energy Audits of City Buildings 68
Table 33: Cogeneration Energy Greenhouse Gas Savings Percentage 72
Table 34: Cogeneration Energy Greenhouse Gas Savings 72
Table 35: LED Streetlight Energy Greenhouse Gas Savings Percentage 73
Table 36: LED Streetlight Energy Greenhouse Gas Savings 73
Table 37: Solar PV Carbon Reductions Calculations 74
Table 38: Electric Bus Assumptions 75
Table 39: Electric Bus Carbon Reductions Calculations 75
Table 40: Discounted Payback Period (Note: in case of blank value, payback exceeds life of measure) 80
Table 41: Rate of Return (Based on Discounted Payback) (Note: in case of blank value, payback exceeds life of
measure) 80
Table 42: FROI Net Present Value to Cost Ratio 81
Table 43: Net Present Value per tCO2e Over 20 Years 82
Table 44: Social Cost of Carbon (Modified from: Environment and Climate Change Canada) 86

City of Edmonton Greenhouse Gas Management Plan 2019-2030 Civic Operations
Page 7
List of Figures
Figure 1: Percent Breakdown of Energy Use by Fuel Type and by GHG by Asset Type (2016) 19
Figure 2: GHG Emissions Percent Breakdown by Fuel Type and by Asset Type (2016) 20
Figure 3: Forecast of Annual Greenhouse Gas Emissions – Business-As-Usual Scenario 22
Figure 4: Lifetime Greenhouse Gas Reduction Potential of Various City Buildings Based on Audit Recommended
Energy Upgrades 25
Figure 5: Simple Payback Periods of various Carbon Abatement Options 26
Figure 6: Rate of Return (based on discounted payback) of Various Carbon Abatement Options 26
Figure 7: Net Present Value Benefit to Cost Ratio of Various Carbon Abatement Options 27
Figure 8: Unit Lifecycle Cost Benefit (NPV) of Various Carbon Abatement Options versus Social Cost of Carbon 28
Figure 9: Sensitivity Analysis Results for Net Present Value Benefit to Cost Ratio 30
Figure 10: Forecast of Annual Greenhouse Gas Emissions – 30 Percent Reduction Scenario 34
Figure 11: Forecast of Annual Greenhouse Gas Emissions – 50 Percent Reduction Scenario 2: Increased Green
Electricity Purchase 37
Figure 12: Forecast of Annual Greenhouse Gas Emissions – Carbon Neutral Scenario 40
Figure 13 - Building Emissions 50
Figure 14: Fleet Emissions 52
Figure 15: Street Light Emissions 53
Figure 16: Landfill Gas Degradation 54
Figure 17: Total Electricity Price (Energy and Delivery) Forecast for City of Edmonton 62
Figure 18: Emissions Intensity of Grid Factor Over Time 64
Figure 19: Frequency of Suggested Energy Conservation Measure in Energy Studies Analyzed 69
Figure 20: Energy & Reduction potential based on Study Recommended ECMs 69
Figure 21: Simple Payback Period of Suite of Measures in Each Facility Studied 70
Figure 22: FROI Benefit to Cost Ratio of Suite of Measures in Each Facility Studied 70
Figure 23: Unit Net Present Value Benefit Over 20 Years of Suite of Measures in Each Facility Studied 71
Figure 24: Carbon Abatement Costs 76
Figure 25: Simple Payback Periods of Various Carbon Abatement Options 77
Figure 26: Discounted Payback of Various Carbon Abatement Options 77
Figure 27: Net Benefit over 20 Years of Various Carbon Abatement Options 78
Figure 28: NPV Benefit to Cost Ratio Over 20 years of various Carbon Abatement Options 78
Figure 29: Rate of Return of Various Carbon Abatement Options 79

City of Edmonton Greenhouse Gas Management Plan 2019-2030 Civic Operations
Page 8
Figure 30: Discounted Payback Period (Note: in case of blank value, payback exceeds life of measure) 80
Figure 31: Rate of Return (Based on Discounted Payback) (Note: in case of blank value, payback exceeds life of
measure) 81
Figure 32: Net Present Value to Cost Ratio 82
Figure 33: Unit Net Present Value Benefit Over 20 Years 83
Figure 34: Social Cost of Carbon 87
City of Edmonton Greenhouse Gas Management Plan 2019-2030 Civic Operations
Page 9
Executive Summary
Scientific evidence shows that Earth’s climate is changing, with the primary cause being the surge in greenhouse
gas (GHG) emissions from human activity. In response to this challenge, countries and cities around the world are
setting targets and developing plans to reduce their GHG emissions. Most notably, G7 countries have
recommended that all developed countries should reduce emissions by 80 per cent or more by 2050. This City of
Edmonton Greenhouse Gas Management Plan 2019-2030 Civic Operations is a response to the global threat of
climate change. Its mandate comes from a number of City Council directives including: (a) a goal in The Way We
Green for Edmonton to become “a carbon-neutral city”; (b) Strategic Action 6.10.1 contained in The Way We Green
that directs the City of Edmonton to establish, implement and maintain “a [civic operations] Greenhouse Gas
Management Plan aimed at significantly reducing greenhouse gas emissions from City operations”; and (c)
Strategic Direction 4 contained in Edmonton’s Community Energy Transition Strategy (C585) that the City of
Edmonton will take a lead role in supporting Edmonton’s energy transition efforts, including leading-by example in
its own civic operations; (d) alignment with the Pan Canadian Framework on Clean Growth and Climate Change, a
comprehensive, multi-sectoral plan to meet interim 2030 targets of 30% reduction below 2005, as a part of
demonstrating Canada’s commitment to The Paris Agreement and its 2050 targets; and (e) alignment with the
Edmonton Declaration’s commitments for Greenhouse Gas planning and reporting. This plan “leads by example”
— adopting and demonstrating high standards of sustainable, energy conserving, climate change mitigation
practices that are encouraged throughout the community.
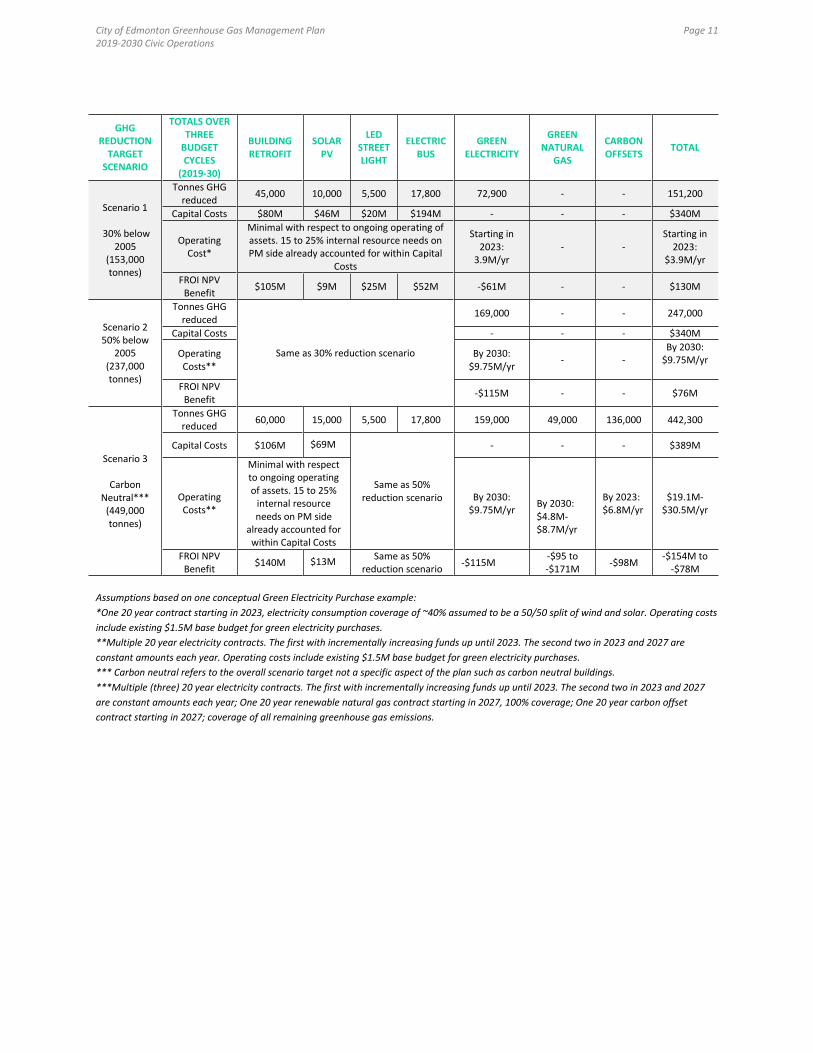
This plan proposes three GHG reduction scenarios by 2030, each with accompanying conceptual capital and
operating budgetary requirements covering the next three 4-year budget cycles:
Scenario One: Achieve 30% below 2005 levels by 2030. This target scenario is the minimum
acceptable scenario and would align with the Government of Canada’s Pan Canadian Framework for
Clean Growth and Climate Change’s 2030 target; (a 153,000 tonne reduction by 2030);
Scenario Two: Achieve 50% below 2005 levels by 2030. (a 237,000 tonne reduction by 2030);
Scenario Three: Achieve carbon neutrality for all of City operations, a highly conceptual scenario. (a
449,000 tonne reduction by 2030)
For each target scenario, the plan proposes different levels of deployment of the following greenhouse gas
mitigation options above and beyond business as usual. These options include:
Accelerated building energy retrofits;
Accelerated deployment of microgeneration solar photovoltaics on City buildings and sites;
Accelerated LED street lights replacements;
Replacement of diesel buses with electric; and
The purchase of renewably generated (green) electricity.
The recommended portfolio of options are supported by best available data and information on capital
requirements, lifecycle cost benefit analysis, and further informed by extensive input and advice from corporate
project planning, design, engineering, and project delivery staff. The recommended options reflect ambitious but
achievable rates of increased deployment that considers various constraints and minimization of impacts and
disruptions to City services and programming.
The rigorous analysis and consultation used in developing this report found that the business case actions from a
Financial Return on Investment (FROI) standpoint, ranging from strongest to weakest, were building energy
City of Edmonton Greenhouse Gas Management Plan 2019-2030 Civic Operations
Page 10
retrofits, LED street lights, electric buses, large microgeneration solar photovoltaics, and renewable (green)
electricity investment. All of the options related to investing in City assets have positive net present value benefits
over a 20 year period from a FROI standpoint. Only green electricity, green natural gas and carbon offsets have
negative NPVs, as they are simply premiums paid over a specific period. These premiums were estimated based on
the key principles outlined in Appendix C.
Analysis and consultation determined that building retrofits, although having a very strong
lifecycle cost benefit, has a deployment rate that is largely impacted and constrained by the need to minimize
building shutdown periods and disruption to City services and programming. Secondly, the analysis showed that
the average building energy retrofit can only reasonably achieve a 35% GHG reduction. The same types of issues
(e.g., scalability, deployability, impact on internal capacity and resources) are true for solar photovoltaics, electric
buses, and to a lesser extent LED street lights. The purchase of green electricity from off-site wind and solar farms
was the best option for aggressive reductions in the City’s GHG emissions, and the least impacted by the above
mentioned constraints. It cannot be emphasized enough that a portfolio of options is needed to achieve even the
minimum acceptable GHG reduction target of 30% below 2005 levels by 2030.
Of all of the carbon abatement options proposed, the future cost of electric buses is considered the most uncertain
due to this technology being in the early stages of market transformation. This is as compared to building retrofits,
LED street lights and even solar photovoltaics which are considered mature technologies (e.g., soft project or
labour costs becoming more of a dominant cost driver than hard costs of the technologies) and for which hard
prices are not expected to experience substantial decreases in future years. The incremental difference in capital
between electric and diesel buses will narrow and eventually reach parity. But it is uncertain how quickly this will
happen. The current incremental capital estimates in the cost analysis is quite conservative in that future
decreases in incremental cost have not been incorporated.
City of Edmonton Greenhouse Gas Management Plan 2019-2030 Civic Operations
Page 11
GHG REDUCTION
TARGET SCENARIO
TOTALS OVER THREE
BUDGET CYCLES
(2019-30)
BUILDING RETROFIT
SOLAR PV
LED STREET LIGHT
ELECTRIC BUS
GREEN ELECTRICITY
GREEN NATURAL
GAS
CARBON OFFSETS
TOTAL
Scenario 1
30% below 2005
(153,000 tonnes)
Tonnes GHG reduced
45,000 10,000 5,500 17,800 72,900 - - 151,200
Capital Costs $80M $46M $20M $194M - - - $340M
Operating Cost*
Minimal with respect to ongoing operating of assets. 15 to 25% internal resource needs on PM side already accounted for within Capital
Costs
Starting in 2023:
3.9M/yr - -
Starting in 2023:
$3.9M/yr
FROI NPV Benefit
$105M $9M $25M $52M -$61M - - $130M
Scenario 2 50% below
2005 (237,000 tonnes)
Tonnes GHG reduced
Same as 30% reduction scenario
169,000 - - 247,000
Capital Costs - - - $340M
Operating Costs**
By 2030: $9.75M/yr
- - By 2030:
$9.75M/yr
FROI NPV Benefit
-$115M - - $76M
Scenario 3
Carbon Neutral***
(449,000 tonnes)
Tonnes GHG reduced
60,000 15,000 5,500 17,800 159,000 49,000 136,000 442,300
Capital Costs $106M $69M
Same as 50% reduction scenario
- - - $389M
Operating Costs**
Minimal with respect to ongoing operating of assets. 15 to 25%
internal resource needs on PM side
already accounted for within Capital Costs
By 2030: $9.75M/yr
By 2030: $4.8M-$8.7M/yr
By 2023: $6.8M/yr
$19.1M-
$30.5M/yr
FROI NPV Benefit
$140M $13M Same as 50%
reduction scenario -$115M
-$95 to -$171M
-$98M -$154M to
-$78M
Assumptions based on one conceptual Green Electricity Purchase example:
*One 20 year contract starting in 2023, electricity consumption coverage of ~40% assumed to be a 50/50 split of wind and solar. Operating costs
include existing $1.5M base budget for green electricity purchases.
**Multiple 20 year electricity contracts. The first with incrementally increasing funds up until 2023. The second two in 2023 and 2027 are
constant amounts each year. Operating costs include existing $1.5M base budget for green electricity purchases.
*** Carbon neutral refers to the overall scenario target not a specific aspect of the plan such as carbon neutral buildings.
***Multiple (three) 20 year electricity contracts. The first with incrementally increasing funds up until 2023. The second two in 2023 and 2027
are constant amounts each year; One 20 year renewable natural gas contract starting in 2027, 100% coverage; One 20 year carbon offset
contract starting in 2027; coverage of all remaining greenhouse gas emissions.

City of Edmonton Greenhouse Gas Management Plan 2019-2030 Civic Operations
Page 12
1. Purpose
The purpose of this plan is to propose a comprehensive strategy and action plan for reducing greenhouse gas
(GHG) emissions from The City of Edmonton’s civic operations and contributing to Edmonton’s long-term goal of
carbon-neutrality. The various initiatives proposed in this plan (and their underlying assumptions) have been
reviewed and verified by an external consultant — Stantec Inc.
1.1. Background, Mandate and Strategic Alignment for Developing the
Plan
Since approval of the City of Edmonton’s Strategic Plan - The Way Ahead by City Council in 2009, climate
change mitigation through reduction of civic operations and community GHG emissions has been a part of the
City Administration’s mandate. Since July 2010, GHGs from City operations has been one of the performance
measures reported under Corporate Outcome 8: The City of Edmonton’s Operations is Environmentally
Sustainable.
Furthermore, on July 20, 2011, Edmonton City Council approved The Way We Green plan which included: a) a
goal for Edmonton to become “a carbon-neutral city” and b) Strategic Action 6.10.1 directing the
Administration to establish, implement and maintain “a City Operations Greenhouse Gas Management Plan
aimed at significantly reducing greenhouse gas emissions from City operations.”
Implementation of The Way We Green led to development of a detailed strategic framework and action plan
to mitigate climate change and reduce community greenhouse gas emissions between 2012 and 2014. The
result was Edmonton’s Community Energy Transition Strategy, community targets in terms of greenhouse gas
emissions reductions, energy efficiency and resilient energy systems for 2035, and a detailed 8 Year Action
Plan - approved by City Council in April 2015.
Both The Way We Green and Edmonton’s Community Energy Transition Strategy instruct the City to “lead by
example” to achieve its sustainability and resilience goals, and recognizes that the City must model the way for
sustainable living that it wants to encourage in the community.
The city has “lead by example” by developing the Change for Climate Edmonton Declaration (2018) which
commits to “establishing, implementing, and maintaining GHG inventories, targets, action plans and reporting
mechanisms consistent with the Paris Agreement and commitments made through the Global covenant of
Mayors for Climate and Energy”.
The city has also lead by example in development of transformational initiatives including:
Development of Blatchford which will turn 535 acres in the heart of Edmonton into one of the world’s
largest sustainable communities. The neighbourhood will create an opportunity for 30,000 residents
to live a unique and sustainable lifestyle. The community will incorporate best practices for
sustainable urban design including increasing density; prioritizing design that promotes walking,
cycling or transit; creating a mix of housing, retail, commercial and public spaces; and incorporating
significant park and green spaces.
Support for a Downtown District Energy system. In 2017, ENMAX released a Design Basis Document

City of Edmonton Greenhouse Gas Management Plan 2019-2030 Civic Operations
Page 13
that outlines the design, construction, and operation of a potential Downtown District Energy System
(DES), which would provide cost-effective and environmentally responsible thermal energy to
individual buildings in the downtown core. City Council has approved additional funding to further
advance the design of this system in order to make informed decisions on the potential future
construction of this system. Additional work being conducted in 2018 will also include assessment of
City buildings, in the area of the District Energy system, for deep green retrofits that would
compliment a possible district energy system.
The new City of Edmonton Greenhouse Gas Management Plan (2019-2030 Civic Operations) was developed in
accordance with the implementation of the Edmonton’s Community Energy Transition Strategy and 8 Year
Action Plan, specifically under Tactic 4.7.15B: Update the City Operations Greenhouse Gas Management Plan.
The main drivers for the need to update the 2012 Plan include:
Changes in inventory and reporting best practices recommends the inclusion of GHG emissions from
public transit assets and operations. These GHG emission sources were excluded in previous
municipal / public section greenhouse gas inventory protocols and therefore management plans. The
2012 Plan was developed based on the ICLEI International Local Government GHG Emissions Analysis
Protocol (IEAP) (Version 1.0, October 2009)1. However, since the development of the 2012 Plan, the
older protocol has become obsolete and been replaced by The Climate Registry (TCR) General
Reporting Protocol2 (Version 2.1, January 2016) as the best practice for local government greenhouse
gas emissions quantification and reporting.
Strengthening the alignment with emerging federal and provincial policies and programs.
o Pan Canadian Framework: To demonstrate Canada’s commitment to the Paris Agreement,
the federal government led the collaborative development of The Pan Canadian Framework
for Clean Growth and Climate Change - a collective plan to grow the economy while reducing
emissions and building resilience to adapt to a changing climate. The plan aims to reduce
greenhouse gas emissions by 30% below 2005 by 2030 and was endorsed by eight provinces
(including Alberta) and three territories in fall 2016. The City’s 2012 Plan has a baseline year
of 2008.
o Alberta’s Climate Leadership Plan; and Renewable Electricity Plan (REP): Alberta’s Climate
Leadership Plan provides both a framework and funding sources through the introduction of
the carbon levey to accelerate climate change action in the province. The REP is expected to
add 5,000 megawatts of renewable electricity capacity by 2030, enable accelerated shut-
down of coal fired generation and will put Alberta on a path to achieve its target of 30%
renewable electricity by that time.
The Way Ahead Renewal: Includes review and update of corporate outcomes, performance
measures, and targets; an opportunity to affirm Council commitment to climate change mitigation;
1ICLEI. 2009. International Local Government GHG Emissions Analysis Protocol (IEAP) (Version 1.0, October2009) http://archive.iclei.org/fileadmin/user_upload/documents/Global/Progams/CCP/Standards/IEAP_October2010_color.pdf 2 The Climate Registry. 2016.General Reporting Protocol for the Voluntary Reporting Program. (Version 2.1, January 2016) http://www.theclimateregistry.org/tools-resources/reporting-protocols/general-reporting-protocol/ The Climate Registry. 2010. Local Government Operations (LGO) Protocol for the Quantification and Reporting of Greenhouse Gas Emissions Inventories (Version 1.1, May 2010). https://www.arb.ca.gov/cc/protocols/localgov/pubs/lgo_protocol_v1_1_2010-05-03.pdf

City of Edmonton Greenhouse Gas Management Plan 2019-2030 Civic Operations
Page 14
Better data and information; changing technologies; improved internal processes: improved energy
management platform, routine building energy audits to support improved integration of energy
retrofits with routine capital rehabilitation program, greater understanding and industry capacity of
building energy modeling for existing buildings; emerging technologies like electric buses, along with
dramatic price decrease in technologies like solar photovoltaics, LED lighting, etc.
Based on the drivers outlined above and the Energy Transition Plan’s strategic direction of dynamic steering,
this compels Administration to review and revise dated assumptions and previous cost benefit results that no
longer apply.

City of Edmonton Greenhouse Gas Management Plan 2019-2030 Civic Operations
Page 15
2. Principles & Approaches Used to Develop This Plan
This plan applies the following approaches, including but not limited to those proposed in The Way We Green and
Edmonton’s Community Energy Transition Strategy:
Acknowledge that there is an environmental cost to emitting carbon dioxide that is not reflected in
traditional economic models and pricing systems; (Refer to Section 3: The Cost of Carbon)
Apply best management practices to ensure its investment and operating decisions are informed by
triple-bottom-line analyses, financial lifecycle analyses to understand cost and benefits of investment
options over their life spans including cost of carbon and other externalities in these analyses; and
application of consistent, conservative methodologies for estimating future energy prices.
Recommends a hierarchical investment approach that where possible, prioritizes in the following order
“Avoid” (avoiding wasteful energy and carbon-intensive practices and/or purchasing or construction of
new assets), “Reduce” (improve energy efficiency), “Replace” (replacing high carbon energy sources with
low carbon sources) and “Offset” (where action is taken to reduce GHG emissions in one place to offset
emissions that occur elsewhere).
Use a dynamic / adaptive steering approach. As we proceed with the civic operations GHG Management
Plan, we understand the need for flexibility. While the initiatives outlined in this Plan represent our best
solutions today, we expect the solutions will evolve over time as: (a) new technologies and information
emerge and/or (b) social, economic and environmental conditions change. As such, the Plan applies a
phased and flexible approach to GHG management, careful not to place all “eggs in one basket” nor take
high risk positions that could lock in sub-optimal solutions. Moreover, it calls for a dynamic steering
approach that includes: (a) continual surveillance of risks, opportunities and performance, (b) timely
feedback loops, (c) continual evaluation of next-steps and (d) ability to alter course quickly as new
information and opportunities emerge
Collaborative, integrated implementation approach. This plan was developed through a year long
collaborative process not only with those involved in planning, design and delivery of infrastructure
projects, but also with key internal City stakeholders involved in delivery of essential community building,
social / cultural / recreational programming as well as emergency services. This plan was developed in
recognition that GHG emissions reductions must be carried out in a balanced manner that considers and
addresses impacts to the quality and level of services and programming that the City provides to its
citizens.

City of Edmonton Greenhouse Gas Management Plan 2019-2030 Civic Operations
Page 16
3. The Cost of Carbon
How much should the City of Edmonton be willing to pay to reduce or avoid a tonne of GHG emission? This
complex question is being considered by organizations around the world. The key point of agreement is that GHG
emissions cause a wide range of damage that is not reflected or compensated for in the price of the fossil fuel
consumed. It is argued that these externalities3 should, in some way, be factored into the policy and investment
decisions made by organizations, including local governments. Incorporating a “social cost of carbon” into cost
benefit analysis is an approach that can be used to internalize these costs.
Environment Canada4 describes the concept and derivation of the Social Cost of Carbon:
“The Social Cost of Carbon (SCC) is a term used to describe an estimate of the monetary value in a given
year of worldwide damage that will occur over the coming decades and centuries from emitting one
additional tonne of carbon dioxide (CO2) emissions. Specifically, the SCC represents the marginal damage
of an additional tonne of CO2 emitted into the atmosphere in a given year, expressed in dollars, based on
an assumed global CO2 emissions path.
To calculate the SCC, it is necessary to project the impacts of the assumed global CO2 path on the climate
(e.g., temperature, precipitation and weather events). It is then necessary to determine the physical
impacts associated with those climate impacts (e.g., sea levels, agriculture, forests, water availability,
pests). An economic value then needs to be placed on the physical impacts to generate a monetary value
for the emission.
Once the SCC values are generated, multiplying the appropriate SCC value for a given year by the total
expected CO2 emissions reductions (or increases) for that year, and then summing the discounted values
over the time period considered for analysis, allows these GHG benefits (or costs) to be considered within
cost-benefit analysis…
The SCC values increase over time, as emissions accumulate in the atmosphere and the cost associated
with an additional tonne of CO2 emissions increases.”
Although an internal social cost of carbon has not been established and formally adopted by the City of Edmonton
for use in triple bottom line lifecycle cost benefit analysis and decision making processes, the concept of SCC is
applied to the cost benefit analysis supporting this Plan.
The Unit Net Present Value Cost or Benefit (per tonne of carbon abated over the lifespan of the abatement
measure) of various options is compared to the Net Present Value 50th
(reflecting average probable climate change
impacts) and 95th
percentile SCC values (reflecting lower probability, worst case, high-cost climate change impacts)
for 2019 and 2030 to indicate whether the investment makes sense from a Sustainable Return on Investment
perspective over those future 12 years. If the Unit Net Present Value Cost or Benefit of a particular option is less
costly than the SCC value, it makes sense to proceed. If the Unit Net Present Value Cost or Benefit of a particular
3 An externality is a cost or benefit conferred upon an agent who was not part to the transaction. The presence of externalities leads to a sub-optimal allocation of resources as the full costs to society are not taken into account in agents’ decision making. 4 Environment and Climate Change Canada. 2016. Technical Update to Canada’s Social Cost of Greenhouse Gas Estimates March 2016.

City of Edmonton Greenhouse Gas Management Plan 2019-2030 Civic Operations
Page 17
option is more costly than the SCC value, it means it may not be the most appropriate to invest in that particular
option at this time from a climate change mitigation perspective. That said the SCC does not consider other desired
outcomes of advancing energy efficiency and clean growth such as promoting local economic diversification,
improving economic productivity and competitiveness, etc.

City of Edmonton Greenhouse Gas Management Plan 2019-2030 Civic Operations
Page 18
4. Description of the City’s reporting program
To estimate GHG emissions, from corporate operations, the City applies the TCR Local Government Operations
(LGO) Protocol for the Quantification and Reporting of Greenhouse Gas Emissions Inventories (Version 1.1, May
2010) (the TCR Protocol). The TCR Protocol identifies a number of GHG emissions sources that should be included
in a municipal government’s GHG Inventory.
Buildings Emissions: Includes GHG emissions from owned and leased5 facilities where the City pays utility
costs.
Fleet Emissions: Includes emissions from all vehicles operated by City departments, including Transit
operations.
Streetlights Emissions: Includes greenhouse gas emissions from electricity used to power roadway lights,
traffic lights and signals, lane lights, security lights, and miscellaneous lighting throughout Edmonton.
Landfill Emissions: Includes emissions from three landfills that are owned by the City of Edmonton:
Beverly Landfill (Rundle Park), South Side (Millwoods Golf Course) and Clover Bar Landfill.
Water and Wastewater Treatment and Drainage Emissions: Emissions from water and water treatment,
and drainage are not included in the City of Edmonton’s inventory given that responsibility for these
operations resides with EPCOR. Based on legal review, EPCOR, although a corporation wholly owned by
The City of Edmonton, has a governance structure that might not meet the protocol’s definition of
“operational control”. EPCOR has reported its energy use and GHG emissions voluntarily to the City.
EPCOR will establish a GHG Management Plan with associated policy, procedures, action plans, reduction
targets, and performance metrics. The reduction targets and performance metrics associated with Water,
Wastewater, and Drainage in the City of Edmonton will be brought forward to City Council for approval as
part of the Performance Based Rates (“PBR”) application process. Capital projects and operating activities
required to achieve the reduction targets will be brought forward in PBR applications or potentially as a
Non-Routine Adjustment (“NRA”) when significant reduction opportunities are identified outside the PBR
cycle. The various reduction scenarios presented in the management plan excludes emissions from
EPCOR.
Green Electricity: includes displacement of electricity consumed by the corporation through the purchase
of renewable energy credits. Section 8.1 of this report provides greater detail on green electricity. The
purchase of green electricity from off-site wind and solar farms is the single most cost efficient (from an
intial cost perspective) and expedient option for aggressive reductions of the City’s GHG emissions, and
the least impacted by the constraints of city operations noted throughout this report.
5 This could include facilities where the City is the leasee (Scope 1 or 2 emissions) or the leasor (Scope 3 emissions).

City of Edmonton Greenhouse Gas Management Plan 2019-2030 Civic Operations
Page 19
5. Review of the City of Edmonton’s Civic Operations Energy
Assets
Table 1 and Table 2, and Figure 1 and Figure 2 below present quantities and percent breakdowns of the energy use
and GHG emissions by fuel type and City asset type.
Table 1: Energy Use by Fuel Type Consumed and City of Edmonton Asset Type (2016)
ASSET TYPE ELECTRICITY (KWH) NATURAL GAS (GJ) GASOLINE
(GJ) DIESEL (GJ) TOTAL (GJ)
Buildings 165,613,385 1,318,717 - - 1,914,925
Street Lights 76,611,562 - - - 275,802
Fleet 34,688,3036 - 221,225 1,123,893 1,470,042
Waste Management Facilities*
28,585,597 142,534 6,125 143,066 394,646
Water & Wastewater Treatment
Included in EPCOR’s energy use and GHG inventory (Appendix A)
Drainage** 5,910,361 48,091 16,740 31,893 118,033
Total 311,409,208 1,509,342 244,090 1,298,852 4,173,448
*Includes all Waste Services buildings and fleet related to collections, processing and disposal.
**Drainage energy use and Greenhouse Gas Emissions will be transferred to EPCOR for the 2017 reporting year and are therefore not included in
forecasting and savings estimates.
Figure 1: Percent Breakdown of Energy Use by Fuel Type and by GHG by Asset Type (2016)
Table 2 identifies City assets that both created and reduced emissions in 2016. The City of Edmonton’s urban forest
includes trees and vegetation planted at City-owned properties and right of way, Renewable Energy Certificates
(RECs) are certificates that the City currently purchases to offset its electricity emissions. Further discussion is
provided on RECs in section 8.1 of this report.
6 LRT train operations only

City of Edmonton Greenhouse Gas Management Plan 2019-2030 Civic Operations
Page 20
Table 2: GHG Emissions and Reductions by Fuel Type Consumed and City of Edmonton Asset Type, tCO2e (2016)
ASSET TYPE ELECTRICITY NATURAL
GAS GASOLINE DIESEL METHANE
CARBON DIOXIDE
TOTAL
Emissions
Buildings 157,333 68,675 - - - - 226,008
Street Lightings 72,781 - - - - - 72,781
Fleet (excl. Transit) - - 12,364 19,993 - - 32,357
Transit Fleet 32,954 - 3,516 59,863 - - 96,333
Solid Waste Facilities
27,156 7,423 440 10,345 - - 45,364
Drainage 5,615 2,504 1,194 2,350 - - 11,663
Landfills - - - - 36,242 - 36,242
Emissions Subtotal 295,839 78,603 17,515 92,551 36,242 - 520,750
Reductions
Urban Forest - - - - - (3,484) (3,484)
Renewable Electricity Credits
- - - - - (72,891) (72,891)
Total 295,839 78,603 17,515 92,551 36,242 (76,375) 444,375
Figure 2: GHG Emissions Percent Breakdown by Fuel Type and by Asset Type (2016)

City of Edmonton Greenhouse Gas Management Plan 2019-2030 Civic Operations
Page 21
6. Baseline Greenhouse Gas Emissions Forecast
The Business-As-Usual Forecast assumes the following reductions are already in place through existing City policies
and programs:
Implementation of C532 Sustainable Building Policy;
Completion of $9Million of energy retrofit to City-owned buildings over 2015-18 budget and
Conversion of street light fixtures to LED (approx. 4,000 units/year).
Two other driving factors for decreasing greenhouse gas emission from City operations that are not directly related
to City interventions are the year over year decrease in landfill gas emissions from the City’s 3 closed landfills, and
the expected decrease in the carbon intensity of the provincial electricity grid or ‘greening the grid7’ due to the
phasing out of coal plants and developing more renewable energy.
The reductions from these ‘Business As Usual’ factors are summarized in Table 3 below.
Table 3: Anticipated Business As Usual Greenhouse Gas Reductions from City of Edmonton Civic Operations
GHG MITIGATING ACTIONS
FIRST YEAR OF PROGRAM OR WHEN
REDUCTIONS BEGIN TO BE REALIZED
RATE OF DEPLOYMENT PER
4 YEAR BUDGET CYCLE
TOTAL GHG REDUCED PER YEAR BY 2030 DUE TO
IMPLEMENTATION OF THE ACTION
City Policy C532 Standard - Minimum 40% better energy and greenhouse gas savings as compared to Code
8
2021 10 to 15 buildings*; 11,000 tonnes
1% for on-site energy generation 2021 10 to 15 buildings*; 3,400 tonnes
Energy retrofit of existing buildings during 2015-18 cycle
2017 10 to 15 building projects**
10,000 tonnes
LED Street Light Replacement 2012
4,000 units /year of various street light types (e.g., arterial, collector, local, alley)
5,100 tonnes
Total GHG Reduced based on CoE initiatives
29,500 tonnes
Emissions reduced from closed City-owned landfills
8,300 tonnes
Emissions reduced from City’s electricity consumption due to greening the grid.
140,400 tonnes
Total Reductions not attributed to CoE initiatives
148,700 tonnes
Total Reductions 178,200 tonnes * Estimated based on 34 new buildings proposed in the 10 year capital plan; and approx. 50 buildings built between 2005 and 2016 that were over 500 sq.m. It should be noted that these savings are reductions from the business as usual. New construction will increase the total carbon emissions of the city however alignment with C532 will reduce these emissions to 11,000 tCO2e less than construction to code.
7 Climate Leadership Plan, https://www.alberta.ca/climate-leadership-plan.aspx 8 2011 National Energy Code for Buildings (as adopted by the Alberta Building Code)
City of Edmonton Greenhouse Gas Management Plan 2019-2030 Civic Operations
Page 22
**Based on extrapolation of the number of buildings covered by the energy audits, the GHG savings potential of those buildings, the capital cost of achieving those savings and the 2015-2018 funding for energy retrofits. And confirmed by IIS in completion of the first retrofits that this savings is reflective of actual savings. Refer to capital cost and carbon abatement potential from the ‘Modified Sample’ in Table 20.
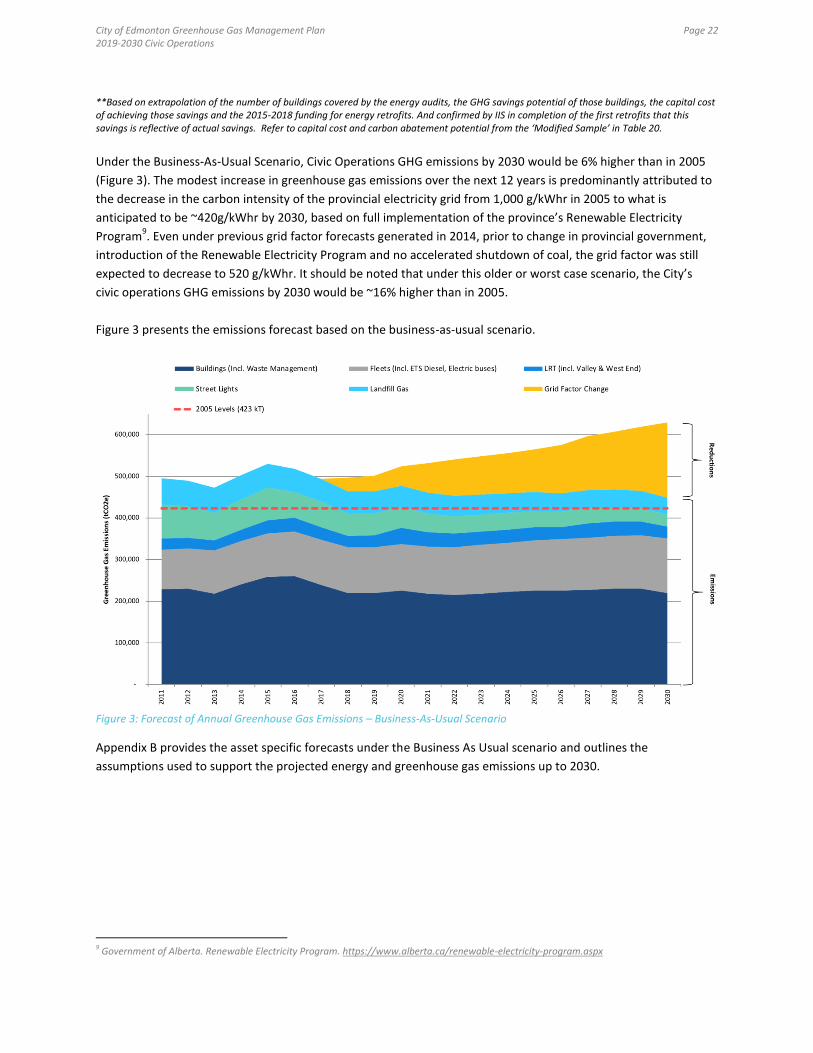
Under the Business-As-Usual Scenario, Civic Operations GHG emissions by 2030 would be 6% higher than in 2005
(Figure 3). The modest increase in greenhouse gas emissions over the next 12 years is predominantly attributed to
the decrease in the carbon intensity of the provincial electricity grid from 1,000 g/kWhr in 2005 to what is
anticipated to be ~420g/kWhr by 2030, based on full implementation of the province’s Renewable Electricity
Program9. Even under previous grid factor forecasts generated in 2014, prior to change in provincial government,
introduction of the Renewable Electricity Program and no accelerated shutdown of coal, the grid factor was still
expected to decrease to 520 g/kWhr. It should be noted that under this older or worst case scenario, the City’s
civic operations GHG emissions by 2030 would be ~16% higher than in 2005.
Figure 3 presents the emissions forecast based on the business-as-usual scenario.
Figure 3: Forecast of Annual Greenhouse Gas Emissions – Business-As-Usual Scenario
Appendix B provides the asset specific forecasts under the Business As Usual scenario and outlines the
assumptions used to support the projected energy and greenhouse gas emissions up to 2030.
9 Government of Alberta. Renewable Electricity Program. https://www.alberta.ca/renewable-electricity-program.aspx

City of Edmonton Greenhouse Gas Management Plan 2019-2030 Civic Operations
Page 23
7. Cost Benefit Analysis Findings
7.1. A Consistent Cost Benefit Approach
In support of a portfolio approach to reducing Greenhouse Gas emissions across the corporation, a consistent
approach was developed and used to compare various GHG abatement options and their associated lifecycle
cost benefits.
The best available and most current capital costs, along with energy and GHG savings and cost savings, and
operations and maintenance savings data were compiled from recently commissioned building energy audits,
business cases, and or schematic design reports in regards to the following options:
Building energy retrofits;
Small scale (e.g., 20 kW on a fire hall) and large scale (e.g., 650 kW on a bus garage) microgeneration,
building-mounted solar photovoltaic systems;
Heat and power cogeneration for buildings;
Electric buses;
LED street lights;
Green electricity from new wind or solar farms.
Input parameters on current and future utility rates and carbon levy, current and forecasted electricity grid
factors, and discount rate were standardized to ensure “apples-to-apples” comparison of cost benefit outputs.
The cost benefit output parameters include: simple payback period, rate of return, unit carbon abatement
cost, net present value benefit to cost ratio, and unit net present value per tonne of carbon abated. Refer to
Appendix E for descriptions and equations of the various cost benefit output parameters.
7.1.1. Cost Benefit of Building Energy Retrofits
Table 4 summarizes the cost benefit results for building retrofits only. A sample of 17 buildings out of the
total of 24 recently commissioned energy audits were reviewed. The 17 buildings are a representative
sample of the City-owned real estate portfolio and covers firehalls, libraries, community centres (e.g.,
seniors centre), leisure centres (e.g., smaller neighbourhood pool and arena facilities), transit centres,
police stations, and industrial / operations facilities (e.g., ecostations, vehicle / bus storage and repair
shops). Seven of the 24 were excluded to prevent over representation of certain building types and size –
specifically ecostations, transit centres and firehalls).
The “All Samples” results shown in the following table covers the 17 buildings. The “Modified Sample”
consists of 11 buildings. It excludes the Mitchell bus garage10
and five buildings under 1,000 square
meters in gross floor area. The rationale was that an accelerated energy retrofit program would be
focused on the largest and most energy or greenhouse gas intensive buildings to realize higher absolute
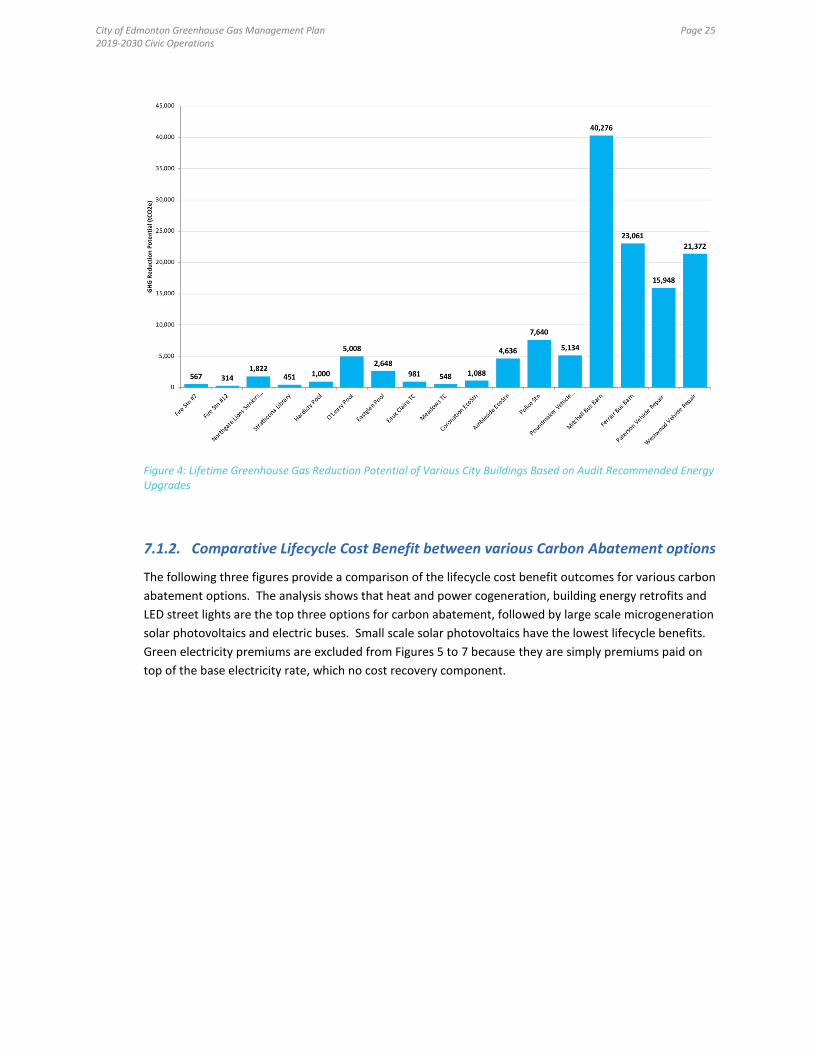
energy and GHG savings, as evidenced by Figure 4, which indicates that there is up to a 100 times
difference in absolute GHG reduction potential between the largest of buildings (e.g., bus barn) as
compared to the smallest of buildings (e.g., transit centre, firehalls).
10 Mitchell Garage’s audit found an unusually high GHG reduction potential. It has been removed to prevent over-estimation of the GHG reduction potential of the overall City-owned building portfolio.

City of Edmonton Greenhouse Gas Management Plan 2019-2030 Civic Operations
Page 24
The cost benefit results between the two different samples were fairly similar, but overall, the modified
sample which is intended to better reflect a focused energy retrofit program did provide slightly better
cost benefit outcomes.
Table 4: Summary of Findings from Review of Recent Building Energy Audits
ALL SAMPLES MODIFIED SAMPLE
PARAMETER AVERAGE MEDIAN AVERAGE MEDIAN
Start of Operation (year) 1974 1974 1973 1975
Square Meters 5004 2137 5618 2346
Energy Use Intensity (ekWh/m2) 1249 960 1388 1003
% Energy Savings Potential relative to baseline (1st yr)
37% 39% 36% 36%
% GHG Reduction Potential relative to baseline (1st yr)
36% 35% 34% 37%
Unit Carbon Abatement Cost $136 $123 $112 $116
NPV/tCO2e over 20 Years $111 $88 $118 $90
Simple Payback (years) 9.9 9.2 10.1 9.1
Discounted Payback (at 2.5%) (years)
10.8 9.4 11.6 9.4
Cost Benefit Ratio (NPV Benefits / Capital Cost)
2.0 0.6 2.5 0.6
Rate of Return (Based on Discounted Payback)
9.2% 10.6% 8.6% 10.9%
Table 4 shows that on average building retrofits (based on the modified sample) can achieve
approximately 35% in both energy savings and greenhouse gas reduction, with simple payback periods of
about 9 years, net present value benefit to cost ratio over 20 years of 3 and rate of return of 9%.
Therefore, the business case for achieving GHG reductions from a financial return on investment is very
strong.
It should be noted that connection to any existing or future district energy system would be considered in
these types of energy retrofits. However development of the district energy system itself is not
considered in this report.
City of Edmonton Greenhouse Gas Management Plan 2019-2030 Civic Operations
Page 25
Figure 4: Lifetime Greenhouse Gas Reduction Potential of Various City Buildings Based on Audit Recommended Energy Upgrades
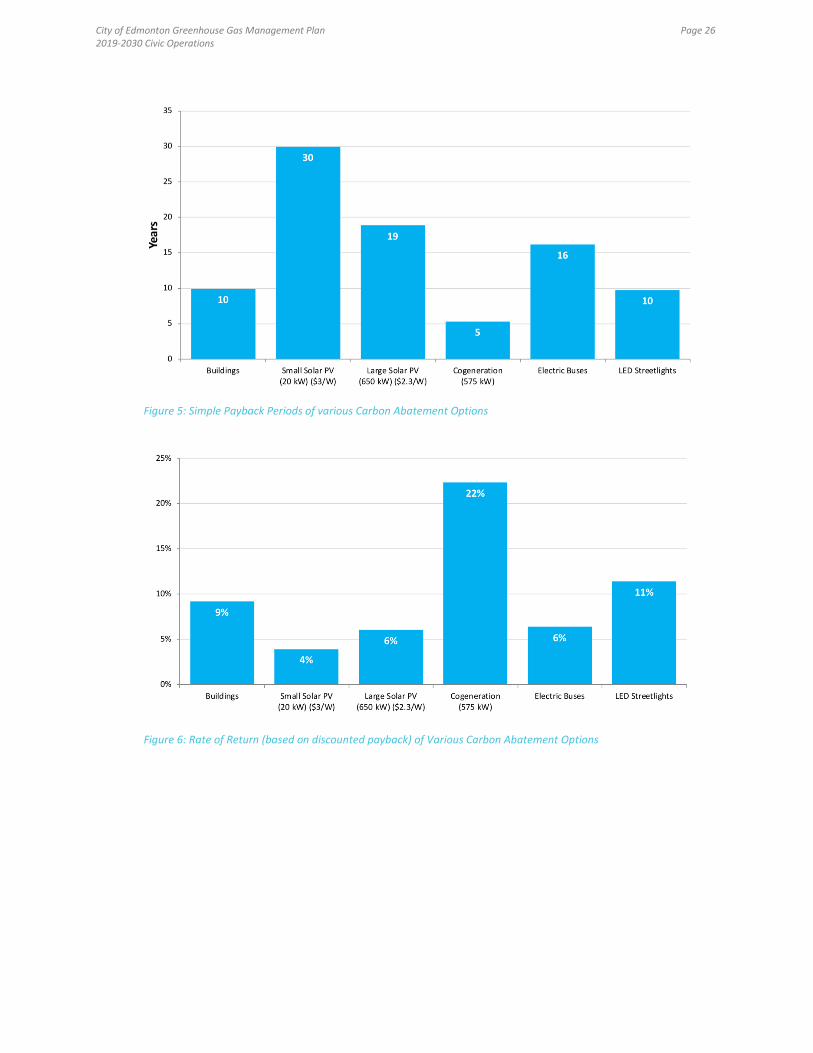
7.1.2. Comparative Lifecycle Cost Benefit between various Carbon Abatement options
The following three figures provide a comparison of the lifecycle cost benefit outcomes for various carbon
abatement options. The analysis shows that heat and power cogeneration, building energy retrofits and
LED street lights are the top three options for carbon abatement, followed by large scale microgeneration
solar photovoltaics and electric buses. Small scale solar photovoltaics have the lowest lifecycle benefits.
Green electricity premiums are excluded from Figures 5 to 7 because they are simply premiums paid on
top of the base electricity rate, which no cost recovery component.
City of Edmonton Greenhouse Gas Management Plan 2019-2030 Civic Operations
Page 26
Figure 5: Simple Payback Periods of various Carbon Abatement Options
Figure 6: Rate of Return (based on discounted payback) of Various Carbon Abatement Options
City of Edmonton Greenhouse Gas Management Plan 2019-2030 Civic Operations
Page 27
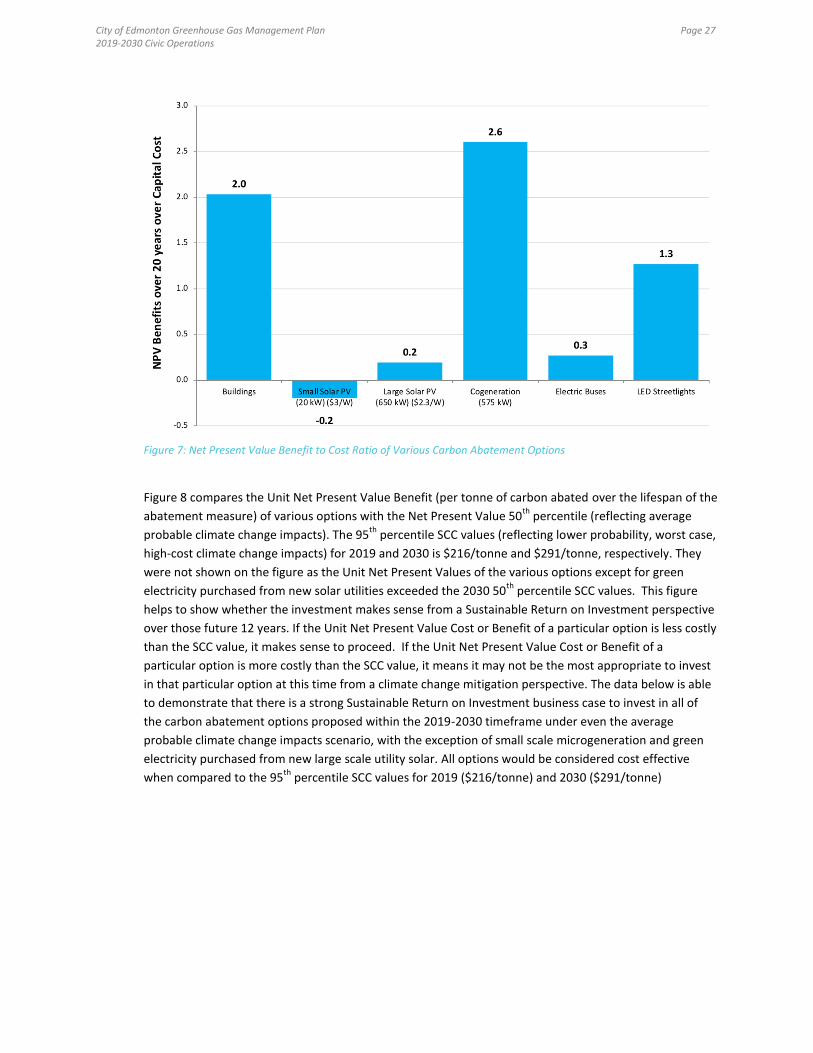
Figure 7: Net Present Value Benefit to Cost Ratio of Various Carbon Abatement Options
Figure 8 compares the Unit Net Present Value Benefit (per tonne of carbon abated over the lifespan of the
abatement measure) of various options with the Net Present Value 50th
percentile (reflecting average
probable climate change impacts). The 95th
percentile SCC values (reflecting lower probability, worst case,
high-cost climate change impacts) for 2019 and 2030 is $216/tonne and $291/tonne, respectively. They
were not shown on the figure as the Unit Net Present Values of the various options except for green
electricity purchased from new solar utilities exceeded the 2030 50th
percentile SCC values. This figure
helps to show whether the investment makes sense from a Sustainable Return on Investment perspective
over those future 12 years. If the Unit Net Present Value Cost or Benefit of a particular option is less costly
than the SCC value, it makes sense to proceed. If the Unit Net Present Value Cost or Benefit of a
particular option is more costly than the SCC value, it means it may not be the most appropriate to invest
in that particular option at this time from a climate change mitigation perspective. The data below is able
to demonstrate that there is a strong Sustainable Return on Investment business case to invest in all of
the carbon abatement options proposed within the 2019-2030 timeframe under even the average
probable climate change impacts scenario, with the exception of small scale microgeneration and green
electricity purchased from new large scale utility solar. All options would be considered cost effective
when compared to the 95th
percentile SCC values for 2019 ($216/tonne) and 2030 ($291/tonne)

City of Edmonton Greenhouse Gas Management Plan 2019-2030 Civic Operations
Page 28
Figure 8: Unit Lifecycle Cost Benefit (NPV) of Various Carbon Abatement Options versus Social Cost of Carbon
7.2. Limitations of Cogeneration
Generating electricity with natural gas through technology like cogeneration can substantially reduce carbon
emissions as compared to consuming electricity from the current electricity grid. Due to the relatively high
electricity prices compared to natural gas, this solution is also very effective at reducing utility costs.
Cogeneration is the most cost effective when implemented and sized to operate in facilities that have
consistently high year round heating loads, such as pools. For this reason, Cogeneration cannot be widely
applied throughout all City buildings. As well, as the grid gets cleaner, the ability for cogeneration to reduce
GHG emissions diminishes. Cogeneration equipment typically has a life of 15 years; therefore if implemented
in the near future, cogeneration could provide effective GHG reductions. For these reasons, it is
recommended that cogeneration be explored on a project by project basis as a part of the broader building
retrofit program, but the civic operations greenhouse gas management plan would not be recommending a
specific cogeneration program.
7.3. Uncertainty of future cost of electric buses
Of all of the carbon abatement options proposed, the future cost of electric buses is considered the most
uncertain due to this technology being in the early stages of market adoption. Building retrofits, LED street
lights and even solar photovoltaics, in comparison, are considered mature and prevalent technologies, where
soft project and labour costs are becoming or have become more of a dominant cost driver than hard costs of
the technologies. For these technologies, the hardware or equipment cost is not expected to experience
substantial decrease in future years. The incremental difference in capital between electric and diesel buses is
expected to dramatically narrow in future years. But it is uncertain how quickly this will happen. The Plan’s
City of Edmonton Greenhouse Gas Management Plan 2019-2030 Civic Operations
Page 29
cost analysis is quite conservative in that future anticipated decreases in incremental cost have not been
incorporated.
7.4. Uncertainty in availability of incentives
Historically, provincial incentives or rebates for municipalities to carry out building energy upgrades or on-site
solar installations have been administered by the Municipal Climate Change Action Centre (MCCAC). For
instance, the currently (2017) active Alberta Municipal Solar Program offers between $0.55/W to $0.90/W
depending on total installed capacity of the system, and helps to cover up to 25% of eligible expenses.
However, these incentives are first come first serve. If available, they could help improve the business case of
a single or a small number of projects, but the City would not be able to depend on a 25% rebate over a large
portfolio of projects that cost several or tens of millions of dollars. More recently, the newly established
Energy Efficiency Alberta has rolled out a number of rebates for businesses, non-profit and institutional
sectors to upgrade their facilities’ lighting, and mechanical systems. But similar to the MCCAC programs, the
funding is not at levels where a large municipality such as Edmonton can depend on to offset capital costs for
large scale deployment of energy upgrades across its building portfolio in a significant way.
Despite uncertainty in availability of incentives the city should make every effort to use available incentives in
the work included in this plan, both to reduce capital costs of projects and to help lead by example. Appendix
E includes more information on incentive programs.
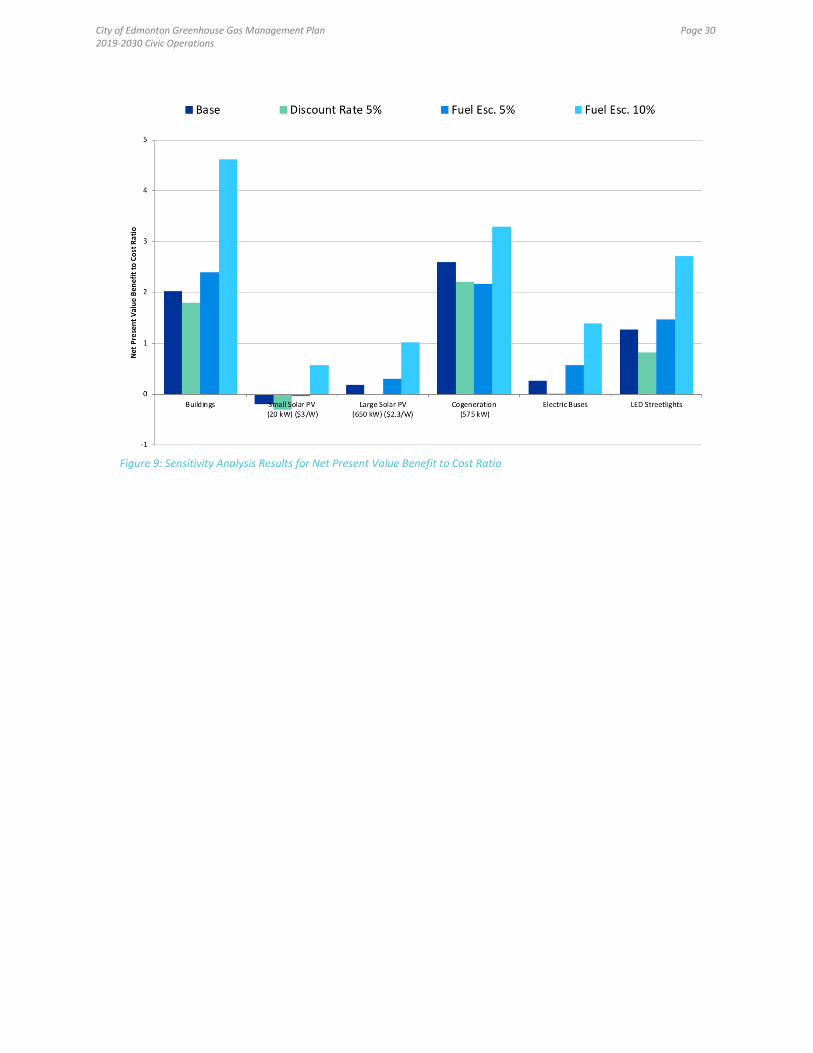
7.5. Sensitivity Analysis
Three different scenarios were evaluated as part of a sensitivity analysis to better understand the implications
of different parameters on lifecycle cost benefit.
Discount rate of 5%: this rate was determined by doubling the discount rate recommended by the
City of Edmonton Finance Department at the time of plan development.
Fuel escalation rate of 5%
Fuel escalation rate of 10%
For each scenario, only the specific parameter in question was changed in the base case, with all other input
parameters remaining the same.
Appendix F provides summaries of the effects these changing parameters have on discounted payback
period, rate of return, net present value benefit to cost ratio and unit net present value benefit per tonne of
carbon abated over 20 years. In general the various financial return on investment metrics for all carbon
abatement options will decrease slightly when the discount rate is increased from 2.5% to 5%, while the
metrics improved as the fuel escalation increased.
City of Edmonton Greenhouse Gas Management Plan 2019-2030 Civic Operations
Page 30
Figure 9: Sensitivity Analysis Results for Net Present Value Benefit to Cost Ratio
City of Edmonton Greenhouse Gas Management Plan 2019-2030 Civic Operations
Page 31
8. Greenhouse Gas Reduction Target Scenarios
Three greenhouse gas reduction scenarios were explored to identify ways that the City of Edmonton could reduce
its greenhouse gas emissions from civic operations:
30% below 2005 baseline by 2030, to align with the Pan Canadian Framework targets;
50% below 2005 baseline by 2030: Target achieved through implementation of Scenario 1 plus additional
green electricity purchase only;
Carbon neutrality by 2030.
Each scenario is accompanied by: greenhouse gas reduction initiatives across buildings, fleets, street lighting and
green energy procurement; the associated preliminary capital and operating budget requirements for the next
three budget cycles to achieve those initiatives; and the lifecycle cost benefits of meeting the specific target.
Detailed methodology and assumptions used to determine the cost benefits of various energy conservation and
greenhouse gas abatement options are found in Appendix E. Scenarios 1 and 2 were developed and supported by
the best available cost information on energy conservation and abatement options that are currently available and
technically feasible for large scale implementation. Scenario 3 is heavily dependent on access to significant
quantities of renewable or low carbon natural gas and alternative vehicle fuels that are not yet widely available
from local or even regional markets. For instance, in 2017 there was no market in Alberta to produce and sell
renewable natural gas or biodiesel with significantly lower carbon content. The technology might exist to produce
these products, but the local/regional market signals and supportive policy framework are not there to enable
deployment at a level that could even meet the City’s fuel consumption levels. Therefore scenario 3 is more
theoretical and highly conceptual at this time, requiring effort and investment by the City to catalyze development
of this emerging industry.
8.1. Background on green electricity procurement
Similar to other public sector organizations within Alberta (e.g., City of Calgary, Alberta Infrastructure), the purchase of renewable energy certificates
11 has been a significant component in the City of Edmonton’s
greenhouse gas emissions management framework to date. Under the 2012 City Operations Greenhouse Management Plan, to achieve the targets set in the Plan to reduce greenhouse gas emissions to 50 percent of 2008 levels by 2020, approximately two thirds of the emissions reductions would be attained through the purchase of renewable energy certificates. Between 2013 and 2016, annual purchases of renewable energy certificates ranged between 20,500 tonnes to 72,900 tonnes (only accounts for approximately 5 to 15% of the City’s total emissions), at an average unit cost of $9 to $10 per tonne per year. The current criteria used by the City for buying renewable energy certificates include:
must be produced in Alberta;
rigorously verified and certified by a reputable organization; and
the least cost of the choices meeting criteria a and b.
Current renewable energy certificates are purchased year to year from wind, hydro, and biomass facilities within the province. Although this procurement approach is very cost effective, it could be considered insufficient for demonstrating true incremental greenhouse gas reductions that are above business as usual. To demonstrate the City’s leadership and commitment to greening the electricity grid, a green electricity
11 Renewable energy certificates are the financial or transactional products that represent the quantity of renewable or green electricity that is purchased by an organization. An organization must purchase the certificates from a renewable electricity facility(ies) in order to claim that its organization uses renewable electricity.

City of Edmonton Greenhouse Gas Management Plan 2019-2030 Civic Operations
Page 32
agreement that is tied to specific new facility(ies) is necessary in order to meet the criteria of ‘additionality’. Other than ‘additionality’, other guiding principles or evaluation criteria for green electricity could include: potential impact on local energy resilience, cost effectiveness, and mitigation of long term electricity price volatility. Descriptions of these principles or criteria are found in Appendix C.
8.2. Scenario 1: 30% below 2005 by 2030
To achieve the Pan Canadian Framework Target of 30% below 2005 levels by 2030, Table 5 identifies the
additional initiatives needed to achieve GHG reductions above and beyond the business-as-usual scenario.
Table 5: Proposed Initiatives to Achieve a Reduction of 30% Greenhouse Gas Emissions below 2005 levels by 2030 from City of Edmonton Civic Operations
ADDITIONAL GHG REDUCTION INITIATIVES
BUSINESS-AS-USUAL DEPLOYMENT PER 4 YEAR BUDGET CYCLE
PROPOSED ADDITIONAL
DEPLOYMENT PER 4 YEAR BUDGET CYCLE
TOTAL NUMBER OF PROJECTS, OR
INSTALLATIONS (2019-2030)
TOTAL REDUCTIONS PER YEAR BY 2030,
BASED ON ANTICIPATED
GREENING GRID
Energy retrofits of existing buildings
012
~35 buildings ~100 building projects
45,000 tonnes
Accelerated microgen solar PV program
13
10 to 15 buildings; or 2.4MW
An additional ~6.9 MW (equivalent to 27 NHL rinks; 44,000 sq.m of roof, wall or ground space)
20 MW (equivalent to 6% of total civic operations electricity use)
10,000 tonnes
Electric Buses 014
220 buses/per cycle starting in 2023
440 buses 17,800 tonnes
LED Street Light Replacement
4,000 units/year of various street light types (e.g., arterial, collector, local, alley)
46,000 units of “low hanging fruit” street lights types (over 1 budget cycle)
46,000 units 5,500 tonnes
Renewable Electricity Procurement
n/a -
45% of corporate electricity consumption (2030)
72,900 tonnes
Total Reductions - - - 151,200 tonnes
Table 6 below outlines the budgetary requirements along with the lifecycle cost benefit in terms of net
present value over the next 20 years for the portfolio of proposed projects to reach the 30% reduction
strategy. Methodology, assumptions and analysis on the capital cost and lifecycle cost benefit is found in
Appendix E.
Many of the energy audit reports did not include project soft costs, such as additional fees to cover detailed
design, project contingencies, and City’s internal technical support and project management into the cost
estimates of the recommended upgrades. Therefore, an additional 15% for project soft cost was applied to the
studies’ estimated capital costs for energy retrofits, cogeneration and solar photovoltaics. The feasibility study
on upgrades of one existing and one proposed bus garages to accommodate electric buses included 25% for
project soft costs and contingencies due to high project complexities. The LED street lighting cost estimate
included a 17% overhead.
12 The 2015-18 capital budget did include a $9 million profile for building energy retrofits however this funding was not approved to continue beyond 2018. 13 See section 9.1 Alignment of Solar Projects for more information. 14 One time purchase of 40 busses between 2017-2023 not an ongoing BAU deployment.

City of Edmonton Greenhouse Gas Management Plan 2019-2030 Civic Operations
Page 33
Table 6: Budgetary Requirements and Lifecycle Cost Benefit of Additional Initiatives to Achieve a 30% Reduction in GHG Emissions below 2005 levels by 2030
TOTAL FUNDING BETWEEN
2019-2030 (TODAY’S DOLLARS)
ADDITIONAL GHG REDUCTION INITIATIVES
BUSINESS-AS-USUAL FUNDING
PER 4 YEAR BUDGET CYCLE
ADDITIONAL FUNDING PER 4 YEAR BUDGET
CYCLE
CAPITAL (ADDITIONAL)
OPERATING
NET PRESENT VALUE
BENEFITS OVER 20
YEARS
Energy retrofits of existing buildings
n/a $26.7 Million $80 Million* - $105 Million
Accelerated microgen solar PV program
~$7 Million** ~$15.3 Million $46 Million***
- $9 Million
Electric Buses n/a
Building infrastructure: $80 Million over 2 to 3 cycles: Buses: $57 Million over 2 cycles
Building Infrastructure: $80 Million Buses: $114 Million
-
$52 Million
LED Street Light Replacement
$3 Million $6.5 Million if divided over 3 cycles
$20 Million - $25 Million
Green Electricity Procurement (New Wind: $20/MWh premium; New Solar: $40/MWh premium) 50/50 solar/wind split assumed, includes $1.5M base funding
- $15.6Million**** -
$3.9 Million -$61 Million
Total New Cost - - $340 Million - $130 Million
*Total cost estimated based on capital cost of $7.5 Million to achieve 6.3 Tonnes/year of offsets (2016’s grid factor), applying a soft project cost factor of 15% and extrapolating it to 45,000 tonnes (assuming 2030 grid factor of 0.42) (Refer to Appendix E: Table 18) **based C532 Policy’s 1% dedicated capital to on-site energy generation; and each installation being able to offset on average 5% of the energy use amongst each new capital building projects, and unit install cost of $2.75/W ***based on current large scale microgeneration solar PV installation (e.g., 650 kW) cost of $2.3/W, solar generation potential of 1,150 kWh/kW/year and including a soft project cost factor of 15% **** Total summed operating cost for four years of green electricity procurement.
Figure 10 shows the Forecast of the Annual Greenhouse Gas Emissions under the 30 Percent Reduction Scenario.

City of Edmonton Greenhouse Gas Management Plan 2019-2030 Civic Operations
Page 34
Figure 10: Forecast of Annual Greenhouse Gas Emissions – 30 Percent Reduction Scenario
15
8.3. Scenario 2: 50% below 2005 by 2030
If the City of Edmonton proposes to exceed the Pan Canadian Framework and further demonstrate leadership to achieve a more aggressive reduction target – i.e., achieve a 50% below 2005 levels by 2030, additional reductions should happen through increased green electricity purchase. One scenario is to simply increase the green electricity purchased from ~50% of the electricity consumed by the City to 100% of the corporate consumption. The details of this purchase methodology are provided in Appendix C. Scenario 2 does not propose any additional capital investments in City assets. Table 7 provides an overview of the GHG savings from Scenario 2.
Table 7: Additional Initiatives to Achieve a GHG Reduction of 50% Below 2005 Levels by 2030 (Scenario 2)
ADDITIONAL GHG REDUCTION INITIATIVES
BUSINESS-AS-USUAL RATE OF
DEPLOYMENT PER 4 YEAR BUDGET CYCLE
ADDITIONAL DEPLOYMENT PER 4 YEAR BUDGET CYCLE
TOTAL NUMBER OF
PROJECTS, OR INSTALLATIONS
(INCL. BAU)
TOTAL REDUCTIONS PER YEAR BY 2030, BASED
ON ANTICIPATED GREENING GRID (ABOVE
BAU SCENARIO)
Energy retrofits of existing buildings
016
~35 buildings ~100 building projects
45,000 tonnes
Accelerated microgen solar PV program
17
10 to 15 buildings; or 2.4MW
An additional ~6.9 MW (equivalent to 27
20 MW (equivalent to
10,000 tonnes
15 Exact timing and rate of green electricity purchase will impact the wedge reduction intermittent profile although the 2030 outcome will remain unaffected. 16 The 2015-18 capital budget did include a $9 million profile for building energy retrofits however this funding was not approved to continue beyond 2018. 17 See section 9.1 Alignment of Solar Projects for more information.

City of Edmonton Greenhouse Gas Management Plan 2019-2030 Civic Operations
Page 35
NHL rinks; 44,000 sq.m of roof, wall or ground space)
6% of total corporate electricity use)
Electric Buses 018
220 buses/per cycle starting in 2023
440 buses 17,800 tonnes
LED Street Light Replacement
4,000 units/year of various street light types (e.g., arterial, collector, local, alley)
46,000 units of “low hanging fruit” street lights types (over 1 budget cycle)
46,000 units 5,500 tonnes
Green Electricity Procurement
- -
~100% of civic operations electricity consumption (2030)
169,000 tonnes
Total Reductions - - - 247,000 tonnes
Grayed out denotes same level of deployment as prescribed in 30% reduction target scenario
Table 8 below outlines the budgetary requirements along with the lifecycle cost benefit in terms of net present value over the next 20 years for the portfolio of proposed projects in Scenario 2. This scenario proposes the same level of capital investment as Scenario 1. But the long term net present value cost benefit for Scenario 2 is lower than Scenario 1 and could potentially be in the negative because the additional green electricity purchased. As green electricity is simply a premium paid on top of existing electricity cost, the greater the purchase, the greater the cost; and this additional cost is not offset by any additional positive NPV benefits that could be realized from additional capital investments in energy efficiency of City assets.
Table 8: Budgetary Requirements and Lifecycle Cost Benefit of Proposed Incremental Greenhouse Gas Reduction Initiatives to Achieve a 50% below 2005 Levels by 2030 (Scenario 2)
TOTAL ADDITIONAL FUNDING
BETWEEN 2019-2030 (TODAY’S DOLLARS)
ADDITIONAL GHG
REDUCTION INITIATIVES
BUSINESS-AS-USUAL
FUNDING PER 4 YEAR BUDGET
CYCLE
ADDITIONAL FUNDING PER 4
YEAR BUDGET CYCLE CAPITAL OPERATING
NET PRESENT VALUE BENEFITS OVER 20 YEARS
Energy retrofits of existing buildings
n/a $26.7 Million $80 Million* - $105 Million
Accelerated microgen solar PV program
~$7 Million** ~$15.3 Million $46 Million*** - $9 Million
Electric Buses n/a
Building infrastructure: $80 Million over 2 to 3 cycles: Buses: $57 Million over 2 cycles
Building Infrastructure: $80 Million Buses: $114 Million
- $52 Million
LED Street Light Replacement
$3 Million $6.5 Million if divided over 3 cycles
$20 Million - $25 Million
Green Electricity Procurement (New Wind: $20/MWh
- See table below - See table
below
-$115 Million
18 One time purchase of 40 busses between 2017-2023 not an ongoing BAU deployment.
City of Edmonton Greenhouse Gas Management Plan 2019-2030 Civic Operations
Page 36
premium; New Solar: $40/MWh premium)
Total New Cost n/a -- $340 Million See table
below $76Million
Grayed out denotes cost reflect same level of deployment as prescribed in 30% reduction target scenario
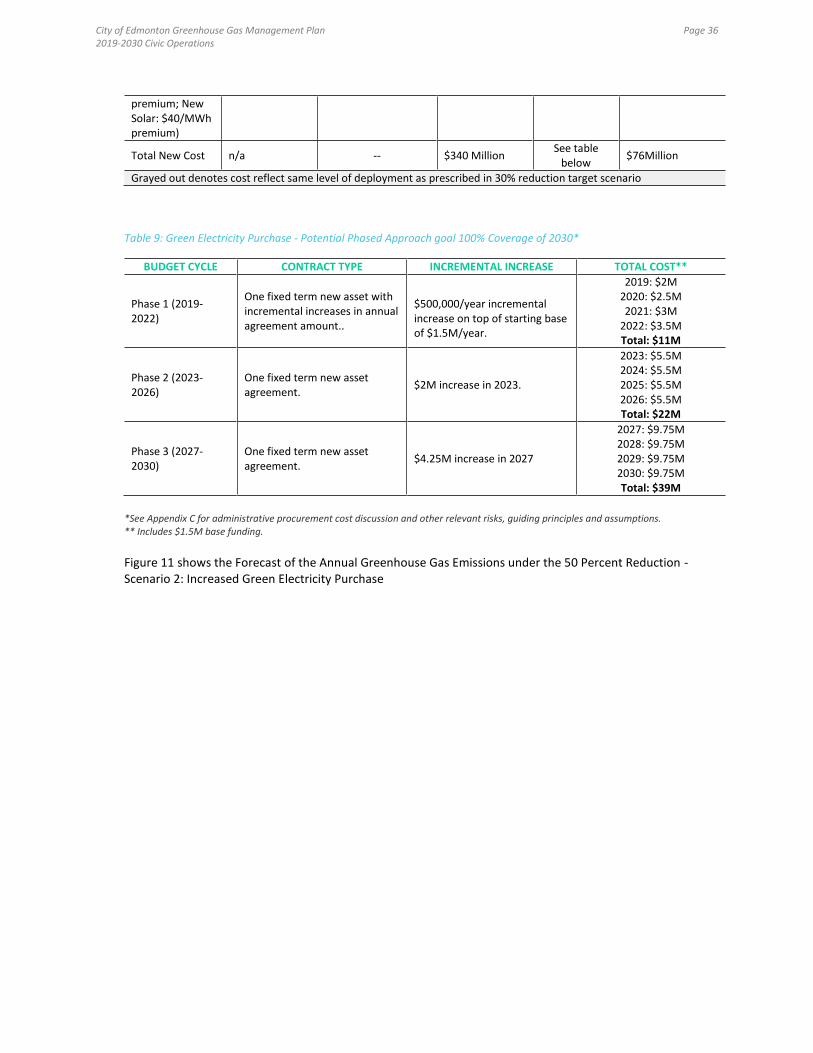
Table 9: Green Electricity Purchase - Potential Phased Approach goal 100% Coverage of 2030*
BUDGET CYCLE CONTRACT TYPE INCREMENTAL INCREASE TOTAL COST**
Phase 1 (2019-2022)
One fixed term new asset with incremental increases in annual agreement amount..
$500,000/year incremental increase on top of starting base of $1.5M/year.
2019: $2M 2020: $2.5M 2021: $3M
2022: $3.5M Total: $11M
Phase 2 (2023-2026)
One fixed term new asset agreement.
$2M increase in 2023.
2023: $5.5M 2024: $5.5M 2025: $5.5M 2026: $5.5M Total: $22M
Phase 3 (2027-2030)
One fixed term new asset agreement.
$4.25M increase in 2027
2027: $9.75M 2028: $9.75M 2029: $9.75M 2030: $9.75M Total: $39M
*See Appendix C for administrative procurement cost discussion and other relevant risks, guiding principles and assumptions. ** Includes $1.5M base funding.
Figure 11 shows the Forecast of the Annual Greenhouse Gas Emissions under the 50 Percent Reduction - Scenario 2: Increased Green Electricity Purchase

City of Edmonton Greenhouse Gas Management Plan 2019-2030 Civic Operations
Page 37
Figure 11: Forecast of Annual Greenhouse Gas Emissions – 50 Percent Reduction Scenario 2: Increased Green Electricity Purchase
19
8.4. Scenario 3: Carbon Neutral
This last scenario simply builds upon Scenario 2 and further reduces the remaining tonnes through the
purchase of renewable natural gas to offset 100% of natural gas use by buildings, and carbon offsets to offset
all emissions from vehicle fleets.
Table 10: Proposed Incremental Greenhouse Gas Reduction Initiatives to Achieve Carbon Neutrality by 2030
ADDITIONAL GHG REDUCTION INITIATIVES
BUSINESS-AS-USUAL RATE OF DEPLOYMENT PER 4 YEAR BUDGET CYCLE
ADDITIONAL DEPLOYMENT PER 4 YEAR BUDGET CYCLE
TOTAL NUMBER OF PROJECTS, OR INSTALLATIONS (INCL. BAU)
TOTAL REDUCTIONS PER YEAR BY 2030, BASED ON 2030 GRID FACTOR (ABOVE BAU SCENARIO)
Energy retrofits of existing buildings
020
~45 buildings ~135 building projects
60,000 tonnes
Accelerated microgen solar PV program
10 to 15 buildings; or 2.4MW
An additional 10 MW (equivalent to 40 NHL rinks; 45,000 sq.m of roof, wall or
30 MW (equivalent to 9% of total civic operations electricity
15,000 tonnes
19 Exact timing and rate of green electricity purchase will impact the wedge reduction intermittent profile although the 2030 outcome will remain unaffected. 20 The 2015-18 capital budget did include a $9 million profile for building energy retrofits however this funding was not approved to continue beyond 2018.

City of Edmonton Greenhouse Gas Management Plan 2019-2030 Civic Operations
Page 38
ground space) consumption)
Electric Buses 021
220 buses/per cycle starting in 2023
440 buses 17,800 tonnes
LED Street Light Replacement
4,000 units/year of various street light types (e.g., arterial, collector, local, alley)
46,000 units of “low hanging fruit” street lights types (over 1 budget cycle)
46,000 units 5,500 tonnes
Green Electricity Procurement
- -
100% of civic operations electricity consumption by or before 2030
159,000 tonnes
Green Natural Gas - -
100% of civic operations natural consumption by or before 2030
49,000 tonnes
Other Carbon Offsets
- - - 136,000 tonnes
Total Reductions (excl. Grid Factor Change)
- - - 442,300 tonnes
Grayed out denotes same level of deployment as prescribed in 50% reduction target scenario
Table 11: Budgetary Requirements and Lifecycle Cost Benefit of Proposed Incremental Greenhouse Gas Reduction Initiatives to Achieve Carbon Neutrality for City operations by 2030
TOTAL ADDITIONAL
FUNDING BETWEEN 2019-2030 (TODAY’S DOLLARS)
ADDITIONAL GHG REDUCTION INITIATIVES
BUSINESS-AS-USUAL FUNDING
PER 4 YEAR BUDGET CYCLE
ADDITIONAL FUNDING PER 4 YEAR BUDGET
CYCLE CAPITAL OPERATING
NET PRESENT VALUE BENEFITS OVER 20 YEARS
Energy retrofits of existing buildings
N/A $35 Million $106 Million - $140 Million
Accelerated microgen solar PV program
~$7 Million ~$20 Million $69 Million - $13 Million
Electric Buses n/a
Building infrastructure: $80 Million over 2 to 3 cycles: Buses: $57 Million over 2 cycles
Building Infrastructure: $80 Million Buses: $114 Million
- $52 Million
LED Street Light Replacement
$3 Million $6.5 Million if divided over 3 cycles
$20 Million - $25 Million
Green Electricity (New Wind: $20/MWh premium; New Solar: $40/MWh premium)
- See table below
- See table below
-$115 Million
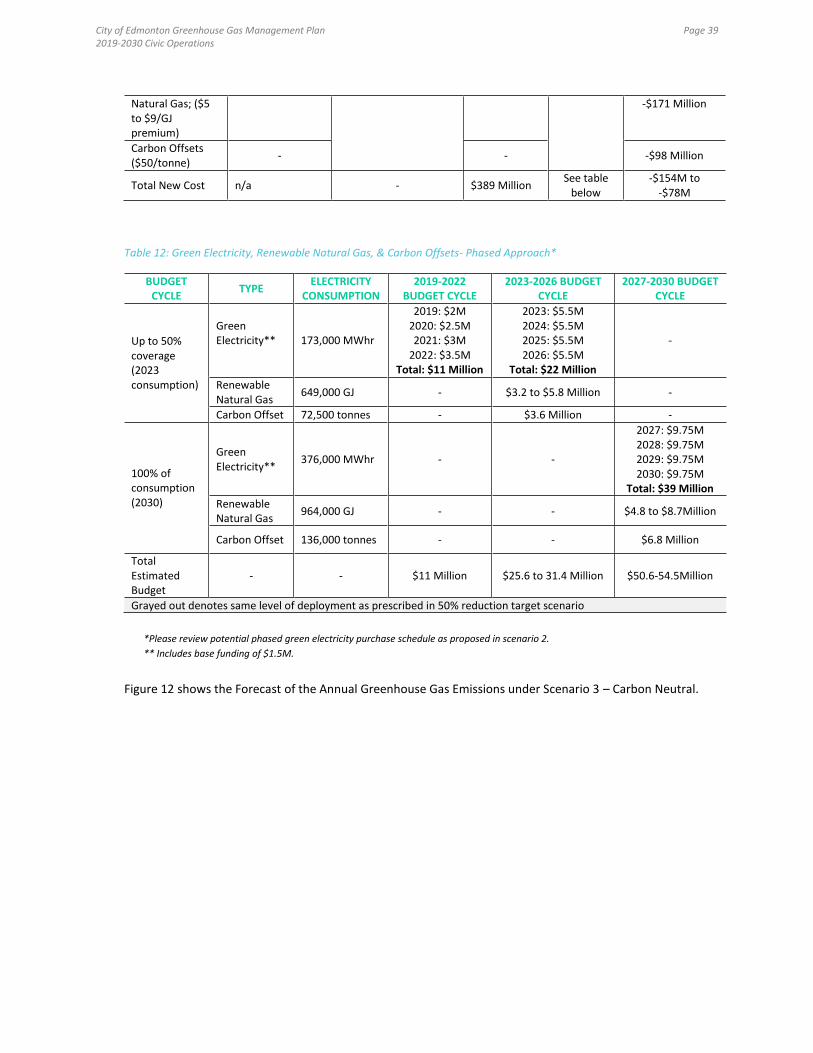
Renewable - - -$95 Million to
21 One time purchase of 40 busses between 2017-2023 not an ongoing BAU deployment.
City of Edmonton Greenhouse Gas Management Plan 2019-2030 Civic Operations
Page 39
Natural Gas; ($5 to $9/GJ premium)
-$171 Million
Carbon Offsets ($50/tonne)
- - -$98 Million
Total New Cost n/a - $389 Million See table
below -$154M to
-$78M
Table 12: Green Electricity, Renewable Natural Gas, & Carbon Offsets- Phased Approach*
BUDGET CYCLE
TYPE ELECTRICITY
CONSUMPTION 2019-2022
BUDGET CYCLE 2023-2026 BUDGET
CYCLE 2027-2030 BUDGET
CYCLE
Up to 50% coverage (2023 consumption)
Green Electricity**
173,000 MWhr
2019: $2M 2020: $2.5M 2021: $3M
2022: $3.5M Total: $11 Million
2023: $5.5M 2024: $5.5M 2025: $5.5M 2026: $5.5M
Total: $22 Million
-
Renewable Natural Gas
649,000 GJ - $3.2 to $5.8 Million -
Carbon Offset 72,500 tonnes - $3.6 Million -
100% of consumption (2030)
Green Electricity**
376,000 MWhr - -
2027: $9.75M 2028: $9.75M 2029: $9.75M 2030: $9.75M
Total: $39 Million
Renewable Natural Gas
964,000 GJ - - $4.8 to $8.7Million
Carbon Offset 136,000 tonnes - - $6.8 Million
Total Estimated Budget
- - $11 Million $25.6 to 31.4 Million $50.6-54.5Million
Grayed out denotes same level of deployment as prescribed in 50% reduction target scenario
*Please review potential phased green electricity purchase schedule as proposed in scenario 2.
** Includes base funding of $1.5M.
Figure 12 shows the Forecast of the Annual Greenhouse Gas Emissions under Scenario 3 – Carbon Neutral.
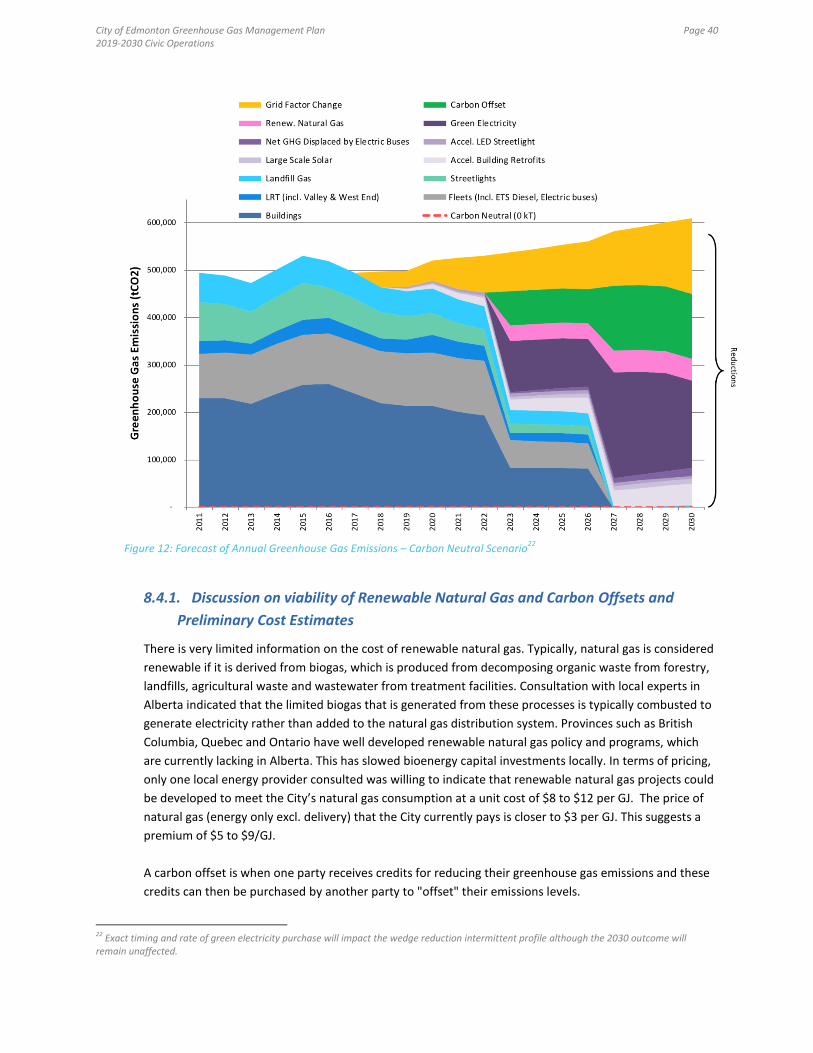
City of Edmonton Greenhouse Gas Management Plan 2019-2030 Civic Operations
Page 40
Figure 12: Forecast of Annual Greenhouse Gas Emissions – Carbon Neutral Scenario
22
8.4.1. Discussion on viability of Renewable Natural Gas and Carbon Offsets and
Preliminary Cost Estimates
There is very limited information on the cost of renewable natural gas. Typically, natural gas is considered
renewable if it is derived from biogas, which is produced from decomposing organic waste from forestry,
landfills, agricultural waste and wastewater from treatment facilities. Consultation with local experts in
Alberta indicated that the limited biogas that is generated from these processes is typically combusted to
generate electricity rather than added to the natural gas distribution system. Provinces such as British
Columbia, Quebec and Ontario have well developed renewable natural gas policy and programs, which
are currently lacking in Alberta. This has slowed bioenergy capital investments locally. In terms of pricing,
only one local energy provider consulted was willing to indicate that renewable natural gas projects could
be developed to meet the City’s natural gas consumption at a unit cost of $8 to $12 per GJ. The price of
natural gas (energy only excl. delivery) that the City currently pays is closer to $3 per GJ. This suggests a
premium of $5 to $9/GJ.
A carbon offset is when one party receives credits for reducing their greenhouse gas emissions and these
credits can then be purchased by another party to "offset" their emissions levels.
22 Exact timing and rate of green electricity purchase will impact the wedge reduction intermittent profile although the 2030 outcome will remain unaffected.
City of Edmonton Greenhouse Gas Management Plan 2019-2030 Civic Operations
Page 41
Alberta is one of the few jurisdictions in North America to have a highly regulated carbon offset market.
To qualify for offset credits, projects must follow strict government approved protocols that ensure
emissions reductions are real, demonstrable, and quantifiable, additional to what would have occurred
otherwise and registered on the Alberta Emission Offset Registry. Once registered, the offsets can be sold
to Alberta's large emitters, regulated under the Specified Gas Emitters Regulation (replaced by the Carbon
Competitiveness Incentive (CCI) regulation in 2017), that have not met their provincially mandated
reduction obligation. The price facilities pay for the offsets is market driven so the price varies.
Carbon offset is a necessary option for City of Edmonton in order to meet an aggressive and ambitious
target like carbon neutral or zero emissions from all City operations. However, instead of being a large
emitter with reduction obligations under the Carbon Competitiveness Incentive (CCI) Regulation, the City
would be voluntarily choosing to participate in the regulation and purchase offset credits from other
activities that have voluntarily reduced their emissions in Alberta. There are over two dozen23
types of
voluntary carbon reduction activities that have protocols to enable carbon offsets to be quantified and
sold. The City of Edmonton’s anaerobic digester is an example of an ideal voluntary activity for generating
offsets. However, if the City were to quantify and sell these offsets, then these reductions would not be
able to be claimed against the City’s own greenhouse gas inventory. The City’s composting facility has
been generating and selling carbon offsets in the hundreds of thousands of tonnes since 2007, but
because they were sold, the City has not been able to claim the reductions against its own inventory. That
said, a project can only be viable as a offset project typically for 7 years and sometimes up to 12 years on
a case by case basis. The time limit ensures that these projects can demonstrate additionality.
Carbon offsets can be a viable, and market driven solution not only for the City to meet its climate change
goals, but when the City buys offsets, it can be a way to incentivize local clean growth and build capacity
for emerging technologies and practices to take root and become business as usual over time. In fact, as
discussed, one of the limitations of energy retrofits in City buildings is the need to mitigate disruptions to
City operations, services/programming for residents. But carbon offsets is a way for the City to
“outsource” carbon reduction from energy efficiency upgrades to private building owners and property
managers whom are looking to revitalize their properties for a myriad of reasons. The City can claim the
offsets, while the energy efficiency becomes more normalized in the industry and community.
23 Alberta Environment and Parks. Offset Credit System Protocols. http://aep.alberta.ca/climate-change/guidelines-legislation/specified-gas-emitters-regulation/offset-credit-system-protocols.aspx
City of Edmonton Greenhouse Gas Management Plan 2019-2030 Civic Operations
Page 42
9. Enabling Change
There are many essential enabling and continuous improvement activities, programs and projects that are
currently happening, and will need to happen for this plan to be realized. The city will need to integrate the
greenhouse gas reduction practices identified in this plan into all aspects of its decision making and support
behaviour change.
A successful civic operations greenhouse gas management framework will take concerted, persistent,
collaborative, and integrated effort and a multitude of activities, programs and projects that take place across the
corporation, with participation from all departments and branches. Each of the 14,000 City staff play a role in
helping to reduce the City’s greenhouse gas footprint through their day to day behaviour and habits in a City
building or vehicle, and their decision making in regards to selection and procurement of equipment, fleet, and
contracted services. Although this Plan, its targets and the proposed budget is focused on capital projects and
larger impact technological interventions to reducing the City’s civic operations greenhouse gas footprint, it is
important to recognize that there is a myriad of ongoing and emerging initiatives intended to either address the
human behaviour side to climate change mitigation or pilot new emerging technologies.
A few examples of these initiatives include:
Office of Energy Management:
Energy 101 “the basics” – a new web-based energy literacy training platform that is currently being rolled
out as part of onboarding of new staff;
Submetering pilots for tenant areas within City buildings – to increase energy literacy and promote
energy conserving behaviour amongst tenants;
EMPR (City energy management performance reporting framework). EMPR is made up of three parts in
order to provide reliable energy performance reporting for city buildings and consuming assets.
○ Online viewing of energy profiles for City assets. Including benchmark values.
○ A mechanism to perform internal energy reviews to measure performance and actual outcomes
for City assets (includes: GHG emissions and energy efficiency/utilization indexes).
○ Identify energy management standards, methods and protocols to forecast and evaluate the
outcomes from the implemented energy retrofits.
Fleet and Facility Services
Right-Sizing Guidelines to encourage branches, especially those with sizable fleets to make conscientious
decisions about purchasing, assigning and using vehicles that are right-sized and not over-sized for the
job.
GPS Telematics Project – intended to integrate the different GPS systems and analytical platforms
currently used across the corporation, improve and leverage data collection and analysis to improve fleet
safety, support route optimization, improve fuel economy. All of which have positive implications on fuel
consumption.
Parks and Roads Services
Small scale fuel switching - Switching from carbon-fuel based to electric parks maintenance equipment
like lawn mowers, trimmers/cutters;

City of Edmonton Greenhouse Gas Management Plan 2019-2030 Civic Operations
Page 43
Off Grid Solar for Small Seasonal Buildings – using solar panels with batteries to power lighting and
provide electricity to small, seasonal parks maintenance sheds;
Community and Recreation Facilities
REALice technology pilot – a water deration technology currently being piloted at a City arena that can
enable high quality ice surfaces to be made using cold water as compared to conventional practice of hot
water flooding.
9.1. Electrification of City fleets
The City’s fleet is predominantly comprised of light and heavy trucks with a small portion of passenger cars.
Table 13 provides a breakdown of the City’s fleet composition. In addition, the City also operates
approximately 930 low-floor and DATS buses as part of the Edmonton Transit System.
Table 13: City Fleet Composition
24, 2016
TYPE OF VEHICLE NUMBER OF VEHICLES PERCENT OF FLEET
Cars 488 12%
General duty 33 0.8%
Edmonton Police Service 455 11.3%
Light trucks/SUVs/Vans 1550 39%
General duty 1041 25.9%
Edmonton Police Service 509 12.7%
Heavy trucks 663 16%
Rented vehicles (predominantly light trucks)
919 23%
Other self-propelled 400 10%
Total 4,020
Passenger cars are currently the most feasible to switch immediately to electric vehicles with more than 25
models available in Canada at various price points. The remaining City fleet, consisting of light trucks, SUVs,
vans and heavy trucks, currently lacks electric options; however the market is changing quickly. For example,
in early 2017, Ford announced that it will be introducing 13 electric vehicles to its model fleet by 2022,
including an F-150 Hybrid, Mustang Hybrid, a plug-in hybrid Transit Custom van, and a fully electric SUV with
an estimated range of 480 kilometres25
. Tesla has indicated that they will be expanding their market offering,
with a fully electric pickup truck in development.
Based on the principle of dynamic and adaptive steering, rather than provide conceptual targets for
electrification of City fleet based on very limited current market information and little or no electric options on
24 Excludes shop equipment, trailers, non-self-propelled vehicles and historical vehicles 25 Ford Motor Company. 2017. Ford Adding Electrified F-150, Mustang, Transit by 2020 in Major EV Push. https://media.ford.com/content/fordmedia/fna/us/en/news/2017/01/03/ford-adding-electrified-f-150-mustang-transit-by-2020.html

City of Edmonton Greenhouse Gas Management Plan 2019-2030 Civic Operations
Page 44
the majority of the City fleet, the actions in 1st
budget cycle of the Plan (2019-2022) will be more focused on
monitoring trends and changes in market conditions as outlined in section 10 below.

City of Edmonton Greenhouse Gas Management Plan 2019-2030 Civic Operations
Page 45
10. From Concept to Implementation – Steps Towards
Implementation of An Action Plan
There are five key areas that the City will need to focus on regardless of the scenario chosen for greenhouse gas
reduction from City civic operations: governance and accountability, implementation support, enabling and
empowerment, strategic alignment, dynamic and adaptive steering, and aligning EPCOR. These items are not
specifically an implementation plan rather they support the foundations of implementation, and the parallel
operations that enable implementation.
FOUNDATIONS OF IMPLEMENTATION
Timeline
Governance and accountability Description: Activities and initiatives that enable effective executive and organizational oversight, clarifies roles and responsibilities in plan implementation
Establish cross-corporate governance and accountability process to provide oversight for plan implementation, ongoing monitoring and evaluation, include but not limited to:
● Create or assign to appropriate Branch Steering Committee;
● Establish Internal Working Group(s);
● Establish Performance Measures Framework which include tactics on how
to deal with budget shortfalls and how to optimize project choice to
maximize GHG reductions;
● Establishing area (to be defined) specific GHG reduction targets
(potentially tied to ENVISO);
● Identifying senior management responsible for targets (potentially tied to
ENVISO);
● Preparing a prioritized list of detailed actions to achieve those targets
(potentially tied to ENVISO);
● Develop reporting requirements and processes (potentially tied to
ENVISO’s);
● Establish ENVISO roles and responsibilities, and
● Development of ENVISO procedures;
● Develop master plans for implementation pieces as appropriate.
● Develop a standardized method/approach as to how actions should be
prioritized over others that account for GHG reductions, for example
Sustainable Return On Investment or multi-criteria decision making
frameworks.
Implement the governance and accountability process (2019) Draft and establish an Administrative Directive to support the Civic Operations Greenhouse Gas Management Plan Implementation and Energy Management services provided by Office of Energy Management
2018-2019
Strategic Alignment Description:
a) Activities involving collaboration with other business units to ensure energy transition perspectives and existing/emerging
policies, practices or desired outcomes are appropriately considered and integrated into other corporate or cross-
department strategies and policies.
b) Activities involving collaboration, influencing and or monitoring of upcoming provincial and federal policies.

City of Edmonton Greenhouse Gas Management Plan 2019-2030 Civic Operations
Page 46
Contribute to and support the development of the corporate real estate (or land governance) strategy (Real Estate Branch) and lifecycle management strategy (Infrastructure Planning and Design Branch) Monitor, assess, align or integrate new provincial / federal policies into management plan review and implementation including, but not limited to, Alberta Bioenergy Policy Review, Capacity Market, Pan Canadian Clean Fuel Standard.
2019-2030
Dynamic Steering, Adaptive Management
Monitor and leverage emerging financial rebates, incentives, and funding that may be available to City to undertake the action(s). Monitor trends and changes in market conditions such as decreases in cost or increase in availability of electric vehicles, energy storage, alternative fuels, etc. Monitor internal funding allocation surplus, asks and shortfalls in order to reach GHG reduction targets.
2019-2030
PARALLEL OPERATIONS THAT ENABLE IMPLEMENTATION
Parallel Implementation Support Description: Activities and initiatives that support effective, efficient, and integrated project delivery. These are in addition to the implementation plans that will be developed in 2018-2019 through support of steering committees and internal working groups as noted in governance and accountability.
Buildings:
Ongoing improvements to integration of energy upgrades with capital renewal. Ongoing refinement of Terms of Reference / Scope of Work for building audits performed by third parties. Includes ongoing refinement of energy modeling requirements for existing buildings. Develop procedure, in alignment with C532 Sustainable Building Policy, to assess for building need as part of the new building planning process. This helps reduce impact by making sure that only what is needed is built. Identify, assess, and implement learning pilots for existing City buildings that are suitable for deep retrofits and netzero energy pilots City Office of Energy Management:
● Implement program to set Internal Measurement and Verification Plans (MVP). Establishes centralized, reliable energy performance monitoring and tracking for consuming assets:
○ MVPs set for whole-facility performance tracking across the life cycle of the asset. MVPs are set to compliment submetering to track outcomes for isolated energy conservation measures
○ MVP framework follows best practices standard (IPMVP)
● Continue implementation of City integrated energy management performance
reporting framework (City EMPR) for consuming assets:
o Implement internal MVPs (measurement framework) for centralized,
Ongoing Develop: 2019-2022; Plan: 2019-2022; Implement: 2023-2030; MVP and Sub-meter implementations start 2018 EMPR is ongoing starting

City of Edmonton Greenhouse Gas Management Plan 2019-2030 Civic Operations
Page 47
reliable tracking and reporting
o Complete City Submeter Pilot to track performance for City buildings
and tenant spaces within City-owned buildings. Includes develop and
implement cost model and submetering standards / procedures
o Complete enhancement to information and communication interfaces
to support data collection and data exchange for submetering; City
EMPR and Community Benchmarking for City buildings
● Develop and establish best practice standards to evaluate and prioritize ongoing
energy conservation measurements /energy upgrades;
● Implement and learn from behavioural audits to optimize awareness and
education, and working procedures for City consuming assets;
Develop and implement energy use and reporting procedures for City-owned leased to others buildings (Scope 3 buildings – considered outside City’s operational control as per protocol), and buildings that are leased by the City (considered within City’s operational control, as per inventory protocol and need to be included in the corporate inventory). (2018-2019)
2018. Plan, consult, develop 2018 Implement 2019 Ongoing and started in 2018
Fleets:
Monitor and review results of GPS telematics project implemented fleet-wide; explore using data and the platform to design programs to improve driver behaviour, route optimization, etc. Develop fuel use and reporting procedures for contracted fleets (Scope 3) including residential waste collection, long haul for waste disposal, DATs, parks and roads services, etc. (2018-2019); Implement the procedures (2020 onwards)
Complete project: 2018-2019 Plan, Design, Implement new programs: 2019-2022 Plan, Consult, Design: 2018-2019; Implement: 2020
Street Lighting: Explore and implement adaptive lighting pilots; Determine an estimation methodology with EPCOR to enable anticipated electricity reductions be accounted for in the billings
2018-2020
Green electricity
Development of green electricity procurement plan and process including: Project initiation; Project governance and steering
2018-2019
Attain subject matter support; development and issuance of RFPs Selection and negotiations
2018-2020
Execution, construction of new facilities 2021-2022
Start of operation for new facilities 2023-2024
Other renewable and alternative fuels
Ongoing and staggered approach as technologies and opportunities emerge. Explore, monitor market trends, and assess other potential renewables and alternative fuels and carbon offset opportunities. (e.g., investigate feasibility of additional methane extraction for generation of renewable natural gas from Cloverbar landfill, 2019-2020) Further pursue most viable options (Plan, Design, Consult); Execute on most viable options
Ongoing 2020-2027 2022-2030
Enabling and Empowerment
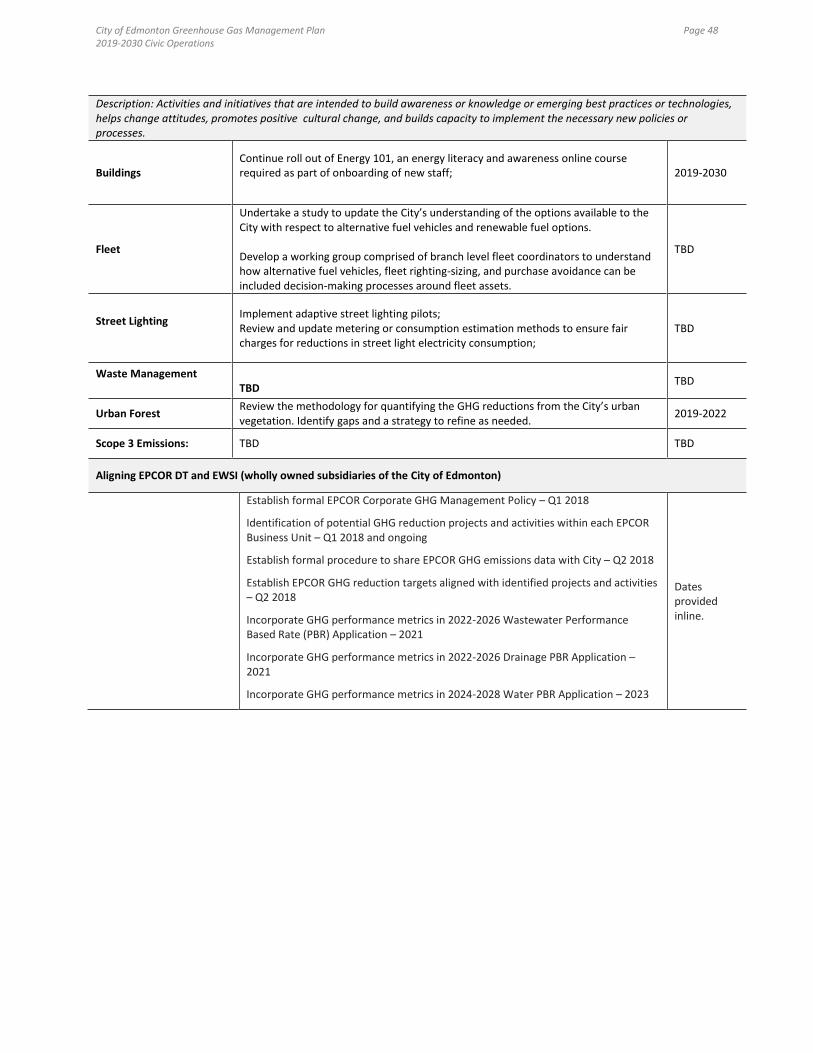
City of Edmonton Greenhouse Gas Management Plan 2019-2030 Civic Operations
Page 48
Description: Activities and initiatives that are intended to build awareness or knowledge or emerging best practices or technologies, helps change attitudes, promotes positive cultural change, and builds capacity to implement the necessary new policies or processes.
Buildings Continue roll out of Energy 101, an energy literacy and awareness online course required as part of onboarding of new staff;
2019-2030
Fleet
Undertake a study to update the City’s understanding of the options available to the City with respect to alternative fuel vehicles and renewable fuel options. Develop a working group comprised of branch level fleet coordinators to understand how alternative fuel vehicles, fleet righting-sizing, and purchase avoidance can be included decision-making processes around fleet assets.
TBD
Street Lighting
Implement adaptive street lighting pilots; Review and update metering or consumption estimation methods to ensure fair charges for reductions in street light electricity consumption;
TBD
Waste Management
TBD
TBD
Urban Forest Review the methodology for quantifying the GHG reductions from the City’s urban vegetation. Identify gaps and a strategy to refine as needed.
2019-2022
Scope 3 Emissions: TBD TBD
Aligning EPCOR DT and EWSI (wholly owned subsidiaries of the City of Edmonton)
Establish formal EPCOR Corporate GHG Management Policy – Q1 2018
Identification of potential GHG reduction projects and activities within each EPCOR Business Unit – Q1 2018 and ongoing
Establish formal procedure to share EPCOR GHG emissions data with City – Q2 2018
Establish EPCOR GHG reduction targets aligned with identified projects and activities – Q2 2018
Incorporate GHG performance metrics in 2022-2026 Wastewater Performance Based Rate (PBR) Application – 2021
Incorporate GHG performance metrics in 2022-2026 Drainage PBR Application – 2021
Incorporate GHG performance metrics in 2024-2028 Water PBR Application – 2023
Dates provided inline.

City of Edmonton Greenhouse Gas Management Plan 2019-2030 Civic Operations
Page 49
Appendix A: EPCOR 2016 Inventory
Assumptions and caveats:
Data includes EPCOR operations and activities within the City of Edmonton
Data includes EPCOR Water, EPCOR Distribution & Transmission, EPCOR Technologies – Drainage is not included at
this time
Data includes emissions from buildings, plants, fleet, SF6
Calculations follow the “Climate Registry General Reporting Protocol for the Voluntary Reporting Program Version 2.1
January 2016”
Electricity factors are taken from updates published by Climate Registry (climateregistry.org) – factors align closely to
generating factors, Climate Registry does not publish separate consumption factors
Data values are preliminary and subject to change as internal process and procedures are created and refined
Table 14: 2016 Emissions by Asset Type
SCOPE 1 GHG EMISSIONS TONNES SCOPE 2 GHG EMISSIONS TONNES ASSETS INCLUDED
Building Heat 2,336 Building Electricity 4,452 NSC, SSC, Tech, TTC, Tower
Plant Heat 7,941 Plant Electricity 109,089 GBWWT, WTPs
Vehicle Fleet 6,095 - - -
SF6 59 - - -
Sub-total Scope 1 16,431 Sub-total Scope 2 113,541 -
- - Total Scope 1 & 2 129,972 -
Table 15: 2016 Emissions by Business Area
SCOPE 1 GHG EMISSIONS TONNES SCOPE 2 GHG EMISSIONS TONNES
EPCOR Water 7,941 EPCOR Water 109,089
EPCOR Electricity 1,835 EPCOR Electricity 2,991
EPCOR Technologies 442 EPCOR Technologies 1,148
EPCOR Fleet 6,095 - -
EPCOR Tower 117 EPCOR Tower 313
Sub-total Scope 1 16,430 Sub-total Scope 2 113,541
Total Scope 1 & 2 - - 129,971
Table 16: 2016 Energy Use Raw Data by Asset Type
SCOPE 1 RAW DATA - SCOPE 2 RAW DATA -
Building Natural Gas (GJ) 41,712 Building Electricity (KWH) 5,635,445
Plant Natural Gas (GJ) 141,797 Plant Electricity (KWH) 138,087,606
Sub-total Natural Gas (GJ) 183,509 Sub-total Electricity (KWH) 143,723,051
Vehicle Fleet Gasoline (L) 891,757 - -
Vehicle Fleet Diesel (L) 1,490,077 - -
SF6 (Kg) 2 - -

City of Edmonton Greenhouse Gas Management Plan 2019-2030 Civic Operations
Page 50
Appendix B: Asset-specific Forecasts under Business As Usual
Table 17: Forecast of Annual Civic Operations Greenhouse Gas Emissions– Business-As-Usual Scenario
YEAR BUILDINGS FLEETS
(INCLUDE ETS BUSES)
LRT (INCL. VALLEY &
WEST END)
STREET LIGHTS
LANDFILL GAS
*TOTAL EMISSIONS
GRID FACTOR CHANGE**
2005 Baseline 196,933 75,868 11,680 74,216 65,040 423,737
2016 260,587 106,521 32,954 72,781 55,780 528,624 -
2017 239,832 108,025 30,002 62,329 54,605 494,793 -
2018 220,156 109,569 27,522 53,790 53,450 464,488 33,287
2019 220,263 110,284 28,547 52,497 52,315 463,906 37,066
2020 226,200 111,871 38,185 50,597 51,195 478,048 46,034
2021 218,036 113,377 34,340 45,008 50,110 460,870 71,651
2022 215,212 115,009 32,256 41,824 49,045 453,346 86,762
2023 219,044 116,764 31,803 40,802 47,990 456,403 91,610
2024 222,596 118,566 31,259 39,686 46,980 459,086 97,331
2025 226,271 120,422 30,719 38,602 45,960 461,974 103,301
2026 226,697 122,302 29,483 36,674 44,990 460,146 114,571
2027 227,586 124,245 36,072 34,941 44,045 466,890 130,131
2028 230,253 126,264 35,130 33,697 43,095 468,439 139,028
2029 230,193 128,323 33,545 31,868 42,180 466,109 152,420
2030 220,037 130,366 29,717 27,965 41,280 449,366 180,932
*This is the total emissions and does not include the grid factor change. The difference between the total emissions and the grid factor change is
the amount that must be reduced to achieve carbon neutrality.
**Grid factor changes calculated form 2018 onwards.
Figure 13 - Building Emissions
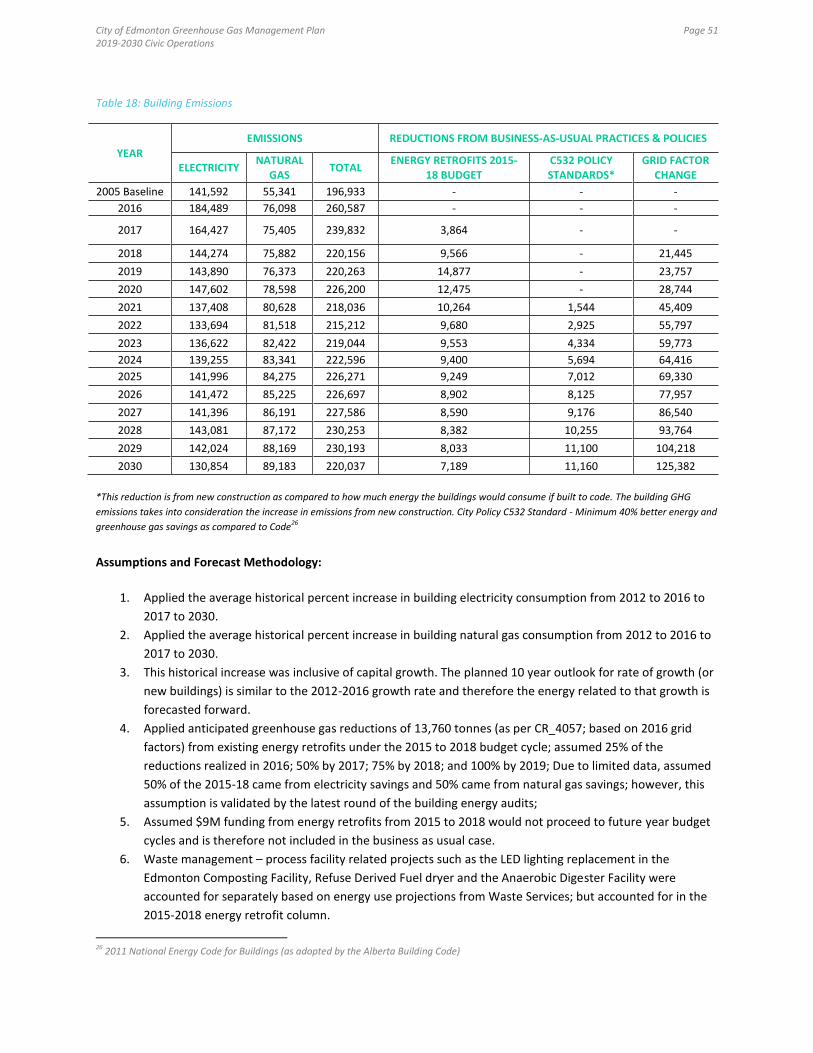
City of Edmonton Greenhouse Gas Management Plan 2019-2030 Civic Operations
Page 51
Table 18: Building Emissions
YEAR
EMISSIONS REDUCTIONS FROM BUSINESS-AS-USUAL PRACTICES & POLICIES
ELECTRICITY NATURAL
GAS TOTAL
ENERGY RETROFITS 2015-18 BUDGET
C532 POLICY STANDARDS*
GRID FACTOR CHANGE
2005 Baseline 141,592 55,341 196,933 - - -
2016 184,489 76,098 260,587 - - -
2017 164,427 75,405 239,832 3,864 - -
2018 144,274 75,882 220,156 9,566 - 21,445
2019 143,890 76,373 220,263 14,877 - 23,757
2020 147,602 78,598 226,200 12,475 - 28,744
2021 137,408 80,628 218,036 10,264 1,544 45,409
2022 133,694 81,518 215,212 9,680 2,925 55,797
2023 136,622 82,422 219,044 9,553 4,334 59,773
2024 139,255 83,341 222,596 9,400 5,694 64,416
2025 141,996 84,275 226,271 9,249 7,012 69,330
2026 141,472 85,225 226,697 8,902 8,125 77,957
2027 141,396 86,191 227,586 8,590 9,176 86,540
2028 143,081 87,172 230,253 8,382 10,255 93,764
2029 142,024 88,169 230,193 8,033 11,100 104,218
2030 130,854 89,183 220,037 7,189 11,160 125,382
*This reduction is from new construction as compared to how much energy the buildings would consume if built to code. The building GHG
emissions takes into consideration the increase in emissions from new construction. City Policy C532 Standard - Minimum 40% better energy and
greenhouse gas savings as compared to Code26
Assumptions and Forecast Methodology:
1. Applied the average historical percent increase in building electricity consumption from 2012 to 2016 to
2017 to 2030.
2. Applied the average historical percent increase in building natural gas consumption from 2012 to 2016 to
2017 to 2030.
3. This historical increase was inclusive of capital growth. The planned 10 year outlook for rate of growth (or
new buildings) is similar to the 2012-2016 growth rate and therefore the energy related to that growth is
forecasted forward.
4. Applied anticipated greenhouse gas reductions of 13,760 tonnes (as per CR_4057; based on 2016 grid
factors) from existing energy retrofits under the 2015 to 2018 budget cycle; assumed 25% of the
reductions realized in 2016; 50% by 2017; 75% by 2018; and 100% by 2019; Due to limited data, assumed
50% of the 2015-18 came from electricity savings and 50% came from natural gas savings; however, this
assumption is validated by the latest round of the building energy audits;
5. Assumed $9M funding from energy retrofits from 2015 to 2018 would not proceed to future year budget
cycles and is therefore not included in the business as usual case.
6. Waste management – process facility related projects such as the LED lighting replacement in the
Edmonton Composting Facility, Refuse Derived Fuel dryer and the Anaerobic Digester Facility were
accounted for separately based on energy use projections from Waste Services; but accounted for in the
2015-2018 energy retrofit column.
26 2011 National Energy Code for Buildings (as adopted by the Alberta Building Code)
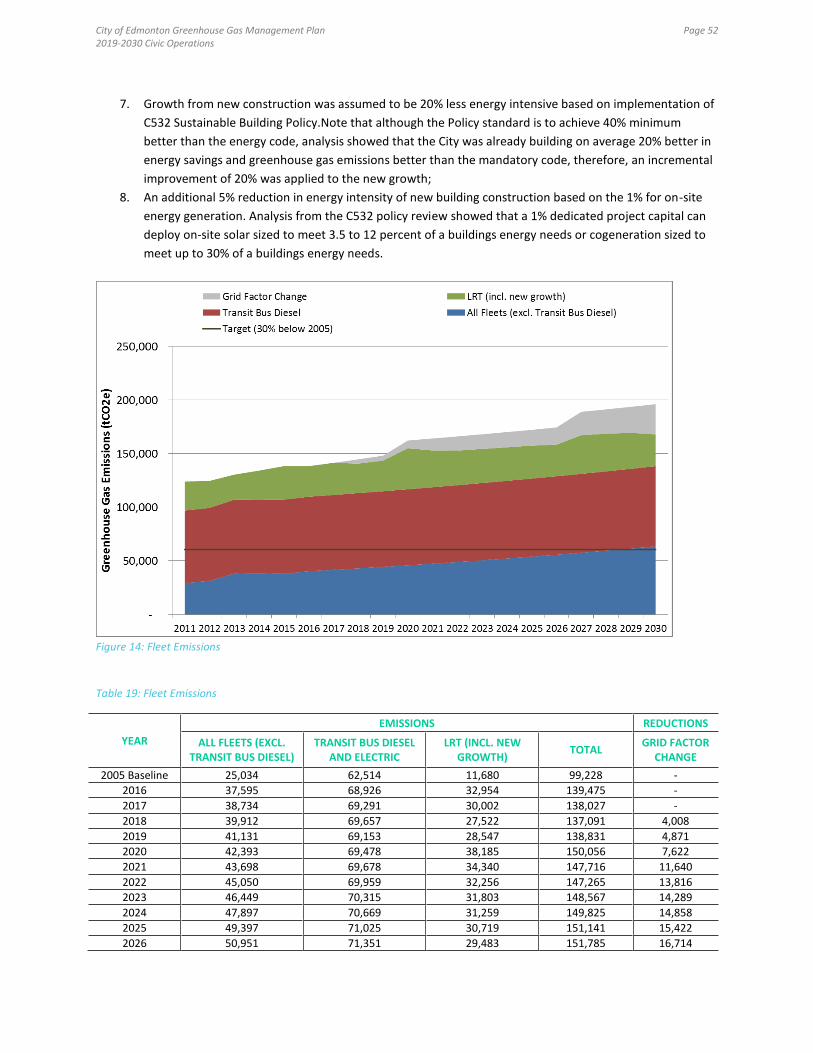
City of Edmonton Greenhouse Gas Management Plan 2019-2030 Civic Operations
Page 52
7. Growth from new construction was assumed to be 20% less energy intensive based on implementation of
C532 Sustainable Building Policy.Note that although the Policy standard is to achieve 40% minimum
better than the energy code, analysis showed that the City was already building on average 20% better in
energy savings and greenhouse gas emissions better than the mandatory code, therefore, an incremental
improvement of 20% was applied to the new growth;
8. An additional 5% reduction in energy intensity of new building construction based on the 1% for on-site
energy generation. Analysis from the C532 policy review showed that a 1% dedicated project capital can
deploy on-site solar sized to meet 3.5 to 12 percent of a buildings energy needs or cogeneration sized to
meet up to 30% of a buildings energy needs.
Figure 14: Fleet Emissions
Table 19: Fleet Emissions
YEAR
EMISSIONS REDUCTIONS
ALL FLEETS (EXCL. TRANSIT BUS DIESEL)
TRANSIT BUS DIESEL AND ELECTRIC
LRT (INCL. NEW GROWTH)
TOTAL GRID FACTOR
CHANGE
2005 Baseline 25,034 62,514 11,680 99,228 -
2016 37,595 68,926 32,954 139,475 -
2017 38,734 69,291 30,002 138,027 -
2018 39,912 69,657 27,522 137,091 4,008
2019 41,131 69,153 28,547 138,831 4,871
2020 42,393 69,478 38,185 150,056 7,622
2021 43,698 69,678 34,340 147,716 11,640
2022 45,050 69,959 32,256 147,265 13,816
2023 46,449 70,315 31,803 148,567 14,289
2024 47,897 70,669 31,259 149,825 14,858
2025 49,397 71,025 30,719 151,141 15,422
2026 50,951 71,351 29,483 151,785 16,714

City of Edmonton Greenhouse Gas Management Plan 2019-2030 Civic Operations
Page 53
2027 52,559 71,686 36,072 160,317 22,519
2028 54,226 72,039 35,130 161,394 23,494
2029 55,952 72,371 33,545 161,868 25,135
2030 57,740 72,626 29,717 160,083 29,098
Assumptions and Forecast Methodology:
1. Applied the historical average percent increase to diesel, gasoline, and propane consumption from
2012 to 2016, to 2017 to 2030;
2. Applied the anticipated electricity consumption for the LRT Valley Line Expansion of 15,000,000
kWhr/year for the downtown to Millwoods leg in 2020; and an additional 15,000,000 kWhr/year for
the downtown to West Edmonton leg in 2026. Note that the original consumption estimate from
Transportation was 9,400,000 kWhr for the Millwoods leg, which seems to be underestimated based
on comparison in length and number of stops to the existing system. Therefore a 1.5 times
estimation factor was applied to the Millwoods leg and assumed that the west leg will have similar
consumption levels. The electricity and natural gas consumption of the LRT stations is assumed to be
a part of the growth in buildings energy use. Note: OEM is meeting with engineering and transit to
review contract terms to determine additional charges that may apply for primary power.
3. 40 busses will be replaced by electric busses in the business as usual case.
Figure 15: Street Light Emissions
Table 20: Street Light Emissions
YEAR TOTAL STREETLIGHTS & TRAFFIC SIGNALS EMISSIONS GRID FACTOR CHANGE (REDUCTIONS
2005 Baseline 74,216
2016 63,051
2017 62,329 -
2018 53,790 7,834
2019 52,497 8,439
2020 50,597 9,668
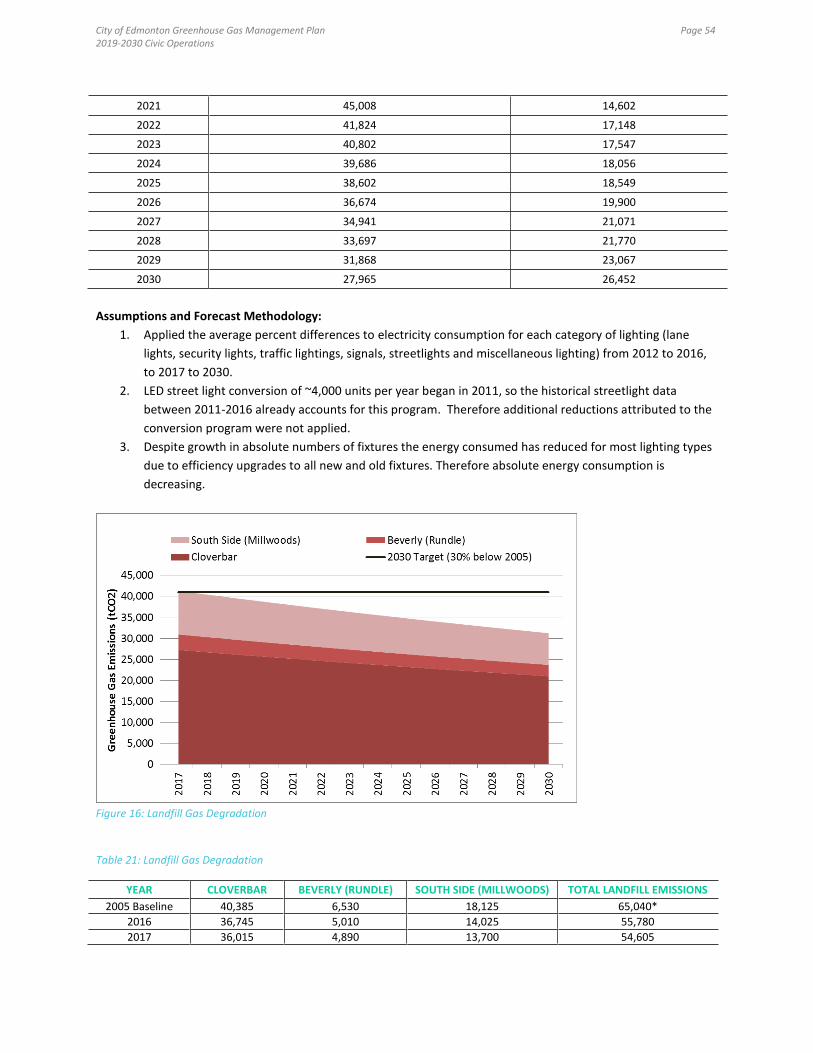
City of Edmonton Greenhouse Gas Management Plan 2019-2030 Civic Operations
Page 54
2021 45,008 14,602
2022 41,824 17,148
2023 40,802 17,547
2024 39,686 18,056
2025 38,602 18,549
2026 36,674 19,900
2027 34,941 21,071
2028 33,697 21,770
2029 31,868 23,067
2030 27,965 26,452
Assumptions and Forecast Methodology:
1. Applied the average percent differences to electricity consumption for each category of lighting (lane
lights, security lights, traffic lightings, signals, streetlights and miscellaneous lighting) from 2012 to 2016,
to 2017 to 2030.
2. LED street light conversion of ~4,000 units per year began in 2011, so the historical streetlight data
between 2011-2016 already accounts for this program. Therefore additional reductions attributed to the
conversion program were not applied.
3. Despite growth in absolute numbers of fixtures the energy consumed has reduced for most lighting types
due to efficiency upgrades to all new and old fixtures. Therefore absolute energy consumption is
decreasing.
Figure 16: Landfill Gas Degradation
Table 21: Landfill Gas Degradation
YEAR CLOVERBAR BEVERLY (RUNDLE) SOUTH SIDE (MILLWOODS) TOTAL LANDFILL EMISSIONS
2005 Baseline 40,385 6,530 18,125 65,040*
2016 36,745 5,010 14,025 55,780
2017 36,015 4,890 13,700 54,605
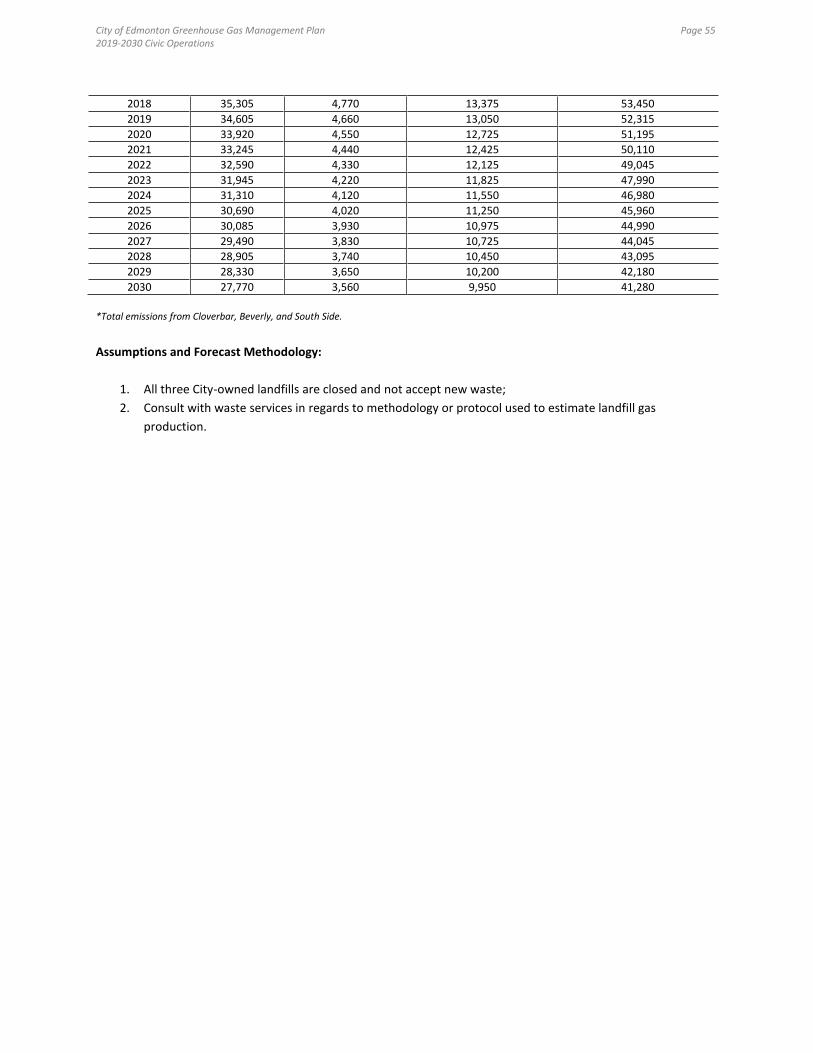
City of Edmonton Greenhouse Gas Management Plan 2019-2030 Civic Operations
Page 55
2018 35,305 4,770 13,375 53,450
2019 34,605 4,660 13,050 52,315
2020 33,920 4,550 12,725 51,195
2021 33,245 4,440 12,425 50,110
2022 32,590 4,330 12,125 49,045
2023 31,945 4,220 11,825 47,990
2024 31,310 4,120 11,550 46,980
2025 30,690 4,020 11,250 45,960
2026 30,085 3,930 10,975 44,990
2027 29,490 3,830 10,725 44,045
2028 28,905 3,740 10,450 43,095
2029 28,330 3,650 10,200 42,180
2030 27,770 3,560 9,950 41,280
*Total emissions from Cloverbar, Beverly, and South Side.
Assumptions and Forecast Methodology:
1. All three City-owned landfills are closed and not accept new waste;
2. Consult with waste services in regards to methodology or protocol used to estimate landfill gas
production.

City of Edmonton Greenhouse Gas Management Plan 2019-2030 Civic Operations
Page 56
Appendix C: Guiding Procurement Principles and
Operationalization Considerations for Green Electricity
These guiding principles are intended for any form of Green electricity procurement at the City of Edmonton. As
such they will be used for the purchase of renewable energy certificates or other future mechanism(s) employed
to procure green electricity in accordance with CoE Procurement Policy's and Procedures which include
compliance with Trade Agreements, Legislation and Internal processes.
While this plan provides high levels for costs and projections for carbon reduction potential it is not intended to be
a formal procurement methodology for these carbon reduction through green electricity procurement. The
implementation of this part of the plan should be completed with the high level budget, required targets, and
following points taken into consideration:
Additionality / Incentivize New Clean Growth
The green energy procured must be able to demonstrate that the green energy generated is over and above
business as usual and that there is an actual incremental reduction in greenhouse gases from baseline. For
instance, purchasing of renewable energy credits on a year to year basis from existing renewable energy facilities
that have been in operation for many years would not be able to demonstrate additionality. Renewable energy
credits generated from a new facility that came to be through a financial commitment from the City and or other
co-investors to purchase the credits or to provide the upfront capital (e.g., joint venture, grant;) would
demonstrate additionality.
Local Resilience and Asset Tied
The green energy procured should be as local and as proximal to Edmonton as much as is economically possible, in
order to positively impact local clean growth and economic diversification, as well as contribute to building
resiliency in the local energy system.
Price Volatility Mitigation
Depending on the financial mechanism, whether the purchase is only for the environmental attributes (e.g., RECs
or carbon offsets) or for the electricity supply as well, there may be co-benefits in a long term green electricity
supply agreement such as protection against future price volatility, and the expected increases to the carbon levy.
Furthermore, investment in on-site or microgeneration renewable energy on City-owned assets can directly help
offset the utility costs incurred by a City asset. These benefits should be considered when procuring green
electricity.
Cost effectiveness
In instances where all factors between two green energy options are considered equal such as in scale, proximity
and type, etc., preference should be given to projects that have lower overall unit cost to purchase.
Consider various green energy instruments
Renewable Energy Certificates is a financial instrument that can only be used to offset electricity, whereas carbon
offsets and the purchase of renewable natural gas can be used to offset other source of carbon emissions. As the

City of Edmonton Greenhouse Gas Management Plan 2019-2030 Civic Operations
Page 57
provincial grid gets greener, it is important that the procurement approach addresses biofuel, green natural gas,
and carbon offsets which can be used to reduce or offset the emissions from natural gas and fleet.
Portfolio Approach
It is important to recognize that some of the guiding principles outlined above are competing priorities. Large
scale wind is the most cost effective, but would do little for local economic growth or to build local energy
transition support and opportunities. Conversely, the higher the number of contracts or projects initiated, the
higher the administrative cost to quantify and verify the RECs or carbon offsets, which will impact cost
effectiveness. Although one or two large scale utility projects outside of the City could be much more cost effective
as compared to a number of smaller utility-sized solar, biogas or biomass installations within the city, yet, the
smaller facilities dispersed throughout the City would have more visibility, builds more awareness of change, and
also potentially enable the economic benefits to be shared with local industry and other community partners. For
these reasons, using a portfolio approach and further contemplation to include a dedicated carve out for smaller
installations that could engage or involve the community is needed to best meet all desired outcomes.
Additional Considerations:
Risks
Green premium pricing is typically tied to a green asset (solar install, wind farm, etc.) investment that requires long
payback periods and longer contract terms. This introduces a high risk scenario because the market is expected to
undergo rapid change during the applicable period for the plan. The period presented 2019-2030 represents an
unknown amount of risk because greening pricing contracts are changing as the electricity market is expected to
rapidly change and potentially become more unstable during that time. The economic outcomes realized from
greening pricing contracts will vary based on market conditions and timing of the contract. It should also be
mentioned that other entities in Alberta and Canada will be moving forward with carbon reduction plans during
this time which may create demand and supply issues in developing the resources in line with the plans timelines.
Administrative Costs
The economic impact to City administration costs for diverse contract scenarios is not included in the figures
provided in this plan. When developing a procurement strategy these values will be material and must be
considered as the City currently incurs minimal overhead costs to manage the electrical power supply for City
operations. The new costs will impact as ongoing operating expenses (accounting; settlement and contract
management and additional costs for regulatory reporting).

City of Edmonton Greenhouse Gas Management Plan 2019-2030 Civic Operations
Page 58
Appendix D: Greenhouse Gas Reduction Target Scenarios –
Data Tables
Table 22: Forecast of Annual Greenhouse Gas Emissions Reductions– 30 Percent Reduction Scenario
ANTICIPATED REDUCTIONS (TCO2E)
YEAR BUILDING RETROFITS
LARGE SCALE
MICROGEN SOLAR
ACCEL. LED STREETLIGHT
ELECTRIC BUSES
GREEN ELECTRICITY
27
GRID FACTOR CHANGE
2019 4,654 1,397 2,308 - - 35,215
2020 9,198 2,723 4,498 - - 42,984
2021 13,163 3,673 6,067 - - 65,328
2022 17,092 4,600 7,598 - - 77,278
2023 21,241 5,669 7,492 1,653 101,317 81,404
2024 25,309 6,686 7,364 3,374 99,582 86,304
2025 29,320 7,666 7,236 5,160 97,864 91,426
2026 32,965 8,408 6,945 7,184 93,924 101,236
2027 36,536 9,103 6,683 9,322 90,384 115,371
2028 40,188 9,850 6,509 11,460 88,023 123,110
2029 43,453 10,346 6,215 13,907 84,052 134,834
2030 45,419 10,000 5,506 17,375 74,466 159,933
Table 23: Forecast of Annual Greenhouse Gas Emissions Reductions– 50 Percent Reduction Scenario Increased Green Electricity Purchase
ANTICIPATED REDUCTIONS (TCO2E)
YEAR BUILDING RETROFITS
LARGE SCALE
MICROGEN SOLAR
ACCEL. LED STREETLIGHT
ELECTRIC BUSES
GREEN ELECTRICITY
28
GRID FACTOR CHANGE
2019 4,654 1,397 2,308 - - 35,215
2020 9,198 2,723 4,498 - - 42,984
2021 13,163 3,673 6,067 - - 65,328
2022 17,092 4,600 7,598 - - 77,278
2023 21,241 5,669 7,492 1,653 108,584 81,404
2024 25,309 6,686 7,364 3,374 106,725 86,304
2025 29,320 7,666 7,236 5,160 104,884 91,426
2026 32,965 8,408 6,945 7,184 100,661 101,236
2027 36,536 9,103 6,683 9,322 193,734 115,371
2028 40,188 9,850 6,509 11,460 188,673 123,110
2029 43,453 10,346 6,215 13,907 180,162 134,834
2030 45,419 10,000 5,506 17,375 159,616 159,933
27 Approximate based on GHG remaining after reduction efforts completed. Actual purchased amounts may differ slightly depending on purchase schedule pursued. 28 Approximate based on GHG remaining after reduction efforts completed. Actual purchased amounts may differ slightly depending on purchase schedule pursued.

City of Edmonton Greenhouse Gas Management Plan 2019-2030 Civic Operations
Page 59
Table 24: Forecast of Annual Greenhouse Gas Emissions Reductions – Carbon Neutral Scenario
ANTICIPATED REDUCTIONS (TCO2E)
YEAR ACCEL.
BUILDING RETROFITS
ACCEL. LARGE SCALE SOLAR
ACCEL. LED STREETLIGHT
ELECTRIC BUSES
GREEN ELECTRICITY
29
RENEW. NATURA
L GAS
CARBON OFFSET
GRID FACTOR CHANGE
2019 6,205 1,397 2,308 - - - - 35,215
2020 12,264 2,723 4,498 - - - - 42,984
2021 17,550 3,673 6,067 - - - - 65,328
2022 22,790 4,600 7,598 - - - - 77,278
2023 28,321 5,669 7,492 1,653 76,006 33,099 72,534 81,404
2024 33,746 6,686 7,364 3,374 74,704 33,099 72,534 86,304
2025 39,094 7,666 7,236 5,160 73,416 33,099 72,534 91,426
2026 43,953 8,408 6,945 7,184 70,460 33,099 72,534 101,236
2027 48,714 9,103 6,683 9,322 165,458 46,003 136,420 115,371
2028 53,584 9,850 6,509 11,460 161,135 46,003 136,420 123,110
2029 57,937 10,346 6,215 13,907 153,866 46,003 136,420 134,834
2030 60,559 15,000 5,506 17,375 136,321 46,003 136,420 159,933
29 Approximate based on GHG remaining after reduction efforts completed. Actual purchased amounts may differ slightly depending on purchase schedule pursued.
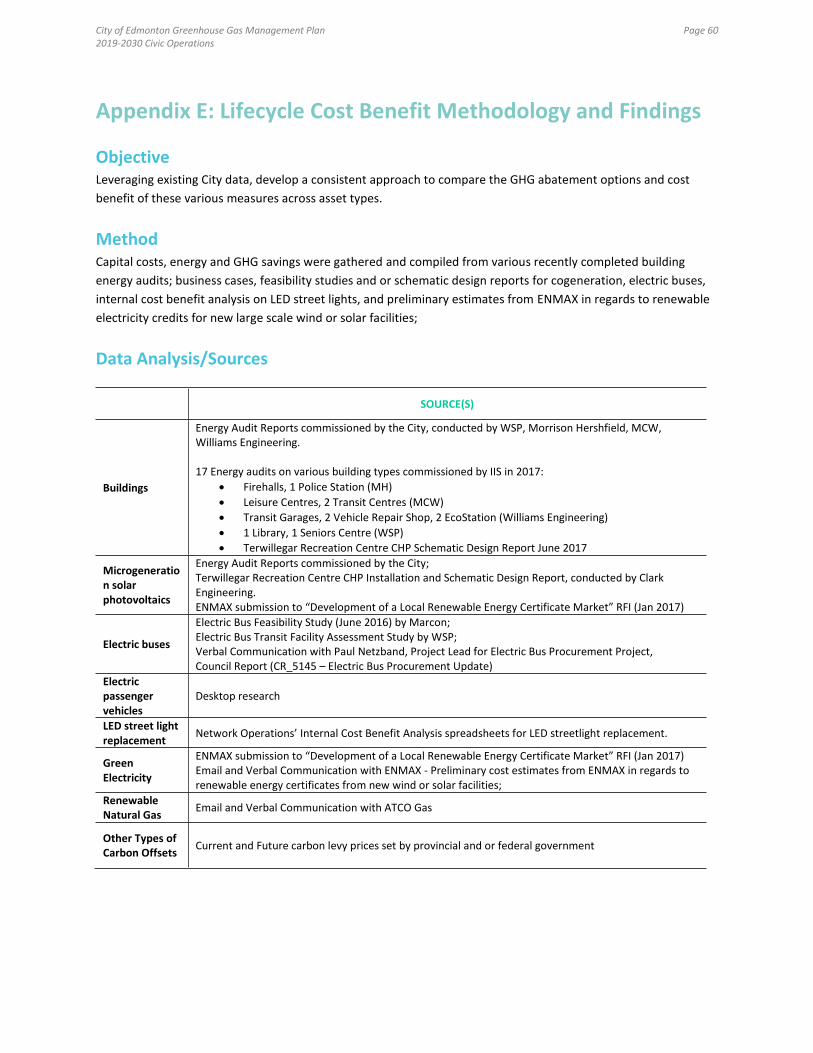
City of Edmonton Greenhouse Gas Management Plan 2019-2030 Civic Operations
Page 60
Appendix E: Lifecycle Cost Benefit Methodology and Findings
Objective Leveraging existing City data, develop a consistent approach to compare the GHG abatement options and cost
benefit of these various measures across asset types.
Method Capital costs, energy and GHG savings were gathered and compiled from various recently completed building
energy audits; business cases, feasibility studies and or schematic design reports for cogeneration, electric buses,
internal cost benefit analysis on LED street lights, and preliminary estimates from ENMAX in regards to renewable
electricity credits for new large scale wind or solar facilities;
Data Analysis/Sources
SOURCE(S)
Buildings
Energy Audit Reports commissioned by the City, conducted by WSP, Morrison Hershfield, MCW, Williams Engineering. 17 Energy audits on various building types commissioned by IIS in 2017:
Firehalls, 1 Police Station (MH)
Leisure Centres, 2 Transit Centres (MCW)
Transit Garages, 2 Vehicle Repair Shop, 2 EcoStation (Williams Engineering)
1 Library, 1 Seniors Centre (WSP)
Terwillegar Recreation Centre CHP Schematic Design Report June 2017
Microgeneration solar photovoltaics
Energy Audit Reports commissioned by the City; Terwillegar Recreation Centre CHP Installation and Schematic Design Report, conducted by Clark Engineering. ENMAX submission to “Development of a Local Renewable Energy Certificate Market” RFI (Jan 2017)
Electric buses
Electric Bus Feasibility Study (June 2016) by Marcon; Electric Bus Transit Facility Assessment Study by WSP; Verbal Communication with Paul Netzband, Project Lead for Electric Bus Procurement Project, Council Report (CR_5145 – Electric Bus Procurement Update)
Electric passenger vehicles
Desktop research
LED street light replacement
Network Operations’ Internal Cost Benefit Analysis spreadsheets for LED streetlight replacement.
Green Electricity
ENMAX submission to “Development of a Local Renewable Energy Certificate Market” RFI (Jan 2017) Email and Verbal Communication with ENMAX - Preliminary cost estimates from ENMAX in regards to renewable energy certificates from new wind or solar facilities;
Renewable Natural Gas
Email and Verbal Communication with ATCO Gas
Other Types of Carbon Offsets
Current and Future carbon levy prices set by provincial and or federal government

City of Edmonton Greenhouse Gas Management Plan 2019-2030 Civic Operations
Page 61
Approach and Assumptions
Parameter Assumptions
Current and future utility rates and carbon levy; current and forecasted electricity grid factors;
application of relevant provincial incentives; and discount rate were made standardized to ensure
that that the cost benefit outputs can be compared “apples-to-apples”
Capital and any maintenance costs / savings were taken directly from the audit and other reports
with no detailed review;
o Note: Incremental O&M Costs / Savings were not consistently included in the reports, but
whatever was available was used in the cost benefit analysis;
No inflation applied to capital cost estimates;
Cost benefit analysis excluded ECMs related to education and operational behaviours;
Buildings-specific
If the modeled results for energy and GHG savings differed from the additive results, modeled results
were used in the analysis
Didn’t review the energy audit costs in conjunction with the building conditions audit to address
redundant costs or figure out the truly incremental cost of the energy related upgrades
Discount Rate
Discount Rate set at 2.5% as recommended by finance department.
Utility Rates and Fuel Costs
2017 to 2019 Electricity Price of $0.11/kWhr (includes delivery and energy charges) based on rate of
the current electricity supply agreement with ENMAX, assuming that there will be a minimum 1 year
contract extension;
EDC Associates’ Q3 2017 for pool and capacity under the “Capacity Market and 5,000 MW of
Renewables” scenario was used for energy (and capacity) portion of the electricity from 2020 to
2031.
ENMAX advised that the delivery vs. energy charge is approximate 50% / 50%, therefore the total
electricity price for 2020 to 2032 was estimated by doubling the forecasted energy (and capacity)
prices, and a 1% yearly fuel escalation rate was applied for 2032 and beyond.

City of Edmonton Greenhouse Gas Management Plan 2019-2030 Civic Operations
Page 62
Table 25: EDC Associates Price Forecast for Energy Cost and Estimated Total Electricity Price (Energy and Delivery) Forecast for City of Edmonton
Figure 17: Total Electricity Price (Energy and Delivery) Forecast for City of Edmonton
2017 Natural Gas based on AB Energy Regulator’s forecast (2017-2026) for energy, 1% yearly increase
after; 2017 delivery charged based on OEM data for 2016, 1% yearly increase.
Price forecasts for diesel and gasoline pegged to expected price escalation for crude oil WTI (between
2018 to 2031), 1% escalation applied for 2032 and beyond
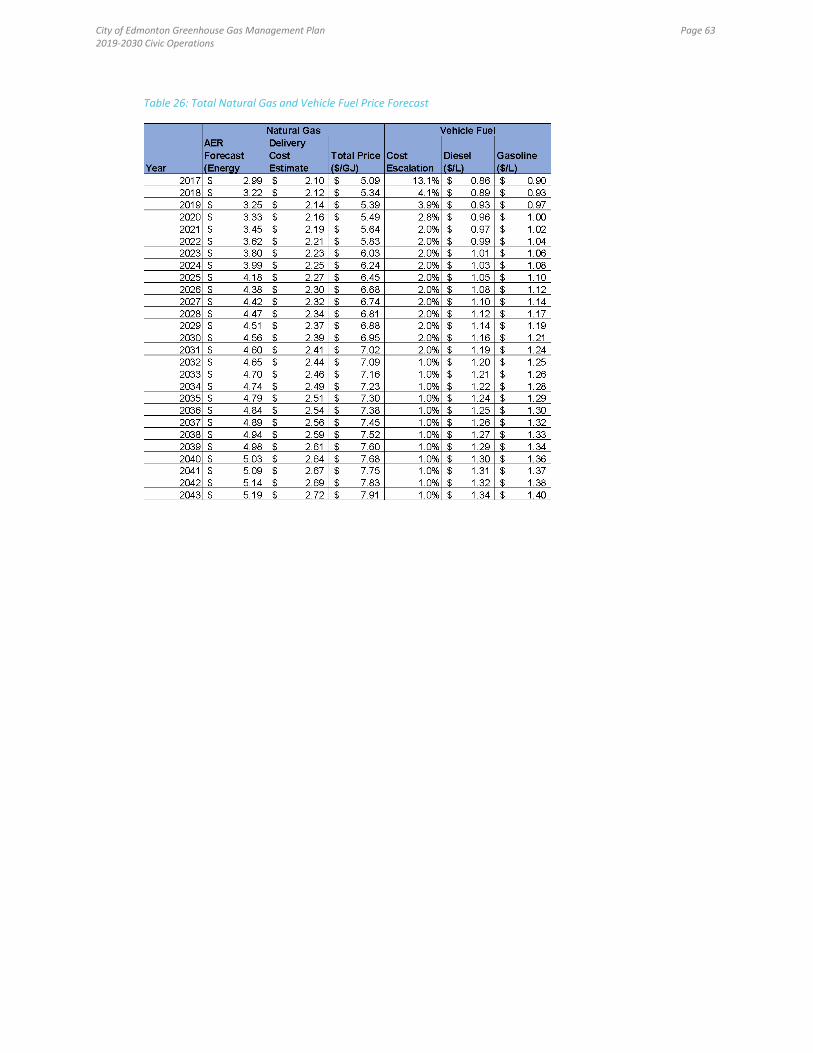
City of Edmonton Greenhouse Gas Management Plan 2019-2030 Civic Operations
Page 63
Table 26: Total Natural Gas and Vehicle Fuel Price Forecast
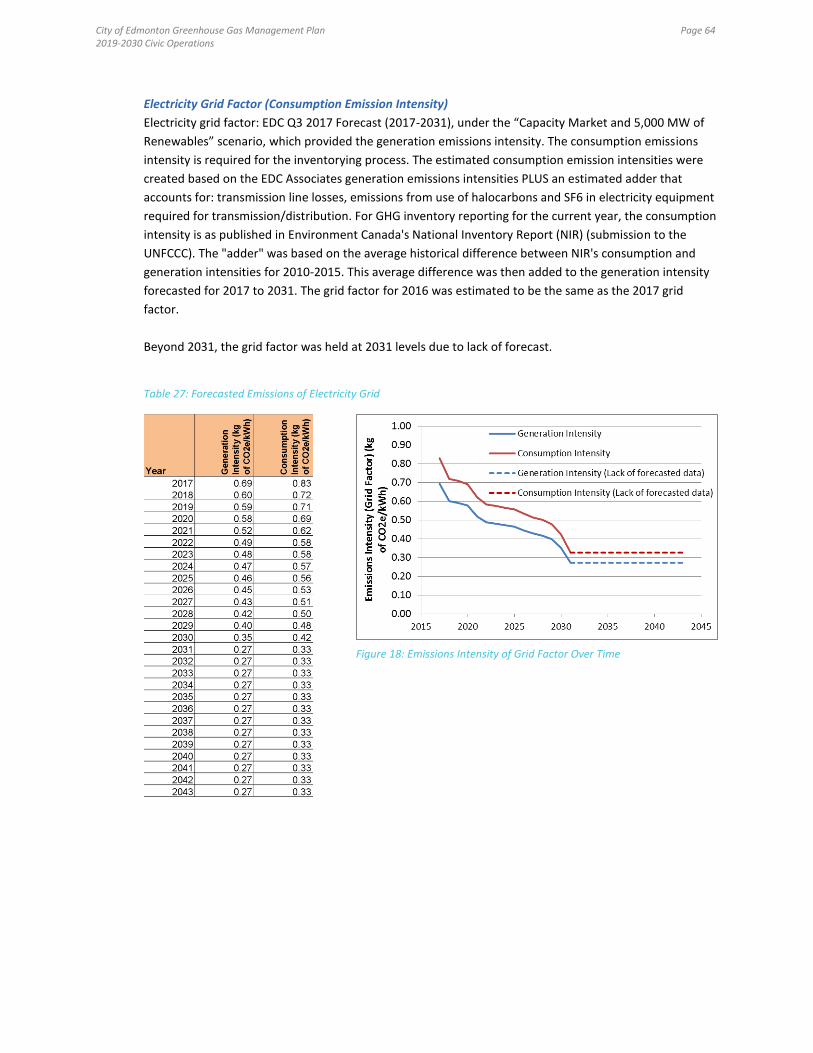
City of Edmonton Greenhouse Gas Management Plan 2019-2030 Civic Operations
Page 64
Electricity Grid Factor (Consumption Emission Intensity)
Electricity grid factor: EDC Q3 2017 Forecast (2017-2031), under the “Capacity Market and 5,000 MW of
Renewables” scenario, which provided the generation emissions intensity. The consumption emissions
intensity is required for the inventorying process. The estimated consumption emission intensities were
created based on the EDC Associates generation emissions intensities PLUS an estimated adder that
accounts for: transmission line losses, emissions from use of halocarbons and SF6 in electricity equipment
required for transmission/distribution. For GHG inventory reporting for the current year, the consumption
intensity is as published in Environment Canada's National Inventory Report (NIR) (submission to the
UNFCCC). The "adder" was based on the average historical difference between NIR's consumption and
generation intensities for 2010-2015. This average difference was then added to the generation intensity
forecasted for 2017 to 2031. The grid factor for 2016 was estimated to be the same as the 2017 grid
factor.
Beyond 2031, the grid factor was held at 2031 levels due to lack of forecast.
Table 27: Forecasted Emissions of Electricity Grid
Figure 18: Emissions Intensity of Grid Factor Over Time
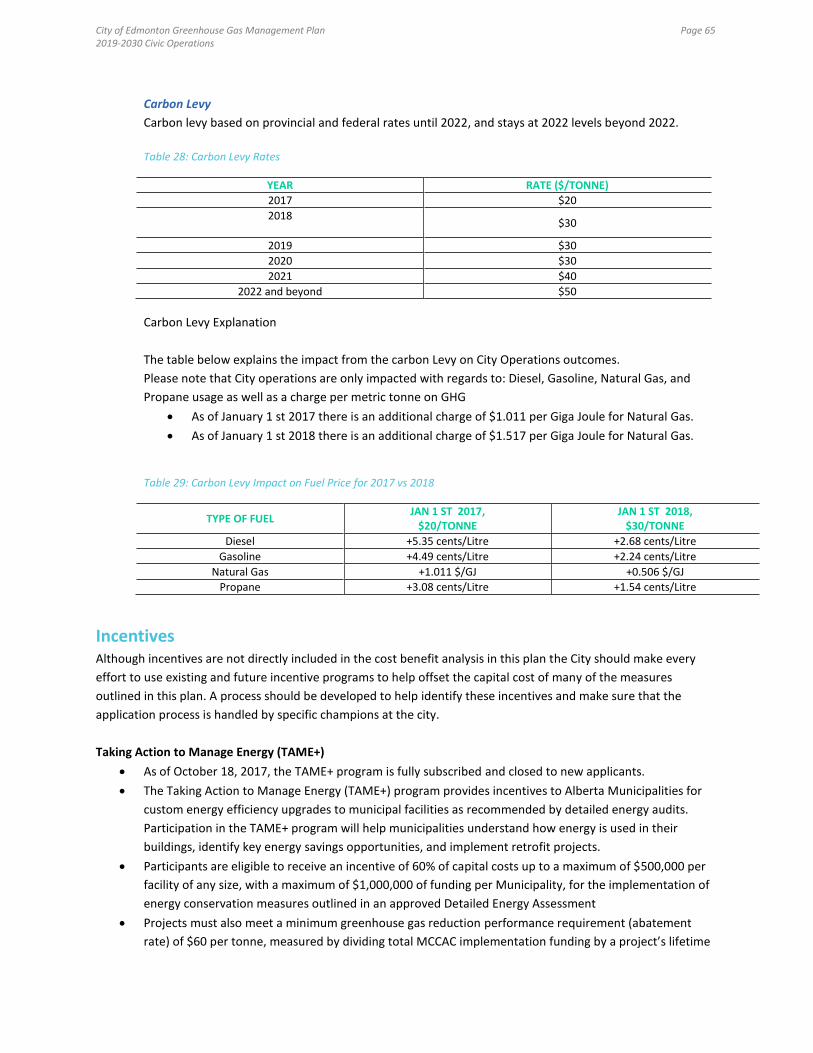
City of Edmonton Greenhouse Gas Management Plan 2019-2030 Civic Operations
Page 65
Carbon Levy
Carbon levy based on provincial and federal rates until 2022, and stays at 2022 levels beyond 2022.
Table 28: Carbon Levy Rates
YEAR RATE ($/TONNE)
2017 $20
2018
$30
2019 $30
2020 $30
2021 $40
2022 and beyond $50
Carbon Levy Explanation
The table below explains the impact from the carbon Levy on City Operations outcomes.
Please note that City operations are only impacted with regards to: Diesel, Gasoline, Natural Gas, and
Propane usage as well as a charge per metric tonne on GHG
As of January 1 st 2017 there is an additional charge of $1.011 per Giga Joule for Natural Gas.
As of January 1 st 2018 there is an additional charge of $1.517 per Giga Joule for Natural Gas.
Table 29: Carbon Levy Impact on Fuel Price for 2017 vs 2018
TYPE OF FUEL JAN 1 ST 2017,
$20/TONNE JAN 1 ST 2018,
$30/TONNE
Diesel +5.35 cents/Litre +2.68 cents/Litre
Gasoline +4.49 cents/Litre +2.24 cents/Litre
Natural Gas +1.011 $/GJ +0.506 $/GJ
Propane +3.08 cents/Litre +1.54 cents/Litre
Incentives Although incentives are not directly included in the cost benefit analysis in this plan the City should make every
effort to use existing and future incentive programs to help offset the capital cost of many of the measures
outlined in this plan. A process should be developed to help identify these incentives and make sure that the
application process is handled by specific champions at the city.
Taking Action to Manage Energy (TAME+)
As of October 18, 2017, the TAME+ program is fully subscribed and closed to new applicants.
The Taking Action to Manage Energy (TAME+) program provides incentives to Alberta Municipalities for
custom energy efficiency upgrades to municipal facilities as recommended by detailed energy audits.
Participation in the TAME+ program will help municipalities understand how energy is used in their
buildings, identify key energy savings opportunities, and implement retrofit projects.
Participants are eligible to receive an incentive of 60% of capital costs up to a maximum of $500,000 per
facility of any size, with a maximum of $1,000,000 of funding per Municipality, for the implementation of
energy conservation measures outlined in an approved Detailed Energy Assessment
Projects must also meet a minimum greenhouse gas reduction performance requirement (abatement
rate) of $60 per tonne, measured by dividing total MCCAC implementation funding by a project’s lifetime

City of Edmonton Greenhouse Gas Management Plan 2019-2030 Civic Operations
Page 66
greenhouse gas reductions. Funding for projects that have an abatement rate greater than $60/tonne will
be pro-rated
Municipal Climate Change Action Centre. 2017. TAME+. http://www.mccac.ca/programs/TAME
Municipal Climate Change Action Centre. 2017. AMSP Guidebook
http://www.mccac.ca/sites/default/files/amsp_guidebook_4.pdf
Alberta Municipal Solar Program
The Alberta Municipal Solar Program (AMSP) provides financial incentives to Alberta municipalities who
install grid-connected solar photovoltaics (PV) on municipal facilities or land and complete public
engagement for the project.
Participants are eligible to receive a rebate per watt of total installed capacity ($/W), as per the table
below. The rate tier is determined by the total installed capacity of a project submitted through a single
AMSP Application. The rebate provided by the MCCAC will not exceed 25% of eligible expenses.
Total Installed Capacity (DC) Rebate
<10 kilowatts $0.90/Watt
10 kilowatts to <150 kilowatts $0.75/Watt
150 kilowatts to <2 Megawatts $0.60/Watt
2 Megawatts to 5 Megawatts $0.55/Watt
Note: Funding is available on a first come, first served basis. Municipalities are eligible to submit multiple
applications.
Additional Funding Opportunities
Energy Efficiency Alberta. 2017. Business, Non-Profit, and Institutional Energy Savings Program.
https://www.efficiencyalberta.ca/business-non-profit-and-institutional/
Public Transit Infrastructure Fund (PTIF) should be considered for electric bus purchases and any retrofits
that work with transit facilities.
Federal funding through the Low Carbon Economy Challenge https://www.canada.ca/en/environment-
climate-change/services/climate-change/low-carbon-economy-fund/challenge.html
Sensitivity Analysis Conditions Sensitivity analysis completed on (ranging from most to least conservative):
Discount rate of 5%;
Fuel/utility cost escalation at 5% and 10%.
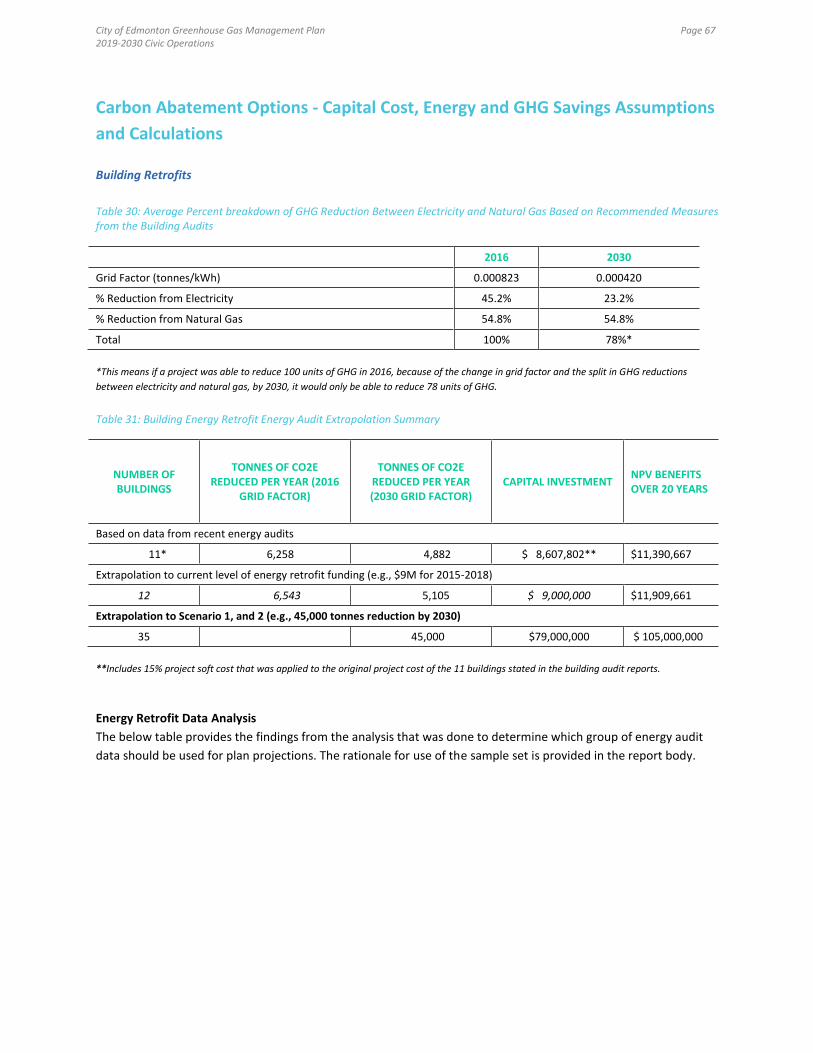
City of Edmonton Greenhouse Gas Management Plan 2019-2030 Civic Operations
Page 67
Carbon Abatement Options - Capital Cost, Energy and GHG Savings Assumptions
and Calculations
Building Retrofits
Table 30: Average Percent breakdown of GHG Reduction Between Electricity and Natural Gas Based on Recommended Measures from the Building Audits
2016 2030
Grid Factor (tonnes/kWh) 0.000823 0.000420
% Reduction from Electricity 45.2% 23.2%
% Reduction from Natural Gas 54.8% 54.8%
Total 100% 78%*
*This means if a project was able to reduce 100 units of GHG in 2016, because of the change in grid factor and the split in GHG reductions
between electricity and natural gas, by 2030, it would only be able to reduce 78 units of GHG.
Table 31: Building Energy Retrofit Energy Audit Extrapolation Summary
NUMBER OF BUILDINGS
TONNES OF CO2E REDUCED PER YEAR (2016
GRID FACTOR)
TONNES OF CO2E REDUCED PER YEAR (2030 GRID FACTOR)
CAPITAL INVESTMENT NPV BENEFITS OVER 20 YEARS
Based on data from recent energy audits
11* 6,258 4,882 $ 8,607,802** $11,390,667
Extrapolation to current level of energy retrofit funding (e.g., $9M for 2015-2018)
12 6,543 5,105 $ 9,000,000 $11,909,661
Extrapolation to Scenario 1, and 2 (e.g., 45,000 tonnes reduction by 2030)
35 45,000 $79,000,000 $ 105,000,000
**Includes 15% project soft cost that was applied to the original project cost of the 11 buildings stated in the building audit reports.
Energy Retrofit Data Analysis
The below table provides the findings from the analysis that was done to determine which group of energy audit
data should be used for plan projections. The rationale for use of the sample set is provided in the report body.
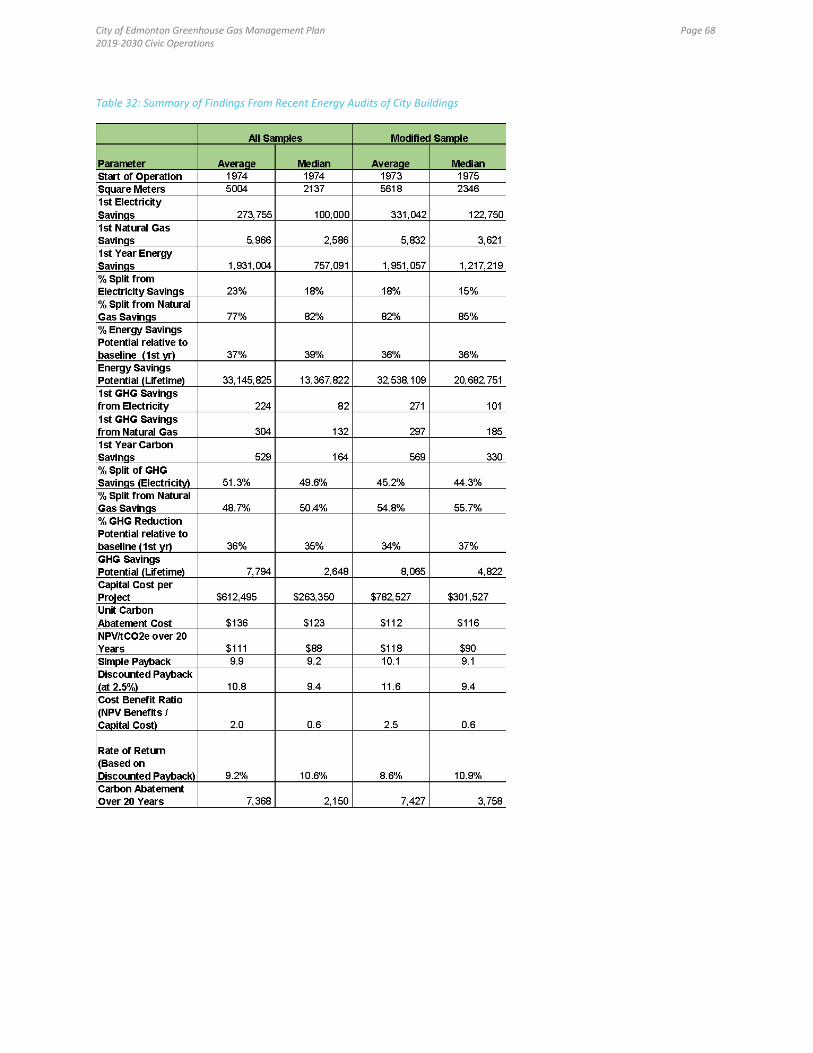
City of Edmonton Greenhouse Gas Management Plan 2019-2030 Civic Operations
Page 68
Table 32: Summary of Findings From Recent Energy Audits of City Buildings
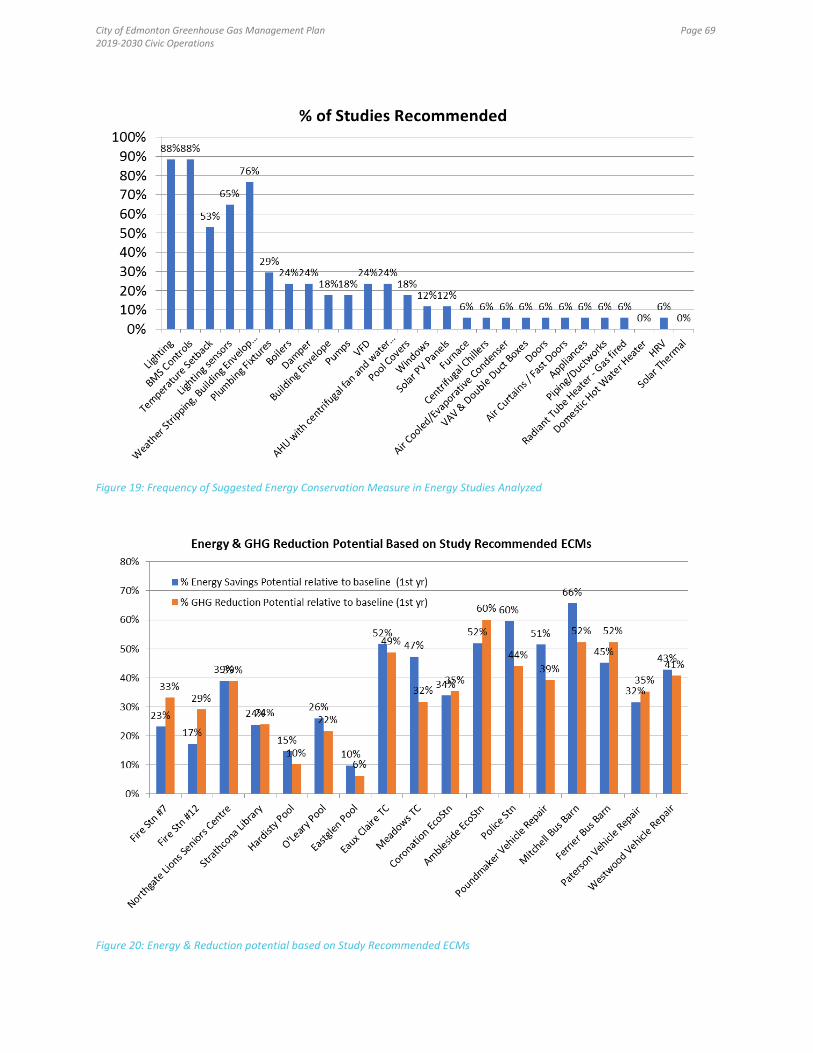
City of Edmonton Greenhouse Gas Management Plan 2019-2030 Civic Operations
Page 69
Figure 19: Frequency of Suggested Energy Conservation Measure in Energy Studies Analyzed
Figure 20: Energy & Reduction potential based on Study Recommended ECMs

City of Edmonton Greenhouse Gas Management Plan 2019-2030 Civic Operations
Page 70
Figure 21: Simple Payback Period of Suite of Measures in Each Facility Studied
Figure 22: FROI Benefit to Cost Ratio of Suite of Measures in Each Facility Studied
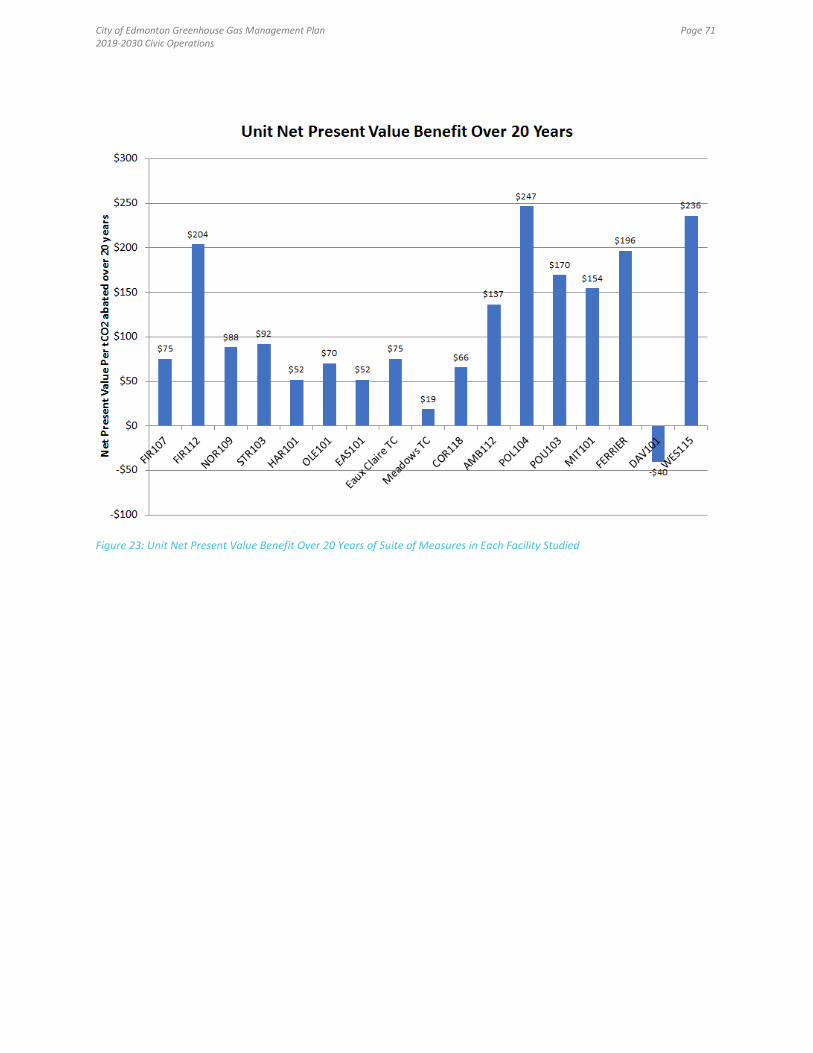
City of Edmonton Greenhouse Gas Management Plan 2019-2030 Civic Operations
Page 71
Figure 23: Unit Net Present Value Benefit Over 20 Years of Suite of Measures in Each Facility Studied

City of Edmonton Greenhouse Gas Management Plan 2019-2030 Civic Operations
Page 72
Cogeneration Calculations
Capital Cost: $1,186,000
Project Soft Cost = 15%
Total Capital Cost = $1,363,900
Installed capacity: 575 kW
Estimated Equipment Lifepsan: 15
Yearly Maintenance Cost: $86,282
Building to be installed in: Terwillegar Rec Centre
Table 33: Cogeneration Energy Greenhouse Gas Savings Percentage
CURRENT YEARLY ENERGY USE ANTICIPATED ENERGY SAVINGS AND GHG REDUCTION
Electricity Use (kWh) 10,635,238
Natural Gas Use (GJ) 45,948 % of energy savings (First yr) -11%
Total Energy Use (ekWh) 23,399,592 % of GHG savings (First yr) 22%
Table 34: Cogeneration Energy Greenhouse Gas Savings
NATURAL GAS SAVINGS
(GJ)
ELECTRICITY SAVINGS
(KWH)
TOTAL ANNUAL ENERGY SAVINGS
(EKWH)
ANNUAL NATURAL GAS CARBON
SAVINGS (TCO2E)
ANNUAL ELECTRICITY
CARBON SAVINGS (1ST YEAR TCO2E)
TOTAL ANNUAL CARBON
SAVINGS (TCO2E)
(26,748) 4,793,472 -2,637,122 (1,364) 3,834.8 2,470.6

City of Edmonton Greenhouse Gas Management Plan 2019-2030 Civic Operations
Page 73
LED Streetlight Calculations
Units remaining to be replaced: 46,000
Average unit type = S72
Average replacement = a 195W unit replaced with 127W unit
Run hours per year = 11.46 hrs/day*365
Material (incl. 17% overhead) = $294.50/unit X 1.17 = $344.57/unt
Contractor labour = $82.40/unit
Total Cost per unit = $426.97
Total Capital Cost: $19,640,000
Estimated Equipment Life span: 20
o Note: equipment has not yet been tested for full rated life span therefore 20 years is based on
rated value not City of Edmonton experience.
Yearly Maintenance Cost Savings:
Decrease in planned inspection and replacement = ~19% of the 46,000 units X $26.12/units = $228,289
Decrease in random average relamp cost of older lamps = ~11.5% of 46,000 units X $65.49/units =
$346,442
Total yearly maintenance cost savings = $574,731
Table 35: LED Streetlight Energy Greenhouse Gas Savings Percentage
CURRENT YEARLY ENERGY USE ANTICIPATED ENERGY SAVINGS AND GHG REDUCTION
Electricity Use (kWh)/unit 816 531
% of energy savings (First yr) 35%
% of GHG savings (First yr) 35%
Table 36: LED Streetlight Energy Greenhouse Gas Savings
CARBON REDUCTION FOR SCENARIO 1, 2, AND 3
YEAR
PROJECT GRID
FACTOR (TCO2E/ KWHR)
NATURAL GAS
SAVINGS (GJ)
ELECTRICITY SAVINGS
(KWH)
TOTAL ANNUAL ENERGY SAVINGS (EKWH)
ANNUAL NATURAL GAS
CARBON SAVINGS (TCO2E)
ANNUAL ELECTRICITY
CARBON SAVINGS (1ST YEAR TCO2E)
TOTAL ANNUAL CARBON SAVINGS (TCO2E)
2019* 0.00070
9 3,254,500 3,254,500 2307 2307
2030 0.00042
0 13,018,000 13,018,000 5,506 5,506
*Full rollout completed by 2022

City of Edmonton Greenhouse Gas Management Plan 2019-2030 Civic Operations
Page 74
Solar Photovoltaics Calculations Table 37: Solar PV Carbon Reductions Calculations
SMALL SCALE LARGE SCALE
Installed Capacity (kW) 19 650
Installed Cost: $3/W (Incl. project soft cost) $2.3/W (Incl. project soft cost)
Capital Cost: $57,000 $1.5M
Yearly Maintenance Cost $500 $3000
Solar generation potential (kWh/kW/yr of installed capacity)
1150 1150
Electricity import avoided annually (kWh)
19 kW x 1150 kWh/kW/yr = 21,850 kWh
650 kW x 1150 kWh/kW/yr = 747,500 kWh
Carbon Reduction for Scenario 1, and 2
Total Installed Capacity
20 MW - Large Scale
Calculation (approximated) Value
Total Installation Cost 20MW x $2.3/W x 1,000,000 W/MW=
$47 Million for report purposes.
Carbon Reduction by year Grid Factor
2019 0.000704 20 MW x 1150 kWh/kW x 0.704 kg/kWh=
16192 tonnes
2030 0.000420 20 MW x 1150 kWh/kW x 0.420 kg/kWh=
9660 tonnes approximated to 10,000 tonnes for report purposes.

City of Edmonton Greenhouse Gas Management Plan 2019-2030 Civic Operations
Page 75
Electric Bus Calculations Table 38: Electric Bus Assumptions
ASSUMPTIONS (MARCON - USED)
Distance traveled per bus per year 49450 km Total Maintenance & Servicing Cost
Mileage of Diesel buses 0.49 L/km Diesel $ 0.783 per km
Mileage of Trickle Charged 1.25 kwh/km Electric $ 0.546 per km
Mileage of En Route Charged 1.38 kwh/km Labour cost increases
3%
Number of buses purchased 40
Revised Assumptions based on conversation with Paul Netzband, Project Lead, Electric Bus Procurement Project (Oct 23, 2017)
Incremental Capital Cost:
Incremental cost per bus could range from $75,000 to $350,000 - but likely between $100,000 to
$200,000 USD; $200,000 USD is used in the analysis, with an exchange rate of 1.3 applied from USD to
CAD
$260,000 for incremental capital cost between diesel and electric bus (ONLY)
Infrastructure Upgrade Cost:
Infrastructure upgrade cost based on Electric Bus Transit Facility Assessment Study (WSP)
Centennial Upgrades = $30.8 Million for 100 electric bus
NETG upgrades = $42 Million for 100 electric bus
Charge infrastructure for 200 buses in total, but times 2 because only half of the buses are charging at a
time, so can serve around 400 in total.
$182,000 per bus for Capital Upgrade / Charging Infrastructure Requirements
Table 39: Electric Bus Carbon Reductions Calculations
CARBON REDUCTION FOR SCENARIO 1, 2 AND 3
YEAR
DIESEL EMISSIONS FACTOR (TCO2E/L)
GRID FACTOR (TCO2E/ KWHR)
PER
NET CHANGE IN DIESEL USE(L)
NET CHANGE IN ELECTRICITY USE (KWH)
ANNUAL DIESEL CARBON SAVINGS (TCO2E)
ANNUAL ELECTRICITY CARBON SAVINGS (TCO2E)
TOTAL ANNUAL CARBON SAVINGS (TCO2E)
2019 0.002786
0.000704 1 bus -23,835
61,813
66.4 -43.5 22.9
2030 0.002786 0.000420 1 bus -23,835 61,813
66.4 -26.0 40.4
2030 0.002786 0.000420 440 bus 17,800

City of Edmonton Greenhouse Gas Management Plan 2019-2030 Civic Operations
Page 76
Cost Benefit Results of various Carbon Abatement Options
The graph below compares the unit upfront capital carbon abatement cost for various types of energy
conservation measures. This measure is calculated as: total upfront capital cost divided tonnes of CO2e abated
over lifespan of energy conservation measure. It is only a measure of capital efficiency and ignores any cost
recovery potential from utility and or O&M savings.
Figure 24: Carbon Abatement Costs
The second graph below compares the simple payback of the various energy conservation measures. The data
shows that all of the displayed energy conservation measures have potential paybacks, even with the relatively
higher upfront capital requirements in the case of electric buses and LED streetlights.

City of Edmonton Greenhouse Gas Management Plan 2019-2030 Civic Operations
Page 77
Figure 25: Simple Payback Periods of Various Carbon Abatement Options
The third graph below compares the discounted payback of the various carbon abatement options. The
discounted payback analysis included application of future fuel cost increases, planned carbon levy increase as well
as a modest discount rate of 2.5%. The simple and discounted payback periods are very similar because the
projected increases in fuel cost and carbon levy are essentially offset by the discount rate.
Figure 26: Discounted Payback of Various Carbon Abatement Options
The fourth graph below compares the unit net present value per tonne of GHG abated. This measure is calculated as: (Net present value of the utility and O&M savings over 20 years - upfront capital cost) divided by tonnes of CO2e abated over 20 years or life of the ECM (whichever is shorter). This is a measure of financial cost benefit as it considers cost recovery. The graph shows positive net present value for nearly all types of energy conservation measures. Again, both electric buses and LED street lights had positive net present value even though they had

City of Edmonton Greenhouse Gas Management Plan 2019-2030 Civic Operations
Page 78
high upfront capital carbon abatement costs (refer to graph above).
Figure 27: Net Benefit over 20 Years of Various Carbon Abatement Options
The fifth graph below compares net present value benefit to cost benefit ratio of various GHG abatement options. This is a financial return on investment measure that is calculated as: (Net present value of the utility and O&M savings over 20 years - upfront capital cost) divided by upfront capital cost. The higher the ratio is the greater the potential for cost recovery.
The graph shows positive net present value benefit to cost ratios for nearly all types of GHG abatement options.
Electric buses had positive net present value benefits even though it had high upfront capital carbon abatement
costs (refer to graph above).
Figure 28: NPV Benefit to Cost Ratio Over 20 years of various Carbon Abatement Options

City of Edmonton Greenhouse Gas Management Plan 2019-2030 Civic Operations
Page 79
Figure 29: Rate of Return of Various Carbon Abatement Options
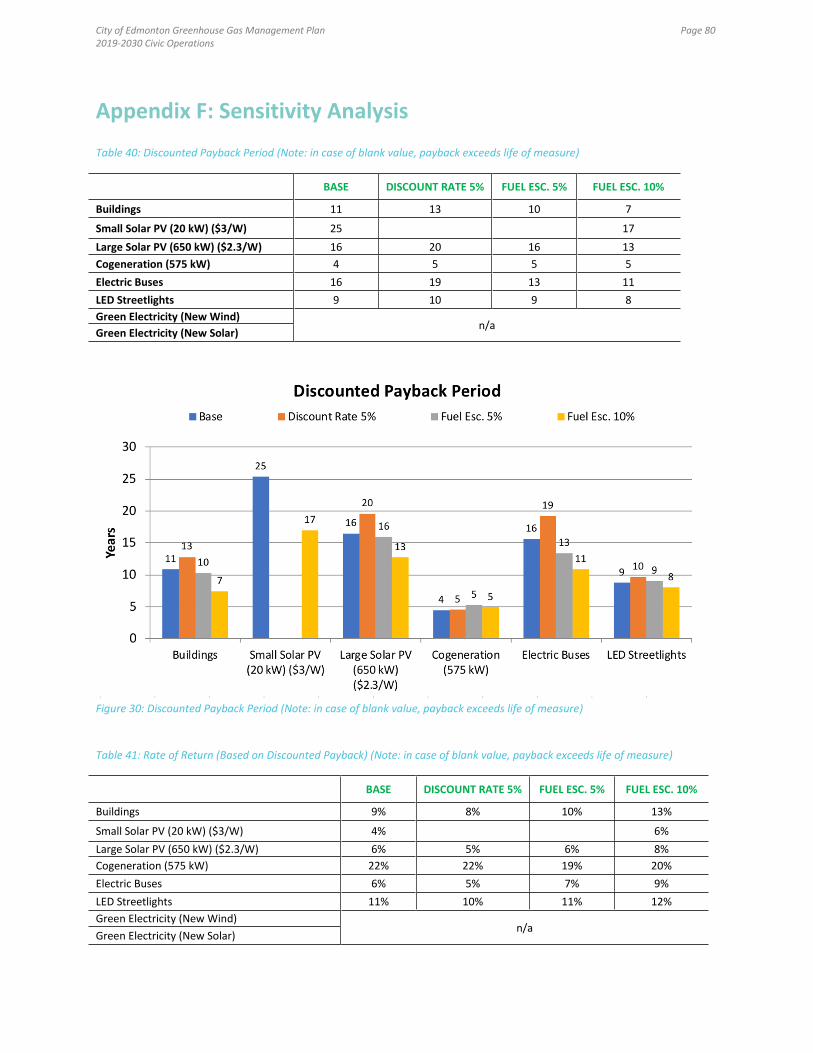
City of Edmonton Greenhouse Gas Management Plan 2019-2030 Civic Operations
Page 80
Appendix F: Sensitivity Analysis
Table 40: Discounted Payback Period (Note: in case of blank value, payback exceeds life of measure)
BASE DISCOUNT RATE 5% FUEL ESC. 5% FUEL ESC. 10%
Buildings 11 13 10 7
Small Solar PV (20 kW) ($3/W) 25
17
Large Solar PV (650 kW) ($2.3/W) 16 20 16 13
Cogeneration (575 kW) 4 5 5 5
Electric Buses 16 19 13 11
LED Streetlights 9 10 9 8
Green Electricity (New Wind) n/a
Green Electricity (New Solar)
Figure 30: Discounted Payback Period (Note: in case of blank value, payback exceeds life of measure)
Table 41: Rate of Return (Based on Discounted Payback) (Note: in case of blank value, payback exceeds life of measure)
BASE DISCOUNT RATE 5% FUEL ESC. 5% FUEL ESC. 10%
Buildings 9% 8% 10% 13%
Small Solar PV (20 kW) ($3/W) 4%
6%
Large Solar PV (650 kW) ($2.3/W) 6% 5% 6% 8%
Cogeneration (575 kW) 22% 22% 19% 20%
Electric Buses 6% 5% 7% 9%
LED Streetlights 11% 10% 11% 12%
Green Electricity (New Wind) n/a
Green Electricity (New Solar)

City of Edmonton Greenhouse Gas Management Plan 2019-2030 Civic Operations
Page 81
Figure 31: Rate of Return (Based on Discounted Payback) (Note: in case of blank value, payback exceeds life of measure)
Table 42: FROI Net Present Value to Cost Ratio
BASE DISCOUNT RATE 5% FUEL ESC. 5% FUEL ESC. 10%
Buildings 2.0 1.8 2.4 4.6
Small Solar PV (20 kW) ($3/W) -0.2 -0.3 0.0 0.6
Large Solar PV (650 kW) ($2.3/W) 0.2 0.0 0.3 1.0
Cogeneration (575 kW) 2.6 2.2 2.2 3.3
Electric Buses 0.3 0.0 0.6 1.4
LED Streetlights 1.3 0.8 1.5 2.7

City of Edmonton Greenhouse Gas Management Plan 2019-2030 Civic Operations
Page 82
Figure 32: Net Present Value to Cost Ratio
Table 43: Net Present Value per tCO2e Over 20 Years
BASE DISCOUNT RATE 5% FUEL ESC. 5% FUEL ESC. 10%
Buildings $109 $75 $142 $254
Small Solar PV (20 kW) ($3/W) -$76 -$100 -$38 $87
Large Solar PV (650 kW) ($2.3/W) $41 -$3 $67 $221
Cogeneration (575 kW) $217 $185 $181 $275
Electric Buses $158 $13 $336 $818
LED Streetlights $204 $132 $237 $438
Green Electricity (New Wind) -$40 -$33 -$40 -$40
Green Electricity (New Solar) -$80 -$65 -$80 -$80
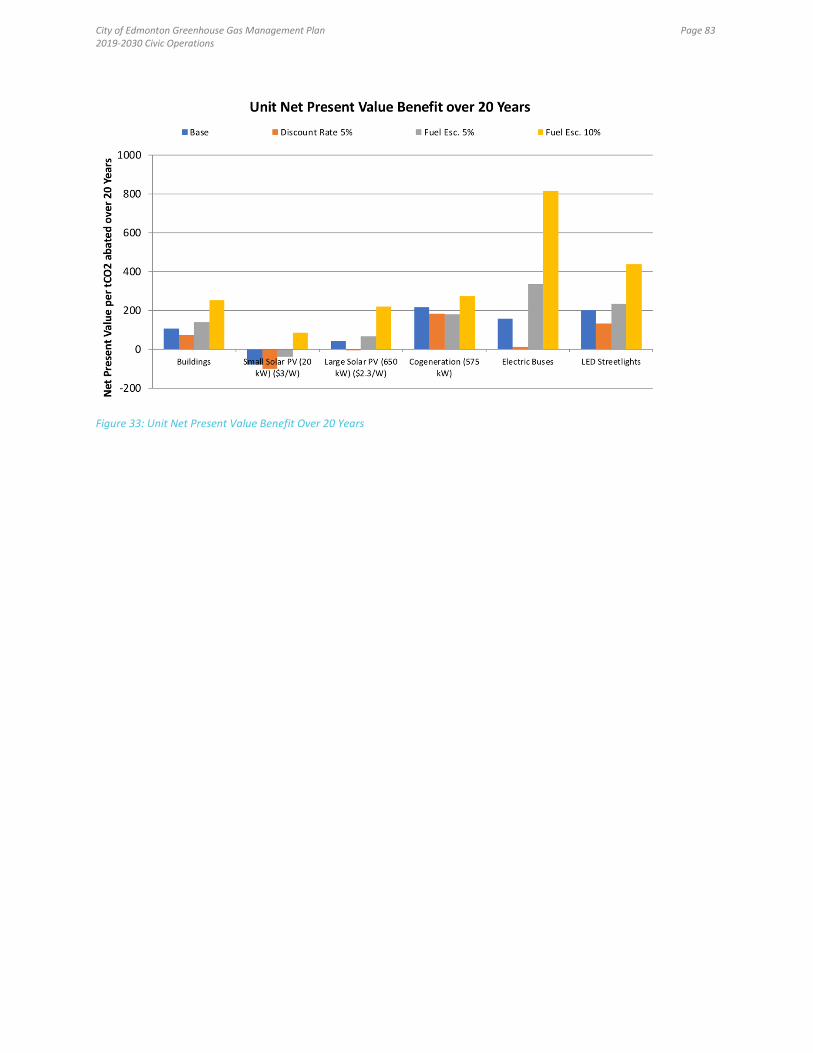
City of Edmonton Greenhouse Gas Management Plan 2019-2030 Civic Operations
Page 83
Figure 33: Unit Net Present Value Benefit Over 20 Years
City of Edmonton Greenhouse Gas Management Plan 2019-2030 Civic Operations
Page 84
Appendix G: Glossary and Equations
Greenhouse Gas (GHG): Gases such as carbon dioxide, methane and nitrogen oxide which actively contribute to
the atmospheric greenhouse effect. Greenhouse gases also include gases generated through industrial processes.
Carbon-neutral: refers to achieving net zero carbon emissions by balancing a measured amount of carbon released
with an equivalent amount sequestered or offset, or buying enough carbon credits to make up the difference
Carbon Offset/Credit: A reduction in emissions of carbon dioxide or greenhouse gases made in order to
compensate for or to offset an emission made elsewhere.
tCO2e: tonnes of carbon dioxide equivalent. The idea is to express the impact of each different greenhouse gas in
terms of the amount of CO2 that would create the same amount of warming.
Net Zero Energy Building: A building/site where the total amount of energy used on an annual basis is roughly
equal to the amount of renewable energy created on the site.
Financial Return on Investment: measures the gain or loss generated on an investment relative to the amount of
money invested.
Green Electricity: electricity sourced from renewable energy sources such as hydro, wind, and solar power.
Procuring green electricity from the electricity grid can logistically be achieved through a number of contractual
arrangements; however, the mechanism for any organization to claim the environmental attribute created from
the carbon reduction that occurs as a result of displacement of fossil fuel sourced electricity is a renewable energy
certificate (RECs). These RECs are generally purchased as a premium above the negotiated retail price of the
electricity. The purchase of RECs can be coupled or decoupled from the electricity services contract. The outcome
of the investment in RECs is increased market viability of renewable energy projects which decreases local,
regional and global carbon emissions. The organization that makes the investment in the RECs is able to
legitimately, transparently, and in alignment with international standards, claim that reduction within their own
emissions inventory.
Social Cost of Carbon: An estimate of the economic damages associated with a small increase in carbon
dioxide emissions (conventionally one metric tonne).
Lifecycle Cost Benefit Analysis: The analysis entails an assessment of key building elements on a lifecycle, apply
net present value methodology, include energy costs and maintenance costs (above business-as-usual), include
element replacement costs over the lifespan, and apply a City-approved discount rate.
Sustainable Return on Investment (SROI): An enhanced form of lifecycle cost benefit analysis that provides a
triple-bottom line view of the a project's economic results and monetizes all relevant social and environmental
impacts related to the given project, and provides the equivalent financial metrics. Refer to Consultant Design
Manuals and RFP specifications for most current project-specific requirements.

City of Edmonton Greenhouse Gas Management Plan 2019-2030 Civic Operations
Page 85
Description and Equations of Cost Benefit Parameters
Simple Payback Period
Description: This parameter provides an indication of the cost recovery potential, in terms of the period of time it will take to recovery the upfront investment based on anticipated savings in operations, maintenance and utility or fuel costs from the 1
st full year of implementing a specific measure.
Equation: Simple payback period = Upfront capital investment / Savings after 1
st full year of implementation
Unit Carbon Abatement Cost
Description: This parameter provides an indication of the capital efficiency as it relates to carbon abatement and does not consider cost recovery.
Equation:
Unit Carbon Abatement Cost = Upfront capital investment / total tonnes of carbon abated over the
lifespan of the measure
Net Present Value Benefit over 20 years to Cost Ratio
Description: This parameter indicates the level of cost recovery relative to the initial investment. This analysis incorporates anticipated changes in utility or fuel prices, operations and maintenances cost changes, and applies a discount rate to reflect the value of money in the future. The higher the ratio, the higher the rate of cost recovery relative to the initial investment.
Equation: Net Present Value Benefit over 20 years to Cost Ratio = (Net Present Value of Anticipated Savings over 20 years or lifespan of the measure (whichever is less) – Upfront Capital Investment) / Upfront capital investment
Unit Net Present Value Benefit
Description: This parameter indicates a unitized NPV benefit per tonne of carbon abated over 20 years. This analysis incorporates anticipated changes in utility or fuel prices, operations and maintenances cost changes, and applies a discount rate to reflect the value of money in the future. The higher the unit NPV per tonne of carbon abated, it means the more monetary benefit being returned to the City for implementing a measure.
Equation: Unit Net Present Value Benefit = (Net Present Value of Anticipated Savings over 20 years or lifespan of the measure, whichever is less – Upfront capital investment) / Total tonnes of carbon abated over 20 years or lifespan of the measure, whichever is less

City of Edmonton Greenhouse Gas Management Plan 2019-2030 Civic Operations
Page 86
Appendix H: Social Cost of Carbon
The following Social Cost of Carbon values were derived from those published by Environment and Climate Change
Canada30
. The 50th
and 95th
percentile values published were discounted at 3% and with a base year of 2012. The
values in the table and figure below used in the cost benefit analysis was undiscounted, then discounted at 2.5%
and with a base year of 2017.
Table 44: Social Cost of Carbon (Modified from: Environment and Climate Change Canada)
50TH PERCENTILE 95TH PERCENTILE
YEAR UN DISCOUNTED DISCOUNTED**
(BASE YEAR 2017) UN DISCOUNTED
DISCOUNTED (BASE YEAR 2017)
2016 $46 $188
2017 $48 $48 $200 $200
2018 $51 $50 $214 $208
2019 $54 $52 $227 $216
2020 $57 $53 $242 $224
2021 $60 $54 $255 $231
2022 $63 $56 $268 $237
2023 $66 $57 $283 $244
2024 $69 $58 $298 $250
2025 $73 $60 $313 $257
2026 $77 $61 $329 $264
2027 $80 $63 $346 $271
2028 $84 $64 $364 $277
2029 $88 $66 $382 $284
2030 $93 $67 $401 $291
2031 $97 $69 $422 $298
2032 $102 $70 $443 $306
2033 $107 $72 $464 $313
2034 $112 $74 $487 $320
2035 $117 $75 $511 $328
2036 $123 $77 $536 $335
2037 $129 $79 $561 $343
2038 $135 $80 $588 $350
2039 $141 $82 $616 $358
2040 $148 $84 $645 $366
2041 $155 $85 $673 $372
2042 $162 $87 $703 $379
2043 $169 $89 $733 $386
2044 $177 $91 $765 $393
2045 $185 $92 $798 $400
2046 $193 $94 $832 $407
2047 $202 $96 $868 $414
2048 $211 $98 $905 $421
2049 $220 $100 $943 $428
2050 $230 $102 $983 $435
30 Environment and Climate Change Canada. 2016. Technical Update to Canada’s Social Cost of Greenhouse Gas Estimates March 2016. http://publications.gc.ca/site/eng/9.629765/publication.html
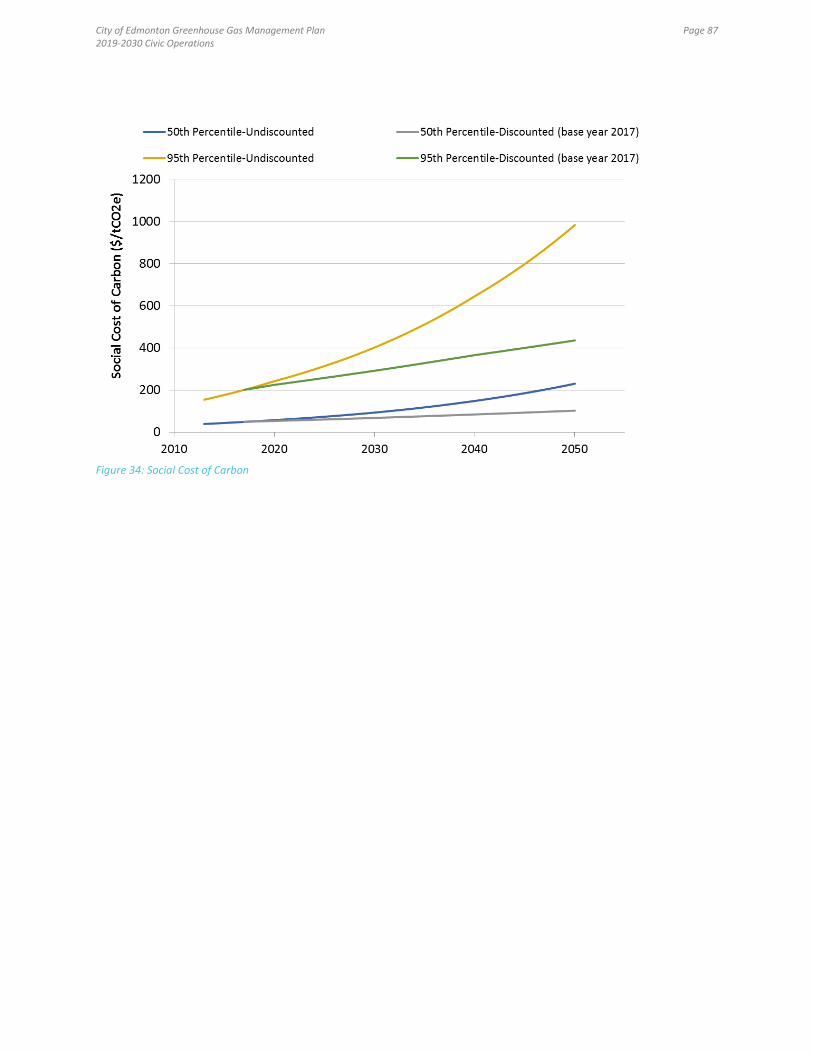
City of Edmonton Greenhouse Gas Management Plan 2019-2030 Civic Operations
Page 87
Figure 34: Social Cost of Carbon